
A Systematic Review of Sensing Technology in Human-Building Interaction Research

Abstract
:1. Introduction
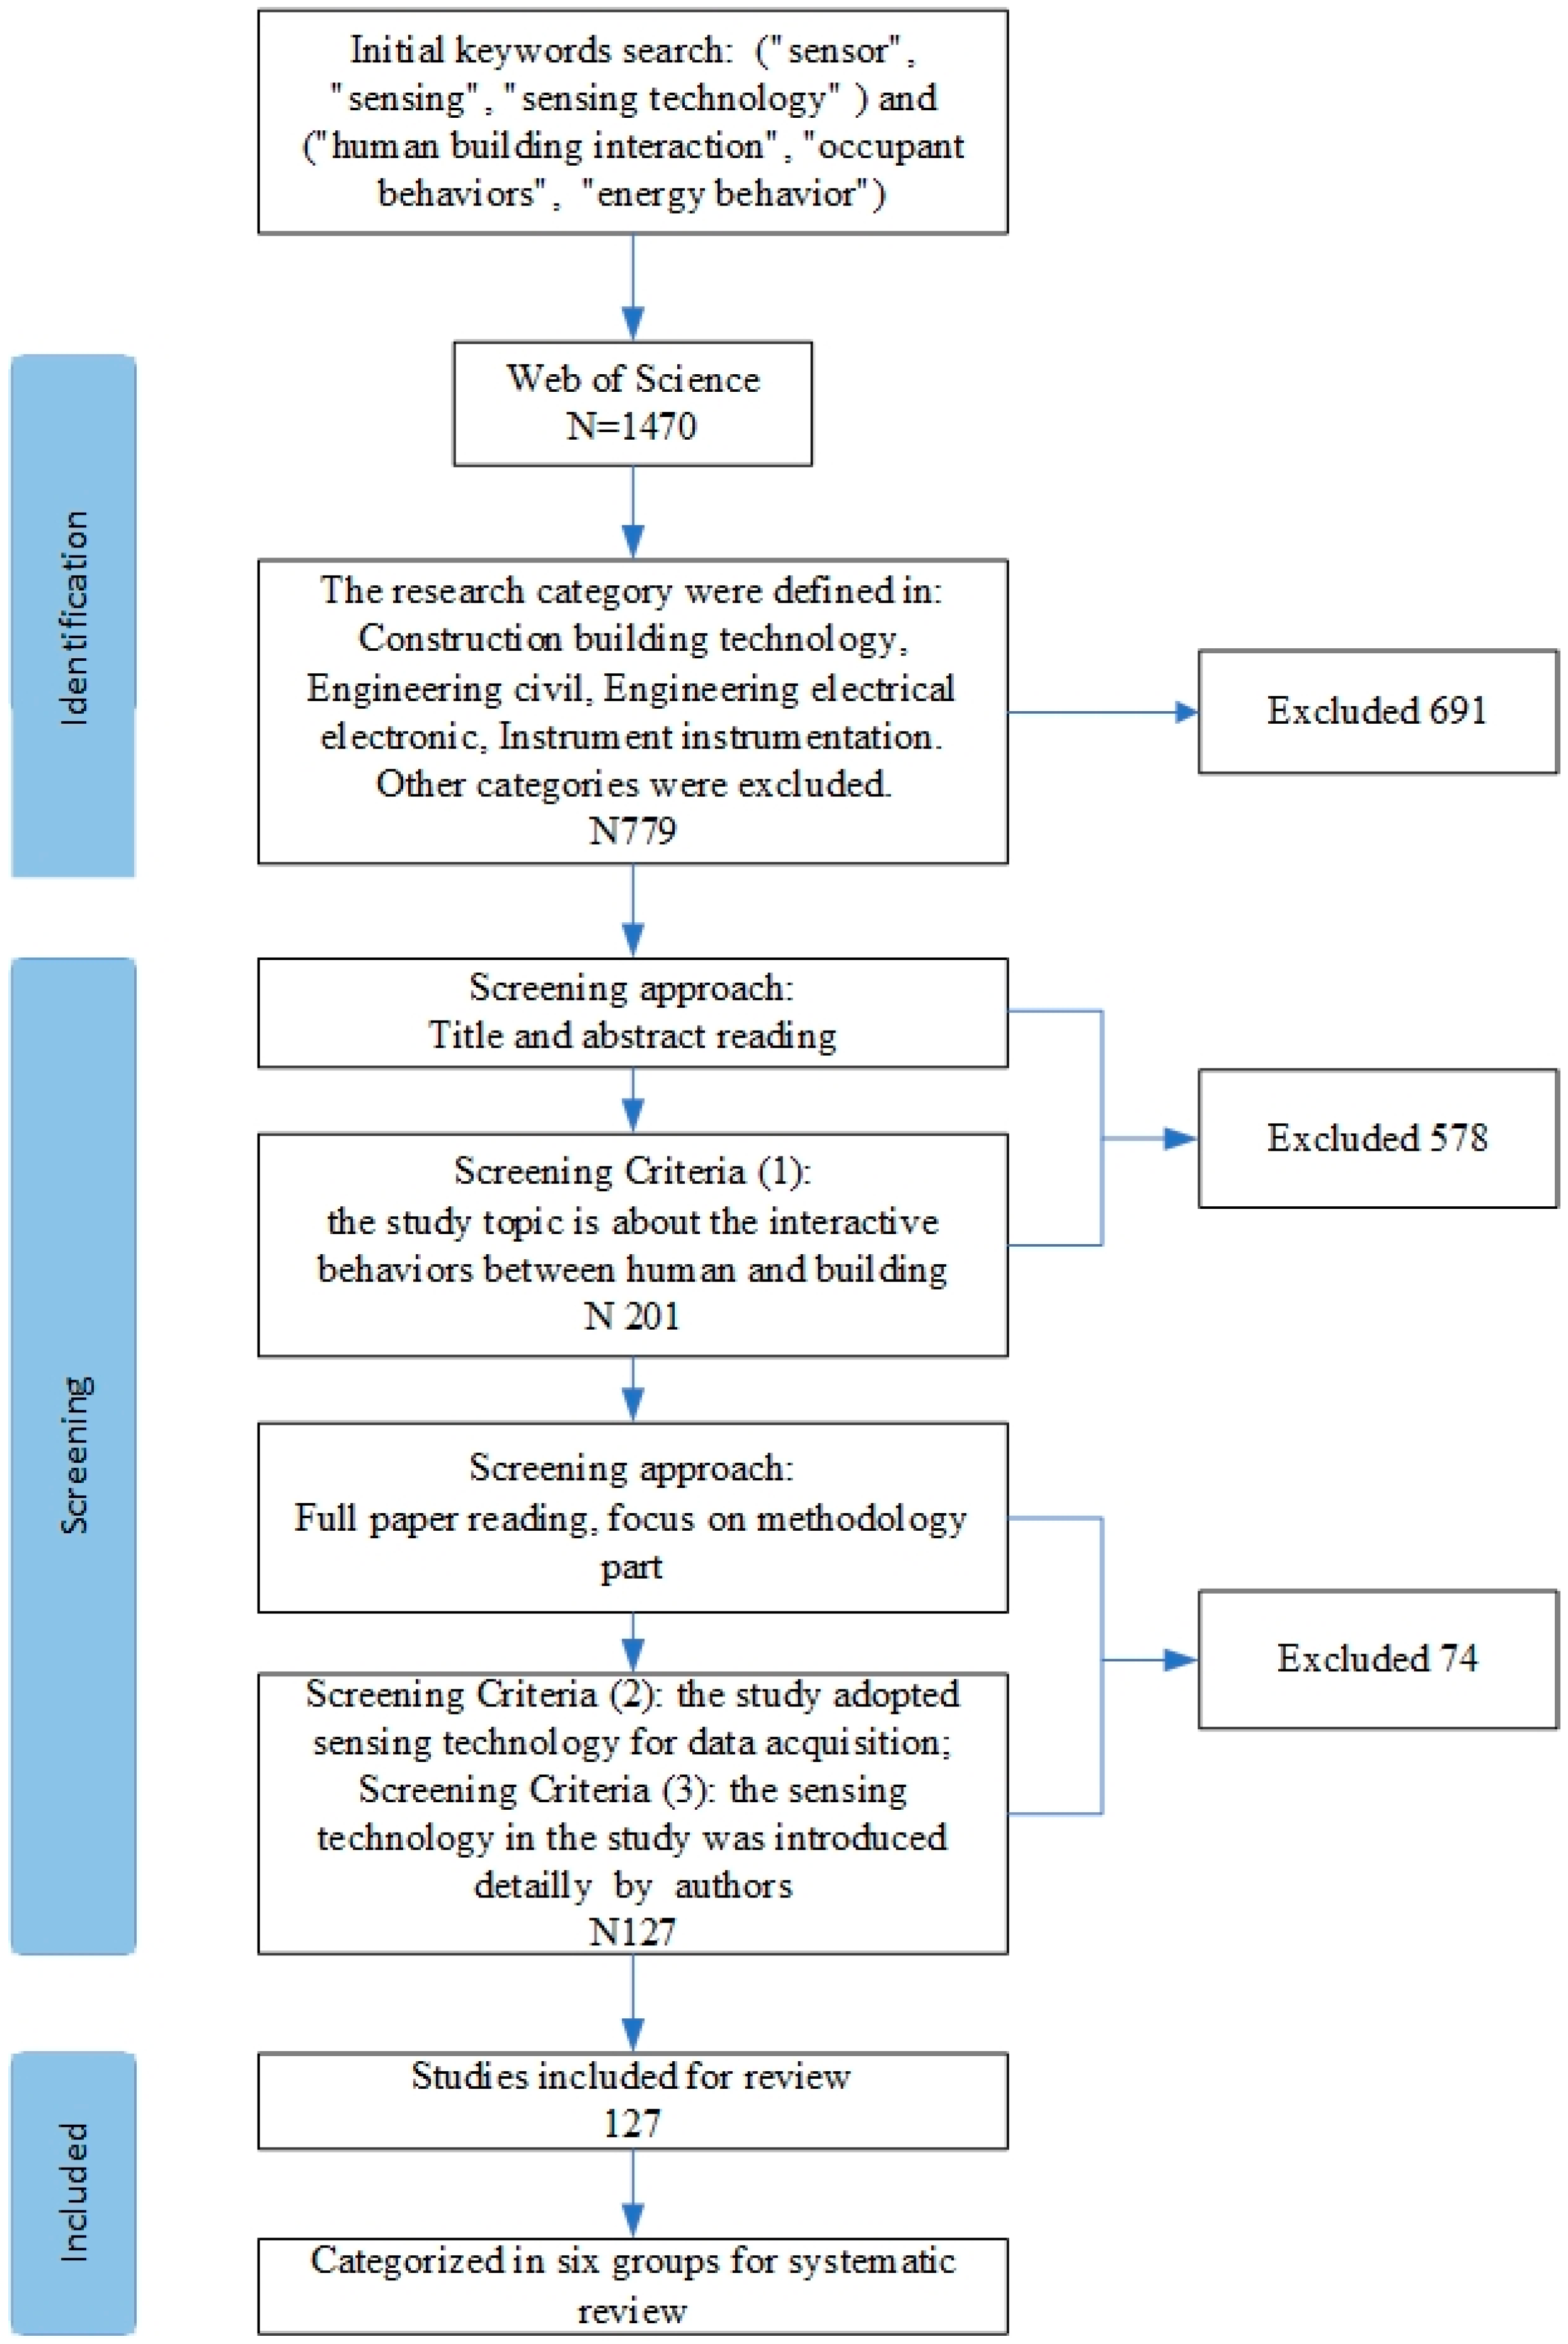
2. Materials and Methods
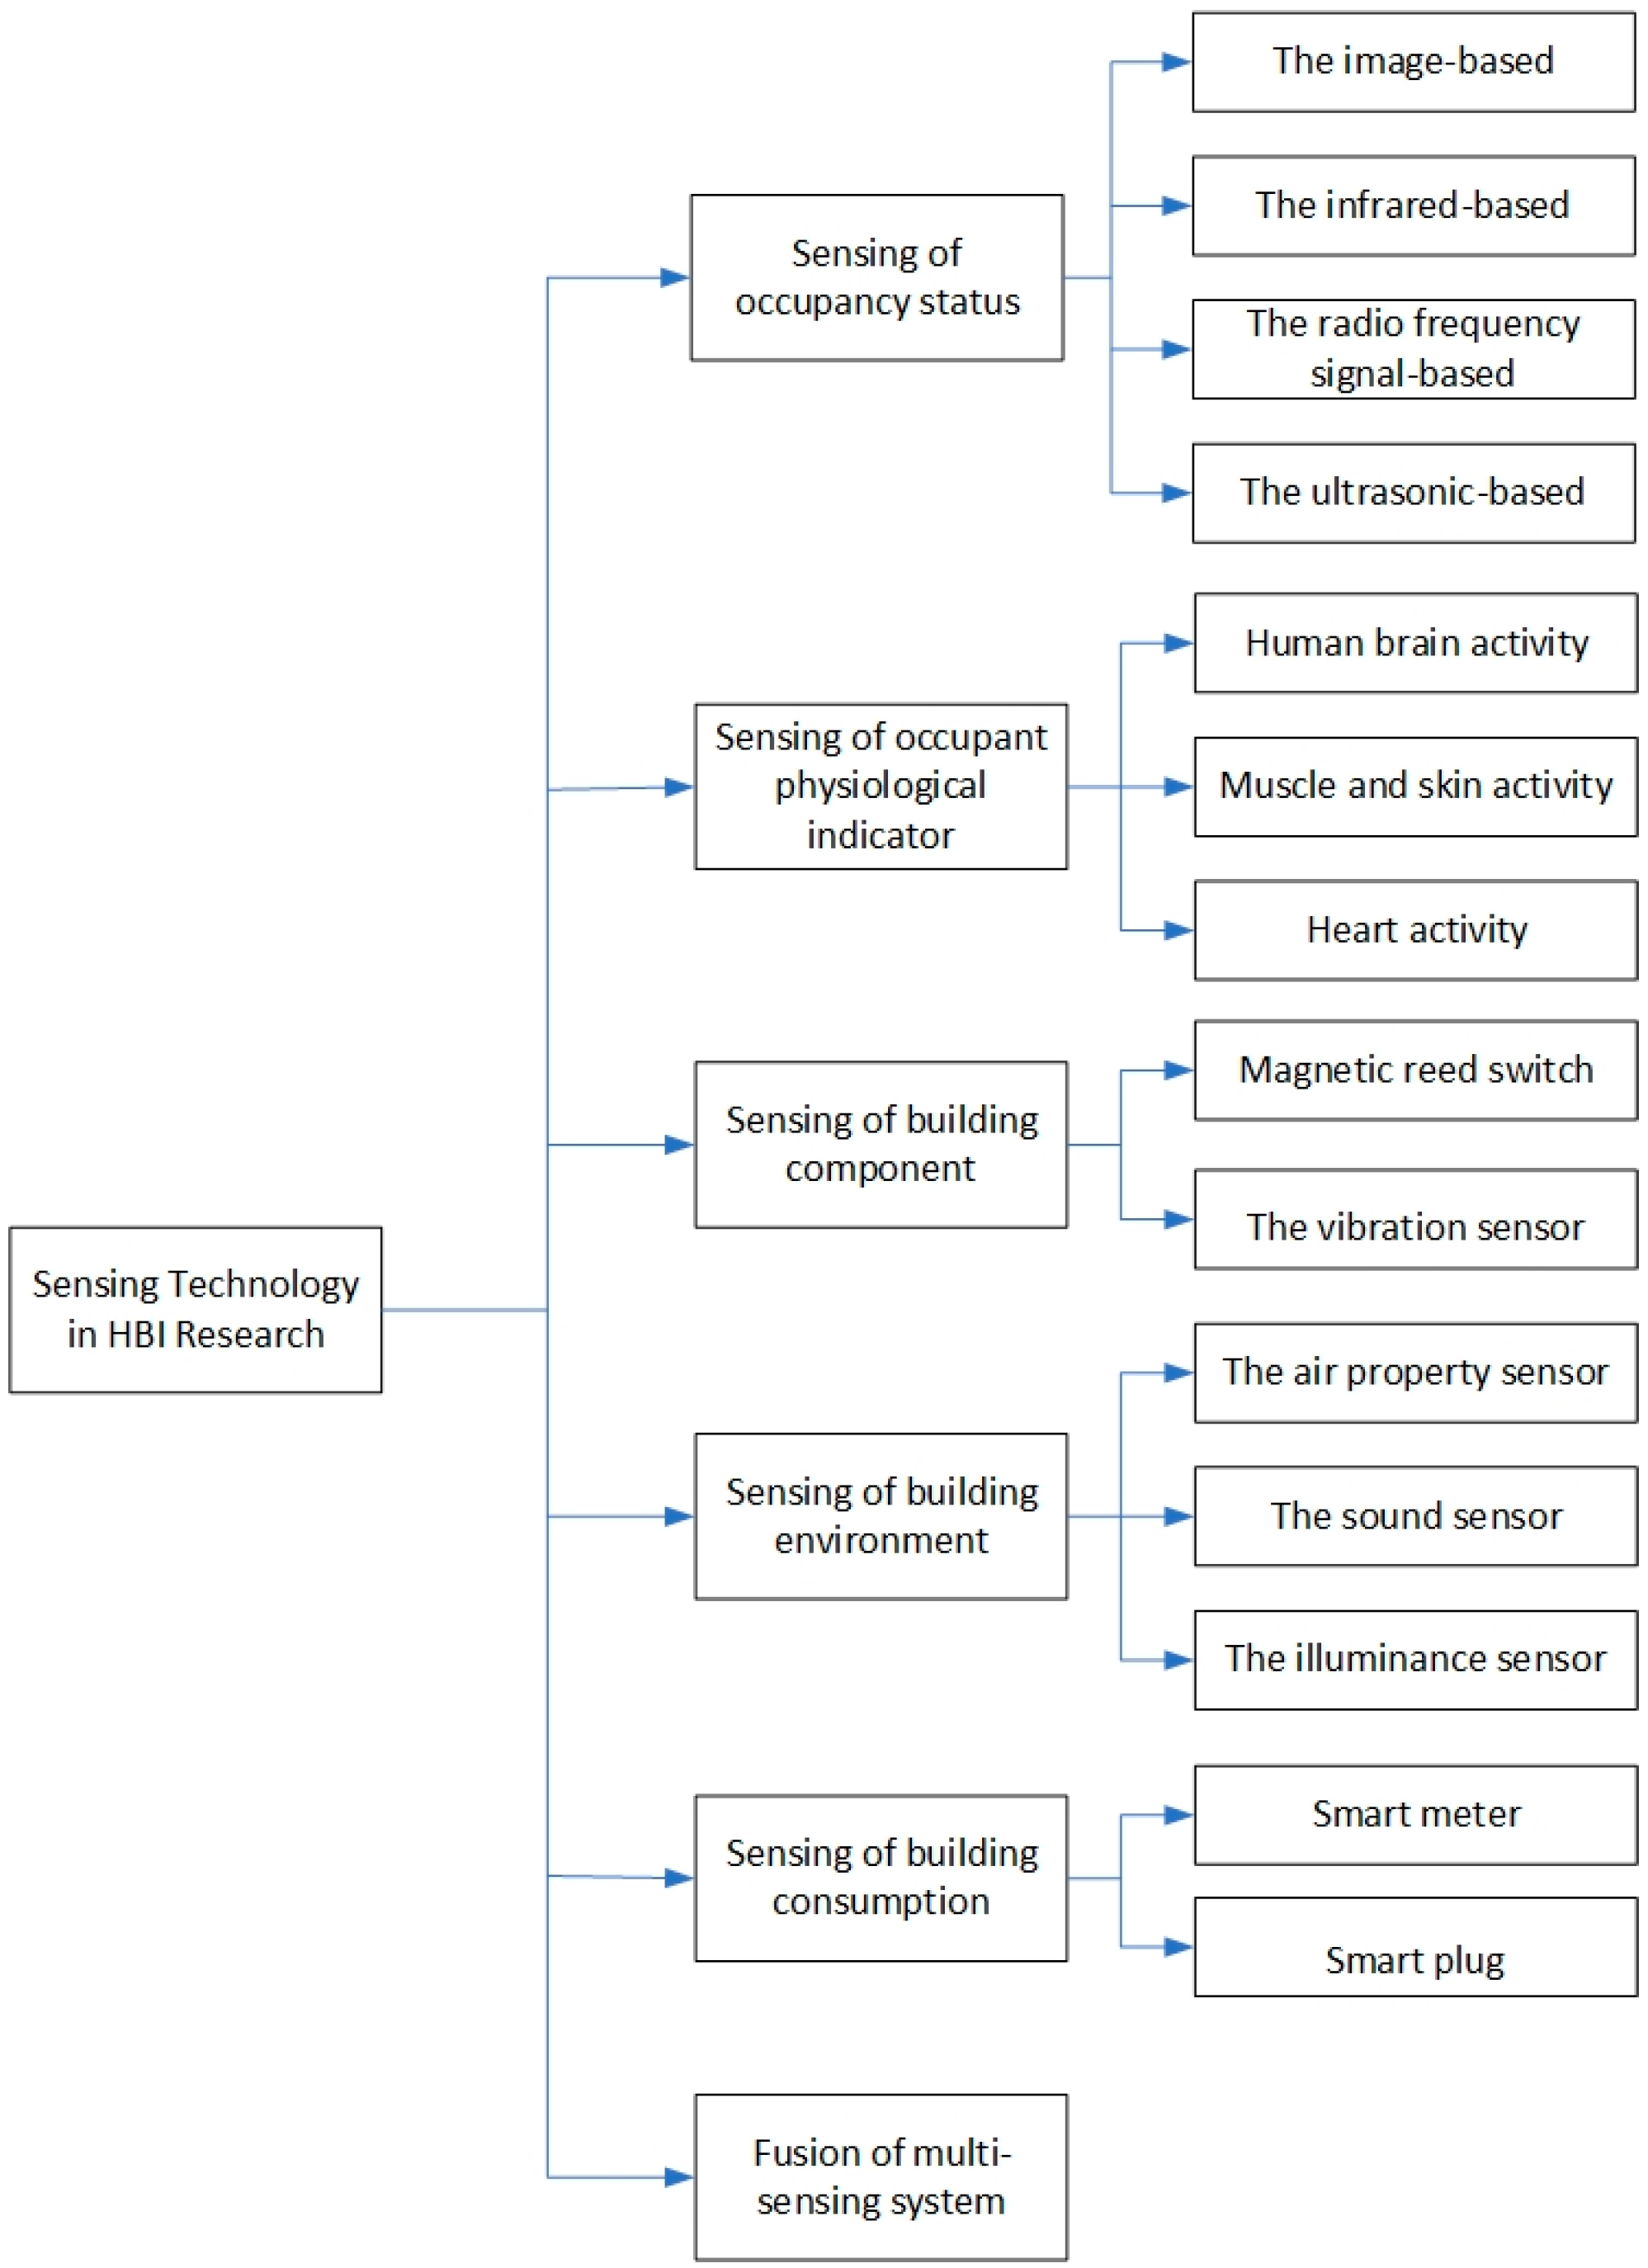
3. The Sensing Technologies Adopted by HBI Research
3.1. The Sensing of Occupancy Status
3.1.1. Image-Based Sensing
- (1)
- The RGB image
- (2)
- The depth image

| Ref. | Type | Year | Research Object | Sensing Device | Data Processing Method |
|---|---|---|---|---|---|
| [11] | RGB | 2022 | Occupant activities | Web camera | SVM, KNN, RF, manually labeling |
| [12] | 2018 | Occupant tracking | View camera | rHOG | |
| [13] | 2017 | Occupant presence | Web camera | stochastic model | |
| [14] | 2017 | Occupant positions | Camera-based indoor tracking system | localization algorithms, calibrated mapping algorithm | |
| [15] | 2022 | Occupancy counting | Web camera | Statistical analysis, K-means clustering, multiple linear regression | |
| [16] | 2018 | Occupancy counting | overhead video; PTZ camera | Background Subtraction algorithm, SVM + HOG | |
| [17] | 2022 | Occupant clothing insulation | Azure Kinect | CNN models-VGG 16, Inception V4, TinyYOLOV3, ResNet18 | |
| [18] | 2022 | Occupant clothing insulation | Video camera | CNN-YOLO models | |
| [23] | Depth | 2020 | Occupant activity | Microsoft Kinect | CNN model-METNet |
| [24] | 2019 | Occupant activity | Microsoft Kinect | depth registration; skeleton model, CNN | |
| [25] | 2015 | Occupancy detection and profiling | Microsoft Kinect MESA SR4000 | background subtraction, point cloud clustering | |
| [26] | 2017 | Occupancy counting | Microsoft Kinect | FORK | |
| [27] | 2021 | Occupancy counting | VL53L5TOF sensor | 3D reconstruction, Background subtraction, and filtering, point clustering |
3.1.2. Infrared-Based Sensing
3.1.3. Radio Frequency Signal-Based Sensing
| No. | Type | Year | Research Object | Data Processing Method |
|---|---|---|---|---|
| [42] | WIFI | 2019 | Occupancy counting | Multiple linear regression, ANN |
| [43] | 2022 | Occupant behavior | lightweight CNN | |
| [44] | 2019 | Occupancy detection | Ensemble learning classification algorithms | |
| [45] | 2021 | Occupancy pattern | K-means clustering, Poisson regression, cumulative frequency analysis | |
| [46] | BLE | 2017 | Occupancy detection | SVM, RF |
| [47] | 2020 | occupancy pattern | Binary classification, gradient boosting algorithm, K-means algorithm, | |
| [49] | RFID | 2012 | Occupancy counting, occupancy identification | Scattering analysis, statistical analysis |
| [50] | 2022 | Occupancy counting | Radio signal processing | |
| [51] | UWB | 2017 | Occupancy detection | Principal component analysis (PCA) |
| [52] | 2017 | Human identification | Region of interest extraction, PCA | |
| [53] | 2021 | Motion detection | adaptive motion detection algorithm | |
| [54] | GPS | 2021 | Occupancy counting | GeoHash Model |
| [55] | 2021 | Occupancy schedule | Web scraping techniques, text classification, and semantic analysis |
3.1.4. Ultrasonic-Based Sensing
3.2. The Sensing of Occupant Physiological Indicators
3.2.1. The Sensing of Human Brain Activity
3.2.2. The Sensing of Muscle and Skin Activity
3.2.3. The Sensing of Heart Activity
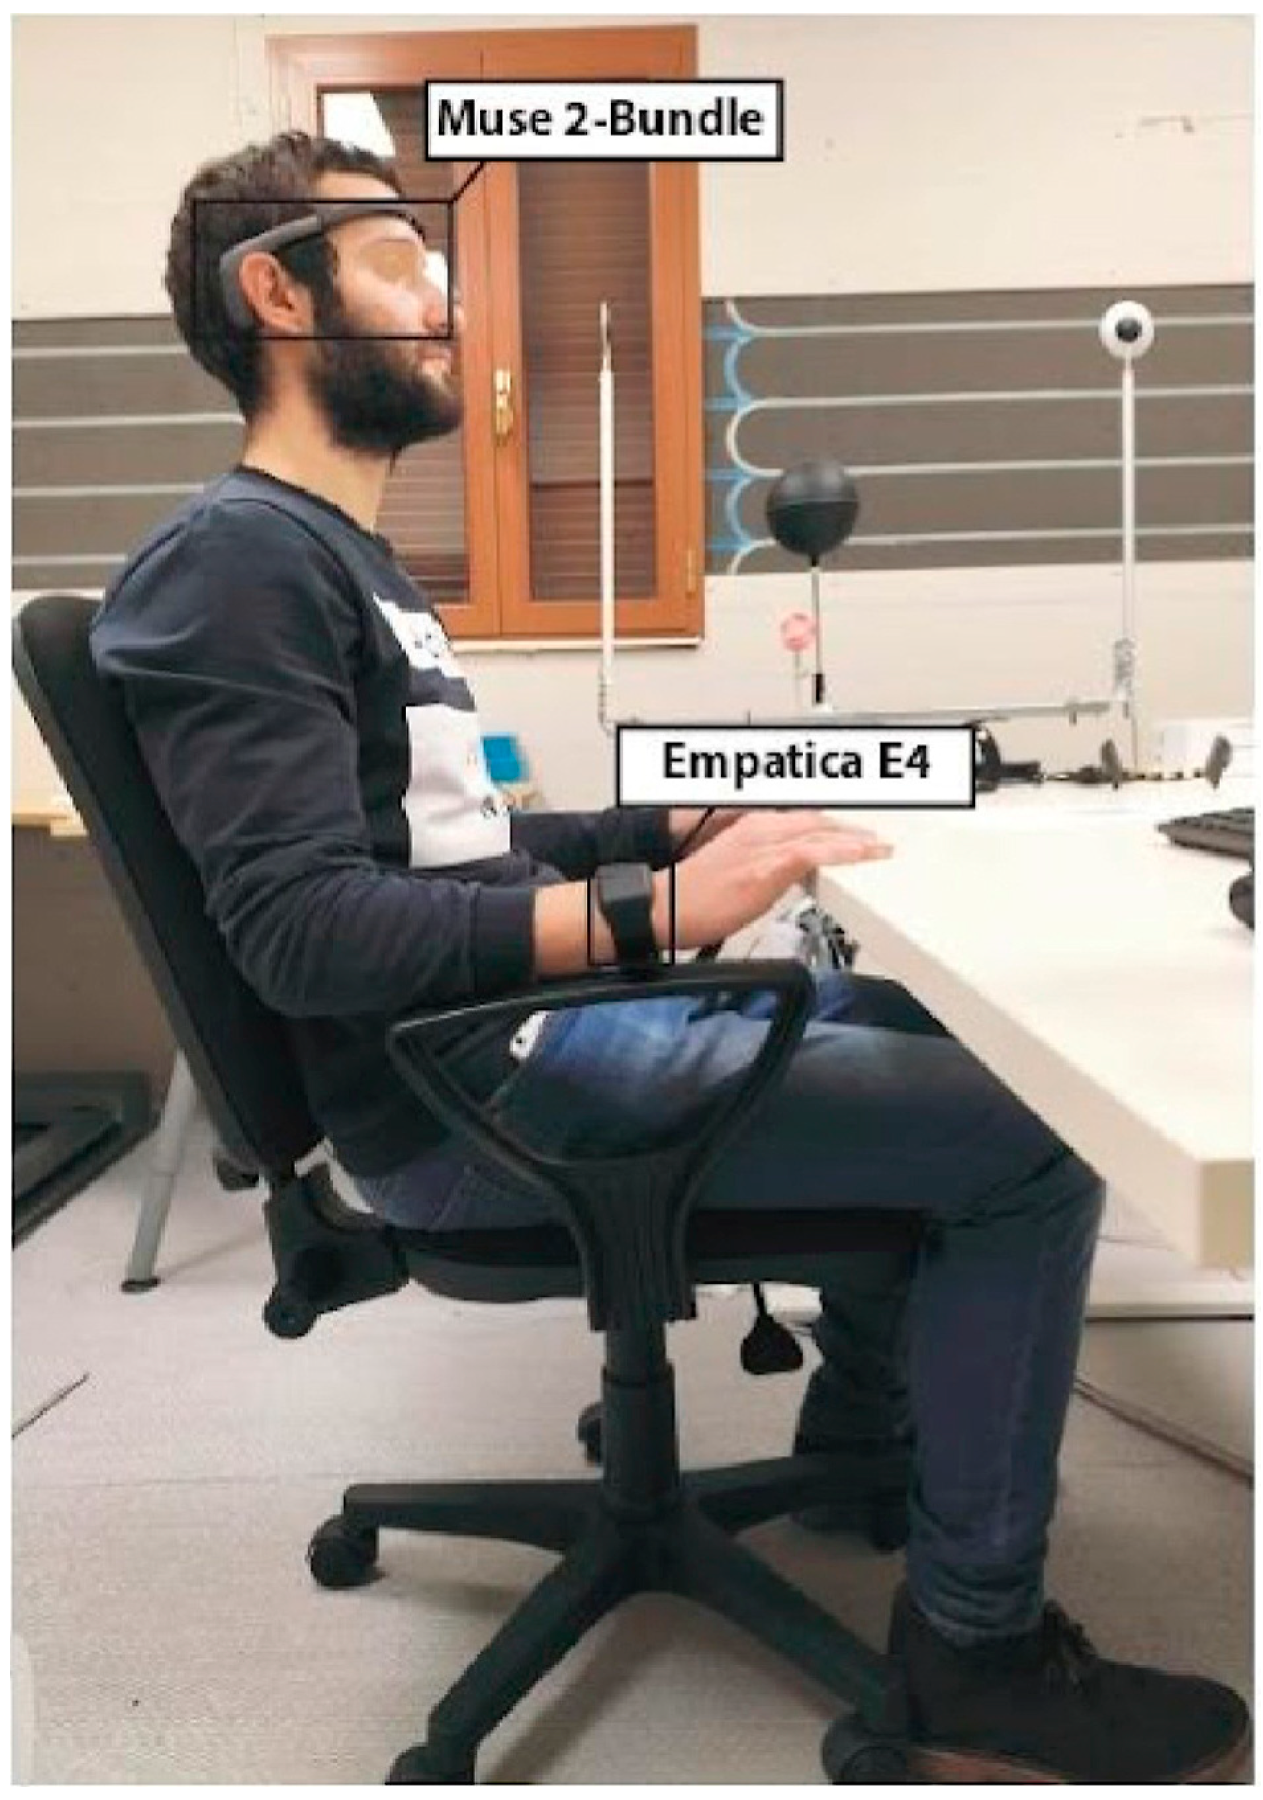
3.2.4. The Wearable Device
| No. | Type | Year | Research Object | Sensing Device | Data Analysis Method |
|---|---|---|---|---|---|
| [61] | EEG | 2018 | Brain activity in rest and task | Emotiv EPOC | EEGLAB toolbox LDA classifier |
| [62] | 2019 | Brain activity in rest and task | Emotiv EPOC | EEGLAB toolbox LDA, SVM | |
| [64] | 2020 | Brain activity in VR environment | Emotiv EPOC | software Emotiv Pro, statistical analysis | |
| [65] | 2022 | Brain activity in VR environment | 63-channel actiCHamp | Lab Streaming Layer (LSL) software | |
| [66] | EMG IMU | 2021 | Worker’s muscle engagement | Myo armband | ANN |
| [69] | 2014 | Physical demand | Delsys wireless EMG system | MATLAB, statistics analysis | |
| [70] | 2021 | Leg fatigue, gait motion | Megawin, Qualisys Track Manager | MATLAB, statistic analysis | |
| [71] | EDA, ST | 2019 | Environmental comfort | Careshine Electronic Technology, PyroButton-L | Statistic analysis |
| [72] | 2019 | Skin temperature, face temperature | Wearable device with infrared temperature sensor, thermal camera | Neighborhood component based feature selection, RF, SVM, KNN | |
| [73] | 2022 | Occupant thermal comfort | E4 Wristband | CNN-SVM hybrid model, ensemble transfer learning | |
| [74] | 2018 | Occupant thermal comfort | Exacon D-S18JK | Statistical analysis, SVM, ELM | |
| [75] | ECG | 2020 | Environmental comfort | EPOC+, BioHarness | Feature extraction, LDA, KNN, decision Tree, naïve Bayes, SVM, and RF |
| [76] | 2018 | Occupant thermal comfort | Holter | Statistic analysis | |
| [77] | PPG | 2019 | Pervasive blood pressure | Smart wristbands | Feature extraction, NN, SVM, DT |
| [78] | ECG, EEG, EMG, GSR | 2022 | Indoor thermal comfort | Physiological signal measurement system | Linear regression, Gaussian process regression, SVM regression, DT |
| [79] | EEG, EDA, BVP, IBI, ST | 2022 | Thermal comfort | MUSE 2 headband Empatica E4 | Feature extraction, statistic analysis |
3.3. The Sensing of Building Components
3.3.1. Magnetic Reed Switch
3.3.2. The Vibration Sensor
3.4. The Sensing of the Building Environment
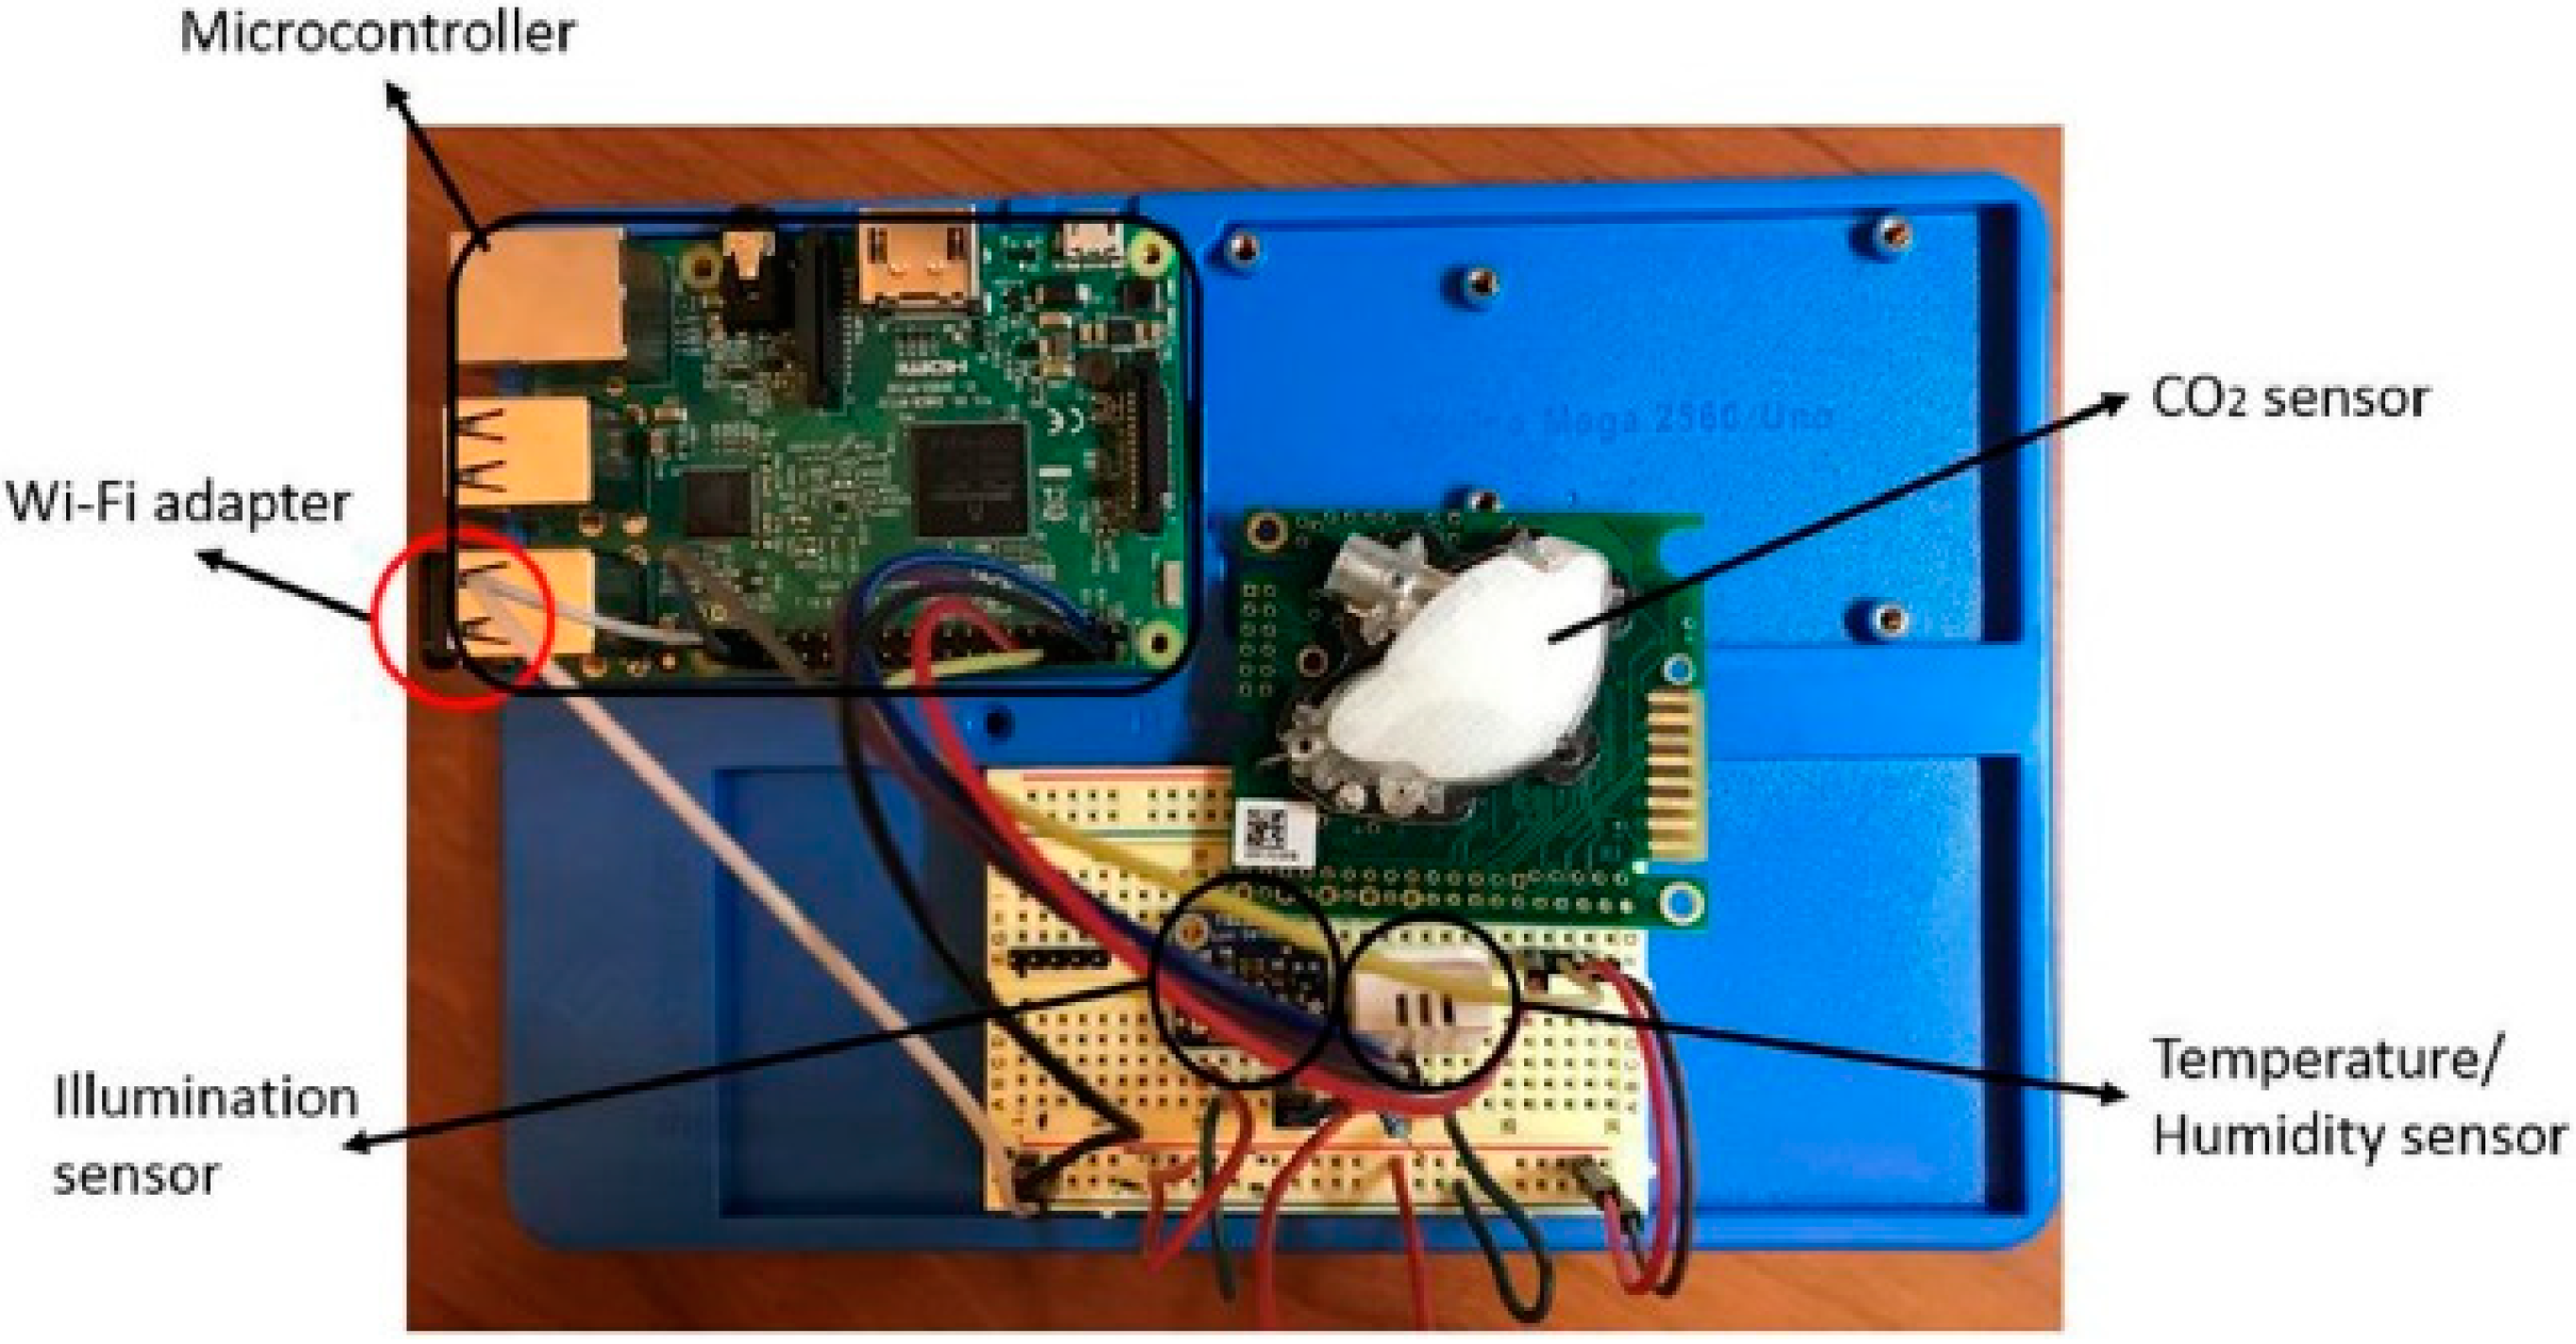
3.4.1. Air Property Sensor
- (1)
- CO2 sensor
- (2)
- Indoor air quality (IAQ) monitor
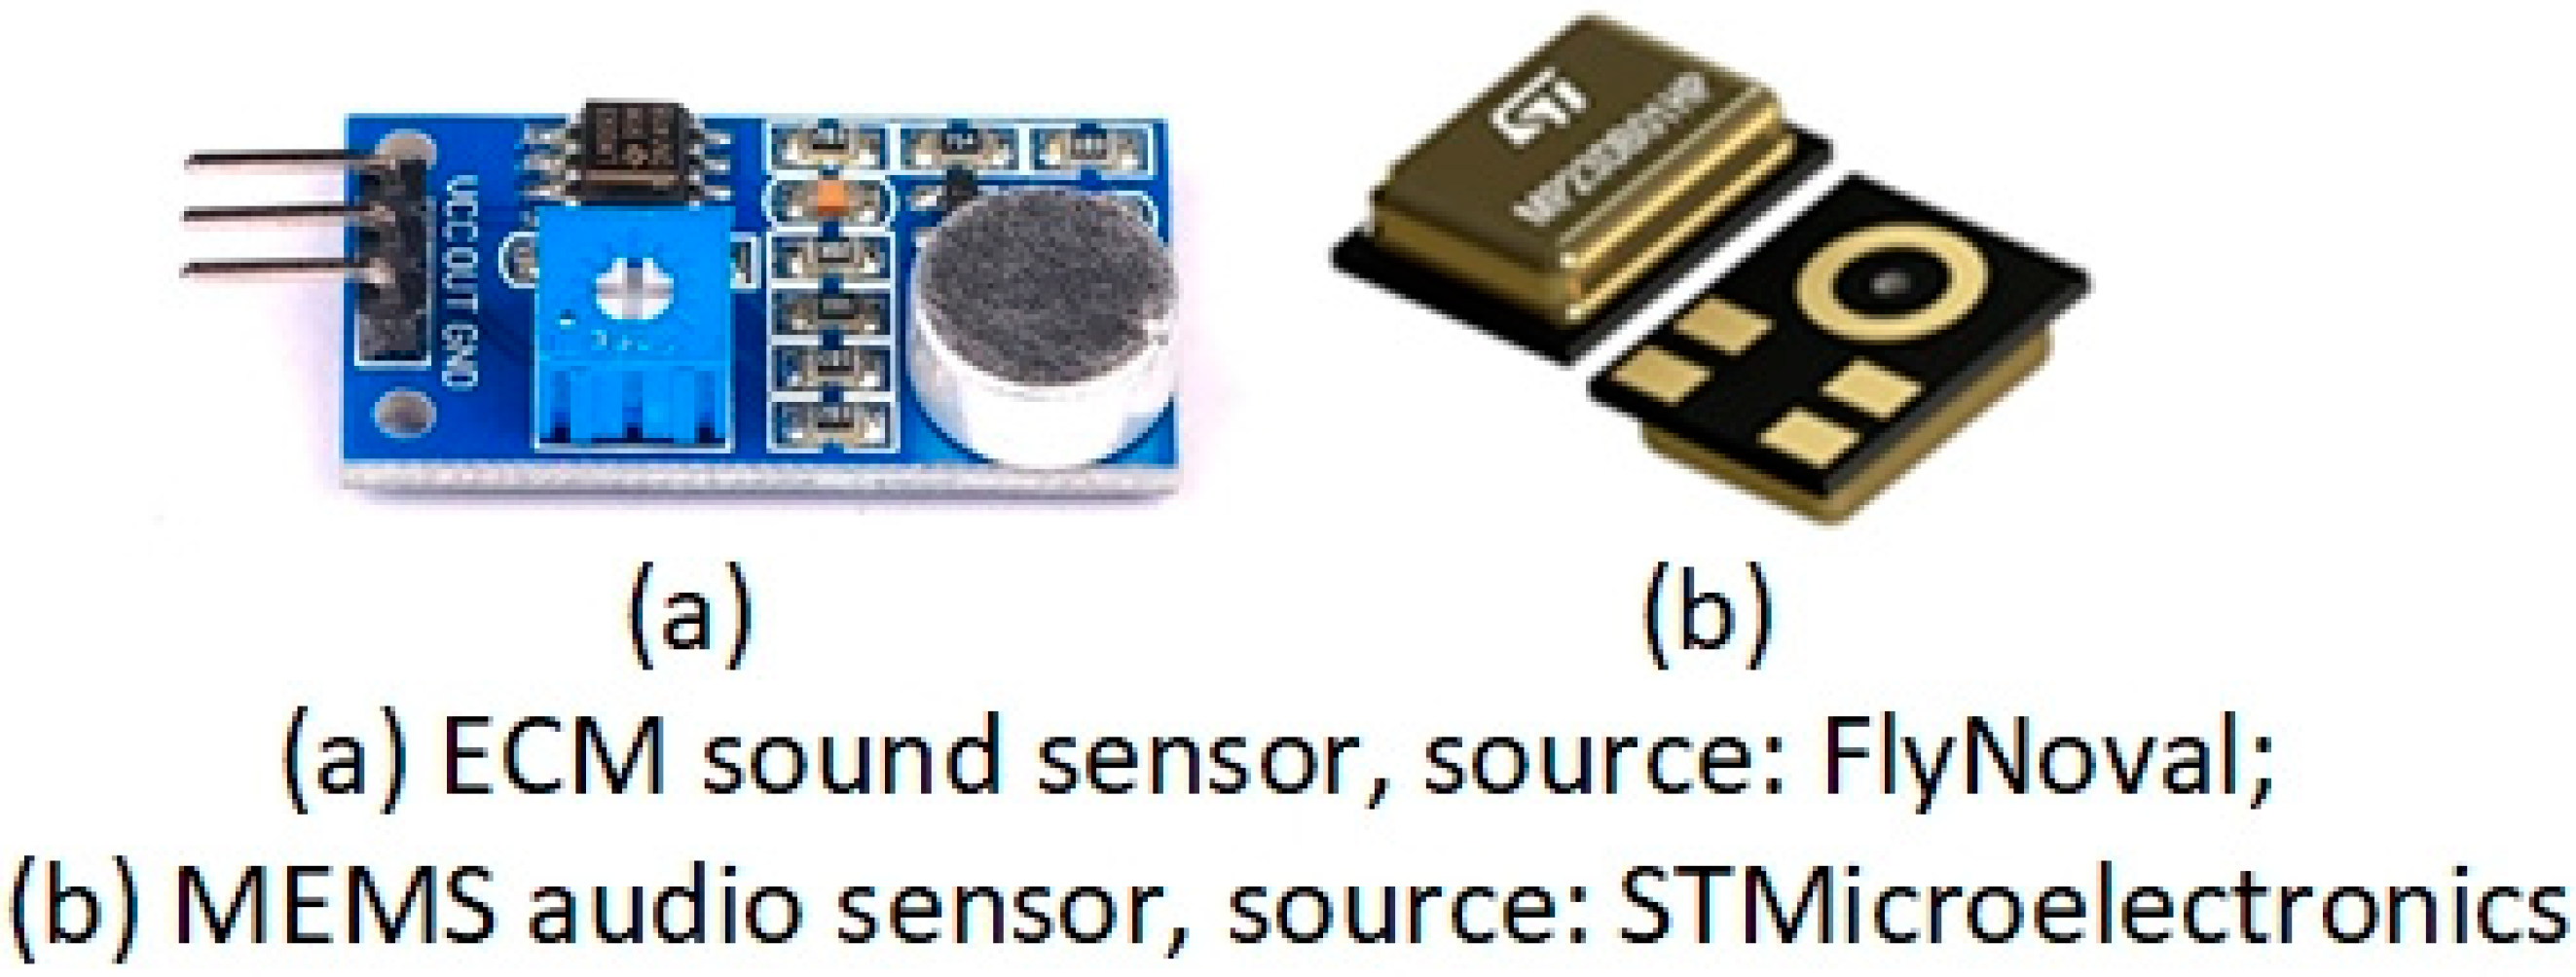
3.4.2. Sound Sensor
3.4.3. Illuminance Sensor
| No. | Type | Year | Research Object | Sensing Device | Data Processing Method |
|---|---|---|---|---|---|
| [101] | CO2 | 2019 | Occupancy counting | CO2 sensor | Statistical analyses |
| [102] | 2015 | Occupancy counting, occupancy activity | CO2 sensor, beam-break sensor | Statistical analyses | |
| [103] | 2019 | Occupancy counting | CO2 sensor | stochastic differential equations | |
| [104] | IAQ | 2017 | Influence of occupant behavior on energy | IEQ monitors | Model-based simulation, statistical modeling |
| [105] | 2019 | Occupant behavior | Customized smart sensor node | Agent-based modeling | |
| [106] | 2019 | Influence of IEQ on occupant behavior | SHT30, T6703 CO2 Module, SP3S-AQ2, MEVIU | weighed Euclidean distance | |
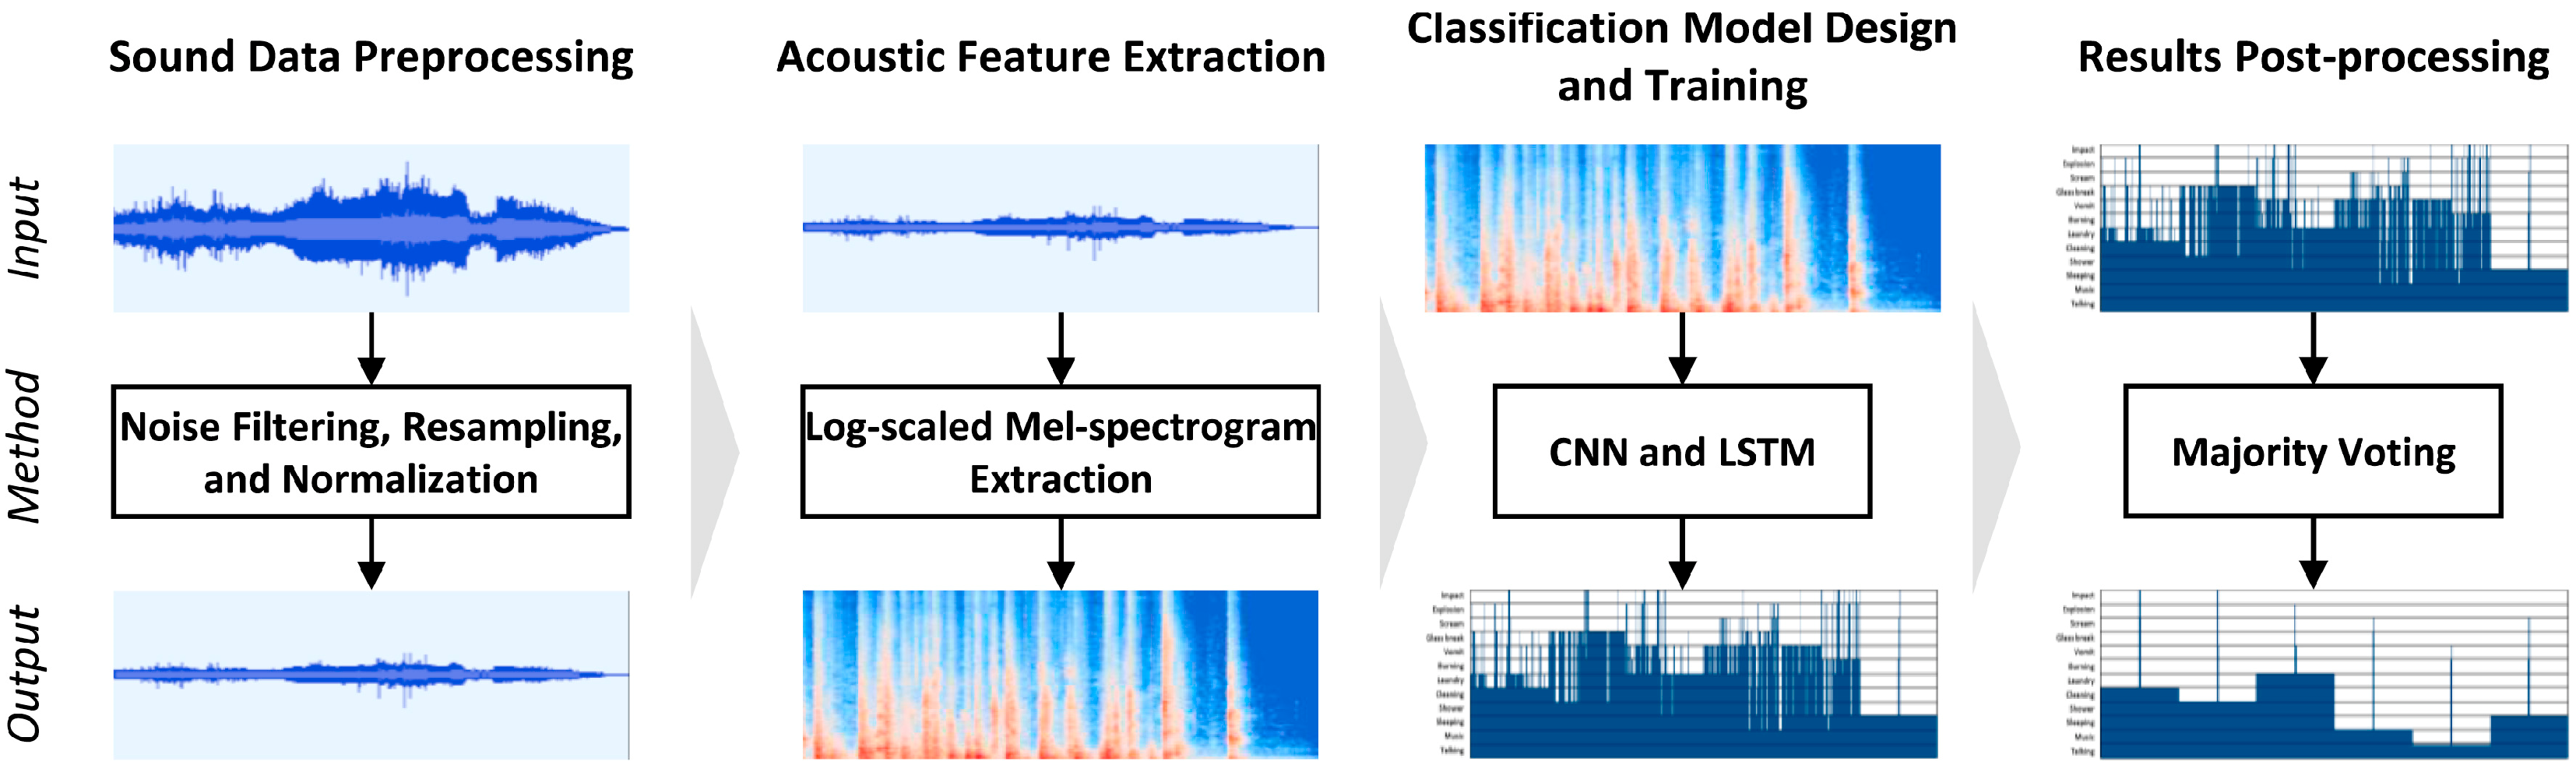
| [107] | Sound | 2020 | Occupant behavior monitoring and emergency event detection | IVR-50 | Deep learning sound recognition |
| [110] | 2015 | energy-related activity recognition in buildings | Smartphone | Locality-constrained linear coding method | |
| [111] | Illuminance | 2016 | Occupant comfort, energy consumption | Light sensor, headlight, PIR sensor | Statistic analysis |
| [112] | 2015 | Lighting control for comfort and energy efficiency | Light sensor, headlight, PIR sensor | Statistic analysis | |
| [113] | 2018 | personalized visual satisfaction | Illuminance sensor, HDR camera | Bayesian modeling | |
| [114] | 2019 | Occupant-centric lighting control | LightLearn hardware configuration (light sensor, RPI) | Reinforcement learning |
3.5. The Sensing of Building Consumption
3.5.1. Smart Meter
3.5.2. Smart Plug
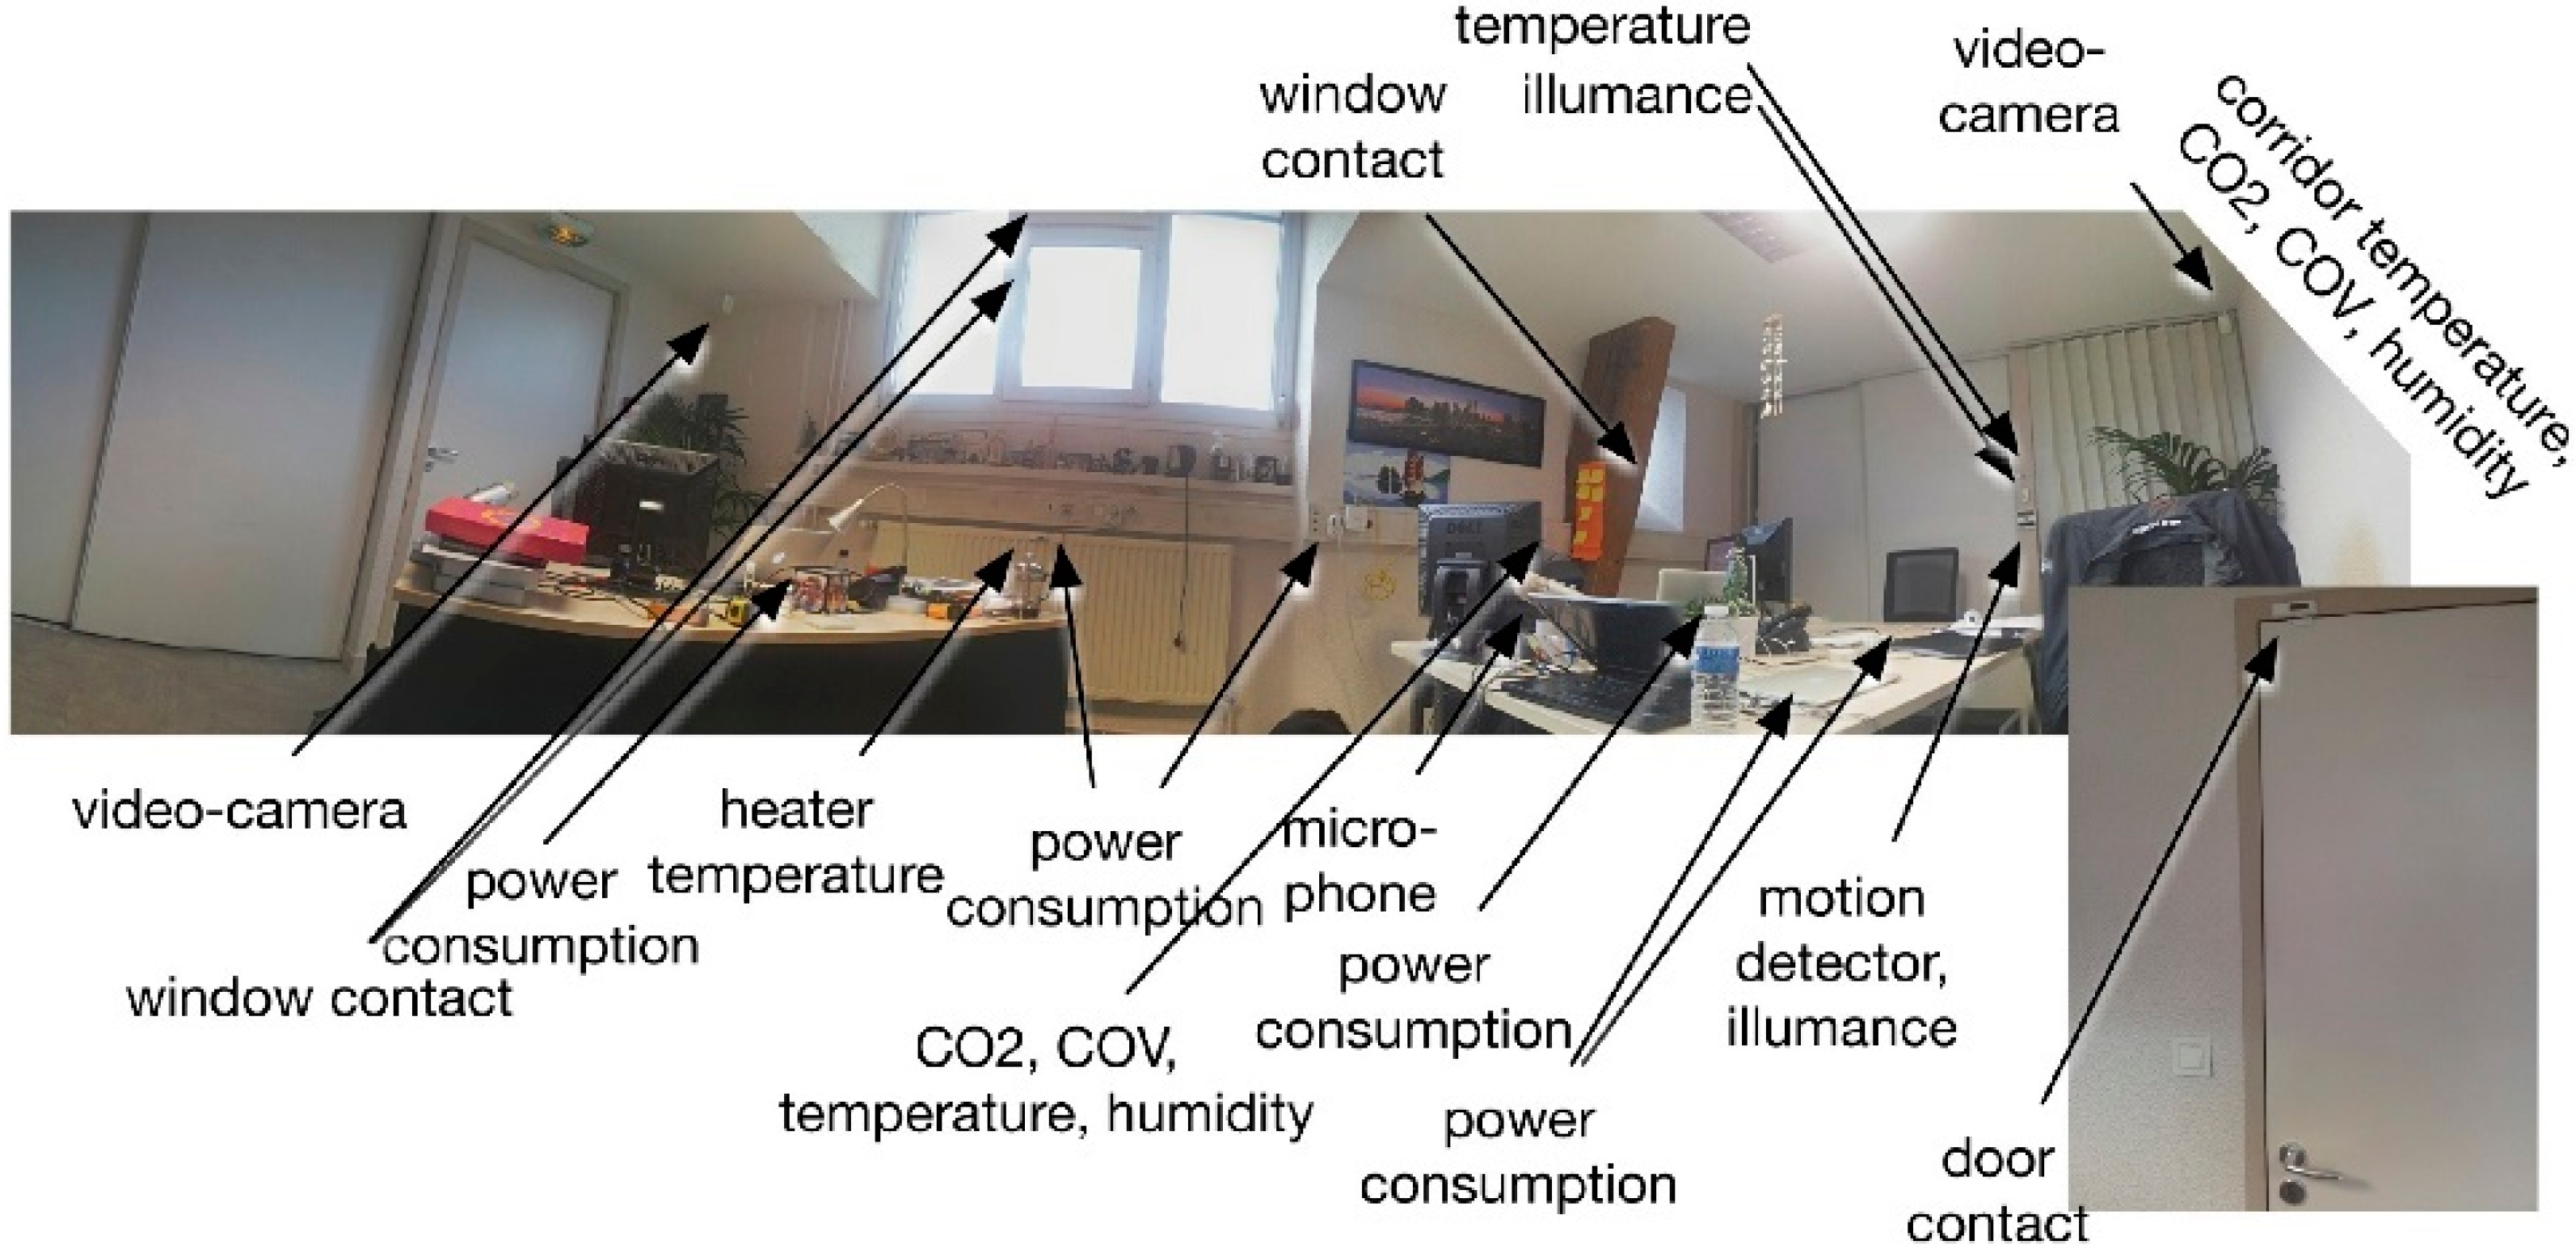
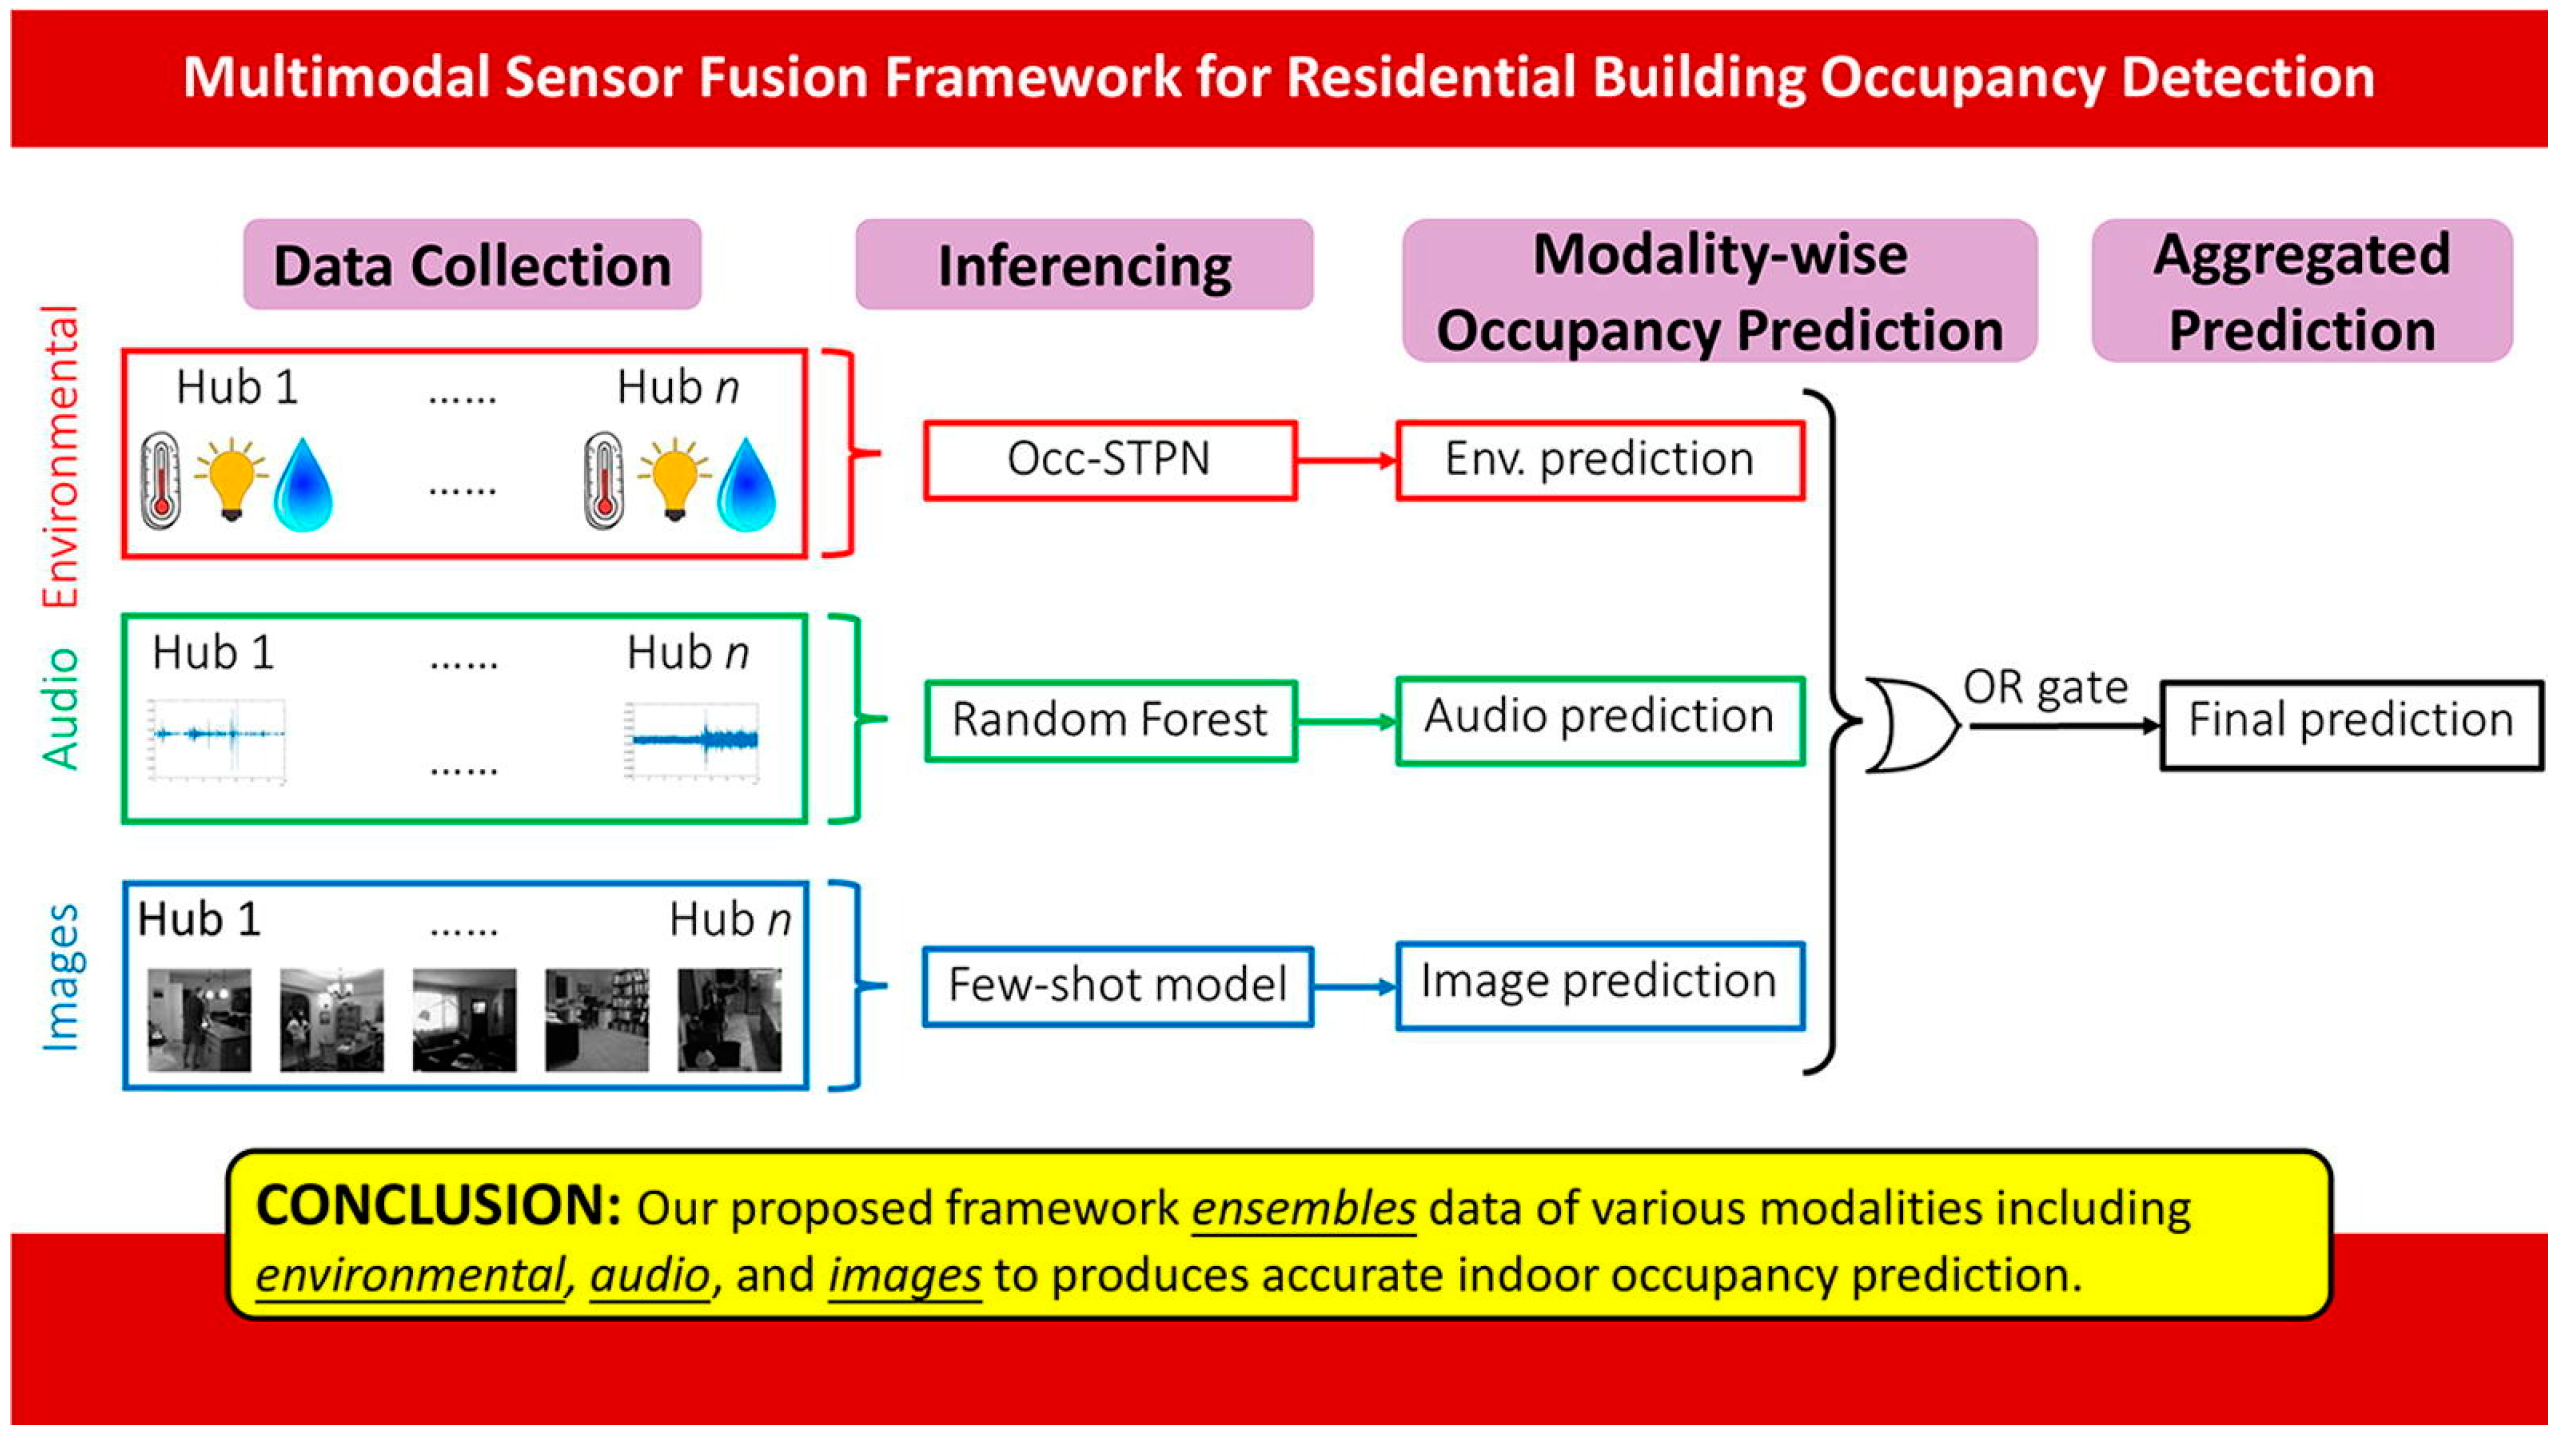
3.6. The Fusion of Multi-Sensing System
4. Discussion
4.1. The Facts behind the Data
4.2. The Cost-Effectiveness of the Fusion of Multi-Sensing System
4.3. The Privacy Issues Involved with Data Acquisition
5. Conclusions
Author Contributions
Funding
Acknowledgments
Conflicts of Interest
References
- Johansen, S.S.; Kjeldskov, J.; Skov, M.B. Temporal Constraints in Human--Building Interaction. ACM Trans. Comput. Interact. 2019, 26, 1–29. [Google Scholar] [CrossRef] [Green Version]
- Alavi, H.S.; Churchill, E.F.; Wiberg, M.; Lalanne, D.; Dalsgaard, P.; Fatah gen Schieck, A.; Rogers, Y. Introduction to Human-Building Interaction (HBI): Interfacing HCI with Architecture and Urban Design. ACM Trans. Comput. Hum. Interact. 2019, 26, 1–10. [Google Scholar] [CrossRef]
- Hong, T.; D’Oca, S.; Turner, W.J.; Taylor-Lange, S.C. An ontology to represent energy-related occupant behavior in buildings. Part I: Introduction to the DNAs framework. Build. Environ. 2015, 92, 764–777. [Google Scholar] [CrossRef] [Green Version]
- D’Oca, S.; Chen, C.F.; Hong, T.; Belafi, Z. Synthesizing building physics with social psychology: An interdisciplinary framework for context and occupant behavior in office buildings. Energy Res. Soc. Sci. 2017, 34, 240–251. [Google Scholar] [CrossRef] [Green Version]
- Norouziasl, S.; Jafari, A.; Zhu, Y. Modeling and simulation of energy-related human-building interaction: A systematic review. J. Build. Eng. 2021, 44, 102928. [Google Scholar] [CrossRef]
- Harputlugil, T.; de Wilde, P. The interaction between humans and buildings for energy efficiency: A critical review. Energy Res. Soc. Sci. 2021, 71, 101828. [Google Scholar] [CrossRef]
- Yan, D.; O’Brien, W.; Hong, T.; Feng, X.; Gunay, H.B.; Tahmasebi, F.; Mahdavi, A. Occupant behavior modeling for building performance simulation: Current state and future challenges. Energy Build. 2015, 107, 264–278. [Google Scholar] [CrossRef] [Green Version]
- Jia, M.; Srinivasan, R.S.; Raheem, A.A. From occupancy to occupant behavior: An analytical survey of data acquisition technologies, modeling methodologies and simulation coupling mechanisms for building energy efficiency. Renew. Sustain. Energy Rev. 2017, 68, 525–540. [Google Scholar] [CrossRef]
- Xie, C.; Ding, H.; Zhang, H.; Yuan, J.; Su, S.; Tang, M. Exploring the psychological mechanism underlying the relationship between organizational interventions and employees’ energy-saving behaviors. Energy Policy 2021, 156, 112411. [Google Scholar] [CrossRef]
- Choi, H.; Um, C.Y.; Kang, K.; Kim, H.; Kim, T. Review of vision-based occupant information sensing systems for occupant-centric control. Build. Environ. 2021, 203, 108064. [Google Scholar] [CrossRef]
- Yoon, Y.R.; Lee, Y.R.; Kim, S.H.; Kim, J.W.; Moon, H.J. A non-intrusive data-driven model for detailed occupants’ activities classification in residential buildings using environmental and energy usage data. Energy Build. 2022, 256, 111699. [Google Scholar] [CrossRef]
- Ahmed, I.; Ahmad, A.; Piccialli, F.; Sangaiah, A.K.; Jeon, G. A Robust Features-Based Person Tracker for Overhead Views in Industrial Environment. IEEE Internet Things J. 2018, 5, 1598–1605. [Google Scholar] [CrossRef]
- Ahn, K.-U.; Kim, D.-W.; Park, C.-S.; de Wilde, P. Predictability of occupant presence and performance gap in building energy simulation. Appl. Energy 2017, 208, 1639–1652. [Google Scholar] [CrossRef]
- Liu, S.; Yin, L.; Ho, W.K.; Ling, K.V.; Schiavon, S. A tracking cooling fan using geofence and camera-based indoor localization. Build. Environ. 2017, 114, 36–44. [Google Scholar] [CrossRef] [Green Version]
- Alishahi, N.; Ouf, M.M.; Nik-Bakht, M. Using WiFi connection counts and camera-based occupancy counts to estimate and predict building occupancy. Energy Build. 2022, 257, 111759. [Google Scholar] [CrossRef]
- Yang, J.; Pantazaras, A.; Chaturvedi, K.A.; Chandran, A.K.; Santamouris, M.; Lee, S.E.; Tham, K.W. Comparison of different occupancy counting methods for single system-single zone applications. Energy Build. 2018, 172, 221–234. [Google Scholar] [CrossRef]
- Medina, A.; Méndez, J.I.; Ponce, P.; Peffer, T.; Meier, A.; Molina, A. Using Deep Learning in Real-Time for Clothing Classification with Connected Thermostats. Energies 2022, 15, 1811. [Google Scholar] [CrossRef]
- Medina, A.; Méndez, J.I.; Ponce, P.; Peffer, T.; Molina, A. Embedded Real-Time Clothing Classifier Using One-Stage Methods for Saving Energy in Thermostats. Energies 2022, 15, 6117. [Google Scholar] [CrossRef]
- Giancola, S.; Valenti, M.; Sala, R. A survey on 3D cameras: Metrological comparison of time-of-flight, structured-light and active stereoscopy technologies. In SpringerBriefs in Computer Science; Springer: Berlin/Heidelberg, Germany, 2018. [Google Scholar]
- Forbes, A.; de Oliveira, M.; Dennis, M.R. Structured light. Nat. Photonics 2021, 15, 253–262. [Google Scholar] [CrossRef]
- Huang, S.; Gu, F.; Cheng, Z.; Song, Z. A Joint Calibration Method for the 3D Sensing System Composed with ToF and Stereo Camera. In Proceedings of the 2018 IEEE International Conference on Information and Automation (ICIA), Wuyishan, China, 11–13 August 2018. [Google Scholar]
- Sun, K.; Zhao, Q.; Zou, J. A review of building occupancy measurement systems. Energy Build. 2020, 216, 109965. [Google Scholar] [CrossRef]
- Na, H.; Choi, H.; Kim, T. Metabolic rate estimation method using image deep learning. Build. Simul. 2020, 13, 1077–1093. [Google Scholar] [CrossRef]
- Dziedzic, J.W.; Da, Y.; Novakovic, V. Indoor occupant behaviour monitoring with the use of a depth registration camera. Build. Environ. 2018, 148, 44–54. [Google Scholar] [CrossRef]
- Diraco, G.; Leone, A.; Siciliano, P. People occupancy detection and profiling with 3D depth sensors for building energy management. Energy Build. 2015, 92, 246–266. [Google Scholar] [CrossRef]
- Liu, K.S.; Munir, S.; Francis, J.; Shelton, C.; Lin, S. Poster Abstract: Long Term Occupancy Estimation in a Commercial Space: An Empirical Study. In Proceedings of the 2017 16th ACM/IEEE International Conference on Information Processing in Sensor Networks (IPSN), Pittsburgh, PA, USA, 18–20 April 2017. [Google Scholar]
- Lu, H.; Tuzikas, A.; Radke, R.J. A zone-level occupancy counting system for commercial office spaces using low-resolution time-of-flight sensors. Energy Build. 2021, 252, 111390. [Google Scholar] [CrossRef]
- Mohammadmoradi, H.; Yin, S.; Gnawali, O. Room occupancy estimation through wifi, UWB, and light sensors mounted on doorways. In Proceedings of the 2017 International Conference on Smart Digital Environment, Rabat, Morocco, 21–23 July 2017; Association for Computing Machinery: New York, NY, USA, 2017; pp. 27–34. [Google Scholar]
- Liu, P.; Nguang, S.-K.; Partridge, A. Occupancy Inference Using Pyroelectric Infrared Sensors through Hidden Markov Models. IEEE Sensors J. 2015, 16, 1062–1068. [Google Scholar] [CrossRef]
- Rabiee, R.; Karlsson, J. Multi-Bernoulli Tracking Approach for Occupancy Monitoring of Smart Buildings Using Low-Resolution Infrared Sensor Array. Remote. Sens. 2021, 13, 3127. [Google Scholar] [CrossRef]
- Khan, D.S.; Kolarik, J.; Hviid, C.A.; Weitzmann, P. Method for long-term mapping of occupancy patterns in open-plan and single office spaces by using passive-infrared (PIR) sensors mounted below desks. Energy Build. 2021, 230, 110534. [Google Scholar] [CrossRef]
- Yang, D.; Xu, B.; Rao, K.; Sheng, W. Passive Infrared (PIR)-Based Indoor Position Tracking for Smart Homes Using Accessibility Maps and A-Star Algorithm. Sensors 2018, 18, 332. [Google Scholar] [CrossRef] [Green Version]
- Zhang, J.; Zhao, T.; Zhou, X.; Wang, J.; Zhang, X.; Qin, C.; Luo, M. Room zonal location and activity intensity recognition model for residential occupant using passive-infrared sensors and machine learning. Build. Simul. 2022, 15, 1133–1144. [Google Scholar] [CrossRef]
- Wu, L.; Wang, Y. A Low-Power Electric-Mechanical Driving Approach for True Occupancy Detection Using a Shuttered Passive Infrared Sensor. IEEE Sens. J. 2018, 19, 47–57. [Google Scholar] [CrossRef]
- Yang, B.; Li, X.; Hou, Y.; Meier, A.; Cheng, X.; Choi, J.H.; Wang, F.; Wang, H.; Wagner, A.; Yan, D.; et al. Non-invasive (non-contact) measurements of human thermal physiology signals and thermal comfort/discomfort poses—A review. Energy Build. 2020, 224, 110261. [Google Scholar] [CrossRef]
- Metzmacher, H.; Wölki, D.; Schmidt, C.; Frisch, J.; van Treeck, C. Real-time human skin temperature analysis using thermal image recognition for thermal comfort assessment. Energy Build. 2018, 158, 1063–1078. [Google Scholar] [CrossRef]
- Chidurala, V.; Li, X. Occupancy Estimation Using Thermal Imaging Sensors and Machine Learning Algorithms. IEEE Sens. J. 2021, 21, 8627–8638. [Google Scholar] [CrossRef]
- Metwaly, A.; Queralta, J.P.; Sarker, V.K.; Gia, T.N.; Nasir, O.; Westerlund, T. Edge Computing with Embedded AI: Thermal Image Analysis for Occupancy Estimation in Intelligent Buildings. In Proceedings of the INTelligent Embedded Systems Architectures and Applications Workshop 2019, New York, NY, USA, 13–18 October 2019; Association for Computing Machinery: New York, NY, USA, 2019; pp. 1–6. [Google Scholar]
- Kraft, M.; Aszkowski, P.; Pieczyński, D.; Fularz, M. Low-Cost Thermal Camera-Based Counting Occupancy Meter Facilitating Energy Saving in Smart Buildings. Energies 2021, 14, 4542. [Google Scholar] [CrossRef]
- Li, P.; Dai, P.; Cao, D.; Liu, B.; Lu, Y. Non-intrusive comfort sensing: Detecting age and gender from infrared images for personal thermal comfort. Build. Environ. 2022, 219, 109256. [Google Scholar] [CrossRef]
- Dong, B.; Kjærgaard, M.B.; De Simone, M.; Gunay, H.B.; O’Brien, W.; Mora, D.; Dziedzic, J.; Zhao, J. Sensing and Data Acquisition. In Exploring Occupant Behavior in Buildings: Methods and Challenges; Wagner, A., O’Brien, W., Dong, B., Eds.; Springer International Publishing: Cham, Switzerland, 2018; pp. 77–105. [Google Scholar]
- Hobson, B.; Lowcay, D.; Gunay, H.B.; Ashouri, A.; Newsham, G.R. Opportunistic occupancy-count estimation using sensor fusion: A case study. Build. Environ. 2019, 159, 106154. [Google Scholar] [CrossRef]
- Zhou, Q.Z.; Yang, Q.L.; Xing, J.C. Enabling efficient WiFi-based occupant behavior recognition using insufficient samples. Build. Environ. 2022, 212, 108806. [Google Scholar] [CrossRef]
- Wang, W.; Hong, T.; Li, N.; Wang, R.Q.; Chen, J. Linking energy-cyber-physical systems with occupancy prediction and interpretation through WiFi probe-based ensemble classification. Appl. Energy 2019, 236, 55–69. [Google Scholar] [CrossRef] [Green Version]
- Alishahi, N.; Nik-Bakht, M.; Ouf, M.M. A framework to identify key occupancy indicators for optimizing building operation using WiFi connection count data. Build. Environ. 2021, 200, 107936. [Google Scholar] [CrossRef]
- Barsocchi, P.; Crivello, A.; Girolami, M.; Mavilia, F.; Palumbo, F. Occupancy detection by multi-power bluetooth low energy beaconing. In Proceedings of the 2017 International Conference on Indoor Positioning and Indoor Navigation (IPIN), Sapporo, Japan, 18–21 September 2017. [Google Scholar]
- Tekler, Z.D.; Low, R.; Gunay, B.; Andersen, R.K.; Blessing, L. A scalable Bluetooth Low Energy approach to identify occupancy patterns and profiles in office spaces. Build. Environ. 2020, 171, 106681. [Google Scholar] [CrossRef]
- Arabshahi, M.; Wang, D.; Sun, J.; Rahnamayiezekavat, P.; Tang, W.; Wang, Y.; Wang, X. Review on Sensing Technology Adoption in the Construction Industry. Sensors 2021, 21, 8307. [Google Scholar] [CrossRef] [PubMed]
- Li, N.; Calis, G.; Becerik-Gerber, B. Measuring and monitoring occupancy with an RFID based system for demand-driven HVAC operations. Autom. Constr. 2012, 24, 89–99. [Google Scholar] [CrossRef]
- Kong, M.; Dong, B.; Zhang, R.; O’Neill, Z. HVAC energy savings, thermal comfort and air quality for occupant-centric control through a side-by-side experimental study. Appl. Energy 2021, 306, 117987. [Google Scholar] [CrossRef]
- Baird, Z.; Gunasekara, I.; Bolic, M.; Rajan, S. Principal component analysis-based occupancy detection with ultra wideband radar. In Proceedings of the 2017 IEEE 60th International Midwest Symposium on Circuits and Systems (MWSCAS), Boston, MA, USA, 6–9 August 2017; pp. 1573–1576. [Google Scholar]
- Mokhtari, G.; Zhang, Q.; Hargrave, C.; Ralston, J.C. Non-Wearable UWB Sensor for Human Identification in Smart Home. IEEE Sensors J. 2017, 17, 3332–3340. [Google Scholar] [CrossRef]
- Bregar, K.; Hrovat, A.; Mohorčič, M. UWB Radio-Based Motion Detection System for Assisted Living. Sensors 2021, 21, 3631. [Google Scholar] [CrossRef] [PubMed]
- Kim, S.; Lee, E.; Park, S.; Kwon, K. Non-intrusive Occupancy Estimation using a Smartphone GPS. In Proceedings of the 2021 International Conference on Information and Communication Technology Convergence (ICTC), Jeju Island, Republic of Korea, 21–23 October 2021. [Google Scholar]
- Lu, X.; Feng, F.; Pang, Z.; Yang, T.; O’Neill, Z. Extracting typical occupancy schedules from social media (TOSSM) and its integration with building energy modeling. Build. Simul. 2021, 14, 25–41. [Google Scholar] [CrossRef]
- Shih, O.; Lazik, P.; Rowe, A. Aures: A wide-band ultrasonic occupancy sensing platform. In Proceedings of the 3rd ACM International Conference on Systems for Energy-Efficient Built Environments, Palo Alto, CA, USA, 16–17 November 2016. [Google Scholar]
- Shih, O.; Rowe, A. Occupancy estimation using ultrasonic chirps. In Proceedings of the ACM/IEEE Sixth International Conference on Cyber-Physical Systems, Seattle, WA, USA, 14–16 April 2015. [Google Scholar]
- Lazik, P.; Rowe, A. Indoor pseudo-ranging of mobile devices using ultrasonic chirps. In Proceedings of the 10th ACM Conference on Embedded Network Sensor Systems, Toronto, ON, Canada, 6–9 November 2012. [Google Scholar]
- Ghosh, A.; Chakraborty, A.; Chakraborty, D.; Saha, M.; Saha, S. UltraSense: A non-intrusive approach for human activity identification using heterogeneous ultrasonic sensor grid for smart home environment. J. Ambient. Intell. Humaniz. Comput. 2019, 1–22. [Google Scholar] [CrossRef]
- Karakas, T.; Yildiz, D. Exploring the influence of the built environment on human experience through a neuroscience approach: A systematic review. Front. Arch. Res. 2020, 9, 236–247. [Google Scholar] [CrossRef]
- Shan, X.; Yang, E.-H.; Zhou, J.; Chang, V.W.-C. Human-building interaction under various indoor temperatures through neural-signal electroencephalogram (EEG) methods. Build. Environ. 2018, 129, 46–53. [Google Scholar] [CrossRef]
- Shan, X.; Yang, E.-H.; Zhou, J.; Chang, V.W. Neural-signal electroencephalogram (EEG) methods to improve human-building interaction under different indoor air quality. Energy Build. 2019, 197, 188–195. [Google Scholar] [CrossRef]
- Bower, I.; Tucker, R.; Enticott, P.G. Impact of built environment design on emotion measured via neurophysiological correlates and subjective indicators: A systematic review. J. Environ. Psychol. 2019, 66, 101344. [Google Scholar] [CrossRef]
- Hu, M.; Roberts, J. Built Environment Evaluation in Virtual Reality Environments—A Cognitive Neuroscience Approach. Urban Sci. 2020, 4, 48. [Google Scholar] [CrossRef]
- Cruz-Garza, J.G.; Darfler, M.; Rounds, J.D.; Gao, E.; Kalantari, S. EEG-based investigation of the impact of room size and window placement on cognitive performance. J. Build. Eng. 2022, 53, 104540. [Google Scholar] [CrossRef]
- Bangaru, S.S.; Wang, C.; Busam, S.A.; Aghazadeh, F. ANN-based automated scaffold builder activity recognition through wearable EMG and IMU sensors. Autom. Constr. 2021, 126, 103653. [Google Scholar] [CrossRef]
- Critchley, H.D. Review: Electrodermal Responses: What Happens in the Brain. Neurosci. 2002, 8, 132–142. [Google Scholar] [CrossRef]
- Mansi, S.A.; Barone, G.; Forzano, C.; Pigliautile, I.; Ferrara, M.; Pisello, A.L.; Arnesano, M. Measuring human physiological indices for thermal comfort assessment through wearable devices: A review. Measurement 2021, 183, 109872. [Google Scholar] [CrossRef]
- Lavender, S.A.; Hedman, G.E.; Mehta, J.P.; Reichelt, P.A.; Conrad, K.M.; Park, S. Evaluating the physical demands on firefighters using hand-carried stair descent devices to evacuate mobility-limited occupants from high-rise buildings. Appl. Ergon. 2014, 45, 389–397. [Google Scholar] [CrossRef]
- Halder, A.; Nordin, A.; Miller, M.; Kuklane, K.; Nirme, J.; Gao, C. Effects of leg fatigue due to exhaustive stair climbing on gait biomechanics while walking up a 10° incline—Implications for evacuation and work safety. Fire Saf. J. 2021, 123, 103342. [Google Scholar] [CrossRef]
- Xiong, J.; Ma, T.; Lian, Z.; de Dear, R. Perceptual and physiological responses of elderly subjects to moderate temperatures. Build. Environ. 2019, 156, 117–122. [Google Scholar] [CrossRef]
- Aryal, A.; Becerik-Gerber, B. A comparative study of predicting individual thermal sensation and satisfaction using wrist-worn temperature sensor, thermal camera and ambient temperature sensor. Build. Environ. 2019, 160, 106223. [Google Scholar] [CrossRef]
- Park, H.; Park, D.Y. Prediction of individual thermal comfort based on ensemble transfer learning method using wearable and environmental sensors. Build. Environ. 2021, 207, 108492. [Google Scholar] [CrossRef]
- Chaudhuri, T.; Zhai, D.; Soh, Y.C.; Li, H.; Xie, L. Thermal comfort prediction using normalized skin temperature in a uniform built environment. Energy Build. 2018, 159, 426–440. [Google Scholar] [CrossRef]
- Pigliautile, I.; Casaccia, S.; Morresi, N.; Arnesano, M.; Pisello, A.L.; Revel, G.M. Assessing occupants’ personal attributes in relation to human perception of environmental comfort: Measurement procedure and data analysis. Build. Environ. 2020, 177, 106901. [Google Scholar] [CrossRef]
- Zhu, H.; Wang, H.; Liu, Z.; Li, D.; Kou, G.; Li, C. Experimental study on the human thermal comfort based on the heart rate variability (HRV) analysis under different environments. Sci. Total. Environ. 2017, 616–617, 1124–1133. [Google Scholar] [CrossRef]
- Riaz, F.; Azad, M.A.; Arshad, J.; Imran, M.; Hassan, A.; Rehman, S. Pervasive blood pressure monitoring using Photoplethysmogram (PPG) sensor. Future Gener. Comput. Syst. 2019, 98, 120–130. [Google Scholar] [CrossRef] [Green Version]
- Pao, S.-L.; Wu, S.-Y.; Liang, J.-M.; Huang, I.-J.; Guo, L.-Y.; Wu, W.-L.; Liu, Y.-G.; Nian, S.-H. A Physiological-Signal-Based Thermal Sensation Model for Indoor Environment Thermal Comfort Evaluation. Int. J. Environ. Res. Public Health 2022, 19, 7292. [Google Scholar] [CrossRef]
- Mansi, S.A.; Pigliautile, I.; Arnesano, M.; Pisello, A.L. A novel methodology for human thermal comfort decoding via physiological signals measurement and analysis. Build. Environ. 2022, 222, 109385. [Google Scholar] [CrossRef]
- Dong, B.; Prakash, V.; Feng, F.; O’Neill, Z. A review of smart building sensing system for better indoor environment control. Energy Build. 2019, 199, 29–46. [Google Scholar] [CrossRef]
- Yan, D.; Hong, T.; Dong, B.; Mahdavi, A.; D’Oca, S.; Gaetani, I.; Feng, X. IEA EBC Annex 66: Definition and simulation of occupant behavior in buildings. Energy Build. 2017, 156, 258–270. [Google Scholar] [CrossRef] [Green Version]
- Huang, K.; Sun, W.; Feng, G.; Wang, J.; Song, J. Indoor air quality analysis of 8 mechanically ventilated residential buildings in northeast China based on long-term monitoring. Sustain. Cities Soc. 2020, 54, 101947. [Google Scholar] [CrossRef]
- Pan, S.; Xiong, Y.; Han, Y.; Zhang, X.; Xia, L.; Wei, S.; Wu, J.; Han, M. A study on influential factors of occupant window-opening behavior in an office building in China. Build. Environ. 2018, 133, 41–50. [Google Scholar] [CrossRef]
- Li, N.; Li, J.; Fan, R.; Jia, H. Probability of occupant operation of windows during transition seasons in office buildings. Renew. Energy 2015, 73, 84–91. [Google Scholar] [CrossRef]
- Dong, B.; Liu, Y.; Mu, W.; Jiang, Z.; Pandey, P.; Hong, T.; Olesen, B.; Lawrence, T.; O’Neil, Z.; Andrews, C.; et al. A Global Building Occupant Behavior Database. Sci. Data 2022, 9, 369. [Google Scholar] [CrossRef]
- Moshnyaga, V.; Osamu, T.; Ryu, T.; Hashimoto, K. Identification of Basic Behavioral Activities by Heterogeneous Sensors of In-Home Monitoring System; Springer International Publishing: Cham, Switzerland, 2015. [Google Scholar]
- Liu, J.; Dai, X.; Li, X.; Jia, S.; Pei, J.; Sun, Y.; Lai, D.; Shen, X.; Sun, H.; Yin, H.; et al. Indoor air quality and occupants’ ventilation habits in China: Seasonal measurement and long-term monitoring. Build. Environ. 2018, 142, 119–129. [Google Scholar] [CrossRef]
- Pan, S.; Mirshekari, M.; Fagert, J.; Ruiz, C.; Noh, H.Y.; Zhang, P. Area Occupancy Counting Through Sparse Structural Vibration Sensing. IEEE Pervasive Comput. 2019, 18, 28–37. [Google Scholar] [CrossRef]
- Mirshekari, M.; Fagert, J.; Pan, S.; Zhang, P.; Noh, H.Y. Step-Level Occupant Detection across Different Structures through Footstep-Induced Floor Vibration Using Model Transfer. J. Eng. Mech. 2020, 146, 04019137. [Google Scholar] [CrossRef]
- Drira, S.; Pai, S.G.; Reuland, Y.; Olsen, N.F.; Smith, I.F. Using footstep-induced vibrations for occupant detection and recognition in buildings. Adv. Eng. Inform. 2021, 49, 101289. [Google Scholar] [CrossRef]
- Lam, M.; Mirshekari, M.; Pan, S.; Zhang, P.; Noh, H.Y. Robust Occupant Detection Through Step-Induced Floor Vibration by Incorporating Structural Characteristics; Springer International Publishing: Cham, Switzerland, 2016. [Google Scholar]
- Mirshekari, M.; Pan, S.; Fagert, J.; Schooler, E.M.; Zhang, P.; Noh, H.Y. Occupant localization using footstep-induced structural vibration. Mech. Syst. Signal Process. 2018, 112, 77–97. [Google Scholar] [CrossRef]
- Drira, S.; Reuland, Y.; Pai, S.G.S.; Noh, H.Y.; Smith, I.F.C. Model-Based Occupant Tracking Using Slab-Vibration Measurements. Front. Built Environ. 2019, 5, 63. [Google Scholar] [CrossRef] [Green Version]
- Drira, S.; Smith, I.F. A framework for occupancy detection and tracking using floor-vibration signals. Mech. Syst. Signal Process. 2022, 168, 108472. [Google Scholar] [CrossRef]
- Zhang, Y.; Pan, S.; Fagert, J.; Mirshekari, M.; Noh, H.Y.; Zhang, P.; Zhang, L. Occupant Activity Level Estimation Using Floor Vibration. In Proceedings of the 2018 ACM International Joint Conference and 2018 International Symposium on Pervasive and Ubiquitous Computing and Wearable Computers, Singapore, 8–12 October 2018; Association for Computing Machinery: Singapore, 2018; pp. 1355–1363. [Google Scholar]
- Uddin, M.; Wei, H.-H.; Chi, H.; Ni, M. Influence of Occupant Behavior for Building Energy Conservation: A Systematic Review Study of Diverse Modeling and Simulation Approach. Buildings 2021, 11, 41. [Google Scholar] [CrossRef]
- Zhou, X.; Liu, T.; Yan, D.; Shi, X.; Jin, X. An action-based Markov chain modeling approach for predicting the window operating behavior in office spaces. Build. Simul. 2021, 14, 301–315. [Google Scholar] [CrossRef]
- Niu, B.; Li, D.; Yu, H.; Mahyuddin, N.; Liu, Y.; Wu, J.; Wang, X.; Pan, S. Investigation of occupant window opening behaviour during the summer period in a Beijing maternity hospital. J. Build. Eng. 2022, 45, 103441. [Google Scholar] [CrossRef]
- Liu, Y.; Chong, W.T.; Cao, Y.; Liu, H.; Yu, H.; Cui, T.; Chang, L.; Pan, S. Characteristics analysis and modeling of occupants’ window operation behavior in hot summer and cold winter region, China. Build. Environ. 2022, 216, 108998. [Google Scholar] [CrossRef]
- Um, C.Y.; Zhang, N.; Kang, K.; Na, H.; Choi, H.; Kim, T. Occupant behavior and indoor particulate concentrations in daycare centers. Sci. Total. Environ. 2022, 824, 153206. [Google Scholar] [CrossRef]
- Li, Y.-C.; Tseng, W.-C.; Hsieh, N.-H.; Chen, S.-C. Assessing the seasonality of occupancy number-associated CO2 level in a Taiwan hospital. Environ. Sci. Pollut. Res. 2019, 26, 16422–16432. [Google Scholar] [CrossRef] [PubMed]
- Dedesko, S.; Stephens, B.; Gilbert, J.A.; Siegel, J.A. Methods to assess human occupancy and occupant activity in hospital patient rooms. Build. Environ. 2015, 90, 136–145. [Google Scholar] [CrossRef]
- Wolf, S.; Calì, D.; Krogstie, J.; Madsen, H. Carbon dioxide-based occupancy estimation using stochastic differential equations. Appl. Energy 2019, 236, 32–41. [Google Scholar] [CrossRef]
- Cedeno Laurent, J.G.; Samuelson, H.; Chen, Y. The impact of window opening and other occupant behavior on simulated energy performance in residence halls. Build. Simul. 2017, 10, 963–976. [Google Scholar] [CrossRef]
- Jia, M.; Srinivasan, R.S.; Ries, R.; Weyer, N.; Bharathy, G. A systematic development and validation approach to a novel agent-based modeling of occupant behaviors in commercial buildings. Energy Build. 2019, 199, 352–367. [Google Scholar] [CrossRef]
- Kim, J.; Hong, T.; Lee, M.; Jeong, K. Analyzing the real-time indoor environmental quality factors considering the influence of the building occupants’ behaviors and the ventilation. Build. Environ. 2019, 156, 99–109. [Google Scholar] [CrossRef]
- Kim, J.; Min, K.; Jung, M.; Chi, S. Occupant behavior monitoring and emergency event detection in single-person households using deep learning-based sound recognition. Build. Environ. 2020, 181, 107092. [Google Scholar] [CrossRef]
- Zhu, J.; Liu, X.; Shi, Q.; He, T.; Sun, Z.; Guo, X.; Liu, W.; Sulaiman, O.B.; Dong, B.; Lee, C. Development Trends and Perspectives of Future Sensors and MEMS/NEMS. Micromachines 2019, 11, 7. [Google Scholar] [CrossRef] [Green Version]
- Peña-García, N.N.; Aguilera-Cortés, L.A.; González-Palacios, M.A.; Raskin, J.-P.; Herrera-May, A.L. Design and Modeling of a MEMS Dual-Backplate Capacitive Microphone with Spring-Supported Diaphragm for Mobile Device Applications. Sensors 2018, 18, 3545. [Google Scholar] [CrossRef] [Green Version]
- Zhu, Q.; Chen, Z.; Soh, Y.C. Using unlabeled acoustic data with locality-constrained linear coding for energy-related activity recognition in buildings. In Proceedings of the 2015 IEEE International Conference on Automation Science and Engineering (CASE), Gothenburg, Sweden, 24–28 August 2015. [Google Scholar]
- Nagy, Z.; Yong, F.Y.; Schlueter, A. Occupant centered lighting control: A user study on balancing comfort, acceptance, and energy consumption. Energy Build. 2016, 126, 310–322. [Google Scholar] [CrossRef]
- Nagy, Z.; Yong, F.Y.; Frei, M.; Schlueter, A. Occupant centered lighting control for comfort and energy efficient building operation. Energy Build. 2015, 94, 100–108. [Google Scholar] [CrossRef]
- Xiong, J.; Tzempelikos, A.; Bilionis, I.; Awalgaonkar, N.M.; Lee, S.; Konstantzos, I.; Sadeghi, S.A.; Karava, P. Inferring personalized visual satisfaction profiles in daylit offices from comparative preferences using a Bayesian approach. Build. Environ. 2018, 138, 74–88. [Google Scholar] [CrossRef]
- Park, J.Y.; Dougherty, T.; Fritz, H.; Nagy, Z. LightLearn: An adaptive and occupant centered controller for lighting based on reinforcement learning. Build. Environ. 2019, 147, 397–414. [Google Scholar] [CrossRef]
- Adams, J.; Bélafi, Z.; Horváth, M.; Kocsis, J.; Csoknyai, T. How Smart Meter Data Analysis Can Support Understanding the Impact of Occupant Behavior on Building Energy Performance: A Comprehensive Review. Energies 2021, 14, 2502. [Google Scholar] [CrossRef]
- Sun, Q.; Li, H.; Ma, Z.; Wang, C.; Campillo, J.; Zhang, Q.; Wallin, F.; Guo, J. A Comprehensive Review of Smart Energy Meters in Intelligent Energy Networks. IEEE Internet Things J. 2016, 3, 464–479. [Google Scholar] [CrossRef]
- Raman, S.H.; Hanafiah, M.A.M.; Ab Ghani, M.R.; Jusoh, W.W. A human machine interface (HMI) framework for Smart Grid system. In Proceedings of the 2014 IEEE Innovative Smart Grid Technologies—Asia (ISGT ASIA), Kuala Lumpur, Malaysia, 20–23 May 2014. [Google Scholar]
- Nilsson, A.; Wester, M.; Lazarevic, D.; Brandt, N. Smart homes, home energy management systems and real-time feedback: Lessons for influencing household energy consumption from a Swedish field study. Energy Build. 2018, 179, 15–25. [Google Scholar] [CrossRef]
- Zhang, X.; Shen, J.; Yang, T.; Tang, L.; Wang, L.; Liu, Y.; Xu, P. Smart meter and in-home display for energy savings in residential buildings: A pilot investigation in Shanghai, China. Intell. Build. Int. 2019, 11, 4–26. [Google Scholar] [CrossRef]
- Chen, Z.; Jiang, C.; Xie, L. Building occupancy estimation and detection: A review. Energy Build. 2018, 169, 260–270. [Google Scholar] [CrossRef]
- Vafeiadis, T.; Zikos, S.; Stavropoulos, G.; Ioannidis, D.; Krinidis, S.; Tzovaras, D.; Moustakas, K. Machine Learning Based Occupancy Detection via the Use of Smart Meters. In Proceedings of the 2017 International Symposium on Computer Science and Intelligent Controls (ISCSIC), Budapest, Hungary, 20–22 October 2017. [Google Scholar]
- Najafi, B.; Depalo, M.; Rinaldi, F.; Arghandeh, R. Building characterization through smart meter data analytics: Determination of the most influential temporal and importance-in-prediction based features. Energy Build. 2021, 234, 110671. [Google Scholar] [CrossRef]
- Díaz, J.; Jiménez, M. Experimental assessment of room occupancy patterns in an office building. Comparison of different approaches based on CO2 concentrations and computer power consumption. Appl. Energy 2017, 199, 121–141. [Google Scholar] [CrossRef]
- Jenkins, C.; Young, R.; Tsau, J.; Razavi, H.; Kaplan, J.; Ibeziako, M.O. Effective management of plug loads in commercial buildings with occupant engagement and centralized controls. Energy Build. 2019, 201, 194–201. [Google Scholar] [CrossRef]
- Amayri, M.; Arora, A.; Ploix, S.; Bandhyopadyay, S.; Ngo, Q.-D.; Badarla, V.R. Estimating occupancy in heterogeneous sensor environment. Energy Build. 2016, 129, 46–58. [Google Scholar] [CrossRef]
- Wang, W.; Chen, J.; Hong, T. Occupancy prediction through machine learning and data fusion of environmental sensing and Wi-Fi sensing in buildings. Autom. Constr. 2018, 94, 233–243. [Google Scholar] [CrossRef] [Green Version]
- Wang, W.; Hong, T.; Xu, N.; Xu, X.; Chen, J.; Shan, X. Cross-source sensing data fusion for building occupancy prediction with adaptive lasso feature filtering. Build. Environ. 2019, 162, 106280. [Google Scholar] [CrossRef] [Green Version]
- Tan, S.Y.; Jacoby, M.; Saha, H.; Florita, A.; Henze, G.; Sarkar, S. Multimodal sensor fusion framework for residential building occupancy detection. Energy Build. 2022, 258, 111828. [Google Scholar] [CrossRef]
- Azizi, S.; Rabiee, R.; Nair, G.; Olofsson, T. Effects of Positioning of Multi-Sensor Devices on Occupancy and Indoor Environmental Monitoring in Single-Occupant Offices. Energies 2021, 14, 6296. [Google Scholar] [CrossRef]
- Varlamis, I.; Sardianos, C.; Chronis, C.; Dimitrakopoulos, G.; Himeur, Y.; Alsalemi, A.; Bensaali, F.; Amira, A. Smart fusion of sensor data and human feedback for personalized energy-saving recommendations. Appl. Energy 2022, 305, 117775. [Google Scholar] [CrossRef]
- Day, J.K.; McIlvennie, C.; Brackley, C.; Tarantini, M.; Piselli, C.; Hahn, J.; O’Brien, W.; Rajus, V.S.; De Simone, M.; Kjærgaard, M.B.; et al. A review of select human-building interfaces and their relationship to human behavior, energy use and occupant comfort. Build. Environ. 2020, 178, 106920. [Google Scholar] [CrossRef]
- Deng, Z.; Chen, Q. Simulating the impact of occupant behavior on energy use of HVAC systems by implementing a behavioral artificial neural network model. Energy Build. 2019, 198, 216–227. [Google Scholar] [CrossRef]
- Song, G.; Ai, Z.; Zhang, G.; Peng, Y.; Wang, W.; Yan, Y. Using machine learning algorithms to multidimensional analysis of subjective thermal comfort in a library. Build. Environ. 2022, 212, 108790. [Google Scholar] [CrossRef]
- Chen, C.-F.; Xu, X.; Arpan, L. Between the technology acceptance model and sustainable energy technology acceptance model: Investigating smart meter acceptance in the United States. Energy Res. Soc. Sci. 2017, 25, 93–104. [Google Scholar] [CrossRef]
- Singh, S.; Yassine, A. Mining Energy Consumption Behavior Patterns for Households in Smart Grid. IEEE Trans. Emerg. Top. Comput. 2019, 7, 404–419. [Google Scholar] [CrossRef]
- Barhamgi, M.; Perera, C.; Ghedira, C.; Benslimane, D. User-centric Privacy Engineering for the Internet of Things. IEEE Cloud Comput. 2018, 5, 47–57. [Google Scholar] [CrossRef] [Green Version]


| No. | Type | Year | Research Object | Sensing Device | Data Processing Method |
|---|---|---|---|---|---|
| [28] | Active | 2017 | People counting | beam-break sensor | thresholding algorithm |
| [29] | Passive | 2016 | Occupancy presence | PIR sensor | Hidden Markov models |
| [30] | 2021 | Occupancy presence | Infrared Sensor Array | Image processing, multi-Bernoullii filter | |
| [31] | 2021 | Occupancy pattern | PIR sensor | deterministic modelling | |
| [32] | 2018 | Occupant tracking | PIR sensor | accessibility map, A-Star algorithm | |
| [33] | 2022 | Occupant location and activity intensity | PIR sensor | SVM | |
| [34] | 2019 | Occupancy presence | PIR sensor | Find state algorithm | |
| [36] | Thermal camera | 2018 | human skin temperature | Thermal camera | Thermal image processing software |
| [37] | 2021 | Occupancy estimation | Thermal imaging sensor | Blob extraction algorithm, blob filtering algorithm, KNN, SVM, RF | |
| [38] | 2019 | Occupancy estimation | Thermal camera | DNN model | |
| [39] | 2021 | Occupancy counting | Thermal camera | U-Net-like CNN | |
| [40] | 2022 | Occupant thermal comfort | Thermal camera | CNN model |
| No. | Type | Year | Research Object | Sensing Device | Data Processing Method |
|---|---|---|---|---|---|
| [56] | Ultrasonic sensor | 2016 | Occupancy detection, counting | wide-band ultrasonic transmitter, ultrasonic MEMs microphone | Semi-supervised learning model, classification, regression trees; |
| [57] | 2015 | Occupancy detection, counting | Motu Ultra-Light MK3 DAC and ADC, audio amplifier, omnidirectional tweeter, measurement microphone | DBSCAN algorithm, regression model | |
| [58] | 2012 | Occupant location tracking | audio speakers | Signal processing-TDOA technique, pulse compression | |
| [59] | 2019 | Human activity | ultrasonic sensors | Threshold-based classification |
| No. | Type | Year | Research Object | Sensing Device | Data Processing Method |
|---|---|---|---|---|---|
| [82] | Magnetic reed switch | 2020 | Window state | Window sensor | Statistic analysis |
| [83] | 2018 | Occupants’ window behavior | Window sensor | Statistic analysis | |
| [84] | 2015 | Occupants’ window behavior | Window sensor | Monte Carlo simulation | |
| [86] | 2015 | Monitor elderly’s behavior | Door contact | activities assessment algorithm developed by authors | |
| [87] | 2018 | Occupants’ ventilation habits | Window sensor | Statistic analysis | |
| [88] | Vibration sensor | 2018 | Occupancy counting | Geophone SM-2 | Detection algorithm |
| [89] | 2020 | Occupant detection | Geophone SM-2 | Transfer learning | |
| [90] | 2021 | Occupant detection | Vibration sensor | CWT, SVM, CNN, finite element simulation | |
| [91] | 2016 | Occupant detection | Vibration sensor | a two-stage step-induced signal detection algorithm | |
| [92] | 2018 | Occupant localization | Geophone, amplifier | Anomaly detection algorithm, SVM | |
| [93] | 2019 | Occupant Tracking | Vibration sensor | Signal processing, error-domain model-falsification | |
| [94] | 2022 | Occupancy detection and tracking | Vibration sensor | Signal processing, error-domain model-falsification | |
| [95] | 2019 | Occupant activity | Geophone, amplifier, ADC module, Raspberry Pi | Signal processing, noise filtering, vibration detection. |
| No. | Type | Year | Research Object | Sensing Device | Data Processing Method |
|---|---|---|---|---|---|
| [118] | Smart meter | 2018 | Energy consumption | HEMS | Statistic analysis |
| [119] | 2019 | Energy saving | Smart meter, in-home display | Statistical analysis | |
| [121] | 2017 | Occupancy detection | Smart meter | Monte Carlo simulations, RF | |
| [122] | 2021 | Building usage type, operation pattern | Smart meter | Machine learning-RF | |
| [123] | Smart plug | 2017 | Room occupancy pattern | Smart plug, CO2 sensor | Statistic analysis |
| [124] | 2019 | Occupant engagement | Smart plug | Statistic analysis |
| No. | Type | Year | Research Object | Sensing Device | Data Processing Method |
|---|---|---|---|---|---|
| [125] | RGB PIR Magnetic reed contact IAQ Sound illuminance smart plug | 2016 | Occupancy counting | Video-camera, Motion detector, Window contact, Smart plug, Microphone, IAQ monitor | Decision tree algorithm |
| [126,127] | Wi-Fi, CO2, Temperature, humidity sensor, RGB | 2018 2019 | Occupancy prediction | Wi-Fi probe, Web camera, IAQ monitor | ANN, KNN, SVM |
| [128] | Environmental, Audio, image | 2022 | Occupancy detection | IAQ monitor, Video Camera, | Occ-STPN, RF, Few-shot model |
Disclaimer/Publisher’s Note: The statements, opinions and data contained in all publications are solely those of the individual author(s) and contributor(s) and not of MDPI and/or the editor(s). MDPI and/or the editor(s) disclaim responsibility for any injury to people or property resulting from any ideas, methods, instructions or products referred to in the content. |
© 2023 by the authors. Licensee MDPI, Basel, Switzerland. This article is an open access article distributed under the terms and conditions of the Creative Commons Attribution (CC BY) license (https://creativecommons.org/licenses/by/4.0/).
Share and Cite
Ji, W.; Yang, L.; Liu, Z.; Feng, S. A Systematic Review of Sensing Technology in Human-Building Interaction Research. Buildings 2023, 13, 691. https://doi.org/10.3390/buildings13030691
Ji W, Yang L, Liu Z, Feng S. A Systematic Review of Sensing Technology in Human-Building Interaction Research. Buildings. 2023; 13(3):691. https://doi.org/10.3390/buildings13030691
Chicago/Turabian StyleJi, Weiyu, Lu Yang, Zhansheng Liu, and Shuxin Feng. 2023. "A Systematic Review of Sensing Technology in Human-Building Interaction Research" Buildings 13, no. 3: 691. https://doi.org/10.3390/buildings13030691