Article

Dynamic Response and Failure Mechanism of Deep-Buried Tunnel with Small Net Distance under Blasting Load

1
Beijing Key Laboratory of Urban Underground Space Engineering, School of Civil and Resource Engineering, University of Science and Technology Beijing, Beijing 100083, China
2
Faulty of Public Security and Emergency Management, Kunming University of Science and Technology, Kunming 650093, China
*
Author to whom correspondence should be addressed.
Buildings 2023, 13(3), 711; https://doi.org/10.3390/buildings13030711
Submission received: 10 January 2023 / Revised: 21 February 2023 / Accepted: 27 February 2023 / Published: 8 March 2023
(This article belongs to the Section Building Structures)

Abstract

:
Under blasting load, a series of safety problems, such as lining cracking and surrounding rock instability, are prone to occur in deep-buried tunnels with a small net distance. It is significant to understand the dynamic response and failure mechanism of tunnels under blasting. The blasting attenuation formula is optimized through theoretical analysis and field experiments. The measuring point vibration is monitored in real time and the tunnel blasting model is established by ANSYS/LS-DYNA software. The model was set as having no reflective boundary and an uncoupled charge structure was used. The attenuation law of blasting seismic waves is studied from the adjacent tunnel lining and the direction of the tunnel cross-section and length. The inner and outer sides of the tunnel lining are investigated, respectively. The displacement and acceleration of lining measuring point are also analyzed. The dynamic response of the tunnel lining under blasting excavation is analyzed from multiple angles. The results show that the arch foot on the inner side of the lining (the side in contact with the tunnel headroom) is the first to generate vibration. On the outside of the lining (the side in contact with the rock),the peak vibration velocity is reached after blasting load unloading. There is little difference in the vibration velocity at different positions of the transverse section, but great difference in the vibration velocity of the longitudinal section. The influence of the horizontal displacement was greater than that of the vertical displacement. The vibration acceleration of the measuring point at the arch foot of the section is the largest and the detonation is also the largest.

1. Introduction

The depth of a tunnel has a great impact on its stability and safety. Excessive depth will lead to a high-stress field, which may lead to rockburst and large deformation [1]. The rock clamped in the small-distance tunnel is subjected to severe disturbance by excavation on both sides, and is in an unfavorable state of unidirectional or bidirectional force [2]. Especially under the action of blasting load, the instability probability of a deep-buried small-distance tunnel is obviously increased, so it is necessary to explore the dynamic response of deep-buried tunnels with a small net distance under blasting load.
The secondary lining concrete in the tunnel is close to the work face and is susceptible to blasting vibration during construction [3]. A large number of scholars have carried out research on the stress characteristics of the surrounding rock of tunnels with a small net distance. Li et al. [4] monitored the surrounding rock pressure behind the initial support of the section and found that the tunnel excavation changed the maximum principal stress of the surrounding rock at the arches and inverts into tensile stress. Pan et al. [5] explored the influence of tunnel blasting on the secondary lining of an intermediate railway tunnel. Through numerical calculation and comparative analysis, it was revealed that the area where the plastic zone is concentrated and the left and right hances produce large deformation. Wu et al. [6] used shaking table model tests and damage theory to study the change of shear strength and the mechanical cumulative damage model of a fault fracture zone under the blasting vibration cyclic load. In order to explore the classification standard of large compressive deformation of deep-buried tunnels, Zhu et al. [7] found by numerical simulation that compressive stress was the main force on the initial support structure under blasting load, and tensile stress was distributed at the arch bottom and arch foot. The formulas for calculating the surrounding rock stress are also different, and different tunnels focus on different factors. Based on the upper limit method of limit analysis, An et al. [8] derived the formula of surrounding rock pressure in deep tunnels with a small net distance, and analyzed the characteristics of surrounding rock pressure by using the control variable theory. Wang et al. [9] use a power function to express the relationship between the main vibration frequency and the distance from the blasting source. Wu et al. [10], aiming at the surrounding rock pressure problem of an asymmetric three-hole tunnel, comprehensively considered such factors as rock thickness, compressive strength and internal friction angle on the basis of the general theory. The calculation method of the surrounding rock pressure in an asymmetric three span tunnel with a small net distance was obtained.
Numerical simulation is an effective way to analyze tunnel dynamic response. Zhu [11] established a three-dimensional finite element model of blasting vibration to explore the dynamic response law of rock piles tunnel under blasting load. The comparison between the simulated velocity and the measured velocity at the tunnel inlet shows that the finite element software can accurately predict the dynamic response at different positions of the tunnel. Hao [12] aimed to explore the dynamic response and velocity variation rule of tunnels under blasting load under different net distances and advance distances. Based on the finite element software LS-DYNA, the model was established and the engineering example was combined to analyze the dynamic response of the tunnel to the stress and vibration velocity. Ma et al. [13] established a 4D-LSM numerical calculation model in order to study the failure mechanism of tunnels under the action of close-range explosions. The dynamic response and failure characteristics of the tunnel under different blast pressures and distances were analyzed. The vibration velocity is an important index to measure the dynamic response of a tunnel, and the propagation law of vibration velocity also reflects the failure mechanism of a tunnel under blasting. In order to explore the blasting vibration response characteristics of the advance tunnel with a small net distance and large cross-section, Ma et al. [14] monitored and analyzed the distribution law of blasting vibration velocity in the longitudinal and cross-sectional sections of the advance tunnel. It was found that the radial vibration velocity of the side wall of the tunnel was the largest, and the vibration velocity of the side facing the explosion was obviously higher than that of the side facing the explosion. There are also laws that reflect the characteristics of the dynamic response: under the action of multi-frequency blasting, the acoustic velocity of the surrounding rock fluctuates from the inside of the middle rock to the tunnel contour [15], the blasting vibration speed in the middle of the floor attenuates the fastest and the damage range of surrounding rock is the largest [16], and the blasting vibration has great influence on the horizontal direction of the tunnel [17].
To sum up, the dynamic response of a tunnel to blasting load is special and different. The current domestic and foreign studies on deep-buried small-distance tunnels mainly focus on the stress characteristics of the surrounding rock and the propagation law of different tunnel sections. Therefore, against the background of the blasting excavation of three-way separation tunnel, the theory of data analysis is firstly expounded. Then the field blasting experiment is used to explore the law of seismic wave propagation in the tunnel. At the same time, the dynamic response of the tunnel is further explored with the help of numerical simulation software. This paper mainly explores the dynamic response inside and outside the lining and the transverse and longitudinal vibration velocity propagation law of the tunnel. It also analyzes the horizontal and vertical displacement and acceleration changes of the tunnel lining. Finally, the dynamic response and damage mechanism of a deep-buried tunnel with a small net distance under blasting load are obtained.

2. Methodology

In the experimental data processing, the linear regression and nonlinear regression are used to compare and analyze the Sadowski formula.
At present, the Sadowski empirical formula is widely recognized at home and abroad for the prediction of blasting vibration speed, and the Sadowski formula has been incorporated into China’s Blasting Safety Regulations (GB6722-2014). The Sadowski empirical formula:
V = K ( Q 1 / 3 R )            
V is peak velocity of blasting vibration; Q is blasting charge; R is blasting distance; K is the coefficient related to medium and blasting conditions; is blasting vibration attenuation index.
(1)
Linear regression analysis
Take the log of both sides of this equation:
InV = InK + In ( Q 1 / 3 R )    
Let
ρ = Q 1 / 3 R    
Then
InV = InK + α In ρ  
Let y = In V, x = In ρ , a = α , b = In K, then
y = ax + b  
(2)
Nonlinear regression analysis [18]
Let Q 1 / 3 / R = q , then V = Kq α
The sum of squares of nonlinear residuals is
M 2 = i n ( V i Kq i α ) 2
M 2 gets the minimum value, and the necessary condition of the function above is
M 2 K = 0 , M 2 α = 0
Thus
i = 1 n ( V i Kq i α ) q i α = 0 , i = 1 n ( V i Kq i α ) q i α   Inq i
Transposition to
i = 1 n V i q i α = K i = 1 n q i 2 α , i = 1 n V i q i α ln q i = K i = 1 n q i 2 α ln q i          
Then
i = 1 n   V i q i α K i = 1 n q i 2 α = i = 1 n V i q i α ln q i K i = 1 n q i 2 α ln q i = 1        
construct nonlinear equation about α
f ( α ) = ( i = 1 n V i q i α ) ( i = 1 n q i 2 α ln q i ) ( i = 1 n V i q i α ) ( i = 1 n q i 2 α ) = 0  
after solving for α, K can be obtained from Equation (10)
K = i = 1 n V i q i α / i = 1 n q i 2 α      

3. Experiment Study

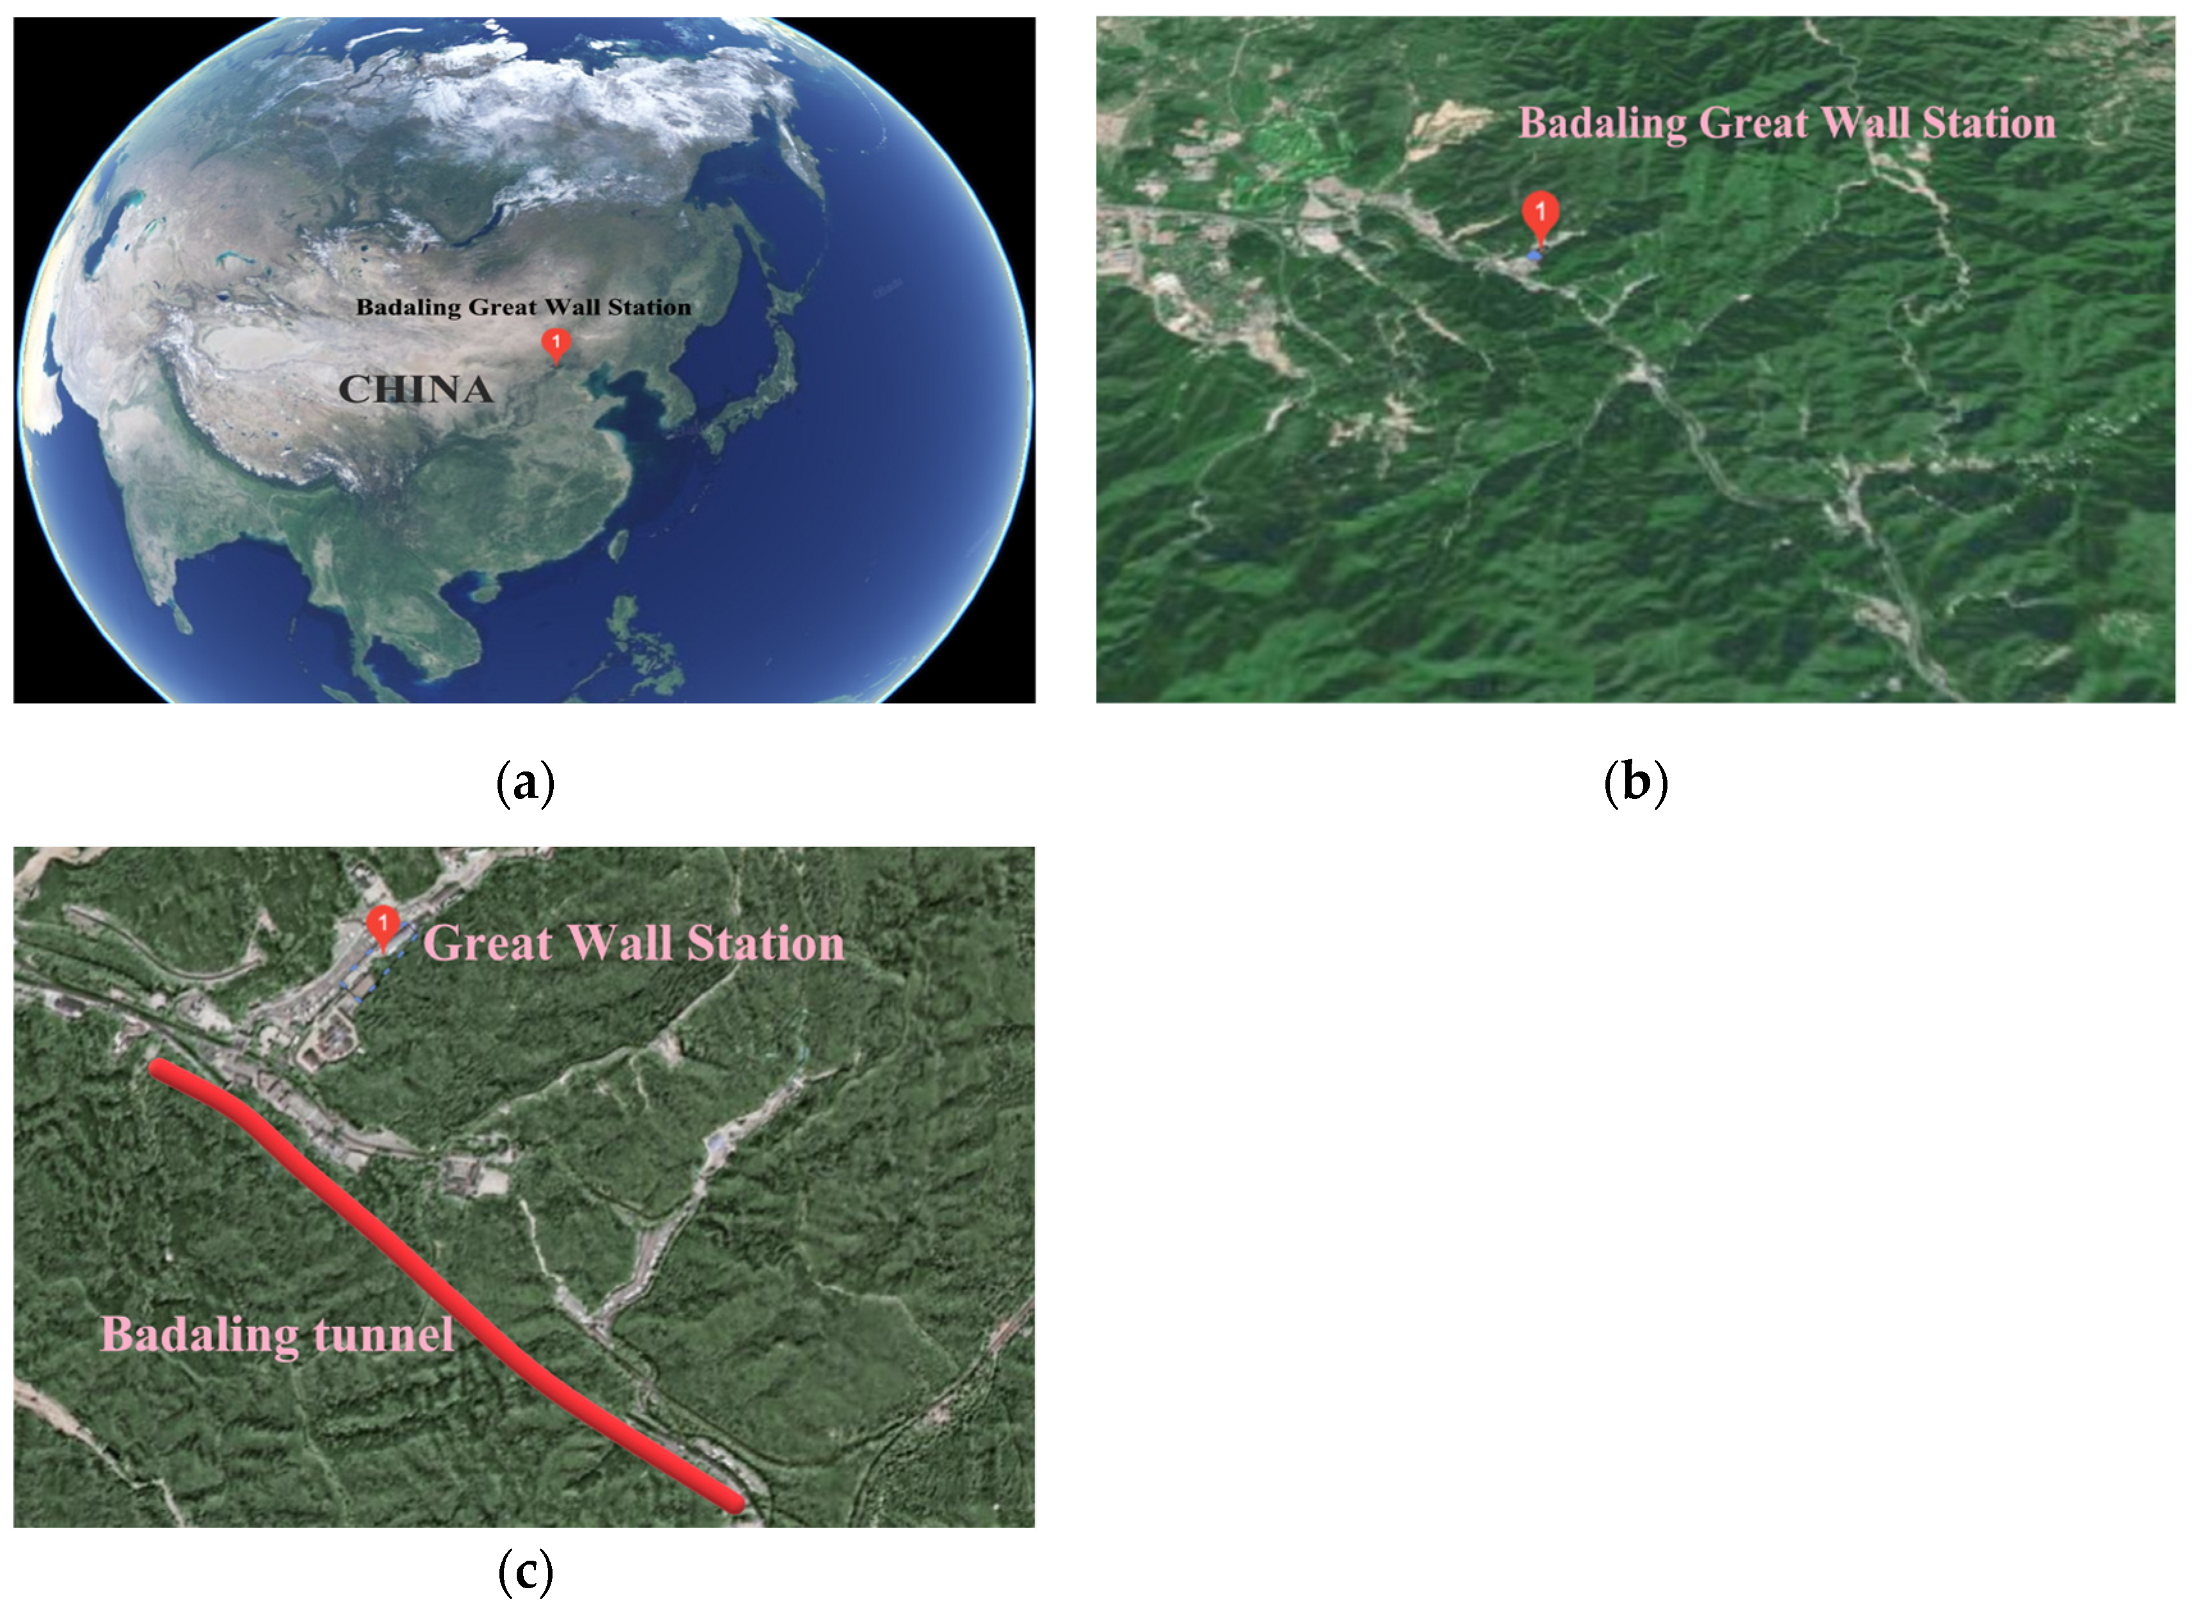
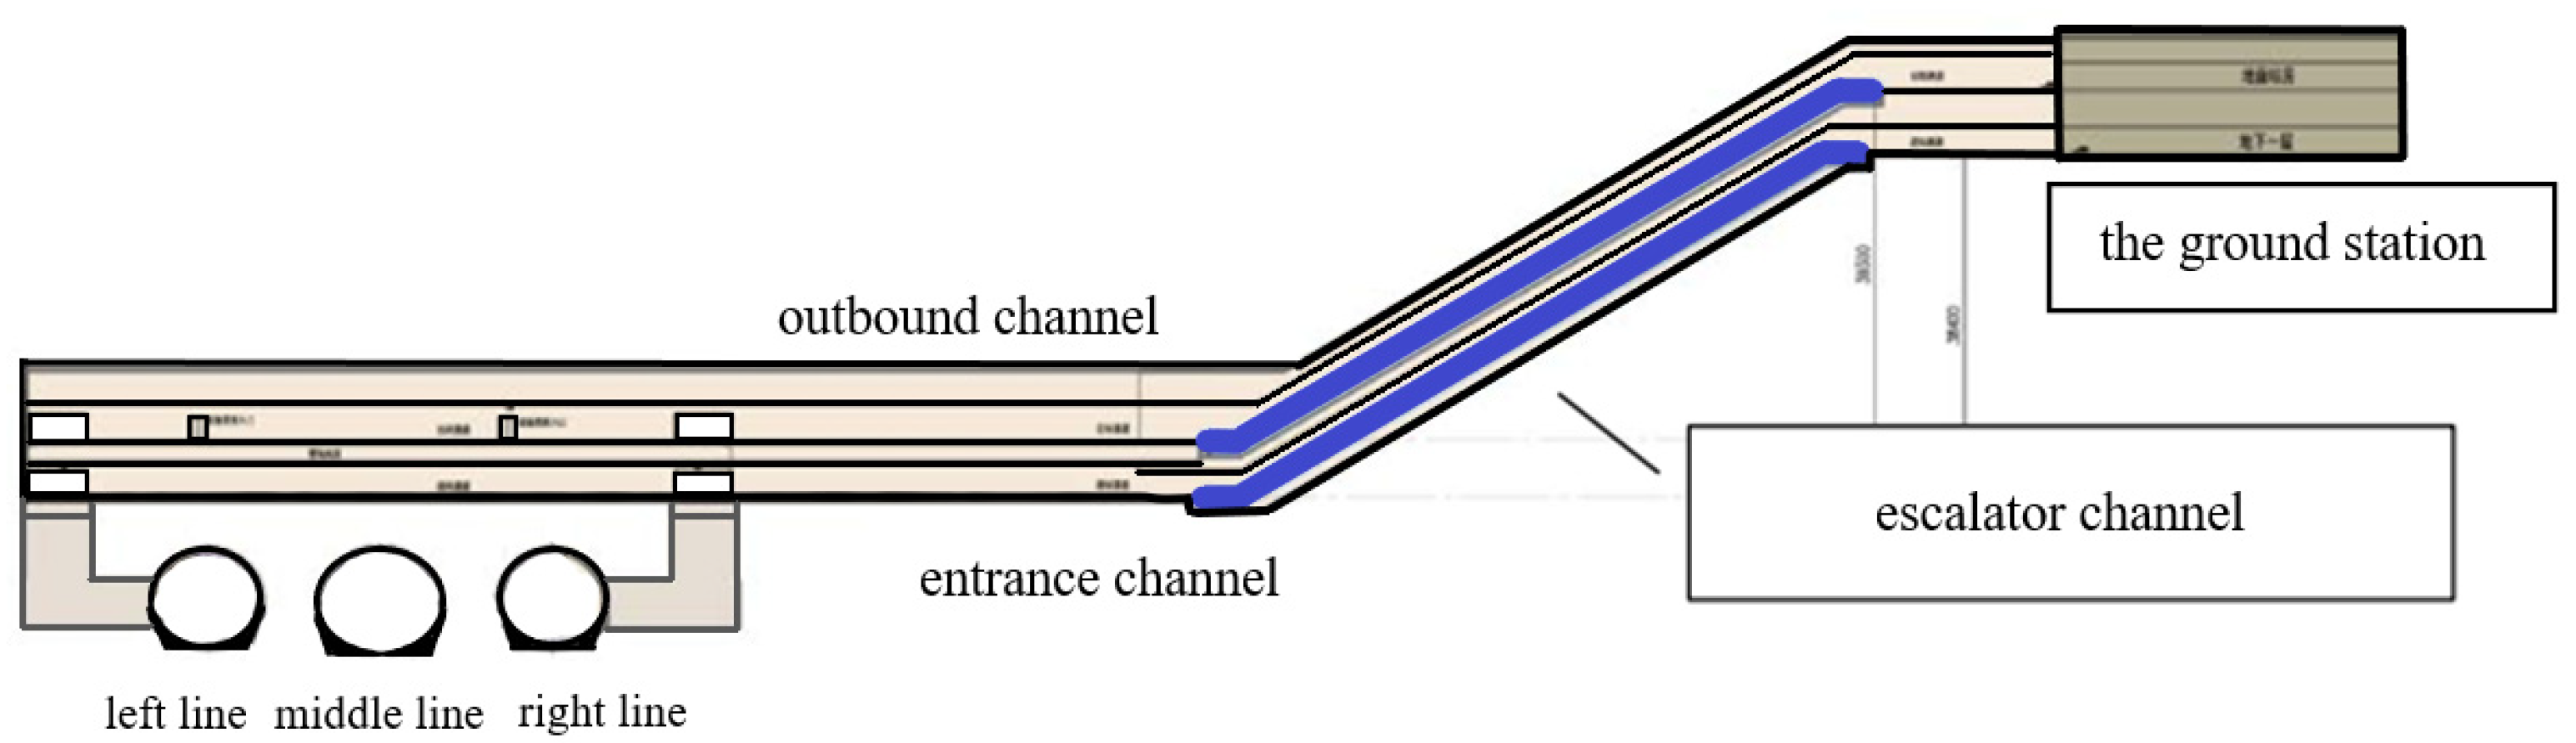
3.1. Project Summary

Badaling Great Wall Station is located in the new Badaling Tunnel. Its location is shown in the Figure 1. The total length of the station is 470 m. The underground construction area of the station is 36,000 square meters and the depth between rail surface and ground is 102 m. With many stations and a large number of variable types of caverns, it is a complex underground cave group of stations in China. The underground structure of the station has three floors, as shown in Figure 2, which are platform floor, inbound channel floor, outbound channel floor and equipment cavern. The levels of surrounding rock are mainly III and Ⅴ. The horizontal spacing of the standard tunnel section is 2.27~6 m. The vertical spacing between the platform layer and the passageway layer is 4.55 m. The clear passage distance of the escalator in and out of the station building is 4.1~3.78 m.
The overall construction plan is to excavate the left line first, followed by the right line and the middle line. This is to select a reasonable tunneling scheme according to the parameters involved [19]. The surrounding rock of grade III is constructed by bench blasting. The upper and lower steps are staggered by 5~8 m, and the second lining is 51~80 m away from the tunnel face. The surrounding rock of Grade V adopts the temporary transverse support method of three steps, the construction interval of the upper, middle and lower steps is 3~5 m, and the second lining is not more than 70 m away from the tunnel face. Emulsified explosives and plastic detonators are selected as blasting equipment. Millisecond differential initiation is used for blasting. The section size and spacing of the three holes are shown in Figure 3.

3.2. Experimental Scheme

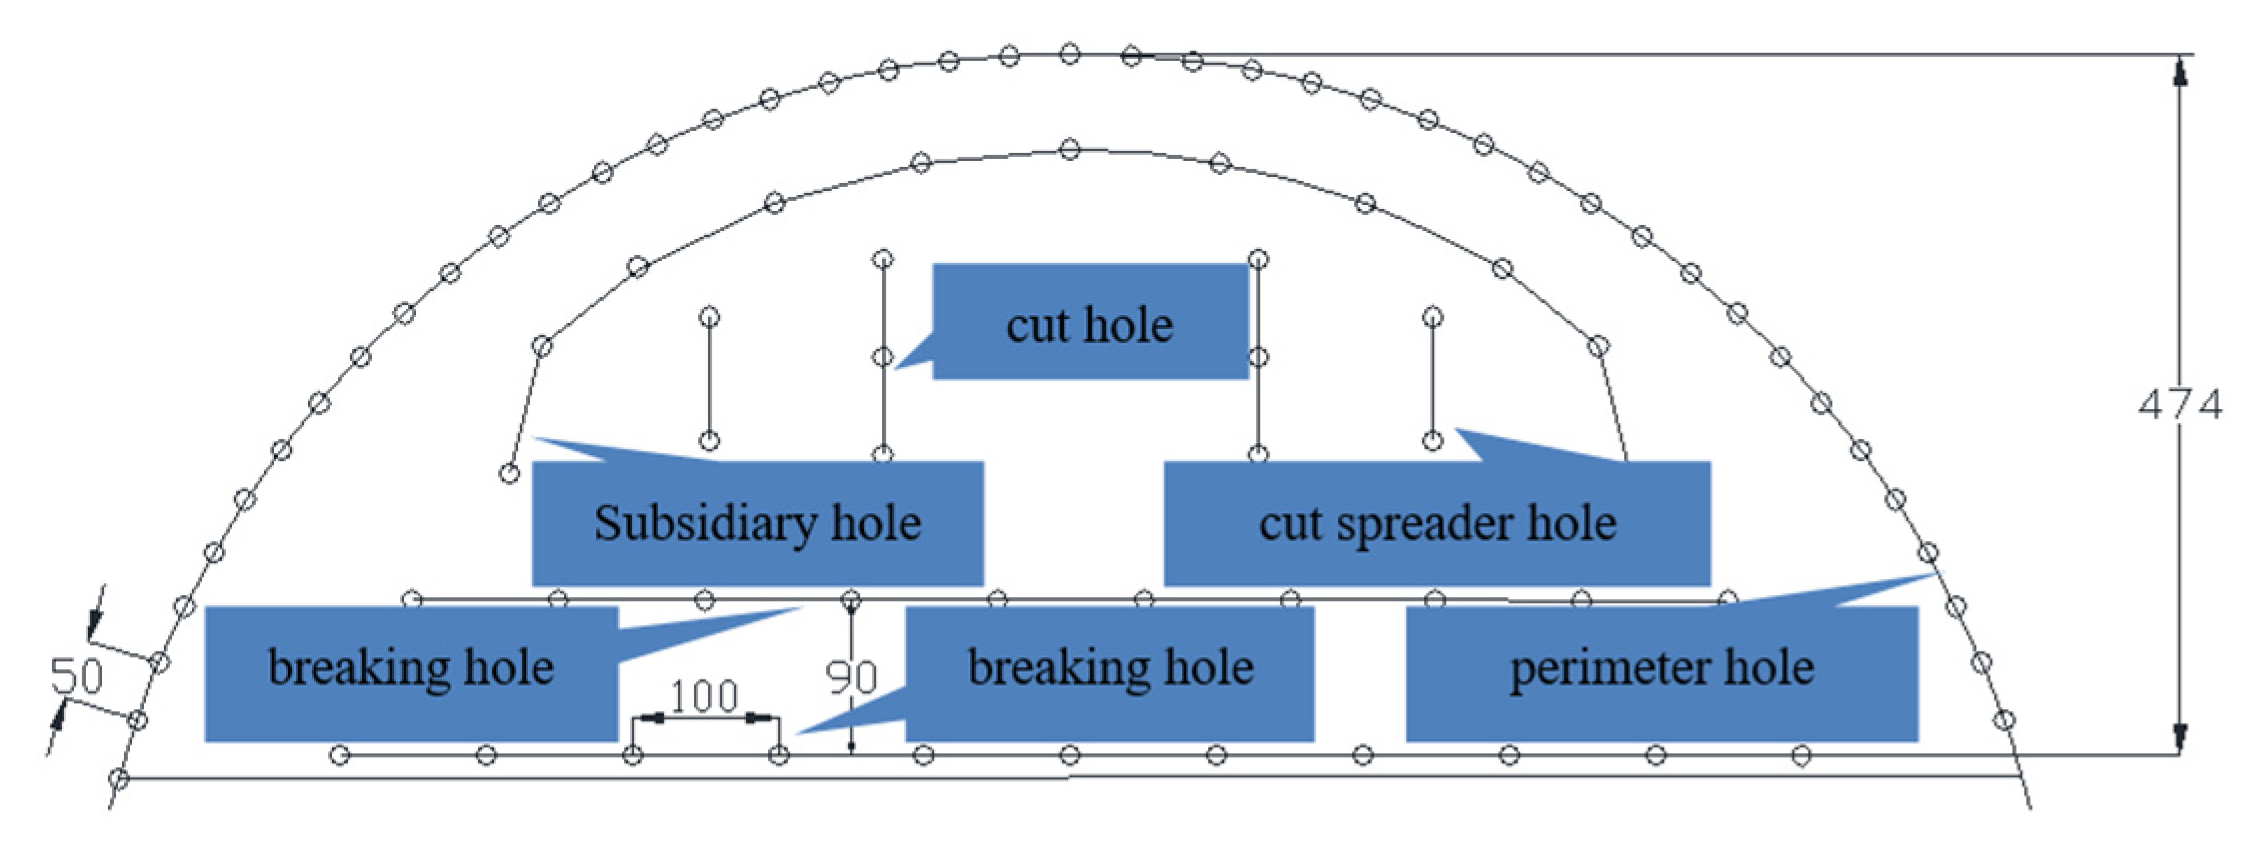
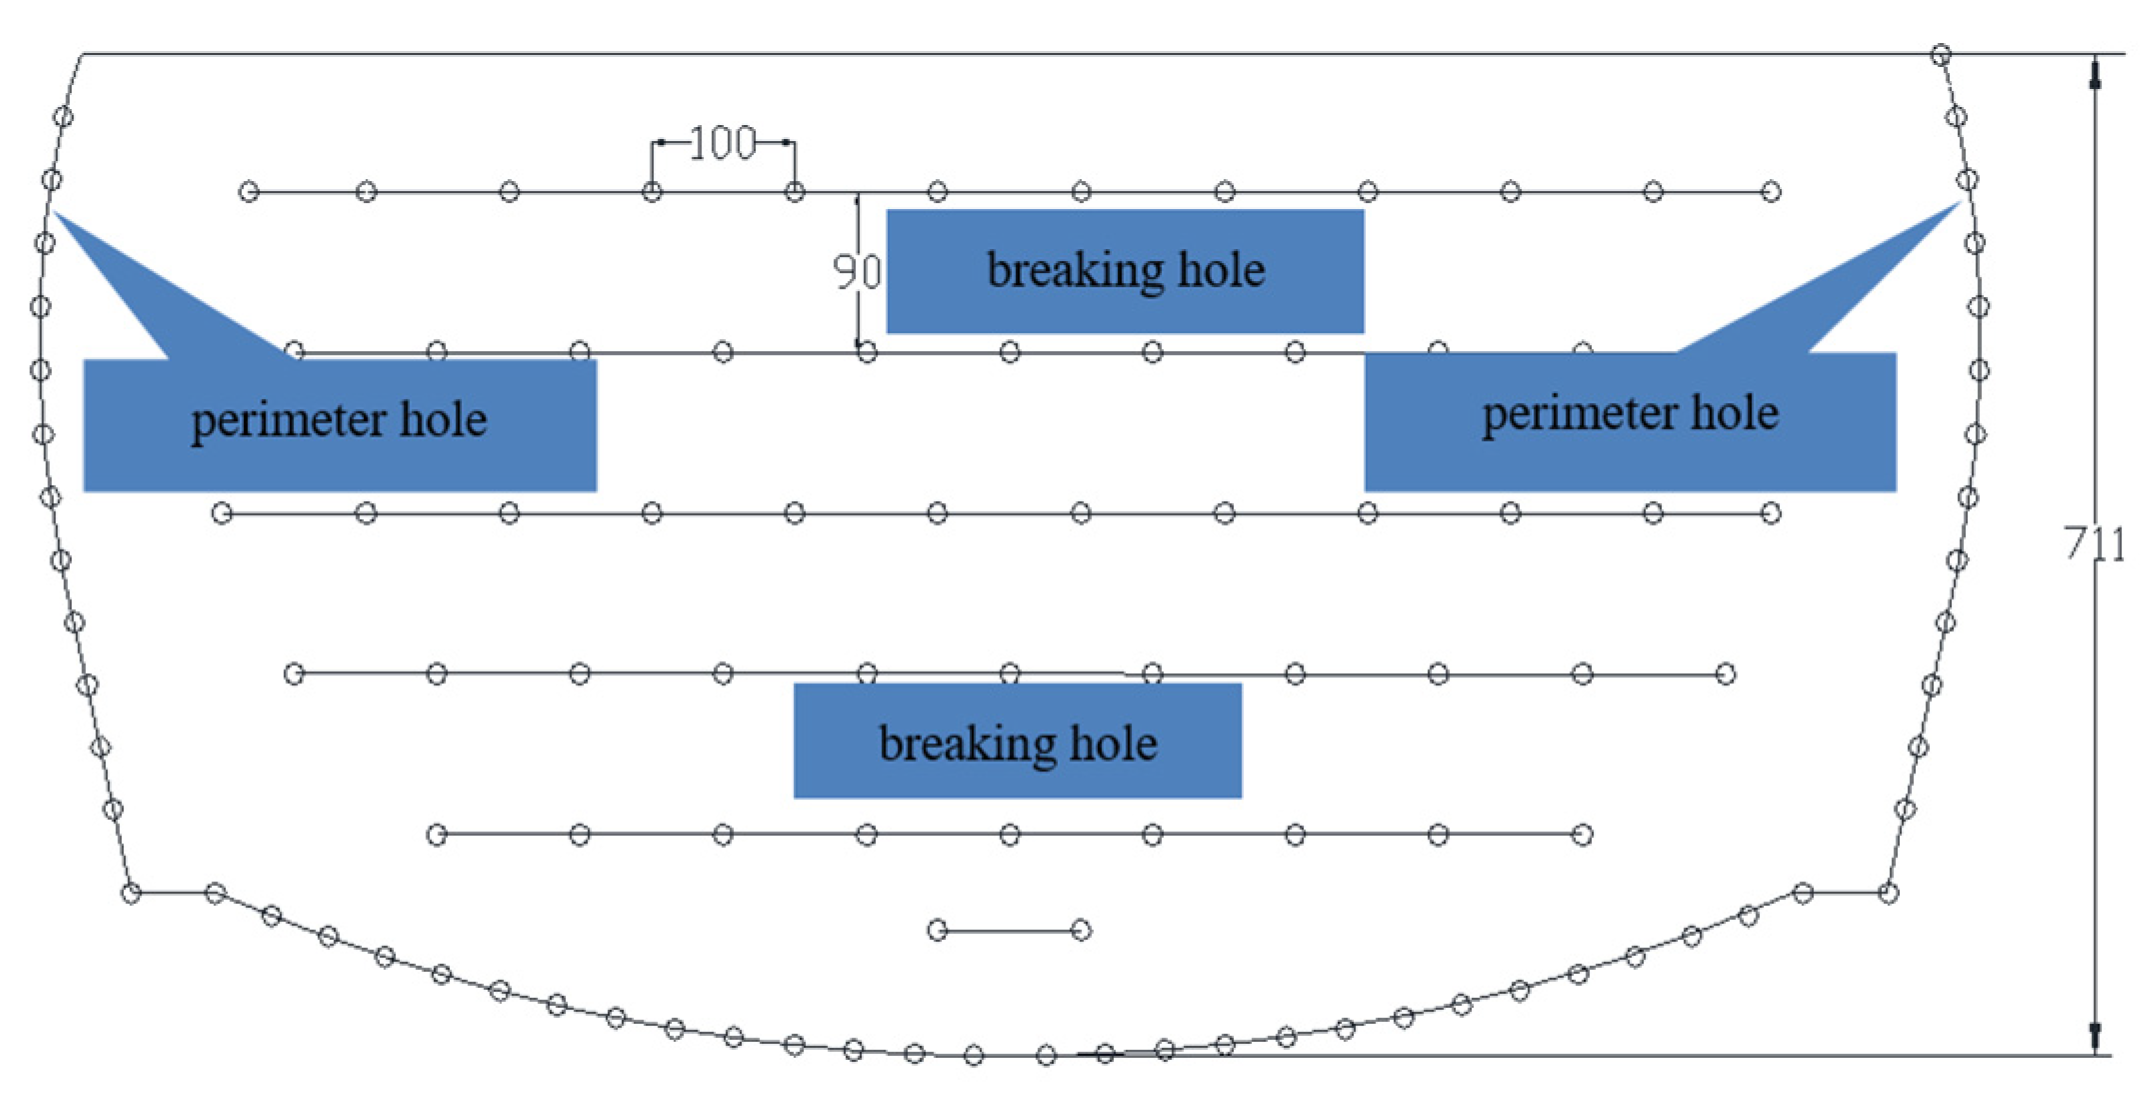
3.2.1. Design of Blasting Parameters for the Standard Section of Three Holes Separation

Bench blasting is adopted for the three-hole separation of the grade III surrounding rock section, the step length is 5~8 m, and the blasting construction is carried out in the order of up and down [20]. The borehole is drilled by hand-held pneumatic drill, the diameter of the borehole is 42 mm, and the blasting explosive is Φ32 mm rock emulsion explosive. In terms of charging structure, layered charging [21] and uncoupled charging are adopted. Taking the third-level surrounding rock of the middle hole in the three-hole separation section as an example, the middle hole in the cut blasting plays the role of the free surface [22], and its hole layout is shown in Figure 4 and Figure 5.

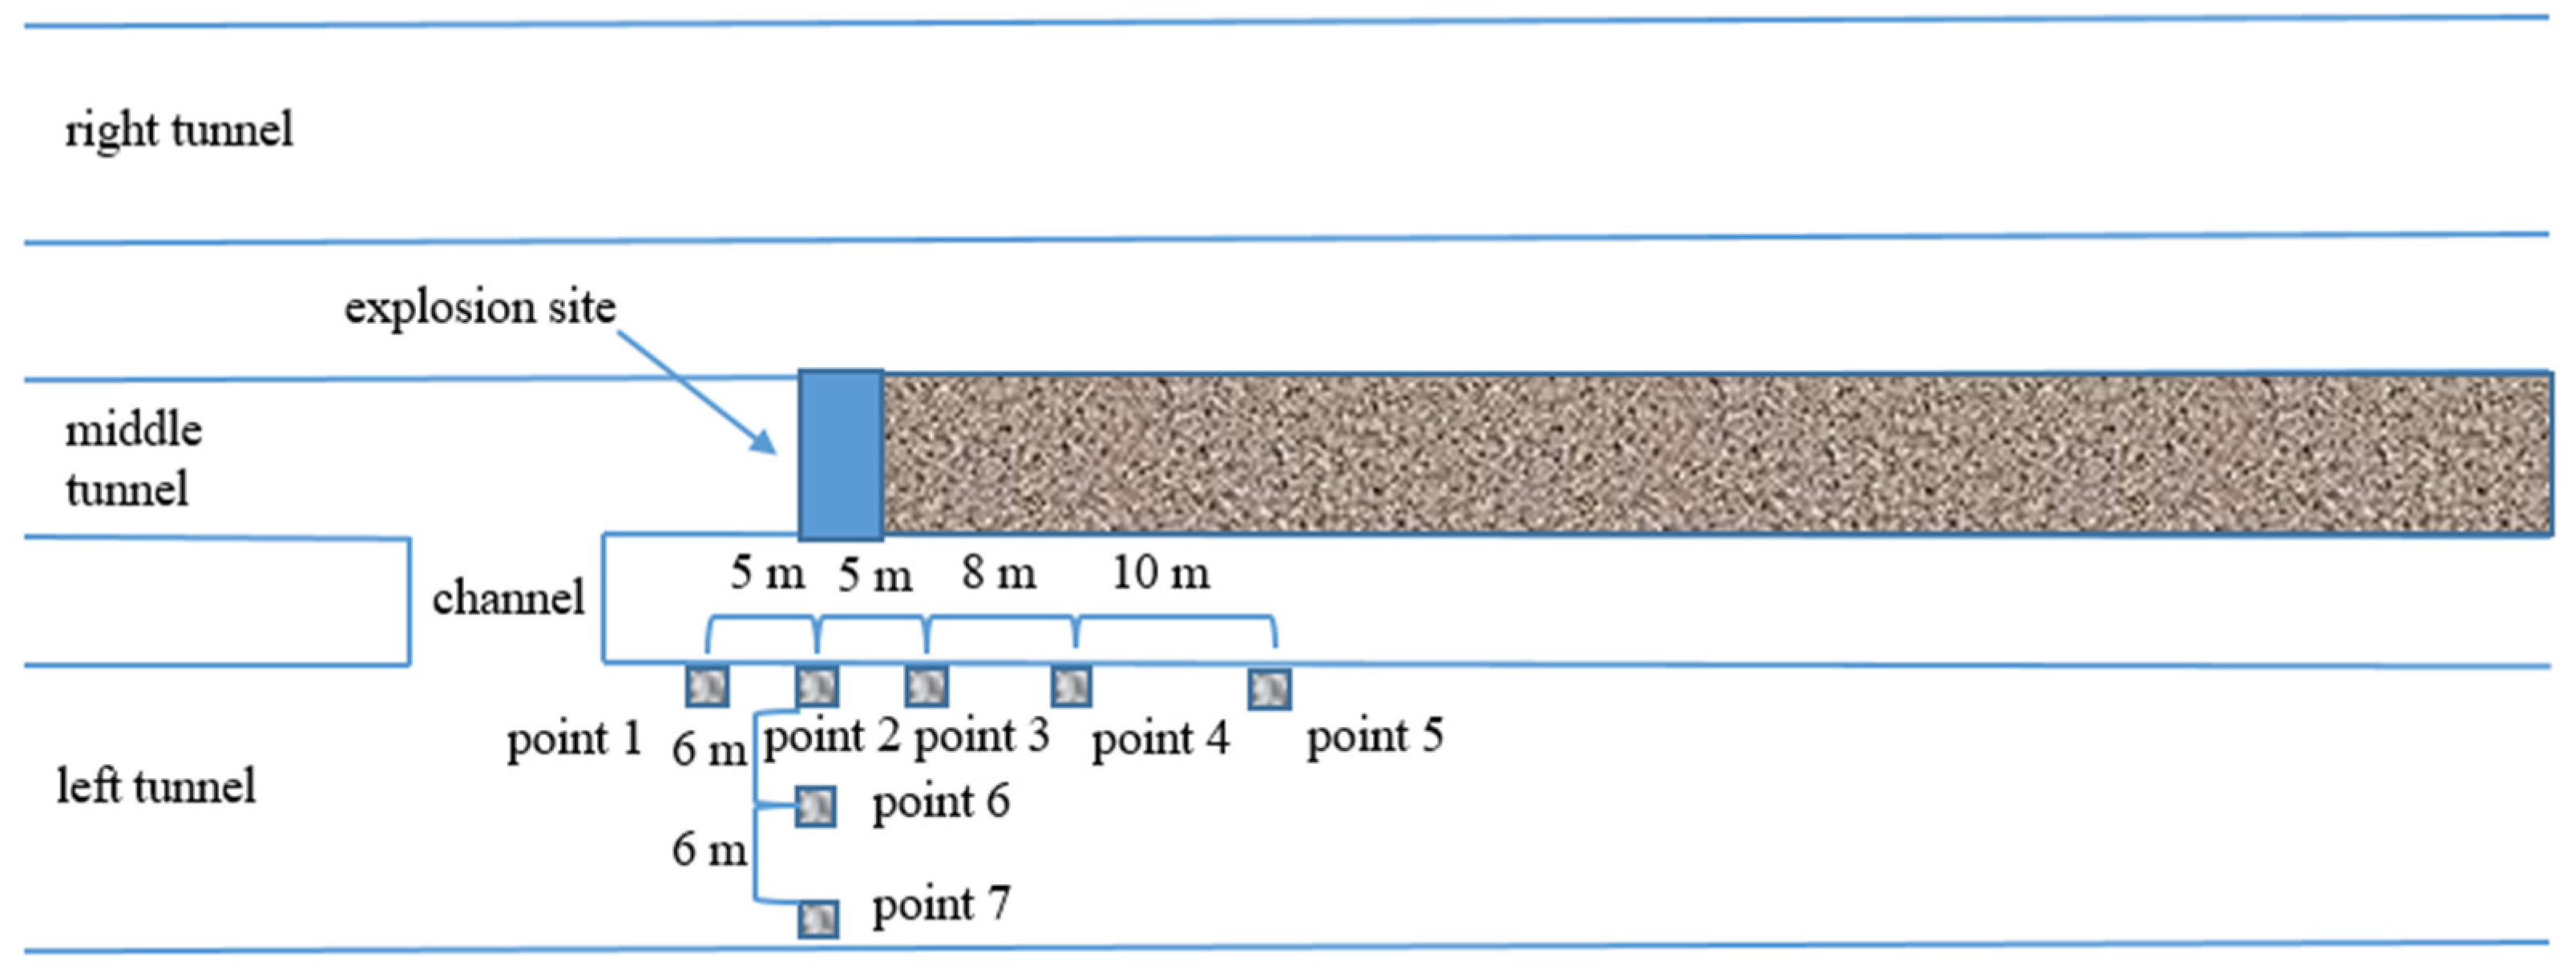
3.2.2. Vibration Monitoring Scheme

A total of seven measuring points are arranged for the vibration test, and their positions are shown in Figure 6. The mileage corresponding to the face of the middle hole is DK68+158, and the thickness of the wall is 6 m. Measuring point 2 is on the same plane as the charging section on the tunnel face. Measuring point 1 is set in the excavated stage of the middle tunnel, 5 m away from measuring point 2. Measuring points 3, 4, and 5 are set in the unexploded area of the middle tunnel. The distances from measuring point 2 are 5 m, 13 m and 23 m. Measuring points 6 and 7 are on the same plane with measuring point 2, but 0.8 m lower than that of measuring point 2. By monitoring the vibration velocity of the measuring point in the same plane and a measuring line, the propagation law of blasting vibrations in different positions is analyzed.

3.3. Monitoring Results and Analysis of Blasting Vibration

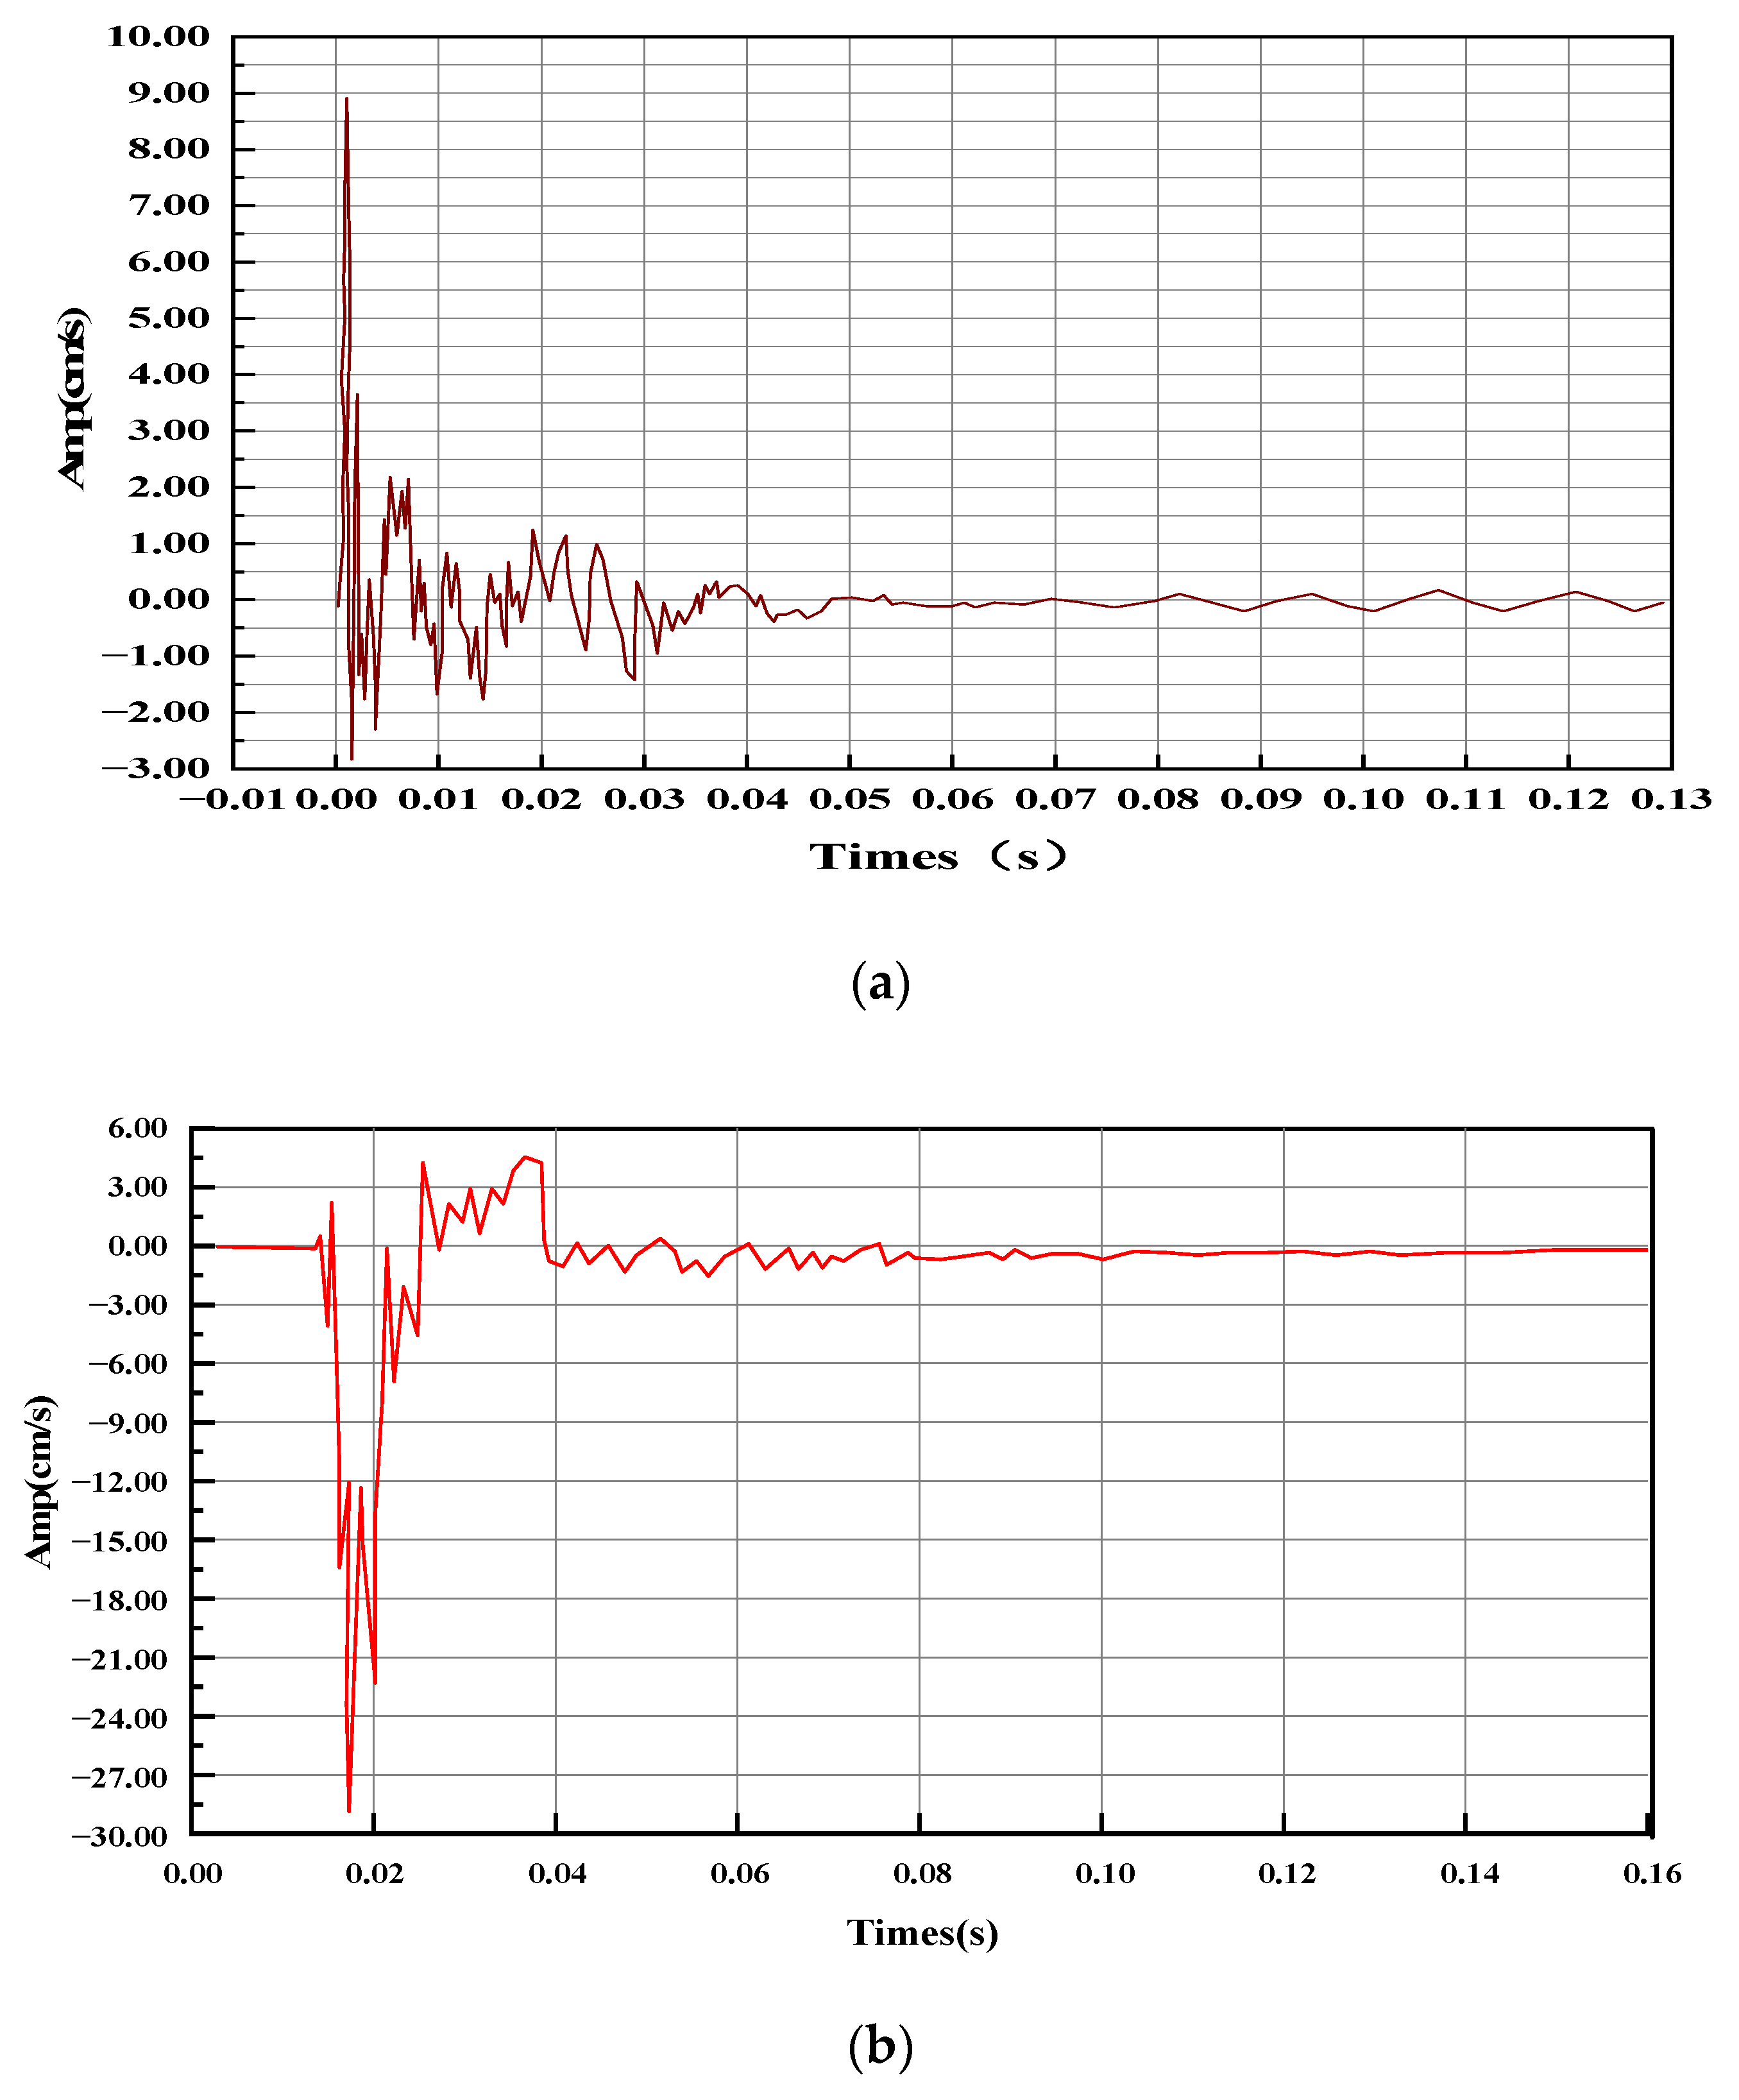
3.3.1. Vibration Monitoring Results

Tunnel blasting vibration signals have chaotic characteristics. As the distance between the blasting operation surface and the detonation center of existing tunnels decreases, the chaotic characteristics of the blasting vibration response are enhanced. Therefore, drilling and blasting parameter optimization and real-time monitoring of blasting vibration should be strengthened to ensure construction quality and blasting safety [23]. In order to study the vibration response of the existing tunnel, the velocity vibration waveform of measuring point 2 was selected for analysis, as shown in Figure 7.
The field measured data of each measurement point are shown in Table 1.
As can be seen from Table 1 and Figure 7, the maximum vibration velocity of tunnel blasting appears in cut blasting, because cut blasting has only one free surface and it is under a lot of pressure. A large part of the explosion energy is directly transformed into a vibration wave and transmitted, so the blasting vibration speed is relatively high. After the cutting surface is formed, the free surface is provided for the subsequent blasting. Therefore, although the total amount of subsequent explosions is large, the vibration generated gradually decreases, and the impact on the existing tunnel is smaller. According to the above analysis, it is necessary to start with the cut hole vibration to solve the problem of excessive vibration velocity. At the same time, the comparison of the three-way vibration waveform shows that the radial peak vibration velocity has the largest fluctuation range, and the tangential vibration velocity has the longest fluctuation time.
Due to the small distance between the two tunnels, the maximum vibration velocity of measuring point 2, which is directly opposite to the middle of the charge position, reaches 27.95 cm/s, but the attenuation speed is also relatively fast. When the horizontal distance from the tunnel face is 13 m, the vibration velocity of measuring point 4 has dropped to 5.22 cm/s. As can be seen from Table 1, the vibration velocity of measuring point 1 is 16.45 cm/s, while that of measuring point 3 is 17.22 cm/s. The former is smaller than the latter, indicating that although the propagation distance of the vibration wave is the same, the rock mass on the excavated side has been disturbed. The surrounding rock is damaged, and the vibration velocity transmitted to the measuring point is reduced.

3.3.2. Analysis of Measured Data

The measured data were analyzed by linear regression according to the least-squares method. The linear correlation between the blasting vibration velocity and the distance to the center of the blast is established, and the corresponding correlation coefficient (R2) is given. The results are shown in Table 2.
The Sadowski formula suitable for the project is obtained from the above regression fitting results, as shown in Table 3.
The results of the nonlinear regression and Sadowski attenuation formula suitable for this project are shown in Table 4 and Table 5.
From the above two analysis results, it can be seen that there is a certain gap between the linear regression results and the nonlinear regression. This is caused by the fact that the sum of squares of the residuals in the linear regression cannot obtain the minimum value [18], so the nonlinear results are taken as the benchmark. The cumulative damage of the tunnel under blasting load increases with the increase in blasting times. However, the damage increments decrease gradually [24]. Both changes show a nonlinear relationship.
The velocity changes in each direction of each measuring point are plotted according to Table 1, as shown in Figure 8.
As can be seen from Figure 8, the variation law of vibration velocity in x direction and resultant velocity is roughly consistent. The velocity in x direction is the highest, followed by the magnitude of the velocity in the y direction and the velocity in the z direction. The distance between measuring point 1 and the explosion source is 5 m; measuring point 3 has the same distance. The vibration velocity in x direction of measuring point 1 is slightly less than that of measuring point 3 due to the damage of the excavated surrounding rock. Measuring point 2 and the explosion source are in the same cross-section, and the distance is the closest, so the vibration velocity is the maximum. Measuring points 3 to 5 are distributed longitudinally along the tunnel, and the vibration velocity decreases with the increase in the distance from the detonation source. Measuring points 6 and 7 are in the same cross-section as measuring point 2. It can be seen from the figure that the vibration velocity is inversely proportional to the detonation source distance.

4. Numerical Simulation of Dynamic Response of Lining

4.1. Parameter Selection

The third section mainly carries on the field test and data analysis according to the general situation of the project. At the same time, the field blasting vibration propagation law is predicted by the traditional blasting vibration attenuation formula. The distribution law of the vibration velocity along different directions is obtained. Also, it is necessary to use numerical simulation software to study the blasting vibration propagation law more accurately. The help of numerical simulation software can be a good complement to the field experiment. The advantages of the numerical simulation method in instantaneous force, material non-linearity, and other complex mathematical problems are incomparable to the traditional experience.
This paper is based on the ANSYS/LS-DYNA finite element program to simulate the dynamic response of existing tunnels to blasting. In the separation section of three holes in this paper, the main tunnel is 11.7 m high and 14.0 m wide, and the tunnels on both sides are 11.1 m high and 12.6 m wide. The net distance of the tunnel is 6 m. Therefore, the selected boundary size of the model is 200 m horizontally, 196 m vertically and 100 m vertically, that is, the model size is 200 m × 196 m × 100 m, as shown in Figure 9. The uncoupled charging structure is adopted. At the same time, the 3D model is set to no reflective boundary, so that the influence of reflection on the solution can be avoided when the wave reaches the interface. Finally, non-reflective boundary conditions are applied to the front, back, left, right, and lower boundaries of the model.
The algorithm adopted in this simulation is the shared node method, and the selected unit is the 3D solid164 element [25].
There is no material model of explosives included in ANSYS pre-processing. The linear elastic material model is used in the modeling of explosives. After the K file is created, the linear elastic material model parameters are changed to *MAT_HIGH_EXPLOSIVE_BURN. The LS-DYNA 3D program describes the pressure–volume relationship of the detonation products of high energy explosives using the JWL equation of state. The unit pressure of the detonation product of high energy explosives can be obtained by the equation of state. The relationship of the JWL equation of state is as follows:
p = A ( 1 ω R 1 V ) e R 1 V + B ( 1 ω R 2 V ) e R 2 V + ω E 0 V
V is relative volume; E 0 is initial internal energy density; A , B , R 1 , R 2 , ω are constants determined by experiment. The constitutive model of surrounding rock is the HJC (Holmquist–Johnson–Cook) material model [26,27]. The model is mainly applied to the simulation of concrete and rock with high strain rate and large deformation. The HJC model is defined by *MAT_JOHNSON_HOLMGUIST_CONCRETE. The parameter selection of III level surrounding rock is shown in Table 6. ρ is density; e is elasticity modulus; ν is Poisson’s ratio; γ is unit weight; c is cohesive force; σ is tensile limit; φ is internal friction angle.
The secondary lining and invert filling were simulated using elastic solid elements. Shell elements were used to simulate the initial shotcrete, and parameters were selected as shown in Table 7.
In terms of the damping of rock mass, Rayleigh damping is the most widely used in dynamic analysis and practical engineering. The linear combination of global mass matrix [M] and global stiffness matrix [K] represent global damping matrix [C].
That is:
[ C ] = α [ M ] + β [ K ]  
In Equation (19), the column coefficient can be determined by the following equation:
α = ζ min ω min β = ζ min ω min  
ω min is the minimum center frequency, which is related to both the natural frequency and the input load frequency of the system under study, and the frequency is 50 Hertz in the calculation; ζ min is the minimum critical damping ratio, which is related to the material properties of rock mass, and the ratio is 0.5% in the calculation.

4.2. Simulated Result

This paper mainly studies the effect of the blasting construction of an excavated tunnel on existing tunnels. The dynamic response rules of blasting excavation at different positions and fault faces on the same section were studied, taking a cross-section in the same plane with the tunnel face, which is called section 0, and four cross-sections behind the tunnel face. These sections have the same longitudinal monitoring points. They are section 5, section 13 and section 23, as shown in Figure 10. Figure 11 shows the measuring point of section 0, and other sections are consistent with it. The comparison between the numerical simulation and measured vibration velocity is shown in Table 8.
As can be seen from Table 8, the vibration velocity monitored on site is slightly smaller than the numerical calculation data, but the two are numerically similar. Yong [28], Li [29], and F. Kirzhneret et al. [30] all analyzed the dynamic response of the tunnel with the help of finite element software. This shows that the model established by ANSYS/LS-DYNA can better reflect the actual tunnel blasting construction process.

4.2.1. Analysis of Tunnel Force under the Influence of Dead Weight

After the completion of excavation, the buried tunnel will be affected by the gravity of its top rock mass, and the tunnel will produce certain displacement and stress concentrations. The numerical simulation of the tunnel under the action of gravity on the upper rock mass is carried out to find out the stress concentration and the most unfavorable position of possible displacement. The cloud picture of the stress and displacement of the three-way tunnel under the influence of dead weight is shown in Figure 12, Figure 13, Figure 14, Figure 15 and Figure 16.
Through the simulation of the tunnel’s dynamic response under the action of dead weight, the conclusions are as follows:
(1)
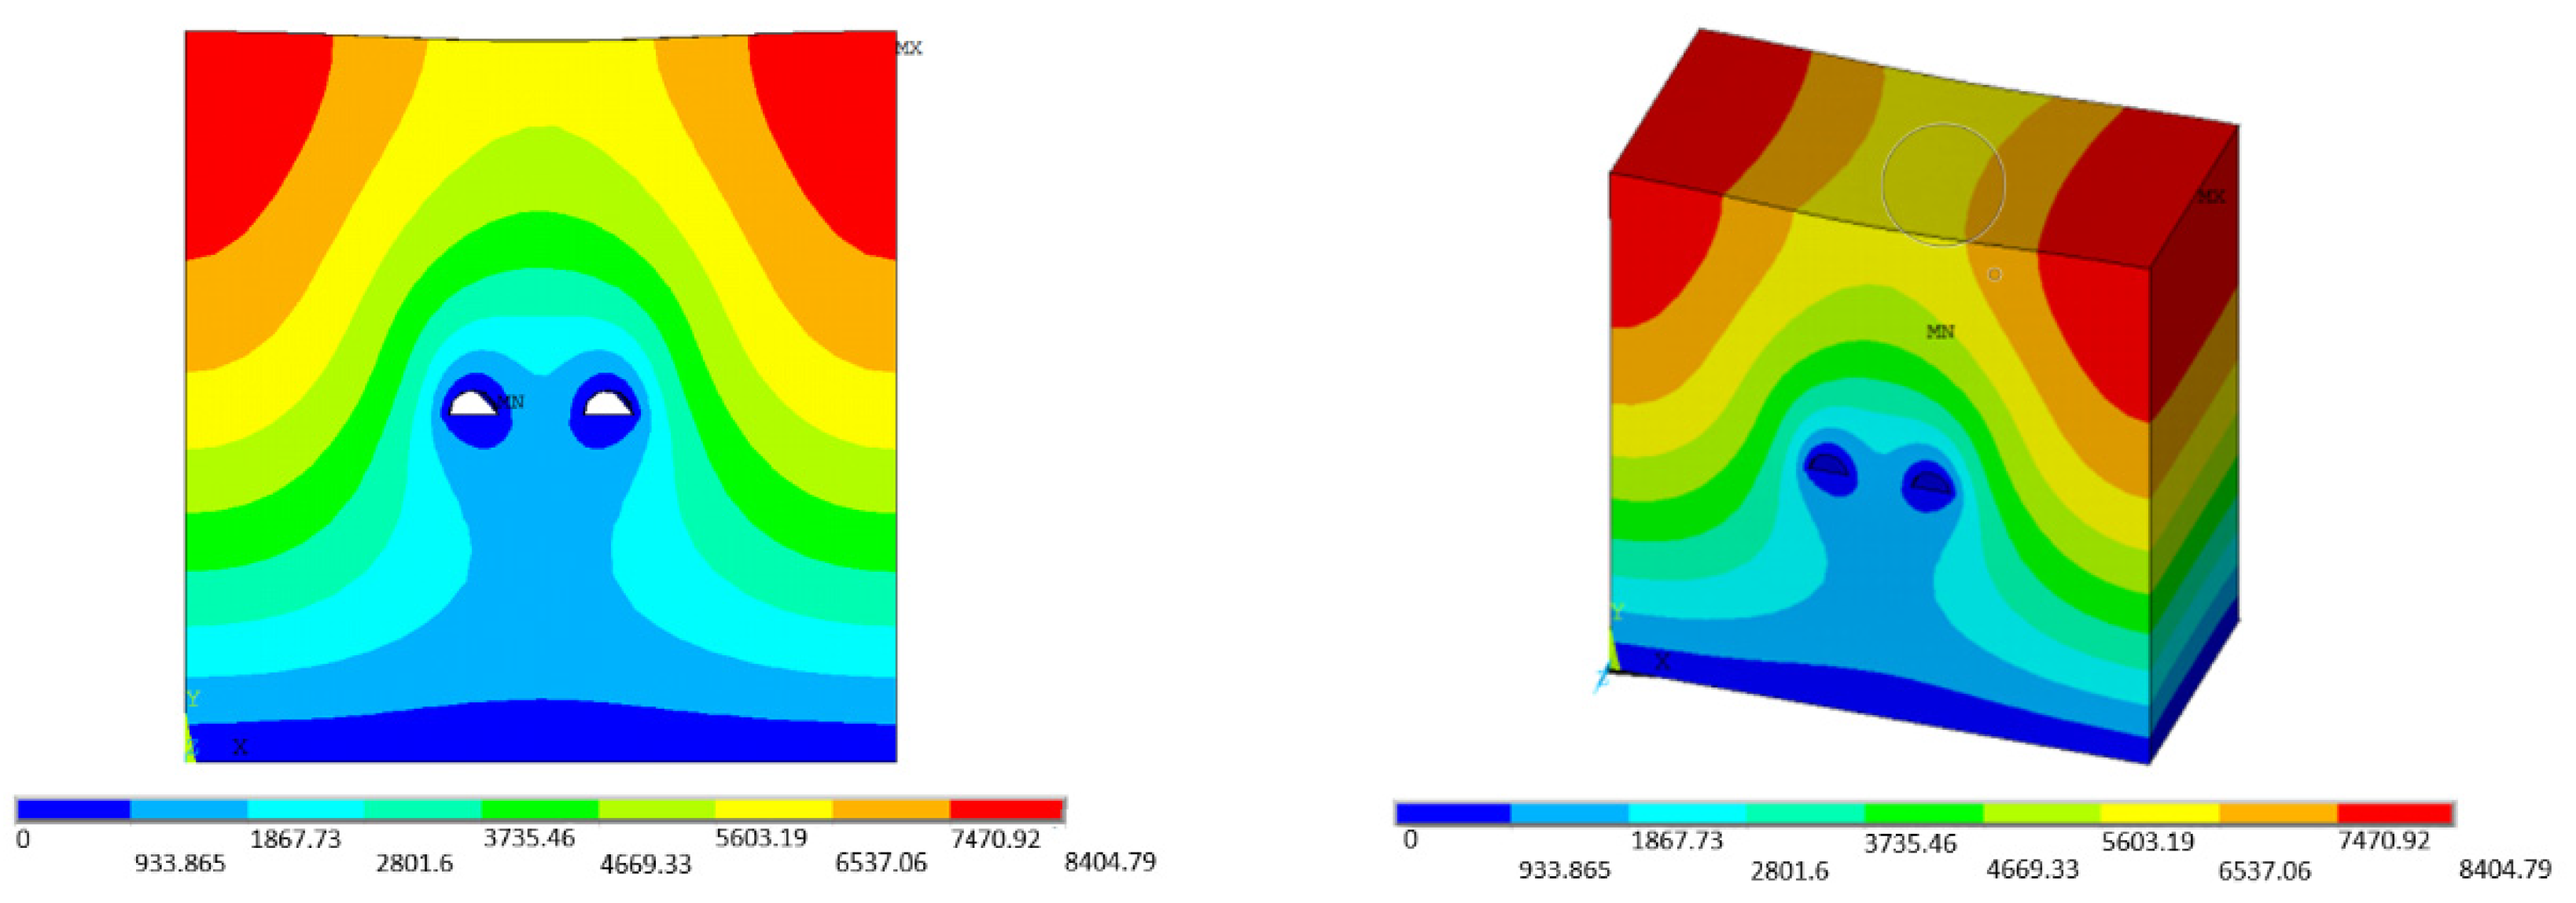
As can be seen Figure 12, Figure 13 and Figure 14, in the X and Z directions, the tunnel is mainly affected by the stress released by the surrounding rock mass due to excavation, and there is no large stress concentration around the tunnel in the X direction. In the Z direction, there is a certain stress concentration in the vault and the hance. In the Y direction, i.e., the direction of the dead weight of rock mass, the stress concentration is greater at the vault and above, while the stress is smaller at the arch foot and tunnel bottom.
(2)
In Figure 15, under the action of X, Y and Z directions, the stress concentration is the largest at the hance, followed by the vault and the arch foot. The surrounding rock within a certain range will produce a certain stress.
(3)
As can be seen from Figure 16, the rock mass around the tunnel does not produce displacement under the action of rock mass gravity. This is because the tunnel is deep underground and gravity cancels out under the action of ground stress and surrounding rock stress.
The location of stress concentration in different directions is different. According to the magnitude of influence, we should focus on the influence of self-weight in Y direction and stress concentration at the hance.

4.2.2. Vibration Velocity Analysis of the Left Tunnel Lining of a Deep-Buried Tunnel with Small Interval

The inner and outer sides of the lining were analyzed for their respective dynamic response. The inner side was the side in contact with the tunnel headroom, and the outer side was the side in contact with the surrounding rock.
(1)
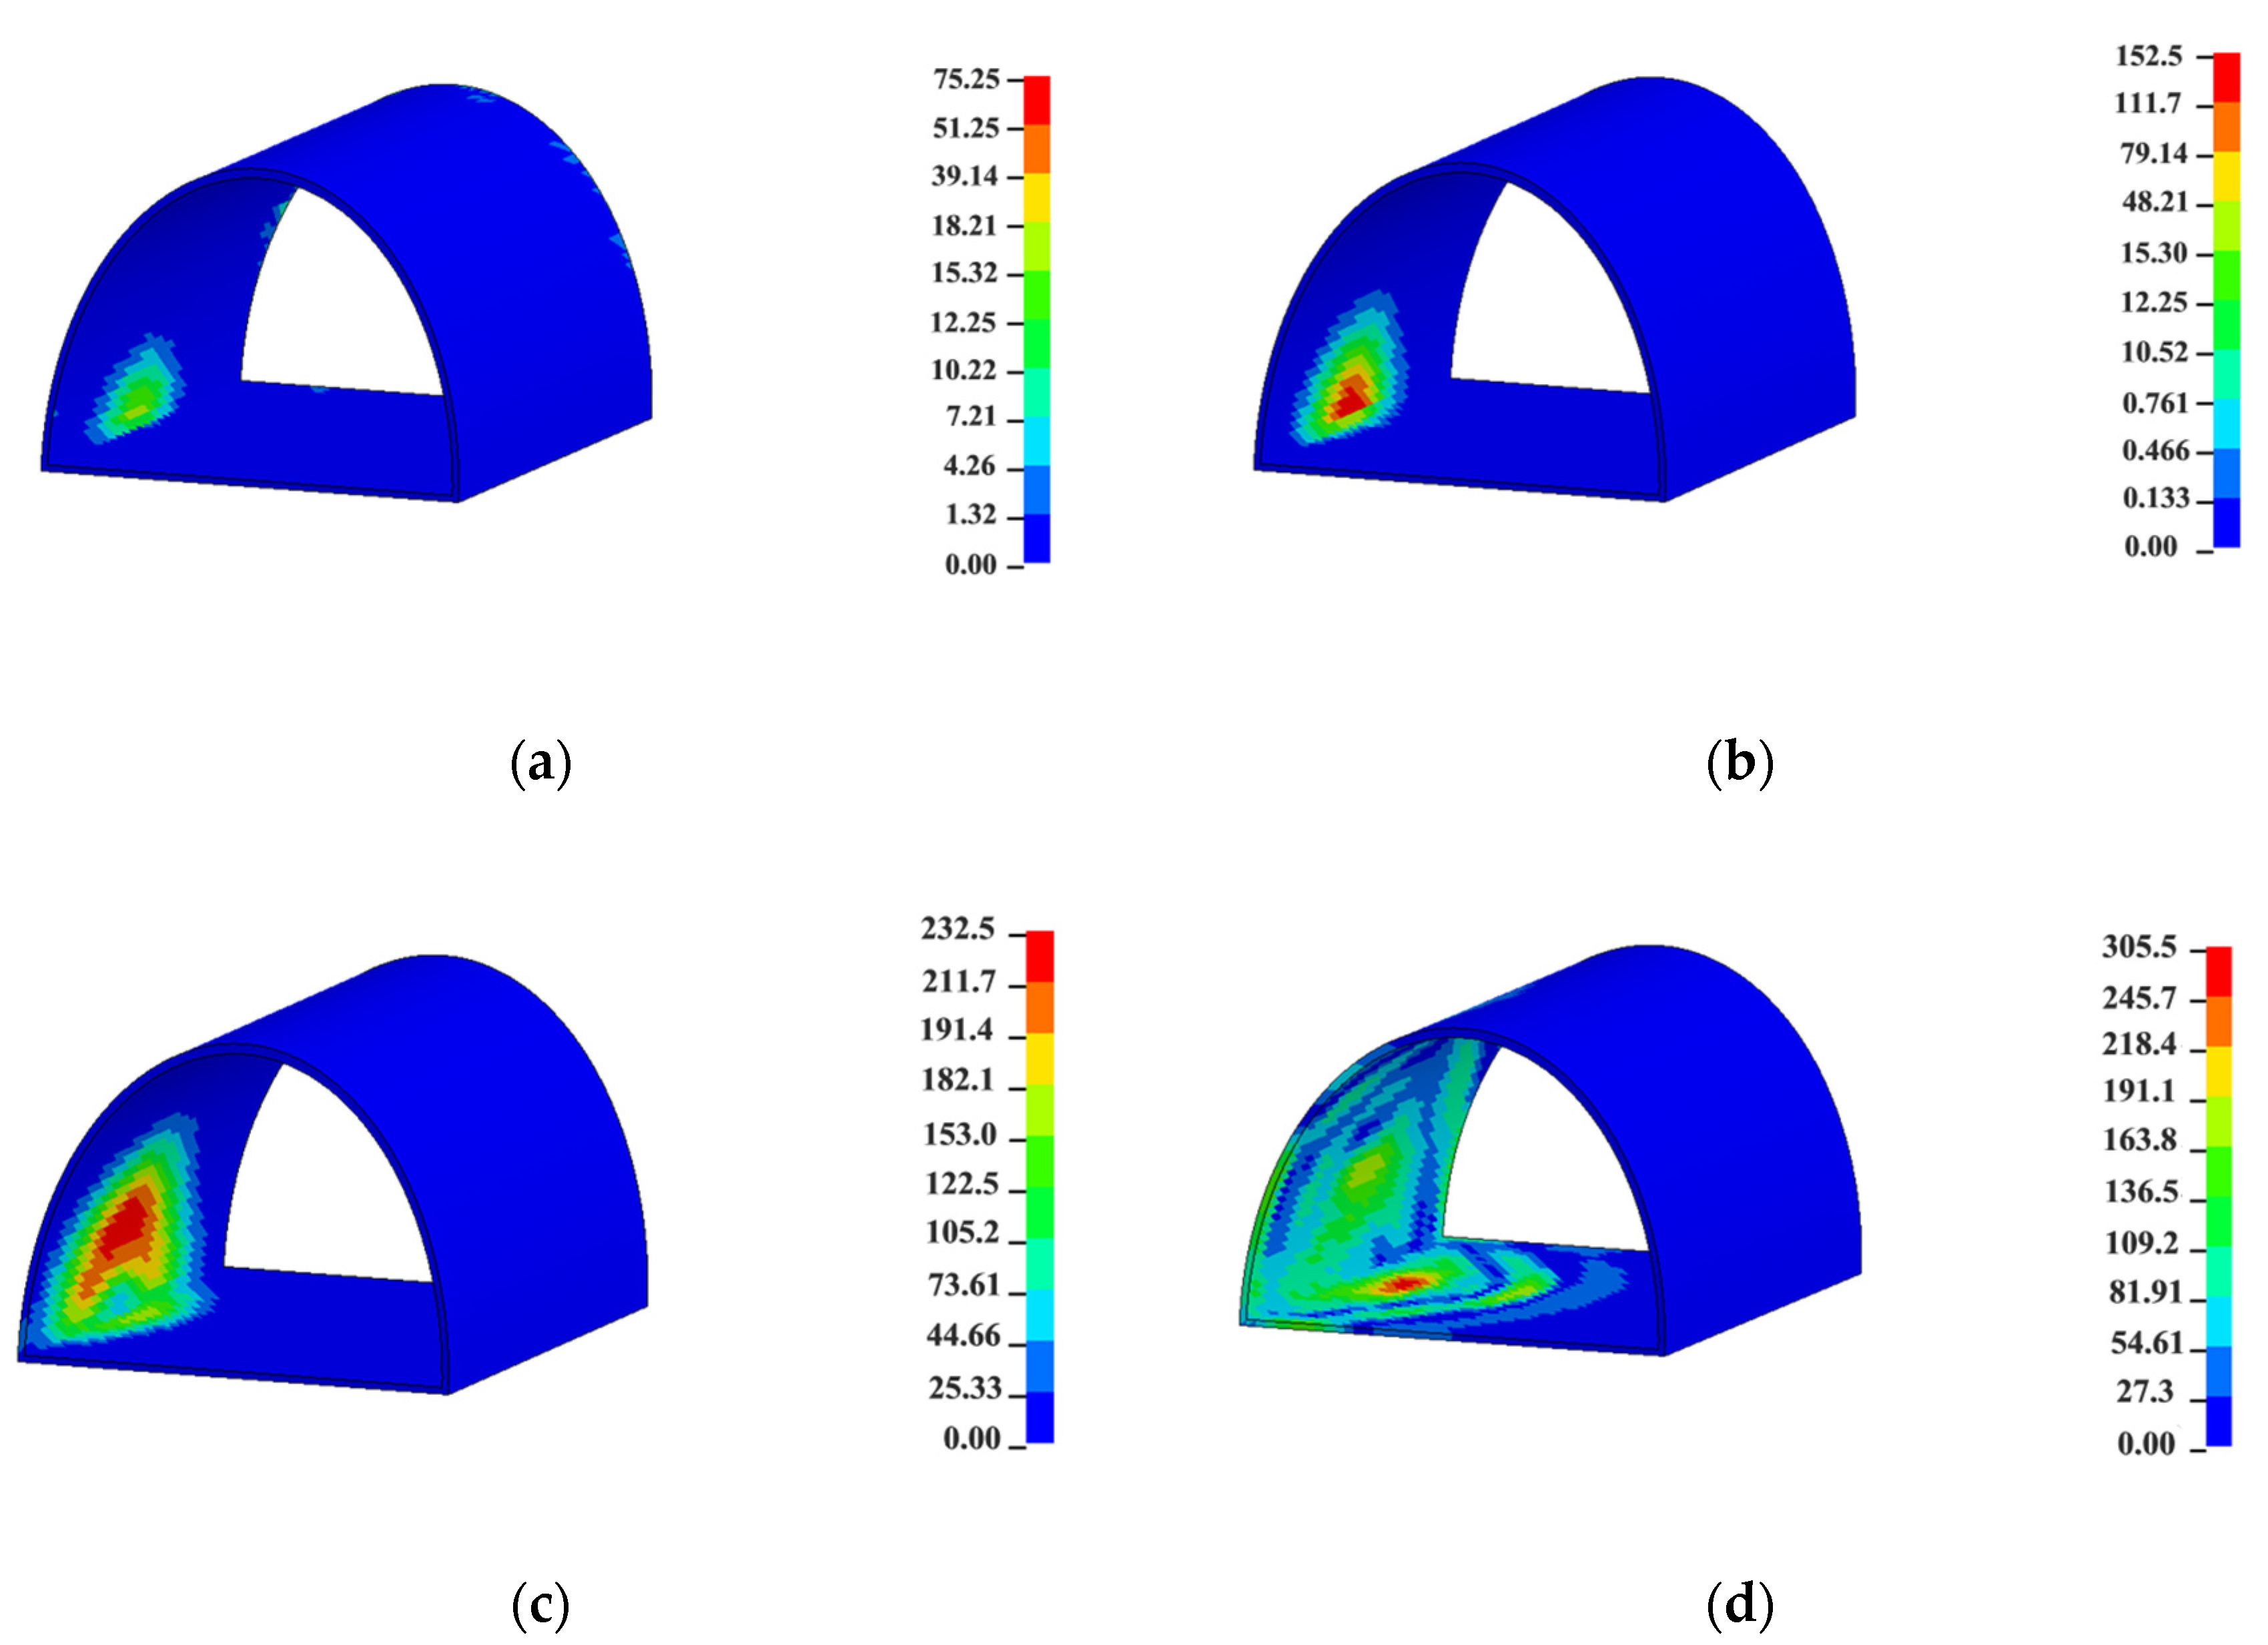
Analysis of vibration velocity distribution on inner lining
Figure 17 shows the nephogram of the vibration velocity corresponding to 1 ms, 3 ms, 5 ms, and 7 ms on the inner side of the lining.
As can be seen from Figure 17:
  • (1)
    As shown in Figure 17a, on the inside of the lining, the blasting vibration velocity first occurs at the arch foot, and its vibration velocity is also small, about 7.52 cm/s;
    (2)
    As can be seen from Figure 17b, the vibration velocity at the arch foot increases to 15.25 cm/s in a very short time and extends to the tunnel hance. It can be found in Figure 17c that the peak vibration velocity at the hance reaches 23.25 cm/s, and the vibration velocity spreads in the upper part and the bottom part.
    (3)
    As can be seen from Figure 17d, the vibration velocity continues to spread along the tunnel lining towards the vault and tunnel bottom.
In the whole blasting process, the maximum vibration velocity is at the arch foot, followed by the tunnel hance, and the minimum velocity is at the vault. After that, the blasting load gradually decreases, and the vibration velocity decreases rapidly until it approaches 0.
(2)
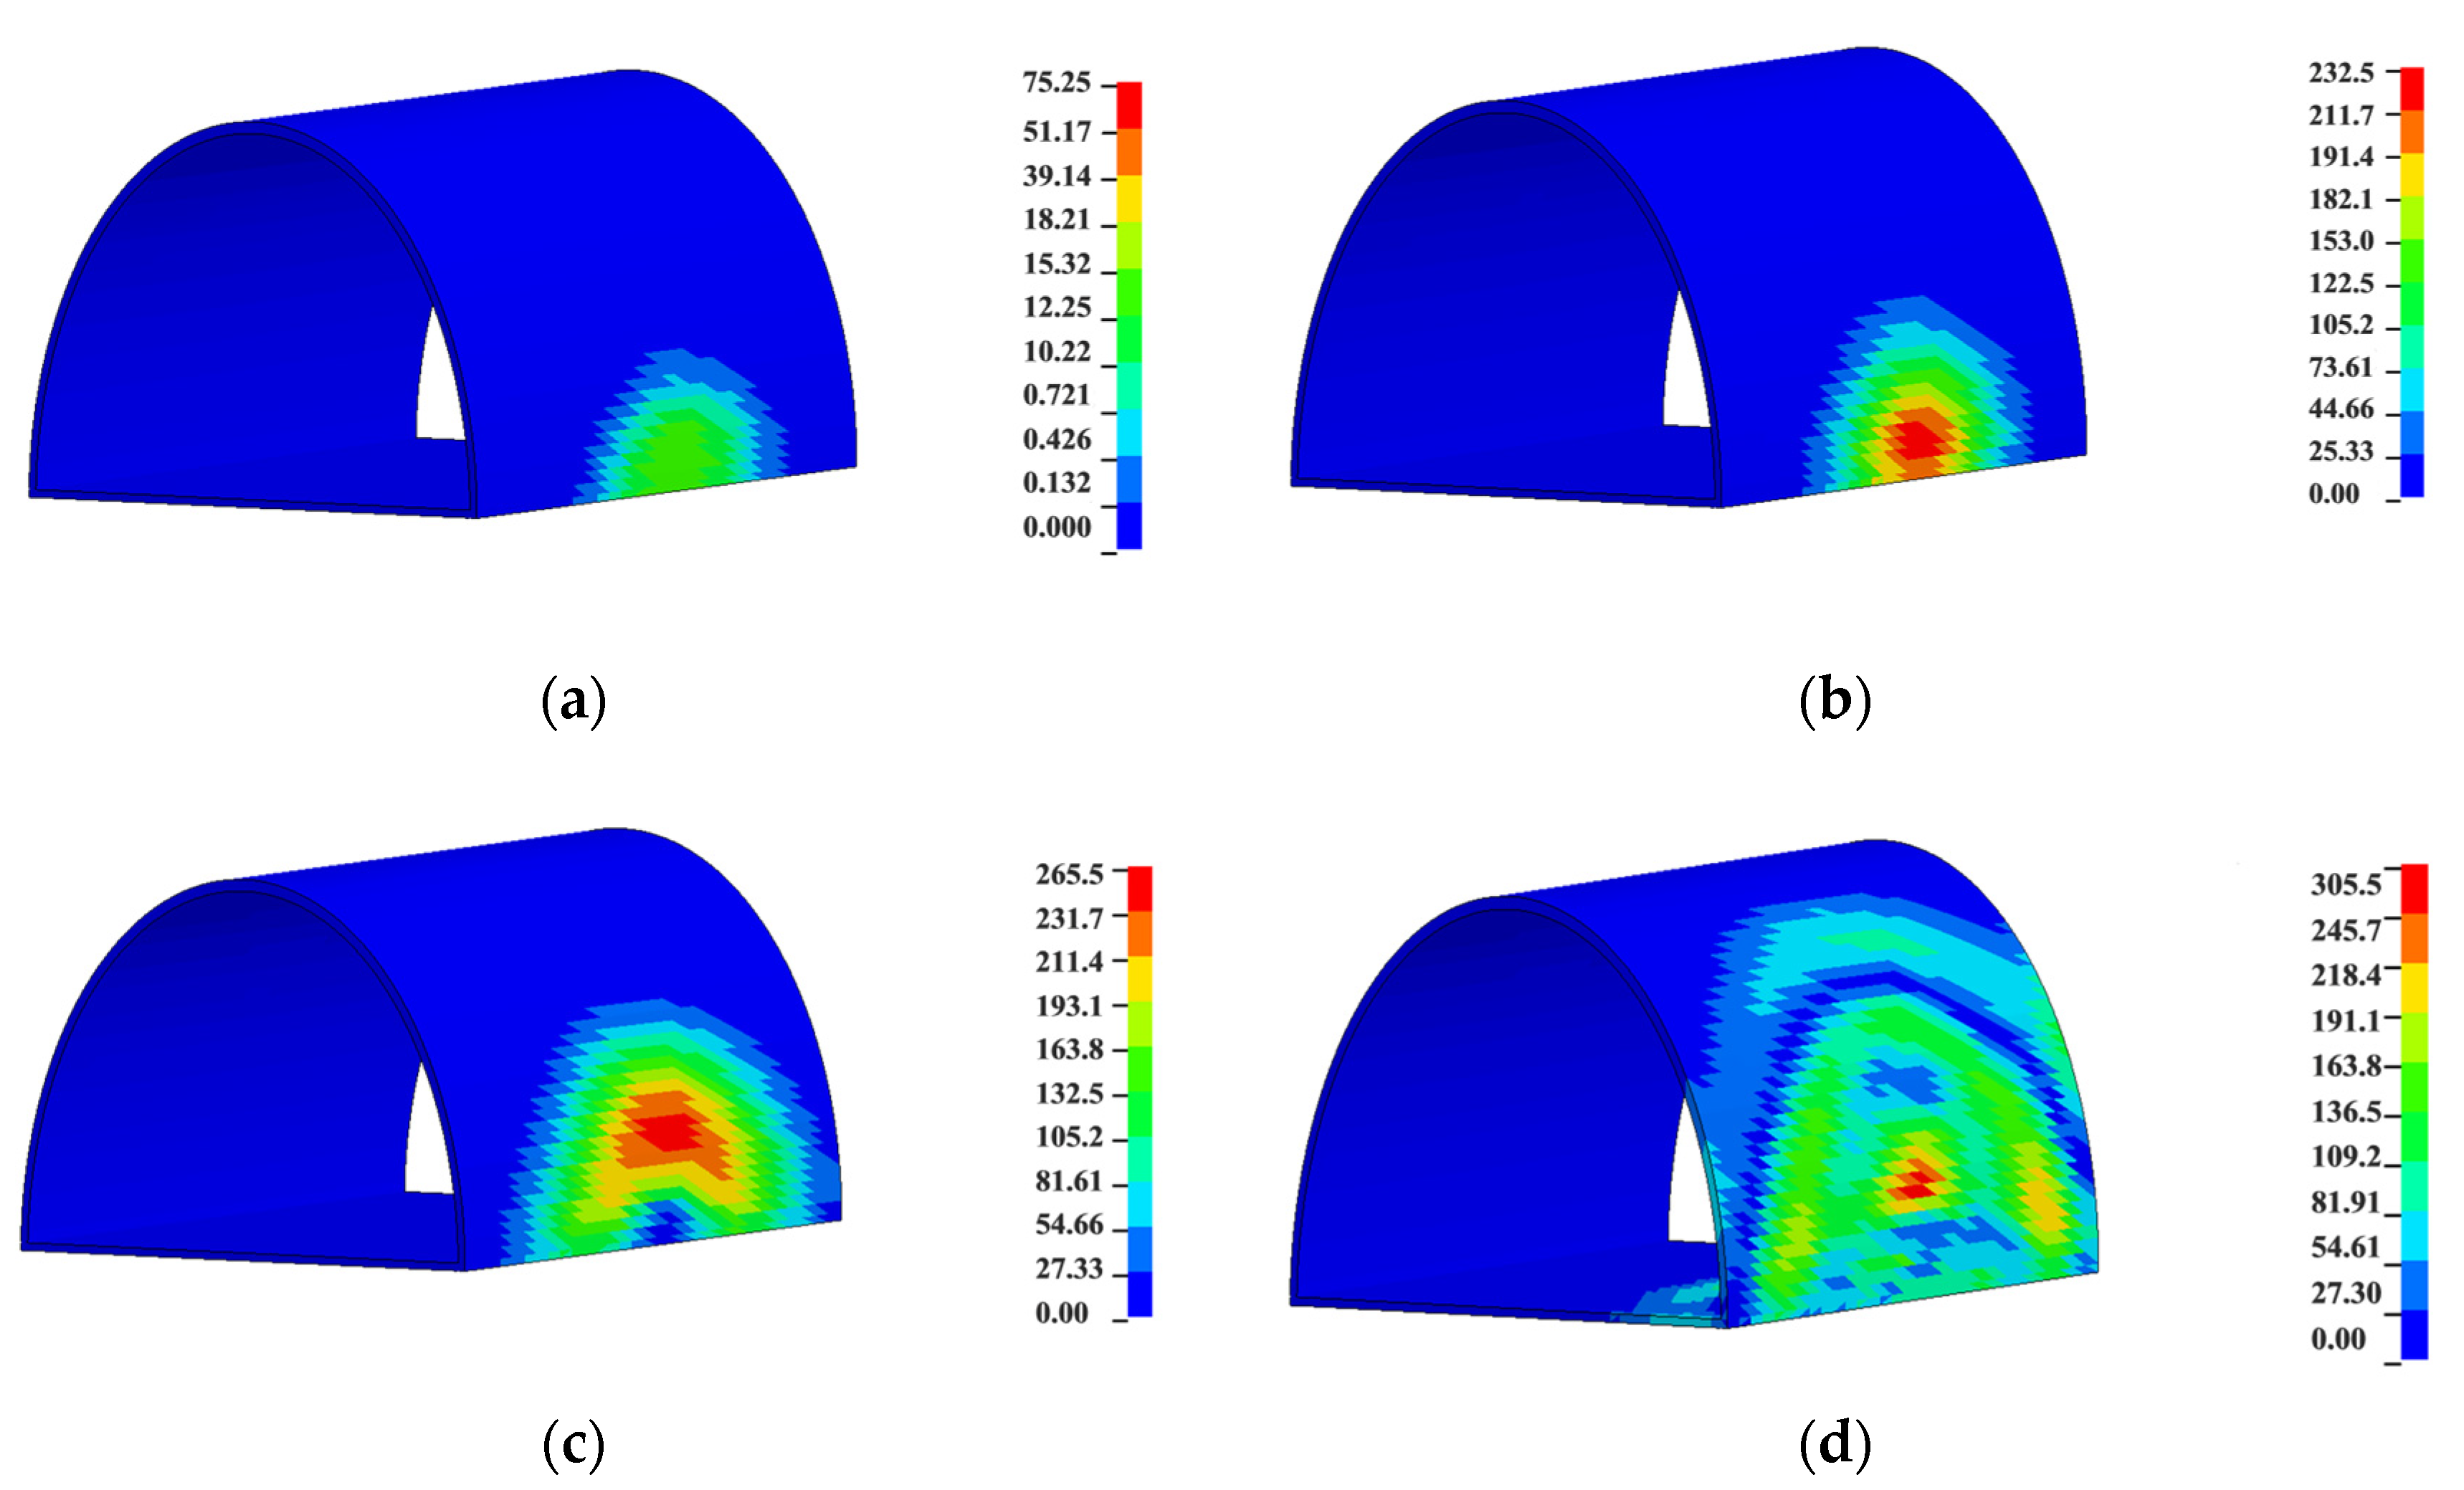
Analysis of vibration velocity distribution on external lining
Figure 18 shows the nephogram of vibration velocity corresponding to 1 ms, 3 ms, 5 ms, and 7 ms on the external side of the lining.
As can be seen from Figure 18:
  • (1)
    At the initial stage of blasting load, the lining of the blasting side of the existing left tunnel is affected by vibration first, and a vibration velocity circle is formed. The vibration velocity of the vibration velocity circle is relatively small, and the scope of action is not large, as shown in Figure 18a,b. The vibration velocity of the arch foot in the vibration velocity circle is the largest.
    (2)
    When the blasting load continues to increase, the vibration velocity circle increases rapidly and so does the vibration velocity, but it does not reach the maximum value, as shown in Figure 18c.
    (3)
    With the increase in time, the blasting stress wave continues to propagate and reflect in the medium, and reaches a maximum value of 30.55 cm/s in Figure 18d. At this time, the blasting load has been unloaded and then vibrates. The peak value of dynamic velocity decreases gradually until it approaches 0.
Compared with the inner lining, the velocity propagation of the outer lining shows that the peak vibration velocity at every moment is greater than that of the inner lining, and the peak vibration velocity at 7 ms appears at the hance. This is because the outer lining is closer to the detonation source and the detonation wave propagates more rapidly.
(3)
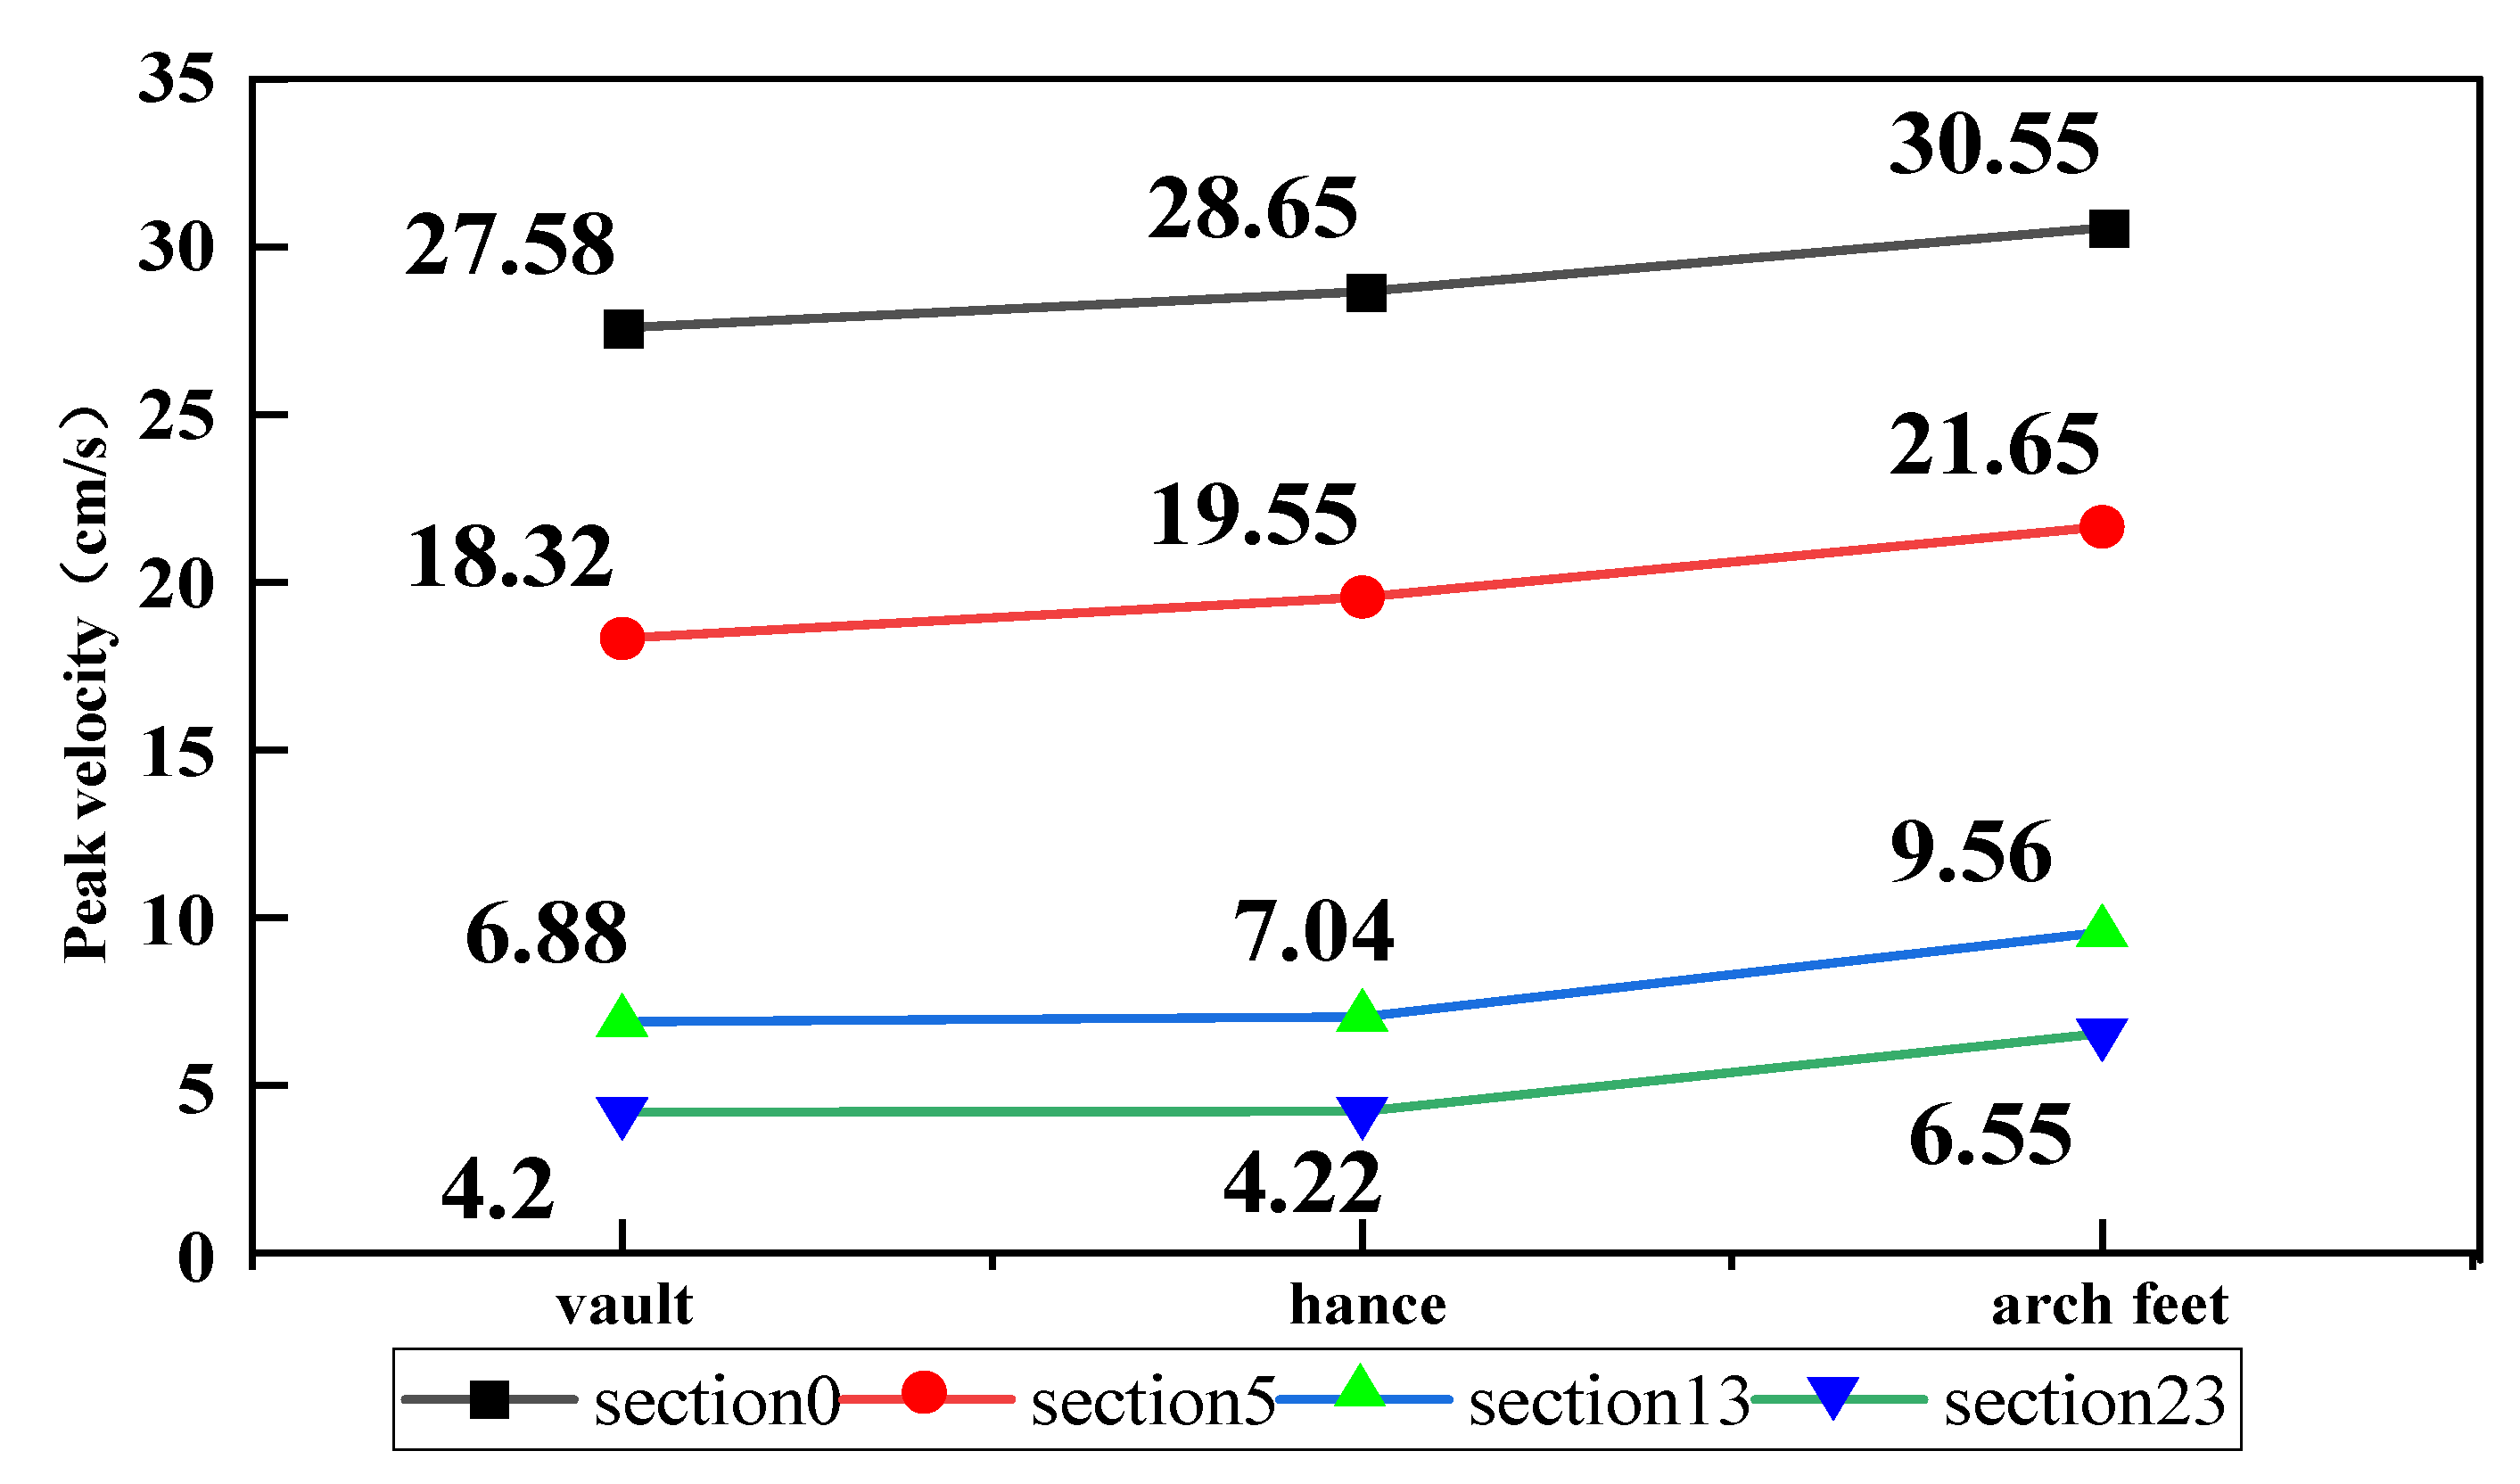
Analysis of transverse vibration velocity distribution
The vibration velocities of the measured points at each monitoring section are shown in Table 9, and the variation of peak vibration velocity is shown in Figure 19.
Figure 20 shows the waveform of vibration velocity at the measured points of each section.
It can be seen from Figure 19 and Figure 20 that:
  • (1)
    The vibration velocity is the largest at the arch foot of the blasting side lining of the existing tunnel. The velocity of hance is slightly smaller than that of arch foot but larger than that of vault. As section 0 is very close to the detonation source, the vibration speed reaches 30.55 cm/s, but it rapidly decreases to 6.55 cm/s at section 23, as shown in Figure 19.
    (2)
    Section 0 first reaches the peak value of blasting vibration velocity, and its blasting vibration velocity rapidly decreases after reaching the maximum value. The blasting vibration wave attenuates the fastest. Section 5 is the second, and its blasting vibration attenuation rate is less than that of section 0. The attenuation velocity of section 13 is obviously less than that of sections 0 and 5 after it reaches the peak velocity of blasting vibration. The blasting vibration velocity of section 23 reaches the peak time the latest, and the attenuation speed is also the smallest.
It can be seen that with the increase in detonation source distance, the time for the measuring point to reach the blasting vibration peak velocity also increases. After reaching the peak vibration velocity, the attenuation velocity also decreases with the increase in detonation source distance. The vibration velocity of the cross-section has little change. However, with the increase in longitudinal distance, there is a big difference in the vibration velocity of different sections.
(4)
Analysis of longitudinal vibration velocity distribution
The comparison of the vibration velocity and vibration waveform of each longitudinal measurement point in the left tunnel is shown in Figure 21 and Figure 22.
As can be seen from Figure 21 and Figure 22:
  • (1)
    The blasting vibration velocity of section 0 and section 5 (i.e., near the blast source) attenuates the fastest after reaching the peak. However, the attenuation rate of the vibration velocity of section 13 and section 23 is significantly lower than that of the former, and their attenuation velocity is roughly the same.
    (2)
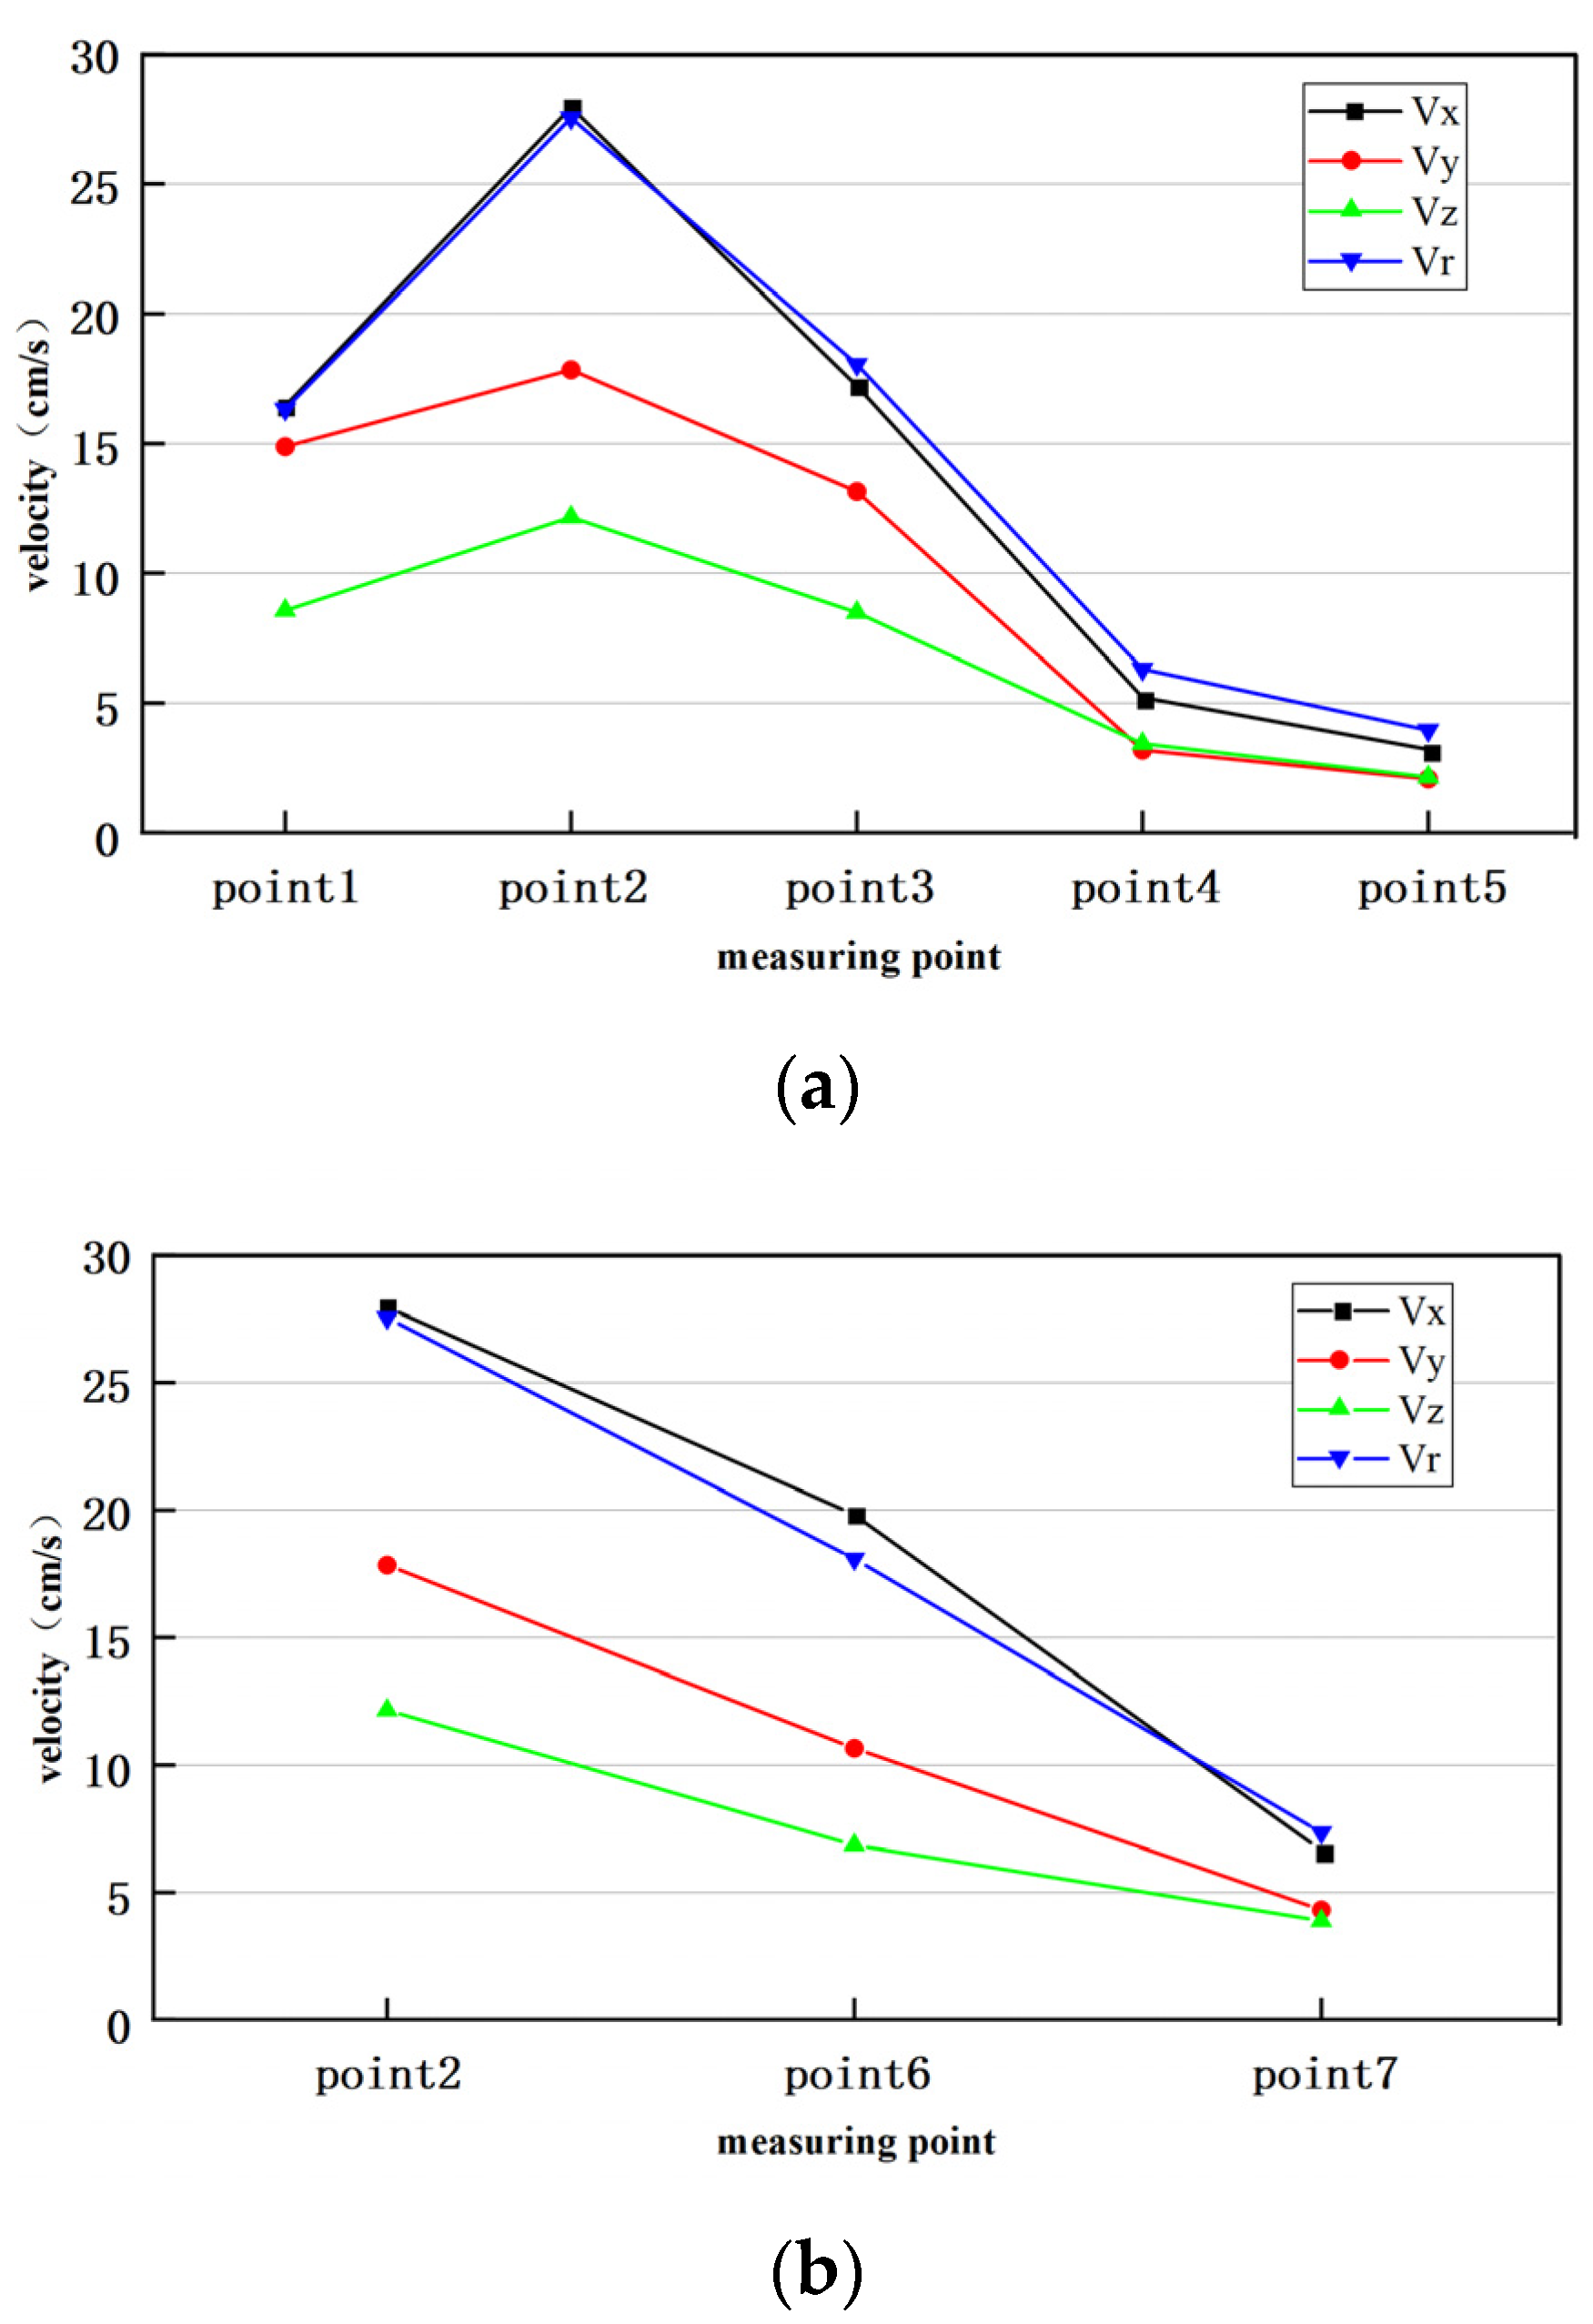
    In the longitudinal direction of the existing tunnel (i.e., in the directions of measuring points 2, 3, 4 and 5), the vibration velocity of the blasting lining of the existing tunnel decreases gradually. This indicates that the vibration velocity of the measuring point decreases rapidly with the increase of the distance to the blasting source.
    (3)
    With the increase in the detonation source distance, the moment when different sections reach the peak vibration velocity is different. The moment when the measuring points of section 0 and section 5 reach the peak vibration velocity is almost the same, while 13 and 23 reach the peak vibration velocity later. This indicates that the surrounding rock vibration frequencies are similar in the area of section 0 to section 5. The vibration velocity at the arch foot of sections 13 and 23 is 0 in 0–2 ms.
The sections close to the blasting source (section 0, section 5) have similar changes in vibration velocity and is greatly affected. The two sections far away from the detonation source (section 13 and section 23) have similar changes in vibration velocity. The main vibration band is within 0 to 2 ms.

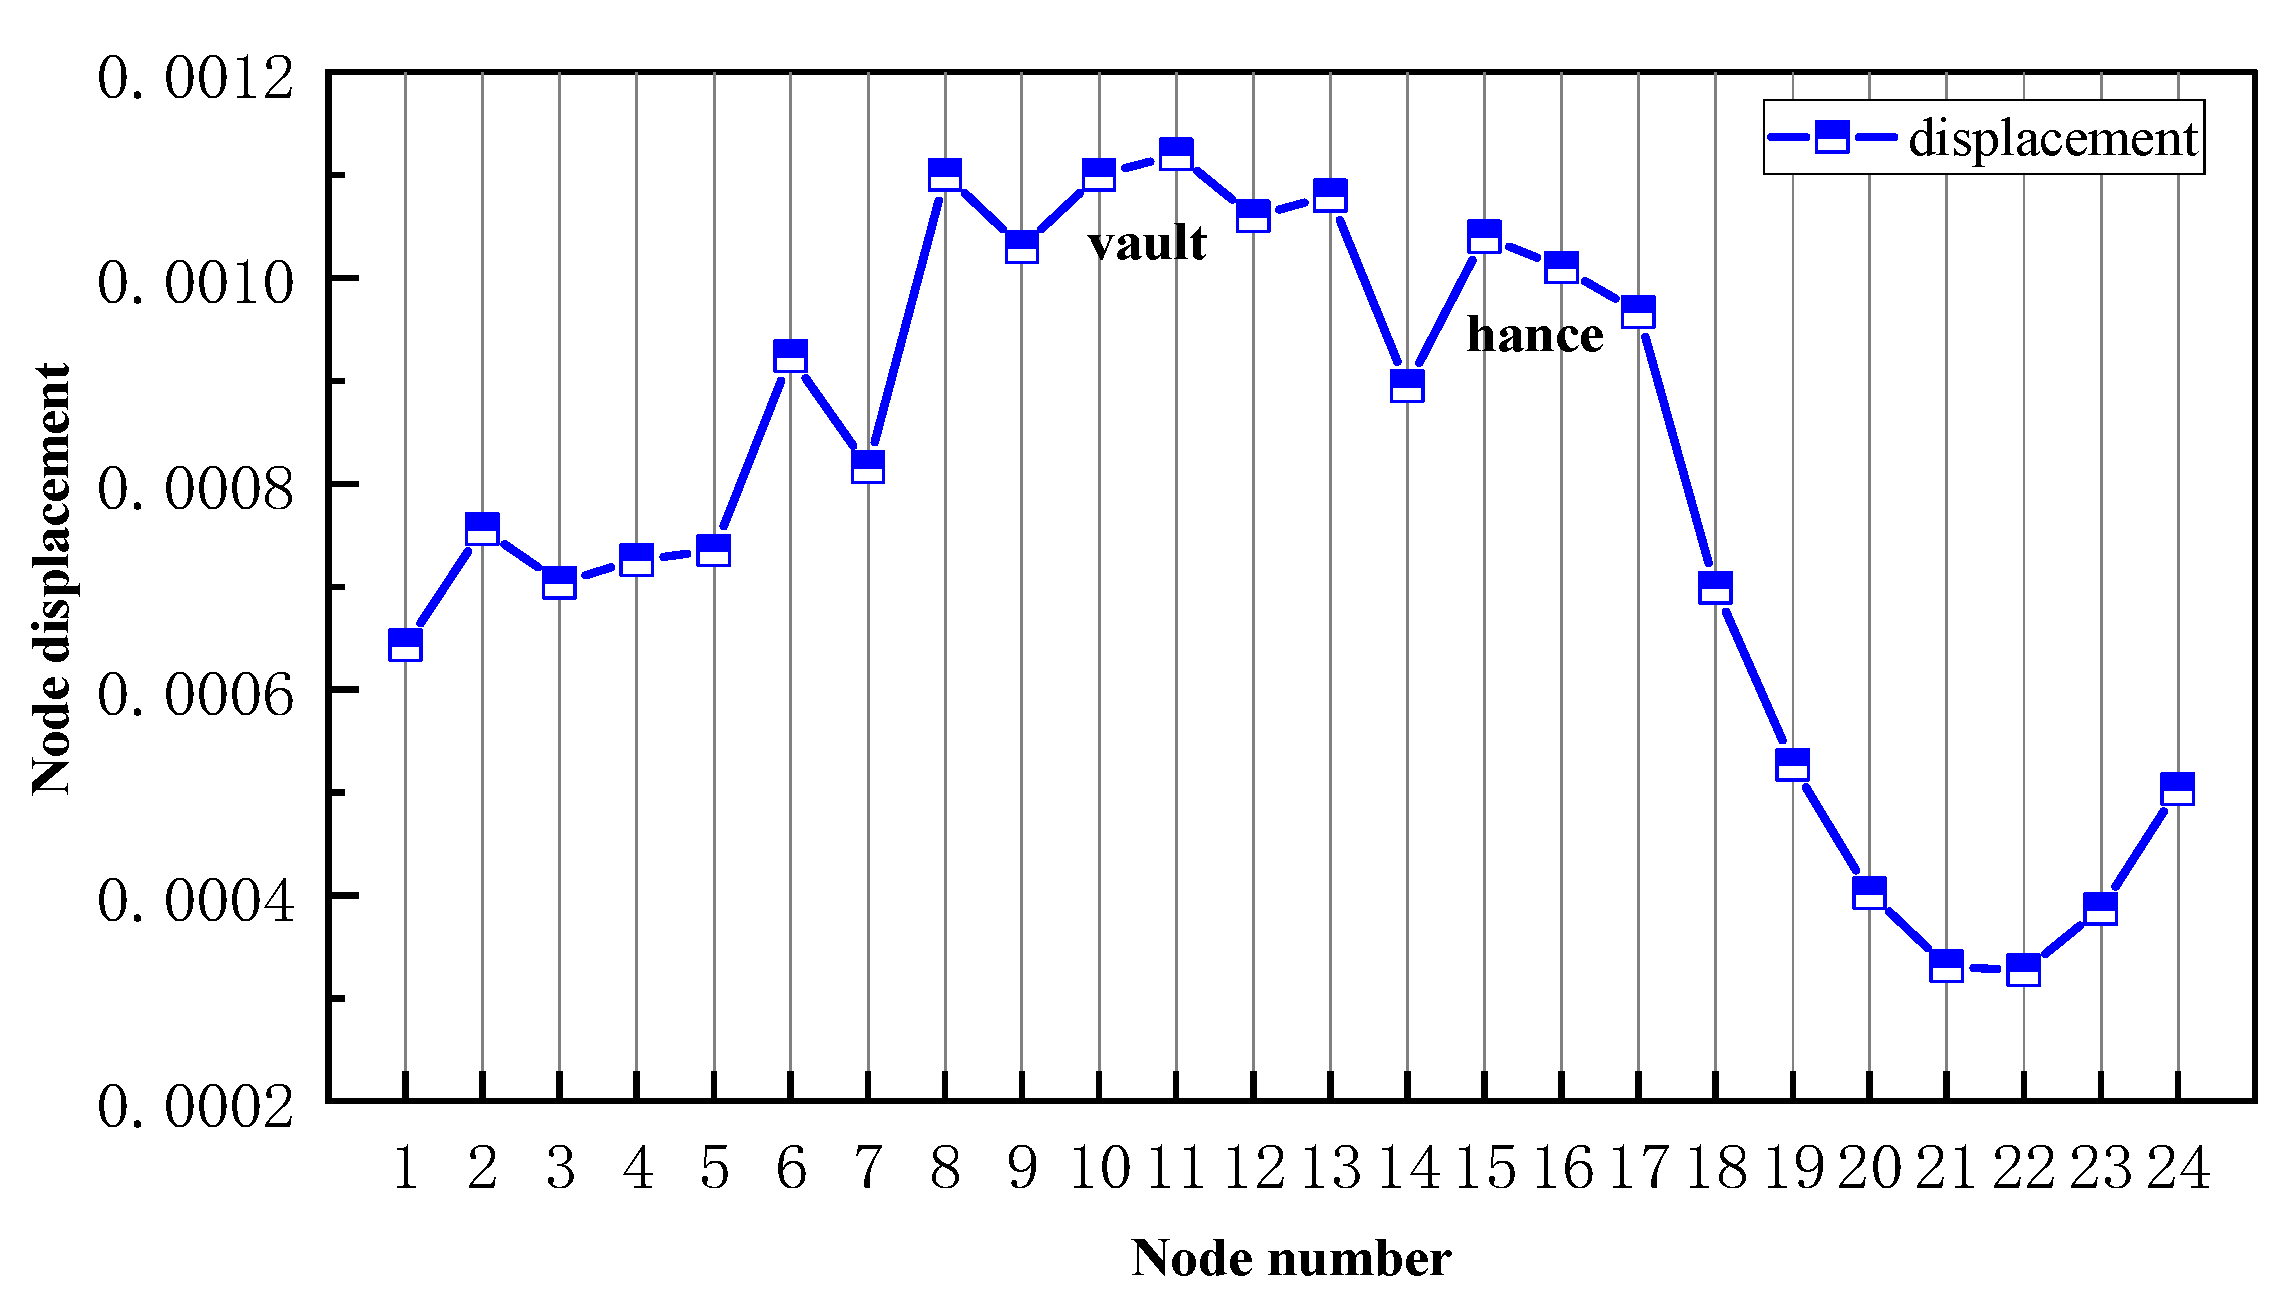
4.3. Analysis of Displacement of Left Tunnel

A basic model diagram of tunnel nodes is shown in Figure 23, with 1–24 internal nodes and 24–45 external nodes.
An overall lining deformation diagram, the X and Y direction and vector synthesis displacement nephograms, are shown in Figure 24, Figure 25, Figure 26 and Figure 27.
According to Figure 24, Figure 25 and Figure 26, it can be seen that the maximum horizontal displacement of the tunnel occurs on the inner node, namely, the inner side of the lining, while the maximum vertical displacement of the tunnel occurs on the outer node, namely, the outer side of the lining. Compared with the horizontal displacement, the vertical displacement fluctuates greatly, but it still has relevant rules. Different from the horizontal displacement, the vertical displacement fluctuates greatly on the power exponential curve. This shows that its changes are more complex and more random. Of course, the overall vertical displacement of the tunnel is smaller than that of the horizontal displacement. It can be seen that under the condition of the same distance in most cases, the horizontal displacement should be paid more attention than the vertical displacement [31].
It can be seen from Figure 27 that the influence range of displacement vector synthesis is mainly the inner side of the lining, which also confirms that more attention should be paid to the horizontal displacement mentioned above. The maximum displacement occurs at the tunnel vault, followed by the displacement at the hance. The variation of displacement with numbering is shown in Figure 28.

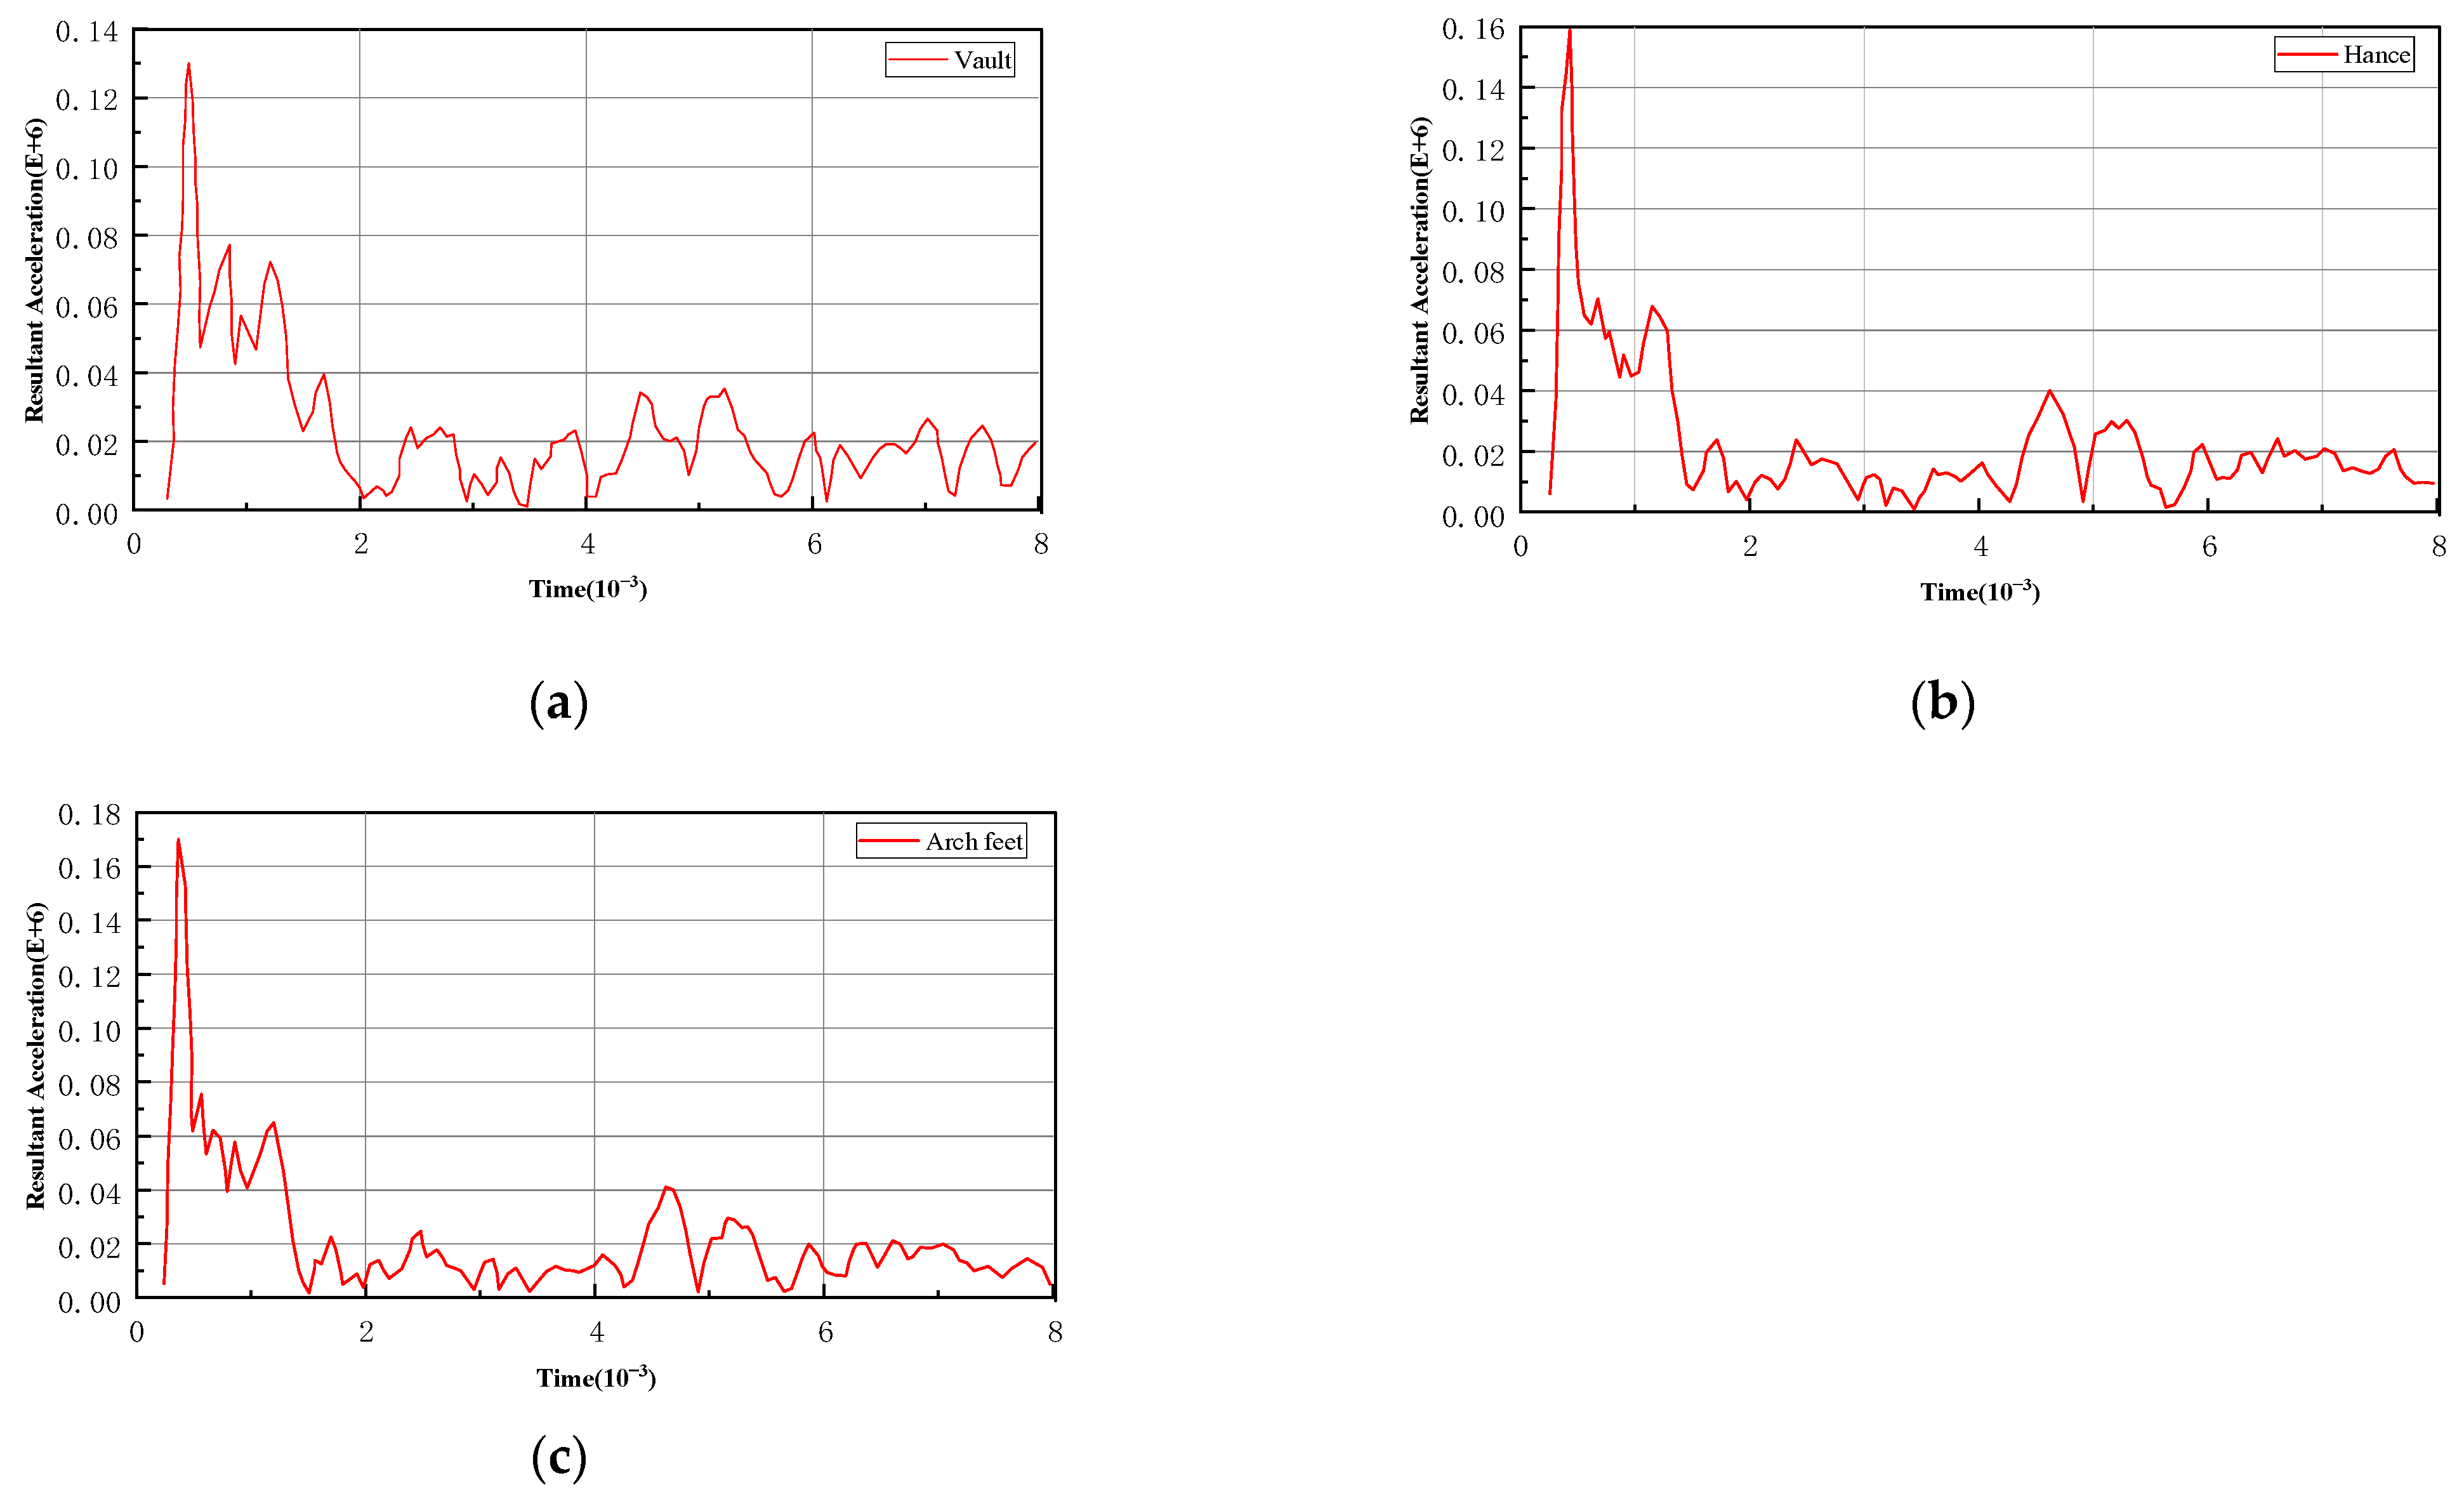
4.4. Acceleration Analysis of Measured Points

Figure 29 shows the time-history curve of blasting vibration acceleration at each measuring point at section 0.
It can be seen from Figure 29 that the vibration acceleration of the measuring point at the arch foot of section 0 on the blasting side of the left tunnel is the largest, followed by the measuring point at the tunnel hance, and the peak value of vibration acceleration of the vault is the smallest. By analyzing the change of the blasting vibration acceleration, the resultant force change law of the blasting side can be directly observed: the blasting vibration acceleration at the arch foot is the largest, indicating that the outside lining of the blasting side has the largest detonation force.

5. Conclusions

Through the combination of field test and numerical simulation, this paper analyzes the dynamic response of a deep-buried tunnel with small interval under blasting load, and the specific conclusions are as follows:
  • Through the spectrum analysis of the field measured waveform and the nonlinear regression of the data, the empirical formula conforming to the attenuation law of the Sadowski vibration velocity of the project is obtained.
  • On the inside of the lining (the side contacting the tunnel headroom), the vibration continues from the arch foot along the tunnel lining towards the vault and tunnel bottom. On the outside of the lining (the side contacting the surrounding rock), the lining on the blasting side is affected by vibration before the back side at the initial stage of blasting. The vibration velocity in the order of large to small is arch foot, tunnel hance, and vault.
  • After the blasting action is completed, the vibration velocity of the lining structure gradually decreases but will not disappear, and will only approach 0. The vibration velocity of the cross-section shows little change. The vibration velocity of the section near the detonation source attenuates faster, while the vibration velocity of the section far away from the detonation source attenuates slower and there is little difference in the attenuation velocity.
  • The influence of the horizontal displacement of the tunnel lining is greater than that of the vertical displacement, and the randomness of the vertical displacement is larger. The influence of the inner displacement of the lining is greater than that of the outer displacement.
  • The vibration acceleration at the arch foot of the section is the largest, followed by that at the tunnel hance, and the peak value of vibration acceleration at the vault is the smallest.

Author Contributions

Data curation, W.X.; Formal analysis, X.M.; Investigation, J.S. and H.Z.; Project administration, J.S.; Resources, J.S.; Supervision, H.A.; Writing—original draft, W.X.; Writing—review and editing, W.X., H.A. and H.Z.; Conceptualization, H.A. All authors have read and agreed to the published version of the manuscript.

Funding

This research received no external funding.

Data Availability Statement

Not applicable.

Conflicts of Interest

The authors declare no conflict of interest.

References

  1. Xia, M. Influence factors on stability of Surrounding rock of tunnel with small clear spacing. J. Civ. Env. Eng. 2021, 43, 73–80. [Google Scholar]
  2. Li, R.; Wang, S.T.; Zhang, D.L.; Chen, P.; Pan, H.A.; Li, A. Control mechanism and engineering application of pillar-reinforcing bolt in closely spaced tunnels. Rock Soil Mech. 2022, 7, 1865–1876. [Google Scholar]
  3. Xiong, L.; Zhou, C.; Jiang, N.; Wang, T.; Meng, X. Dynamic Response and Safety Control of Newly Poured Secondary Lining Concrete under Large Section Tunnel Blasting-A Case Study of Longnan Tunnel of Ganshen High-speed Railway. Period. Polytech. Stroit. 2022, 66, 1294–1308. [Google Scholar] [CrossRef]
  4. Li, X.J.; Yang, Z.X.; Huang, F.; Wang, C.P.; Liu, X.Z. Actual measurement and simulation study on Mechanical Characteristics of shallow tunnel support with large section and small clear distance. Sci. Technol. Ind. 2022, 22, 309–314. [Google Scholar]
  5. Pan, W.T.; He, C.; Wu, F.Y.; Xu, Y.J.; Yao, R.J.; Yan, Q.X. Study on Bonding Construction and Blasting Vibration Effect of Small clean Distance Three-hole parallel Railway Tunnel. Railw. Std. Des. 2022, 12, 1–10. [Google Scholar]
  6. Wu, T.; Zhou, C.B.; Jiang, N.; Xia, Y.Q.; Bin, Z. Study on the Mechanical Cumulative Damage Model of Slope Fault Fracture Zone under the Cumulative Effect of Blasting Vibration. Period. Polytech. Civ. Eng. 2020, 64, 845–858. [Google Scholar] [CrossRef]
  7. Zhu, Z.G.; Fang, Z.C.; Han, Z.M.; Ding, X.; Ma, C.Y.; Sun, M.L.; Wang, Z.W. Research on Classification Standard and Control Technology of Extrusion Large Deformation of Deep Buried Tunnel. J. Railw. Eng. Soc. 2022, 39, 47–52. [Google Scholar]
  8. An, Y.L.; Tan, G.Y.; Li, J.H.; Zhu, T.H.; Guo, J.D.; Yue, J. Study on surrounding rock pressure of Deep tunnel with small clear distance under nonlinear failure criterion. J. Catas. 2022, 12, 1–10. [Google Scholar]
  9. Wang, Y.Q.; Gong, L.J.; An, N.N.; Peng, X.B.; Wang, W.; Wang, Z.F. Field Investigation of Blasting-Induced Vibration in Concrete Linings during Expansion of Old Highway Tunnel. Adv. Civ. Eng. 2021, 2021, 8820544. [Google Scholar] [CrossRef]
  10. Wu, K.H.; Shi, E.L.; Yu, H.Z.; Gong, W.J. Pressure analysis of surrounding rock of asymmetric three-hole tunnel with small clear distance. Chin. J. Undergr. Space Eng. 2022, 18, 65–73. [Google Scholar]
  11. Zhu, D.P.; Abrae, T.; Xu, H.B. Dynamic response prediction of rock pile under blasting vibration in DaqianShiling Tunnel. Chin. J. Undergr. Space Eng. 2021, 17, 645–649. [Google Scholar]
  12. Hao, R.J. Dynamic response analysis of tunnel with small clear distance under blasting load. Water Resour. Hydropower Eng. 2020, 51, 291–297. [Google Scholar]
  13. Ma, J.J.; Li, C.H.; Guan, J.W.; Chen, W.X.; Huang, L.C. Dynamic response of close-range explosion over a subway tunnel. J. Railw. Sci. Eng. 2022, 12, 1–10. [Google Scholar]
  14. Ma, Y.Y.; He, H.H.; Zhang, Y.; Tie, J.K.; Liu, G.F.; Jiang, W.; Gao, Q.D. Analysis of Blasting Vibration Response Characteristics and Safety Control of first tunnel with Small Clear distance Large Section. Blasting 2022, 12. [Google Scholar]
  15. Li, X.G.; Zhou, X.Q.; Yang, H.P.; Fu, X.Q.; Yu, J. Vibration control and Damage identification of Rock Burst in tunnel with Large span and Small clear Distance. Tunnel Constr. 2022, 42, 406–413. [Google Scholar]
  16. Ji, L.; Zhou, C.B.; Zhang, B.; Wang, F.X. Study on dynamic response and damage effect of surrounding rock in large tunnel under blasting excavation. J. China Railw. Soc. 2021, 43, 161–168. [Google Scholar]
  17. Yan, Y.P. Study on stress-strain characteristics and dynamic response of double tunnel excavation in soft rock area. Railw. Constr. Technol. 2022, 7, 106–110. [Google Scholar]
  18. Wang, Z.H.; Wang, Q. Nonlinear regression method with zero residual sum of residual errors and its application. J. Northeast For. Univ. 2011, 39, 125–127+130. [Google Scholar] [CrossRef]
  19. Alipour, A.; Mokhtarian-Asl, M.; Asadizadeh, M. Support Vector Machines for the Estimation of Specific Charge in Tunnel Blasting. Period. Polytech. Civ. Eng. 2021, 65, 967–976. [Google Scholar] [CrossRef]
  20. He, Y.C.; Chen, Q.N.; Yi, L.W.; Huang, X.T.; Zeng, A.; Zhou, M.Y.; Zhou, G.Y. Influence of tunnel blasting vibration on secondary lining of new ultra short age concrete. J. Cent. South Univ. (Sci. Technol.) 2020, 51, 507–513. [Google Scholar]
  21. Li, C.X.; Yang, R.S.; Wang, Y.B.; Xu, B.; Zuo, J.J.; Xie, P. Research on deep hole segmented charge cut blasting of rock roadway based on numerical simulation. J. Coal Sci. Technol. 2022, 9, 1–18. [Google Scholar]
  22. Xie, L.X.; Lu, W.B.; Jiang, Q.H.; Zhang, Q.B.; Wang, G.H.; Chen, M.; Yan, P. Damage evolution mechanism of deep rock mass in process of cut blasting. J. Cent. South Univ. (Sci. Technol.) 2017, 48, 1252–1260. [Google Scholar]
  23. Xie, Q.M.; Jia, Y.S.; Ding, K.; Zhang, J.; Ling, Z.D.; Liu, D.S. Chaotic characteristics analysis of tunnel blasting vibration signals. J. Vib. Shock 2022, 41, 238–244+306. [Google Scholar] [CrossRef]
  24. Wang, H.L.; Li, S.; Zhao, Y. Research on blasting damage law of initial concrete support under cumulative effect. Eng. Blasting 2021, 27, 29–33+50. [Google Scholar] [CrossRef]
  25. Yin, H.; Ouyang, Y. Experimental and Numerical Study on Steel Fiber Concrete under Blast Loading. Buildings 2022, 12, 2119. [Google Scholar] [CrossRef]
  26. Liu, J.; Liu, C.; Qu, K.; Li, J.; Wu, C. Calibration of Holmquist Johnson Cook (HJC) model for projectile penetration of geopolymer-based ultra-high performance concrete (G-UHPC). Structures 2022, 43, 149–163. [Google Scholar] [CrossRef]
  27. Wang, C.; Song, R.; Wang, G.; Zhang, S.; Cao, X.; Wei, P. Modifications of the HJC (Holmquist–Johnson–Cook) Model for an Improved Numerical Simulation of Roller Compacted Concrete (RCC) Structures Subjected to Impact Loadings. Materials 2020, 13, 1361. [Google Scholar] [CrossRef] [Green Version]
  28. Yong, W.; Wu, Y.; Dai, Y.C.; Wang, S.S.; Wu, B.; Xu, S.X.; Wei, H. Analysis of Mutual Influence on Blasting Construction of Urban Shallow-buried Small Spacing Tunnels. Earth Environ. Sci. 2020, 525, 012055. [Google Scholar] [CrossRef]
  29. Li, X.H.; Liang, C.; Xu, X.L. The Research of Influence of Above Building on Tunnel Dynamic Response. Mater. Sci. Eng. 2018, 39, 329–336. [Google Scholar] [CrossRef]
  30. Kirzhner, F.; Rosenhouse, G. Numerical analysis of tunnel dynamic response to earth motions. Tunn. Undergr. Space Technol. 2020, 15, 249–258. [Google Scholar] [CrossRef]
  31. Xu, J.F.; Wang, J.C.; Bian, C.; He, P. Analysis of foundation pit excavation’s influence towards adjacent tunnel under soft soil geological conditions in Hangzhou. Bull. Sci. Technol. 2020, 36, 103–108. [Google Scholar]
Figure 1. Location of Badaling Great Wall Station. (a) Location in China. (b) Surrounding environment. (c) The relative location of the Great Wall Station.
Buildings 13 00711 g001
Figure 2. Cross-sectional sketch of Badaling Great Wall Station.
Buildings 13 00711 g002
Figure 3. Section size and spacing of separation section of three holes (unit: cm).
Buildings 13 00711 g003
Figure 4. The layout of the upper step gun hole of grade III surrounding rock in the middle of the three-hole separation section (unit: mm).
Buildings 13 00711 g004
Figure 5. The layout of the lower step gun hole of grade III surrounding rock in the middle of the three-hole separation section (unit: mm).
Buildings 13 00711 g005
Figure 6. Diagram of arrangement of vibration measuring points.
Buildings 13 00711 g006
Figure 7. Velocity vibration waveform of measurement point 2. (a) Vertical velocity vibration waveform of measuring point 2. (b) Radial velocity vibration waveform of measuring point 2. (c) Tangential velocity vibration waveform of measuring point 2.
Buildings 13 00711 g007aBuildings 13 00711 g007b
Figure 8. Diagram of vibration velocity and detonation distance. (a) Longitudinal point. (b) Transverse point.
Buildings 13 00711 g008
Figure 9. Tunnel model.
Buildings 13 00711 g009
Figure 10. Measuring point.
Buildings 13 00711 g010
Figure 11. Diagram of section layout.
Buildings 13 00711 g011
Figure 12. Stress distribution in the X direction of the three-way tunnel under the influence of dead weight.
Buildings 13 00711 g012
Figure 13. Stress distribution in the Y direction of the three-way tunnel under the influence of dead weight.
Buildings 13 00711 g013
Figure 14. Stress distribution in the Z direction of the three-way tunnel under the influence of dead weight.
Buildings 13 00711 g014
Figure 15. Stress intensity distribution of three-way tunnel under the influence of dead weight.
Buildings 13 00711 g015
Figure 16. Y-direction displacement distribution cloud map of the three-way tunnel under the influence of dead weight.
Buildings 13 00711 g016
Figure 17. Cloud picture of vibration velocity distribution inside tunnel lining: (a) 1 ms; (b) 3 ms; (c) 5 ms; and (d) 7 ms.
Buildings 13 00711 g017
Figure 18. Cloud picture of vibration velocity distribution of external lining: (a) 1 ms; (b) 3 ms; (c) 5 ms; and (d) 7 ms.
Buildings 13 00711 g018
Figure 19. Peak vibration velocity variation trend diagram.
Buildings 13 00711 g019
Figure 20. The vibration waveform of four cross-section measuring points: (a) Section 0; (b) Section 5; (c) Section 13; and (d) Section 23. (unit: cm/s).
Buildings 13 00711 g020
Figure 21. Diagram of longitudinal vibration velocity change of measuring points.
Buildings 13 00711 g021
Figure 22. Change diagram of vibration velocity at measuring points of vault, hance and arch foot: (a) vault; (b) hance; and (c) arch foot. (unit: cm/s).
Buildings 13 00711 g022aBuildings 13 00711 g022b
Figure 23. Tunnel displacement model diagram.
Buildings 13 00711 g023
Figure 24. Tunnel structure deformation diagram.
Buildings 13 00711 g024
Figure 25. Tunnel displacement nephogram in X direction.
Buildings 13 00711 g025
Figure 26. Tunnel displacement nephogram in Y direction.
Buildings 13 00711 g026
Figure 27. Tunnel displacement vector synthesis nephogram.
Buildings 13 00711 g027
Figure 28. Displacement vector node displacement variation diagram.
Buildings 13 00711 g028
Figure 29. Acceleration time history curve of section 0 measurement point. (a) vault; (b) hance; (c) arch foot. (unit: cm/s2).
Buildings 13 00711 g029
Table 1. Field measured data graph.
NumberDistance (m)Vibration
Velocity (cm/s)
VxVyVzVr
1−516.4514.888.5616.33
2027.9517.8412.1627.55
3517.2213.158.4818.06
4135.223.193.446.31
5233.222.082.153.96
6019.8210.666.8618.09
706.654.323.897.35
Table 2. Linear regression result.
DirectionabKαR2
X4.771.60117.921.600.82
Y4.611.73100.481.730.78
Z3.701.2940.041.290.88
Resultant4.621.44101.491.440.84
Table 3. Sadowski attenuation formula.
Formula of Vibration Velocity AttenuationCorrelation Coefficient
V x = 117.92 ( Q 3 R ) 1.60 R 2 = 0.82
V y = 100.48 ( Q 3 R ) 1.73 R 2 = 0.78
V z = 40.04 ( Q 3 R ) 1.29 R 2 = 0.88
V r = 101.49 ( Q 3 R ) 1.44 R 2 = 0.84
Table 4. Nonlinear regression result.
DirectionKαR2
X161.551.850.89
Y81.931.530.84
Z44.481.360.78
Resultant144.181.730. 85
Table 5. Nonlinear regression Sadovski attenuation formula.
Formula of Vibration Velocity AttenuationCorrelation Coefficient
V x = 161.55 ( Q 3 R ) 1.85 R 2 = 0.89
V y = 81.93 ( Q 3 R ) 1.53 R 2 = 0.84
V z = 40.48 ( Q 3 R ) 1.36 R 2 = 0.78
V r = 144.18 ( Q 3 R ) 1.73 R 2 = 0.85
Table 6. III level surrounding rock parameters.
ρ
(kg/m3)
e
(GPa)
ν γ
(kN/m3)
c
(MPa)
σ
(MPa)
φ
2400130.275241.11.1244.5
Table 7. Concrete parameter table.
ρ
(kg/m3)
e
(GPa)
ν
Invert (C20)250025.50.2
Shotcrete (C30)250030.00.2
Secondary lining
(C35)
250031.50.2
Table 8. Comparison between the calculated vibration velocity and the measured vibration velocity.
NumberNumerical Calculation
of Velocity (cm/s)
Measured Vibration Velocity (cm/s)Percentage Error
117.2116.335.4%
228.6527.554.0%
319.5518.068.3%
47.046.3111.5%
54.223.966.6%
620.1818.0911.6%
78.337.3513.3%
Table 9. Vibration velocity of measuring point in section.
Measuring PointPeak Vibration Velocity of the Vault (cm/s)Peak Vibration Velocity of the Hance (cm/s)Peak Vibration Velocity of the Arch Foot (cm/s)
Section 0 27.5828.6530.55
Section 518.3219.5521.65
Section 13 6.887.049.56
Section 23 4.204.226.55
Disclaimer/Publisher’s Note: The statements, opinions and data contained in all publications are solely those of the individual author(s) and contributor(s) and not of MDPI and/or the editor(s). MDPI and/or the editor(s) disclaim responsibility for any injury to people or property resulting from any ideas, methods, instructions or products referred to in the content.

