Abstract
Numerical analysis is an important method for the study of seismic performance of underground structures. Current research on the seismic damage of Daikai station and the subway tunnel during the Great Hanshin earthquake mainly focuses on the dynamic time-history analysis. However, the modeling process of the dynamic time-history analysis is complicated and shows the characteristics of the enormous calculation amount, long running time and low computation efficiency. This paper briefly introduces the seismic phenomena of Daikai station and the subway tunnel during the Great Hanshin earthquake. The internal forces of Daikai station and the subway tunnel under horizontal and vertical bi-directional seismic effects are obtained by simplified seismic analysis. The pushover analyses of the columns are carried out to obtain the seismic performance curves of the columns under different vertical pressures by considering various loading and restraint conditions. Finally, the pushover analyses of the soil-structure system are carried out to reproduce the seismic damage of Daikai station and subway tunnel under horizontal and vertical bi-directional seismic effects. The results show that the computed damage is similar to the actual damage. The pushover analysis method, which considers both horizontal and vertical inertia forces of the soil, can be used to simulate the damage and study the collapse mechanism at Daikai station. Compared with the dynamic analysis, the calculation efficiency of the pushover analysis method is significantly higher; it is therefore suggested to use pushover analysis in seismic analysis of underground stations.
1. Introduction
At the early stage of underground structure construction, due to the insufficient understanding of the dynamic response characteristics of underground structures, it was usually assumed that underground facilities have better seismic performance under the restraint of the surrounding soil compared with aboveground structures. The seismic analysis theories and design methods of underground structures have been neglected for a long time [1,2,3]. However, historical data from many significant earthquakes show that underground systems face threats from earthquakes, and their seismic damage problems are prominent. One of the most typical cases is the Great Hanshin earthquake (1995, Richter scale 7.2), which damaged many underground structures like subway stations and subway tunnels in Kobe City [4]. In addition, the Kocaeli earthquake (1999, Turkey), the Chi-Chi earthquake (1999, Taiwan, China), and the Wenchuan earthquake (2008, China) all caused damage to underground structures to varying degrees [5,6,7]. The seismic problem of underground structures is also worthy of in-depth study [8,9,10,11]. At present, the seismic research of underground structures has progressed in theoretical analysis [12], model testing [13,14,15], and numerical simulation [16,17,18].
Daikai station is the first large underground structure to suffer a severe collapse in an earthquake. Since then, most seismic research work on underground structures has been made based on the seismic damage characteristics of this subway station. For the damage mechanism study of Daikai station, researchers worldwide have analyzed and explained the causes of its seismic failure from multiple perspectives based on different analysis methods, models and conditions. Iida et al. [19] concluded that due to the horizontal seismic effect, the ends of the central columns were subjected to bending and shear action to reach the ultimate strength. The damage of central columns resulted in the reduction of their bearing capacity, leading to the overall collapse of the top slab. Iwatate et al. [20] concluded that horizontal ground shaking caused shear deformation of the station structure. The strain generated in the central columns was five times higher than that in the side walls. The central columns were damaged due to insufficient shear bearing capacity and led to the collapse of the top slab based on the shaking table model test and dynamic time-history analysis. Yamato et al. [21] concluded that the strong horizontal load caused the shear capacity of the central column to reach yield and gradually produce damage; then, the vertical bearing capacity of the column slowly disappeared, and the overall compression-bending damage occurred under the continuing loadings. The above studies emphasize the effect of horizontal ground deformation on the shear damage of the underground structure. They concluded that the insufficient shear resistance of the central column was the leading cause of the deterioration of Daikai subway station. An et al. [22] concluded that the axial force variation in the central columns caused by vertical ground shaking changed the shear and deformation capacity of the columns by numerical analysis. The seismic damage of Daikai station was caused by the low shear and deformation capacity of the central columns. Targeted suggestions to improve the seismic performance of the central columns were proposed. Huo [23] compared the seismic response of Daikai station and the subway tunnel; the results showed that when equipped with an appropriate amount of hoop reinforcement, the central columns had sufficient ductility to resist the lateral displacement caused by the earthquake. Zhuang et al. [24] concluded that the plastic hinges were firstly formed at the intersection between the top slab and the side walls and the ends of the central columns during the earthquake. It caused most of the overlying soil weight to be transferred to the central columns, which caused damage to the central columns, resulting in the collapse of the top slab. Liu et al. [25] stated that under the effects of ground shaking, the overlying soil of the underground structure tends to lose structural stability. The loads on the central columns and the top slab tend to increase. The plastic hinges at the ends of the central column further develop under the combination of high axial compression and the bending moment, eventually leading to compression-bending damage and fracture. Du et al. [26] found that the overlying soil at Daikai station first showed shear damage under the strong earthquake; the inertia force of the overlying soil acted on the station structure under the vertical ground motion. The change in force distribution of the structural system led to the uncoordinated deformation capacity of the side walls and the central columns, which eventually caused the damage of the structure. Li et al. [27] and Dong et al. [28] reproduced the earthquake damage phenomenon of Daikai subway station through dynamic time-history analysis method and compared it with the real situation. These studies on the seismic damage mechanism of underground systems were verified by centrifuge shaking table tests [29,30]. This research concluded that the effect of vertical ground motion on underground structures could not be neglected. This effect significantly reduces the shear bearing and horizontal deformation capacity of critical components of underground facilities. The central column is one of the key seismic components of underground structures [31,32]. In order to reduce the seismic damage of underground structure, many seismic reduction and isolation technologies around the central column have been put forward in recent years [33,34,35].
Existing studies on the seismic damage of Daikai station and subway tunnel structures mainly employ shaking table tests and numerical simulations. The selected ground motion and material parameters vary greatly among researchers, so the conclusions are slightly different. When the dynamic time-history analysis is used to study this aspect, a complex soil-structure interaction model is required, which relates to the nonlinear material and contact properties, the complex earthquake input and boundary condition settings. As a result, the computational cost of the time-history analyses is high, especially because several seismic inputs must be considered. This paper systematically describes the seismic damage condition of Daikai station and the subway tunnel structures. Based on the actual seismic damage characteristics of Daikai station, a pushover analysis of components and the soil-structure system was carried out by selecting the material parameters commonly used in current studies. Pushover analysis method for underground structures, which considers both horizontal and vertical inertia forces of the soil, was used to evaluate the seismic damage of Daikai station and the subway tunnel. Compared with a dynamic time-history analysis method, pushover analysis method is simple in operation and efficient in calculation.
2. Observed Seismic Damage at Daikai Station
The Great Hanshin earthquake measuring 7.2 on the Richter scale occurred in Hanshin District, Japan at 5:46 a.m., 17 January 1995; the epicenter was located at 34.604° N, 135.034° E, with a source depth of about 14 km. Among the 21 subway stations distributed in five lines in Kobe City, Daikai station, Nagata station and the part of the subway tunnel in Kobe Express Railway, and Sannomiya station, Kamisawa station, Shin-Nagata station, and part of the tunnel between them on Kobe Municipal Railway suffered various degrees of seismic damage. The seismic damage showed that a total of 30 central columns in Daikai station were bent under compression.
Daikai station was built in August 1962 using the cut-and-cover method and was completed in January 1964. The station is located approximately 15 km from the epicenter of the Great Hanshin earthquake. More than 30 columns along the 120 m line in the middle of the station were utterly destroyed in the earthquake, directly causing damage to the top slab as shown in Figure 1a. The initial design of Daikai station did not consider the seismic effects. However, the design was very conservative, and the overall structural safety factor was high, especially in the central columns. Daikai station was neither across fault zones nor surrounded by liquefied soils, but it still suffered severe earthquake damage, which has caused widespread concern among researchers and engineers.
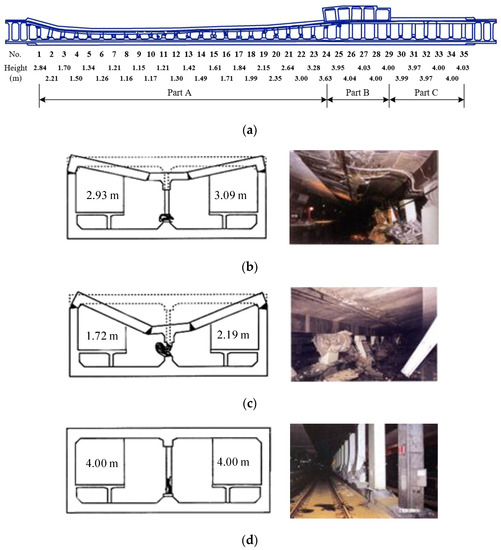
Figure 1.
Typical damage patterns in Daikai station: (a) Damage of Daikai station; (b) Column no. 2; (c) Column no. 10; (d) Column no. 31.
The station was divided into three parts along the longitudinal direction according to the characteristics of the earthquake damage. Part A (columns no. 1 to no. 24) contained a single-story, double-span structure on the side of Nagata Station. Part A witnessed the most severe earthquake damage. There were two primary forms of damage to the central columns in this part: one was the column reinforcement being roughly symmetrically crimped in the shape of a lantern, such as column no. 2 shown in Figure 1b, and the other was the column bent in one direction, such as column no. 10 in Figure 1c. The top slab in this part was twisted and collapsed downward; the overall section was shaped in an ‘M’. The longitudinal cracks within 2 m on both sides of the top slab centerline were 150–250 mm in width. The transverse cracks that appeared in the top slab were distributed roughly at equal distances along the longitudinal direction, mainly at the edge of the central columns, with a crack width of 70 mm. The concrete at the connection of the top slab and the side walls was dislodged, and the main reinforcement on the inner side was destabilized, creating cracks of 200 mm on the outer side. The tops of the side walls were tilted to the inside to some extent. Part B (columns no. 24 to no. 29) contained a double-story, four-span structure. The damage in Part B was less severe than in the other two parts, and three of the central columns in the transition area near Parts A and C suffered minor damage and showed crushing and bulging. The structural form of Part C (columns no. 29 to no. 35) was similar to area A with single-story, double-span. The damage in this part was less severe than that in Part A, as shown in Figure 1d for column no. 31. In Part C, shear damage occurred in the lower part of the central columns. The concrete spalled off, and the axial reinforcement was crimped and exposed, causing the top slab to sink about 5 cm.
3. Simplified Seismic Analysis of the Original Daikai Station
3.1. Structural Description of the Original Daikai Station
Daikai station and the subway tunnel are typical single-story double-span frame structures, whose section forms are shown in Figure 2. Among them, the width and height of Daikai station are 17 m and 7.17 m, respectively. The thickness of side walls, top slab and bottom slab is 0.7 m, 0.8 m and 0.85 m, respectively; the cross-section of the central column is rectangular with 0.4 m width and 1 m length, and the distance between central columns is 3.5 m. In terms of the subway tunnel, it has a width of 9 m and a height of 6.36 m. The thickness of side walls, top slab and bottom slab is 0.4 m, 0.4 m and 0.44 m, respectively; the cross-section of the central column is rectangular with a 0.4 m width and 0.6 m length, and the distance between central columns is 2.5 m.
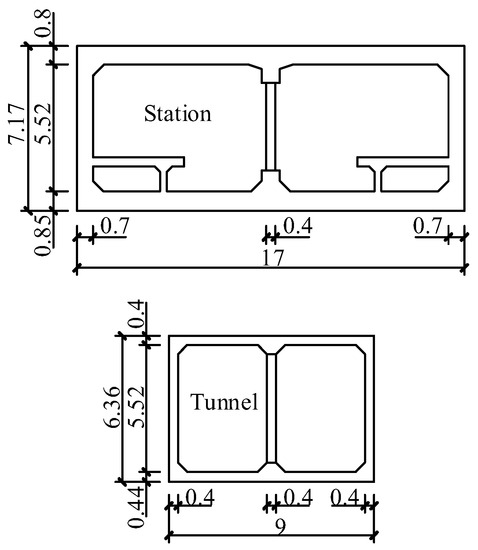
Figure 2.
Cross-section of Daikai station and subway tunnel (unit: m).
The cross-sectional reinforcement of the central columns in Daikai station and the tunnel are shown in Figure 3, and the longitudinal reinforcement ratios are comparable: 6% and 5.6%, respectively. After the earthquake, Daikai station was repaired, and the central columns were changed from the original reinforced concrete to the current combination of three square concrete-filled steel tubes (CFSTs). The length and width of the steel tube are both 450 mm, and the thickness is 12 mm. It can be seen from Figure 3 that the cross-sectional size and reinforcement rate of the new central columns are larger than those in the original Daikai station. In addition, the cross-sectional dimensions and reinforcement ratios of the structural components in the original Daikai station and the tunnel are shown in Table 1.
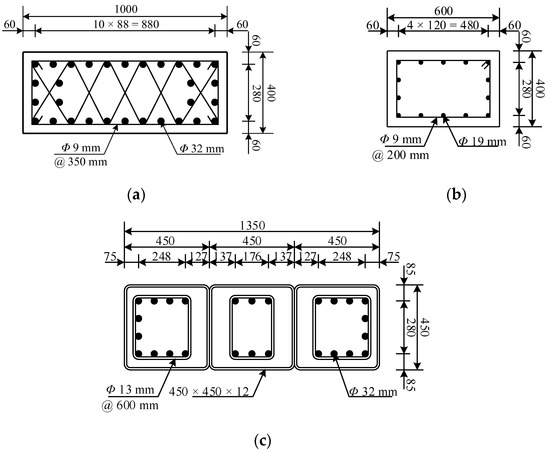
Figure 3.
Section reinforcement of columns in original structures and the new station (unit: mm): (a) Reinforcement of columns in the original station; (b) Reinforcement of columns in the original tunnel; (c) Reinforcement of columns in the new station.

Table 1.
Section size and reinforcement of components.
3.2. Internal Forces
Response displacement method (RDM) is a practical method for seismic design of underground structures. Foundation springs are introduced in this method to reflect the interaction between structure and soil since there are differences in stiffness between them. Liu et al. [36] established the integral response displacement method (IRDM) and directly established the integral analysis model of soil and structure. To further consider the vertical inertial force of the overlying soil, Xu et al. [37] proposed the vertical inertia force-response displacement method (VIF-RDM) and integral vertical inertia force-response displacement method (IVIF-RDM). The calculation models discard the foundation springs of the top slab and consider the vertical inertia force of the overlying soil, which can more realistically reflect the characteristics of the load effect of the accumulation or shear damage of the overlying soil under strong earthquakes. As a result, the internal forces of shallow-buried underground structures under horizontal and vertical bi-directional seismic loads can be evaluated more rationally.
With reference to the ground motion parameters and site parameters given by Xu et al. [37], the internal force responses of station structures and tunnel structures can be obtained by the above two simplified analysis methods. The internal force results are shown in Table 2. From the calculation model of the conventional response displacement method, it is known that for the single-story double-span Daikai station and subway tunnel structures, the loads are considered to be antisymmetric, so the axial force of the central column is 0. From the calculation results in Table 2, it can be seen that the most important difference between the traditional response displacement methods VIF-RDM and IVIF-RDM is the magnitude of the axial force applied to the central columns. In VIF-RDM, the axial forces in central columns are not negligible because of the vertical inertia force effect of the overlying soil and the structure itself. According to the design code for underground facilities in Japan at that time (without considering the impact of seismic effect), the design value of the axial force within the central column under static load in Daikai station was 4410 kN [21]. In the case of static analysis considering only gravity load without seismic effect, the axial forces at the bottom of the side walls and central columns in Daikai station are 2028.04 kN and 3367.53 kN, respectively. In contrast, the axial forces in the subway tunnel are 1065.51 kN and 1243.31 kN, respectively. When ground motion obtained from Kobe University is used for the calculation, the axial force in the column at Daikai station is 792.78 kN/m × 3.5 m = 2774.73 kN by VIF-RDM, which is about 82% of the static analysis. In comparison, it is 755.42 kN/m × 3.5 m = 2643.97 kN by IVIF-RDM, which is about 79% of the static analysis. The axial force in the column of the subway tunnel is 384.18 kN/m × 2.5 m = 960.45 kN by VIF-RDM, which is about 77% of the static analysis; while it is 365.76 kN/m × 2.5 m = 914.40 kN by IVIF-RDM, which is about 74% of the static analysis. In other words, considering the inertia effect generated by the overlying soil under the vertical earthquake will change the axial compression of the central columns to a greater extent. The increased axial force is not negligible compared with the static analysis. It might increase the axial compression ratio of the central columns by 80%, which leads to the deterioration of the seismic performance, especially in the deformation capacity of the central columns.
Table 2.
Section force of the central column by different analysis methods.
4. Pushover Analysis of the Original and New Central Columns
4.1. Analysis Method
For above-ground structures, when pushover analysis is performed on the structural components, a certain vertical pressure is applied first to make them reach a predetermined axial compression ratio. Then the components are loaded step by step through force or displacement-based control until they are damaged. The loading pattern is shown in Figure 4a. However, this loading mode is not suitable for direct use in the pushover analysis of columns in underground structures. It has been shown that the rotational freedom at the top of the central column is constrained mainly due to the restraining effect of the overlying soil and the top slab. Therefore, to truly reflect the deformation behavior of the central columns during the earthquake, a rotation constraint is applied to the top of the model during the pushover analysis of the central column. The loading pattern is shown in Figure 4b.
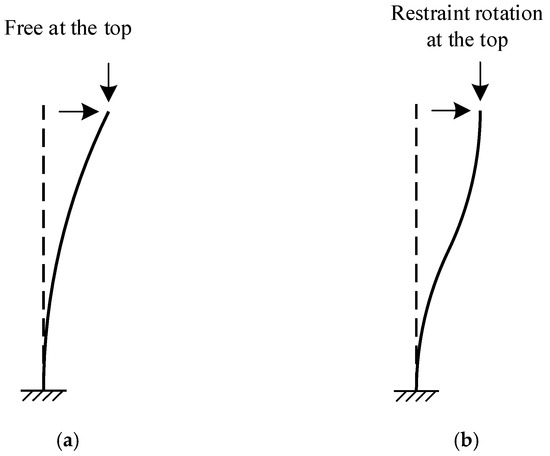
Figure 4.
Pushover modes of the central column: (a) Mode 1; (b) Mode 2.
4.2. FEM and Material Parameters
The finite element models based on ABAQUS of the original and the new central columns in pushover analysis are shown in Figure 5, respectively. The calculation ranges of all the models were selected as single-span structures, i.e., 3.5 m for Daikai station and 2.5 m for the subway tunnel. In addition, it should be noted that since only the damage of the central column was considered during the pushover in this section, the concrete in the ends of columns, including slab and beam sections, was modeled elastically without considering the corresponding reinforcing cage. The central columns were simulated using the plastic damage model, and the material properties are shown in Figure 6 [38]. The model considers the reduction of strength and stiffness of concrete after tension and compression by introducing tensile damage factor and compression damage factor. In addition, an ideal elastoplastic model was used for the steel bars, with an initial elastic modulus of 200 GPa and yield stress of 235 MPa. The seismic damage survey of Daikai station showed that the design strength of concrete used in the central column and other structural components was 23.52 MPa and 20.58 MPa, respectively. The concrete and reinforcement material parameters selected in this study were taken to restore the actual situations as far as possible. The reinforcing cages embedded in the concrete are shown in Figure 5, and it was assumed that there was no bond-slip between them. The steel tube and concrete intersection locations share the same nodes in the finite element model of the new station. The concrete and steel tube parameters used in the new station are the same as in the original Daikai station. During the pushover of the central columns, the model’s bottom was fixed and the top was applied with rotational restraint. Then, the vertical pressure is applied according to the axial compression ratio corresponding to different working conditions of central columns. Subsequently, a step-by-step horizontal displacement loading was performed at the top of the models.
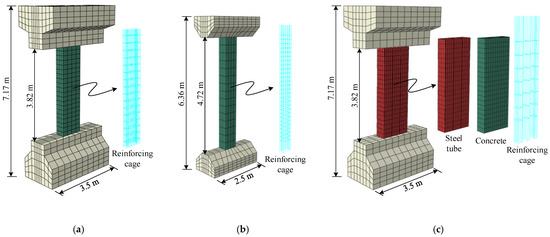
Figure 5.
Finite element models of central columns: (a) Original station; (b) Original tunnel; (c) New station.
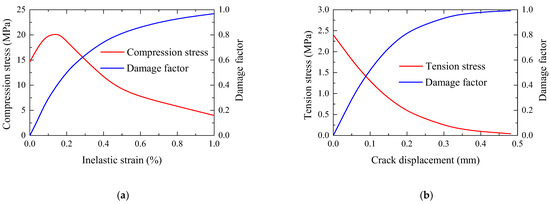
Figure 6.
Material parameters of concrete: (a) Compressive behavior; (b) Tensile behavior.
4.3. Analysis Results
It’s known that the station structure has larger transverse and longitudinal spans than the tunnel. The axial compression ratios of the central columns in Daikai station and the subway tunnel under gravity were 0.59 and 0.36, respectively. However, after considering the vertical ground motion effect, the corresponding axial compression ratios of columns increased to 1.05 and 0.63, respectively. Therefore, in the horizontal pushover analysis of the central columns, an appropriate vertical pressure needs to be applied at the top of the model to obtain the mentioned axial compression ratios. The force-displacement curves of each central column in pushover analysis are shown in Figure 7. From Figure 7a, it can be seen that the force-displacement curves of the columns in the original Daikai station show significant differences under the axial pressure ratio of 0.59 and 1.05. When considering the inertia forces of overlying soil and the structure caused by vertical ground motion, the peak load and ultimate displacement (defined here as the displacement corresponding to 85% of the peak load) of the central column under an axial compression ratio of 1.05 are significantly lower than that of 0.59. For the central column with an axial compression ratio of 0.59, when the horizontal displacement is 46 mm, the load reaches a peak value of 580 kN. The lateral displacement rate of the central column is about 1/147 at this time, after which the horizontal load does not show an apparent downward trend but shows good ductility performance. In contrast, for the case where the axial compression ratio of the central column is 1.05, the horizontal load reaches the peak of 528 kN when the horizontal displacement comes to 37 mm. At this time, the lateral displacement rate of the central column is about 1/183. After that, the force-displacement curve shows obvious decline. When the displacement is about 55 mm (the lateral displacement rate is about 1/123), the horizontal thrust force drops to 85% of the peak value. At this time, the central column can be considered to have failed.
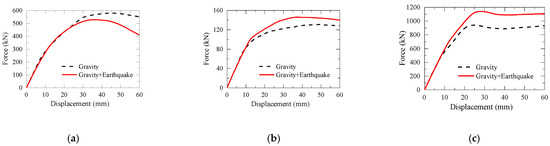
Figure 7.
Force-displacement curves of columns under different compression loads: (a) Original station; (b) Original tunnel; (c) New station.
The force-displacement curves of the column in the subway tunnel under different vertical pressures are shown in Figure 7b. It can be seen that although the inertia force caused by vertical ground motion is considered, the axial compression ratio only increases from 0.36 to 0.63. In other words, the axial compression ratio of the columns in the tunnel after considering the vertical inertia force is comparable to that when only gravity is considered. Therefore, the force-displacement curves of the columns in the tunnel for axial compression ratios of 0.36 and 0.63 show the same trend: both maintain a long period of deformation capacity after the peak load and deliver good ductility performance.
The force-displacement curves of the central columns in the new station under different vertical pressures are shown in Figure 7c. Although the same vertical pressure was applied at the top of the model as in the central column model of the original station, the CFST central column under high axial pressure did not show the damage of ordinary reinforced concrete. When the axial compression ratio is 1.05, the peak horizontal load of the central column in the new station is 1139.57 kN, which is about twice the peak value in the original station under the same loading condition. It can be seen that the shear bearing capacity of the central column can be improved to a great extent by adopting CFST. After the peak load, the CFST column can still maintain an excellent lateral force capacity, and the force-displacement curve does not show an apparent decreasing trend. This performance is similar to the regular reinforced concrete column under low axial pressure. The central column of CFSTs in the new station can be considered to have good ductility performance.
Further analysis of the central column in Daikai station reveals that the central column mainly carries the gravity of the overlying soil. The column has an axial compression ratio close to 0.6 at the initial loading stage, and then the value increases to 1.05 after considering the vertical ground motion. According to the bearing capacity curve of the compression-bending section, it is known that the high axial compression reduces not only the bending bearing but also the plastic rotation capacity of the component section. The plastic hinges will occur after the bending moment of the section reaches the bearing capacity. The bearing capacity of the structural component decreases sharply until the eventual damage. In general, it can be preliminarily found that the axial compression ratio of the central column becomes more significant due to the inertia force of overlying soil and the structure under vertical ground motion by the pushover analysis for Daikai station and tunnel. The brittle damage with insufficient ductility in the central column of the original Daikai station with a high axial compression ratio adversely affects the overall seismic performance of the station, which might be one of the leading causes of the collapse of Daikai station in the Great Hanshin earthquake. In contrast, the damage by insufficient ductility of the central column does not occur under the corresponding axial compression in the tunnel and the new station. Still, it maintains a certain lateral force resistance after the peak horizontal thrust. Therefore, the tunnel did not experience damage similar to that of Daikai station during the earthquake.
5. Pushover Analysis of Soil-Structure System
5.1. Analysis Method
In the traditional pushover analysis for underground structures, the loading of the soil-structure system in a vertical direction includes only gravity. Then, horizontal inertial forces are applied to the system step by step until the final damage [39]. Section 4 shows that the seismic performance of reinforced concrete columns varies significantly under different axial pressures. When the axial compression ratio is too large, brittle damage with insufficient deformation capacity may occur in the reinforced columns. Therefore, the vertical loads, including gravity and vertical seismic effect, are considered in the pushover analysis of the soil-structure system, herein referred to as the pushover analysis method [40]. The force characteristics of the structure under horizontal and vertical seismic effects are achieved by applying corresponding inertia forces in a specific distribution form to the soil-structure system. Considering the small contribution of the structural inertia to its seismic response, linearly distributed inertia force along the vertical direction is applied only to the surrounding soil in the soil-structure system. The loading modes of the pushover analysis methods are shown as mode 1 and mode 2 in Figure 8, respectively. The horizontal loads of the two modes are the same, both applying horizontal inertia forces step by step in the form of inverted triangular distribution. However, the main difference lies in the vertical load, with mode 2 including vertical earthquake load and gravity. Xu et al. [37] proposed to equate the central columns into a soil body of a specific range; then the vertical acceleration distribution of the site soil can be obtained by analyzing the vertical seismic response of the equivalent one-dimensional site.
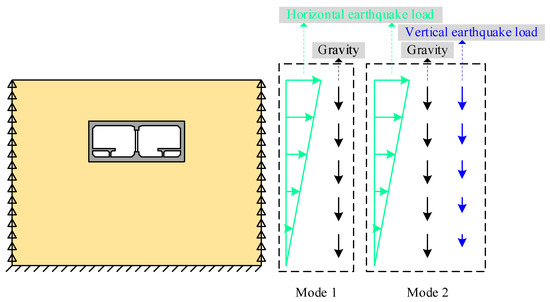
Figure 8.
Pushover modes of soil-structure system.
5.2. FEM and Material Parameters
The bottom boundary of the finite element model in pushover analysis is taken to the bedrock, i.e., the model height is taken as 39.2 m. The longitudinal dimensions of the station models are taken as five times the spacing of the central columns, i.e., 17.5 m for Daikai station model and 12.5 m for the subway tunnel model. The lateral dimensions of the station models are taken as seven times the width of the structure, i.e., 119 m for Daikai station model and 63 m for the tunnel model. Figure 9 shows the cross-section of the finite element model and the material parameters of the soil. To consider the property that the shear modulus of the soil decreases gradually with the increase of shear strain, the Davidenkov model [38] is used in the pushover analysis. The variation of the shear modulus ratio with shear strain is shown in Equation (1).
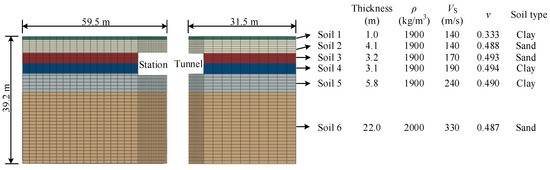
Figure 9.
Cross-section of finite element model of soil.
Herein, G and γ are shear modulus and shear strain, respectively; Gmax is the maximum shear modulus; A, B and γ0 are fitting parameters related to soil properties, which are shown in Figure 10.
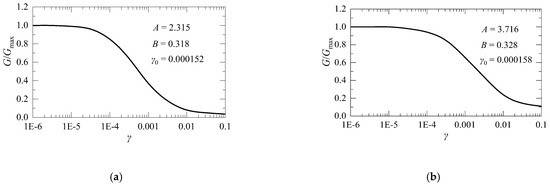
Figure 10.
Stiffness parameters of soil: (a) Shear modulus ratio-shear strain curve of sand; (b) Shear modulus ratio-shear strain curve of clay.
The pushover analysis is a pseudo-static method with no damping being involved in the numerical calculation. The shear modulus ratio-shear strain curves for different types of soils are given in Figure 10. The 3D finite element models of the original Daikai station, the original subway tunnel and the new Daikai station are shown in Figure 11. It is difficult to strictly restore the reinforcement of the actual Daikai station and the tunnel during the model establishment, so the side walls and the slabs are modeled according to Table 1, making it as close to the actual situation as possible. In the finite element model of the central column, the material parameters of the reinforcement and concrete are identical to the previous Section 4.2.
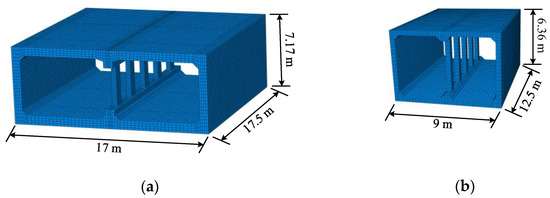
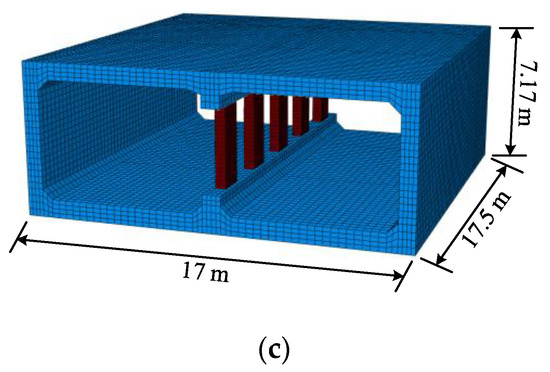
Figure 11.
Finite element models of Daikai station and tunnel: (a) Original station; (b) Original tunnel; (c) New station.
The reinforcement is embedded inside the concrete, and the bond-slip between them is not considered. Dynamic contact is used at the location of the soil-structure intersection, i.e., detachment along the normal direction is allowed between the soil and the structure. At the same time, the sliding friction with a coefficient equal to 0.4 is set in the tangential direction. As for the boundary conditions, the model’s bottom is fixed, and the lateral boundary nodes are assigned to couple the degrees of freedom in each direction. The front and rear boundaries are constrained to limit the out-of-plane displacement.
5.3. Analysis Results
The bending moment-curvature curves of the central columns in different structures are shown in Figure 12. From Figure 12a, it can be seen that the bending moment of the bottom section in the central column keeps increasing with the increase of curvature when the gravity is the only vertical load. The moment-curvature curves under different pressures witness a similar tendency until the steel yields. The curves present higher bearing capacity after considering the vertical ground motion, with the peak of the curves corresponding to larger moment values. However, after the peak bending moment, the moment-curvature curve shows a significant downward segment. The curvature is about 1/73 when the bending moment drops to 85% of the peak value. The level of curvature at this time coincides with the elastic-plastic working state of the underground structure as defined by Zhuang et al. [41] and Du et al. [42]. The trends of the moment-curvature curves indicate a significant deficit in the deformation capacity of the central columns after considering the vertical ground motion. It can be seen from Figure 12b that the difference in the load-bearing and deformation capacity under two different vertical pressures of the columns in the tunnel is not significant. Even when the effect of vertical ground motion is considered, there is no such brittle damage as the columns in Daikai station. Figure 12c shows the pushover curves of the new station. The moment bearing capacity of the central column is significantly improved due to the adoption of the square CFST combination structure. Beyond the peak bearing capacity, the moment-curvature curve can maintain a high bearing capacity status without a declining section, thus ensuring the structural safety of the new station.
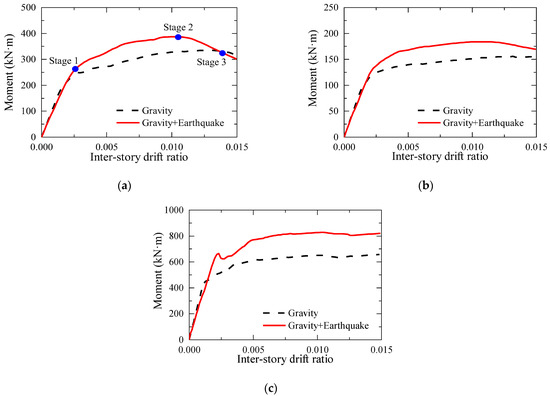
Figure 12.
Bending moment-curvature curves of columns under different compression load: (a) Original station; (b) Original tunnel; (c) New station.
Comprehensive analysis of pushover results of the column and soil-structure system can come to the same conclusion: the central columns need to bear higher pressure when the gravity and vertical seismic effect are considered simultaneously. Although the bending capacity of the central columns is improved, the deformation capacity is reduced to a large extent, which is unfavorable to the overall seismic performance of the station structure.
Figure 13 shows the compressive and tensile damage of the concrete; Figure 14 shows the equivalent plastic strain of the column and steel during the pushover process when considering the inertia force of the overlying soil caused by vertical ground motion. In Stage 1, the reinforcement of the central column was in elastic working condition. The concrete of the central column showed minor compressive damage, and some tensile damage occurred at the middle of the two spans in the top slab. During the transition from Stage 1 to Stage 2, the reinforcement in the central columns started to yield. The damage in the central column further increased, and the concrete at the ends of the side walls also showed considerable tensile damage. In the course of Stage 2 to Stage 3, the equivalent plastic strain of the central column reached 0.38%, which can be considered to exceed the ultimate compressive strain of the concrete, at which point the concrete of the central column was damaged. Thereafter, suppose further horizontal loading is applied to the soil-structure system; in this case, the structure would experience the damage phenomenon shown in Figure 13d, with the central column eventually being completely crushed, the top concrete of the side walls showing severe tensile damage, and the top slab then being collapsed.
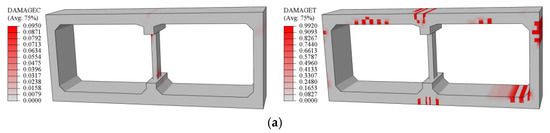
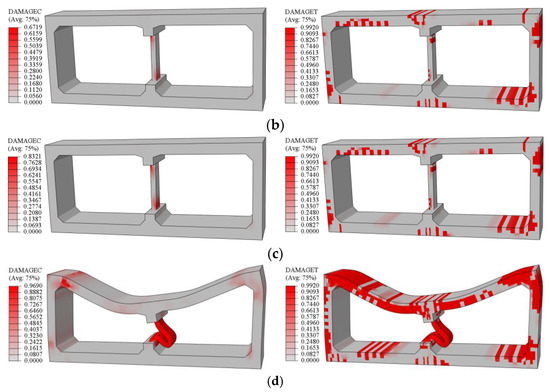
Figure 13.
Compressive and tensile damage of the concrete during pushover: (a) Stage 1; (b) Stage 2; (c) Stage 3; (d) Stage 4.
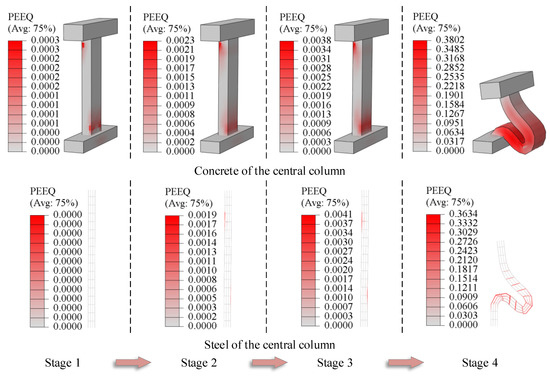
Figure 14.
Equivalent plastic strain of the column and steel during pushover.
Figure 15 compares the actual seismic damage and the final pushover state of structures under different vertical pressures. It should be noted that the pushover analysis is still available because there is no severe damage in the original station (under gravity) and the new station (under gravity and earthquake). The final pushover state described here corresponds to the collapse moment of the original Daikai station under gravity and vertical inertia force. The horizontal inertial forces exerted in the numerical simulation models listed in Figure 15 are identical. It can be seen that when considering both gravity and vertical inertia force, the seismic damage exhibited in Daikai station with ordinary reinforced concrete is similar to the actual situation. However, the application of CFSTs in the central column can effectively avoid seismic disasters.
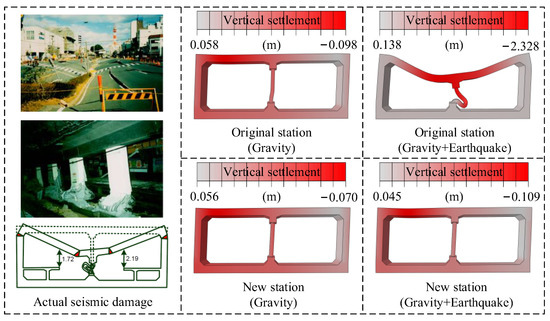
Figure 15.
Comparison of actual seismic damage and numerical simulation result.
6. Conclusions
This paper focuses on Daikai subway station, which suffered serious collapse during the Great Hanshin earthquake. The seismic performance curves of different central columns are obtained by pushover analysis method, and the seismic damage phenomenon and damage mechanism of Daikai subway station are reproduced by the pushover analysis of soil-structure system. The conclusions are summarized as follows:
- The pseudo-static pushover analysis reproduces the seismic damage of Dakai subway station by applying horizontal and vertical inertial forces to the soil, and reveals its failure mechanism. Compared with the dynamic time-history analysis method, this method is simple in operation and efficient in calculation for the single-layer double-span structure.
- When considering the effect of vertical ground motion, the axial compression ratio of the central columns in Daikai station increases significantly. The performance curves of the central columns obtained from the pushover process at both component and structural levels show brittle damage. In other words, the deformation capacity of the central column in the original Daikai station with ordinary reinforced concrete under a high axial compression ratio is insufficient. Finally, it causes the overall collapse of the structure.
- In contrast, the lateral and longitudinal span of the subway tunnel is much smaller than that of Daikai station. Even under the consideration of the vertical ground motion, the axial force of the central columns in the tunnel is not large, and it still maintains good ductility under horizontal load. Therefore, severe damage to the subway tunnel structure does not appear.
- The central columns of the new Daikai station equipped with concrete-filled steel tube exhibit high bearing capacity and ductility performance even under a large axial compression ratio. No collapse like the original subway occurred under the same seismic load in the new station, thereby significantly improving the structural seismic performance.
Author Contributions
Conceptualization, Y.Y. and Z.X.; methodology, J.C.; software, R.Q.; writing—original draft preparation, Y.Y.; writing—review and editing, Z.X.; visualization, R.Q.; supervision, Z.X. All authors have read and agreed to the published version of the manuscript.
Funding
This research was funded by the Natural Science Foundation of Jiangxi Province (2021BAB214014) and the Technology Project of Department of Transportation of Jiangxi Province (2021Z0004).
Data Availability Statement
Not applicable.
Conflicts of Interest
The authors declare no conflict of interest.
References
- Amorosi, A.; Boldini, D. Numerical modelling of the transverse dynamic behaviour of circular tunnels in clayey soils. Soil Dyn. Earthq. Eng. 2009, 29, 1059–1072. [Google Scholar] [CrossRef]
- Cilingir, U.; Madabhushi, S.P.G. Effect of depth on the seismic response of square tunnels. Soils Found. 2011, 51, 449–457. [Google Scholar] [CrossRef]
- Tsinidis, G. Response characteristics of rectangular tunnels in soft soil subjected to transversal ground shaking. Tunn. Undergr. Space Technol. 2017, 62, 1–22. [Google Scholar] [CrossRef]
- Du, X.; Li, Y.; Xu, C.; Lu, D.; Xu, Z.; Jin, L. Review on damage causes and disaster mechanism of Daikai subway station during 1995 Osaka-Kobe Earthquake. Chin. J. Geotech. Eng. 2018, 40, 223–236. [Google Scholar]
- Elnashai, A.S. Analysis of the damage potential of the Kocaeli (Turkey) earthquake of 17 August 1999. Eng. Struct. 2000, 22, 746–754. [Google Scholar] [CrossRef]
- Wang, W.L.; Wang, T.T.; Su, J.J.; Lin, C.H.; Huang, T.H. Assessment of damage in mountain tunnels due to the Taiwan Chi-Chi Earthquake. Tunn. Undergr. Space Technol. 2001, 16, 133–150. [Google Scholar] [CrossRef]
- Li, T. Damage to mountain tunnels related to the Wenchuan earthquake and some suggestions for aseismic tunnel construction. Bull. Eng. Geol. Environ. 2012, 71, 297–308. [Google Scholar] [CrossRef]
- Hashash, Y.M.A.; Hook, J.J.; Schmidt, B.; Yao, J.I.-C. Seismic design and analysis of underground structures. Tunn. Undergr. Space Technol. 2001, 16, 247–293. [Google Scholar] [CrossRef]
- Huo, H.; Bobet, A.; Fernández, G.; Ramírez, J. Load transfer mechanisms between underground structure and surrounding ground: Evaluation of the failure of the Daikai station. J. Geotech. Geoenviron. Eng. 2005, 131, 1522–1533. [Google Scholar] [CrossRef]
- Chen, C.H.; Wang, T.T.; Jeng, F.S.; Huang, T.H. Mechanisms causing seismic damage of tunnels at different depths. Tunn. Undergr. Space Technol. 2012, 28, 31–40. [Google Scholar] [CrossRef]
- Debiasi, E.; Gajo, A.; Zonta, D. On the seismic response of shallow-buried rectangular structures. Tunn. Undergr. Space Technol. 2013, 38, 99–113. [Google Scholar] [CrossRef]
- Penzien, J. Seismically induced racking of tunnel linings. Earthq. Eng. Struct. Dyn. 2000, 29, 683–691. [Google Scholar] [CrossRef]
- Moss, R.E.S.; Crosariol, V.A. Scale model shake table testing of an underground tunnel cross section in soft clay. Earthq. Spectra 2013, 29, 1413–1440. [Google Scholar] [CrossRef]
- Kawamata, Y.; Nakayama, M.; Towhata, I.; Yasuda, S. Dynamic behaviors of underground structures in E-Defense shaking experiments. Soil Dyn. Earthq. Eng. 2016, 82, 24–39. [Google Scholar] [CrossRef]
- Ma, X.; Wang, G.; Wu, J.; Ji, Q. Experimental study on the seismic response of subway station in soft ground. J. Earthq. Tsunami 2017, 11, 1750020. [Google Scholar]
- Zhuang, H.; Hu, Z.; Wang, X.; Chen, G. Seismic responses of a large underground structure in liquefied soils by FEM numerical modelling. Bull. Earthq. Eng. 2015, 13, 3645–3668. [Google Scholar] [CrossRef]
- Xu, Z.; Du, X.; Xu, C.; Hao, H.; Bi, K.; Jiang, J. Numerical research on seismic response characteristics of shallow buried rectangular underground structure. Soil Dyn. Earthq. Eng. 2019, 116, 242–252. [Google Scholar] [CrossRef]
- Xu, Z.; Zhuang, H.; Xia, Z.; Yang, J.; Bu, X. Study on the effect of burial depth on seismic response and seismic intensity measure of underground structures. Soil Dyn. Earthq. Eng. 2023, 166, 107782. [Google Scholar] [CrossRef]
- Iida, H.; Hiroto, T.; Yoshida, N.; Iwafuji, M. Damage to Daikai subway station. Soils Found. 1996, 36, 283–300. [Google Scholar] [CrossRef] [PubMed]
- Iwatate, T.; Kobayashi, Y.; Kusu, H.; Rin, K. Investigation and shaking table tests of subway structures of the Hyogoken-Nanbu earthquake. In Proceedings of the 12th World Conference on Earthquake Engineering, Auckland, New Zealand, 30 January–4 February 2000. [Google Scholar]
- Yamato, T.; Umehara, T.; Aoki, H.; Nakamura, S.; Ezaki, J.; Suetomi, I. Damage to Daikai subway station of Kobe rapid transit system and estimation of its reason during the 1995 Hyogoken-Nanbu earthquake. Doboku Gakkai Ronbunshu 1996, 1996, 303–320. [Google Scholar] [CrossRef] [PubMed]
- An, X.; Shawky, A.A.; Maekawa, K. The collapse mechanism of a subway station during the Great Hanshin earthquake. Cem. Concr. Compos. 1997, 19, 241–257. [Google Scholar] [CrossRef]
- Huo, H. Seismic Design and Analysis of Rectangular Underground Structures; Purdue University: West Lafayette, IN, USA, 2005. [Google Scholar]
- Zhuang, H.Y.; Cheng, S.G.; Chen, G.X. Numerical simulation and analysis of earthquake damages of Dakai metro station caused by Kobe earthquake. Rock Soil Mech. 2008, 29, 245–250. [Google Scholar]
- Liu, J.; Liu, X. Pushover analysis of Daikai subway station during the Osaka-Kobe earthquake in 1995. In Proceedings of the 14th World Conference on Earthquake Engineering, Beijing, China, 12–17 October 2008. [Google Scholar]
- Du, X.; Xu, Z.; Xu, C. Inertia force-displacement method for seismic analysis of shallow buried underground structures. Chin. J. Geotech. Eng. 2018, 40, 583–591. [Google Scholar]
- Li, W.; Chen, Q. Seismic performance and failure mechanism of a subway station based on nonlinear finite element analysis. KSCE J. Civ. Eng. 2018, 22, 765–776. [Google Scholar] [CrossRef]
- Dong, R.; Jing, L.; Li, Y.; Yin, Z.; Wang, G.; Xu, K. Seismic deformation mode transformation of rectangular underground structure caused by component failure. Tunn. Undergr. Space Technol. 2020, 98, 103298. [Google Scholar] [CrossRef]
- Che, A.; Iwatate, T. Shaking table test and numerical simulation of seismic response of subway structures. In Structures Under Shock and Impact VII; WIT Press: Southampton, UK, 2002; p. 10. [Google Scholar]
- Xu, C.; Zhang, Z.; Li, Y.; Du, X. Validation of a numerical model based on dynamic centrifuge tests and studies on the earthquake damage mechanism of underground frame structures. Tunn. Undergr. Space Technol. 2020, 104, 103538. [Google Scholar] [CrossRef]
- Parra-Montesinos, G.J.; Bobet, A.; Ramirez, J.A. Evaluation of soil-structure interaction and structural collapse in Daikai subway station during Kobe earthquake. ACI Struct. J. 2006, 103, 113. [Google Scholar]
- Ma, C.; Lu, D.-C.; Du, X.-L.; Qi, C.-Z.; Zhang, X.-Y. Structural components functionalities and failure mechanism of rectangular underground structures during earthquakes. Soil Dyn. Earthq. Eng. 2019, 119, 265–280. [Google Scholar] [CrossRef]
- Chen, Z.Y.; Chen, W.; Bian, G.Q. Seismic performance upgrading for underground structures by introducing shear panel dampers. Adv. Struct. Eng. 2014, 17, 1343–1357. [Google Scholar] [CrossRef]
- Ma, C.; Lu, D.; Du, X. Seismic performance upgrading for underground structures by introducing sliding isolation bearings. Tunn. Undergr. Space Technol. 2018, 74, 1–9. [Google Scholar] [CrossRef]
- Xu, Z.; Du, X.; Xu, C.; Han, R. Numerical analyses of seismic performance of underground and aboveground structures with friction pendulum bearings. Soil Dyn. Earthq. Eng. 2020, 130, 105967. [Google Scholar] [CrossRef]
- Liu, J.B.; Wang, W.H.; Zhao, D.D.; Zhang, X.B. Integral response deformation method for seismic analysis of underground structure. Chin. J. Rock Mech. Eng. 2013, 32, 1618–1624. [Google Scholar]
- Xu, Z.; Du, X.; Xu, C.; Jiang, J.; Han, R. Simplified equivalent static methods for seismic analysis of shallow buried rectangular underground structures. Soil Dyn. Earthq. Eng. 2019, 121, 1–11. [Google Scholar] [CrossRef]
- Zhuang, H.Y.; Chen, G.X.; Liang, Y.X.; Xu, M. A developed dynamic viscoelastic constitutive relations of soil and implemented by ABAQUS software. Rock Soil Mech. 2007, 28, 436–442. [Google Scholar]
- Liu, J.; Wang, W.; Dasgupta, G. Pushover analysis of underground structures: Method and application. Sci. China Technol. Sci. 2014, 57, 423–437. [Google Scholar] [CrossRef]
- Jiang, J.; Xu, C.; Naggar, H.; Du, X.; Assaf, J. Improved pushover method for seismic analysis of shallow buried underground rectangular frame structure. Soil Dyn. Earthq. Eng. 2021, 140, 106363. [Google Scholar] [CrossRef]
- Zhuang, H.Y.; Ren, J.W.; Wang, W.; Miao, Y.; Chen, G.X. Elasto-plastic working states and seismic performance levels of frame-type subway underground station with two layers and three spans. Chin. J. Geotech. Eng. 2019, 41, 131–138. [Google Scholar]
- Du, X.; Jiang, J.; Naggar, M.H.E.; Xu, C.; Xu, Z. Interstory drift ratio associated with performance objectives for shallow-buried multistory and span subway stations in inhomogeneous soil profiles. Earthq. Eng. Struct. Dyn. 2021, 50, 655–672. [Google Scholar] [CrossRef]


Disclaimer/Publisher’s Note: The statements, opinions and data contained in all publications are solely those of the individual author(s) and contributor(s) and not of MDPI and/or the editor(s). MDPI and/or the editor(s) disclaim responsibility for any injury to people or property resulting from any ideas, methods, instructions or products referred to in the content. |
© 2023 by the authors. Licensee MDPI, Basel, Switzerland. This article is an open access article distributed under the terms and conditions of the Creative Commons Attribution (CC BY) license (https://creativecommons.org/licenses/by/4.0/).