Abstract
In the context of a single-tower cable-stayed bridge, the effects of the ambient temperature change, stiffness degradation of the main beam and cable damage on the deflection of the main girder under the action of self-weight are investigated. To explore the possibility of identifying cable damage based on the deflection of the main girder, the results show that before and after the cable damage, the variation of the deflection difference of the girder has obvious characteristics: under the action of dead weight, the distribution curve of the deflection difference of the girder is obviously twisted at the anchorage point of the damaged cable and reaches a peak, and the peak value increases with the increase of the cable damage degree. The deterioration of the girder’s performance will make the change of the girder’s deflection more sensitive to the cable damage. The ambient temperature change has a great influence on the deflection of the girder but has no obvious influence on the deflection difference of the girder before and after the cable damage.
1. Introduction
The cables are the main force component of the cable-stayed bridge and also are the most easily damaged component. Because the bridge structure is affected by various loads and external environment during the service period, the cables of cable-stayed bridge may suffer different forms of damage such as corrosion or broken wires. Once a cable is damaged, the cable force will change, and then the deflection of the girder will change. The girder’s deflection is an important control index to characterize the overall performance of the bridge and also an important parameter to be checked in bridge inspection. However, the change of the girder’s deflection is the result of many factors. How to highlight the change characteristics of the girder’s deflection caused by the cable damage is the primary problem to be solved in the research of identifying the cable damage of the cable-stayed bridges based on the girder’s deflection.
The variation of girder deflection is the result of various factors, such as degradation of the girder’s stiffness, change of the temperature, the cable’s stiffness (cable damage) and the initial tension etc. Based on the monitoring data of the deflection and the cable force, Liang et al. [1,2] analyzed the sensitivity of the main girder’s deflection to the cable damage of Shenzhen Bay Highway Bridge and believed that the main span deflection of the bridge is more sensitive to the cable damage but do not analyze the influence of the degradation of the girder’s stiffness and the change of the temperature on the deflection of the main girder.
Taking a single tower cable-stayed bridge as the research object, Wang et al. [3,4,5] analyzed the influence of the construction loads, the overall bridge’s stiffness, the shrinkage and creep of the concrete, the overall temperature change and other factors on the deflection and stress of the girder body of the completed bridge. The results show that the structural dead weight and the overall temperature change have the greatest influence on the deflection and the cable force of the main girder of the cable-stayed bridge, while the other factors have no obvious influence. Zhu et al. [6] studied the influence of various parameters on the alignment of the main girder in the completed state of cable-stayed bridge and believed that the bulk weight of the main girder, the initial tension of the cable, the annual temperature difference, the tower-girder temperature difference and cable–girder temperature difference have a great influence on the alignment of the main girder, and the midspan alignment of the main girder has the greatest change. The influence of overall temperature and cable–girder temperature difference on the distribution law of the girder’s deflection difference before and after the cable damage is considered [7,8].
Cable damage can also cause variation of axial forces in cables [9,10]. Marzuki et al. [11] studied the influence of the loss of pre-stress force of the cables on the cable-net structure. Based on the principle of superposition, Wang et al. studied [12,13] the relationship between the static deflection change and the cable force, identifying the damage of the hanger in arch bridges. The cable damage can be evaluated by measuring the change of cable force or cable stress [14,15,16].
Based on the microstructural mechanical model of damaged multi-wire cable, Xu et al. [17] proposed an analytical method for the static and dynamic characteristics of cables with broken wires. Their research shows that that an increase in the number of symmetrical broken wires linearly decreases the horizontal component of cable tension in piecewise, linearly increases the sag and decreases the in-plane natural broken wire damage, while the horizontal component of cable tension and natural frequency are not sensitive to the location of the broken wire damage.
The above references do not involve the research on the influence of cable damage (temperature action) on the deflection distribution law of the main beam. This paper takes a single tower cable-stayed bridge as the research object, intending to analyze the influence of the cable damage (different degrees of the cable damage at different positions) and other factors (the ambient temperature change, stiffness degradation of the main beam and cable damage) on the change of the girder’s deflection and its distribution law. It lays a foundation for the research of cable damage identification based on beam deflection.
2. The Relationship between the Deflection and Damage Cable Force
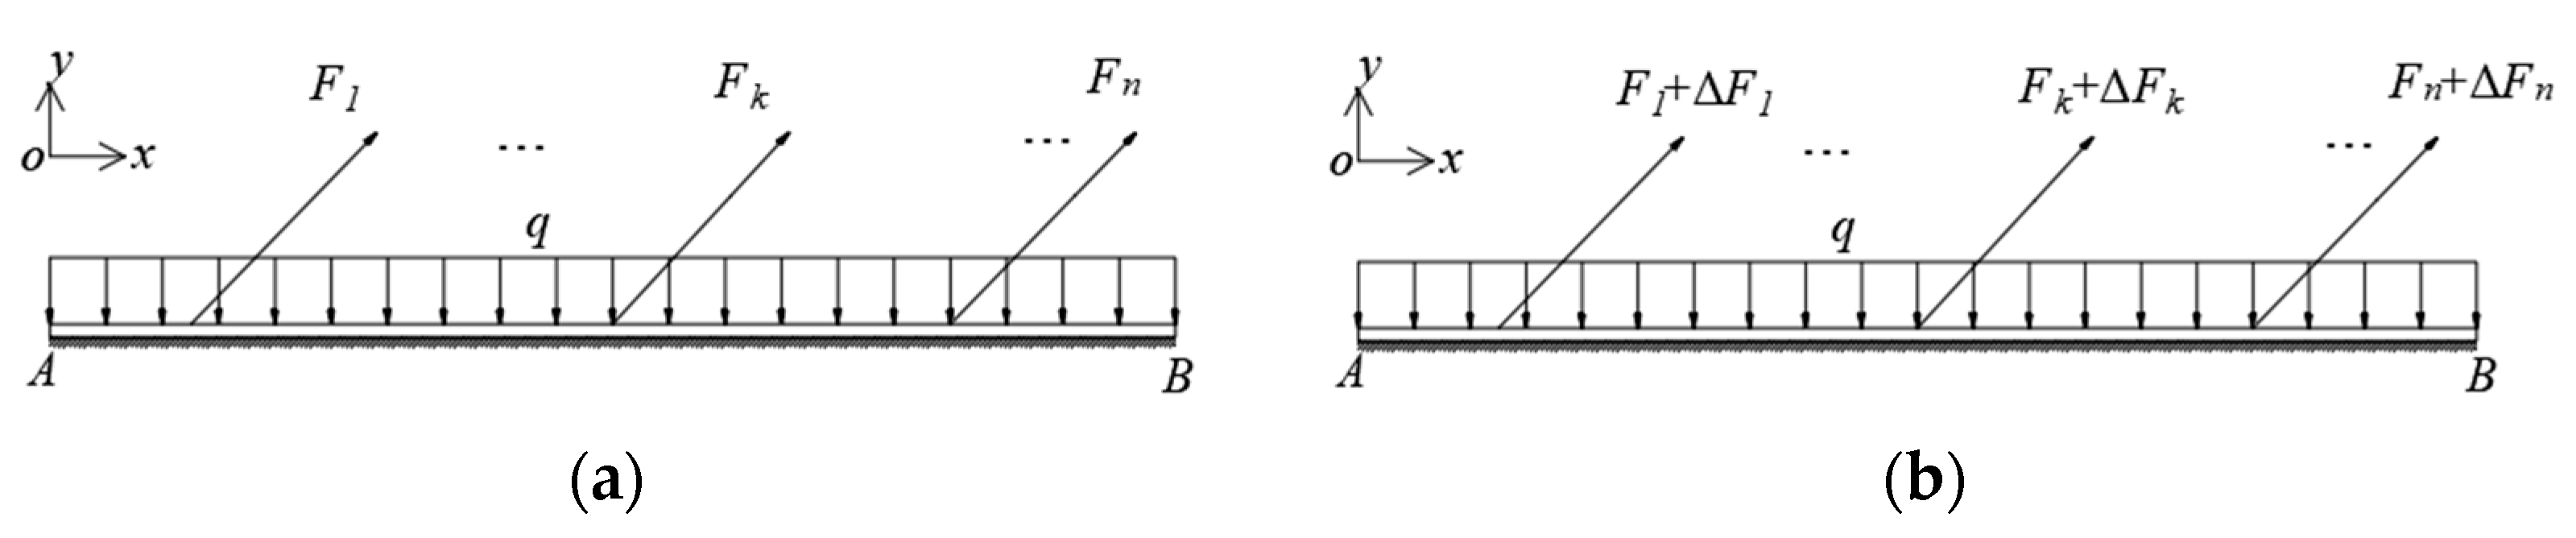
The main girder of a cable-stayed bridge is equated to a foundation girder as shown in Figure 1, with girder section AB being one of the sections, which contains n cables. The anchorage points of each cable and the main girder are numbered 1, 2, , k − 1, k, k + 1,⋯, n in order from left to right. The cable forces in the cable-stayed cables are , respectively. The angle between the stay cable and the main girder is , respectively.

Figure 1.
Stress analysis diagram of the girder section: (a) Stress state of beam AB in the healthy state; (b) Stress state of beam AB after cable damage.
If one stay cables i has been damaged at any position under the action of dead weight, then the deflection at the anchorage point of the cable k and the main girder before and after damage are, respectively, , and the deflection difference of the girder before and after cable damage is
where the subscript i represents the position of the damage cable (can be multiple or single cable damage); n is the number of the anchorage points; is the anchorage points of each stay cable and the girder.
The deflection of the girder at any section k of the main girder before cable damage (in the healthy state) can be expressed as:
The deflection of the girder body at any section i of the main girder after cable damage can be expressed as:
and the deflection difference of the girder is
That is, the deflection difference at section i is due to the change in the cable force of cable i before and after cable damage.
According to the theory of foundation beam of infinite length [18], without considering the influence of boundary conditions, a concentrated force is applied on the elastic foundation beam of infinite length. The settlement of any point on the surface of a foundation is proportional to the pressure exerted on that point per unit area,
where is the pressure per unit area; k is the coefficient of the foundation. Its physical meaning is the pressure required to produce unit settlement of the foundation.
Consider the deflection difference function as an unknown quantity, which needs to satisfy the requirements of the differential equation.
As shown in Figure 2, the relationship between deflection , uniformly distributed load q and foundation reaction p is as follows:
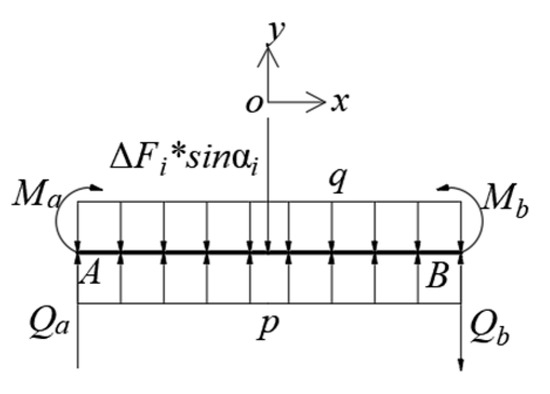
Figure 2.
Microsegment diagram of girder subjected to force.
Rewrite it to Equation (7).
Set , and substitute it into Equation (8).
Equation (8) is a fourth order linear nonhomogeneous differential equation with constant coefficients
It consists of two parts: the general solution of Equation (9) and the particular solution of Equation (8).
First solve the Equation (9), set =, by substituting into Equation (9), we can obtain the characteristic equation.
Solve Equation (10) to obtain Equation (11).
So, we have four particular solutions: .
By the following relation
The general solution of Equation (9) can be written as
The particular solution of Equation (8) is
The solution of Equation (8) is
There is no load other than concentrated force on the beam, q = 0.
The coefficients A, B, C and D are determined according to the boundary conditions, as , and substitute it into Equation (13),
Therefore, A = 0, B = 0, and substitute it into Equation (13)
When x = 0, ,
Hence:
We can obtain:
By substituting Equation (19) into Equation (17), we can obtain:
where ; k is the elastic coefficient of the main beam; γ is the elastic eigenvalue of the beam; E is the elastic modulus of the main beam; I is the bending inertial moment of the main beam.
The deflection difference of the girder less than 0 can be obtained by symmetry. According to Equation (20), the deflection difference of the girder maximized at the anchorage point of the main beam and the damaged cable.
3. Example Verification
3.1. Project Profile
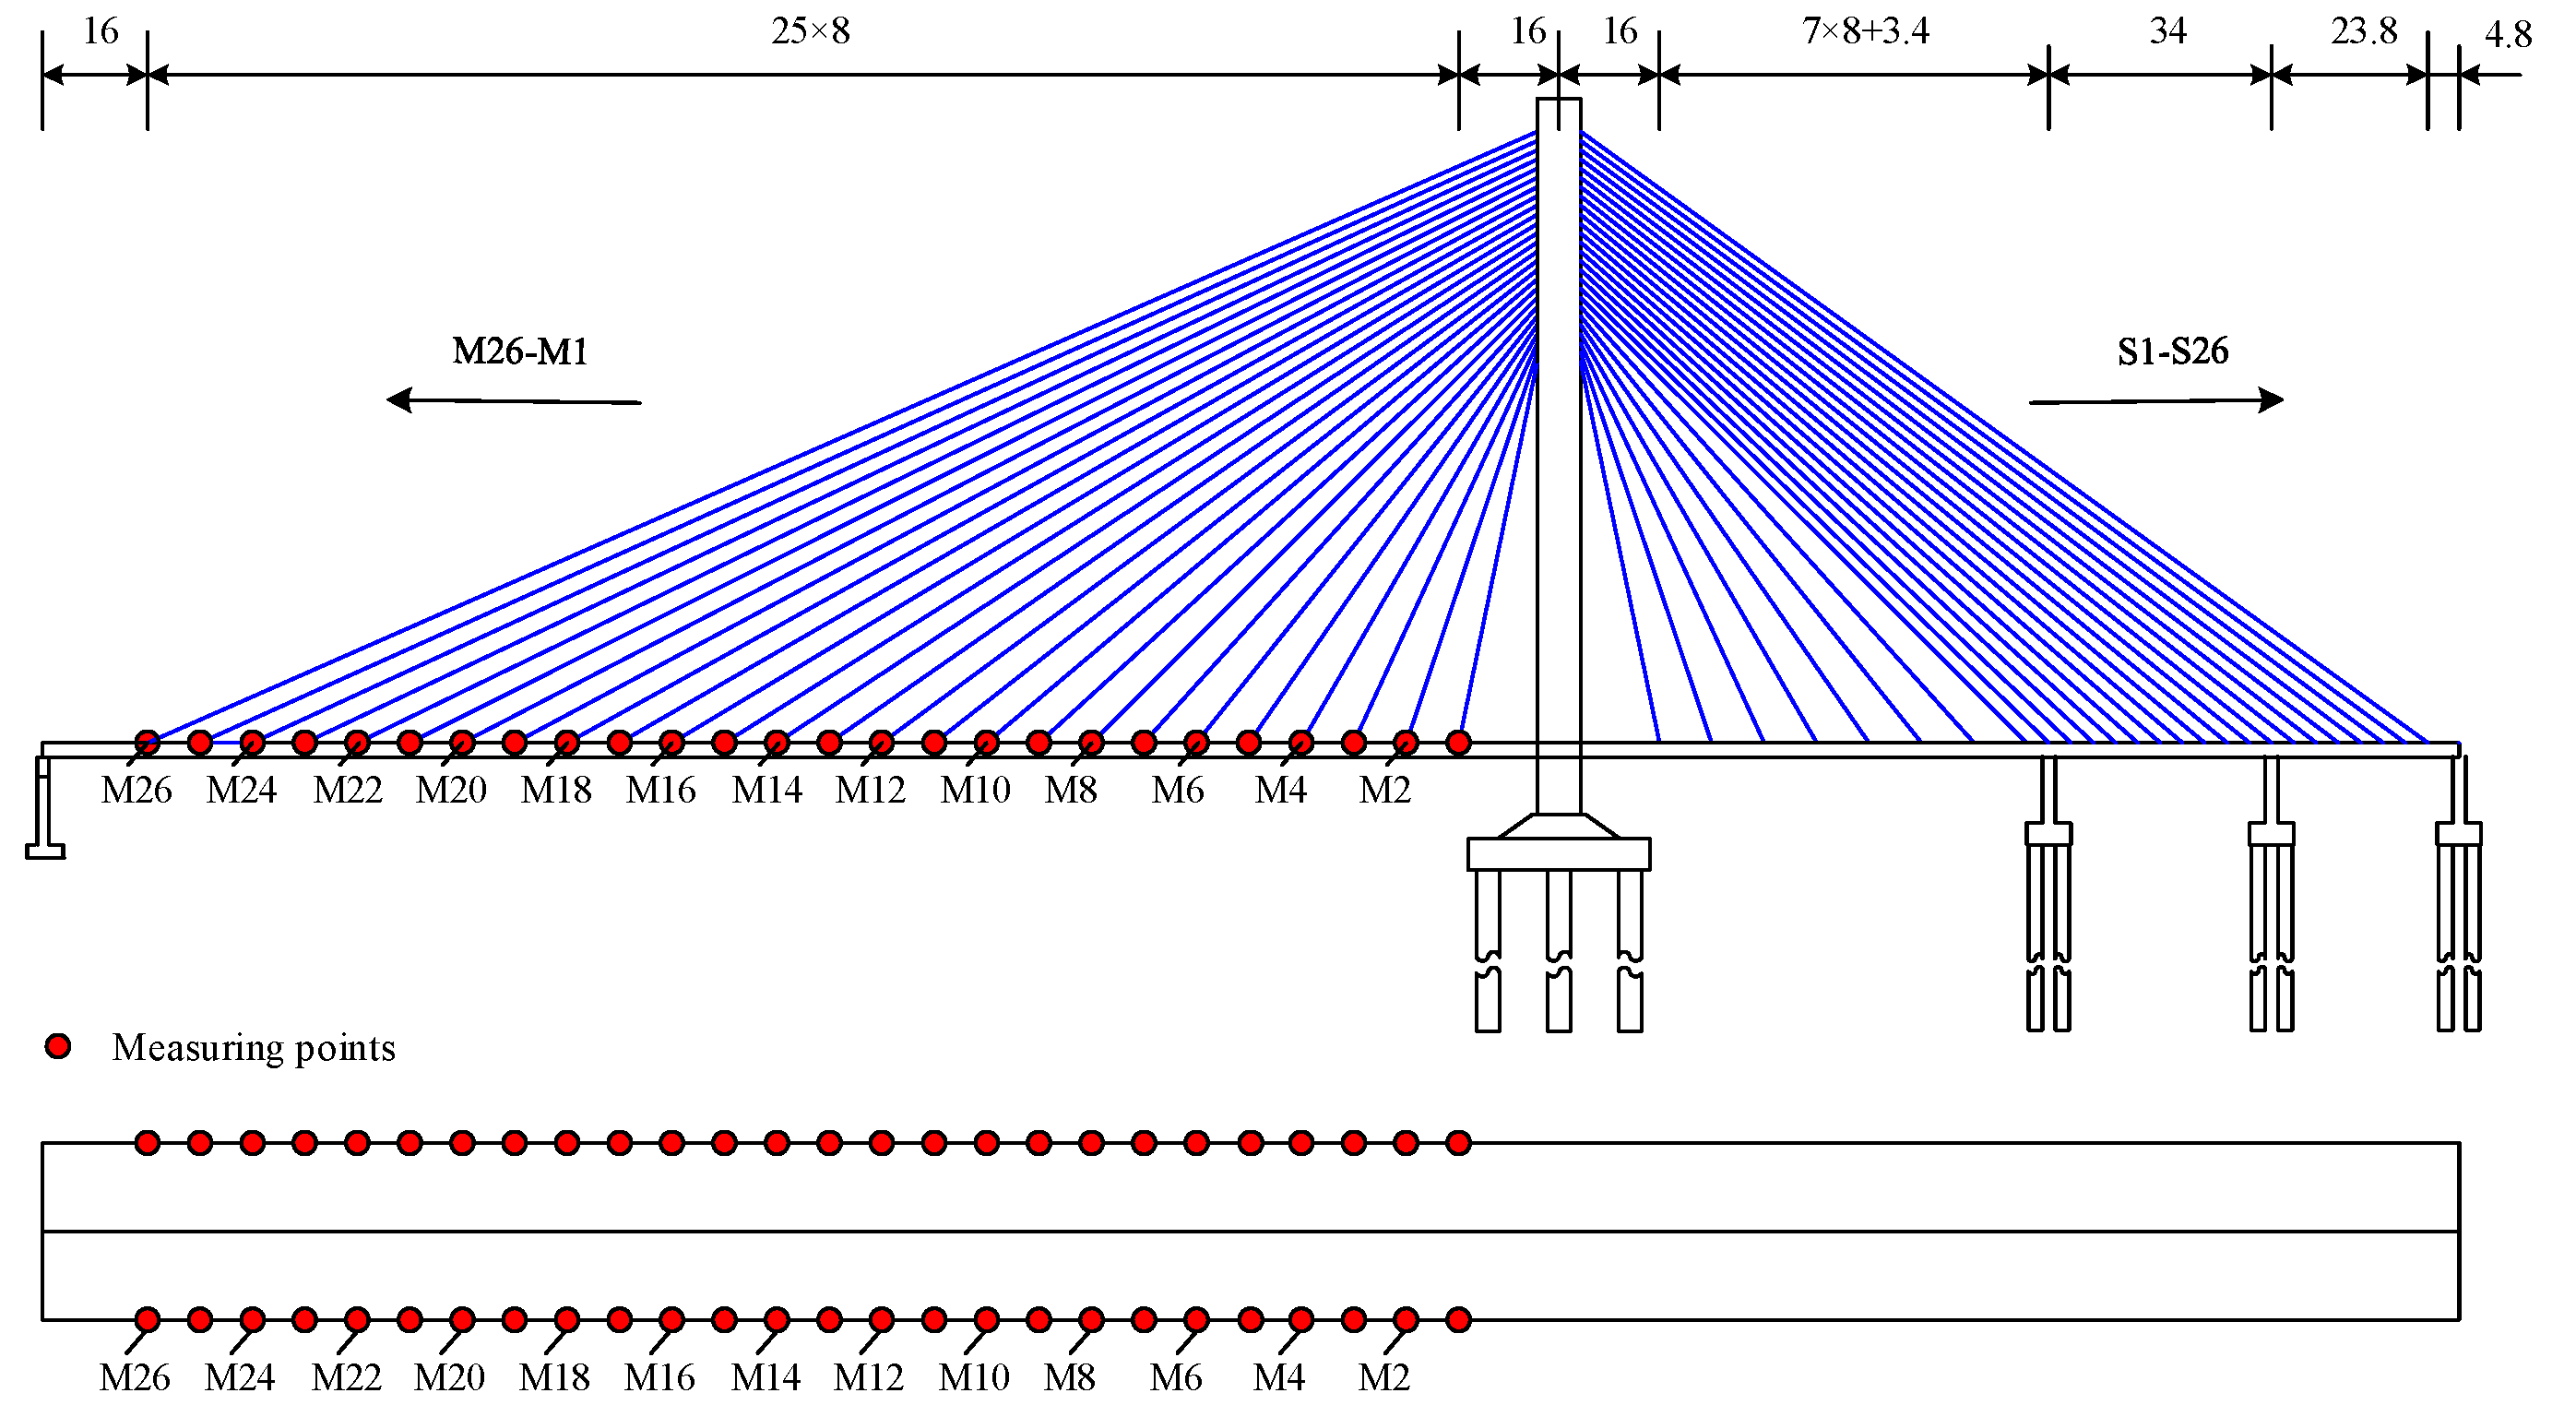
Taking a single-pylon cable-stayed bridge as an example, its span arrangement is 232 m + 75.4 m + 34 m + 28.6 m, and the total length of the bridge is 370 m. The structure is shown in Figure 3. The main span (232 m) of the river side of the bridge is a three-way prestressed concrete girder with an open box section and a height of 2.2 m. The bank side span is a closed box girder and a solid girder segment. The first span (75.4 m) is a box section; the second span (34 m) and the third span (28.6 m) are solid sections. The full width of the girder is 23.5 m, and the width of the bridge deck is 16 m. The cables of the whole bridge are made of galvanized low relaxation high strength parallel steel wire with a diameter of 7 mm. The cable is divided into 7 types (PES7-283, PES7-241, PES7-233, PES7-199, PES7-163, PES7-121, PES7-85). The standard tensile strength of the cable is 1670 MPa, and the elastic modulus is 2.06 × 10⁵ MPa. The cables are arranged in an asymmetric form. There are 52 pairs of cables on the upstream and downstream sides. The main girder of the box is made of concrete marked C50. Concrete marked C40 is used for the girder of the solid section and the tower.
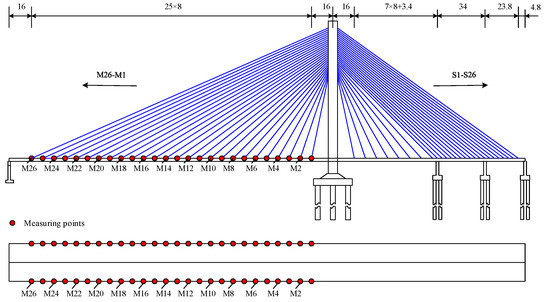
Figure 3.
Bridge layout of the single tower cable-stayed bridge.
3.2. Finite Element Model
The reference model of the whole bridge is established by ANSYS [19]. Taking the center of bridge deck connected by the tower and the main beam as the origin of coordinates, the transverse axis along the main beam is the x-axis; the vertical axis along the main beam is the y-axis; and the longitudinal axis along the main beam is the z-axis. In this paper, the positive x-axis is upstream; the negative x-axis is downstream; and the vertical y-axis is positive. Because the bridge is a consolidation system of beams and towers, the two ends of the cable-stayed bridge are constrained by the y-direction degrees of freedom, and other degrees of freedom are released. The mid-span beam and tower are consolidated as one, and the tower column supports under the cable tower are constrained by all degrees of freedom. The type and number of units are shown in Table 1. The main girder is 8 m per unit. A cable is a unit.

Table 1.
The type and number of units.
The model is made according to the actual size of the design drawing. The second-stage dead load is equivalent to the uniform load applied on the deck; a fixed constraint is applied at the bottom of the tower and the pier.
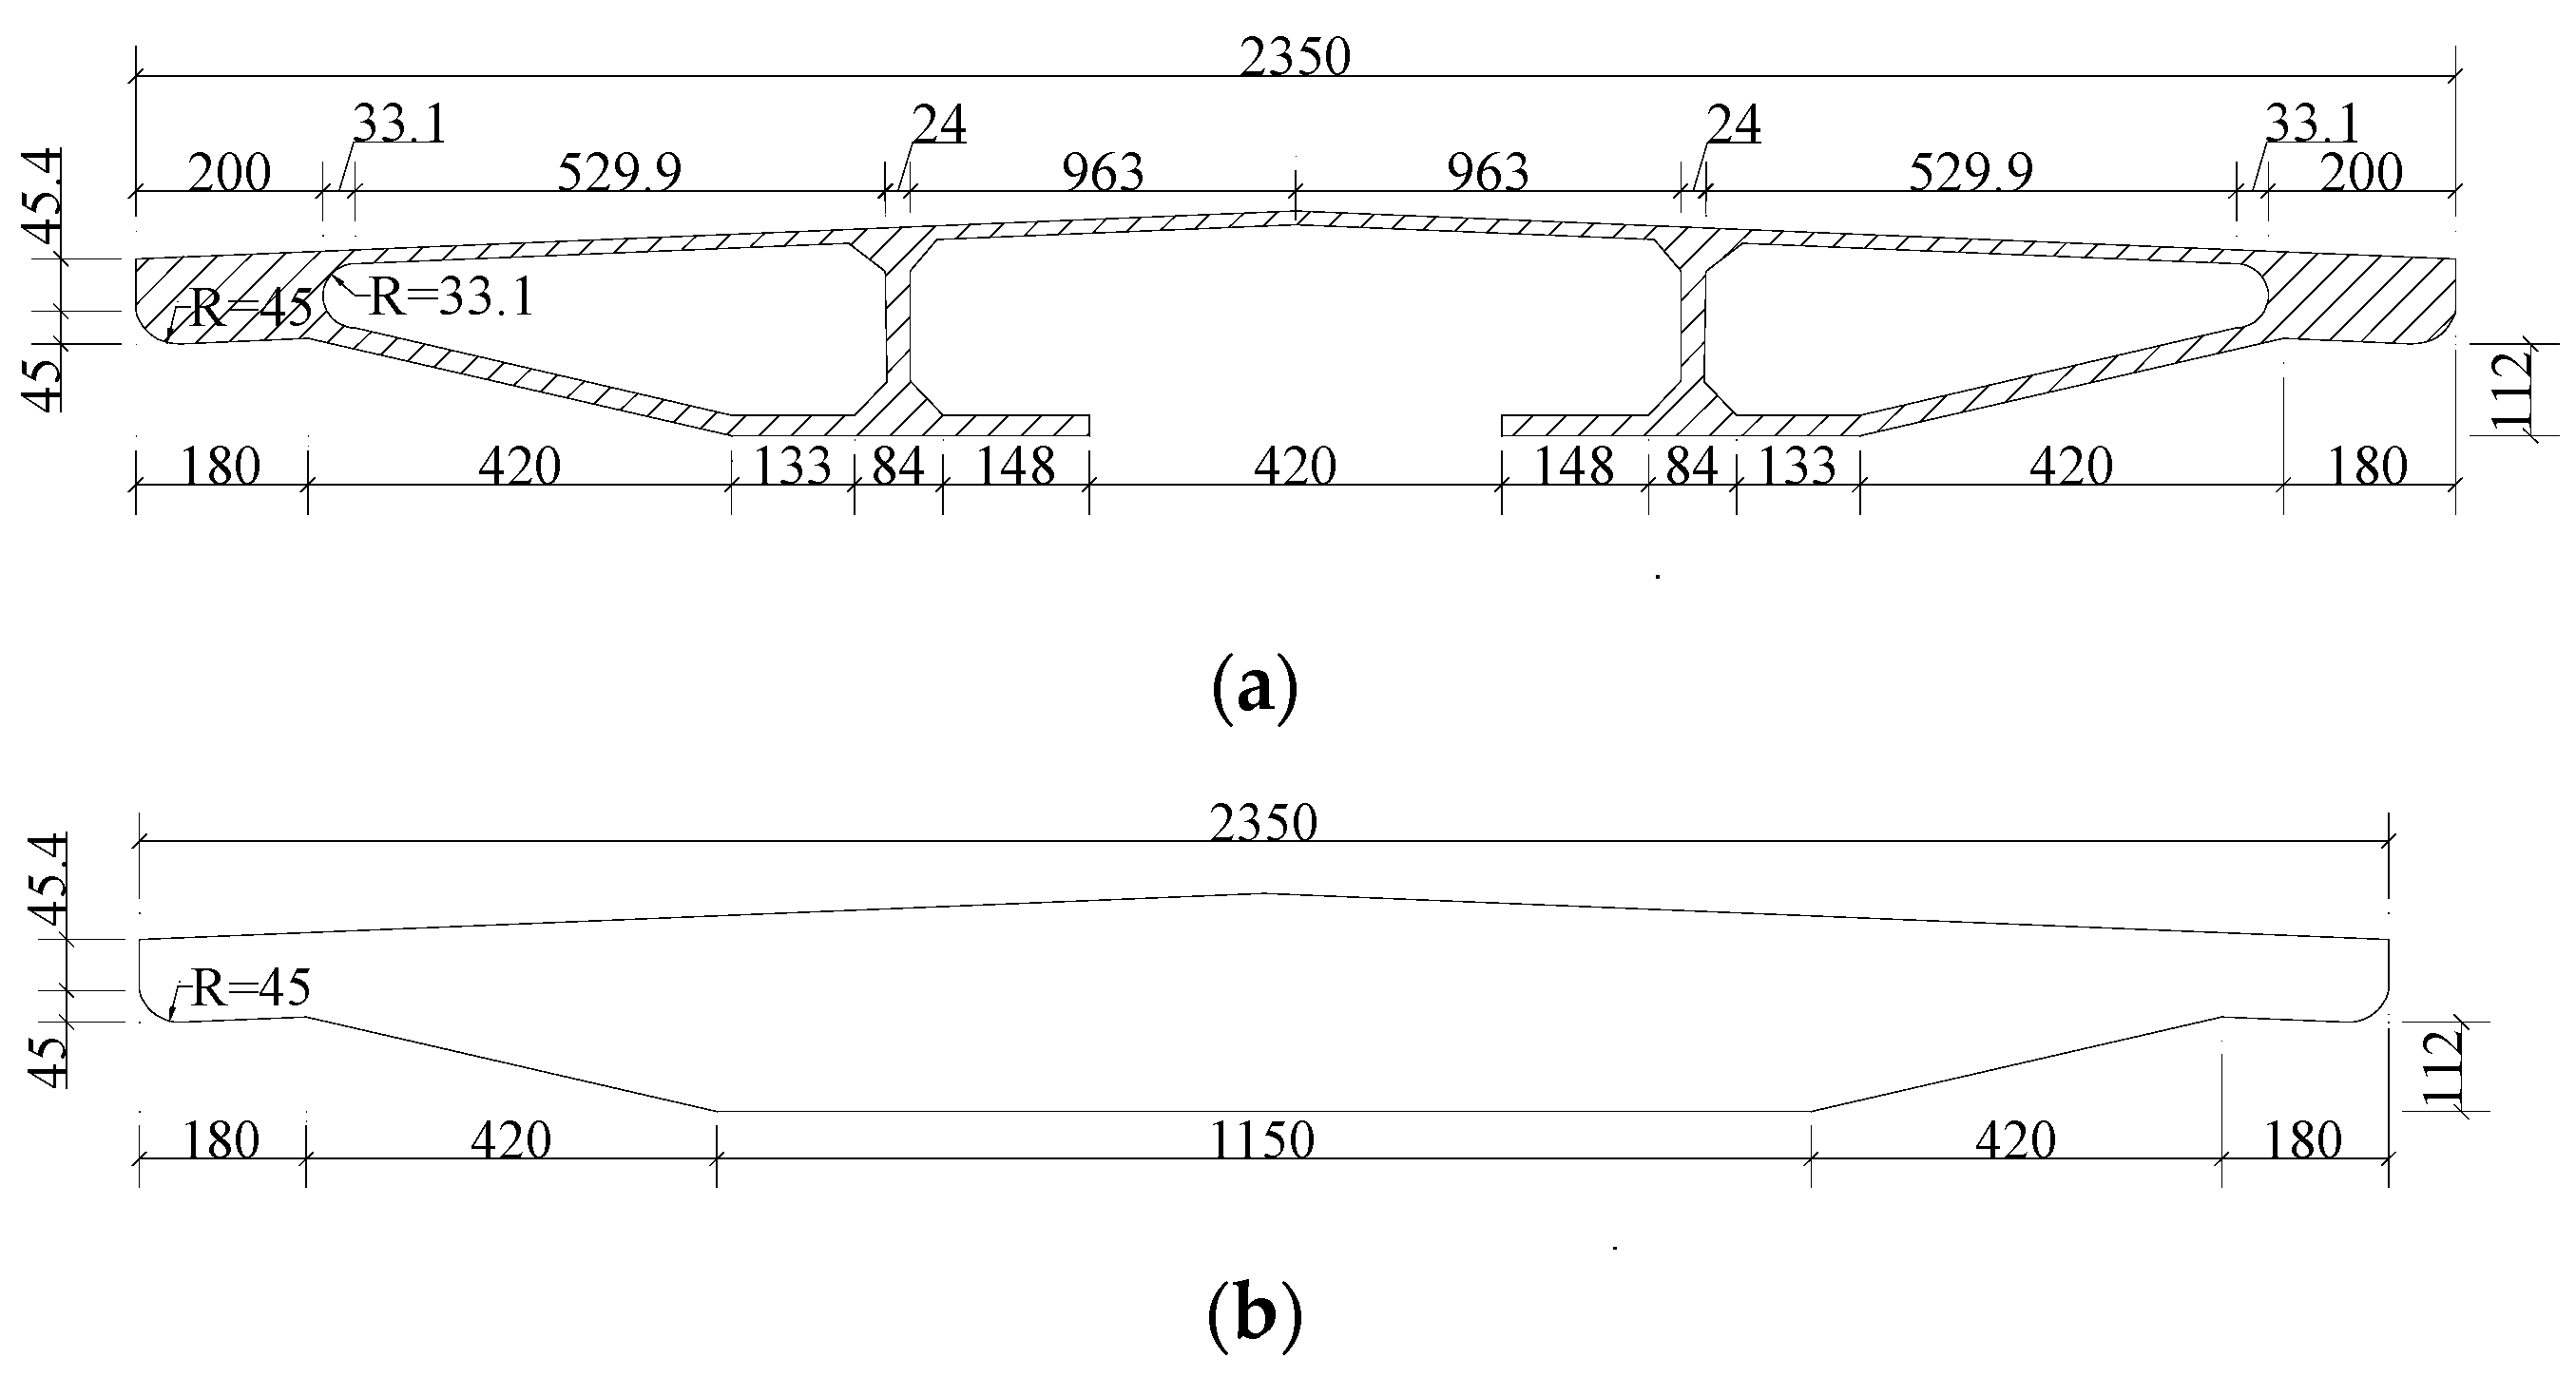
The elastic modulus of the main girder’s concrete E = 3.45 × 10⁴ MPa, the density ρ = 2600 kg/m2, Poisson’s ratio v = 0.2; the elastic modulus E = 3.25 × 10⁴ MPa, the density ρ = 2500 kg/m2, Poisson’s ratio v = 0.2. The finite element model of the structure above the pier of the single-pylon cable-stayed bridge is shown in Figure 4. The sections of the girder are shown in Figure 5a,b.
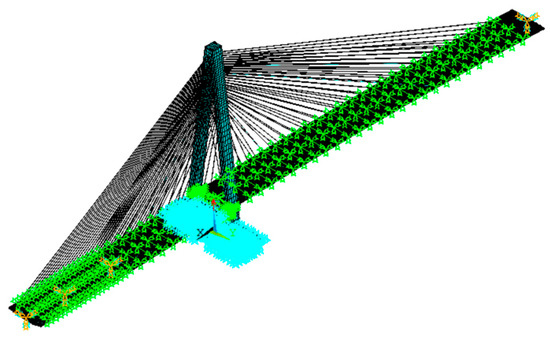
Figure 4.
Finite element model of the single tower cable-stayed bridge.
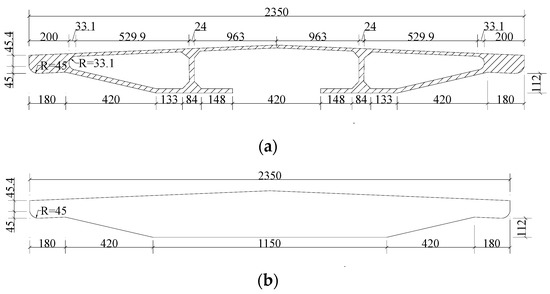
Figure 5.
Section type: (a) Open box section; (b) Solid section.
4. Variation and Distribution of the Deflection Difference of the Girder before and after Cable Damage under Dead Weight
4.1. Variation and Distribution of the Deflection Difference of the Girder before and after the Cable Damage
- (1)
- Variation and distribution of the deflection difference of the girder before and after a single cable damage
Assuming that the stiffness of a cable decreases after the damage occurs, the cable damage can be simulated by reducing the elastic modulus or the cross-section area. In this paper, the elastic modulus of the cable is reduced to simulate the damage (see Table 2).
Table 2.
Value of elastic modulus of the cable after reduction GPa.
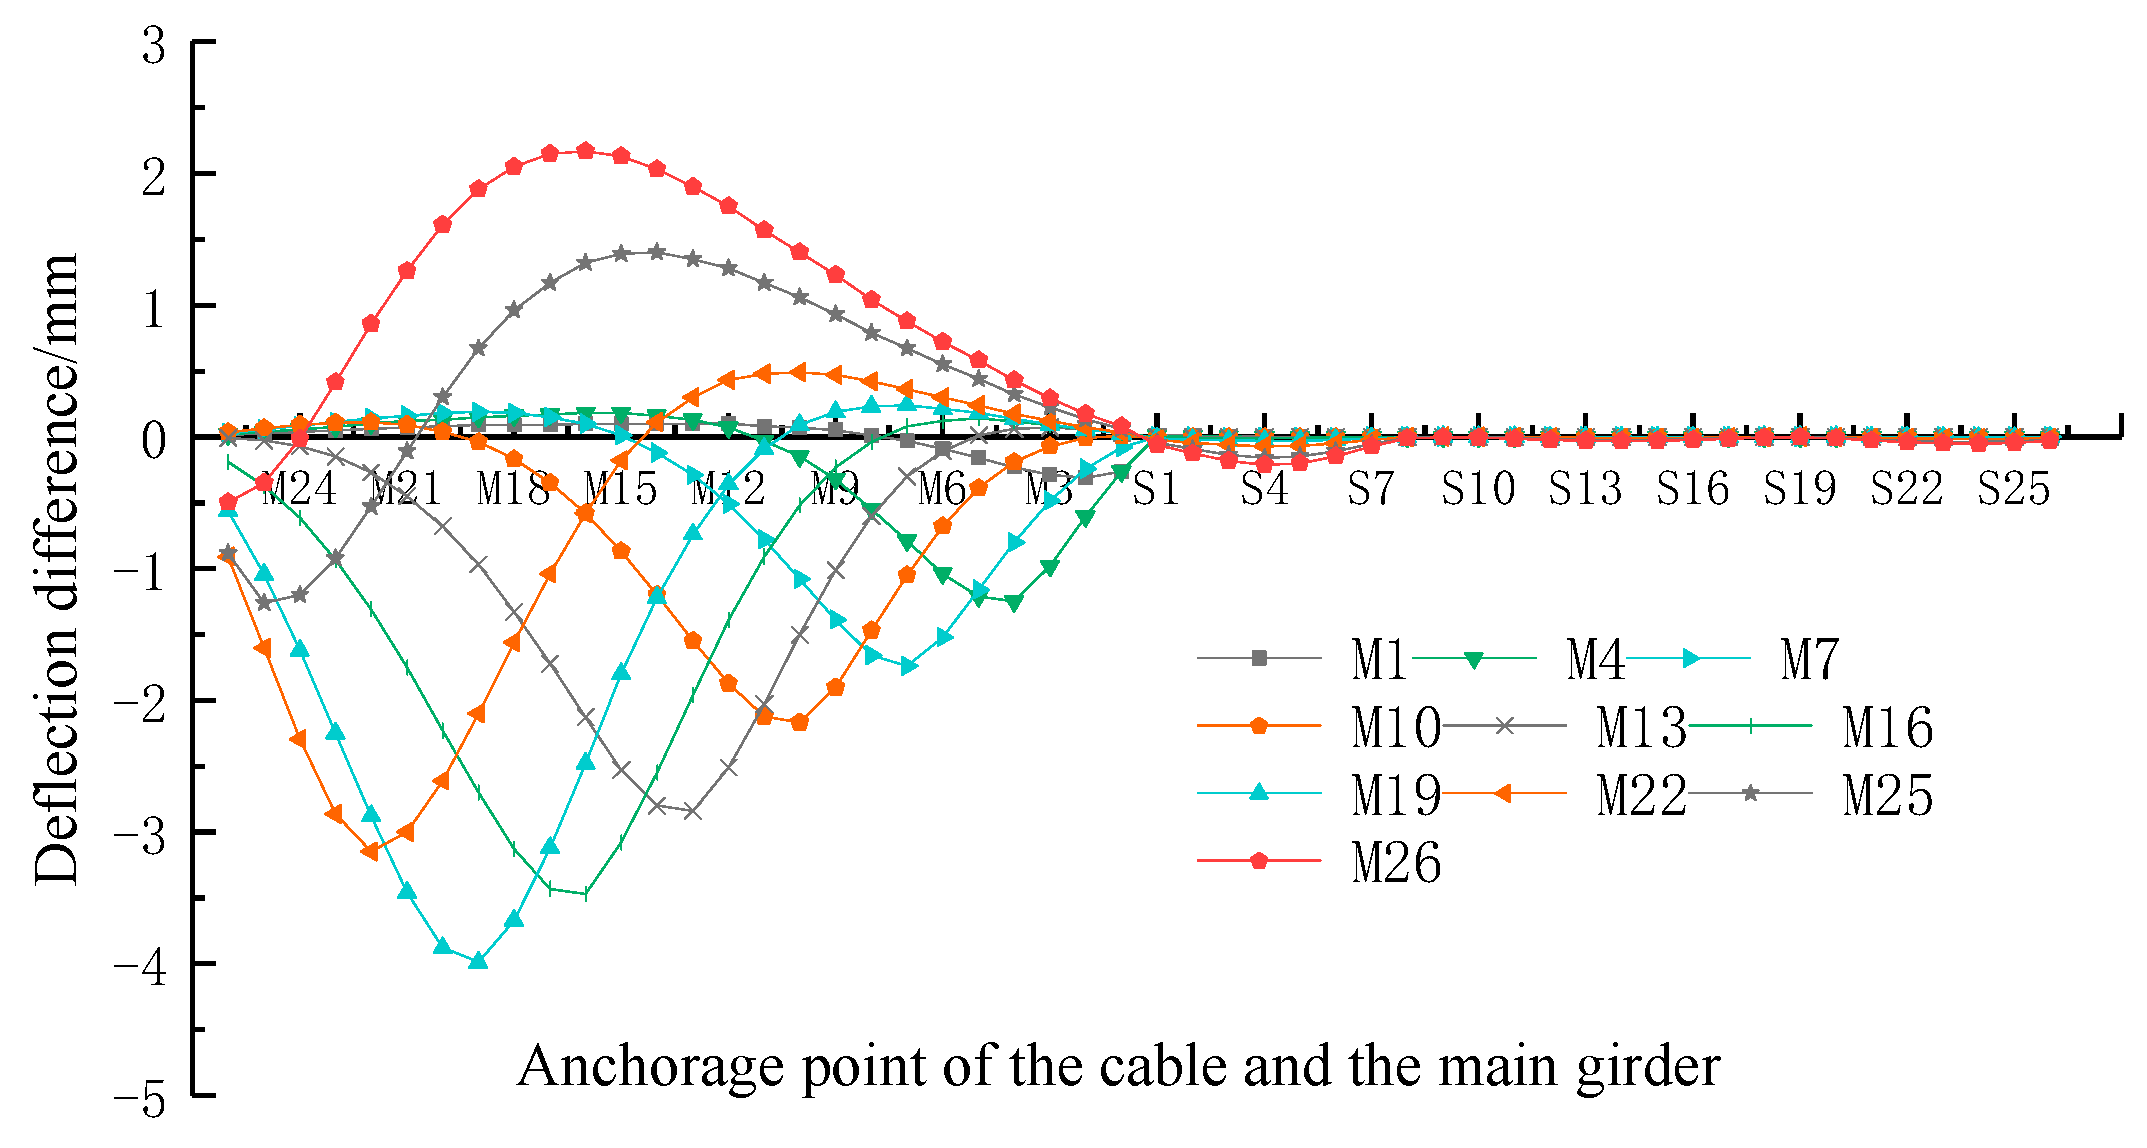
When 10% damage occurs separately to the cable on the upstream side of the main span (M1, M4, M7, M10, M13, M16, M19, M22, M25, M26), the distribution of the deflection difference of each anchorage point on the upstream side of the girder before and after the cable damage (the side where the damage cable is located) is shown in Figure 5. Each legend in the figure represents the number of the damage cable; the abscissa is the number of the anchorage point of each cable; and the ordinate is the deflection difference of the girder before and after the damage of the cable.
It can be seen from Figure 6 that when a cable is damaged at different positions, the distribution curves of the deflection difference of the girder before and after the cable is damaged flex around the anchorage point of the damaged cable, and the peak value (point) appears at the anchorage point of the damaged cable. The peak value of deflection difference caused by the damage of the cable in the midspan area is larger than that caused by the damage of the cable in other positions. When the stay cable of the main span is damaged, the deflection of the local span girder is greatly affected, but the deflection of the adjacent span girder is not. When the cable damage degree at different positions is the same (10%), the corresponding girder’s deflection difference distribution curves have different peaks. The deflection difference’s peak caused by the damage of cable M19 is the largest (3.99 mm), and the deflection difference peak caused by the cable damage closer to the fulcrum (or bridge tower) on both sides of M19 gradually decreases.
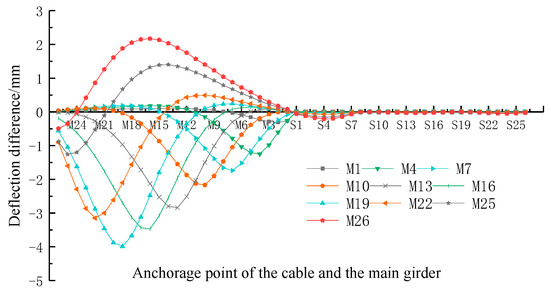
Figure 6.
The distribution curves of the deflection difference of the girder before and after a cable damage (10%).
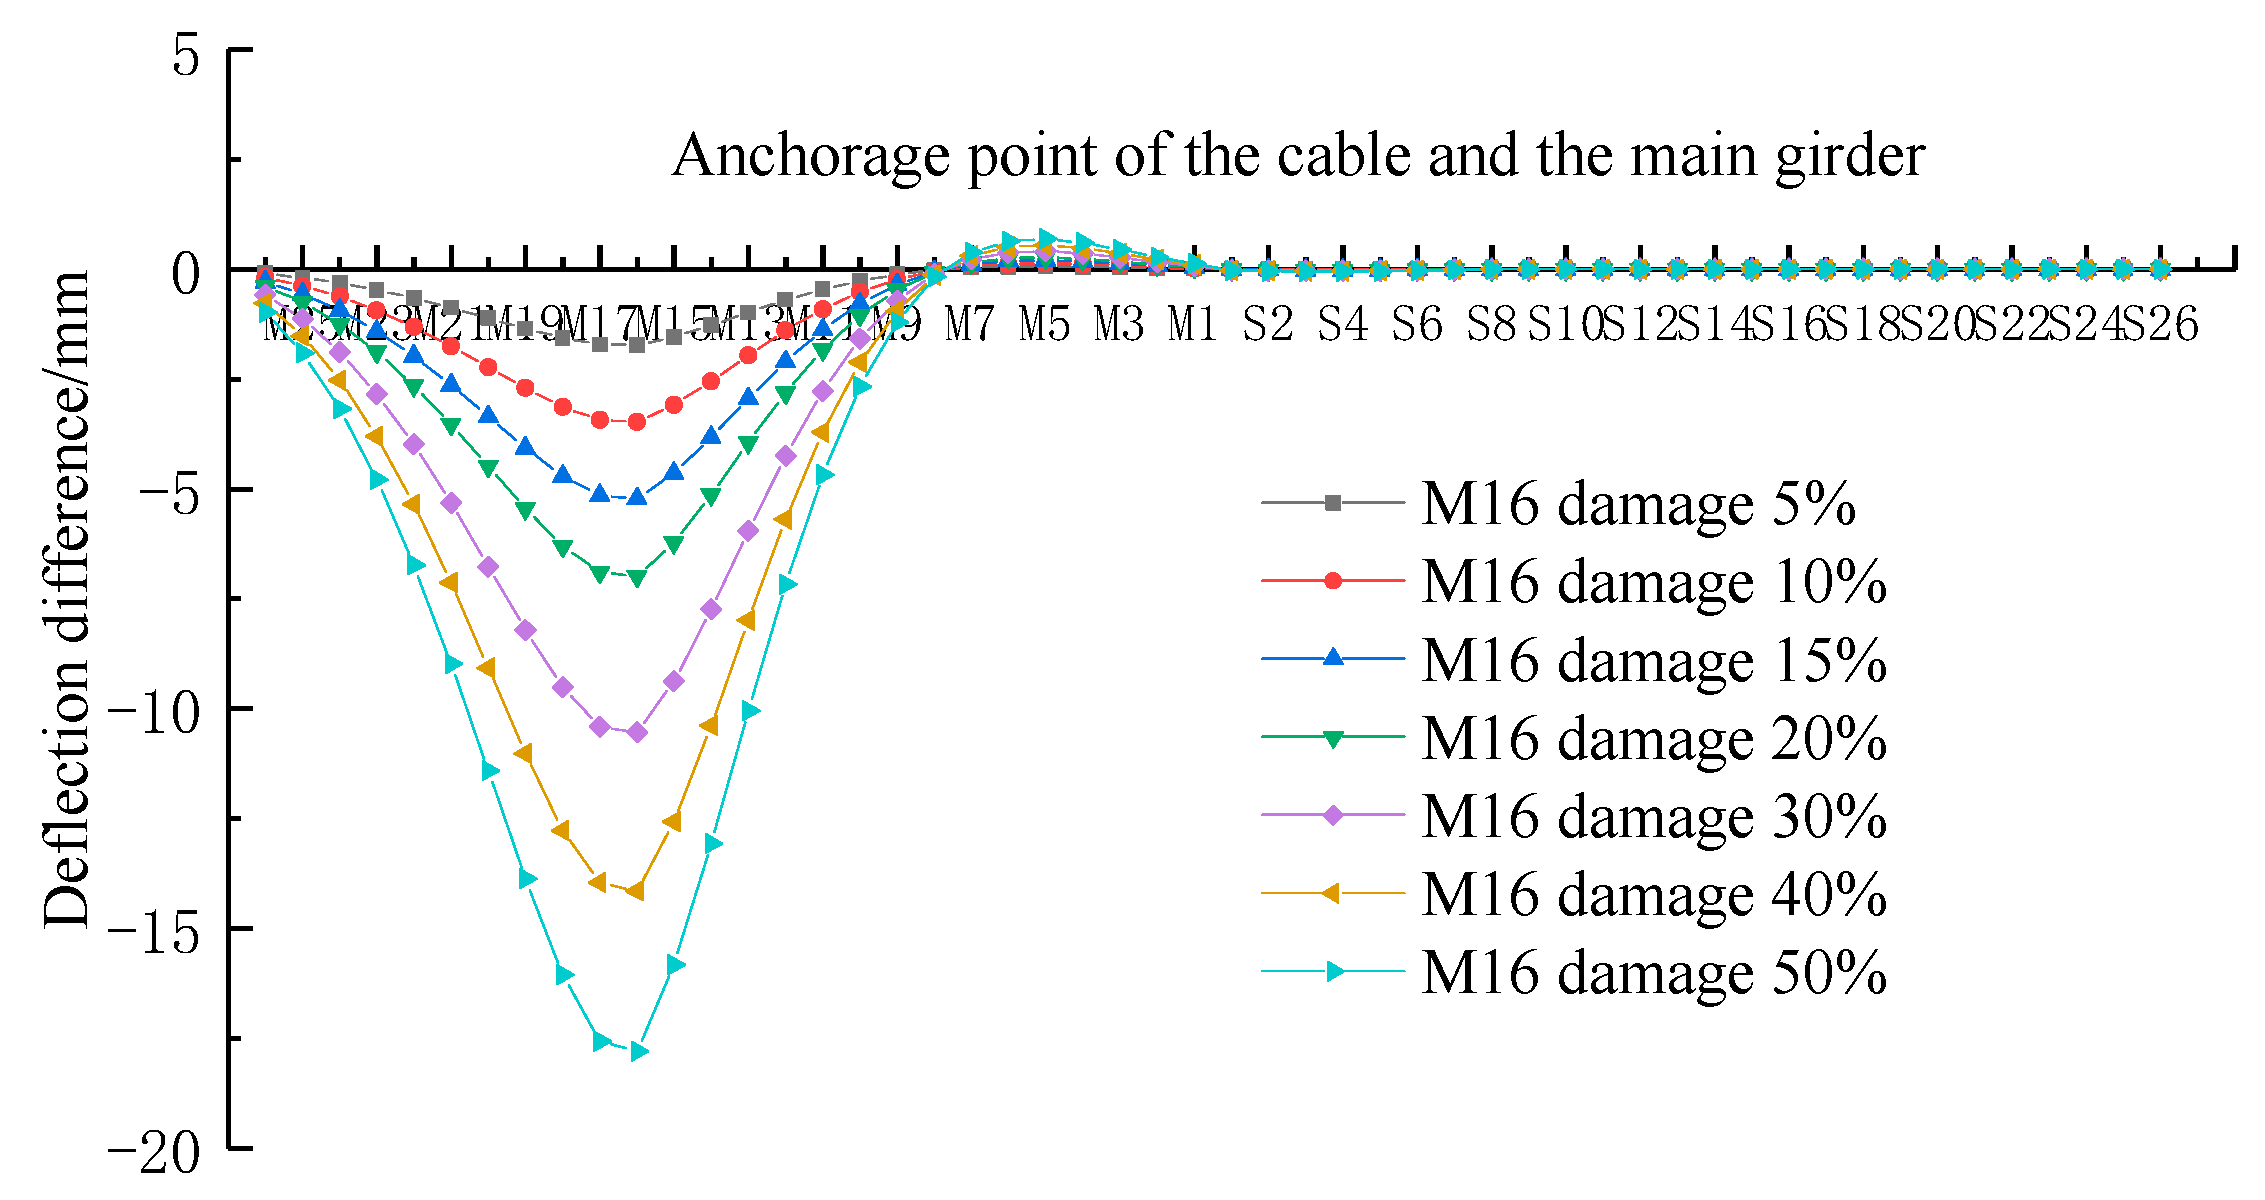
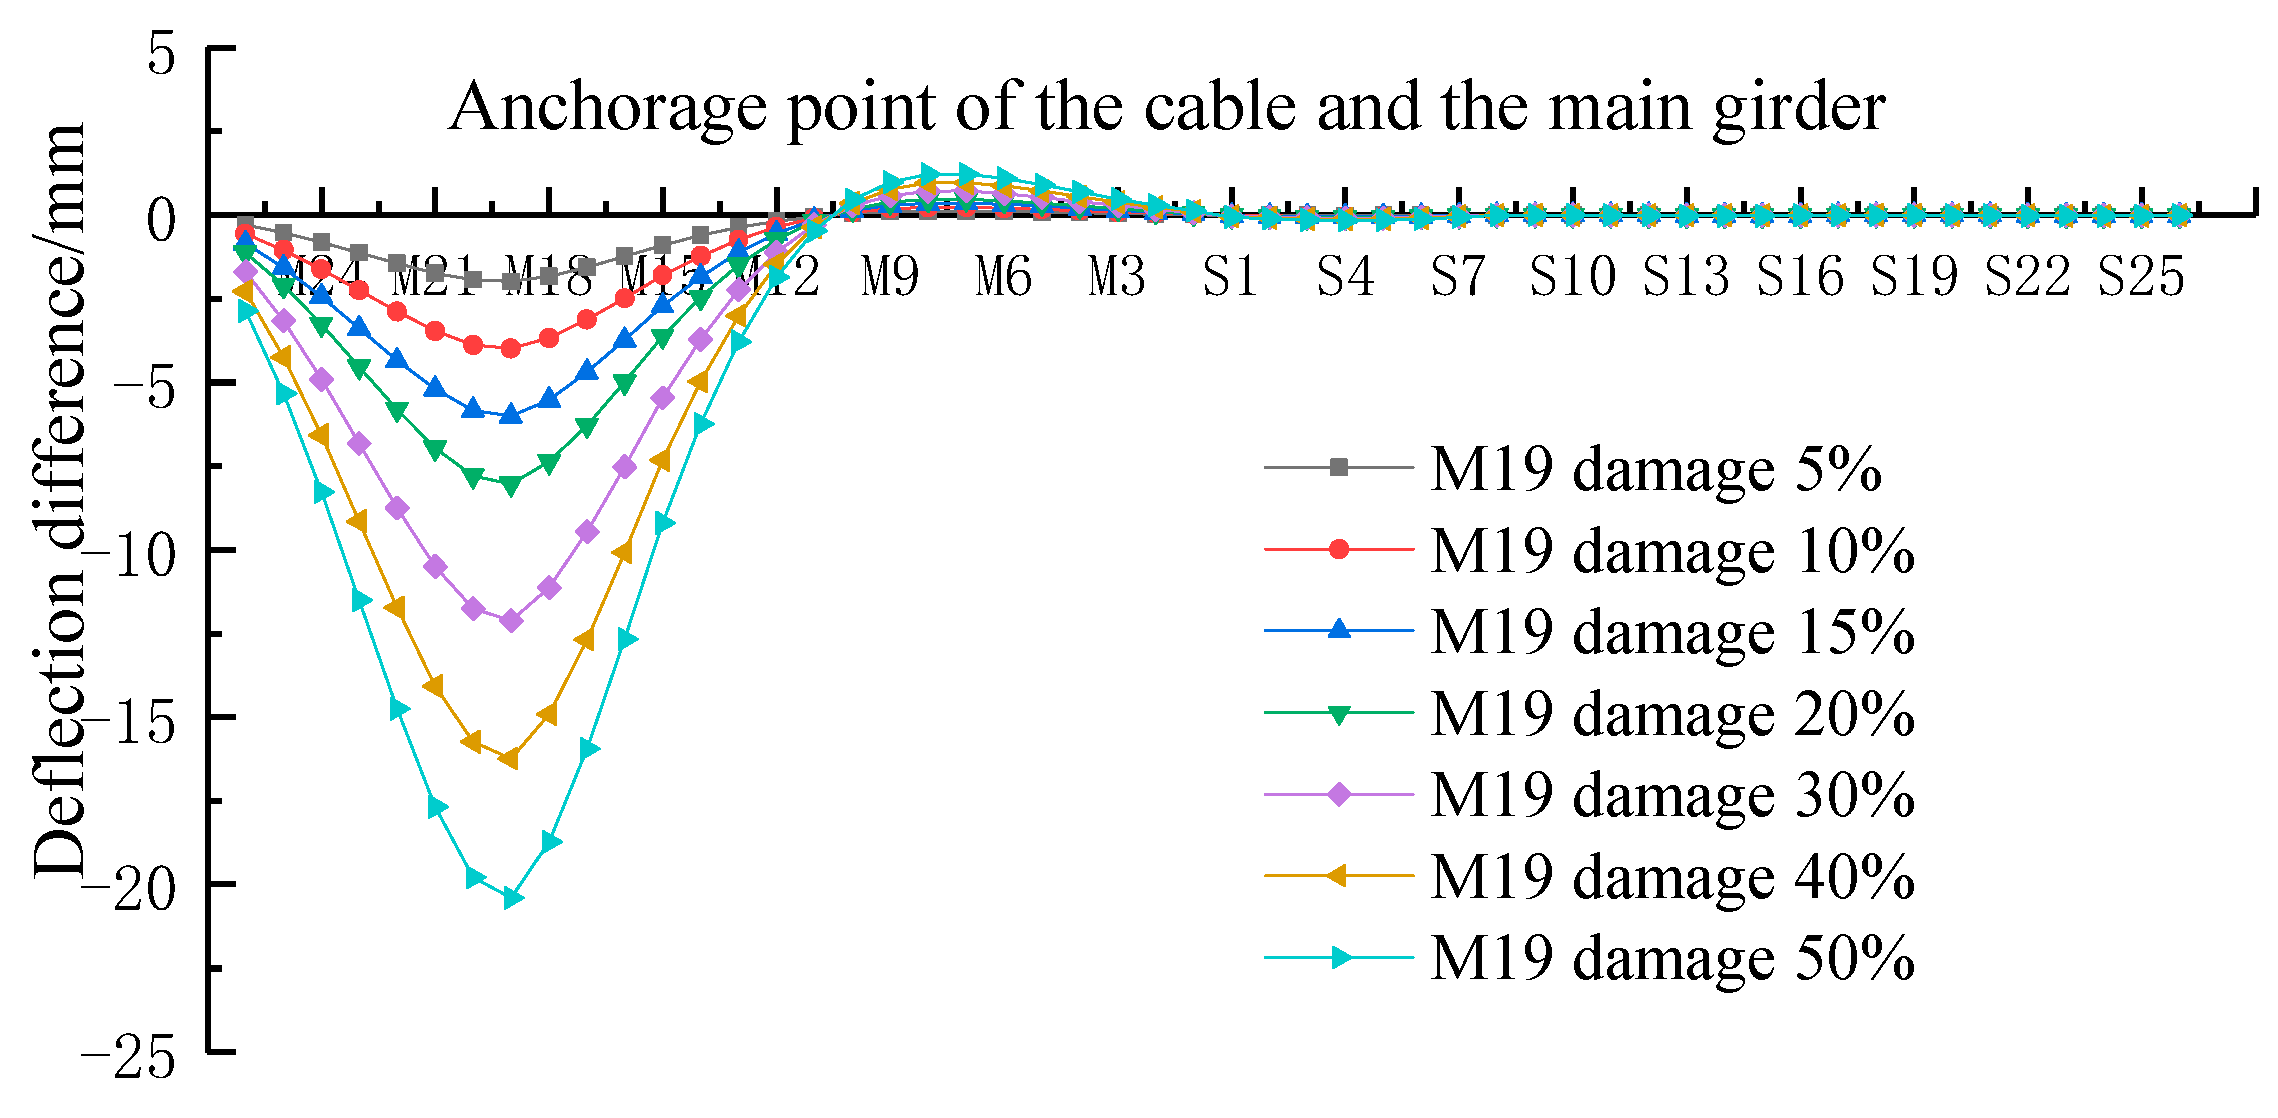
It is assumed that a certain stay cable is damaged to different degrees independently. Taking M16 and M19 as examples, the damage degrees are 5%, 10%, 15%, 20%, 30%, 40% and 50%, respectively. The variation and distribution curve of the deflection difference of the girder are shown in Figure 7 and Figure 8.
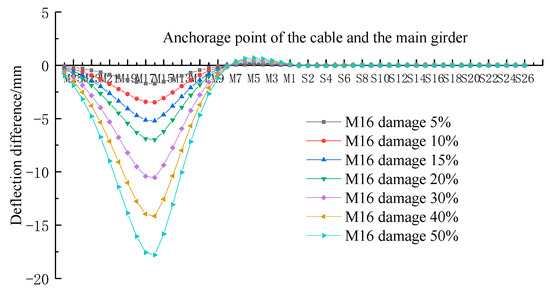
Figure 7.
The distribution curves of the deflection difference of the girder before and after different degrees of damage of the stay cable M16.
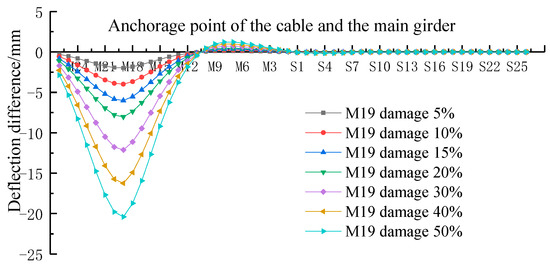
Figure 8.
The distribution curves of the deflection difference of the girder before and after different degrees of damage of the stay cable M19.
As shown in Figure 7 and Figure 8, when a single cable is damaged, the distribution curves of the deflection difference of the girder significantly flex at the anchorage point of the cable and reach a peak value. The peak value increases with the increase of the damage degree of the cable. When the cable is damaged at different positions, the peak value on the corresponding deflection difference distribution curve increases with the increase of the damage degree. When cable M16 is damaged by 10–50%, the peak of the deflection difference of the girder at its anchorage point is 3.47 mm–17.8 mm, while when cable M19 is damaged by 10–50%, the peak of the deflection difference of the girder at its anchorage point is 3.99 mm–20.41 mm. It can be seen that the deflection of the girder has different sensitivity to the cable damage at different positions; that is, the closer the cable is to the midspan, the more sensitive the girder’s deflection is to its damage.
Figure 9 shows the variation of the peak values of the distribution curves of the deflection difference with the damage degree of the cable. when different degrees of damage occurred separately for each cable. The figure shows that when the cables (M1–M26) located in the main span have different degrees of damage, the peak value of the deflection difference changes with the degree of damage.
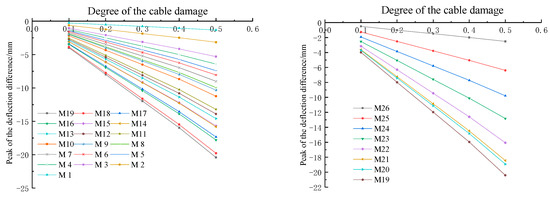
Figure 9.
The variation of peak value of the deflection difference with damage degree.
It can also be seen from Figure 8 that with the increase of the damage degree, the corresponding peak of the deflection difference increases linearly. However, with the increase of the damage degree of different cables, the corresponding peak value of the deflection difference increases at different growth rates (proportional coefficients).
For cables M1–M19, when the damage degree is the same, the longer the cable is, the larger the peak value of the deflection difference is. That is, the closer the damage cable is to the midspan, the larger the peak of the deflection difference is, the more sensitive the deflection of the girder is to the damage of the cable.
For cables M19–M26, the longer the cable is (the closer its anchorage point is to the support), the smaller the corresponding peak of the deflection difference is, and the less sensitive the deflection change of the girder is to the cable damage.
In other words, the deflection of the girder is more sensitive to the damage of the cable near the midspan, but less sensitive to the damage of the cable near the support (or bridge tower). The change of the girder’s deflection is the most sensitive to the damage of cable M19 (a long cable located near the midspan).
- (2)
- Variation and distribution of the deflection difference of the girder before and after multi-cable damage
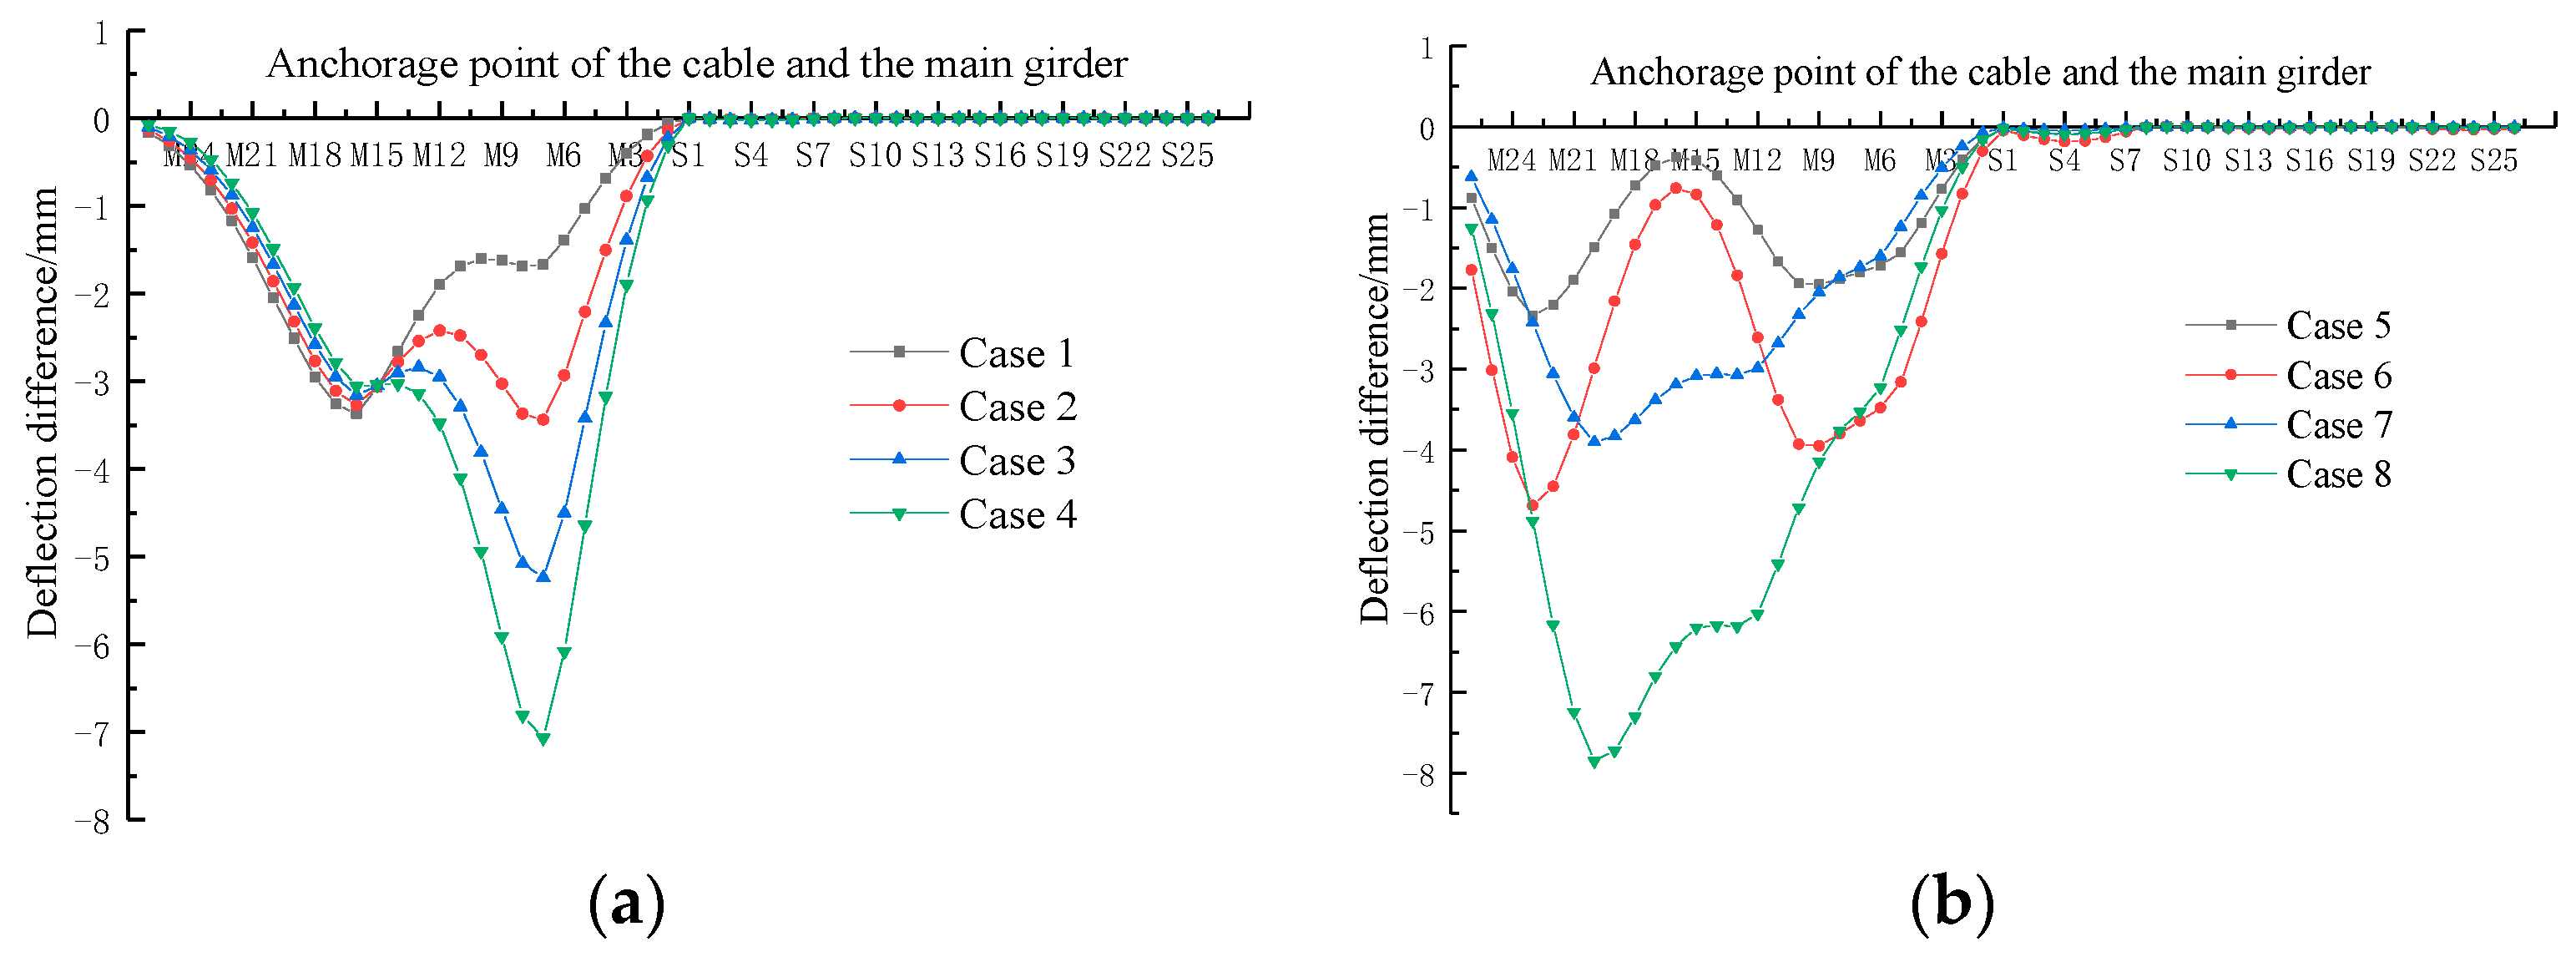
When the cables (M7 and M16) on the upstream side of the main span are damaged in the working conditions listed in Table 3, before and after the cable damage, the distribution curves of the deflection difference (the side where the damage cable is located) are shown in Figure 10a. The deflection difference distribution curve of the girder after three cable damage is shown in Figure 10b.
Table 3.
Multiple-cable damage condition.
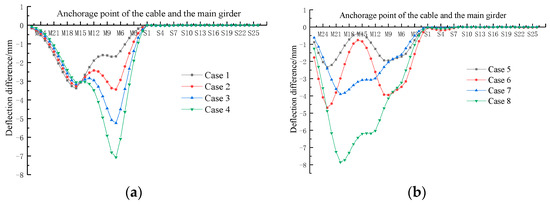
Figure 10.
The distribution curves of the deflection difference of the girder before and after the cable damaged:(a) Double-cable damage; (b) Three-cable damage.
As can be seen from Figure 10, after the damage of double cables (M7 and M16), the distribution curves of the deflection difference convex downward in the area near the anchorage points of the damage cables M7 and M16. and peak values (spike point) appear. When the damage degree of the two cables is the same, the corresponding peak value of the damage cable (M16) near the midspan position is larger. When the damage degree of one cable (such as M16) is constant and the damage degree of the other cable (such as M7) is increased, the peak value corresponding to the anchorage point of M16 is basically unchanged, while the peak value corresponding to the anchorage point of M7 increases with the increase of the damage degree.
After the three cables are damaged, the distribution curves of the deflection difference of the girder convex downward in the area near the anchorage point of the damage cable, and peak values (sharp point) appear. When the damage degree of the three cables (M6, M12, M20) is the same, the corresponding peak value of the damage cable (M20) near the midspan is larger. When the damage degree of the cable increases, the corresponding peak value increases with the increase of the damage degree.
4.2. Influence of the Change of the Overall Stiffness of the Main Girder on the Distribution of the Deflection Difference
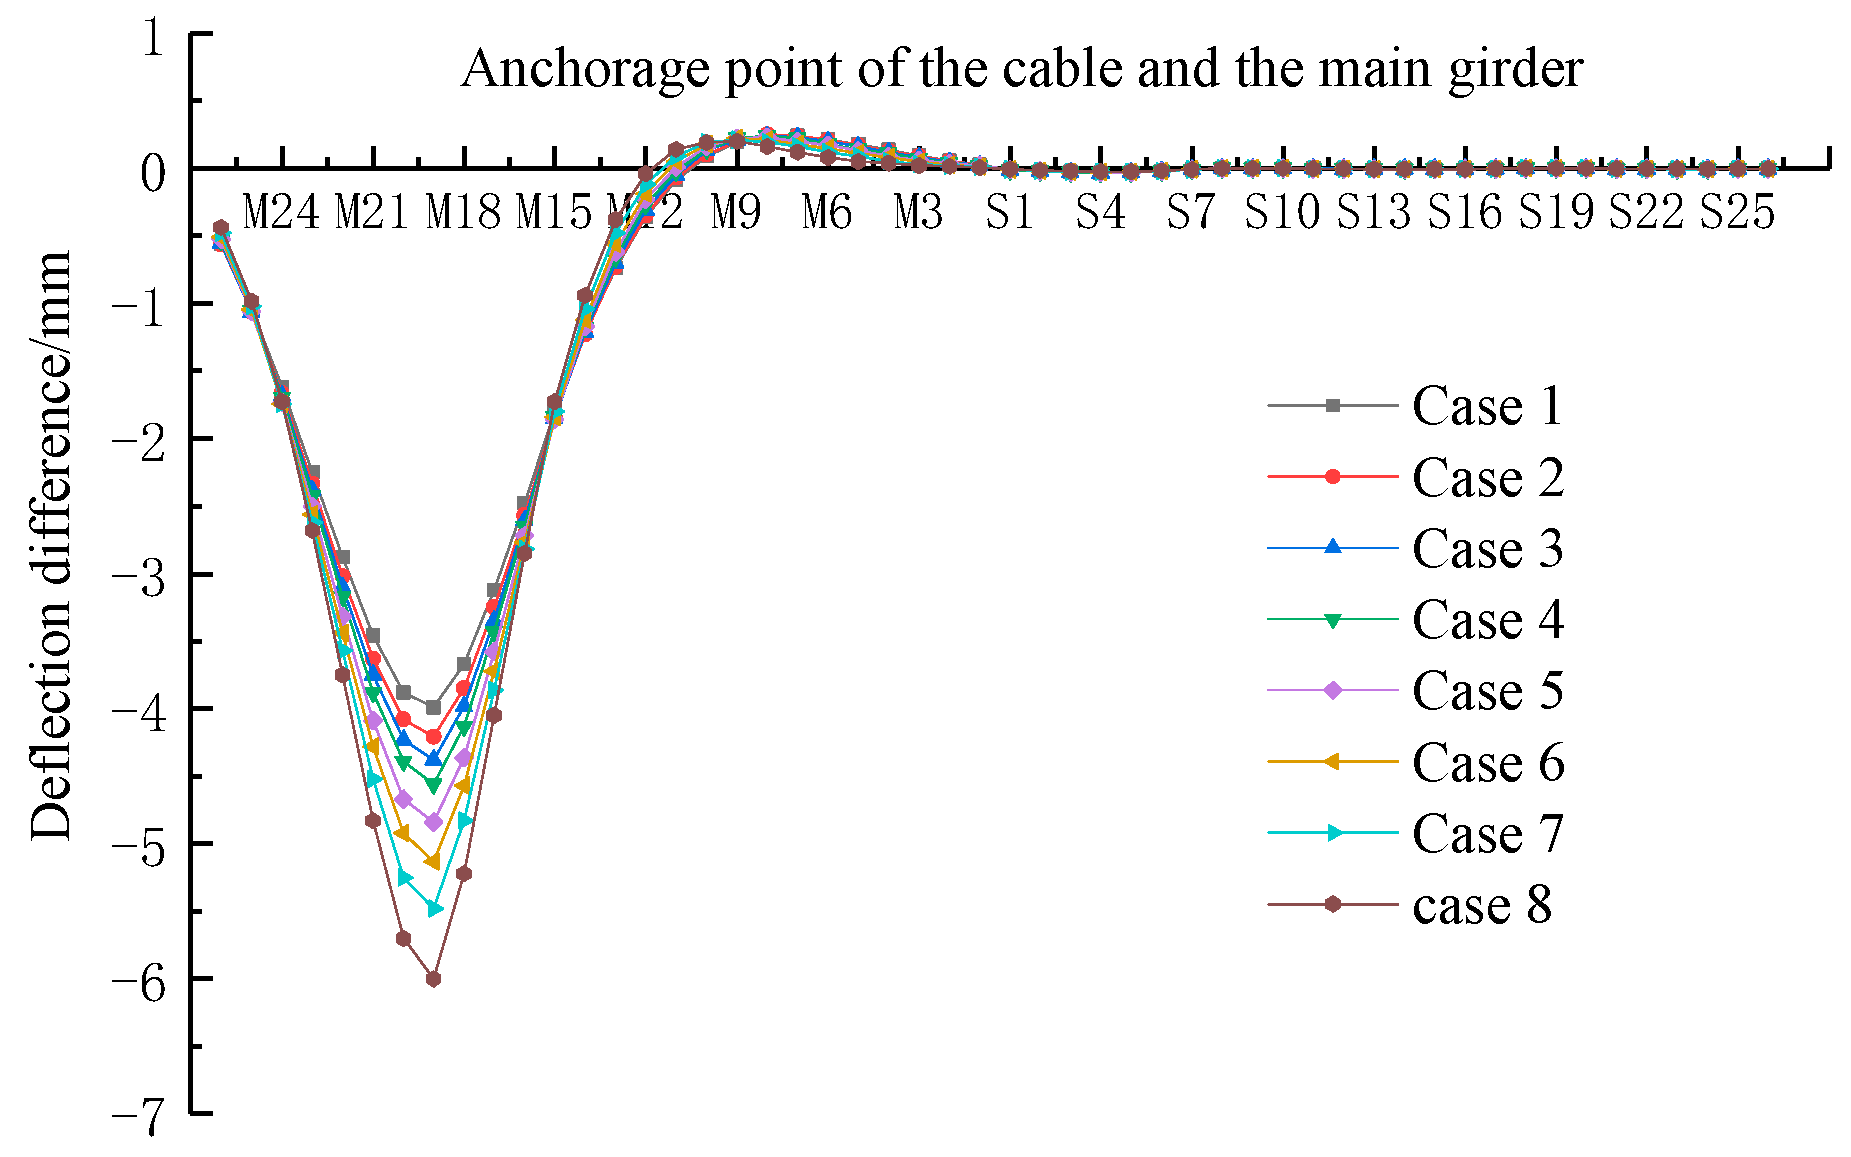
With the extension of the service time, the bending stiffness (EI) of the cable-stayed bridge may degrade as a whole. The stiffness’s degradation is simulated by the change of the elastic modulus of the girder (the moment of inertia of the section remains unchanged). Suppose that the degradation of the elastic modulus of the girder is shown in Table 3. Taking 10% damage of the cable M19 as an example, the influence of the bending stiffness of the girder on the deflection difference of the girder is analyzed.
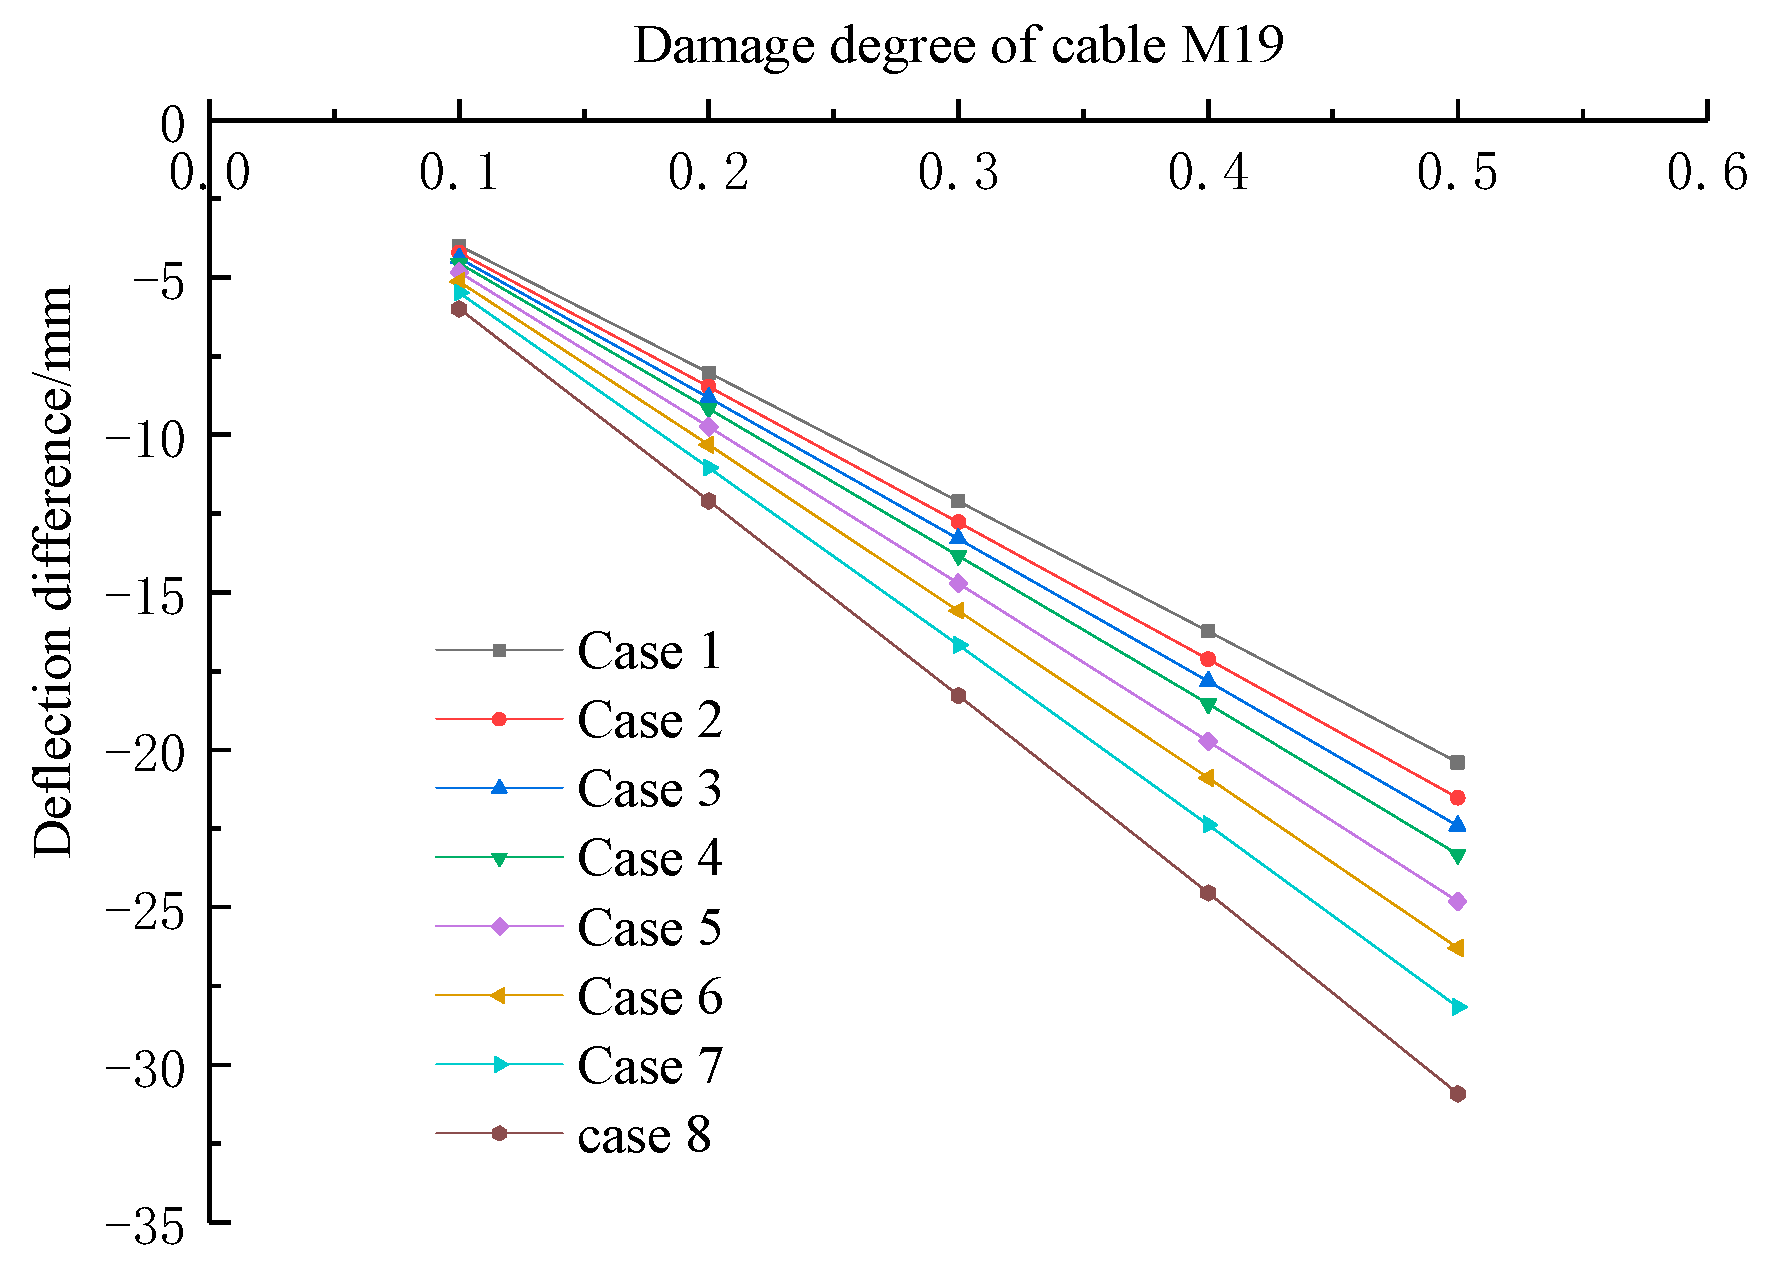
The distribution curves of the deflection difference of the girder under the working conditions listed in Table 4 can be obtained, as shown in Figure 8. As shown in Figure 9, the variation of the peak values of the girder’s deflection difference with different damage degree under the working conditions listed in Table 3 (M19 damage 10–50%) can be obtained.
Table 4.
Value of theoretical elastic modulus of the girder in each working condition.
According to Figure 11 and Figure 12, when M19 is damaged (10%), the distribution curves of the deflection difference at the anchorage point of the damaged cables have the largest value (peak points), and the peak values increase with the reduction of the bending stiffness of the girder. The girder’s bending stiffness is different, and the change rate of the peak values increasing linearly with the increase of the damage degree of cable M19 is different. The smaller the girder’s bending stiffness is, the greater the coefficient of the peak value increases with the increase of the cable damage degree; that is, the smaller the girder’s bending stiffness is, the more sensitive the girder’s deflection change is to the cable damage.
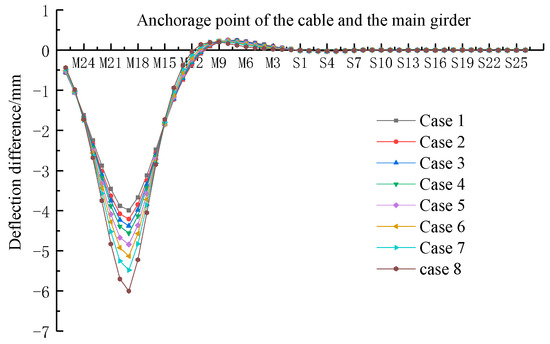
Figure 11.
The distribution curve of the deflection difference of the girder before and after M19 damaged when the stiffness of the girder changed.
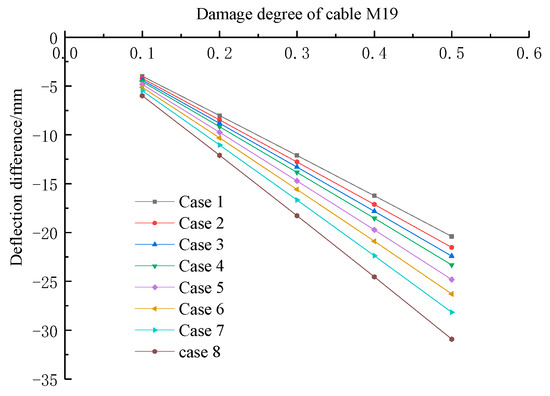
Figure 12.
The variation curve of the peak of the deflection difference of the girder with the damage degree of cable M19 when the stiffness of the girder changed.
4.3. Influence of the Ambient Temperature Change on the Distribution of the Deflection Difference of the Girder
In practical engineering, the stress and deformation of the cable-stayed bridges are affected by the change of the ambient temperature. The influence of the overall structural temperature and cable–girder temperature difference on the distribution law of the girder’s deflection difference is considered. According to the environmental climate conditions of the bridge site, the ambient temperature is set to vary from −20 °C to +40 °C, and the vertical linear shape of the girder corresponding to the ambient temperature of +25 °C is taken as the reference (assuming that the deflection of the cable-stayed bridge under the action of dead weight is 0).
- (1)
- Influence of the overall structural temperature on the distribution of the deflection difference of the girder
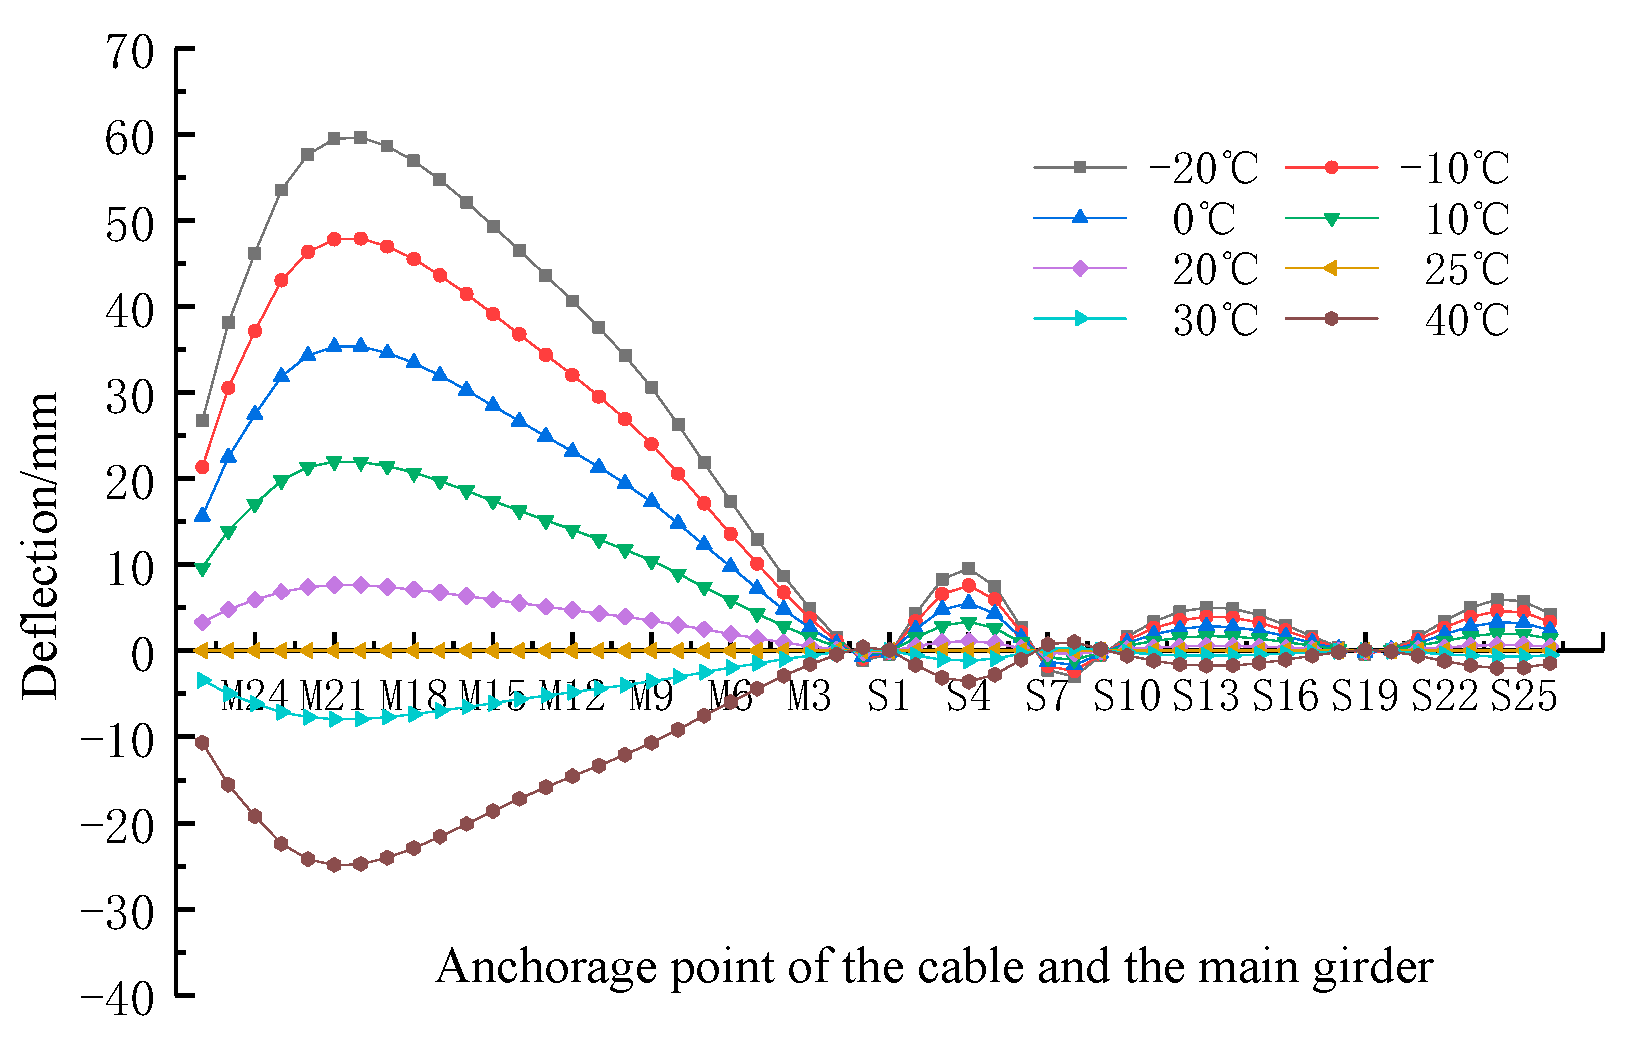
As shown in Figure 13, they are the deflection distribution curves of the beam corresponding to different ambient temperatures in the healthy state of the bridge. Figure 14 shows the variation of the deflection of the girder at different positions (different anchorage points of the cables) with the ambient temperature in the healthy state of the bridge.
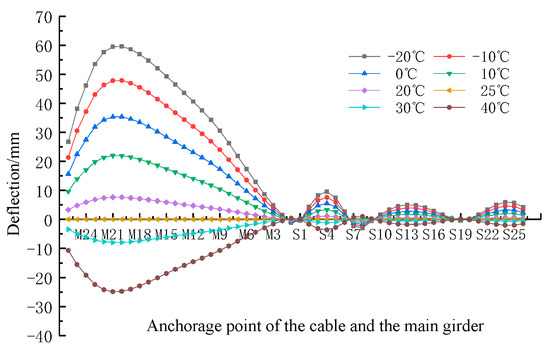
Figure 13.
The deflection distribution curves of the girder with the overall temperature changed.
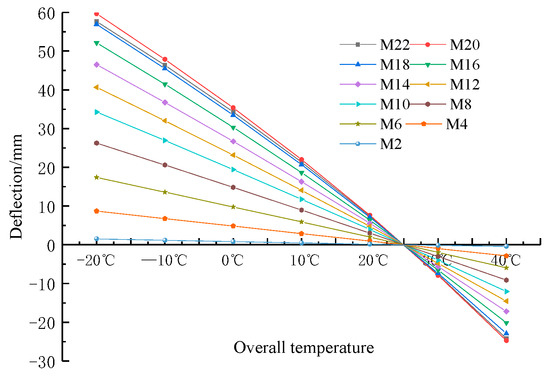
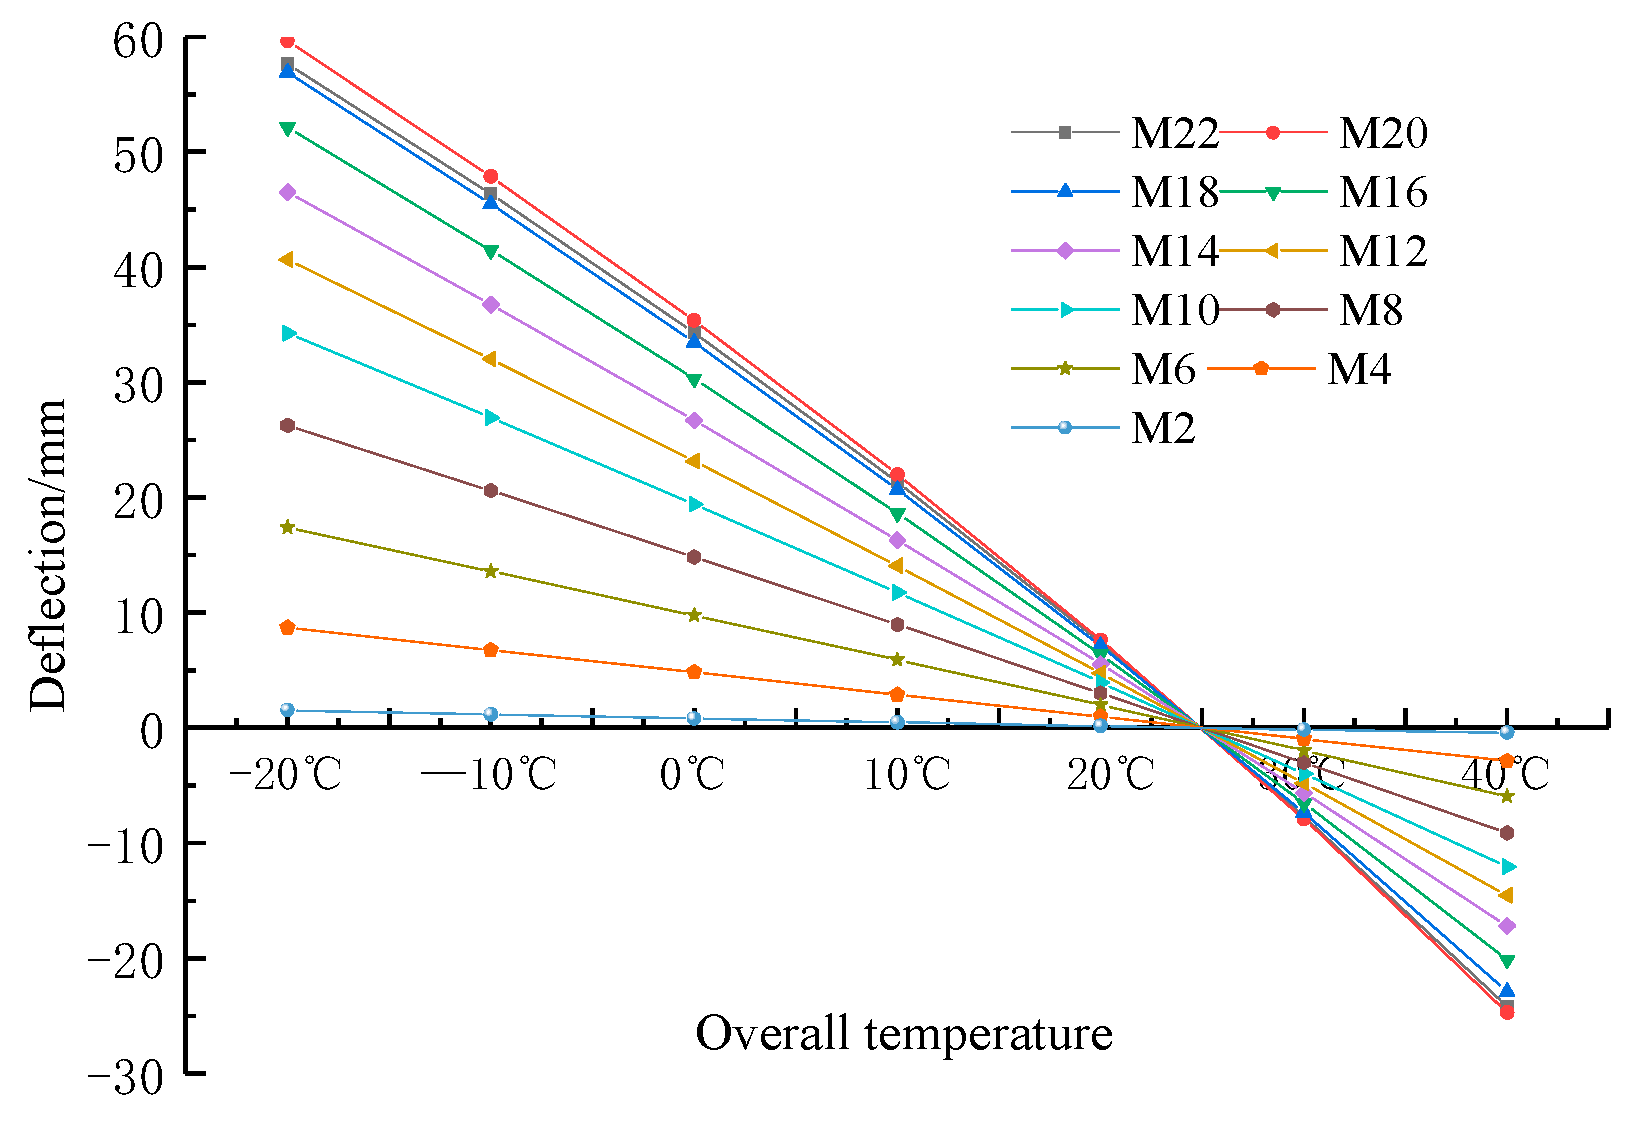
Figure 14.
The deflection curves at different positions of the girder varying with the overall temperature.
According to Figure 13 and Figure 14, the deflection distribution curves of the girder corresponding to different ambient temperatures are different. When the ambient temperature is higher than +25 °C (overall temperature rises), the deflection of the girder at each point is larger as the temperature increases. When the overall temperature rises to +40 °C, the maximum deflection of the girder is 24.9 mm. When the ambient temperature is lower than +25 °C (overall falls), the girder body will arch upward. The lower the temperature is, the larger the arch value will be at each point of the girder body. When the overall temperature is −20 °C, the maximum arch value will be 59.64 mm.
It can be seen that the overall temperature has a great influence on the deflection of the girder body after the bridge is completed. The deflection of the girder at different positions changes with the ambient temperature in an approximate linear law, and the rate of the change of each point is different.
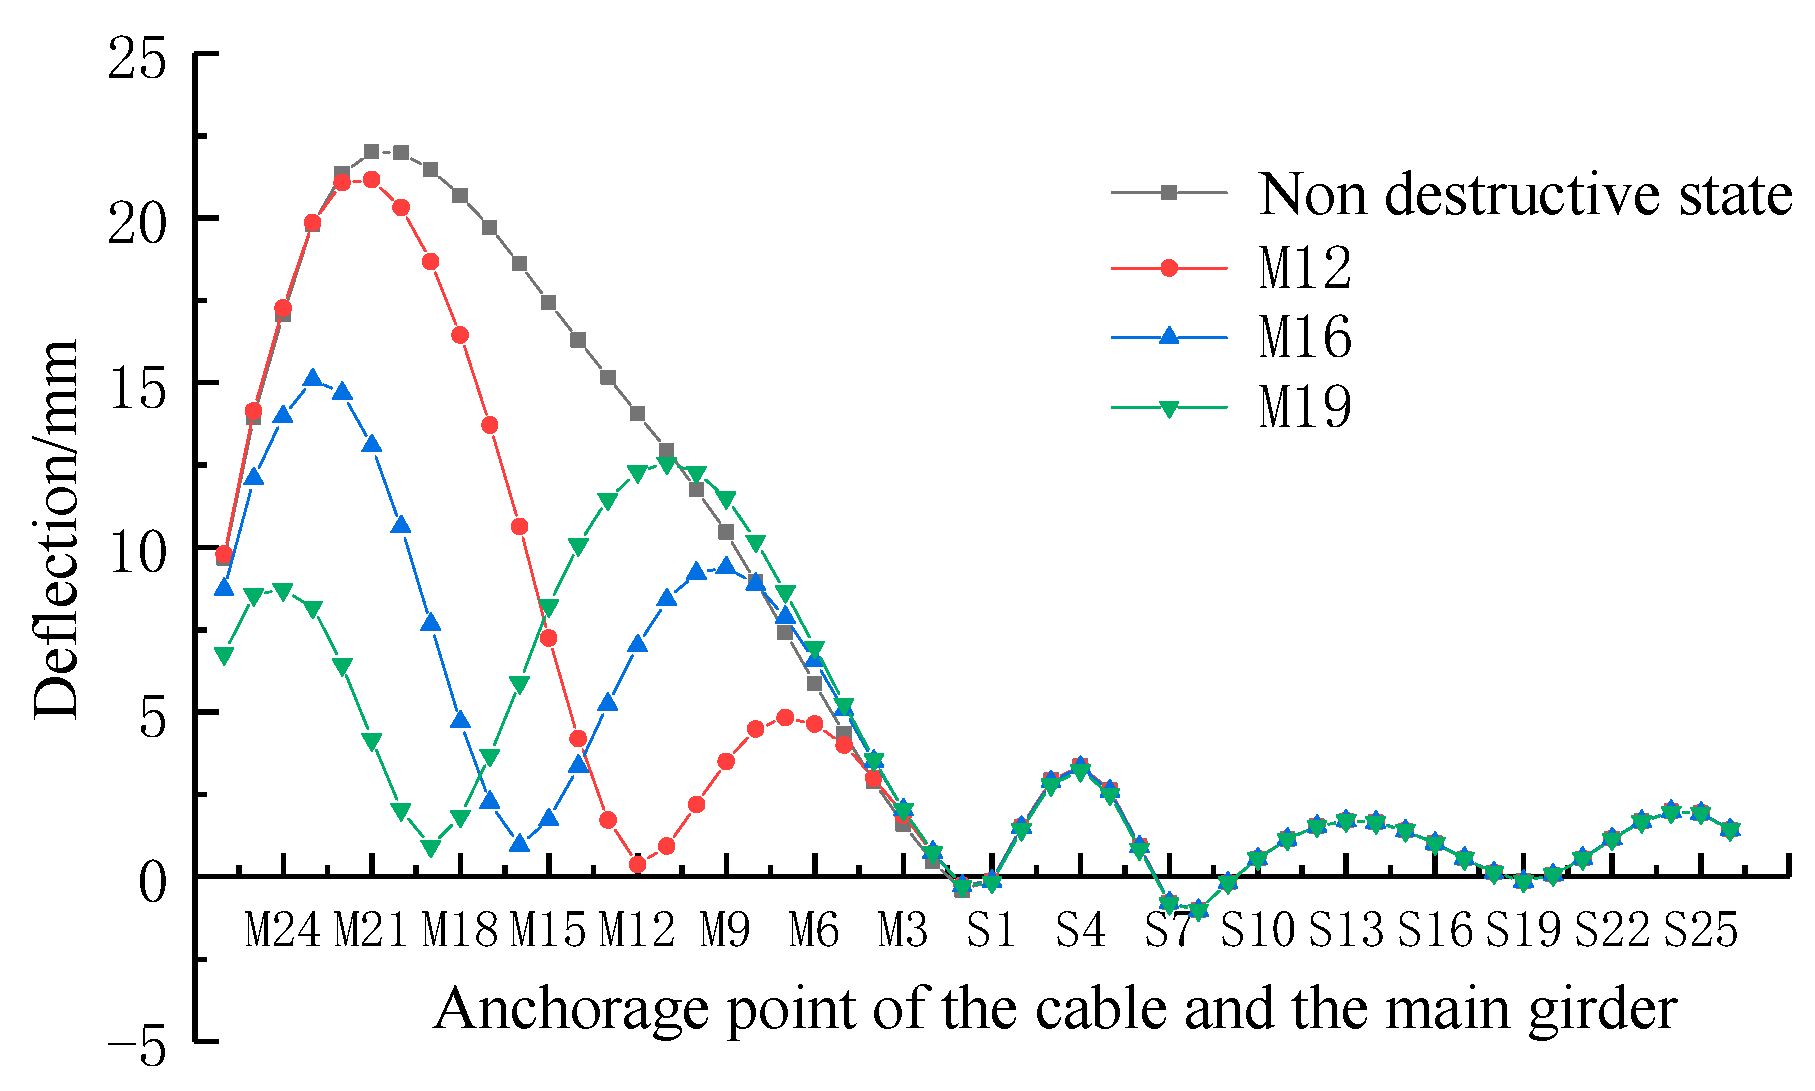
Figure 15 is a comparison of the deflection distribution curves of the anchorage points of each cable without cable damage and M12, M16 and M19 with damage (50%) when the overall temperature drops by 15 °C. Considering the overall temperature drop of 15 °C, the deflection of the girder corresponding to cable M12, M16 and M19 with damage (50%) is different from that of the girder without cable damage, and the deflection distribution curves of the girder are shown in Figure 16.

Figure 15.
The deflection distribution curve of the girder in nondestructive state and after the cable damaged (50%) When the overall temperature dropped 15 °C.
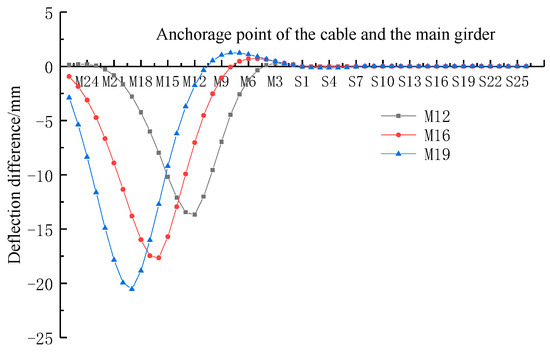
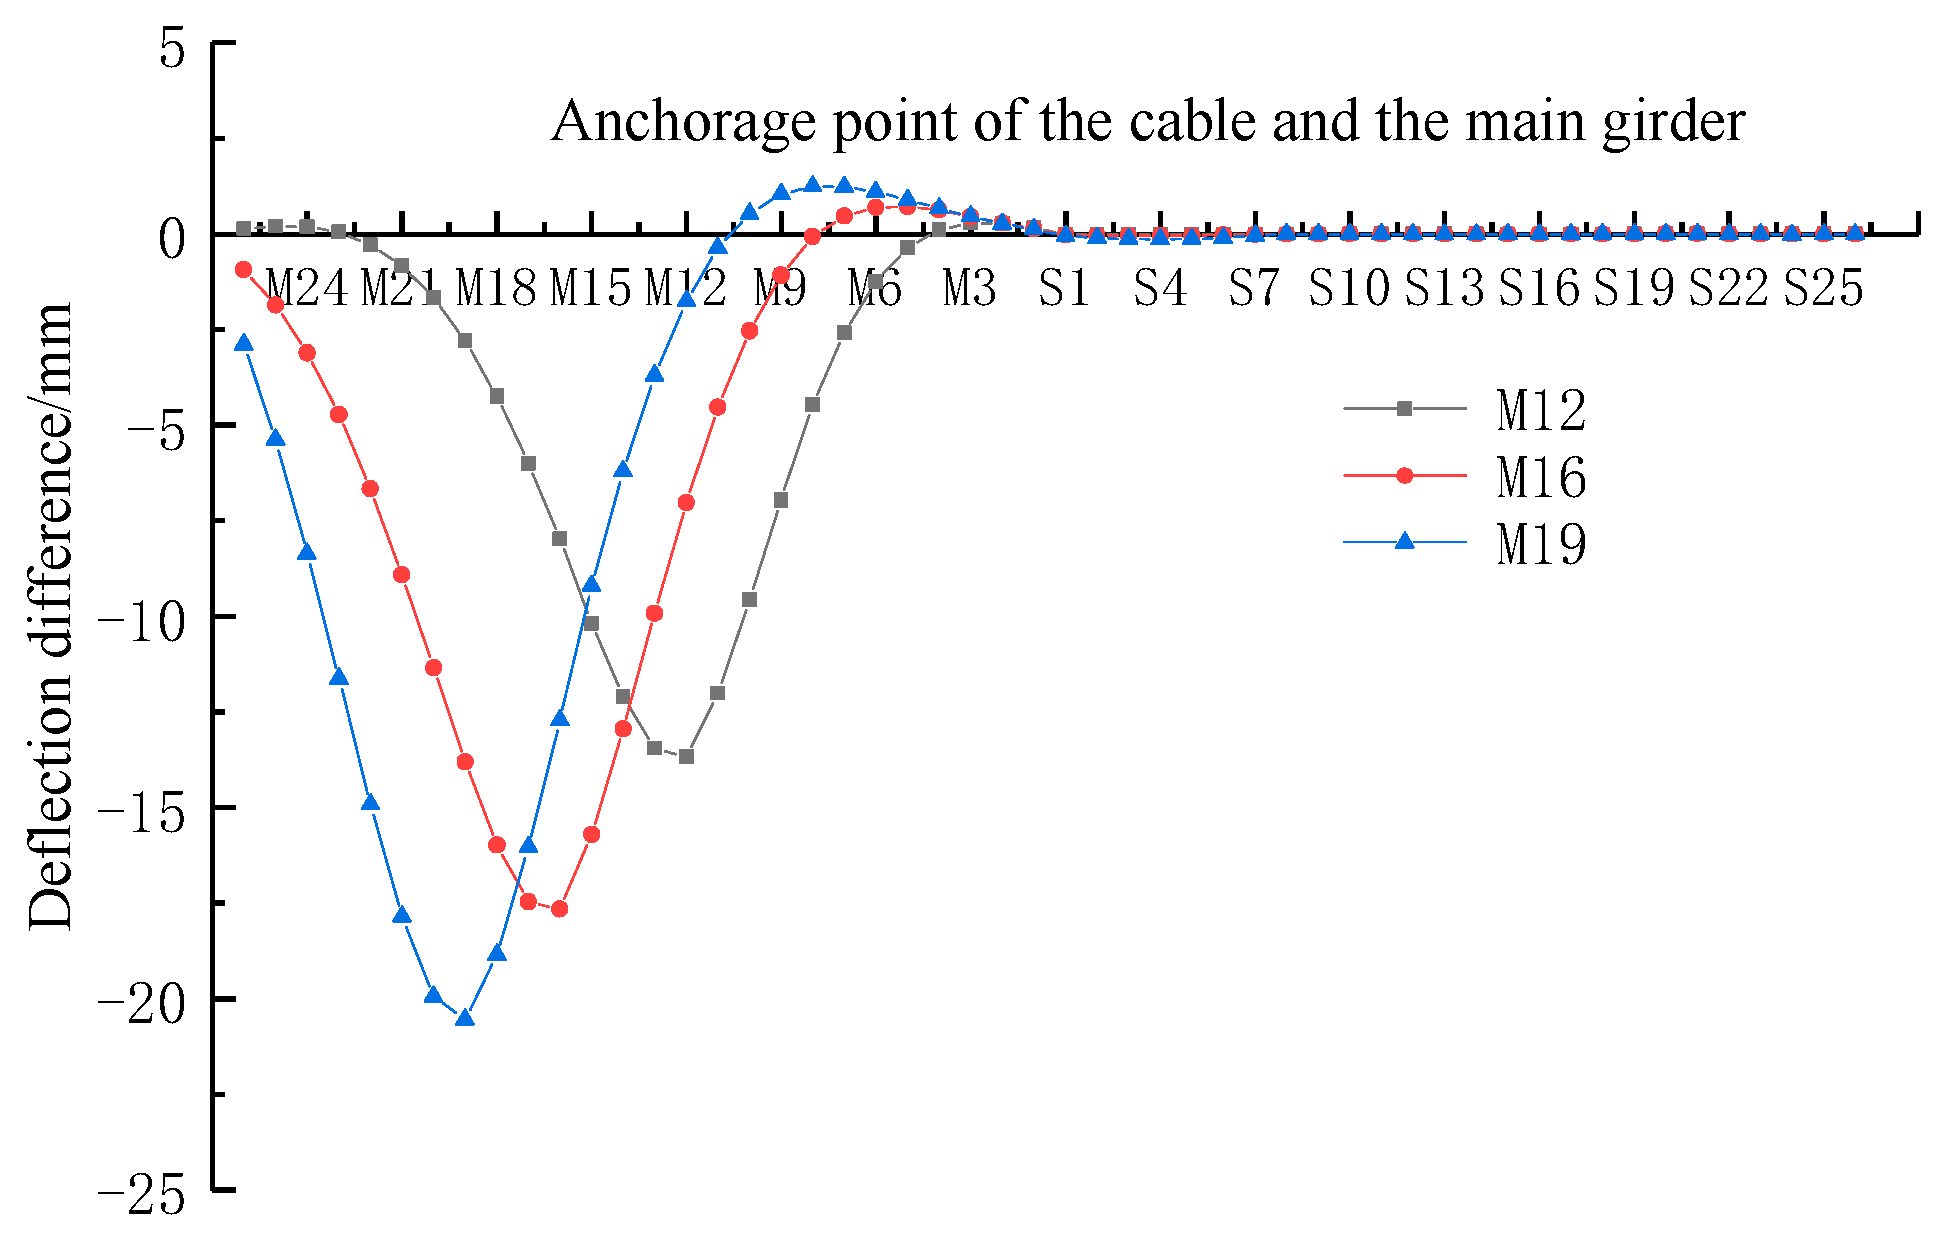
Figure 16.
The deflection difference distribution curve of the girder before and after the cable damaged (50%) When the overall temperature dropped 15 °C.
According to Figure 15, when the overall ambient temperature drops by 15 °C, the corresponding girder’s deflection distribution curves before and after a cable damage (50%) are significantly different. However, by comparing Figure 16 with Figure 7 and Figure 8, we can see that if the deflection distribution curve of the girder in the healthy state (before cable damage) is subtracted from the deflection distribution curve of the girder after the cable damage measured at the corresponding ambient temperature. The result obtained is the same as the deflection difference of the girder before and after cable damage without considering the influence of the temperature’s change. In other words, the change of the ambient temperature (the overall rise and fall of the temperature) has little effect on the variation and distribution of the girder’s deflection difference.
- (2)
- Influence of cable–girder temperature difference on the distribution of the deflection difference of the girder.
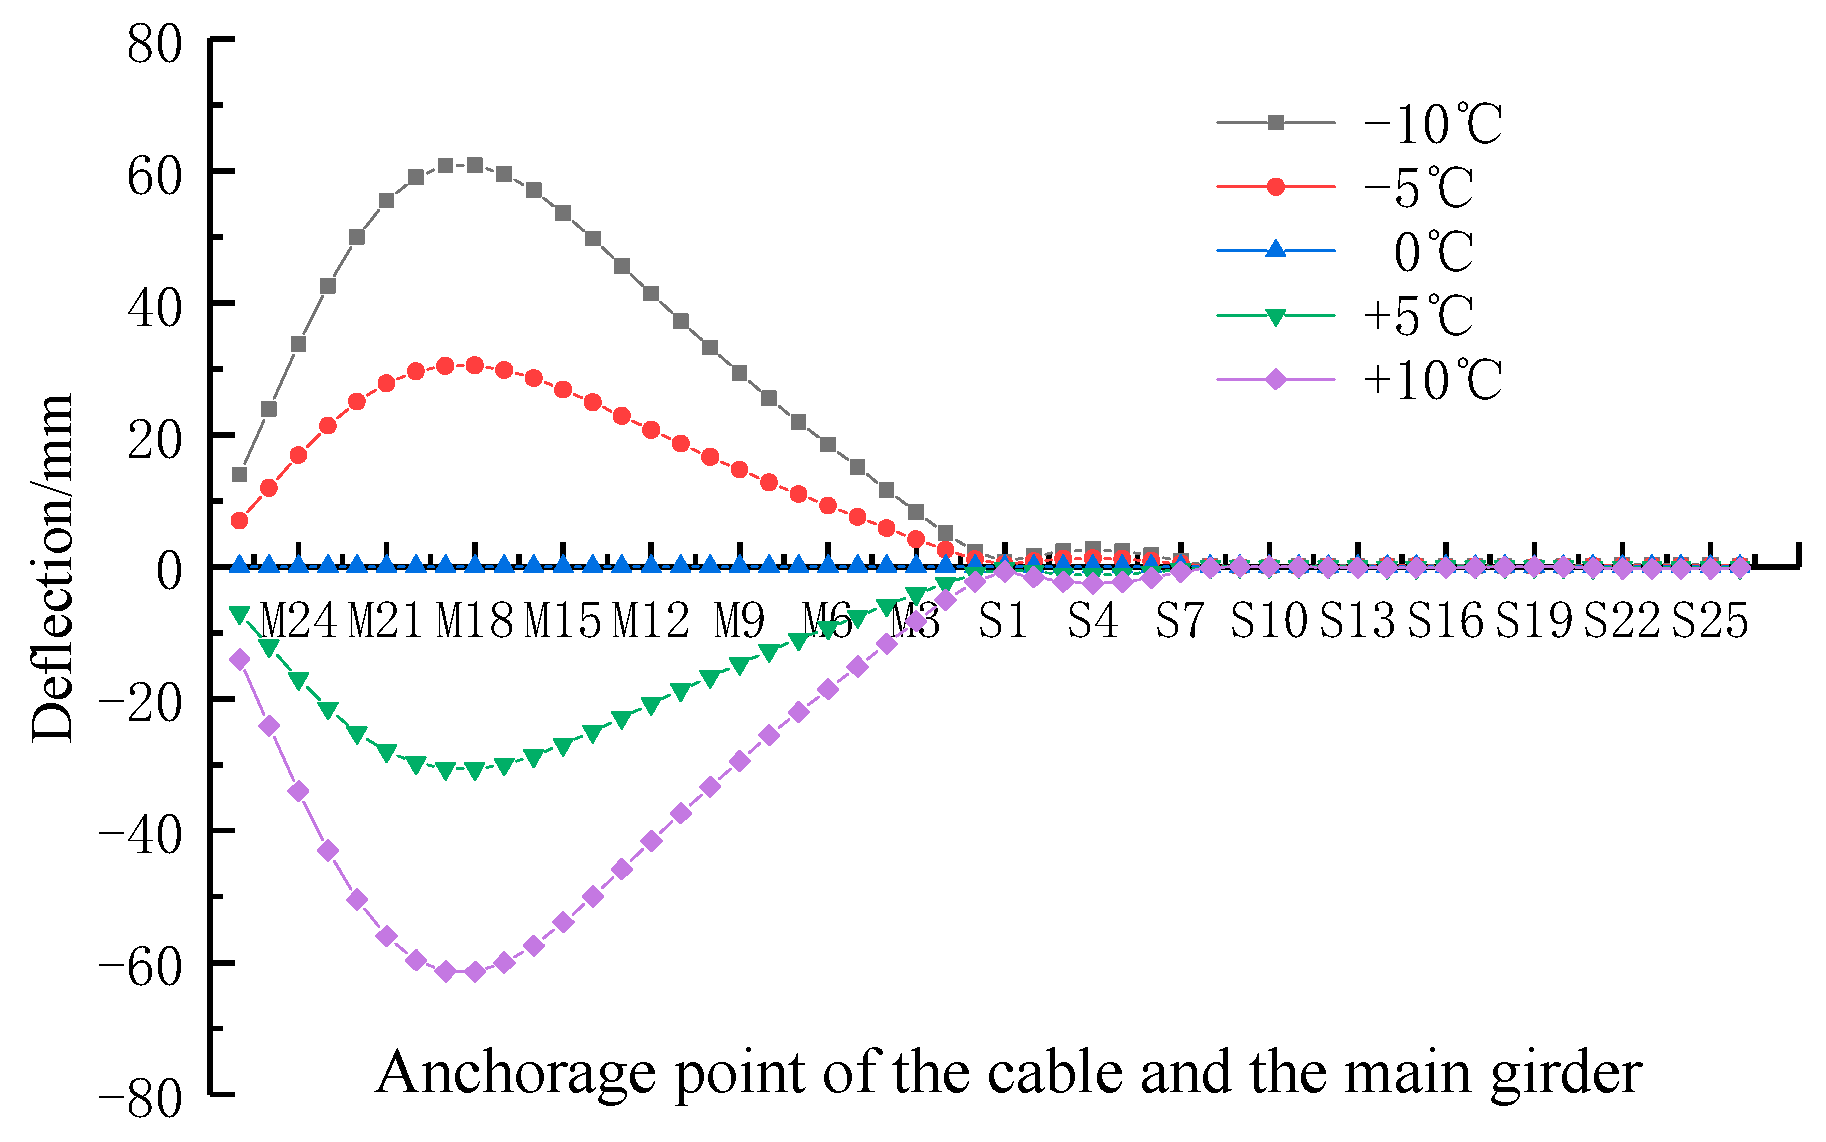
Because the cables are made of steel, the thermal conductivity is large. The main girder is made of concrete material; the thermal conductivity is low; when the ambient temperature changes, the temperature of the cables change with the ambient temperature faster than that of the main girder, so that the temperature difference between the cable and the main girder appears. For simplicity, the average temperature of the main girder is assumed to be +25 °C, and the cables’ temperatures are considered as 15 °C, 20 °C, 30 °C and 35 °C, respectively, forming four cable–girder temperature differences (−10 °C, −5 °C, +5 °C and +10 °C). The influence of cable–girder temperature difference on the variation law of the girder’s deflection of the cable-stayed bridge in healthy state is analyzed. Figure 17 shows the distribution curve of the deflection of the girder in the healthy state of the bridge under different cable–girder temperature differences, and Figure 18 shows the law of the deflection of the girder at different positions (partial anchorage points) changing with cable–girder temperature difference.
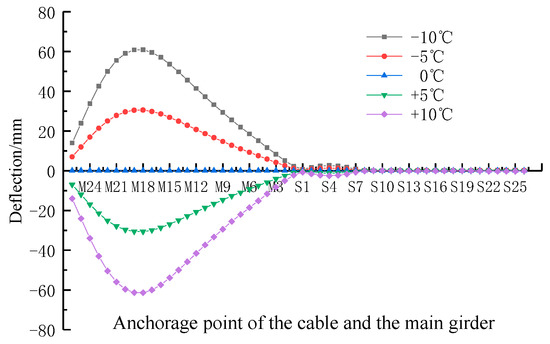
Figure 17.
The distribution curve of the deflection of the girder under different cable–girder temperature difference in healthy state.
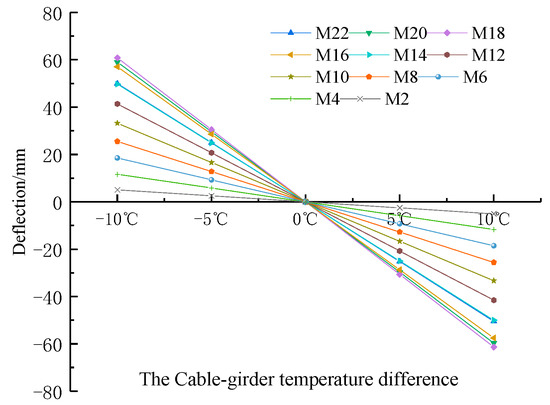
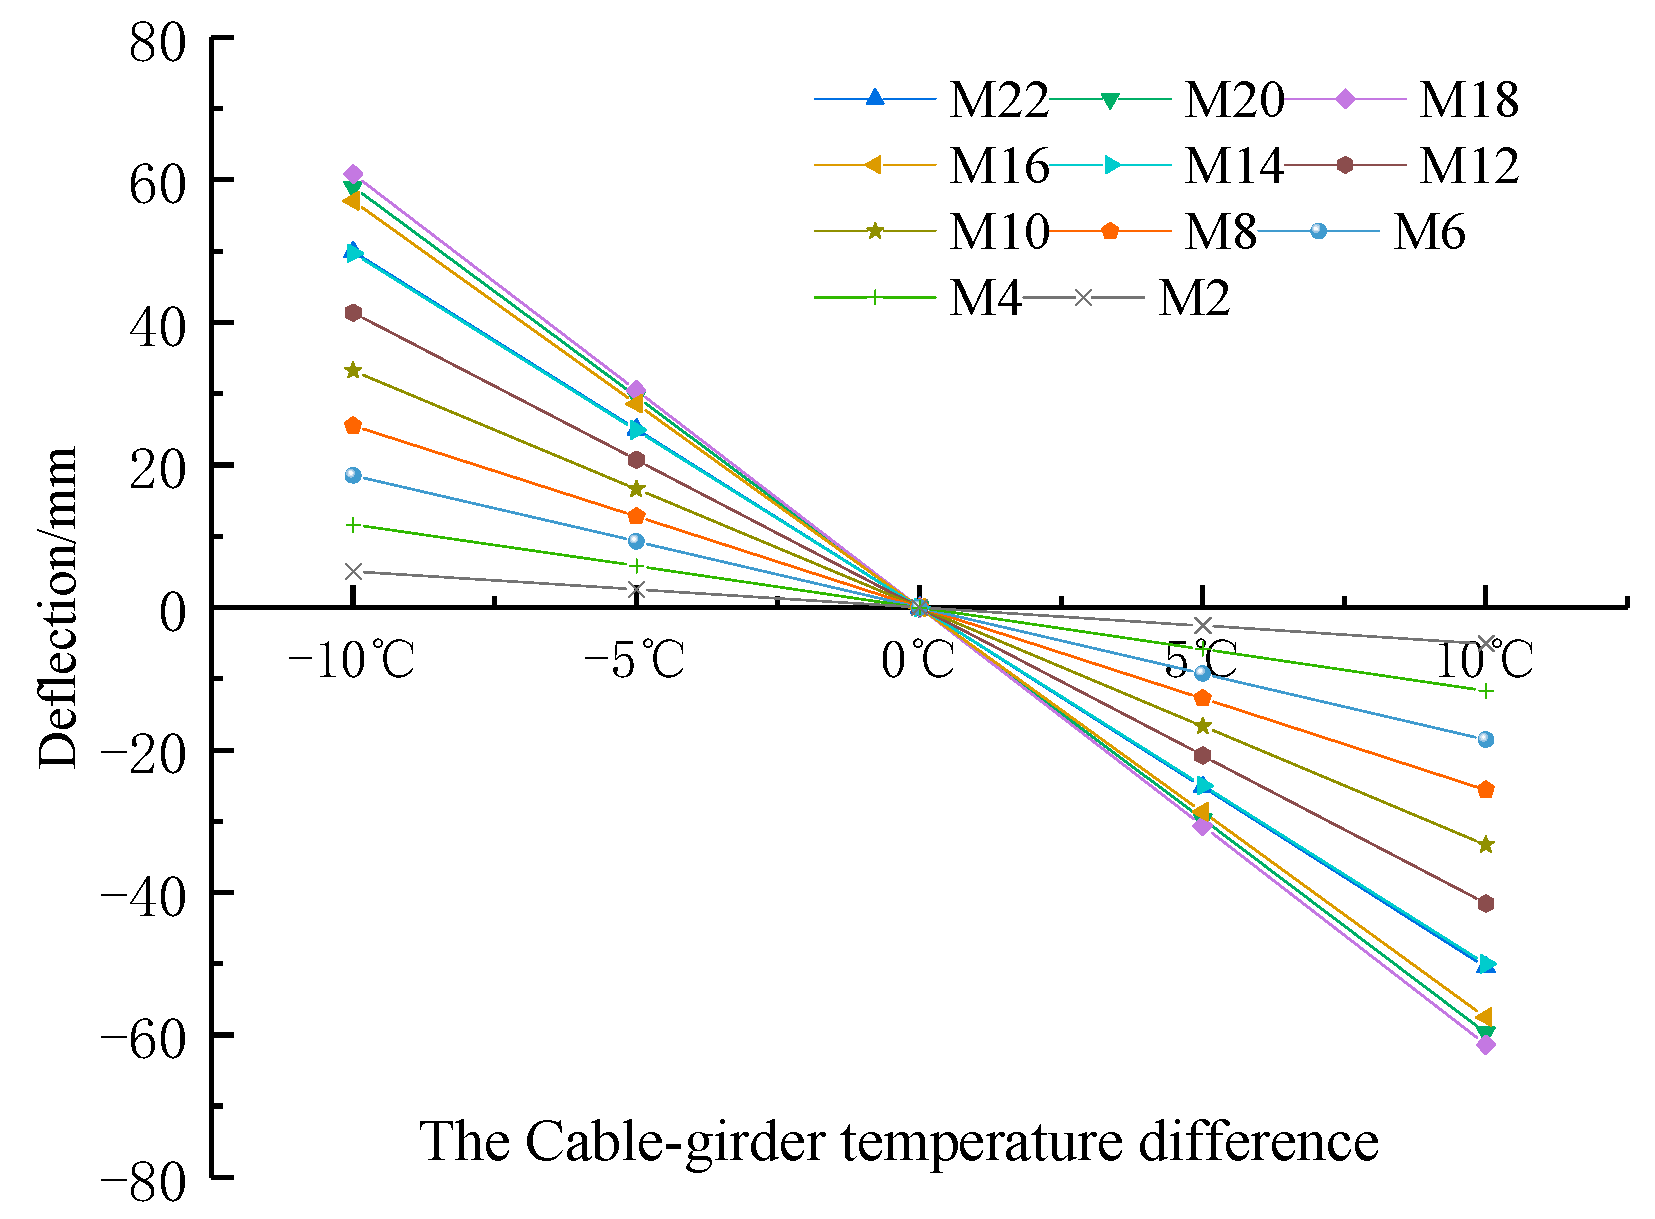
Figure 18.
The deflection curve at different positions of the girder varying with cable–girder temperature difference.
According to Figure 17 and Figure 18, when cable–girder temperature difference is negative (the cable’s temperature is lower than the girder’s temperature), the girder will arch upward. With the increase of cable–girder temperature difference, the upper arch value of each point of the girder will be larger. When cable–girder temperature difference is positive (the cable’s temperature is higher than the girder’s temperature), the girder will flex down. With the increase of cable–girder temperature difference, the deflection value of each point of the girder will be larger. When cable–girder temperature difference is +10℃, the maximum deflection value of the girder is 61.4 mm. No matter whether cable–girder temperature difference is positive or negative, the effect of cable–girder temperature difference has a great influence on the deflection of the girder. The deflection of each point of the girder changes linearly with cable–girder temperature difference, and the change rate of each point is different.
Figure 19 is a comparison of the deflection distribution curves of anchorage points of each cable of the girder without cable damage and after the cable M12, M16 and M19 are damaged (50%) when cable–girder temperature difference is +10 °C (the girder’s temperature is +25 °C and the cable’s temperature is 35 °C).
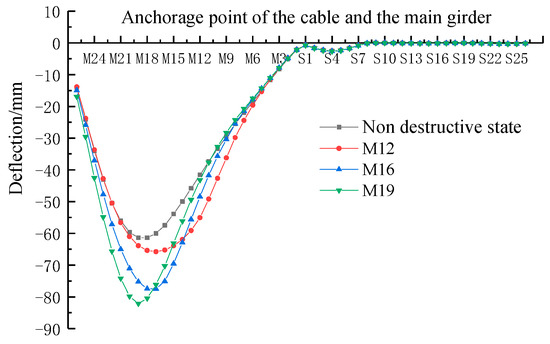
Figure 19.
The deflection distribution curve of the girder in nondestructive state and after cable damaged (50%) at cable–girder temperature difference of +10 °C.
As can be seen from Figure 19, when cable–girder temperature difference is +10 °C, the corresponding girder’s deflection distribution curves before and after a cable damage (50%) are significantly different.
If the girder’s deflection in the healthy state is subtracted from the girder’s deflection after cable M12, M16 and M19 are damaged (50%) in Figure 19, the distribution curve of the girder’s deflection difference obtained is the same as that in Figure 16. In other words, when considering cable–girder temperature difference, the influence of cable–girder temperature difference on the distribution curve of the girder’s deflection difference can also be eliminated after subtracting the deflection of the girder before the cable damage from the deflection after the cable damage.
- (3)
- Influence of girder’s temperature gradient on the girder’s deflection difference distribution law before and after the cable damage
Similarly, it can be seen that the temperature gradient change of the girder also has a significant influence on the deflection of the girder; that is, when the temperature gradient change of the girder is taken into account, the corresponding deflection distribution curves before and after the cable damage have a significant difference, but the influence on the deflection distribution curves of the girder before and after the cable damage is also negligible (the analysis data are omitted).
5. Discussion
In this paper, the sensitivity of beam body deflection to cable damage is verified by numerical simulation. Temperature change has little influence on the beam body deflection difference, which can be ignored. Therefore, the damage of cable can be identified based on the beam body deflection difference, and the position and degree of damage can be identified according to the law of beam body deflection difference distribution curve. The following questions are worth discussing.
Only numerical simulation analysis is done in this paper. Next, the model experiment is used to verify the theory of this paper. The sensitivity of beam deflection to cable damage can be used to explore the method of cable damage identification.
For practical engineering applications, the deflection difference of each anchorage point in any damage state can be obtained from the line shape difference measured under non-traffic conditions (such as at night) and in the completed state.
6. Conclusions
Based on the analysis of the influence of the cable damage (different degrees of cable damage at different positions), ambient temperature change and overall stiffness of the main girder on the variation and distribution of the deflection, the results show that before and after the cable damage of the cable-stayed bridge, the variation of the deflection difference has obvious characteristics. Specific conclusions are as follows:
- Under the action of dead weight, the deflection difference at each point of the girder is different after the damage of a single cable or multi-cable (the side where the damage cable is located), and the deflection difference is the largest at the anchorage point of the damaged cable (there is a sharp point). For the damage of a single cable, the deflection difference corresponding to the same degree of damage of a cable at different positions is different. The deflection difference corresponding to the damage of a cable near the midspan is large, while the deflection difference of the girder corresponding to the damage of a cable near the support (or bridge tower) is small, and the deflection difference at the tip is proportional to the damage degree of the cable.
- When the bending stiffness of the main girder is degraded as a whole, if the damage degree of the cable is certain, the distribution curve of the deflection difference increases linearly at the anchorage point of the damage cable with the decrease of the bending stiffness of the main girder. The smaller the girder stiffness, the greater the coefficient of increase of the deflection difference. That is, the smaller the girder’s bending stiffness, the more obvious the change of the deflection difference.
- The ambient temperature change (including the overall temperature, cable–girder temperature difference and the temperature gradient) has a great influence on the deflection of the girder. However, the influence of ambient temperature change on the deflection difference distribution curves of the girder is small, which can be ignored.
Author Contributions
Conceptualization, Y.Y.; methodology, H.L.; investigation, H.L.; validation, Y.Y.; writing—original draft preparation, Y.Y.; writing—review and editing, M.S. and Y.Y.; resources, M.S.; funding acquisition, M.S. All authors have read and agreed to the published version of the manuscript.
Funding
This work was funded by the National Natural Science Foundations of China (Grant No. 51278315).
Institutional Review Board Statement
Not applicable.
Informed Consent Statement
Not applicable.
Data Availability Statement
No new data were created or analyzed in this study.
Acknowledgments
The authors gratefully acknowledge funding from the National Natural Science Foundations of China (Grant No. 51278315).
Conflicts of Interest
The authors declare no conflict of interest.
References
- Liang, Z.; Li, N.; Zheng, C. Sensitivity Analysis of Cable Damage Based on Monitoring of Deflection and Cable Tension. Highway 2009, 3, 39–43, CNKI:SUN:GLGL.0.2009-03-011. [Google Scholar]
- Zhang, X.T.; Yu, H.; Qin, W.B. Sensitivity analysis of structural parameters of steel box girder cable-stayed bridge. J. Shandong Univ. Sci. Technol. (Nat. Sci.) 2020, 39, 41–47+55. [Google Scholar] [CrossRef]
- Wang, S.W.; Xiang, C.F.; Li, T.T. Analysis of Parameters’ Sensitivities of Cable-stayed Bridge with Shaped Single Tower. Highw. Eng. 2015, 40, 137–142+147. [Google Scholar] [CrossRef]
- Zhou, Y.J.; Wu, L.L.; Liu, J. Research on Geometry Sensitive Parameters for PC Extradosed Cable-stayed Bridge. Highway 2020, 65, 86–91. [Google Scholar]
- Liu, X.Z.; Huang, P.M.; Xu, H.Z. Analysis of parameters’ sensitiveness of cable-stayed bridges with single tower. J. Chang. Univ. (Nat. Sci. Ed.) 2007, 6, 63–66. [Google Scholar] [CrossRef]
- Zhu, J.; Huang, T.; Zhou, C. Sensitivity analysis on finished state of a long-span arch supported single pylon cable-stayed bridge for high-speed railway. J. Railw. Sci. Eng. 2021, 18, 2244–2254. [Google Scholar]
- Wang, X.Y.; Lei, W.L.; Yang, Y. The Correlative Analysis of Temperature and Stress Based on Monitoring Data on the Cable-Stayed Bridge. Appl. Mech. Mater. 2013, 256, 1509–1514. [Google Scholar] [CrossRef]
- Yao, C.R.; Li, Y.D. Research on Temperature Influences in Cable-Stayed Bridges’Health Monitoring. Appl. Mech. Mater. 2012, 188, 162–167. [Google Scholar] [CrossRef]
- Wu, W.H.; Chen, C.C.; Chen, Y.C.; Lai, G.; Huang, C.M. Tension determination for suspenders of arch bridge based on multiple vibration measurements concentrated at one end. Measurement 2018, 123, 254–269. [Google Scholar] [CrossRef]
- Ren, J.; Zhang, B.; Zhu, X.; Li, S. Damaged cable identification in cable-stayed bridge from bridge deck strain measurements using support vector machine. Adv. Struct. Eng. 2022, 25, 754–771. [Google Scholar] [CrossRef]
- Marzuki, N.A.; Yussof, M.M.; Azhar, M.S.; Choong, K.K.; Yee, H.M. Experimental on the Damages of the Cable-Net Structure Under Static Performance. In Proceedings of the AICCE’19: Transforming the Nation for a Sustainable Tomorrow 4, Penang, Malaysia, 21–22 August 2019; Springer International Publishing: New York, NY, USA, 2020; pp. 1245–1256. [Google Scholar]
- Wang, W.; Su, M.; Wang, C. Static Deflection Difference-Based Damage Identification of Hanger in Arch Bridges. KSCE J. Civ. Eng. 2022, 26, 5096–5106. [Google Scholar] [CrossRef]
- Wang, W.; Su, M. Damage Identification in Hangers of Through-Arch Bridges Using Static Deflection Difference at the Anchorage Point. Appl. Sci. 2021, 11, 10780. [Google Scholar] [CrossRef]
- Zhang, L.; Qiu, G.; Chen, Z. Structural health monitoring methods of cables in cable-stayed bridge: A review. Measurement 2021, 168, 108343. [Google Scholar] [CrossRef]
- Lin, S.-W.; Yi, T.-H.; Li, H.-N.; Ren, L. Damage Detection in the Cable Structures of a Bridge Using the Virtual Distortion Method. J. Bridge Eng. 2017, 22, 04017039. [Google Scholar] [CrossRef]
- Mohammad Zarbaf, S.E.H.A.; Norouzi, M.; Allemang, R.J.; Hunt, V.J.; Helmicki, A.; Nims, D.K. Stay Force Estimation in Cable-Stayed Bridges Using Stochastic Subspace Identification Methods. J. Bridge Eng. 2017, 22, 4017055. [Google Scholar] [CrossRef]
- Xu, J.; Sun, H.; Cai, S. Effect of symmetrical broken wires damage on mechanical characteristics of stay cable. J. Sound Vib. 2019, 461, 114920. [Google Scholar] [CrossRef]
- Long, Y. Calculation of Beam on Elastic Foundation; People’s Education Press: Beijing, China, 1981. [Google Scholar]
- Stolarski, T.; Nakasone, Y.; Yoshimoto, S. Engineering Analysis with ANSYS Software; Butterworth-Heinemann: Oxford, UK, 2018. [Google Scholar]


Disclaimer/Publisher’s Note: The statements, opinions and data contained in all publications are solely those of the individual author(s) and contributor(s) and not of MDPI and/or the editor(s). MDPI and/or the editor(s) disclaim responsibility for any injury to people or property resulting from any ideas, methods, instructions or products referred to in the content. |
© 2023 by the authors. Licensee MDPI, Basel, Switzerland. This article is an open access article distributed under the terms and conditions of the Creative Commons Attribution (CC BY) license (https://creativecommons.org/licenses/by/4.0/).