Article

Estimating Maximum Surface Settlement Caused by EPB Shield Tunneling Utilizing an Intelligent Approach

by
Tohid Moghtader
1,
Ahmad Sharafati
1,*,
Hosein Naderpour
2 and
Morteza Gharouni Nik
3
1
Department of Civil Engineering, Science and Research Branch, Islamic Azad University, Tehran, Iran
2
Faculty of Civil Engineering, Semnan University, Semnan, Iran
3
School of Railway Engineering, Iran University of Science and Technology (IUST), Tehran, Iran
*
Author to whom correspondence should be addressed.
Buildings 2023, 13(4), 1051; https://doi.org/10.3390/buildings13041051
Submission received: 20 March 2023 / Revised: 4 April 2023 / Accepted: 11 April 2023 / Published: 17 April 2023

Abstract

:
To control tunneling risk, the prediction of the surface settlement rate induced by shield tunneling using earth pressure balance plays a crucial role. To achieve this, ten independent variables were identified that can affect the amount of settlement. The nonlinear relationship between maximum ground surface settlements and ten influential independent variables was considered in artificial neural network (ANN) models. A total of 150 genuine datasets derived from the Southern Development Section of the Tehran Metro Line 6 project were used to train, validate, and test ANN techniques. Hence, the ground surface settlements of the mentioned project were predicted by the most accurate back propagation ANN technique. Ultimately, the importance level of different influential parameters on ground settlement at tunneling is relatively determined based on the results of the optimal neural network. The results used in this paper to evaluate the relative importance of each variable involved in the rate of ground surface settlement demonstrate that the parameters of grout injection and permeability equivalent to the proportions of approximately 16.91% and 5.07% have the highest and lowest impact, successively.

1. Introduction

In recent decades, urbanization has developed. Furthermore, encountering inevitable heavier traffic on the roads, highways, and freeways in the densely populated megacities has intensified. Hence, constructing the metro plays an increasingly pivotal role in declining traffic jams.
Additionally, the inherent value of land in densely populated cities, specifically metropolis areas, has grown in recent years. Thus, the construction of spaces and underground buildings, such as the construction of underground commercial malls, as well as subway networks, has developed rapidly. The subway tunnels have been frequently excavated by the techniques based on the shield because of its merits comprise tunneling at a considerable speed, less influence on the rate of surface traffic, etc. [1,2]. Despite the undeniable advantages that tunneling with a TBM-EPB shield has, its drawbacks must also be considered. Undoubtedly, a significant factor that must be considered is the tunneling impact on the settlement of adjoining soil [3]. If the soil deformation surpasses an admissible amount, encountering financial risks would be inevitable for a project [4]. Although the purpose of this research was not to study the application of different methods to strengthen the tunnel crown to prevent soil displacements during excavation and ultimately collapse, using wasted tire chips mixed with sand (so-called sand–tire mixture) as a reinforcement material can be an excellent executive solution to prevent such incidents [5]. Furthermore, Liang et al. studied how a shallow tunnel collapses by utilizing the upper-bound analysis technique. For the problems with variable endpoints, they take the variational method into consideration [6].
In fact, in this paper, it is significant to be aware of probable surface settlements based on the prediction of the settlement rate during tunneling.
To decrease the ground surface settlement rate induced by imposed soil pressure and prevent these circumstances, a TBM-EPB can be used to excavate the soft soil, specifically in the densely populated megacities. The mechanism of this machine is based on balancing front face stress with mud pressure, which is behind the cutter head to reduce the influence on the adjacent soil deformation [7]. Moreover, open-face TBM can be an appropriate alternative to decline the settlement rate at tunneling. Open-face machines can be used in either dry or soft soil, but they can also be utilized for solid rock with the right drilling heads. However, even if this criterion is met in the tunneling projects by opting for an appropriate TBM, it is still highly vital to estimate the proportion of the surface settlement [3].
In recent decades, different methods and techniques have been utilized by experts to assess the surface settlement percentage. It is imperative to note that these theories comprise the following: firstly, theoretical calculations included empirical formulae [8,9,10] and analytical solutions [11,12]; secondly, experimental and numerical simulations [13,14,15]; and thirdly machine learning techniques [3]. Albeit the first- and second-mentioned methods will still accompany many noticeable constraints. To exemplify, both of them can be inapplicable to the geotechnical conditions with a high range of uncertainty and complex techniques of excavation [16]. Moreover, it can be difficult to recognize and opt for the influential parameters of the complicated soil constitutive patterns in forming the settlement and their modeling at the tunneling process [17,18]. Due to the mentioned reasons and the weakness of the first and second methods, machine learning has been developed for the past decades. Therefore, it is an efficient and accurate tool for tackling nonlinear problems accompanied by a high number of factors and dimensions [19,20,21].
In fact, in the machine learning methods, we can witness an inconspicuous and effective relationship between input components and output variables in a short time and at dramatic acceleration. Hence, in several of these algorithms, we can discover the complexity of the parameters’ conditions, which ultimately will be efficient in understanding the nature of the problems [22,23].
The backpropagation neural network (BPNN), which is one of the preliminary ANNs, is accompanied by rational and admittable robustness [24,25,26,27]. This ANN has been utilized for estimating the ground surface settlement rate induced by different tunneling methods [24,28].
Santos and Celestino [26] discovered the abilities and reliability of the artificial neural network through a robustness analysis and evaluated its validity. Pourtaghi et al. [17] presented a modified strategy by combining the wavelet hypothesis and ANN to expand a method that upgrades function approximation accuracy. This strategy alleges ANN’s capabilities, as well as a decreased network error.
Moreover, the various types of ANN, such as hybrid artificial neural networks (e.g., ABC-ANN, PSO-ANN, etc.), have been utilized to predict the amount of surface settlement in tunneling.
What can assist us in this kind of hybrid algorithm is opting for optimal variables used in ANNs. On the other hand, the best performances with the appropriate regression should be considered as a target. Ahangari et al. substantially enhanced the performance of ANNs with an innovative procedure. This paper’s methodology for predicting surface settlement was based on ANFIS and GEP integration [29]. In addition, Moeinossadat and Ahangari, in their research, used numerical simulation and intelligent methods to predict the maximum surface settlement caused by EPBM tunneling in Tehran Subway Line 7 and compared it with the measured data [30]. Furthermore, Kohestani et al. proposed a group-learning technique called random forest (RF) to assess the amount of ground surface settlement in tunneling projects [31]. Notably, the RF algorithm can process and model a broad range of variables and excessive observations at the optimal and minimum time [32].
One of the major state-of-the-art tools that has been enormously used in geotechnical studies is the support vector machine (SVM). Both types of classification and regression problems can be modeled and solved by this algorithm [33,34,35,36]. The distinctive attribute of SVM is that, in contrast to the method utilized in ANNs to evaluate the empirical risk minimization (ERM), it can be outstretched by the structural risk minimization (SRM) [37]. Concerning this matter, SVM predicts excellent estimated outputs in encountering problems having fewer parameters and datasets. Compared to ANNs, an influential way to promote the precision of networks would be equipping SVM with other optimization algorithms. Following this, a hybrid algorithm combining PSO and least squares of SVM was presented by Zhang et al. to anticipate the surface settlement in tunneling [18]. Adoko et al., via a comparison of an influential method named multivariate adaptive regression spline (MARS) and ANN and exerting these two ML models on a railway tunnel, succeeded in predicting the proportion of the tunnel optimized diameter convergence at weak rocks [38].
Moreover, the other types of ANN, such as the radial basis function (RBF), as well as extreme learning machine (ELM), have been enormously utilized to apply in the mentioned and relevant fields [39,40,41]. To clarify, by utilization of three various techniques called ANN, Gaussian processes (GPs), and SVM, Ocak and Seker predicted the ground surface settlement in Istanbul tunnels. This tunnel was excavated mechanized using EPB-TBM [42]. Plus, a robust partial-least-squares regression algorithm was used to connect and correlate surface settlements to TBM operational variables during the excavation of the Toulouse Metro Tunnel-Line B (France). This method was applied to two different collections of datasets [7].
Chen et al. alleged several shortcomings despite all of the merits of the methods based on ML that were used to predict surface settlement. To solve the problems, they compared six ML algorithms, namely SVM, BPNN, ELM, GRNN, WNN, and RF, to estimate the amount of tunneling-induced settlements in view of the feasibility and the capability of accomplishment [43].
Zhang et al. proposed and compared four different models—ANN, multivariate adaptive regression spline (MARS), support vector machine (SVM), and extreme gradient boosting (XGBoost)—to predict the surface settlement induced by TBM-EPB tunneling. Hence, according to the results, XGBoost illustrates fractionally more precision [3].
Additionally, Chen and Seo examined the mapping communication and comprehensively established the prediction technique between TBM operational data and the ground condition ahead of the excavation front, using site construction data from the Singapore Metro Line project. A multi-classifier competition mechanism is presented in this research to build ten various classifiers: logistic regression, support vector machine, random forest, extremely randomized trees, adaptive boosting machine, extreme gradient boosting (Xgboost), light gradient boosting (LightGBM), categorical boosting, long short-term memory, and convolutional neural network [44].
Table 1 outlines a structured review of several preliminary and fundamental research studies on the ground surface settlement prediction in tunneling using methods based on soft computing.
Many studies employed the BP or other kinds of ANNs to forecast ground surface settlements induced by shield tunneling, as seen in Table 1. However, several shortcomings can still be observed that are necessary to resolve to enhance the validation and reliability of networks, as well as their capability to generalize: (1) Despite considering various parameters as input collection to participate in the inside operation of networks, there comprehensive parameters cannot be found with various categories to embrace roughly all influential attributes to create the settlements simultaneously. (2) The database is crucial to the performance of ANN techniques, since the robustness and generalization of an accurate network depend on it; however, the database was not adequately discussed in the previously published literature. (3) since the utilization of TBM-EPB shield is mainly focused on excavating in soft soil, investigations of settlement prediction at tunneling by various types of ANNs have been fulfilled in tunnel routs formed by either soft soil or hard rock. Therefore, the choice of a case study comprising soft soil and hard rock has not been witnessed in previous studies. Remarkably, the study of tunneling with TBM-EPB shield at a route with conflicting geotechnical attributes can accompany precious results in settlement prediction.
Initially, according to the related literature reviews and the expertise of well-experienced engineers, the fields of determinative input components are categorized into five major groups. Then ten main characteristics that play a crucial role in forging the soil deformations are derived. The choice of a variety of components as inputs not only assists networks in considering the interconnections of input variables to resolve complicated problems but also has an implicit effect on accurate and rational network performance. Secondly, the database description and the method to collect them are precisely explained in Section 3 and Section 4. Eventually, the case study of this paper can be novel since both soft soil and hard rock can be found along the Southern Development Section of the Tehran Metro Line 6 project.
On the other hand, according to research reported in the relevant fields, to utilize ML to solve prediction problems, the techniques based on the backpropagation ANN method are largely more applicable than for other MLs and different statistical techniques, since they can enhance the machine learning speed and accuracy [45]. However, it is worth noting that to achieve the favorable and optimal result, ANN regular repetition and training under new circumstances, for instance, generating different networks with various numbers of nods in the hidden layer, plays an essential role.
In conclusion, to tackle the shortcomings mentioned in the previous research, this paper presents sixteen various backpropagation artificial neural networks considering a different number of nods in a hidden layer for the ground settlement prediction. Subsequently, these sixteen networks are assessed and compared by their results and errors based on 150 existing datasets on the Southern Development Section of the Tehran Metro Line 6 project. The most optimum and robust ANN was opted for and suggested as a developed model to predict the settlement rate of a metro tunnel section being constructed under the same circumstances. Ultimately, a sensitivity analysis was accomplished in this study to determine the relative importance rate of each independent input variable on the occurrence probability and intensity of settlement based on the significance of weights.

2. Research Significance
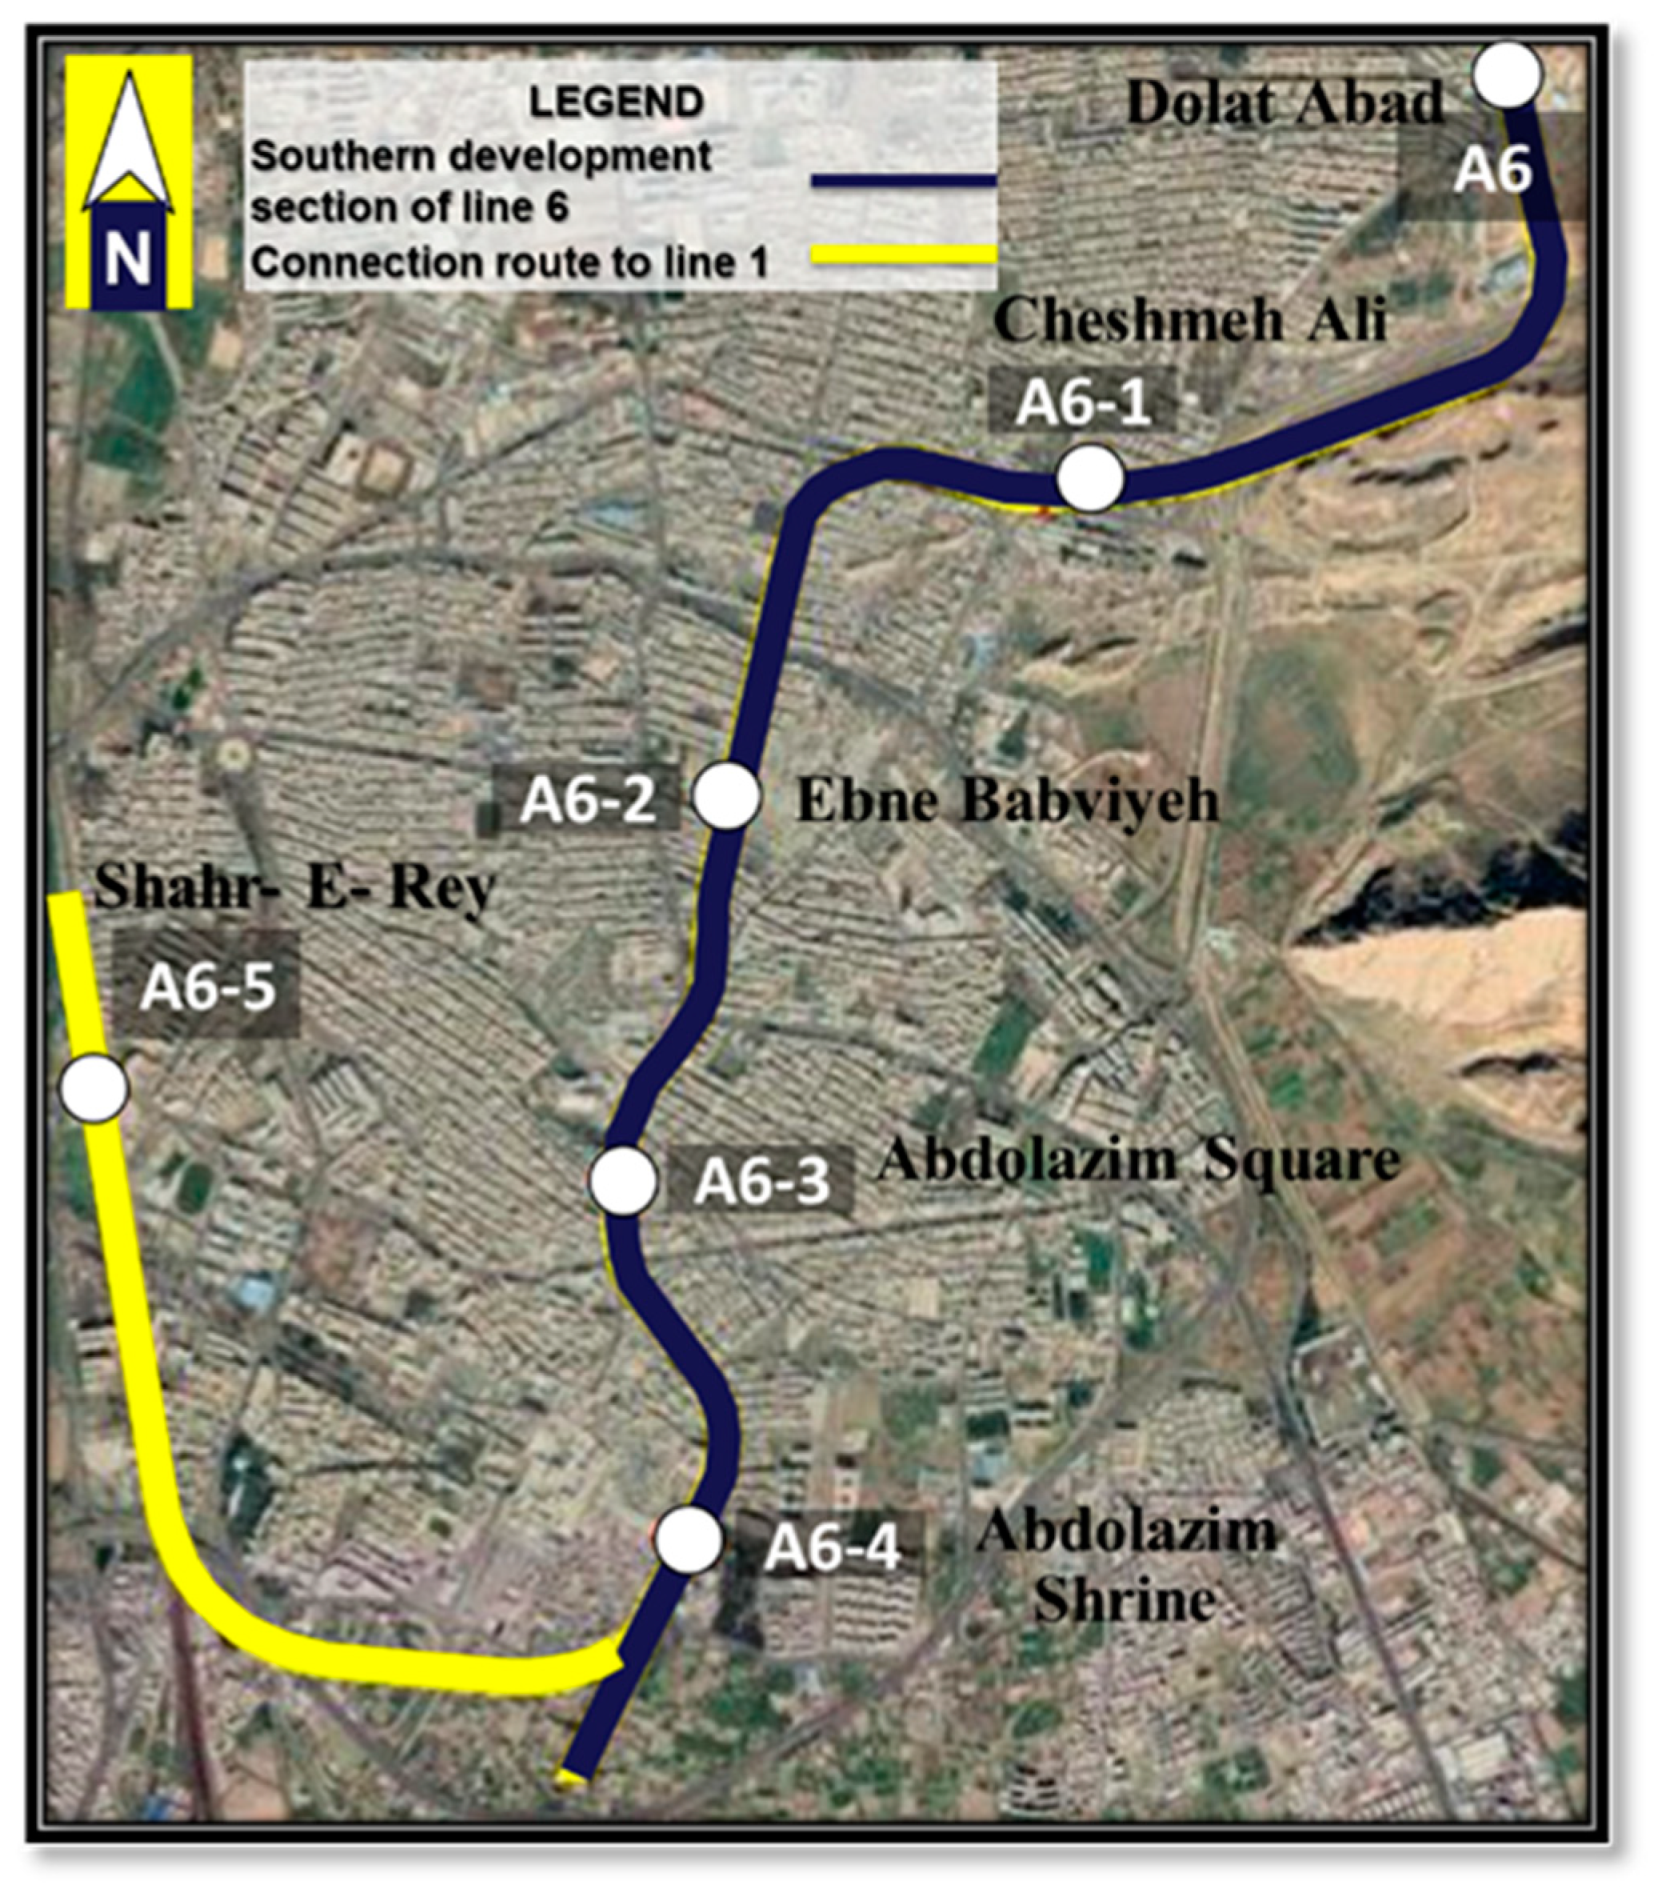
What can effectively assist algorithms in achieving a reliable model with acceptable robustness is determining major input parameters influencing outputs (settlement rate) with high correlation. Thus, this paper proposes comprehensive parameters affecting the maximum ground surface settlement in tunneling caused by the TBM-EPB machine. At the same time, according to Table 1, research has rarely addressed these parameters simultaneously.
It is imperative to note that what distinguishes this study from previous studies is the consideration of two crucial variables in the geotechnical parameters, namely the consistency index and permeability, in predicting the amount of ground settlement. The sensitivity analysis results demonstrated that the choice of these two influential components, specifically the consistency index, is a desirable selection to reflect the soil attributes and to discover soil displacements in networks.

3. Project Overview

In the past years, the urban population has grown dramatically, so congested traffic in transportation systems and the issue of pollution have become critical dilemmas in Tehran, Iran. To remove the mentioned problems, it is highly recommended to progress and broaden metro systems by decisionmakers in metropolis cities. It is noteworthy that, in Tehran City, seven different metro lines with the majority of stations are already in operation, some of the mentioned lines will operate as soon as possible, and Line 10 has been constructed. Three lines, namely Lines 8, 9, and 11, will also be constructed in the near future. As illustrated in Figure 1, this paper studies 6.2 km of the Southern Development Section of Line 6 from the Dolat Abad Station to the Abdol Azim Shrine Station, which comprises 150 instrumentation datasets of ground surface settlement. By constructing the Southern Development Section of Tehran Metro Line 6, the length of this line will reach 38 km, and it will become the longest metro line in West Asia (the Middle East). The total sectors of the line utilized in the calculations are as follows:
  • A6, A6-1 section: Dolat Abad Station–Cheshmeh Ali Station.
  • A6-1, A6-2 section: Cheshmeh Ali Station–Ebne Babviyeh Station.
  • A6-2, A6-3 section: Ebne Babviyeh Station–Abdolazim Square Station.
  • A6-3, A6-4 section: Abdolazim Square Station–Abdolazim Shrine Station.
These four sections of the route are situated in the southeast area of Tehran. The Average Ground Water Head (above the tunnel) varies from 0 to 20 m, and the tunnel’s cover depth (overburden height) differentiates at a range between 12 m and 28 m. A TBM (EPB-shield-type Herrenknecht) with a cutter head diameter of 9.164 m was chosen to excavate this tunnel sector (Figure 2).
In the mentioned case study, there are two fundamental zones in the soils which the tunnel has crossed: (1) the rock zone, where its uniaxial compressive strength ranges between 0.57 MPa and 123 MPa; and (2) the soil zone, which can be classified into four different categories (ET-1 to ET-4). The collected data comprised the measurements of a plenty figure of operational EPB shield factors, tunnel geometry, geological conditions, geotechnical parameters, soil geomechanical properties, and eventually surface settlements. Along the line of the tunnel, numerous settlement indicators have been erected at intervals of approximately 15 m. As depicted in Figure 3 and Figure 4, three points identified by the letters L, C, and R were commonly applied as a settlement monitoring points collection in the transverse section of the tunnel. Hence, an accurate settlement can be attained. On the other side, it can be inferred from Figure 3 that all observed settlements of different points at a section were read and monitored during a period of roughly 30 consecutive days until a constant amount of maximum settlement compared to previous days’ reads would be encountered. Due to the limitations of site positions in some cases, several transverses were considered less than three points.
EPB operational factors were collected by the comprehensive data acquired from the automatically recorded information of the TBM based on the embedded concrete segments along the tunnel’s route. It is imperative to note that the length of each concrete segment is 150 cm. Field engineers accurately recorded all surface settlements. To obtain the maximum surface settlements, the readings were increased to a greater sample frequency during the TBM shield passing. Readings were collected daily even if the shield was far from the monitoring transverse. As illustrated in Figure 3, the monitoring frequencies depended upon the position of the machine cutter head before and after TBM crossing from an exact indicator point. The settlement figures (see Figure 3) were recorded based on TBM cutter head distance till a settlement indicator point, from 24 m before to 93 m after the indicator point.

4. Description of Datasets

For an ANN model to accurately estimate the ground settlement rate, input variables must be chosen properly. According to Suwansawat and Einstein [24], the parameters affecting ground settlement can be categorized into three main categories: geological conditions, tunnel geometry, and TBM operational factors. The tunnel’s geometric features, such as its shape and diameter, can be disregarded because the four parts of the tunnel were all excavated using the same kind of shield. The only geometric component that needs to be considered is the tunnel’s overburden (O). The five EPB operational parameters that are the most influential variables to determine the settlements and were thus chosen as the input parameters are the torque (To), thrust (Th), penetration rate (Pr), earth pressure (Ep), and grout injection (Gi). The machine automatically recorded the values of these parameters in a range of data at every minute. Thus, it is clear that the average amount of a single parameter regarding each embedded concrete segment is presented.
The ground settlement is strongly tied to geological situations, yet geological conditions are difficult to assess [46]. However, one of the most substantial geological parameters, Average Ground Water Head (W), having a knock-on effect on determining the amount of surface settlement, was considered in this research.
Moreover, Sun Jichao and Huang Yuefei studied the effects of particle size and porosity on the simulation of geomaterials [47]. Their research showed that particle size and porosity have important effects on the simulation of geomaterials. In our research, we also found that these two factors can have a significant impact on the prediction of ground settlement. Therefore, when predicting ground settlement, we should fully consider these two factors: particle size and porosity.
Hence, since two parameters, namely the consistency index and permeability, include and reflect the attributes of particle size and porosity, in this research, we opted to use them as the input of networks from the geotechnical parameters category to predict the amount of ground settlement.
The Atterberg limits are used to calculate the consistency index (Ic), which determines the firmness of the soil and variations in water content that allows it to differentiate between the subsequent states: liquid, very soft, soft, stiff, very stiff, and hard. Soil is equilibrium to its liquid limit at a consistency value of zero (0), equivalent to its plastic limit at a consistency index of one (1). The following equation (Equation (1)) can be utilized to compute the consistency index:
Ic = WL(%) − W(%)/WL(%) − WP(%)
The liquid limit is denoted by WL, the water content by W, and the plastic limit is denoted by WP. The consistency index of the soil plays a pivotal role in EPB excavation and soil conditioning, such as the settlement rate. Due to interconnected voids, soils are porous materials, allowing fluids to flow from high-energy to low-energy areas [48].
Permeability (P) undeniably influences the settlement rate of saturated soil under a load. Hence, it is considered to be a contributing criterion to forming the settlement proportion in this paper. Some researchers insert the input layer of ANN soil geomechanical properties, such as the internal friction angle, cohesion, and elasticity modulus, to predict the settlement [48]. Still, almost all of these attributes can be covered by the soil standard penetration test (SPT). Therefore, eventually, the SPT is chosen as the most distinguished component of the geomechanical properties that has an explicit impact on the ground settlement. Additionally, the only considered output variable is the maximum settlement (Sm). Based on previous broad studies, ten input parameters and one output variable were chosen, all of which are inferred to be crucial elements in evaluating the settlement amount.
In choosing these ten variables that influence the rate of surface settlement in mechanized tunneling, we endeavored not to ignore any component even with a slender percentage of effect in creating settlement. Thus, the choice of network input parameters in this research covers a broad range of effective reasons for causing ground subsidence. For instance, the significant degree of the variable of earth pressure in the excavation front is one of the most substantial effective factors in creating the surface settlement in tunneling using the EPB shield, and it is discussed here briefly.
In the influence analysis of excavation front pressure on ground surface settlement in mechanized tunneling using an EPB shield, the results illustrate that for the maintenance pressure of the working front with a constant figure, with the increase in the ratio of overburden thickness to tunnel diameter (H/D), the settlement rate decreases. When tunneling in loose and soft soil with the EPB shield, it is obvious that by declining the figure of the earth pressure, displacement occurs at the excavation front. However, by measuring the amount of settlement on the ground surface, it is not possible to appropriately judge the displacement of the tunnel work front. The ground settlement phenomenon is solely a sector of the consequences caused by the pressure of the tunnel excavation front [49]. Therefore, regarding the variability of the overburden thickness of the tunnel studied in this research between 12 and 28 m, as well as the undeniable influence of the work front pressure on the settlement occurrence, and subsequently increasing the project risk level, the earth pressure as a key factor in the input variables of the BP-ANN to estimate the settlement in this research is considered.
The fundamental statistical descriptions of model input and output are exhibited in Table 2. A comprehensive collection comprising 150 samples of settlement observations and all other criteria of network input was considered to create adequate information for validating the trained neural network.

5. Materials and Methods

Although, according to Table 1, extensive previous studies have been accomplished regarding estimating the ground settlement caused by mechanized tunneling using methods based on ANNs, it is crucial to mention one key point that almost most studies have ignored. This significant point is the robust dependence of the network outputs on the input dataset and the appropriate selection of independent input variables affecting the settlement rate. Therefore, in this research, instead of choosing diverse and immense methods based on ANNs, which are undoubtedly necessary, the authentic and comprehensive choice of input parameters that are effective in the rate of settlement and accuracy in collecting data was discussed.
Thus, this article initially identified different areas with the potential to impact the value of ground surface settlement. Then the parameters of each field were recognized and categorized as the influential elements in the soil movements of the tunnel crown. To improve the precision of the data collected from the instrumentation section of the Line 6 project, the figures allocated to each component at each monitoring point along the route alignment were based on the coordinates of the concrete segments embedded by the TBM-EPB. Eventually, according to Table 2, the number of 10 influential input variables in the occurrence of soil deformation was considered. The number of 150 settlement monitoring points along the route was selected based on the coordinates of the concrete segments embedded in the tunnel. Afterward, from the extensive information on the metro line’s instrumentation, all input parameters and the only output variable in each monitoring point were carefully extracted. To predict the amount of the settlement in this study, the backpropagation neural network method was used. Correspondingly, based on the choice of a different number of neurons in the hidden layer, the networks were trained and tested under various circumstances. Subsequently, the most optimal network with the least mean square error was chosen for predicting the settlement rate in the studied project, and the settlement amount along the tunnel route was predicted. Ultimately, to determine the various degrees of the input parameters’ effect on the amount of settlement and emphasize appropriate input parameters in the next studies, a sensitivity analysis was performed, and its results were presented. The concise research framework utilized for developing the choice method of influential factors on the settlement rate in this study is presented in Figure 5. All the steps and methods of fulfilling this research are briefly described as follows:
i.
Determining subcategories affecting the rate of surface settlement;
ii.
Determining parameters affecting the rate of surface settlement;
iii.
Collecting data comprising figures of the input and the output parameters in each monitoring point;
iv.
Normalizing the dataset between 0.1 and 0.9;
v.
Prediction of the settlement rate utilizing different BP ANNs;
vi.
Choosing the optimal BP network;
vii.
Executing the sensitivity analysis to determine the influence degree of each parameter on the settlement rate;
viii.
Weighting the parameters based on the influence degree on the settlement rate, using the outputs of the sensitivity analysis;
ix.
Suggesting the participation of weighted input variables in the prediction cycle of the surface settlement amount to present the development plan of this research in future studies.

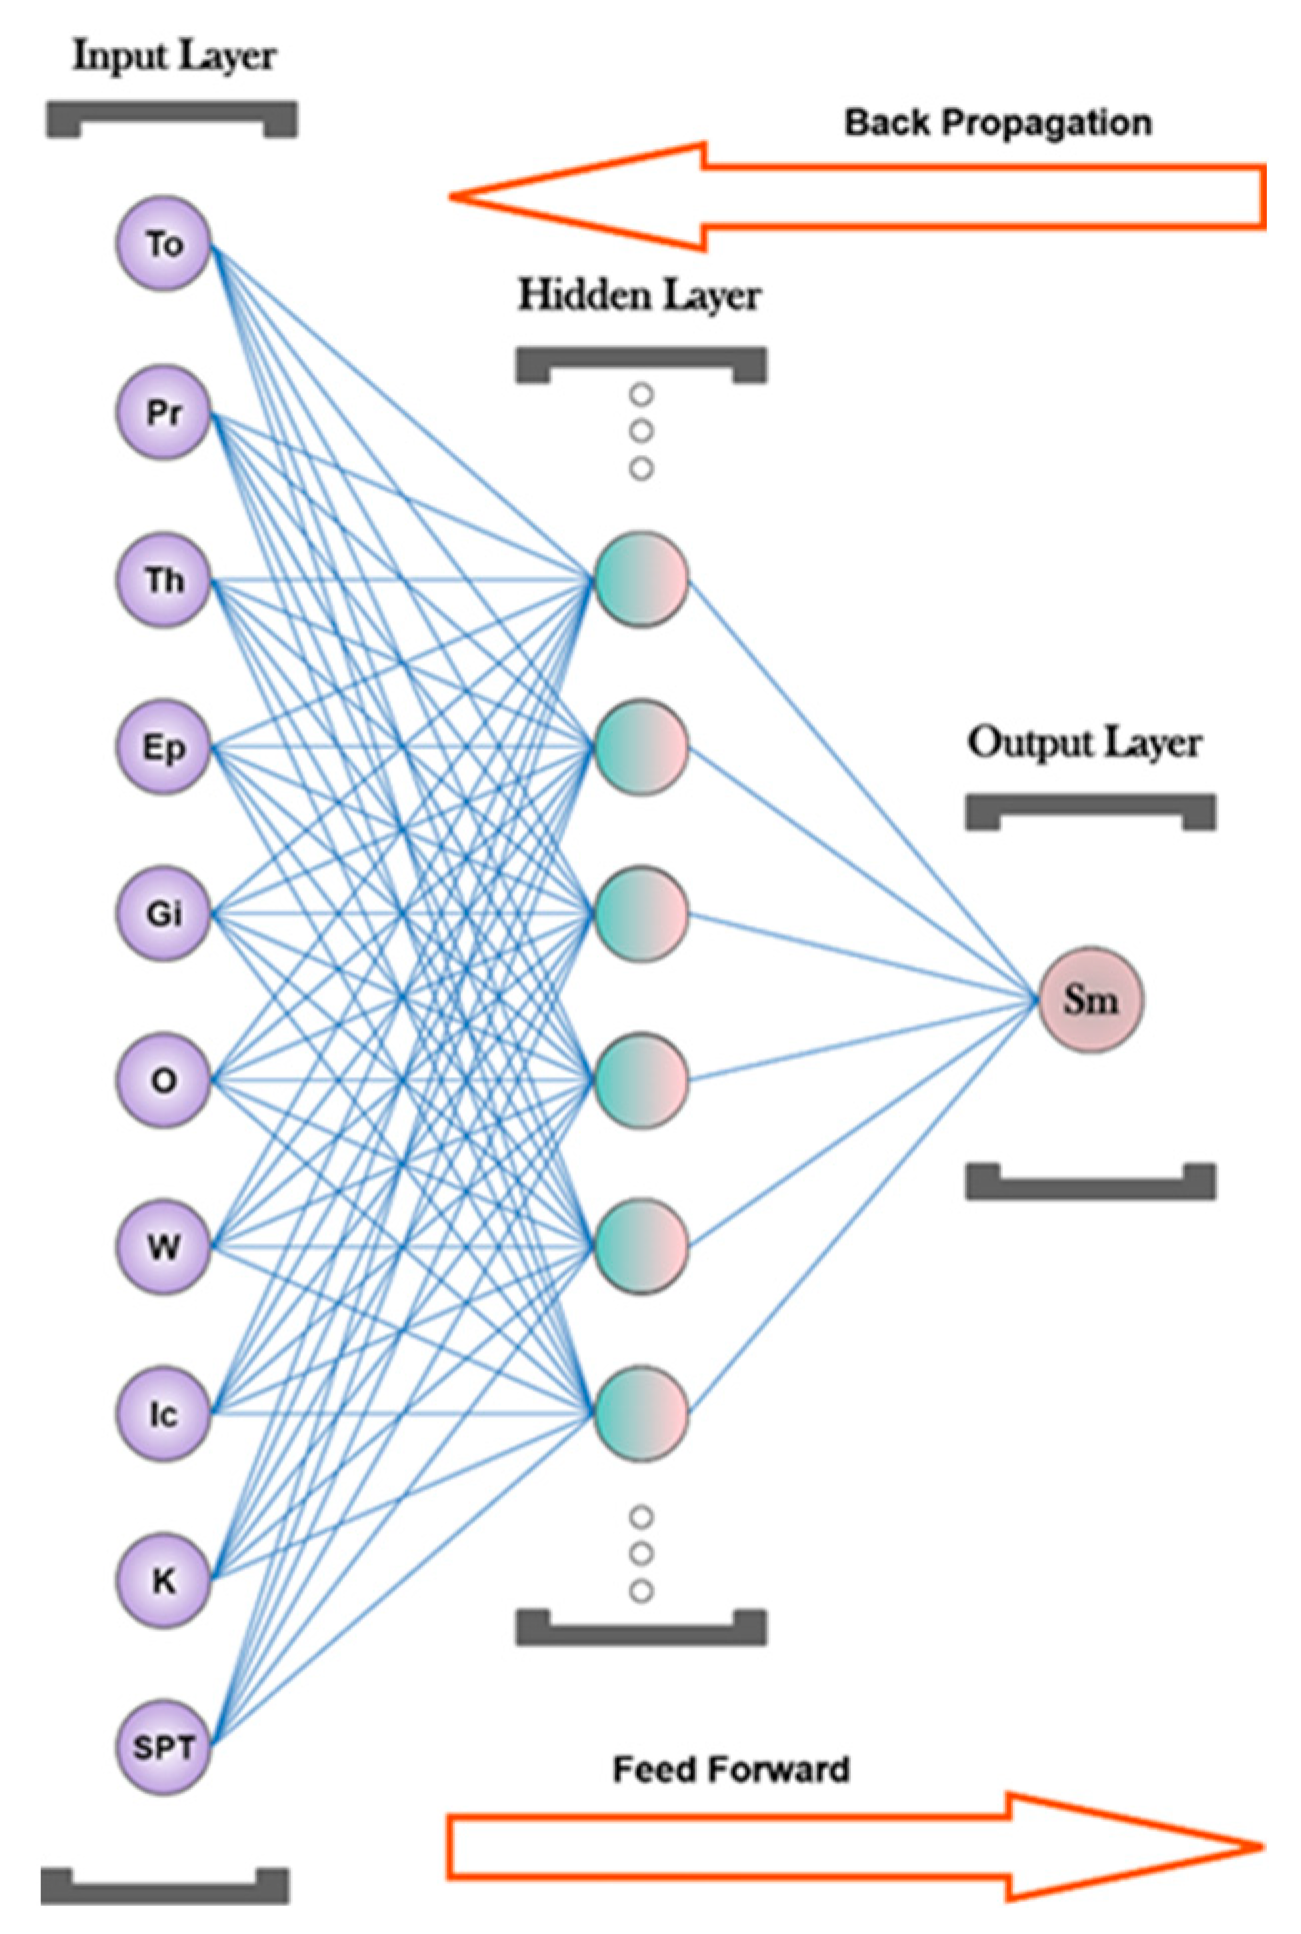
5.1. Neural Networks

A backpropagation neural network (BP) was selected in this research for function approximation. To study the geotechnical fields, it seems that a BP ANN whose basis is on a multilayer perceptron (MLP) can be one of the most frequent ANNs [13,35,50]. The architecture of the BP ANN consists of these three parts: (1) an input layer; (2) one or more hidden layers; and (3) an output layer, which is capable of approximating any function, including a finite number of discontinuities. For nonlinear multilayer networks, the phrase “backpropagation” refers to a technique for calculating the correction gradient [31]. The computed errors of backpropagation are used to train the network based on the adjusted neurons’ weights. After training, the constructed developed ANN in this paper only ever used a rigorous feed-forward algorithm. A feed-forward network comprises a layered structure; each layer obtains its input from modules in the layer beneath and forward its output toward the unities in the superior layers. Generally, interconnections between unities within an identical layer cannot be found.
An optimal BP neural network can be architected through the compatibility between the number of hidden layers and the number of nodes. Whereas the number enhancement of layers and neurons can assist the networks in attaining appropriately acceptable answers, our networks may encounter a challenging situation called overfitting, leading to the inaccurate prediction of a simulated function in utilizing new input data [24]. In this study, to train the network, all models in ANNs utilized the tan-sigmoid activation function to execute for the hidden layers and a pure activation function for computing at the output layer. Subsequently, Equation (2) demonstrates the output number of jth neuron of the hidden layer:
y j = f ( i = 1 m ω j , i x i + θ j )
where xi refers to the input value, yj refers to the output of hidden neuron j, ω(j,i) refers to the weight at the relationship of the input to the hidden node j, θj refers to bias, and f mentions activation function [31].
The ten mentioned parameters in Table 2 (To, Pr, Th, Ep, Gi, O, W, Ic, K, and SPT) were utilized for the input layer, including one hidden layer in the structure of the ANN model. Finally, the output neuron was proposed for estimating the ground surface settlement amount.
Before training ANN, all datasets were normalized and scaled to minimize undesirable influences of number scaling. Since tan-sigmoid transfer functions can only distinguish figures between 0 and 1, this preprocessing step was crucial. According to Equation (3), the minimum and maximum amounts of datasets at each parameter were scaled into the interval of between 0.1 and 0.9 based on the linear relationship, respectively [51,52].
Xscaled = [(0.9 − 0.1) (X − Xmin)/(Xmax − Xmin)] + 0.1
The architecture of the extended ANN described in this article is abbreviated as NN10-n-1, where the first figure denotes the number of input variables; n represents the figure of hidden nodes, as illustrated in Figure 6; and the last number refers to the target output predicting the settlement rate.

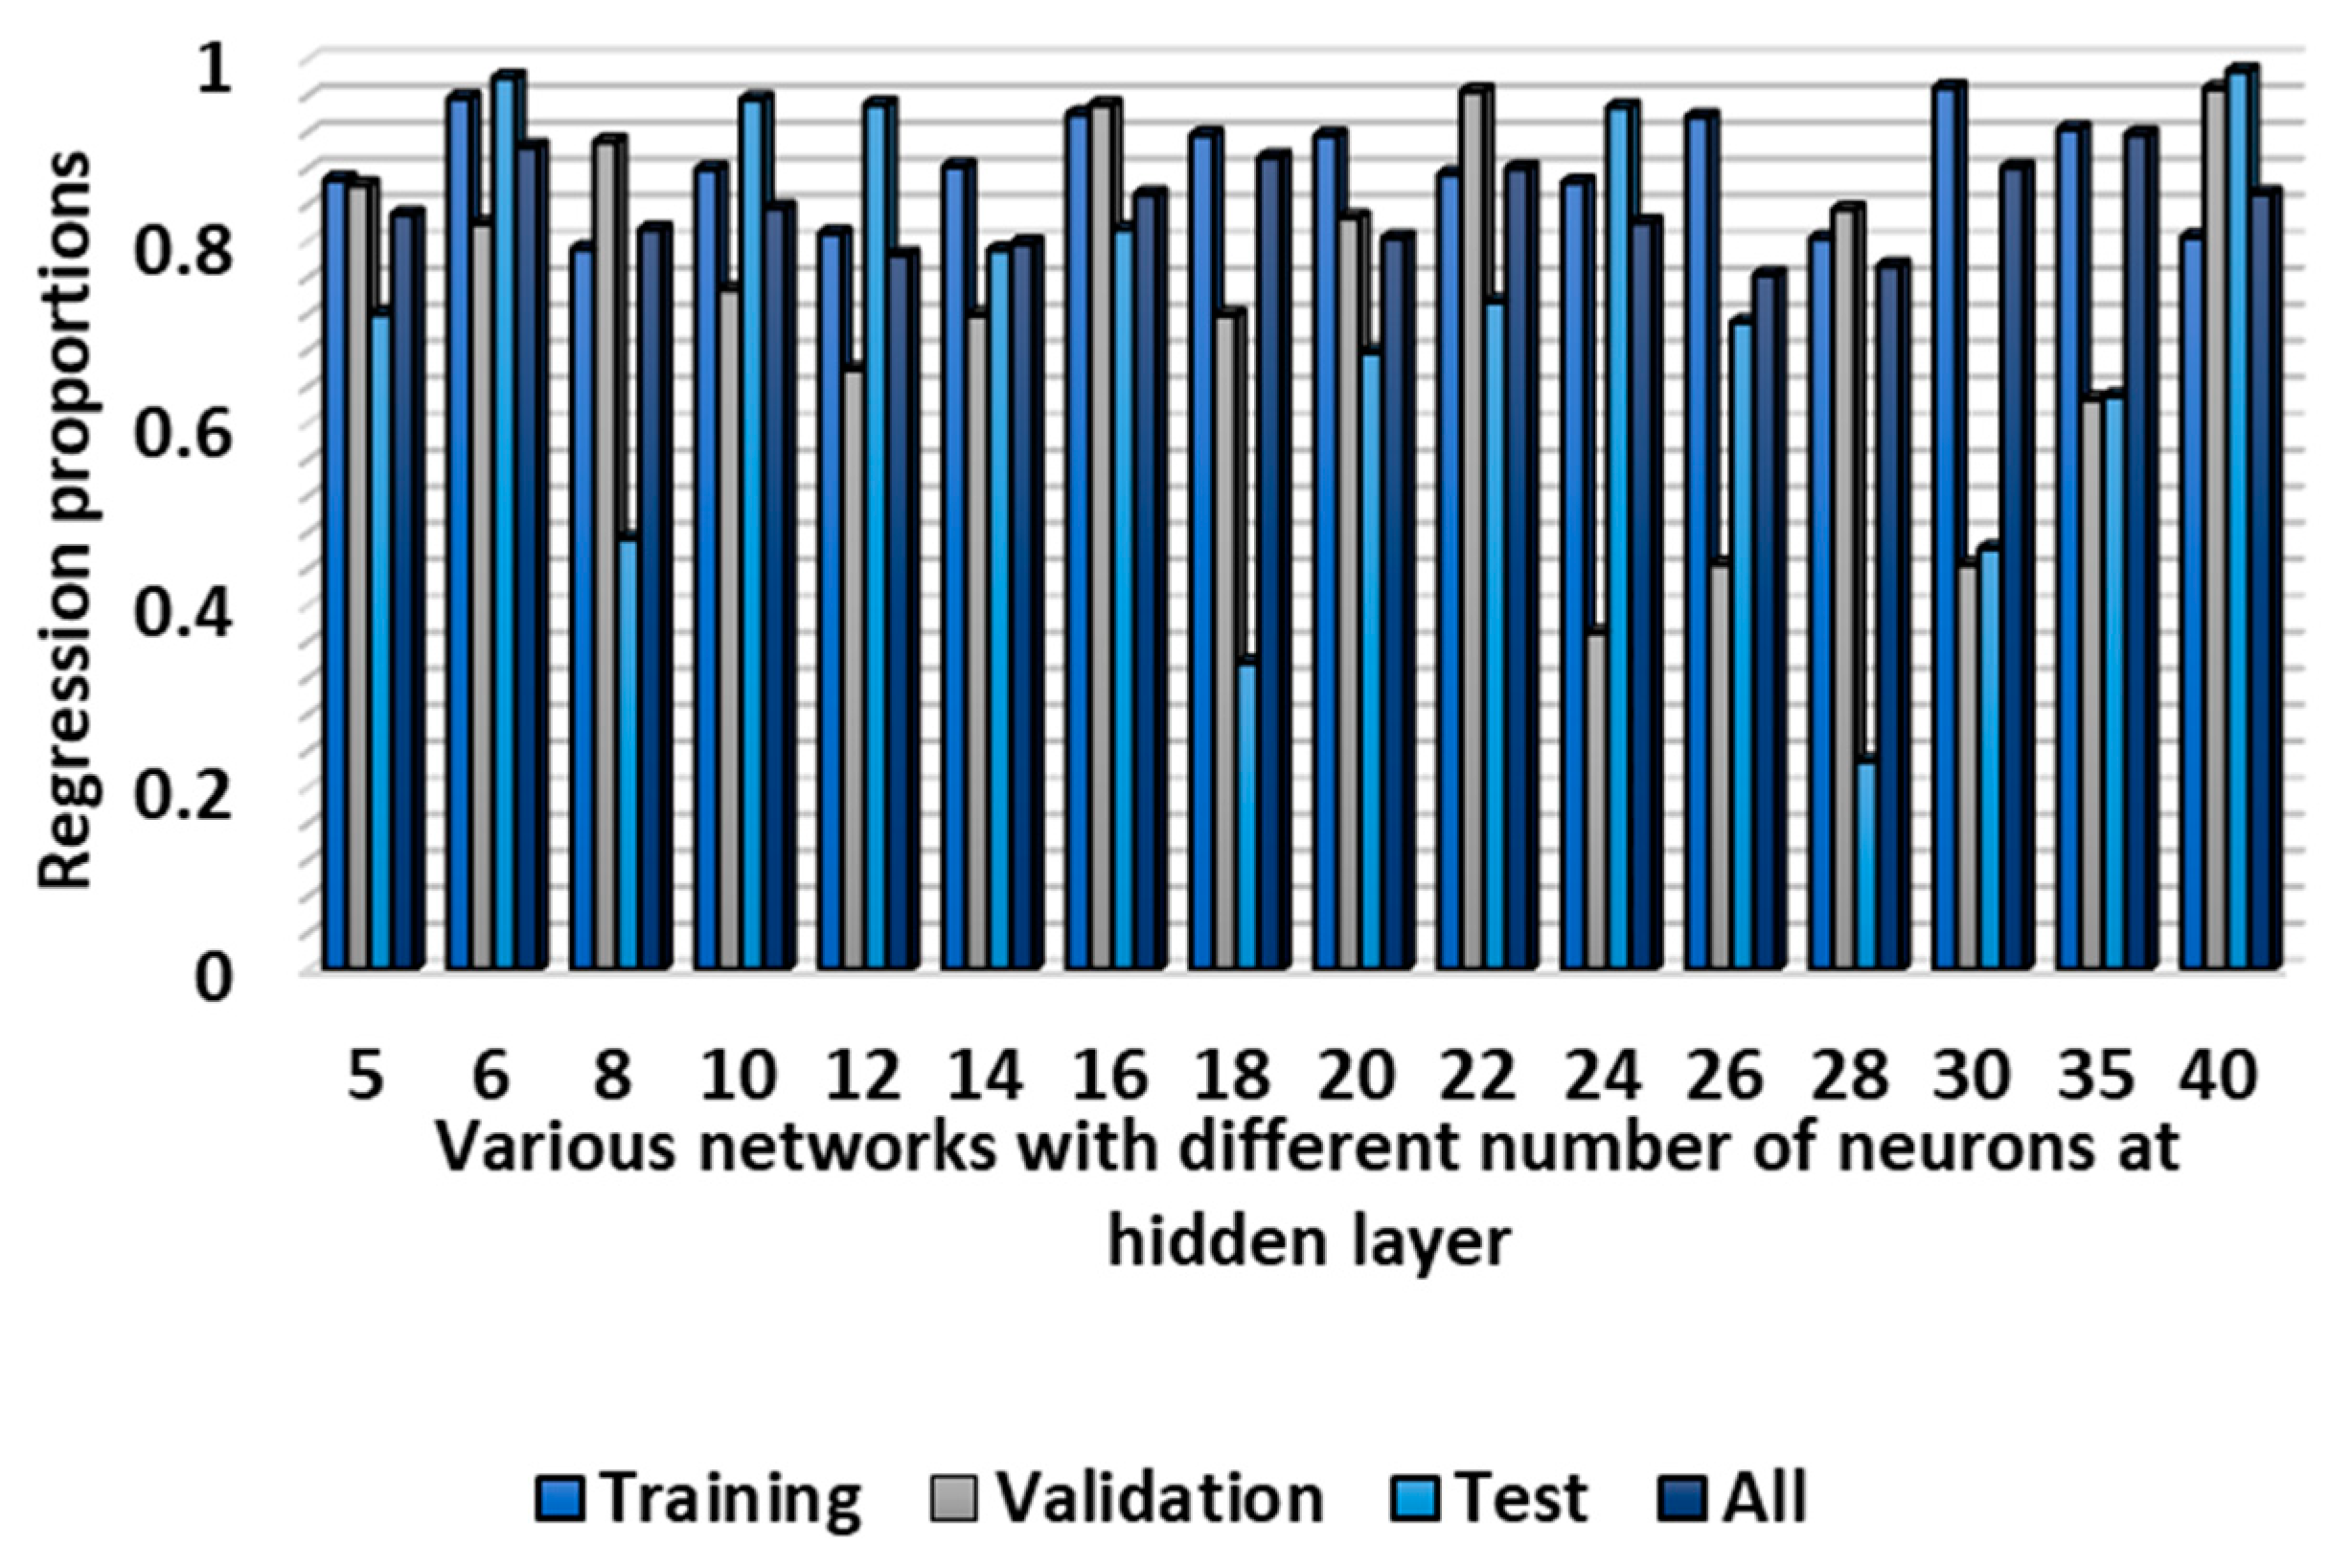
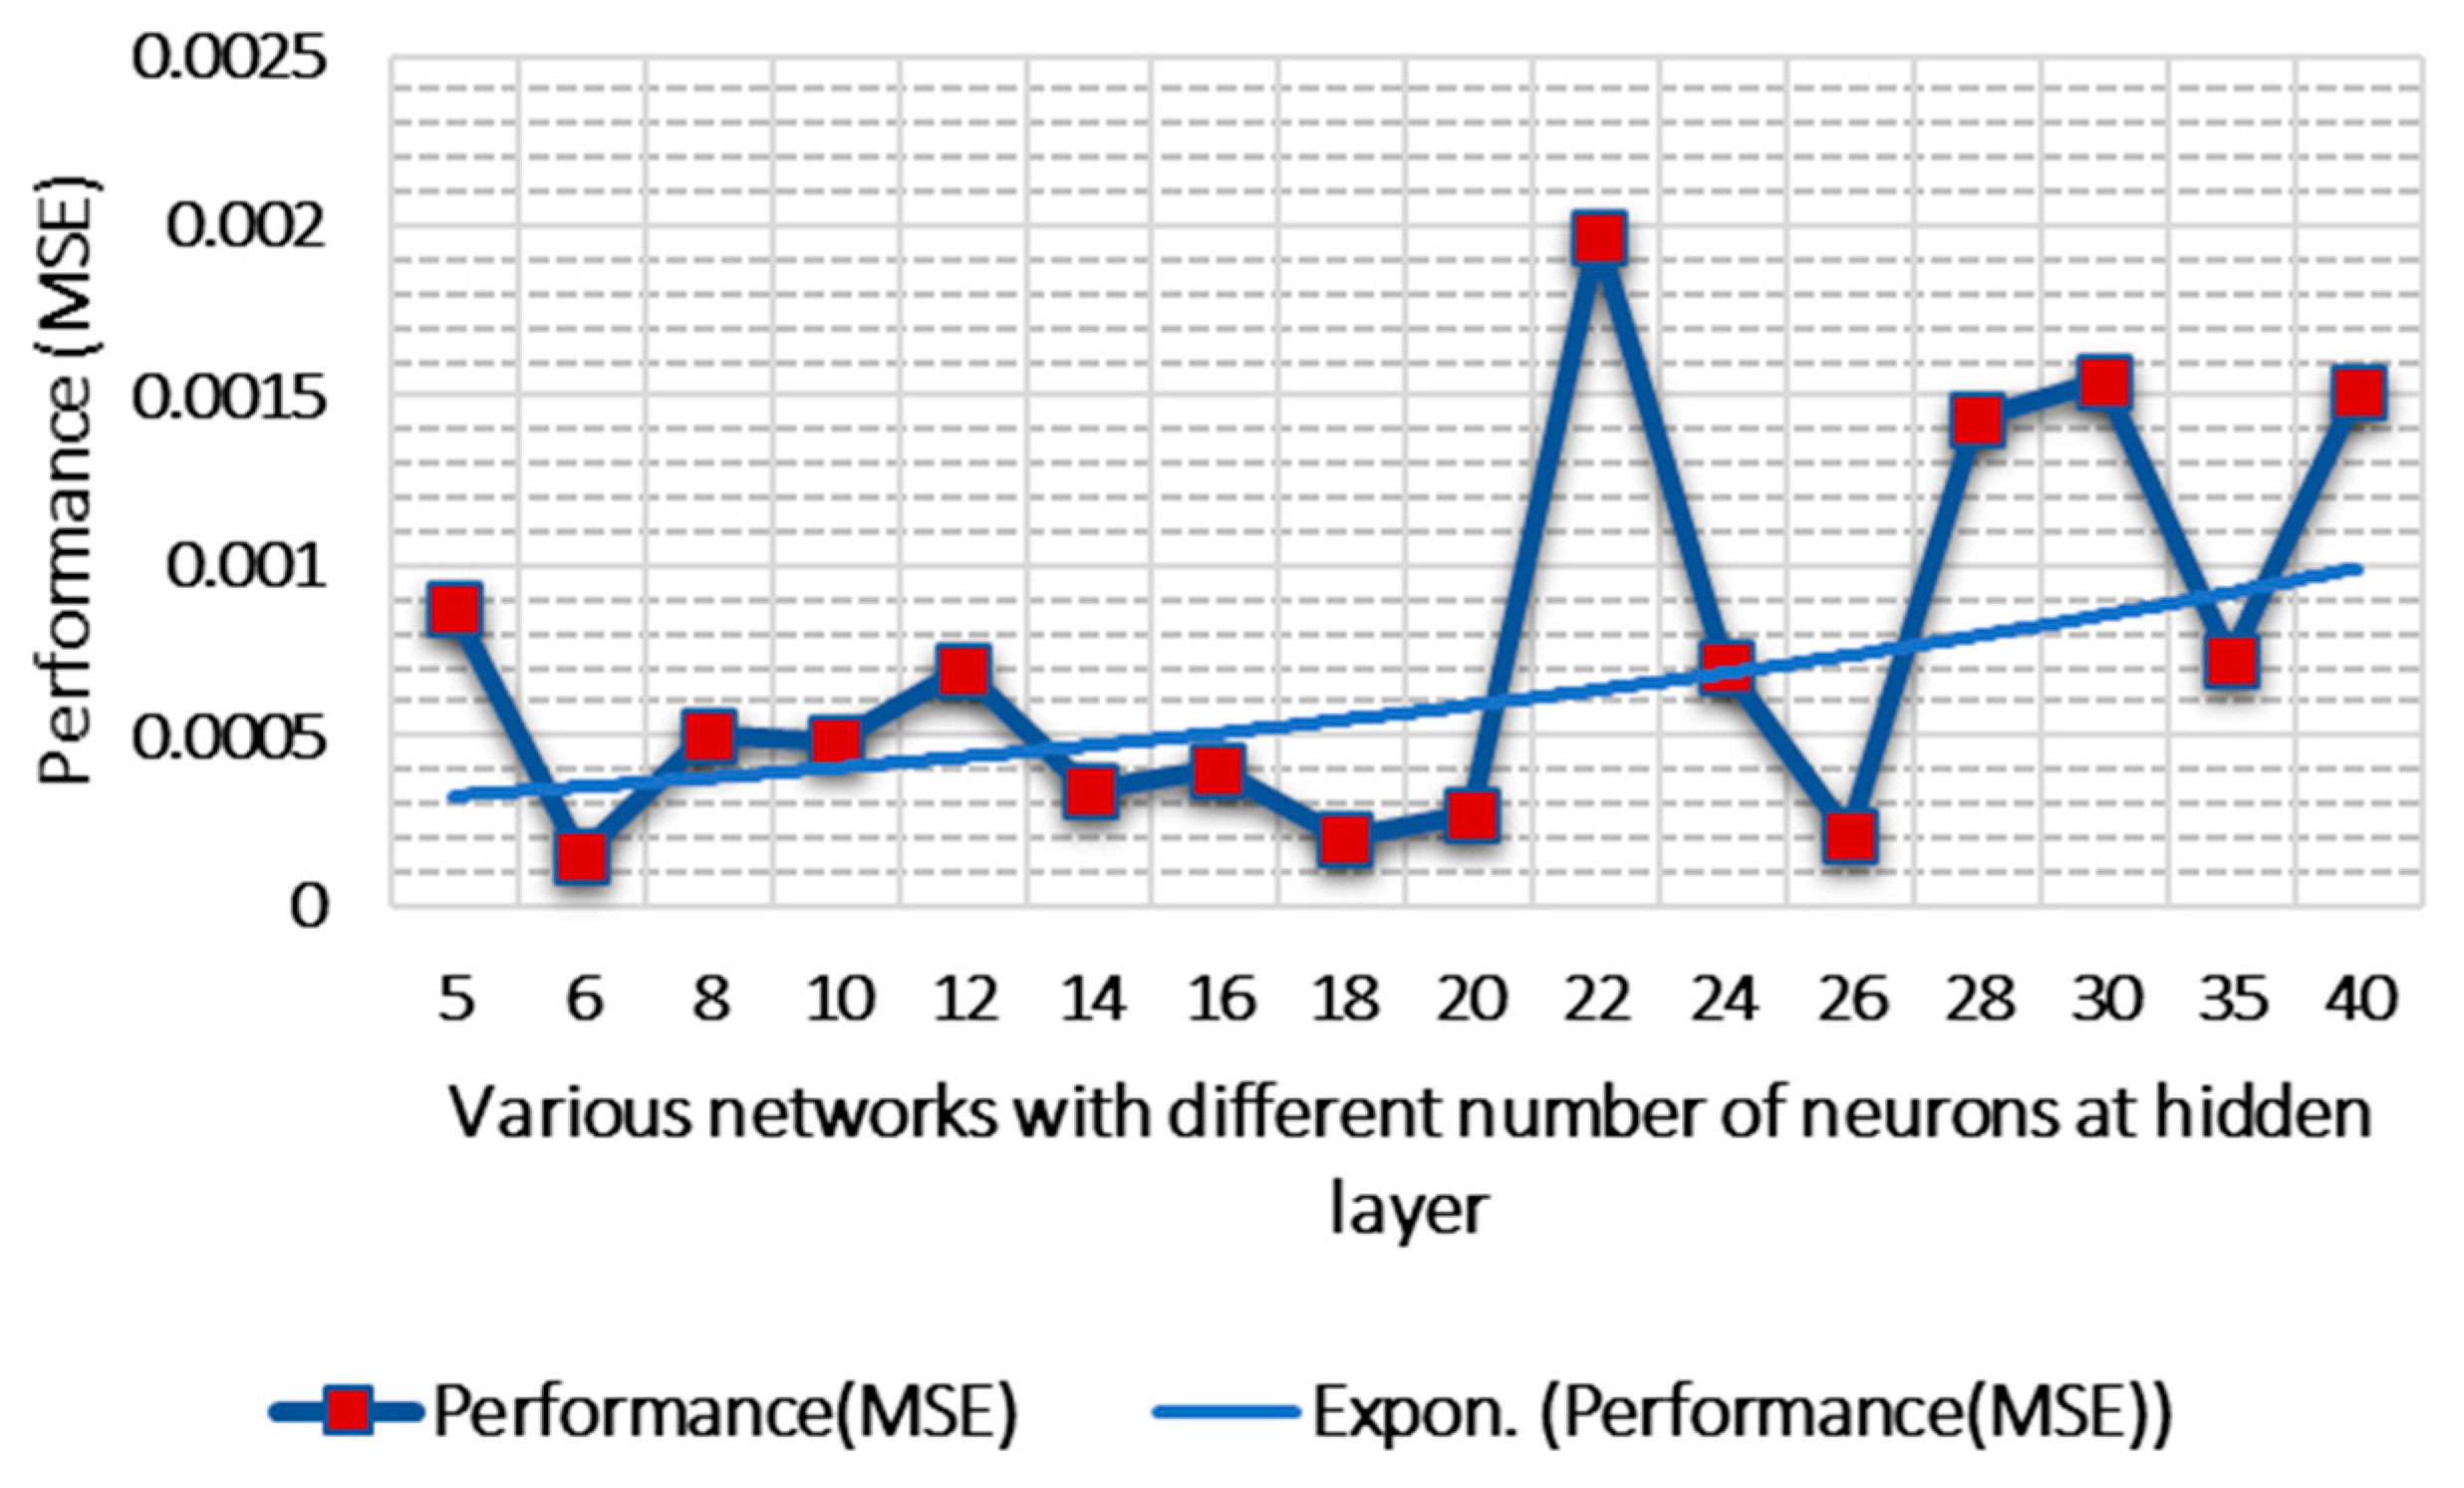
5.2. Performance Analysis

The performance analysis aims to demonstrate how accurate the created prediction model is. As presented in Equations (4)–(6), the mean square error (MSE), the mean absolute error (MAE), and root mean square error (RMSE) can be opted to illustrate how much the forecasts and measurements agree. This research considers the ANN training stop criterion, the mean square error (MSE). The terms MAE, MSE, and RMSE are defined by the following:
M A E = ( 1 n ) 1 n r i p i
M S E = ( 1 n ) 1 n ( r i p i ) 2
R M S E = ( 1 n ) 1 n ( r i p i ) 2
ei = pi − ri
where n is the total number of observations taken into consideration, p is the anticipated settlement, and r is the real settlement. Lower values, in this case, indicate a more idealistic network performance. Regression amounts (R-values) are used to quantify the correlation rate between output and targets in networks, in which an R-value of one represents robust communications between these two categories of data.

6. Result

In this study, all 150 datasets obtained from the Southern Development Section of Tehran Metro Line 6 were considered to create the network architecture. The train, validation, and test ratio are considered to be 0.7, 0.15, and 0.15, respectively, in different trained networks. Based on this, in different iterations of the network, until the optimal result is attained, 105 datasets were determined to be network training data, and the rest as validation and test data. The performance of the created networks was assessed using MSE and R-values as the two main criteria. Concerning these two controlling guidelines, the network was trained plenty of times under various circumstances until the optimal result was achieved.
The number of hidden neurons in a neural network has been the subject of numerous research proposals. The methods can be divided into two categories: constructive and pruning methods. The constructive approach begins with a small-scale network and afterward increases more hidden neurons [53]. The less relevant neurons and weights are first removed from the large network in the pruning procedure in order to discover the smallest and optimized size. A common technique to specify figures of hidden neurons can be the trial-and-error method. This method starts with a lower number of hidden neurons and enhances neurons to hidden layer, slightly.  A formula to determine and recognize the optimized number of neurons in hidden layer at BP-ANN as follows [54]:
Nh = (4n2 + 3)/(n2 − 8)
where Nh = the number of neurons in hidden layer, and n = the number of network input parameters.
According to experience and error, in the BP method, if the number of neurons in the hidden layer is less than five and more than 40, the network will encounter more inaccurate prediction outputs. Moreover, the number of network errors will rise. Therefore, in this study, the network was executed 16 times, taking into account the separation mentioned in the number of training, validation, and testing data, as well as the different numbers of neurons in the hidden layer based on consideration of Equation (8) and the trial-and-error method. The regression results for networks with different numbers of neurons in the hidden layer are demonstrated in Figure 7. Meanwhile, to obtain the optimal network structure, as shown in Figure 7, a single hidden layer with different mentioned neurons was incorporated to train BP neural networks. As can be vividly observed from the figure, the mentioned network with the number of six neurons in the hidden layer is capable of presenting the best performance in the regression values of the whole training, validation, and testing, and all of them are close to one; the network with the number of 28 neurons in the hidden layer emerged as the weakest network according to its reports of the regression results.
Another filtering in the pre-assessment of networks is shown in Figure 8, which includes all generated networks’ computed MSE values. As can be inferred from Figure 8, the 10-6-1 network with the amount of almost 0.00015 is accompanied by the lowest rate of the mean square error. It can be inferred from the Figure 8 that Equation (8) can be a reliable criterion to realize the optimal number of neurons in the hidden layer to achieve a minimum MSE for BP-ANN models. In contrast, the highest amount of MSE was assigned to the 10-22-1 network, which accounts for about 0.00197.
Additionally, the outcome of the 10-6-1 network is exhibited in Figure 9, and the regression results of training, validation, and test figures of the 10-28-1 network are 0.80333, 0.83541, and 0.22935, respectively.

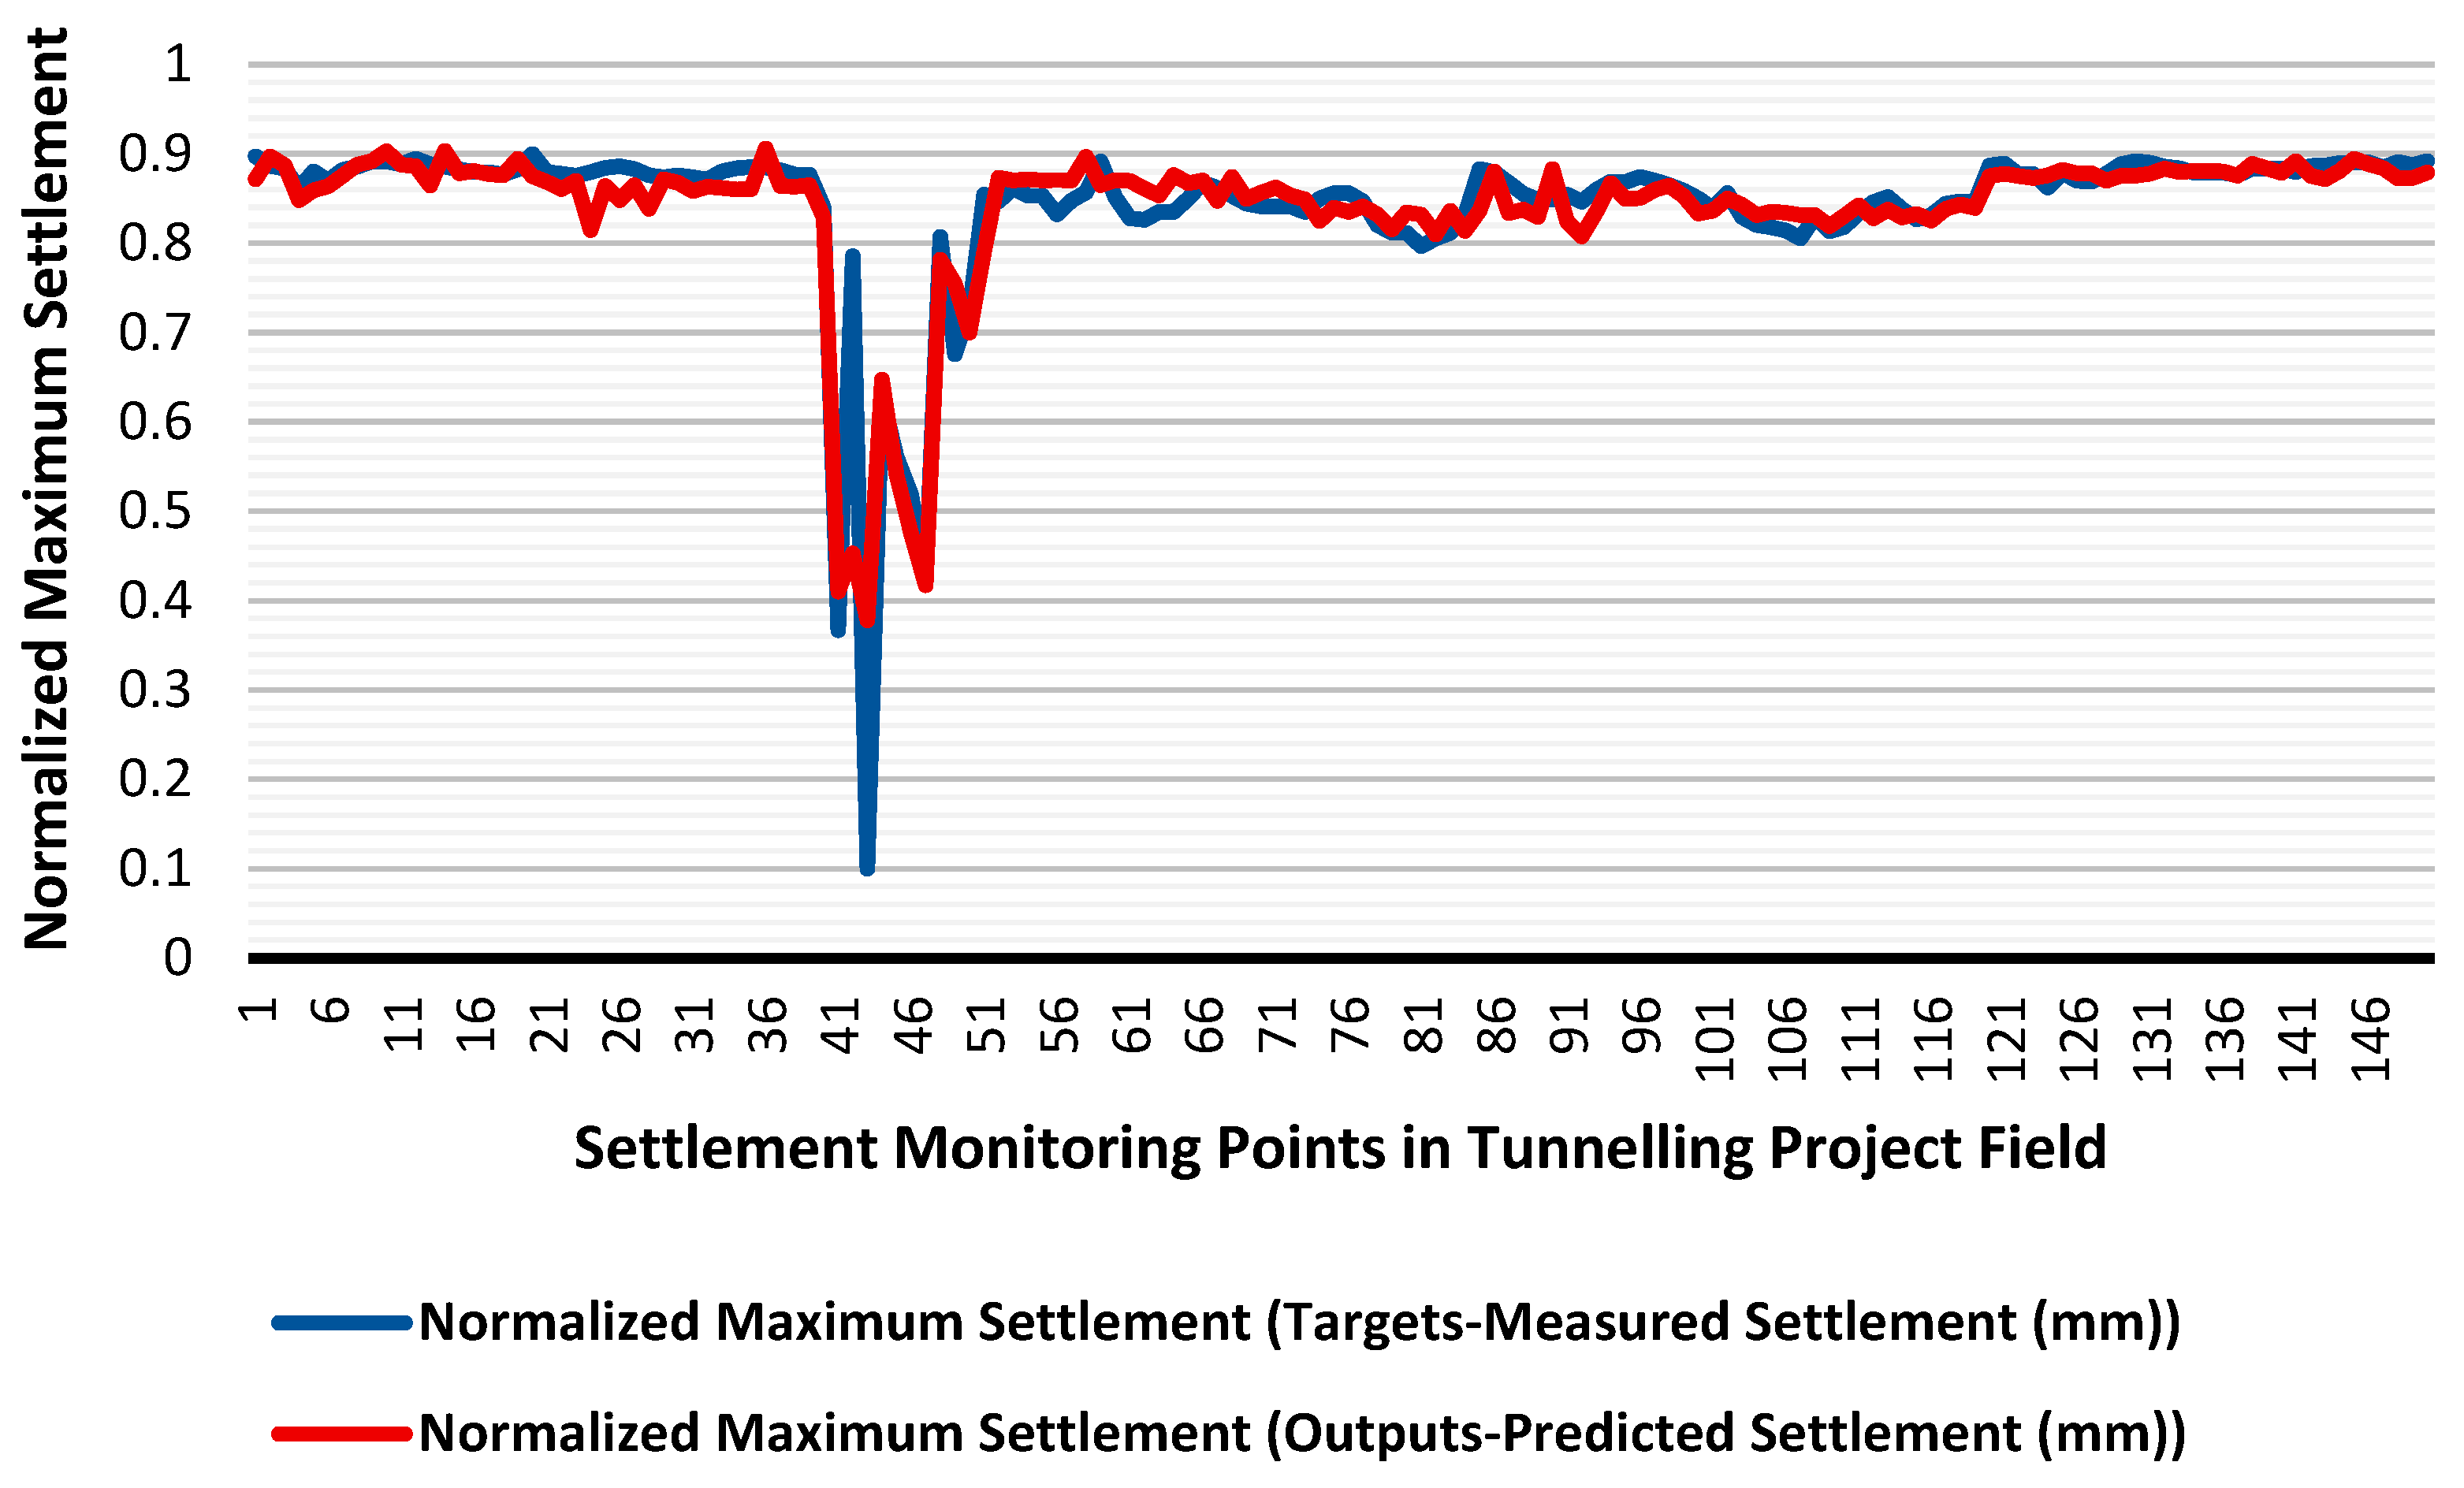
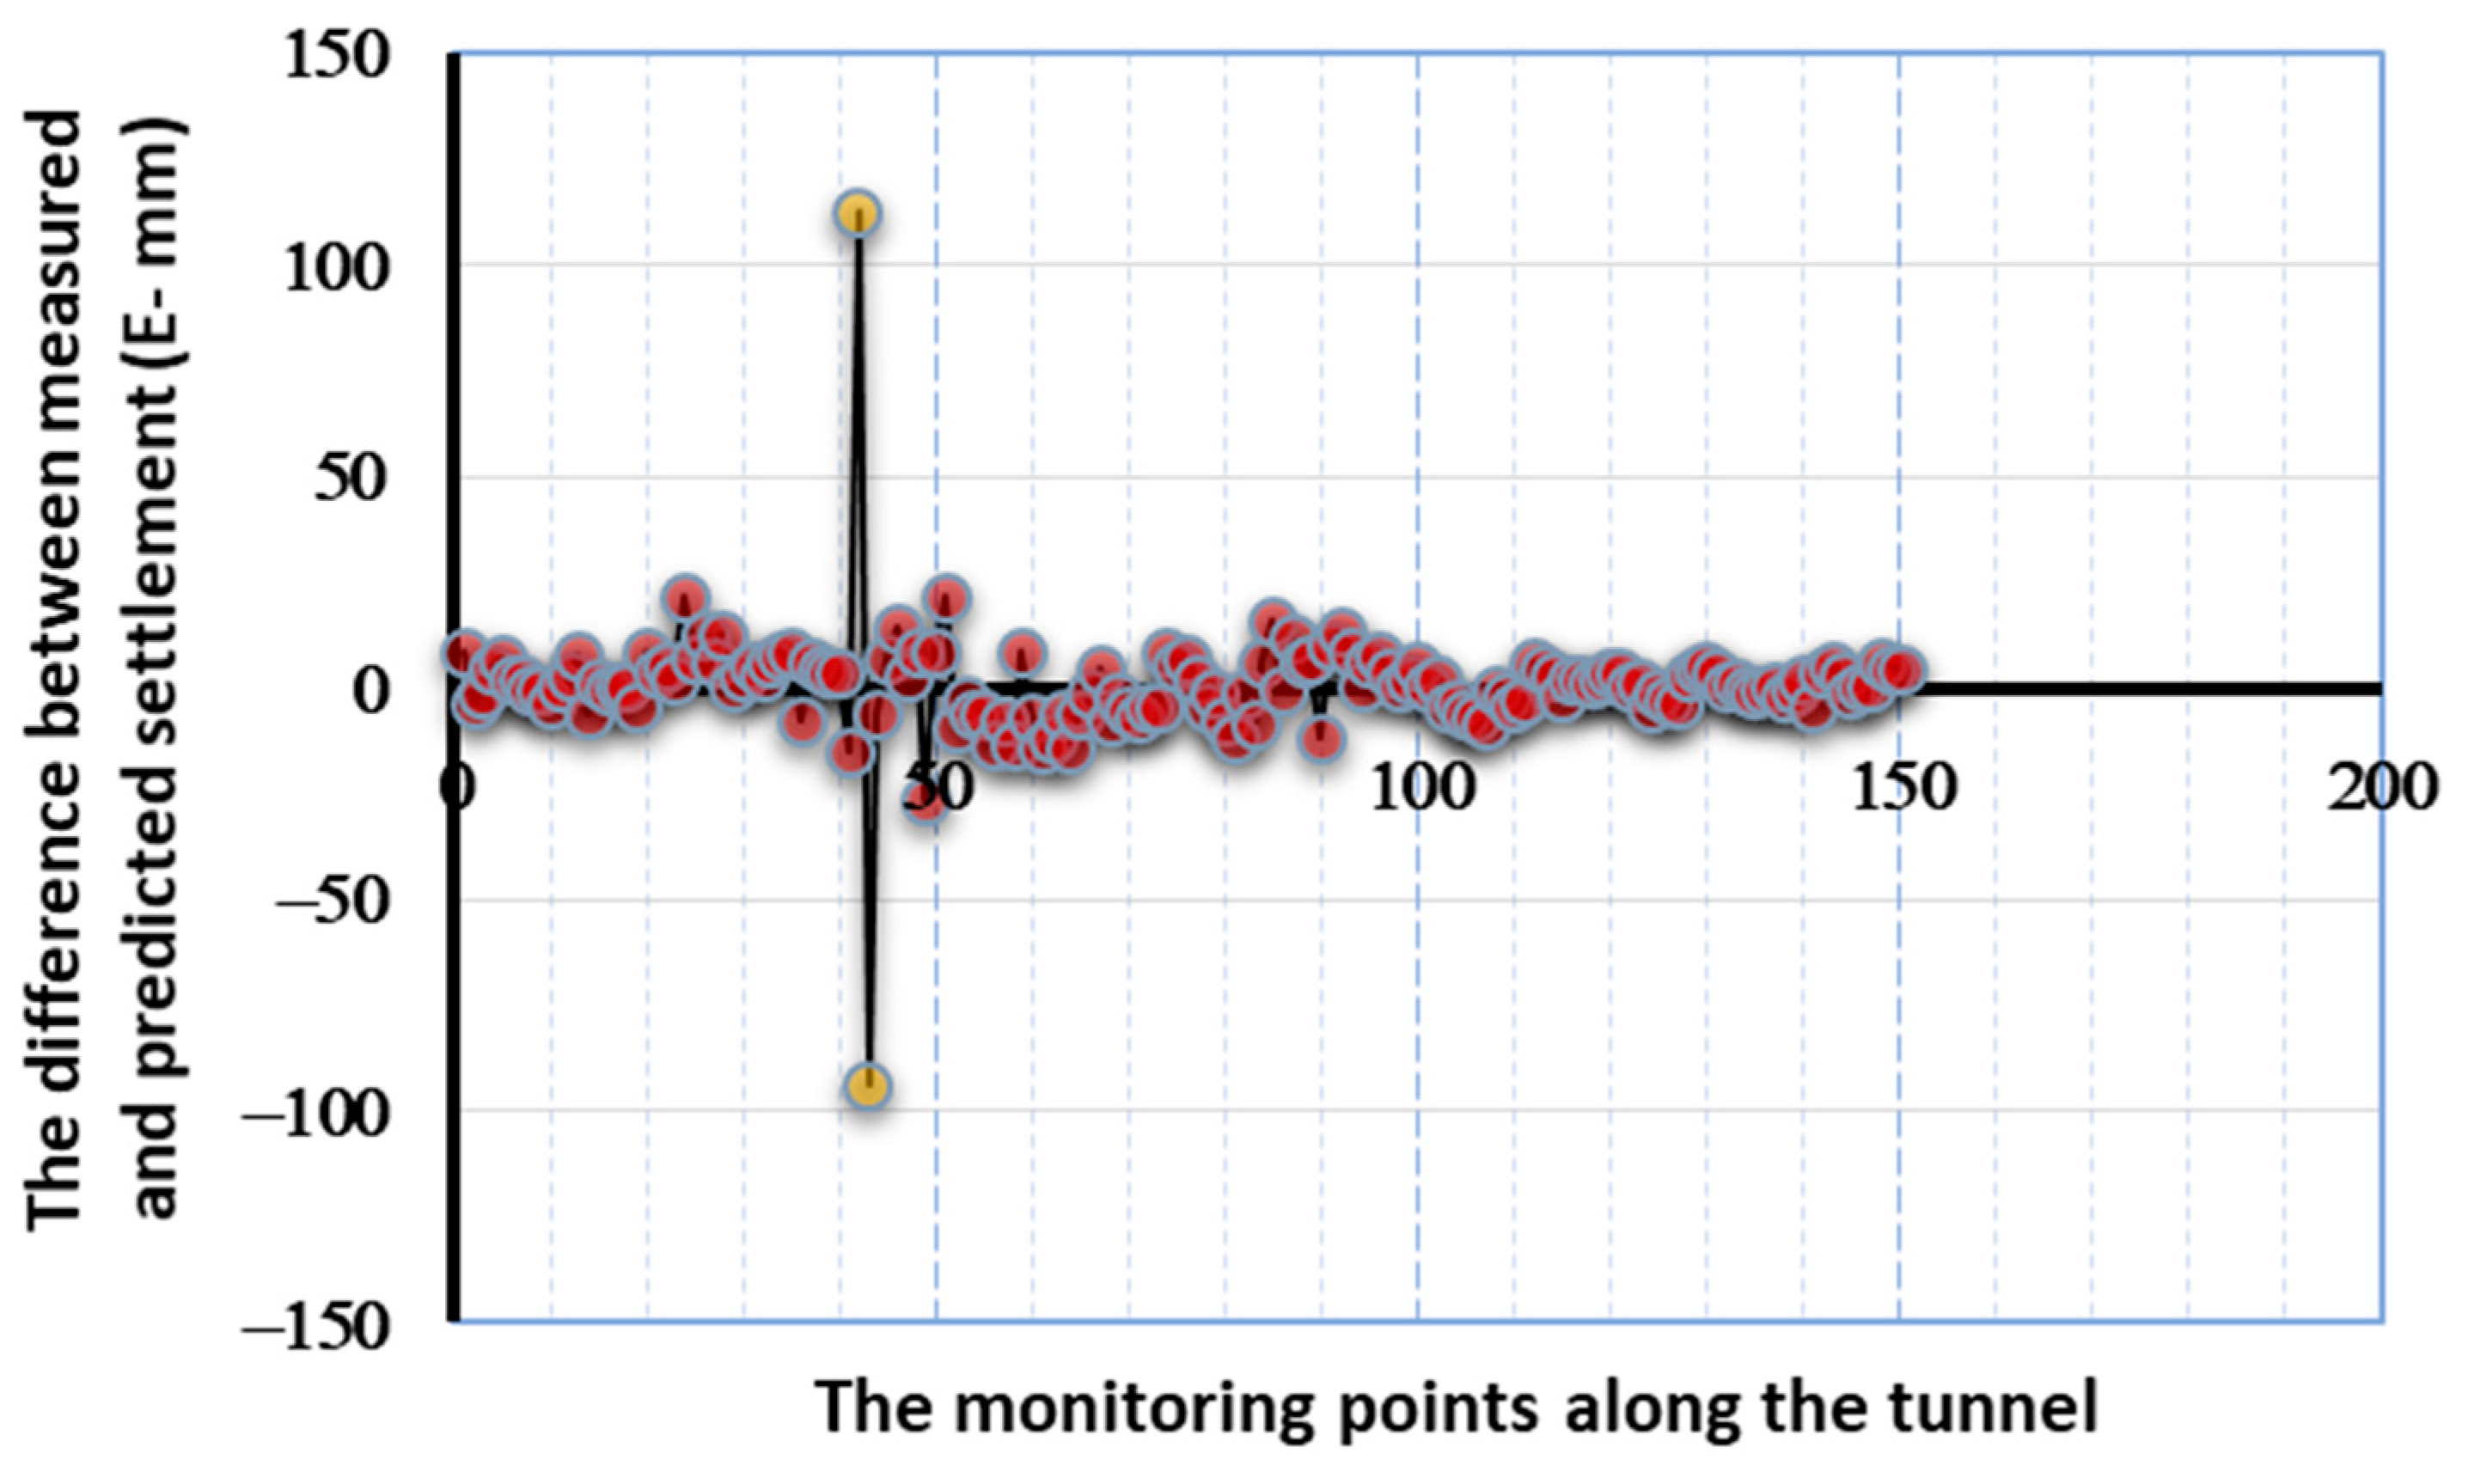
6.1. Utilizing the Most Accurate Neural Network to Predict the Settlement

According to the findings of the two mentioned criteria, the top-performing network among all generated ANN is NN10-6-1. As seen from Figure 8, there is a trivial difference between the mean square error value of the 10-6-1 and 10-26-1 networks, but the regression outcome of 10-6-1 is noticeably more accurate than that of the 10-26-1 network. Additionally, since the NN10-6-1 MSE, which accounts for approximately 0.00015, is fractionally more accurate than the MSE of NN10-26-1, which is roughly 0.000206, the NN10-6-1 was opted for in this research to forecast the surface settlement of the Southern Development Section of Tehran Metro Line 6. It has excellent R-value results and has the minimum MSE of all the networks examined. Figure 9 presents a summary of the NN10-6-1 regression outcomes. It should be mentioned that the x-axis represents the measured settlement in the tunneling field with the unit of millimeter—albeit in a normalized form—and the y-axis also refers to predicted settlement (mm). As can be seen clearly from Figure 9, the regression output of training, validation, and test proportions of the 10-6-1 network are 0.95745, 0.81969, and 0.98032, successively.
Until convergence is reached for the network’s error when tested against the designated validation vectors, ANN is trained iteratively on the designated training vectors. The training ceases once the training set has been successfully executed (even at the cost of an inferior generalization) to resolve the overfitting issue naturally. According to similar research studies, we may expect to witness much more R-value figures that are closer to 1. It is imperative to note that, concerning ten variously influential input parameters, which have not been studied so far to predict the settlement value, simultaneously, as well as experimental datasets, it can be derived that the appropriately acceptable results were obtained under real circumstances.
Figure 10 demonstrates the comparison of the simulated findings (predicted settlement (mm)) with the measured settlement in the tunneling field (mm) in 150 monitoring points. As observed, it can be interpreted that the ANN model correctly learned how to predict based on actual data precisely. After converting the normalized predicted numbers of the 10-6-1 network output into real settlement numbers, it is worthy to note that the prediction results of the ground settlement numbers are in the range between 0.96 mm and 177.21 mm, while in real conditions, the amount of settlement variations changes from 1.1 mm to 271 mm. It can be inferred that although the procedure of network learning for prediction was based on all data, this does not necessarily mean that the network output numbers must cover the same range as the actual surface settlement figures. In fact, in actual data, among all 150 datasets, the amount of settlement in two points is more than the maximum predicted number of the network, which is 177.21, but since a robust network must have the capability to generalize all types of datasets, particular points with maximum settlement figures cannot be considered as the basis of network training.

6.2. Sensitivity Analysis

Most research endeavors in the expansive area of ANN have focused on the progression of up-to-the-minute learning guidelines, enhancing network architecture, and promoting modern fields of ANN utilization. Investigations on the creation of substantial knowledge that assist us in perceiving the inherently internal representations created by ANN in response to a specific challenge are insufficient. ANNs are frequently portrayed to their users as mysterious, complex black boxes that transform input into literally favorable output. It is often impossible to determine or comprehend the mechanisms underlying the network weights or the activation proportions of hidden nods concerning the problem studied for ANNs of immense complexity. Because of this, determining and recognizing the link between each independent and dependent variable in ANNs are largely unnecessary, in contrast to conventional statistical models [55].
The purpose of the sensitivity analysis is to investigate how different sources of input uncertainty might be assigned to the uncertainty degree in the output of a system or a mathematical model. The method of recomputing results under different hypotheses to assess the impact of a component under a sensitivity analysis can be seen as an effective technique to achieve better fundamental communications between input and output parameters in a system [56]. According to Equation (8), the approach suggested by Milne was used in this paper to determine the relative importance of input variables based on the significance of weights [57].
I I F = j = 1 n h i d d e n w j i l = 1 n i n p u t s w j l . w o j k = 1 n i n p u t s ( j = 1 n h i d d e n w j k l = 1 n i n p u t s w j l . w o j )
where IIF refers to the significance of input parameters, ninputs denotes the number of inputs, nhidden is the number of unities, and noutput denotes the number of outputs.
The outcomes from training the ANN 10-6-1 based on experimental data are illustrated in Table 3. The training set was used to calculate the sensitivity analysis and the importance of weights, whereas Milne’s approach was solely exerted to assess the network’s connection weights. The influence of each input parameter on the settlement number is captured in Figure 11. It is noticeable that the largest proportion of the input’s effect on the settlement was grout injection, which accounts for almost 16.91%. On the other side, permeability, with just 5.07%, has the lowest influence on the output number. Earth pressure, which makes up 12.60%, is second in the sensitivity analysis pie chart. Following the reasons presented in Section 4 of this paper, regarding the role of excavation front pressure on the ground settlement, as expected, earth pressure is considered to be one of the most crucial components of generating a ground settlement in tunneling by EPB. It can also be inferred that the choice of EPB machine is a more desirable option than the open TBM in order to diminish the settlement percentage in mechanized excavations, specifically for tunneling in soft soil, since an open-shield-type TBM provides lateral support only, while closed-shield-type TBMs, such as the EPB, provide lateral support and frontal support in tunneling.
Surprisingly, a component that rarely has been chosen to evaluate the settlement at the previous investigations is the consistency index, with about 11.68% of the influential portion from the sensitivity analysis allocated to it, and among all ten effective input variables, it is the third significant criterion to form the settlement.

7. Discussion

A thorough comparison of the outcomes of various BP algorithms captures the fact that the robustness and capability of a particular model to predict the settlements caused by tunneling depend on the appropriate choice of input variables. Therefore, in this research, we tried to choose any components with the potential to influence the creation of the ground surface settlement as an effective input parameter in the network. Subsequently, ten network input variables were chosen from five fields that can be the main inducement of the settlement occurrence. Among the different implemented networks, the only network that accompanies the highest regression number, close to one, and the lowest amount of MSE compared to other networks is the 10-6-1 network. Since the 10-6-1 network has been almost capable of accurately and admittedly estimating the settlement proportion, then at this step, the output data of the network, which were normalized, are denormalized.
It is through a comparison between the actual settlement data and the predicted denormalized data of the network in the studied tunnel that a novel result will be accessible. Remarkably, risk assessment and management are two of the most fundamental motives for predicting the value of ground settlement caused by tunneling using the TBM-EPB machine. Hence, although the function approximation was appropriately evaluated for predicting the settlement rate, it is still highly substantial to check whether the predicted settlement numbers are lower or higher than the actual read figures. As a result, the following equation is considered to calculate the positive or negative difference between the measured and predicted figures of the settlement points [43]:
E = Sp − Sm
where E = the number of network prediction errors at an individual monitoring point, Sp = the predicted settlement figure by the network, and Sm = the real read number of the settlement at the same point.
It is obvious that if E is a positive number, it is interpreted that the network is capable of generating a more pessimistic prediction than reality. On the contrary, the amount of a negative number of E contains the concept of the network’s optimistic prediction. An E number of zero or immensely adjacent to zero indicates equilibrium between the measured and predicted settlement figures. As depicted in Figure 12, the value of the E parameter is computed and presented to all 150 datasets.
Since the inherent uncertainty of tunneling projects is an undeniable and inevitable component of a project’s nature, pessimistic predictions of the settlement rate would be far more efficient than optimistic predictions for risk analysis by project managers. It can be concluded from Figure 12 that the amount of the E parameter in the vast majority of datasets, among the whole number of 150 monitoring points, is positive. From the E figures, it can be inferred that the optimal chosen network has an acceptable safety level in the prediction, despite the accuracy. As a result, the safety concept in predicting can make the desired network reliable and generalizable.
It is imperative to note that precious and comprehensive research has been performed on settlement prediction in mechanized tunneling. A summary of the work is presented in Table 1 of this paper. However, in almost no research study, the two parameters of consistency index and permeability from the all considered input parameters were not referred to as two potential components in the occurrence of settlement. More interestingly, the consistency index, which has often been ignored in the settlement prediction by ANN methods, with roughly 11.68%, stands in third place in the sensitivity analysis. Albeit, according to the substantial hypotheses to specify the influential input data of the network, this was expected. Because soil consistency is the strength with which soil materials are held together or the resistance of soils to deformation and rupture, its impact on soil deformation is undeniable.
As a result, a sensitivity analysis is suggested to determine the relative importance of the input variables in engendering the settlement. Grout injection and earth pressure, with nearly 30 percent significance, play a crucial role in the settlement rate among all ten input components. The most explicit inference that can be perceived from this matter is that in mechanized excavation by TBM-EPB, compared to EPB operational factors, other criteria to create the ground settlement frequently pale in significance. Remarkably, it can be categorized as efficiently appropriate news since, in relation to allege the merits of mechanized tunneling, it is noticeable that the EPB operational factors can be monitored and controlled to decline the settlement amount, leading to a tremendously probable risk at tunneling construction sites.
It is noteworthy that the acquired results nearly resemble the significance of features yielded by Goh et al. (2018) and almost differ from the results presented by Zhang et al. (2021). Goh employed the multivariate adaptive regression splines technique (MARS) to classify the parameters influencing the surface settlement in tunneling utilizing the TBM-EPB machine [58]. According to the results of Goh’s investigations, earth pressure, mean moisture content of the soil, and grout pressure are ranked as the first to third in the importance to the formation of settlement, respectively, whereas in this research, grout injection, earth pressure, and consistency index are the most influential factors in creating settlement, successively. Perhaps, at first glance, the prioritization of the parameters in explaining the relative importance of settlement creation in the two studies was conflicted, but both studies demonstrate that, among the five distinguished areas of parameters affecting the occurrence of surface settlement, EPB operational factors play a pivotal role more than other fields. However, some differences can be found in the results of these two similar studies. As a case in point, concerning Goh’s results, as it was mentioned, the second determining parameter in features importance was the mean moisture content of the soil. At the same time, in this paper, the component named Average Ground Water Head is the sixth, which accounts for approximately 9.87%. One of the most crucial testimonies of this difference can be the diversity in the soil type of the two studied areas.
Conversely, the acquired results differ from Zhang’s similar research findings. Based on consequences obtained by Zhang utilizing the XGBoost ensemble method, geomechanical factors generally have a much higher priority than other potential element classifications in engendering the surface settlement. The following are the major reasons for these various outcomes and, subsequently, different concepts:
i.
Notably, the kind of studied project and the nature of the datasets in this study are utterly different from the fulfilled research by Goh and Zhang. Admittedly, depending on the change in the geomechanical properties of the soil, such as the type of soil; or the variation in the geological parameters, for instance, the percentage of soil moisture, it is possible to encounter diverse results in similar research.
ii.
Furthermore, Goh and Zhang studied eight parameters from four categories and opted for effective criteria in creating the ground settlement. In contrast, in this research, the fifth area, so-called geotechnical factors, comprising two parameters, in addition to the characteristics extracted in other fields, was considered to be a set of influential variables. Additionally, unlike this research, which employed all five EPB operational factors as network input variables, in the studies of Goh and Zhang, three components from the EPB parameters section were used. Two substantial variables, namely torque and thrust, were ignored. It is largely clear that the distinction in the definition of the influential input variables in creating ground settlement will undoubtedly lead to various consequences.
iii.
Finally, concerning the adopted methods of different machine learning (ML) algorithms, the foundation of network learning is frequently identical, and all of them are interdependent on the database collection. Consequently, it can be anticipated that the accuracy of the obtained results would be slightly different among the similar ML methods, but it is commonly not expected that thoroughly different results would be attained on an identical dataset by utilizing two various algorithms [43]. Considering all aspects and hypotheses, applying various ML prediction methods can also impose slender alterations in the outcomes of analyzing and prioritizing the determinant elements of the surface settlements.

8. Conclusions

The ability of the backpropagation neural network to predict ground settlements caused by tunneling using the TBM-EPB machine was investigated in this research. Five main categories, namely EPB operation factors, tunnel geometry, geological conditions, geotechnical parameters, and geomechanical properties, comprising 10 characteristics in total, were taken into account as input factors. In order to develop the BP ANN models and assess their feasibility, 16 different BP networks with various numbers of hidden layers’ neurons, using a database, consisting of 150 datasets from the southern development sector of Tehran Metro Line 6, were created and compared. MSE was utilized to evaluate the performance of the various ANNs. Eventually, the ground surface settlements of the southern development section of Tehran Metro Line 6 were predicted by the most accurate BP ANN technique, using a new database. The conclusions in the following are inferred based on the analysis:
i.
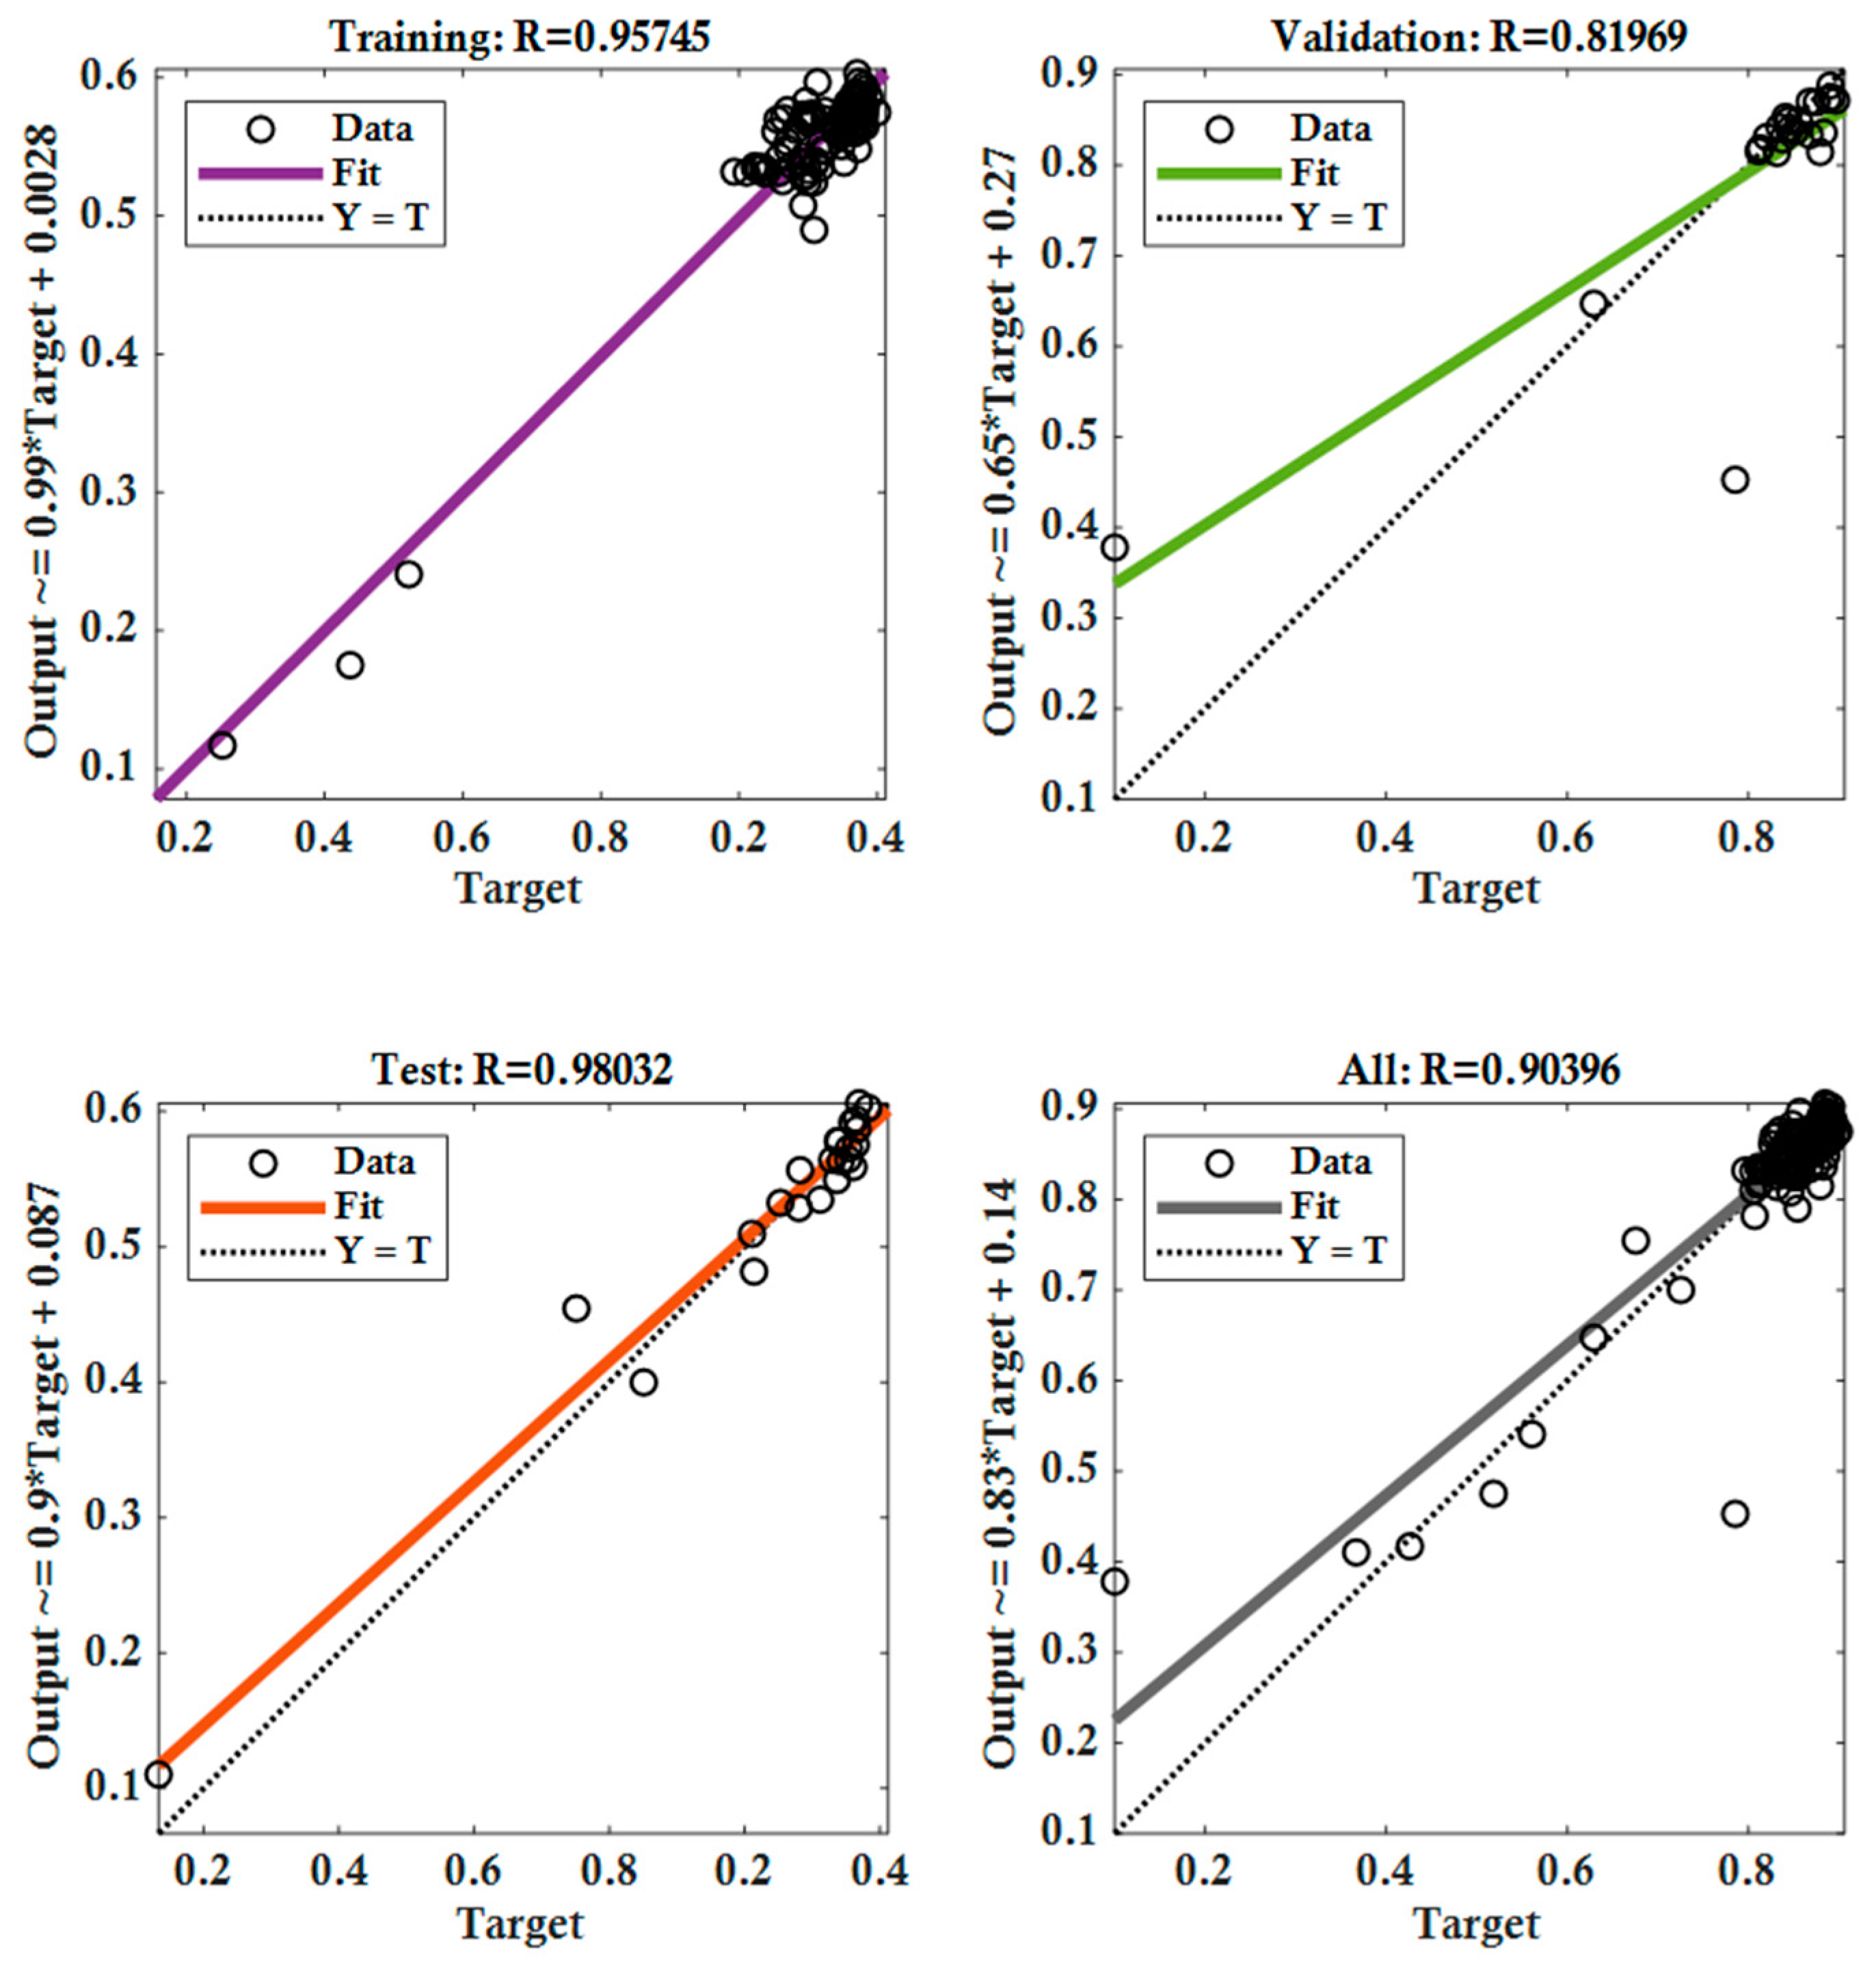
A total of 150 observations were considered from the four sections of the southern development project of Tehran Metro Line 6 being used to simulate the behavior of ground settlements. The regression coefficients (R-values) of the optimum opted network (10-6-1) for training, validation, and testing are 0.957, 0.82, and 0.98, respectively. It can be interpreted that R-values for the mentioned data and based on input parameters to estimate the settlement rate are close to 1, which implies the good performance of the network (10-6-1). The model’s MSE was 0.00015, and it is inferred that the BP ANN technique can predict the surface settlement rate with appropriate and acceptable accuracy.
ii.
Although the number increase of input data commonly promotes the generalization capability and accuracy rate of the BP ANN, the number and distribution of errors cannot be guaranteed. Hence, to successfully generalize an accurate ANN among whole decision-making tools, teetering between and across a mélange of choice criteria while trying to forge a new path to create an excellent settlement prediction should be noticed. Even if the presented database is large and adequate, updating the data collection while EPB excavates the tunnel is still essential.
iii.
The database is crucial to the performance of ANN techniques, since the robustness and generalization of an accurate network depend on it. In fact, the only limitation that may be encountered in the practical application of the model in other projects can be collecting dataset. Obviously, the error in the measurement accuracy of the data can lead to a substantial error of the network in the prediction. This issue will be more significant especially when we consider involving more variables as input parameters of the network in estimating the maximum surface settlement.
iv.
To tackle issues involving complicated geological conditions and identify different influential factors to form the settlement, using BP ANN is advised, as it is an effective and efficient technique compared to other conventional techniques for predicting the surface settlements induced by TBM-EPB machine in tunneling. Additional efforts and techniques are required to broaden the database and enhance the applicability of artificial neural network (ANN) models to make predictions regarding tunneling.

Author Contributions

Methodology, T.M. and A.S.; Software, T.M.; Validation, H.N. and M.G.N.; Formal analysis, A.S.; Investigation, T.M. and H.N.; Writing—original draft, T.M.; Writing—review & editing, A.S., H.N. and M.G.N.; Visualization, M.G.N. All authors have read and agreed to the published version of the manuscript.

Funding

This research received no external funding.

Data Availability Statement

All the datasets utilized in this article are accessible and can be presented to the journal and the esteemed jury if necessary.

Acknowledgments

Behro Comprehensive Consulting Engineers. Co—the employer’s consultant in civil, procurement, equipment, rail transportation, and the operation of Tehran Metro Line 6—provided technical support for this research. We appreciate the honorable managing director of the company, Gholamreza Shamsi, and all of the experts who work in the Research and Development Department of the company, as well as the engineers heading the Line 6 tunneling construction site.

Conflicts of Interest

The authors declare no conflict of interest.

References

  1. Zhang, Z.; Huang, M. Geotechnical influence on existing subway tunnels induced by multiline tunneling in Shanghai soft soil. Comput. Geotech. 2014, 56, 121–132. [Google Scholar] [CrossRef]
  2. Shi, H.; Yang, H.; Gong, G.; Wang, L. Determination of the cutterhead torque for EPB shield tunneling machine. Autom. Constr. 2011, 20, 1087–1095. [Google Scholar] [CrossRef]
  3. Zhang, W.; Li, H.; Wu, C.; Li, Y.; Liu, Z.; Liu, H. Soft computing approach for prediction of surface settlement induced by earth pressure balance shield tunneling. Undergr. Space 2021, 6, 353–363. [Google Scholar] [CrossRef]
  4. Bilgin, N.; Ozbayir, T.; Sozak, N.; Eyigun, Y. Factors affecting the economy and the efficiency of metro tunnel drivage with two TBMs in Istanbul in very fractured rock. In Proceedings of the ITA AITES World Tunnel Congress, Budapest, Hungary, 23–28 May 2009; p. 10. [Google Scholar]
  5. Zhang, X.; Lu, Y. FEM analysis of wasted tire chip and sand as construction material for piles. Case Stud. Constr. Mater. 2023, 18, e01735. [Google Scholar] [CrossRef]
  6. Liang, J.; Cui, J.; Lu, Y.; Li, Y.; Shan, Y. Limit analysis of shallow tunnels collapse problem with optimized solution. Appl. Math. Model. 2022, 109, 98–116. [Google Scholar] [CrossRef]
  7. Bouayad, D.; Emeriault, F.; Maza, M. Assessment of ground surface displacements induced by an earth pressure balance shield tunneling using partial least squares regression. Environ. Earth Sci. 2014, 73, 7603–7616. [Google Scholar] [CrossRef]
  8. Vorster, T.E.; Klar, A.; Soga, K.; Mair, R.J. Estimating the Effects of Tunneling on Existing Pipelines. J. Geotech. Geoenviron. Eng. 2005, 131, 1399–1410. [Google Scholar] [CrossRef]
  9. Attewell, P.B.; Hurrell, M.R. Settlement development caused by tunnelling in soil. Gr. Eng. 1985. [Google Scholar] [CrossRef]
  10. Peck, R.B. Deep Excavations and Tunneling in Soft Ground. State-of-the-Art Report. In Proceedings of the 7th International Conference on Soil Mechanics and Foundation Engineering, Mexico City, Mexico, 29 August 1969; pp. 225–290. Available online: http://scholar.google.com/scholar?hl=en&btnG=Search&q=intitle:Deep+excavations+and+tunneling+in+soft+ground#0%5CnhtCn://ci.nii.ac.jp/naid/10007809489. (accessed on 10 April 2023).
  11. Sagaseta, C. Analysis of undrained soil deformation due to ground loss. Géotechnique 1987, 37, 301–320. [Google Scholar] [CrossRef]
  12. Verruijt, A.; Booker, J.R. Surface settlements due to deformation of a tunnel in an elastic half plane. Géotechnique 1998, 48, 709–713. [Google Scholar] [CrossRef]
  13. Chen, R.; Meng, F.; Li, Z.; Ye, Y.; Ye, J. Investigation of response of metro tunnels due to adjacent large excavation and protective measures in soft soils. Tunn. Undergr. Space Technol. 2016, 58, 224–235. [Google Scholar] [CrossRef]
  14. Huang, H.; Gong, W.; Khoshnevisan, S.; Juang, C.H.; Zhang, D.; Wang, L. Simplified procedure for finite element analysis of the longitudinal performance of shield tunnels considering spatial soil variability in longitudinal direction. Comput. Geotech. 2015, 64, 132–145. [Google Scholar] [CrossRef]
  15. Paternesi, A.; Schweiger, H.F.; Scarpelli, G. Numerical analyses of stability and deformation behavior of reinforced and unreinforced tunnel faces. Comput. Geotech. 2017, 88, 256–266. [Google Scholar] [CrossRef]
  16. Zhang, L.; Wu, X.; Ji, W.; AbouRizk, S.M. Intelligent Approach to Estimation of Tunnel-Induced Ground Settlement Using Wavelet Packet and Support Vector Machines. J. Comput. Civ. Eng. 2017, 31, 04016053. [Google Scholar] [CrossRef]
  17. Pourtaghi, A.; Lotfollahi-Yaghin, M. Wavenet ability assessment in comparison to ANN for predicting the maximum surface settlement caused by tunneling. Tunn. Undergr. Space Technol. 2012, 28, 257–271. [Google Scholar] [CrossRef]
  18. Zhang, L.; Wu, X.; Zhu, H.; AbouRizk, S.M. Performing Global Uncertainty and Sensitivity Analysis from Given Data in Tunnel Construction. J. Comput. Civ. Eng. 2017, 31. [Google Scholar] [CrossRef]
  19. Chou, J.-S.; Lin, C. Predicting Disputes in Public-Private Partnership Projects: Classification and Ensemble Models. J. Comput. Civ. Eng. 2013, 27, 51–60. [Google Scholar] [CrossRef]
  20. Zoveidavianpoor, M. A comparative study of artificial neural network and adaptive neurofuzzy inference system for prediction of compressional wave velocity. Neural Comput. Appl. 2014, 25, 1169–1176. [Google Scholar] [CrossRef]
  21. Hamdia, K.M.; Lahmer, T.; Nguyen-Thoi, T.; Rabczuk, T. Predicting the fracture toughness of PNCs: A stochastic approach based on ANN and ANFIS. Comput. Mater. Sci. 2015, 102, 304–313. [Google Scholar] [CrossRef]
  22. Dai, H.; Cao, Z. A Wavelet Support Vector Machine-Based Neural Network Metamodel for Structural Reliability Assessment. Comput. Civ. Infrastruct. Eng. 2017, 32, 344–357. [Google Scholar] [CrossRef]
  23. Bouayad, D.; Emeriault, F. Modeling the relationship between ground surface settlements induced by shield tunneling and the operational and geological parameters based on the hybrid PCA/ANFIS method. Tunn. Undergr. Space Technol. 2017, 68, 142–152. [Google Scholar] [CrossRef]
  24. Suwansawat, S.; Einstein, H.H. Artificial neural networks for predicting the maximum surface settlement caused by EPB shield tunneling. Tunn. Undergr. Space Technol. 2006, 21, 133–150. [Google Scholar] [CrossRef]
  25. Kim, C.Y.; Bae, G.J.; Hong, S.W.; Park, C.H.; Moon, H.K.; Shin, H.S. Neural network-Based prediction of ground surface settelements due to tunneling. Comput. Geotech. 2001, 28, 517–547. [Google Scholar] [CrossRef]
  26. Santos, O.J.; Celestino, T.B. Artificial neural networks analysis of São Paulo subway tunnel settlement data. Tunn. Undergr. Space Technol. 2008, 23, 481–491. [Google Scholar] [CrossRef]
  27. Shi, J.; Ortigao, J.A.R.; Bai, J. Modular Neural Networks for Predicting Settlements during Tunneling. J. Geotech. Geoenviron. Eng. 1998, 124, 389–395. [Google Scholar] [CrossRef]
  28. Shahin, M.A.; Maier, H.R.; Jaksa, M.B. Investigation into the robustness of artificial neural networks for a case study in civil engineering. In Proceedings of the International Congress on Modeling and Simulation, Melbourne, Australia, 12 December 2005; pp. 79–83. [Google Scholar]
  29. Ahangari, K.; Moeinossadat, S.R.; Behnia, D. Estimation of tunnelling-induced settlement by modern intelligent methods. Soils Found. 2015, 55, 737–748. [Google Scholar] [CrossRef]
  30. Moeinossadat, S.R.; Ahangari, K. Estimating maximum surface settlement due to EPBM tunneling by Numerical-Intelligent approach–A case study: Tehran subway line 7. Transp. Geotech. 2018, 18, 92–102. [Google Scholar] [CrossRef]
  31. Chen, R.-P.; Zhang, P.; Kang, X.; Zhong, Z.-Q.; Liu, Y.; Wu, H.-N. Prediction of maximum surface settlement caused by earth pressure balance (EPB) shield tunneling with ANN methods. Soils Found. 2019, 59, 284–295. [Google Scholar] [CrossRef]
  32. Sun, W.; Shi, M.; Zhang, C.; Zhao, J.; Song, X. Dynamic load prediction of tunnel boring machine (TBM) based on heterogeneous in-situ data. Autom. Constr. 2018, 92, 23–34. [Google Scholar] [CrossRef]
  33. Ding, L.; Wang, F.; Luo, H.; Yu, M.; Wu, X. Feedforward Analysis for Shield-Ground System. J. Comput. Civ. Eng. 2013, 27, 231–242. [Google Scholar] [CrossRef]
  34. Samui, P.; Sitharam, T.G. Least-square support vector machine applied to settlement of shallow foundations on cohesionless soils. Int. J. Numer. Anal. Methods Géoméch. 2008, 32, 2033–2043. [Google Scholar] [CrossRef]
  35. Qi, C.; Tang, X. Slope stability prediction using integrated metaheuristic and machine learning approaches: A comparative study. Comput. Ind. Eng. 2018, 118, 112–122. [Google Scholar] [CrossRef]
  36. Liu, W.; Wu, X.; Zhang, L.; Wang, Y.; Teng, J. Sensitivity analysis of structural health risk in operational tunnels. Autom. Constr. 2018, 94, 135–153. [Google Scholar] [CrossRef]
  37. Behzad, M.; Asghari, K.; Coppola, E.A. Comparative Study of SVMs and ANNs in Aquifer Water Level Prediction. J. Comput. Civ. Eng. 2010, 24, 408–413. [Google Scholar] [CrossRef]
  38. Adoko, A.-C.; Jiao, Y.-Y.; Wu, L.; Wang, H.; Wang, Z.-H. Predicting tunnel convergence using Multivariate Adaptive Regression Spline and Artificial Neural Network. Tunn. Undergr. Space Technol. 2013, 38, 368–376. [Google Scholar] [CrossRef]
  39. Bendu, H.; Deepak, B.; Murugan, S. Application of GRNN for the prediction of performance and exhaust emissions in HCCI engine using ethanol. Energy Convers. Manag. 2016, 122, 165–173. [Google Scholar] [CrossRef]
  40. Krishnan, N.A.; Mangalathu, S.; Smedskjaer, M.M.; Tandia, A.; Burton, H.; Bauchy, M. Predicting the dissolution kinetics of silicate glasses using machine learning. J. Non-Cryst. Solids 2018, 487, 37–45. [Google Scholar] [CrossRef]
  41. Mangalathu, S.; Jeon, J.-S. Classification of failure mode and prediction of shear strength for reinforced concrete beam-column joints using machine learning techniques. Eng. Struct. 2018, 160, 85–94. [Google Scholar] [CrossRef]
  42. Ocak, I.; Seker, S.E. Calculation of surface settlements caused by EPBM tunneling using artificial neural network, SVM, and Gaussian processes. Environ. Earth Sci. 2013, 70, 1263–1276. [Google Scholar] [CrossRef]
  43. Chen, R.; Zhang, P.; Wu, H.; Wang, Z.; Zhong, Z. Prediction of shield tunneling-induced ground settlement using machine learning techniques. Front. Struct. Civ. Eng. 2019, 13, 1363–1378. [Google Scholar] [CrossRef]
  44. Chen, C.; Seo, H. Prediction of rock mass class ahead of TBM excavation face by ML and DL algorithms with Bayesian TPE optimization and SHAP feature analysis. Acta Geotech. 2023, 1–24. [Google Scholar] [CrossRef]
  45. Lessmann, S.; Baesens, B.; Seow, H.-V.; Thomas, L.C. Benchmarking state-of-the-art classification algorithms for credit scoring: An update of research. Eur. J. Oper. Res. 2015, 247, 124–136. [Google Scholar] [CrossRef]
  46. Kang, X.; Ge, L.; Chang, K.-T.; Kwok, A.O.-L. Strain-Controlled Cyclic Simple Shear Tests on Sand with Radial Strain Measurements. J. Mater. Civ. Eng. 2016, 28, 04015169. [Google Scholar] [CrossRef]
  47. Jichao, S.; Yuefei, H. Modeling the Simultaneous Effects of Particle Size and Porosity in Simulating Geo-Materials. Materials 2022, 15, 1576. [Google Scholar] [CrossRef]
  48. Elhakim, A.F. Estimation of soil permeability. Alex. Eng. J. 2016, 55, 2631–2638. [Google Scholar] [CrossRef]
  49. Assadoulahi, M.; Moomivand, H. A Critical Analysis of the Effect of Earth Pressure Balance (EPB) on Displacements of Tunnel Face by Numerical Modeling for the Geomechanical Conditions of Abuzar Water Transitional Tunnel. J. Civ. Environ. Eng. 2021, 50, 83–93. [Google Scholar]
  50. Nejad, F.P.; Jaksa, M.B. Load-settlement behavior modeling of single piles using artificial neural networks and CPT data. Comput. Geotech. 2017, 89, 9–21. [Google Scholar] [CrossRef]
  51. Naderpour, H.; Kheyroddin, A.; Amiri, G.G. Prediction of FRP-confined compressive strength of concrete using artificial neural networks. Compos. Struct. 2010, 92, 2817–2829. [Google Scholar] [CrossRef]
  52. Ahmadi, M.; Naderpour, H.; Kheyroddin, A. Utilization of artificial neural networks to prediction of the capacity of CCFT short columns subject to short term axial load. Arch. Civ. Mech. Eng. 2014, 14, 510–517. [Google Scholar] [CrossRef]
  53. Zhang, J.; Morris, A.J. A sequential learning approach for single hidden layer neural networks. Neural Netw. 1998, 11, 65–80. [Google Scholar] [CrossRef]
  54. Sheela, K.G.; Deepa, S.N. Review on Methods to Fix Number of Hidden Neurons in Neural Networks. Math. Probl. Eng. 2013, 2013, 425740. [Google Scholar] [CrossRef]
  55. Montaño, J.J.; Palmer, A. Numeric sensitivity analysis applied to feedforward neural networks. Neural Comput. Appl. 2003, 12, 119–125. [Google Scholar] [CrossRef]
  56. Naderpour, H.; Rafiean, A.H.; Fakharian, P. Compressive strength prediction of environmentally friendly concrete using artificial neural networks. J. Build. Eng. 2018, 16, 213–219. [Google Scholar] [CrossRef]
  57. Milne, L. Feature Selection Using Neural Networks with Contribution Measures. In Proceedings of the Australian Conference on Artificial Intelligence, Canberra, Australia, 13–17 November 1995; pp. 1–8. [Google Scholar]
  58. Goh, A.T.C.; Zhang, W.; Zhang, Y.; Xiao, Y.; Xiang, Y. Determination of earth pressure balance tunnel-related maximum surface settlement: A multivariate adaptive regression splines approach. Bull. Eng. Geol. Environ. 2016, 77, 489–500. [Google Scholar] [CrossRef]
Figure 1. Plan view of the construction site (Southern Development Section of Line 6).
Buildings 13 01051 g001
Figure 2. Successful and accurate arrival of the TBM (EPB shield) to the A6-4 Station.
Buildings 13 01051 g002
Figure 3. The observed settlements of different points at a section of 2278 m during 30 consecutive days (L, left; C, centered; R, right monitoring points in the transverse section).
Buildings 13 01051 g003
Figure 4. The settlement profile at section 2278 m.
Buildings 13 01051 g004
Figure 5. The concise method framework suggested in this research.
Buildings 13 01051 g005
Figure 6. Schematic diagram of utilized ANN models.
Buildings 13 01051 g006
Figure 7. Various correlation coefficients of NN 10-n-1.
Buildings 13 01051 g007
Figure 8. Maximum squared error (MSE) vs. the number of nods in the hidden layer.
Buildings 13 01051 g008
Figure 9. The training, validation, and test regression in NN 10-6-1 (x-axis, measured settlement (mm) in a normalized form; y-axis, predicted settlement (mm) in a normalized form).
Buildings 13 01051 g009
Figure 10. The comparison of predicted settlement results (mm) with measured settlement data (mm).
Buildings 13 01051 g010
Figure 11. The impact of each input parameter on the settlement rate (mm).
Buildings 13 01051 g011
Figure 12. The difference between measured and predicted settlement.
Buildings 13 01051 g012
Table 1. Summary of works on settlement prediction utilizing methods based on soft computing.
ReferenceTechniqueInput VariablesOutputSample Size
Kim C. Y. et al. (2001) [25]ANN-BPTunnel geometries, ground conditions, and excavation and support conditionsMaximum settlement (mm); inflection point (m)113 datasets
Shahin, M.A. et al. (2005) [28]ANN-BPFooting width, B; footing net applied pressure, q; soil compressibility, N = f(SPT); footing geometry, L/B; footing embedment ratio, Df/BFoundation settlement, Sm189 datasets
Suwansawat S. et al. (2006) [24]ANN-BPDepth (m), distance from shaft (m), geology at crown; geology at invert; face pressure, average penetrate; pitching, grouting pressure (bar), and grout filling (%)Maximum settlement (mm)49 datasets
Pourtaghi, A. et al. (2012) [17]Wavenet, BPDepth (m), distance from shaft (m), geology at the crown and at invert; invert to WT (m), average face pressure, average penetrate; pitching, grout pressure (bar), and grout filling (%)Maximum settlement (mm)49 datasets
Ahangari, K. et al. (2015) [29]ANFIS, GEPElasticity modulus, cohesion, angle of internal friction, tunnel diameter, and tunnel depthSettlement (mm)53 datasets
Bouayad D, Emeriault F. (2017) [23]PCA, ANFISThe dataset consisted of 15 variables (10 parameters + 5 thicknesses)Settlement (mm)95 datasets
Chen, R. et al. (2019) [43]BPNN, WNN, GRNN, ELM, SVM, RFCover depth, torque, penetration rate, thrust, face pressure, grout filling, tunnel depth below the water table, modified standard penetration test, modified dynamic penetration test, and modified uniaxial compressive strengthMaximum settlement (mm)200 datasets
Chen, R. et al. (2019) [31]BP-RBF-GRNNCover depth, torque, penetration rate, thrust, face pressure, grout filling, tunnel depth below the water table, modified standard penetration test, modified dynamic penetration test, and modified uniaxial compressive strengthMaximum settlement (mm)200 datasets
W.G. Zhang. et al. (2021) [3]ANN-SVM-MARS-XGBoostCover (H), advance rate, earth pressure, grout pressure, mean moisture content, mean soil elastic modulus, mean SPT above a crown level, and mean tunnel SPTSurface settlement (mm)148 datasets
Table 2. Range of various utilized parameters.
Variable (Abbreviation)Parameter TypeData (150)Unit
MinimumMaximumMeanStandard
Deviation
Coefficient of Variation
Torque (To)Input1.4145.35.2412.332.35MN.m
Penetration rate (Pr)Input52817.785.430.31mm/rev
Thrust (Th)Input642134,00420,571.194400.600.21KN
Earth pressure (Ep)Input01.570.580.520.91bar
Grout injection (Gi)Input020,4017608.832418.990.32L
Overburden (O)Input122822.664.20.19m
Average Ground Water Head (W)Input0206.337.471.18m
Consistency index (Ic)Input0.7510.930.110.12/
Permeability (K) (normalized)Input454.090.290.07cm/s
Standard penetration test (SPT)Input42.55049.851.050.02/
Maximum settlement (Sm)Output1.127120.4432.221.58mm
Table 3. Weights derived from an idealized neural network (NN 10-6-1).
InputsTarget
EPB Operation FactorsTunnel GeometryGeological ConditionsGeotechnical ParametersGeomechanical Property
Torque (MNM)Penetration Rate (MM/REV)Thrust (KN)Earth Pressure (bar)Grout Injection (Liter)Overburden (m)Average Ground Water Head (m) [above tunnel invert]Consistency IndexPermeability[K]
(cm/s)
SPTMaximum
Settlement (mm)
To variable weightsPr variable weightsTh variable weightsEp variable weightsGi variable weightsO variable weightsW variable weightsIc variable weightsK variable weightsSPT variable weightsSm variable weights
−0.49498−0.54981−0.15513−0.68738−0.406140.30172−0.420691.066−0.567210.276260.36375
−0.577981.837−2.26870.40548−1.7553−1.0539−1.4286−0.0074235−0.212610.864510.64147
−0.392370.69576−0.219−0.81171−1.6462−0.348580.677050.0728220.246520.21439−0.2348
−0.348670.133050.336140.833351.76680.70232−0.404341.21110.0837670.19734−0.37165
1.2353−0.36861−0.02889−0.412780.450230.460620.704250.378910.048820.50980.10354
−0.42897−0.56726−0.71115−1.27690.40772−0.574150.14446−1.2076−0.633960.539−0.27575
Disclaimer/Publisher’s Note: The statements, opinions and data contained in all publications are solely those of the individual author(s) and contributor(s) and not of MDPI and/or the editor(s). MDPI and/or the editor(s) disclaim responsibility for any injury to people or property resulting from any ideas, methods, instructions or products referred to in the content.

