Article

Automatic Detection of Pedestrian Crosswalk with Faster R-CNN and YOLOv7

1
Transportation Department, Engineering and Architecture Faculty, Erzurum Technical University, Erzurum 25050, Turkey
2
College of Engineering and Technology, American University of the Middle East, Egaila 54200, Kuwait
*
Author to whom correspondence should be addressed.
Buildings 2023, 13(4), 1070; https://doi.org/10.3390/buildings13041070
Submission received: 12 March 2023 / Revised: 3 April 2023 / Accepted: 14 April 2023 / Published: 18 April 2023

Abstract

:
Autonomous vehicles have gained popularity in recent years, but they are still not compatible with other vulnerable components of the traffic system, including pedestrians, bicyclists, motorcyclists, and occupants of smaller vehicles such as passenger cars. This incompatibility leads to reduced system performance and undermines traffic safety and comfort. To address this issue, the authors considered pedestrian crosswalks where vehicles, pedestrians, and micro-mobility vehicles collide at right angles in an urban road network. These road sections are areas where vulnerable people encounter vehicles perpendicularly. In order to prevent accidents in these areas, it is planned to introduce a warning system for vehicles and pedestrians. This procedure consists of multi-stage activities by sending warnings to drivers, disabled individuals, and pedestrians with phone addiction simultaneously. This collective autonomy is expected to reduce the number of accidents drastically. The aim of this paper is the automatic detection of a pedestrian crosswalk in an urban road network, designed from both pedestrian and vehicle perspectives. Faster R-CNN (R101-FPN and X101-FPN) and YOLOv7 network models were used in the analytical process of a dataset collected by the authors. Based on the detection performance comparison between both models, YOLOv7 accuracy was 98.6%, while the accuracy for Faster R-CNN was 98.29%. For the detection of different types of pedestrian crossings, YOLOv7 gave better prediction results than Faster R-CNN, although quite similar results were obtained.

1. Introduction

The most important factor causing traffic accidents in a road network is stated as human. This factor comes to the fore, especially in urban transportation [1] because the pedestrian–passenger–driver–vehicle–road network equation becomes more complicated. In developing countries, the migration of the population from rural to urban areas has caused crowded city centers. As a result, unplanned cities, low-educated human profiles on traffic safety, and irregular movements inevitably cause negative incidents in traffic flow. This is a big problem, especially for underdeveloped and developing countries. In addition, vehicle–pedestrian conflict in city centers is exceptionally high. If the tendency to obey traffic rules decreases, it is clear that these conflicts will cause material and fatal accidents.
According to the latest Global Status Report of the World Health Organization, approximately 1.3 million people die from traffic accidents every year around the world [2]. About 93% of these deaths occur in low- and middle-income countries. Most of these deaths involve young people between the ages of 5 and 29. Although the main causes of these deaths are epidemic diseases, traffic accidents are shown as the eighth main cause. It is inevitable that these death rates will increase with the neglect of road safety and the trend of increasing number of vehicles [2]. If this trend stays the same, reaching a modern urban traffic structure will continue to be challenging. In recent years, the integration of autonomous vehicles with traffic has continued at full speed. This means that both road networks and human profiles must be ready. Autonomization of vehicles alone is not beneficial. Other components of road networks also need to be autonomous because warning systems should be given not only to vehicle drivers but also to other components using a road network. Evaluating vehicle–infrastructure–environment communication together is very important in achieving traffic safety.
Moreover, overcoming the difficulties of increasing traffic and micro-mobility solution proposals, which are released as a last-mile delivery, have created new challenges in traffic flow. For example, e-scooter users have many wrong driving profiles, such as lousy parking, using pedestrian roads, and bad lane switching that will endanger traffic flow. To summarize, it is evident that disabled people, pedestrians, and autonomous vehicles use the same traffic flow. Therefore, solutions to some of the problems this union will bring should be proposed. The United Nations General Assembly has committed to halving global deaths and injuries from road traffic accidents by 2030 [2]. In line with this goal, researchers have to act to find solutions to problematic areas in traffic networks and adaptation to current and future technologies.
The authors examined pedestrian crosswalk, which cuts a road network perpendicularly and on which there is pedestrian traffic. It is considered one of urban traffic networks’ most critical conflict points. The Ministry of Interior of Turkey declared 2019 the “Year of Pedestrian Priority Traffic” due to the problems experienced in using pedestrian crosswalks [3]. As it can be understood from here, in developing countries such as Turkey, vehicle–pedestrian–bike–micro-mobility vehicles frequently experience accidents at a pedestrian crossing. It is necessary to develop a system that warns users as they approach pedestrian crossings, both to contribute to the process of autonomy and to reduce the probability of accidents to lower levels. To do so, this study aimed at the stage of automatic detection of pedestrian crosswalks with high accuracy.
In this study, a dataset with 259 pedestrian crosswalk images were obtained from 2 different cities in Turkey, and the automatic detection of pedestrian crosswalks was carried out. The obtained data were passed through the debugging–editing and labeling processes. LabelMe [4] and Roboflow [5] were used for the labeling process. YOLOv7 [6], a single-stage object detection detector, and Faster-RCNN [7], a two-stage object detection detector from the Detectron2 library, were used for object detection. With the help of different backbone architectures, these network structures achieved the most accurate and fast detection of pedestrian crosswalks. The flowchart of the study is given in Figure 1.
The paper is organized as follows: the next section presents studies on crosswalk and deep learning-based object detection. In the third section, the network architectures of the models are presented. The fourth section provides information about the methodology of different network models, and the dataset collected is described. Finally, the paper gives information about the results of the study and provides direction for future studies.

2. Related Work

This section presents a brief review of pedestrian crosswalks and deep learning-based object detection, followed by the innovation/contribution of this paper to the literature. Object detection techniques and object detection using deep neural networks are developing fields [8]. Therefore, it is not the aim of this paper to review all studies in this field, because some comparisons made today will probably be out of date in the near future. Instead, the authors examined more general results and the methods used in this section.
Crossing a street is not only difficult for visually impaired individuals but also has some difficulties for other users. Nevertheless, partial solutions to this problem can be offered with effective pedestrian crosswalk detection. Brief information about some of the studies in the literature is given below.
Se [9] first grouped crosswalk lines and proposed a crosswalk detection method using escape point constraint. However, the high computational complexity of this proposed model highly affects the efficiency of use. Huang and Lin [10] identified areas with alternating black and white stripes using bipolarity segmentation and achieved a good performance in standard lane zones. With this approach, they detected similar zebra crossings in [11,12]. Chen et al. [13] proposed a crosswalk detection method based on Sobel edge extraction and Hough Transform. This approach provides a good balance between model accuracy and speed. Cao et al. [14] achieved high accuracy in recognizing disabled roads and pedestrian crosswalks. Moreover, their study was planned to help visually impaired people facilitate orientation and perceive the environment. A lightweight semantic segmentation network, which was used to segment both pedestrian and disabled paths, combined with depthwise separable convolution, was used as a basic module to reduce the number of parameters of the model and increase the speed of semantic partitioning. In addition, an atrous spatial pyramid pooling module was used to improve the network accuracy. Finally, a dataset was collected from a natural environment to verify the effectiveness of the proposed method. As a result, it was observed that the proposed approach gives better or similar results when compared to other methods.
Ma et al. [15] emphasized the difficulties of people with disabilities in obtaining external information and provided some suggestions for overcoming these difficulties. Their main goal was to investigate the effectiveness of tactile paving at pedestrian crosswalks. Data were collected using unmanned aerial vehicles (UAV), such as drones and a three-axis accelerometer. A before–after comparative analysis of the quantitative index results revealed that the tactile coating helps people with visual impairments maintain a straight passageway, avoid directional deviations, reduce transit times, and improve gait patterns and symmetry.
Romić et al. [16] proposed a method based on an image column and row structure analysis to detect pedestrian crossings to facilitate crossing. The technique was also tested with real data input, and it was found that its performance depends on the image quality and resolution of the dataset.
Tian et al. [17] proposed a new system for understanding dynamic crosswalk scenes; detecting key objects, such as pedestrian crosswalks, vehicles, and pedestrians; and defining pedestrian traffic light status. The proposed system that was implemented on a device worn on the head of a person, which transmits scene information to disabled individuals via an audio signal, was proven to be beneficial.
Tümen and Ergen [18] emphasized that crossroads, intersections, and pedestrian crosswalks are essential areas for autonomous vehicles and advanced driver assistance systems because the probability of traffic accidents in these areas is relatively high. In this context, a deep learning-based approach over real images was proposed to provide instant information to drivers and autonomous vehicles. This approach used CNN-based VggNet, AlexNet, and LeNet to classify the data. As a result, high classification accuracy was achieved, and it was shown that the proposed method is a practical structure that can be used in many areas.
Dow et al. [19] designed an image processing-based human recognition system for a pedestrian crossing. The system aims to reduce accidents and accident possibilities and to increase the level of safety. In order to improve the accuracy of pedestrian detection and reduce the system’s error rate, a dual-camera mechanism was proposed. The experimental results showed that the obtained prototype system performs well.
Pedestrian crosswalks are an essential component of urban transportation, mainly because these road sections are the regions where pedestrian and vehicle accidents occur more frequently. It is an undeniable fact that developing countries experience many problems in these regions [20]. Many parameters, such as driver–pedestrian behavior profile, mutual respect, low tendency to obey the rules, penalties, and flexibility in the rules, are shown as the reasons for these problems.
In addition to the detection of pedestrian crosswalks, object detection processes are also applied in many fields nowadays. Object detection plays an active role in sectors such as health [21], safety [22], transportation [23,24], and agriculture [25,26]. Many researchers enlarge their dataset to achieve high detection accuracy and experiment with differences in the network structure of their detection model. In fact, studies continue for the detection of two-dimensional materials [27]. A few of the existing studies in different fields are detailed in this section and an in-depth analysis framework is presented.
Researchers such as [28,29,30,31,32] have carried out many studies to detect helmets used for dangerous works, such as construction. SSD, Faster R-CNN, and other YOLO models were used in these studies. Among these studies, [28] had the highest mAP value of 96 percent. Even in recent years, object detection in the agricultural and livestock sector provides great ease of work. Fast counting of animals on a farm and detection of dead animals increase efficiency. Different detection models were used in duck counting by [33]. The YOLOv7 achieved a better detection rate than other models, with a 97.57 percent mAP value.
Detection of weeds and product counting in the agricultural sector provide great opportunities in the marketing part. In a study conducted by [25], the YOLOv7 model reached a mAP value of 61 percent during the detection of weeds in a field. This value might vary depending on the dataset and the detected object. Since weeds are small objects and a training dataset is difficult to collect, detection accuracy decreases.
The works on driver-assistance systems continue. Using the phone and drinking beverages, which cause distraction while driving, cause accidents and endanger traffic safety. In a study conducted by [34], YOLOv7 was used to detect driving distraction behaviors. Four different detection results were obtained, including danger, drinking, phone usage, and safety. A mAP value of 73.62 percent was obtained. Creating a dataset by obtaining four different driver states from different drivers is a difficult and time-consuming process. It is clear that the accuracy rate will increase if the variety of data is increased.
As the use of object detection progresses as a sector, it offers very useful solution suggestions. An early smoke warning system for fires that cause ecological problems will protect our forests. In order to prevent the spread of fires, a study was carried out for a smoke warning system. The dataset was defined with three different distance scales. With YOLOv5x, an accuracy rate of 96.8 percent was achieved. Despite the irregularity of the smoke distribution data, a high accuracy rate was obtained [35].
As stated above, object detection continues to be a solution to some existing problems. Different object detection studies, such as cancer polyp detection [21], internal canthus temperature detection in the elderly [36], construction waste detection [37], in situ sea cucumber detection [38], ship detection in satellite images [39], and citrus orchard detection [40], are available in the literature. It is observed that the accuracy rates, which are mentioned in more detail in the later sections of this study, are quite high. Many of the existing studies in the literature have accuracy values between 0.60 and 0.90. In this study, Faster R-CNN and YOLOv7 models have accuracy values of 0.9829 and 0.986, respectively.
All the studies examined showed that the accuracy rate is directly related to the dataset used. The dimensional properties of a detected object, its state in the image, and its variability reduce the detection accuracy. In order to eliminate this situation, the number and diversity of data should be increased. However, this process is quite difficult. In addition, the most suitable model for the dataset should be selected by using different detection models. In this study, the dimensional properties of the detected object are large. Thus, the accuracy rate is high. In particular, local municipalities should use object detection applications more frequently. The use of these models, most of which are open source, especially in urban transportation applications, would be correct within the scope of smart cities. These systems, which are quick solutions to problems, such as parking areas, wrong parking violation penalties, and red light violations, should be supported by politicians.
The literature survey showed that pedestrian crosswalks are a vital segment for autonomous vehicles and advanced driver-support systems, pedestrians, and disabled people. Nevertheless, most studies examined pedestrian crosswalks mainly from the disabled people’s perspective and rarely on the areas where pedestrians approach a crosswalk to cross the street. It appears that these analyses are unidirectional, focusing solely on the direction of pedestrian crosswalks. There is, however, a crucial oversight in the fact that the need for vertical sensing capability to identify autonomous vehicles and advanced driver-assistance systems at pedestrian crosswalks has been disregarded.
This study aims to fill the gap in the current literature by analysing the automatic detection of pedestrian crosswalks in both directions. The contributions of this study to the literature are as follows:
(i)
Two-direction object detection based on Faster R-CNN and YOLOv7 is used for the first time in the evaluation of the detection of pedestrian crosswalks.
(ii)
The two-way crosswalk detection will serve as a valuable groundwork for infrastructure planning and inspiration to other researchers. Additionally, the road network dataset utilized in this study is open to all readers and will offer significant support to fellow researchers, as collecting such data can be a challenging task.
(iii)
Traffic safety will be ensured by completing the pedestrian crosswalk detection process, which is the first stage of the warning system for vehicle drivers, disabled individuals, phone-addicted pedestrians, cyclists, and other micro-mobility vehicle drivers.
(iv)
The completion of the first phase of the warning system will be an important milestone for users of road networks. The high-accuracy detection process established in this study will further the goal of autonomy and is expected to make a substantial contribution to its success.

3. Network Architecture

This section provides a concise overview of the models that serve as the basis for the network architecture. It elaborates on the rationale behind selecting the proposed models, the backbone structures employed, and each model’s success rate in object detection.

Base Models

Since their emergence in 2012, object detection algorithms have been employed as a solution to various problems [8]. Researchers and developers introduce new algorithms annually with the aim of achieving faster and more accurate detection rates. Several models trained on large datasets are available to researchers, and comparisons of these models are presented in the literature [6,41,42,43]. However, the results may vary depending on factors such as the dataset used, the user’s ability, and the computer’s specifications. Object detection competitions have recently been held to promote scientific activities. Notably, the Global Road Damage Detection Challenge (GRDDC) is the most comprehensive object detection competition of recent years. The different solution proposals and application techniques offered by numerous participants have been a valuable source of inspiration for this study. Although many authors have opted to use the Faster R-CNN technique, rather than repeatedly developing a Faster R-CNN field [7,44] model, Detectron2 was used to expedite the development cycle in this study. Detectron2 is a next-generation software system developed by Facebook AI Research (FAIR) that implements state-of-the-art object detection algorithms [45]. Many pre-trained base models are available in Detectron2 [46]. To achieve our aim, Faster R-CNN working with a two-stage detector working principle and YOLOv7 [6] working with a single-stage detector working principle were chosen as the object detection algorithms in this paper.
Two basic backbone models commonly used for Faster R-CNN are R101-FPN and X101-FPN [47]. The main reason for choosing these two models is that they have better Faster R-CNN box Average Precision (AP) than other fields [8,48]. The pre-trained values with the ImageNet dataset are 42% and 43%, respectively. Although X101-FPN has a better AP, the train/predict part may take longer. Its speed is cited as the main reason for using R101-FPN. The Faster R-CNN network structure consists of three main components and is presented in Figure 2. The three main components are the backbone network, the region proposal network, and the box head. The operation of this network architecture is as follows:
i.
The entire input image is ensured as an input to the convolutional layers of Faster R-CNN to produce a feature map.
ii.
Then, to identify the region proposals on the feature map, a region proposal network is used to predict the region proposals.
iii.
Selected anchor boxes and the feature maps computed by the initial CNN model together are fed to the RoI pooling layer for reshaping, and the output of the RoI pooling layer is fed into the FC layers for final classification and bounding box regression.
The part that extracts the features from the input given to the network architecture is the backbone network. This study uses a Feature Pyramid Network (FPN) Field [47] as the backbone network. The region proposal network detects box candidates based on objectivity scores (which represent the probability of finding an object in a region) and box deltas (which suggest centers based on the size of the input image). Subsequently, the RoI head carries out the classification and prediction processes. Prior to this stage, the suggested sets of boxes are passed through the RoI pooling layer to standardize them.
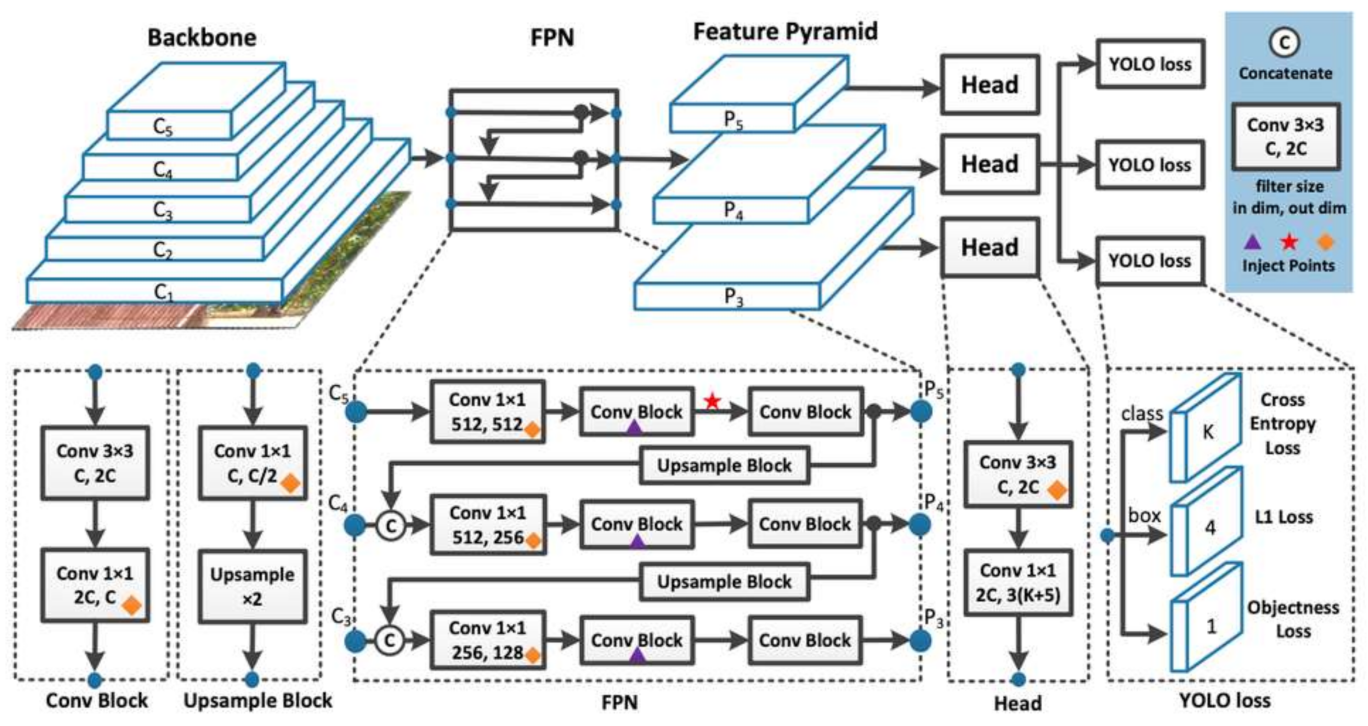
This study also employs YOLOv7 as a model. The field of object detection is continuously evolving and improving, and YOLO remains at the forefront of real-time object detection with its latest version, YOLOv7. YOLOv7 has pushed the boundaries of state-of-the-art object detection, delivering faster and more accurate inferences compared to its predecessors. The YOLOv7 version was presented by Wang et al. [6] in 2022. The YOLOv7 authors sought to define state-of-the-art object detection by creating a network architecture that would predict bounding boxes more accurately than their counterparts at similar inference rates. The new network architecture design is presented in Figure 3. To achieve this, the authors of YOLOv7 implemented several changes to the network structure and training routines, including expanded efficient layer aggregation, model scaling techniques, and parameterization re-planning. YOLOv7 demonstrates state-of-the-art performance in real-time object detection when compared to other similar models. The YOLO architecture functions as follows:
i.
It resizes the input image before going through the convolutional network.
ii.
A 1 × 1 convolution is first applied to reduce the number of channels, which is then followed by a 3 × 3 convolution to generate an output.
iii.
Some additional techniques, such as batch normalization and dropout, regularize the model and prevent it from overfitting.
As with all object detection models, Faster R-CNN and YOLOv7 have many hyper-parameters that need to be adjusted. Experimenting with these hyper-parameters with different configurations and discovering the results is almost impossible in terms of time and computation. The changed parts are detailed in the Training details section. Readers who want more detailed information about the default configurations can refer to the Detectron2’s documentation page [50] and YOLOv7 GitHub [51].

4. Methodology and Dataset

In this section, the data exploration, evaluation, training details, and pedestrian crosswalk detection details are presented. Although the methods used were evaluated on a single dataset, the authors experimented with different value structures. Through the process, the authors were able to solve some of the problems in the traffic network, particularly regarding the critical importance of pedestrian crosswalks in urban transportation.

4.1. Data Exploration and Splits

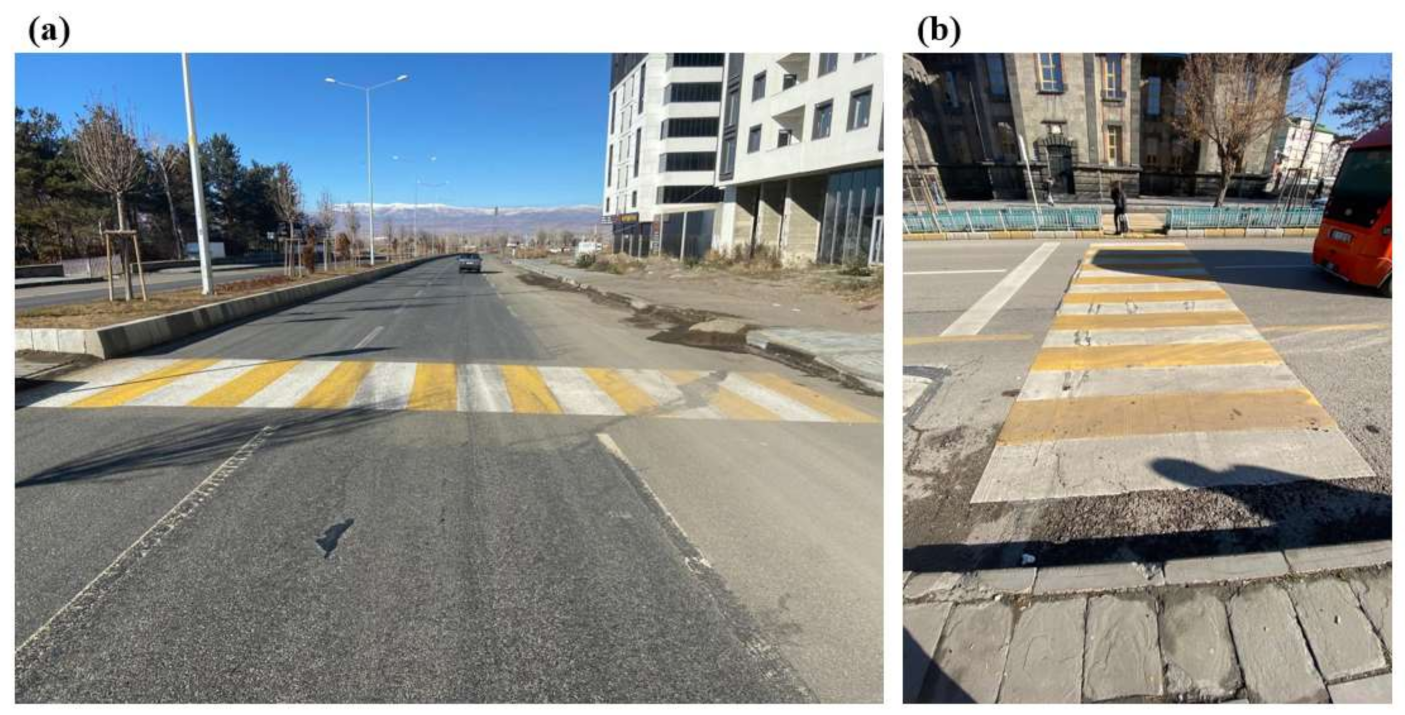
In this study, a single-class training (CRWALKtr), validation (CRWALKval), and test (CRWALKtst) dataset were used, which was not previously utilized in any public dataset’s model training or testing. The dataset was divided into three parts: training, testing, and validation sets, comprising 539, 67, and 67 images, respectively. The data were split into 80% for training, 10% for testing, and 10% for validation. Details of the dataset collection are presented in this section. The number of data points used in a model is crucial for the accuracy and diversity of the data, which is why the authors collected data from two different cities in Turkey, Rize in the north and Erzurum in the east. Collecting pedestrian crosswalks of different structures will allow future studies to use them. However, the city of Rize has fewer pedestrian crosswalks due to its small size. To collect the dataset, the authors employed two different sampling methods, which are illustrated in Figure 4, based on their experience. One of the main contributions of this study is to facilitate two-way pedestrian crosswalk detection because the warning system planned in this study is valid for everyone on a road network. By sending a warning to both vehicle drivers, pedestrians, and micro-mobility drivers who use the same road, it will ensure that safety measures, such as speed reduction and environmental control, are taken while passing through that area. When these data were examined, the proportion of collected data considering vehicle direction was 35 percent. The proportion of collected data considering pedestrian direction was 65 percent. The biggest difference between this rate is shown as the difficulty of taking pictures in the traffic flow.
The obtained dataset was subjected to labeling in order to be included in the object detection process. This process was carried out via Labelme [4] for Faster R-CNN and RoboFlow [5] for YOLOv7, and the label name was determined as “crosswalk”.

4.2. Data Augmentation

A total of 103 of the 259 images that comprise the dataset were collected from Rize and the rest from Erzurum. The negativities and discussions experienced while collecting the data caused the size of the data to be limited (the pedestrians and drivers argued that it was a violation of personal rights).
In addition, one of the biggest problems in object detection is different weather conditions or low model performance in some situations (sun reflection, lack of light, etc.). In this context, a data augmentation process was applied in this study. The augmentation processes applied was as follows: flip—horizontal; 90° rotate—clockwise; crop—0% minimum zoom; 30% maximum zoom; rotation—between −15° and +15°; shear—±15° horizontal and ±15° vertical; saturation—between −50% and +%50; brightness—between −29% and +%29; blur—up to 2.7px; and noise—up to 2% of pixels. With these processes, it is possible to better train the model against some problems that exist in the real world. Moreover, by applying data augmentation to the collected data from the perspectives of pedestrians and vehicles, data were created with different perspectives for micro-mobility vehicles. Thus, the perspectives of many components using pedestrian crosswalks in the road network were obtained. As a result of these processes, the number of data points created was 673.

4.3. Evaluation

There are many parameters for the evaluation of object detection processes. An estimation is considered correct if it satisfies the following conditions:
(i)
P b and G b are a predicted box and a ground-truth box, respectively. The area of overlap between P b and G b exceeds 50% (additionally, a r e a   P b   G b and a r e a   P b   G b ). This condition is described as Intersection over Union (IoU) > 0.5. For more details regarding this, please refer to [52,53].
IoU = a r e a   P b   G b a r e a   P b   G b
(ii)
The predicted label matches the actual label. In this case, if IoU ≥ 0.5, then it is a match, and it is not otherwise.
Accuracy, precision, recall, and F1 score are evaluation parameters in object detection processes. Accuracy is the closeness of a quantity’s measurement value to its actual value. Precision is the ratio of true positives to all predicted positives. Recall is the ratio of true positives to all true positives. F1 score is calculated as the harmonic mean of precision and recall values. Details of the parameters and some equations [53,54,55] are given below:
True Positive (TP): The number of pixels belonging to a crosswalk correctly detected by the algorithm.
False Positive (FP): The number of pixels classified as a crosswalk by the algorithm but not belonging to any specific crosswalk.
False Negative (FN): The number of pixels classified as no crosswalk by the algorithm but belonging to a crosswalk.
A c c u r a c y = T P + T N T P + T N + F P + F N  
P r e c i s i o n = T P T P + F P  
R e c a l l = T P T P + F N  
F 1   s c o r e = 2 × P r e c i s i o n × R e c a l l P r e c i s i o n + R e c a l l  

4.4. Training Details

The network was implemented in GoogleColab with Pytorch. Deep learning applications are developed in Google Colab using various libraries, such as Keras, TensorFlow, PyTorch, and OpenCV. The most important feature that distinguishes Colab from other free cloud services is that Colab provides free GPU. Deep learning applications were developed using PyTorch over the free Tesla K80 GPU provided by Google Colaboratory. The hardware features of the computer from which the object detection models were created included Processor: Intel(R) Core(TM) i5-7400 CPU @ 3.00GHz, RAM: 8.00 GB. The pre-trained network structure was used in this paper. Pedestrian crosswalk detection was carried out with two different object detection algorithms. These algorithms are known to have different properties. The authors provided the detection experiments with different values. Table 1 and Table 2 below contain the hyper-parameter values of the models. These values can be changed by researchers using object detection models. The changed values are included in the tables. These values directly affect a model’s accuracy. In this study, the object detection models gave some hyper-parameter values, and the training process continued without changing these values.
The current network was trained on the CRWALKtr training set and predicted on the CRWALKval validation set. The CRWALKtst test set was used to prevent overfitting during the training process to obtain the best model. In Section 4.1, it is given in detail how the data used in the model are divided into three sets for training, validation, and testing. The images were resized to 720 × 720. Based on the authors’ experience, models in the Detectron2 library give better results using the same-sized images.

5. Result and Discussion

In this study, pedestrian crosswalks using the Faster R-CNN and YOLOv7 object detection models were detected automatically. This approach provides a different perspective for solving many existing problems. Pedestrian crosswalks, where pedestrian–vehicle interaction is frequent, have an essential sensitivity in autonomization, because not only vehicles but also disabled individuals using these parts should play an active role in autonomy. Autonomization for both vehicles and pedestrians at the same time is inevitable in terms of traffic safety. The authors believe that this process will take place very soon. Therefore, they see the importance of carrying out this study, considering current technologies and mobility. Vehicle, pedestrians, disabled individuals, and micro-mobility vehicle drivers are frequently encountered in urban transportation. Especially in developing countries, accidents frequently occur among these traffic components. As a solution to this problem, the authors decided to develop a warning system. However, it was emphasized that this system consists of many stages and that pedestrian crosswalks should be perceived as two-way first. This system will be integrated with users, and users will be warned when pedestrian crosswalks enter the camera angle. Thus, by taking safety measures, such as speed reduction and environmental control, both vehicle drivers and other vulnerable road components will reduce the accident rate. Therefore, the object detection process, which is the first stage of the warning system, is of great importance.
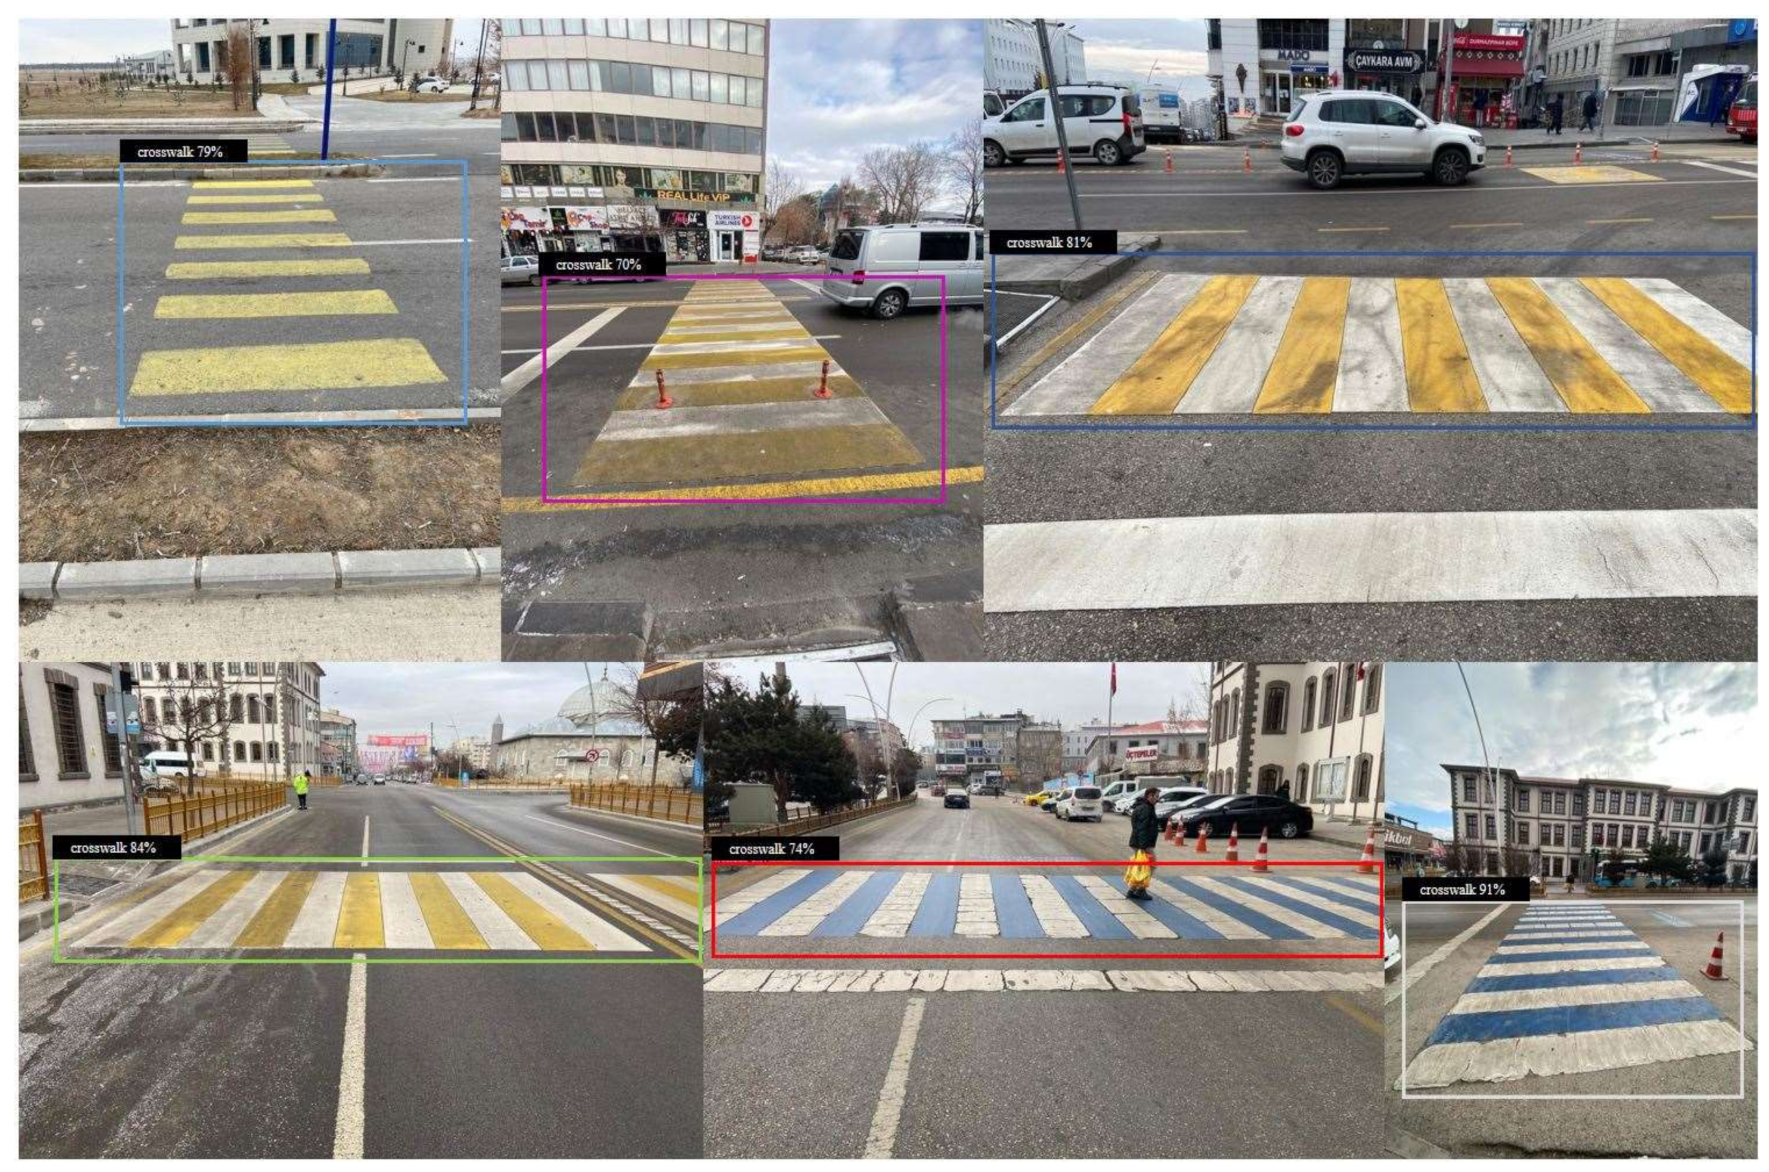
F1, precision, recall, and accuracy values were calculated, which are the essential criteria for measuring the current models’ accuracy. These values show the working performance of object detection models. The Faster R-CNN network model was run with different backbone networks. These backbone models are X101-FPN and R101-FPN, respectively. A Faster R-CNN model reaches these backbone networks’ best speed and accuracy. The results obtained are presented in Figure 5. The model results of the dataset reserved for the testing process are given in Figure 6. The results show that both backbone networks provide the same results for our dataset. Therefore, individual output results are not presented. In this study, it is understood that individual outputs do not have superiority over each other. The same performance between the backbone models depends on many reasons. However, the most important reason is that the number of data points is not large. As can be seen, the detection processes of pedestrian crosswalks have been carried out with very high accuracy. Better detection results can be obtained if the dataset allocated for training is increased. To summarize, the detection performances of the same test data submitted to the two network architectures are 100 percent similar, so they are not included in the article separately. The analysis also gave exactly the same results on accuracy, total loss, and learning rate curves. The two backbone networks are already the most successful networks and have close detection performances. The fact that the number of data points and the number of classes (one-pedestrian crosswalk) are low, caused the results to be the same. The confidence value given for the test was determined as 0.6. In other words, boxes with an accuracy rate of 60% or more are displayed on the screen. The detection accuracy of the Faster R-CNN network model was observed as 98%. This value is quite high and shows that the model performance is high. Another parameter that supports the model accuracy rate is that the model total error loss is very low.
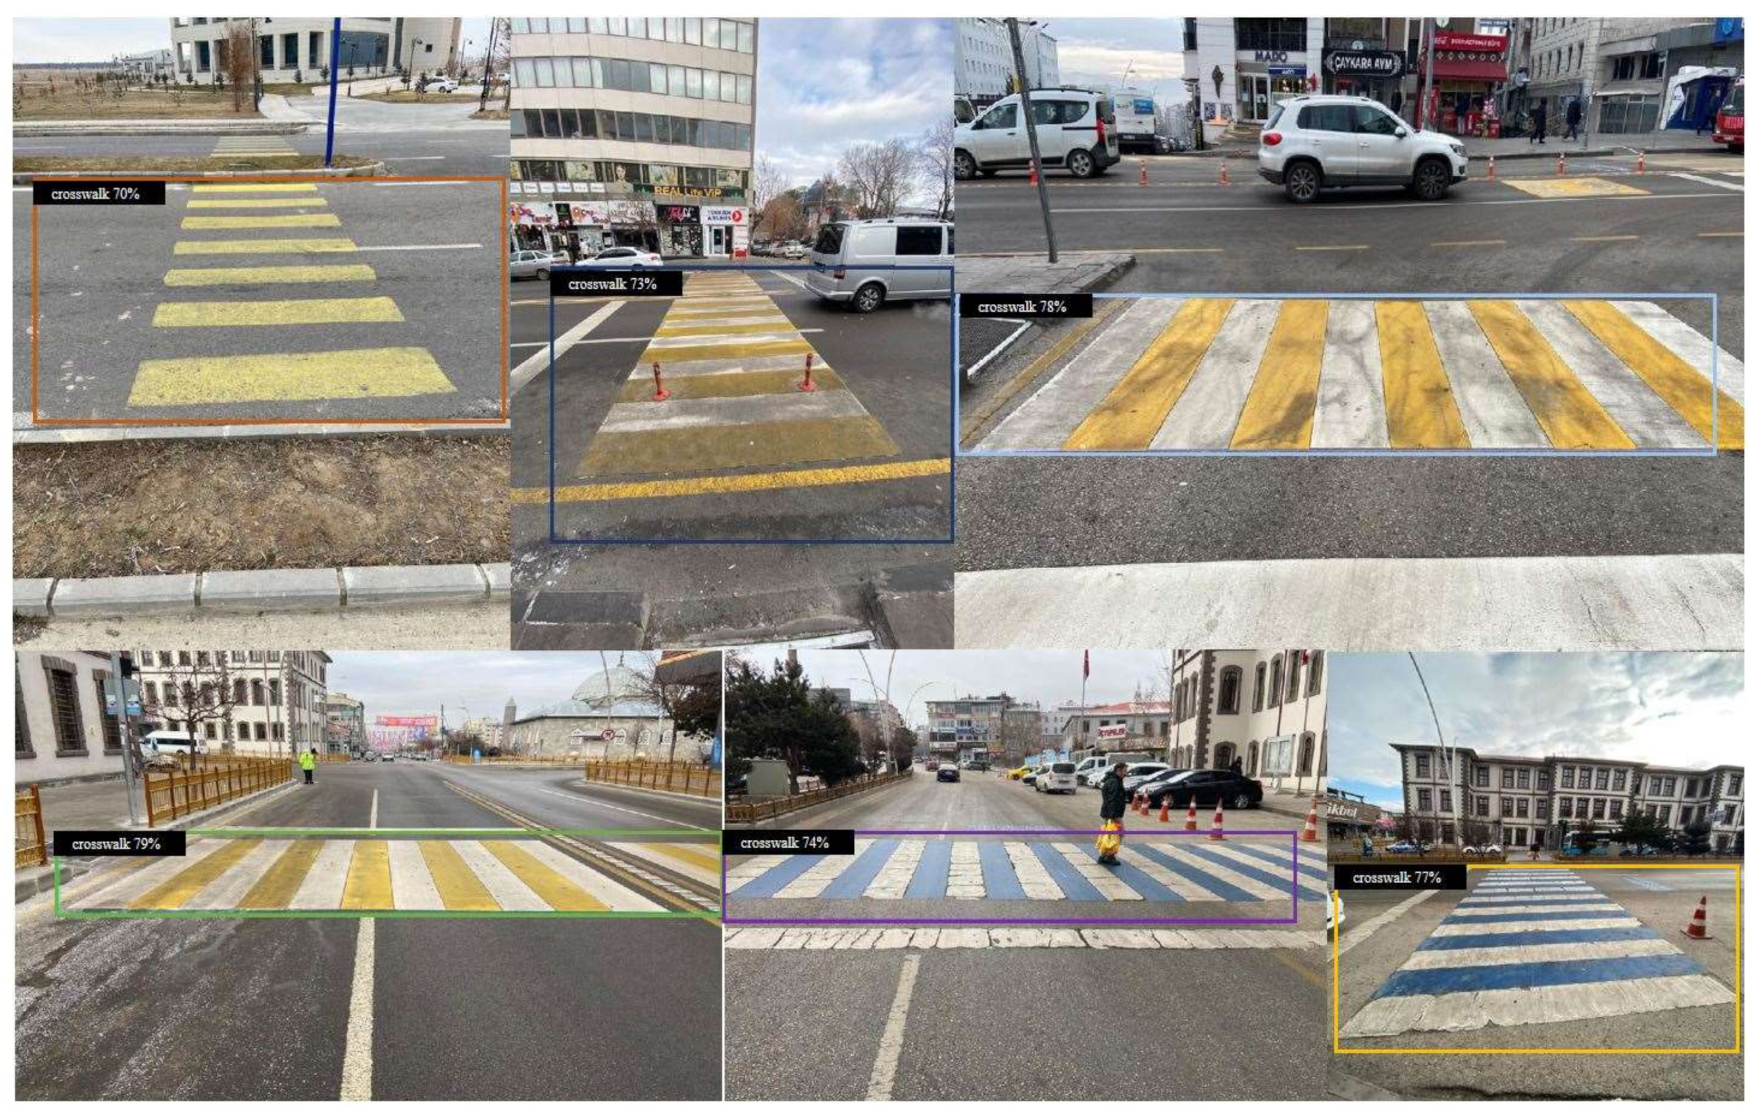
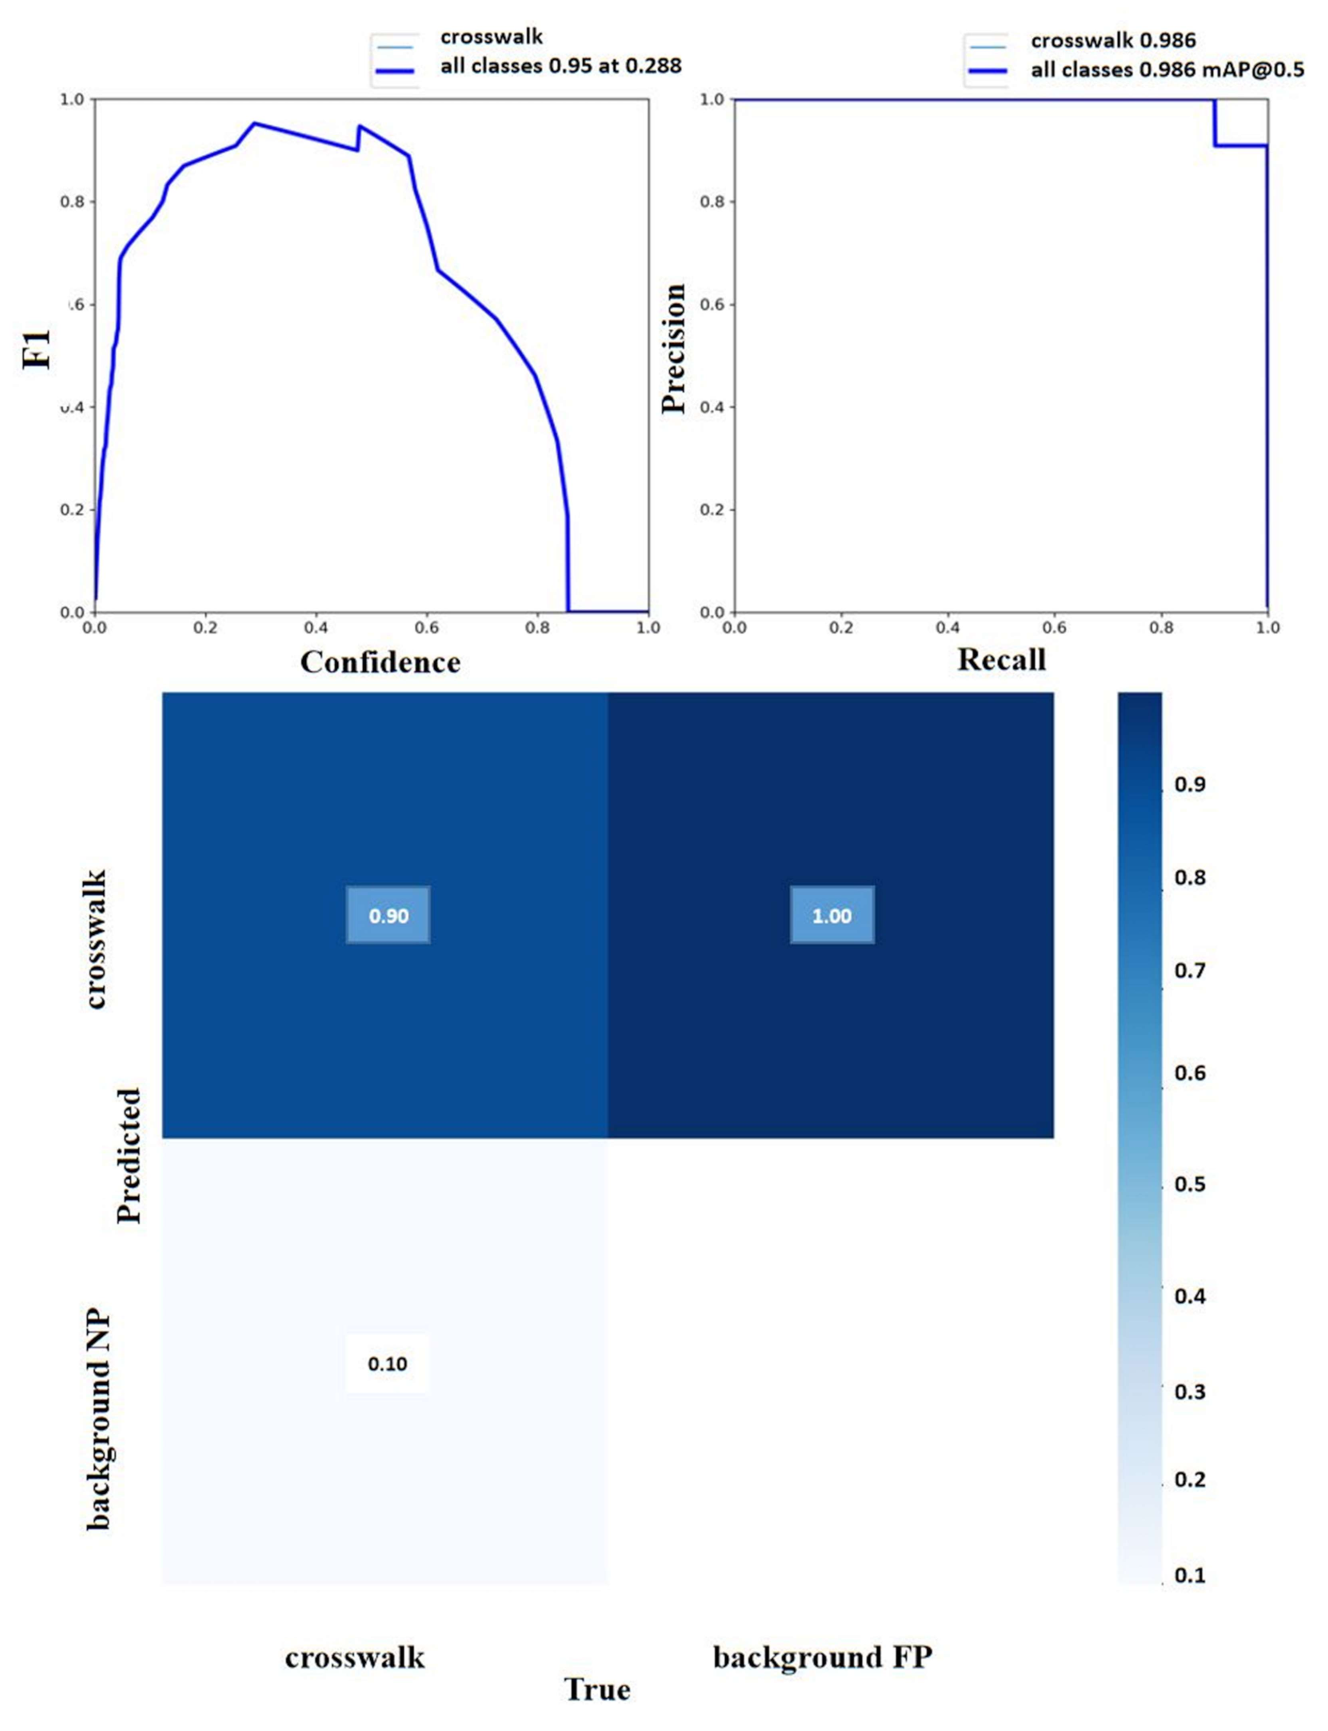
Figure 7 shows the recall, precision, PR curve, F1-score values, and confusion matrix obtained from the detection processes carried out using the YOLOv7 model. The PR curve for the precision–recall curve at the GIoU threshold from 0.5 to 0.95 is displayed in the figure. It is evident from the results that the model performance is well above the acceptable level. The overall performance of the model is observed to be excellent, with the mAP value reaching 98.6% at the GIoU threshold of 0.5. The F1-score value is 0.95, which is significantly higher than the acceptable threshold of 0.5. The precision and recall values are also high, at 90% and 100%, respectively. When these values approach one, it indicates that the model is correct. It is evident that the model works in harmony with the dataset. The detection results of some images in the validation dataset can be found in Figure 8. Figure 6 and Figure 8 illustrate the pedestrian-crosswalk detection outputs of the two distinct models. The same test inputs were employed to provide a clear comparison of the models’ performances. Based on the six sample inputs provided, it can be concluded that the YOLOv7 model outperforms the Faster R-CNN model significantly. The YOLOv7 model even outperforms the Faster R-CNN model in one of the sample inputs. It is important to note that YOLOv7 being a single-stage detector with superior performance will be advantageous for the warning system. Consequently, between the two models, YOLOv7 demonstrates better performance than Faster R-CNN.

6. Conclusions

This study examined pedestrian crosswalks as one of the hot points where pedestrian–vehicle conflict arises in urban traffic, as well as one of the critical regions in traffic safety in the process of autonomization. Faster R-CNN and YOLOv7 algorithms were used for the automatic detection of pedestrian crosswalks. A key point in this study is that the detection process was carried out according to the perspectives of both vehicles and pedestrian–disabled individuals–micro-mobility vehicle drivers because autonomy in the traffic network should be mutual.
The analytical results showed that the proposed models performed above the acceptable level. While Faster R-CNN detected with 98% accuracy, YOLOv7 had the same detection accuracy. It was observed that the YOLOv7 model gave better results in the outputs obtained from the comparison of the two models. It is predicted that the accuracy value can be increased by augmenting the presented dataset. The effectiveness of the study can be tested and increased by integrating an embedded system. The authors are already working on a warning system. Additionally, the authors can develop the existing dataset over time and reach different results with different detection models.
For future studies, a prototype is expected to be created and implemented for both vehicles and pedestrians with a system connecting them. The source codes of the experiments are available for sharing. The authors would be happy to share the dataset via the link: https://app.roboflow.com/ds/6IuQHz0kAu?key=cbJ2KU5lWc (accessed on 10 March 2023).

Author Contributions

Conceptualization, Ö.K., M.Y.Ç. and E.M.; methodology, Ö.K., M.Y.Ç. and E.M.; software, Ö.K.; validation, Ö.K., M.Y.Ç. and E.M.; formal analysis M.Y.Ç. and E.M.; investigation, Ö.K. and M.Y.Ç.; resources, Ö.K.; data curation, Ö.K.; writing—original draft preparation, Ö.K., M.Y.Ç. and E.M.; writing—review and editing, Ö.K., M.Y.Ç. and E.M.; visualization, Ö.K., M.Y.Ç. and E.M.; supervision, Ö.K. and M.Y.Ç.; project administration, Ö.K. and M.Y.Ç.; funding acquisition, M.Y.Ç. and E.M. All authors have read and agreed to the published version of the manuscript.

Funding

This research received no external funding.

Data Availability Statement

The data presented in this study are available from the corresponding author upon request.

Acknowledgments

We are grateful to all developers for their open-source codes.

Conflicts of Interest

The authors declare no conflict of interest.

References

  1. Adanu, E.K.; Jones, S. Effects of Human-Centered Factors on Crash Injury Severities. J. Adv. Transp. 2017, 2017, 1208170. [Google Scholar] [CrossRef]
  2. World Health Organization (WHO). Global Status Report on Road Safety; World Health Organization (WHO): Geneva, Switzerland, 2018. [Google Scholar]
  3. 2019 Pedestrian Priority Traffic Year and Traffic Week. Available online: https://www.icisleri.gov.tr/illeridaresi/2019-yaya-oncelikli-trafik-yili-ve-trafik-haftasi (accessed on 2 December 2020).
  4. Russell, B.C.; Torralba, A.; Murphy, K.P.; Freeman, W.T. LabelMe: A Database and Web-Based Tool for Image Annotation. Available online: http://labelme2.csail.mit.edu/Release3.0/index.php (accessed on 10 January 2023).
  5. Roboflow Give Your Software the Sense of Sight. Available online: https://roboflow.com/ (accessed on 6 October 2022).
  6. Wang, C.; Bochkovskiy, A.; Liao, H.M. YOLOv7: Trainable bag-of-freebies sets new state-of-the-art for real-time object detectors. Comput. Vis. Pattern Recognit. 2022, 1–15. [Google Scholar] [CrossRef]
  7. Ren, S.; He, K.; Girshick, R.; Sun, J. Faster R-CNN: Towards Real-Time Object Detection with Region Proposal Networks. IEEE Trans. Pattern Anal. Mach. Intell. 2017, 39, 1137–1149. [Google Scholar] [CrossRef] [PubMed]
  8. Zaidi, S.S.A.; Ansari, M.S.; Aslam, A.; Kanwal, N.; Asghar, M.; Lee, B. A survey of modern deep learning based object detection models. Digit. Signal Process. A Rev. J. 2022, 126, 103514. [Google Scholar] [CrossRef]
  9. Se, S. Zebra-crossing Detection for the Partially Sighted. In Proceedings of the IEEE Conference on Computer Vision and Pattern Recognition. CVPR 2000 (Cat. No.PR00662), Hilton Head, SC, USA, 15 June 2000; IEEE: Piscataway Township, NJ, USA, 2002. [Google Scholar] [CrossRef]
  10. Xin, H.; Qian, L. An Improved Method of Zebra Crossing Detection based on Bipolarity. Sci.-Eng. 2018, 34, 202–205. [Google Scholar]
  11. Uddin, M.S.; Shioyama, T. Bipolarity and Projective Invariant-Based Zebra-Crossing Detection for the Visually Impaired. In Proceedings of the 2005 IEEE Computer Society Conference on Computer Vision and Pattern Recognition (CVPR’05)-Workshops, San Diego, CA, USA, 20–26 June 2005; IEEE: San Diego, CA, USA, 2005. [Google Scholar]
  12. Cheng, R.; Wang, K.; Yang, K.; Long, N.; Hu, W.; Chen, H.; Bai, J.; Liu, D. Crosswalk navigation for people with visual impairments on a wearable device. J. Electron. Imaging 2017, 26, 053025. [Google Scholar] [CrossRef]
  13. Chen, N.; Hong, F.; Bai, B. Zebra crossing recognition method based on edge feature and Hough transform. J. Zhejiang Univ. Sci. Technol. 2019, 6, 476–483. [Google Scholar]
  14. Cao, Z.; Xu, X.; Hu, B.; Zhou, M. Rapid Detection of Blind Roads and Crosswalks by Using a Lightweight Semantic Segmentation Network. IEEE Trans. Intell. Transp. Syst. 2021, 22, 6188–6197. [Google Scholar] [CrossRef]
  15. Ma, Y.; Gu, X.; Zhang, W.; Hu, S.; Liu, H.; Zhao, J.; Chen, S. Evaluating the effectiveness of crosswalk tactile paving on street-crossing behavior: A field trial study for people with visual impairment. Accid. Anal. Prev. 2021, 163, 106420. [Google Scholar] [CrossRef]
  16. Romić, K.; Galić, I.; Leventić, H.; Habijan, M. Pedestrian Crosswalk Detection Using a Column and Row Structure Analysis in Assistance Systems for the Visually Impaired. Acta Polytech. Hung. 2021, 18, 25–45. [Google Scholar] [CrossRef]
  17. Tian, S.; Zheng, M.; Zou, W.; Li, X.; Zhang, L. Dynamic Crosswalk Scene Understanding for the Visually Impaired. IEEE Trans. Neural Syst. Rehabil. Eng. 2021, 29, 1478–1486. [Google Scholar] [CrossRef] [PubMed]
  18. Tümen, V.; Ergen, B. Intersections and crosswalk detection using deep learning and image processing techniques. Phys. A Stat. Mech. Its Appl. 2020, 543, 123510. [Google Scholar] [CrossRef]
  19. Dow, C.; Lee, L.; Huy, N.H.; Wang, K. A Human Recognition System for Pedestrian Crosswalk. Commun. Comput. Inf. Sci. 2018, 852, 443–447. [Google Scholar] [CrossRef]
  20. Alemdar, K.D.; Kaya, Ö.; Çodur, M.Y. A GIS and microsimulation-based MCDA approach for evaluation of pedestrian crossings. Accid. Anal. Prev. 2020, 148, 105771. [Google Scholar] [CrossRef] [PubMed]
  21. Karaman, A.; Karaboga, D.; Pacal, I.; Akay, B.; Basturk, A.; Nalbantoglu, U.; Coskun, S.; Sahin, O. Hyper-parameter optimization of deep learning architectures using artificial bee colony (ABC) algorithm for high performance real-time automatic colorectal cancer (CRC) polyp detection. Appl. Intell. 2022, 1–18. [Google Scholar] [CrossRef]
  22. Yung, N.D.T.; Wong, W.K.; Juwono, F.H.; Sim, Z.A. Safety Helmet Detection Using Deep Learning: Implementation and Comparative Study Using YOLOv5, YOLOv6, and YOLOv7. In Proceedings of the International Conference on Green Energy, Computing and Sustainable Technology (GECOST), Miri Sarawak, Malaysia, 26–28 October 2022. [Google Scholar] [CrossRef]
  23. Van Der Horst, B.B.; Lindenbergh, R.C.; Puister, S.W.J. Mobile laser scan data for road surface damage detection. Int. Arch. Photogramm. Remote Sens. Spat. Inf. Sci.-ISPRS Arch. 2019, 42, 1141–1148. [Google Scholar] [CrossRef]
  24. Pandey, A.K.; Palade, V.; Iqbal, R.; Maniak, T.; Karyotis, C.; Akuma, S. Convolution neural networks for pothole detection of critical road infrastructure. Comput. Electr. Eng. 2022, 99, 107725. [Google Scholar] [CrossRef]
  25. Dang, F.; Chen, D.; Lu, Y.; Li, Z. YOLOWeeds: A novel benchmark of YOLO object detectors for multi-class weed detection in cotton production systems. Comput. Electron. Agric. 2023, 205, 107655. [Google Scholar] [CrossRef]
  26. Wu, D.; Jiang, S.; Zhao, E.; Liu, Y.; Zhu, H.; Wang, W.; Wang, R. Detection of Camellia oleifera Fruit in Complex Scenes by Using YOLOv7 and Data Augmentation. Appl. Sci. 2022, 12, 11318. [Google Scholar] [CrossRef]
  27. Zenebe, Y.A.; Xiaoyu, L.; Chao, W.; Yi, W.; Endris, H.A.; Fanose, M.N. Towards Automatic 2D Materials Detection Using YOLOv7. In Proceedings of the 19th International Computer Conference on Wavelet Active Media Technology and Information Processing (ICCWAMTIP), Chengdu, China, 16 December 2022. [Google Scholar] [CrossRef]
  28. Kamboj, A.; Powar, N. Safety Helmet Detection in Industrial Environment using Deep Learning. The 9th International Conference on Information Technology Convergence and Services (ITCSE 2020), Zurich, Switzerland, 21–22 November 2020; pp. 197–208. [Google Scholar] [CrossRef]
  29. Huang, L.; Fu, Q.; He, M.; Jiang, D.; Hao, Z. Detection algorithm of safety helmet wearing based on deep learning. Concurr. Comput. Pract. Exp. 2021, 33, 1–14. [Google Scholar] [CrossRef]
  30. Li, Y.; Wei, H.; Han, Z.; Huang, J.; Wang, W. Deep Learning-Based Safety Helmet Detection in Engineering Management Based on Convolutional Neural Networks. Adv. Civ. Eng. 2020, 2020, 9703560. [Google Scholar] [CrossRef]
  31. Long, X.; Cui, W.; Zheng, Z. Safety helmet wearing detection based on deep learning. In Proceedings of the 2019 IEEE 3rd Information Technology Networking, Electronic and Automation Control Conference, ITNEC 2019, Chengdu, China, 15–17 March 2019; pp. 2495–2499. [Google Scholar] [CrossRef]
  32. Chen, K.; Yan, G.; Zhang, M.; Xiao, Z.; Wang, Q. Safety Helmet Detection Based on YOLOv7. ACM Int. Conf. Proceeding Ser. 2022, 31, 6–11. [Google Scholar] [CrossRef]
  33. Jiang, K.; Xie, T.; Yan, R.; Wen, X.; Li, D.; Jiang, H.; Jiang, N.; Feng, L.; Duan, X.; Wang, J. An Attention Mechanism-Improved YOLOv7 Object Detection Algorithm for Hemp Duck Count Estimation. Agriculture 2022, 12, 1659. [Google Scholar] [CrossRef]
  34. Liu, S.; Wang, Y.; Yu, Q.; Liu, H.; Peng, Z. CEAM-YOLOv7: Improved YOLOv7 Based on Channel Expansion and Attention Mechanism for Driver Distraction Behavior Detection. IEEE Access 2022, 10, 129116–129124. [Google Scholar] [CrossRef]
  35. Al-Smadi, Y.; Alauthman, M.; Al-Qerem, A.; Aldweesh, A.; Quaddoura, R.; Aburub, F.; Mansour, K.; Alhmiedat, T. Early Wildfire Smoke Detection Using Different YOLO Models. Machines 2023, 11, 246. [Google Scholar] [CrossRef]
  36. Ghourabi, M.; Mourad-Chehade, F.; Chkeir, A. Eye Recognition by YOLO for Inner Canthus Temperature Detection in the Elderly Using a Transfer Learning Approach. Sensors 2023, 23, 1851. [Google Scholar] [CrossRef]
  37. Zhou, Q.; Liu, H.; Qiu, Y.; Zheng, W. Object Detection for Construction Waste Based on an Improved YOLOv5 Model. Sustainability 2023, 15, 681. [Google Scholar] [CrossRef]
  38. Wang, Y.; Fu, B.; Fu, L.; Xia, C. In Situ Sea Cucumber Detection across Multiple Underwater Scenes Based on Convolutional Neural Networks and Image Enhancements. Sensors 2023, 23, 2037. [Google Scholar] [CrossRef]
  39. Patel, K.; Bhatt, C.; Mazzeo, P.L. Improved Ship Detection Algorithm from Satellite Images Using YOLOv7 and Graph Neural Network. Algorithms 2022, 15, 473. [Google Scholar] [CrossRef]
  40. Chen, J.; Liu, H.; Zhang, Y.; Zhang, D.; Ouyang, H.; Chen, X. A Multiscale Lightweight and Efficient Model Based on YOLOv7: Applied to Citrus Orchard. Plants 2022, 11, 3260. [Google Scholar] [CrossRef]
  41. Common Object in Context. Available online: https://cocodataset.org/#overview (accessed on 30 January 2022).
  42. Girshick, R. Fast R-CNN. In Proceedings of the IEEE International Conference on Computer Vision 2015, Santiago, Chile, 7–13 December 2015; pp. 1440–1448. [Google Scholar] [CrossRef]
  43. Hui, J. SSD Object Detection: Single Shot MultiBox Detector for Real-Time Processing. Available online: https://jonathan-hui.medium.com/ssd-object-detection-single-shot-multibox-detector-for-real-time-processing-9bd8deac0e06 (accessed on 4 January 2022).
  44. Global Road Damage Detection Challenge 2020. Available online: https://rdd2020.sekilab.global/ (accessed on 13 January 2022).
  45. Wu, Y.; Kirillov, A.; Massa, F.; Lo, W.-Y.; Girshick, R. Facebook AI Research-FAIR. Available online: https://paperswithcode.com/lib/detectron2 (accessed on 12 October 2022).
  46. Girshick, R.; Radosavovic, I.; Gkioxari, G.; He, K. Facebookresearch/Detectron2. Available online: https://github.com/facebookresearch/detectron2/blob/main/MODEL_ZOO.md (accessed on 10 November 2022).
  47. Lin, T.-Y.; Dollar, P.; Ross, G.; He, K.; Hariharan, B. Feature Pyramid Networks for Object Detection. Comput. Vis. Pattern Recognit. 2016, 2117–2125. [Google Scholar] [CrossRef]
  48. Sultana, F.; Sufian, A.; Dutta, P. A review of object detection models based on convolutional neural network. Comput. Vis. Pattern Recognit. 2019, 1157, 1–16. [Google Scholar] [CrossRef]
  49. Bai, T.; Yang, J.; Xu, G.; Yao, D. An optimized railway fastener detection method based on modified Faster R-CNN. Meas. J. Int. Meas. Confed. 2021, 182, 109742. [Google Scholar] [CrossRef]
  50. FAIR Meta AI. Available online: https://ai.facebook.com/tools/detectron2/ (accessed on 1 December 2022).
  51. Wang, C.; Bochkovskiy, A.; Liao, H.M. GitHub/WongKinYiu /yolov7. Available online: https://github.com/WongKinYiu/yolov7 (accessed on 10 August 2022).
  52. Arya, D.; Maeda, H.; Ghosh, S.K.; Toshniwal, D.; Mraz, A.; Kashiyama, T.; Sekimoto, Y. Transfer Learning-based Road Damage Detection for Multiple Countries. Comput. Vis. Pattern Recognit. 2020, 16. [Google Scholar] [CrossRef]
  53. Quintana, M.; Torres, J.; Menéndez, J.M. A Simplified Computer Vision System for Road Surface Inspection and Maintenance. IEEE Trans. Intell. Transp. Syst. 2016, 17, 608–619. [Google Scholar] [CrossRef]
  54. Arya, D.; Maeda, H.; Kumar Ghosh, S.; Toshniwal, D.; Omata, H.; Kashiyama, T.; Sekimoto, Y. Global Road Damage Detection: State-of-the-art Solutions. In Proceedings of the 2020 IEEE International Conference on Big Data (Big Data), Atlanta, GA, USA, 10–13 December 2020; pp. 5533–5539. [Google Scholar]
  55. Pham, V.; Pham, C.; Dang, T. Road Damage Detection and Classification with Detectron2 and Faster R-CNN. In Proceedings of the 2020 IEEE International Conference on Big Data (Big Data) 2020, Atlanta, GA, USA, 10–13 December 2020; pp. 5592–5601. [Google Scholar] [CrossRef]
Figure 1. The flowchart of the study.
Buildings 13 01070 g001
Figure 2. Illustration of the Faster R-CNN’s internal architecture [49].
Buildings 13 01070 g002
Figure 3. YOLOv7 network architecture [6].
Buildings 13 01070 g003
Figure 4. Sample images from the dataset: (a) collected data considering vehicle direction, and (b) collected data considering the pedestrian direction.
Buildings 13 01070 g004
Figure 5. Model result values of both backbone networks.
Buildings 13 01070 g005
Figure 6. Detected “Pedestrian Crosswalk” from the CRWALKval dataset using Faster R-CNN.
Buildings 13 01070 g006
Figure 7. F1 score, PR curve, and confusion matrix of YOLOv7 for the CRWALK dataset.
Buildings 13 01070 g007
Figure 8. Detected “Pedestrian Crosswalk” from the CRWALKval dataset using YOLOv7.
Buildings 13 01070 g008
Table 1. Faster R-CNN hyper-parameters.
ModelsBatch SizeLearning Rate (LR)Multiplicative Factor of LR Decay (Gamma)Period of LR Decay (Step Size)Number of IterationsWorkersNumber of Classes
X101-FPN80.0010.0550020021
R101-FPN
Table 2. Values of all hyper-parameters for YOLOv7.
ModelInitial Learning RateBatch SizeMomentumWeight DecayTotal Epochs
YOLOv70.0180.80.000530
Disclaimer/Publisher’s Note: The statements, opinions and data contained in all publications are solely those of the individual author(s) and contributor(s) and not of MDPI and/or the editor(s). MDPI and/or the editor(s) disclaim responsibility for any injury to people or property resulting from any ideas, methods, instructions or products referred to in the content.