

Predicting Seismic Collapse Safety of Post-Fire Steel Moment Frames

 ,
,  , ,
, , 
Abstract
1. Introduction
2. Materials and Methods
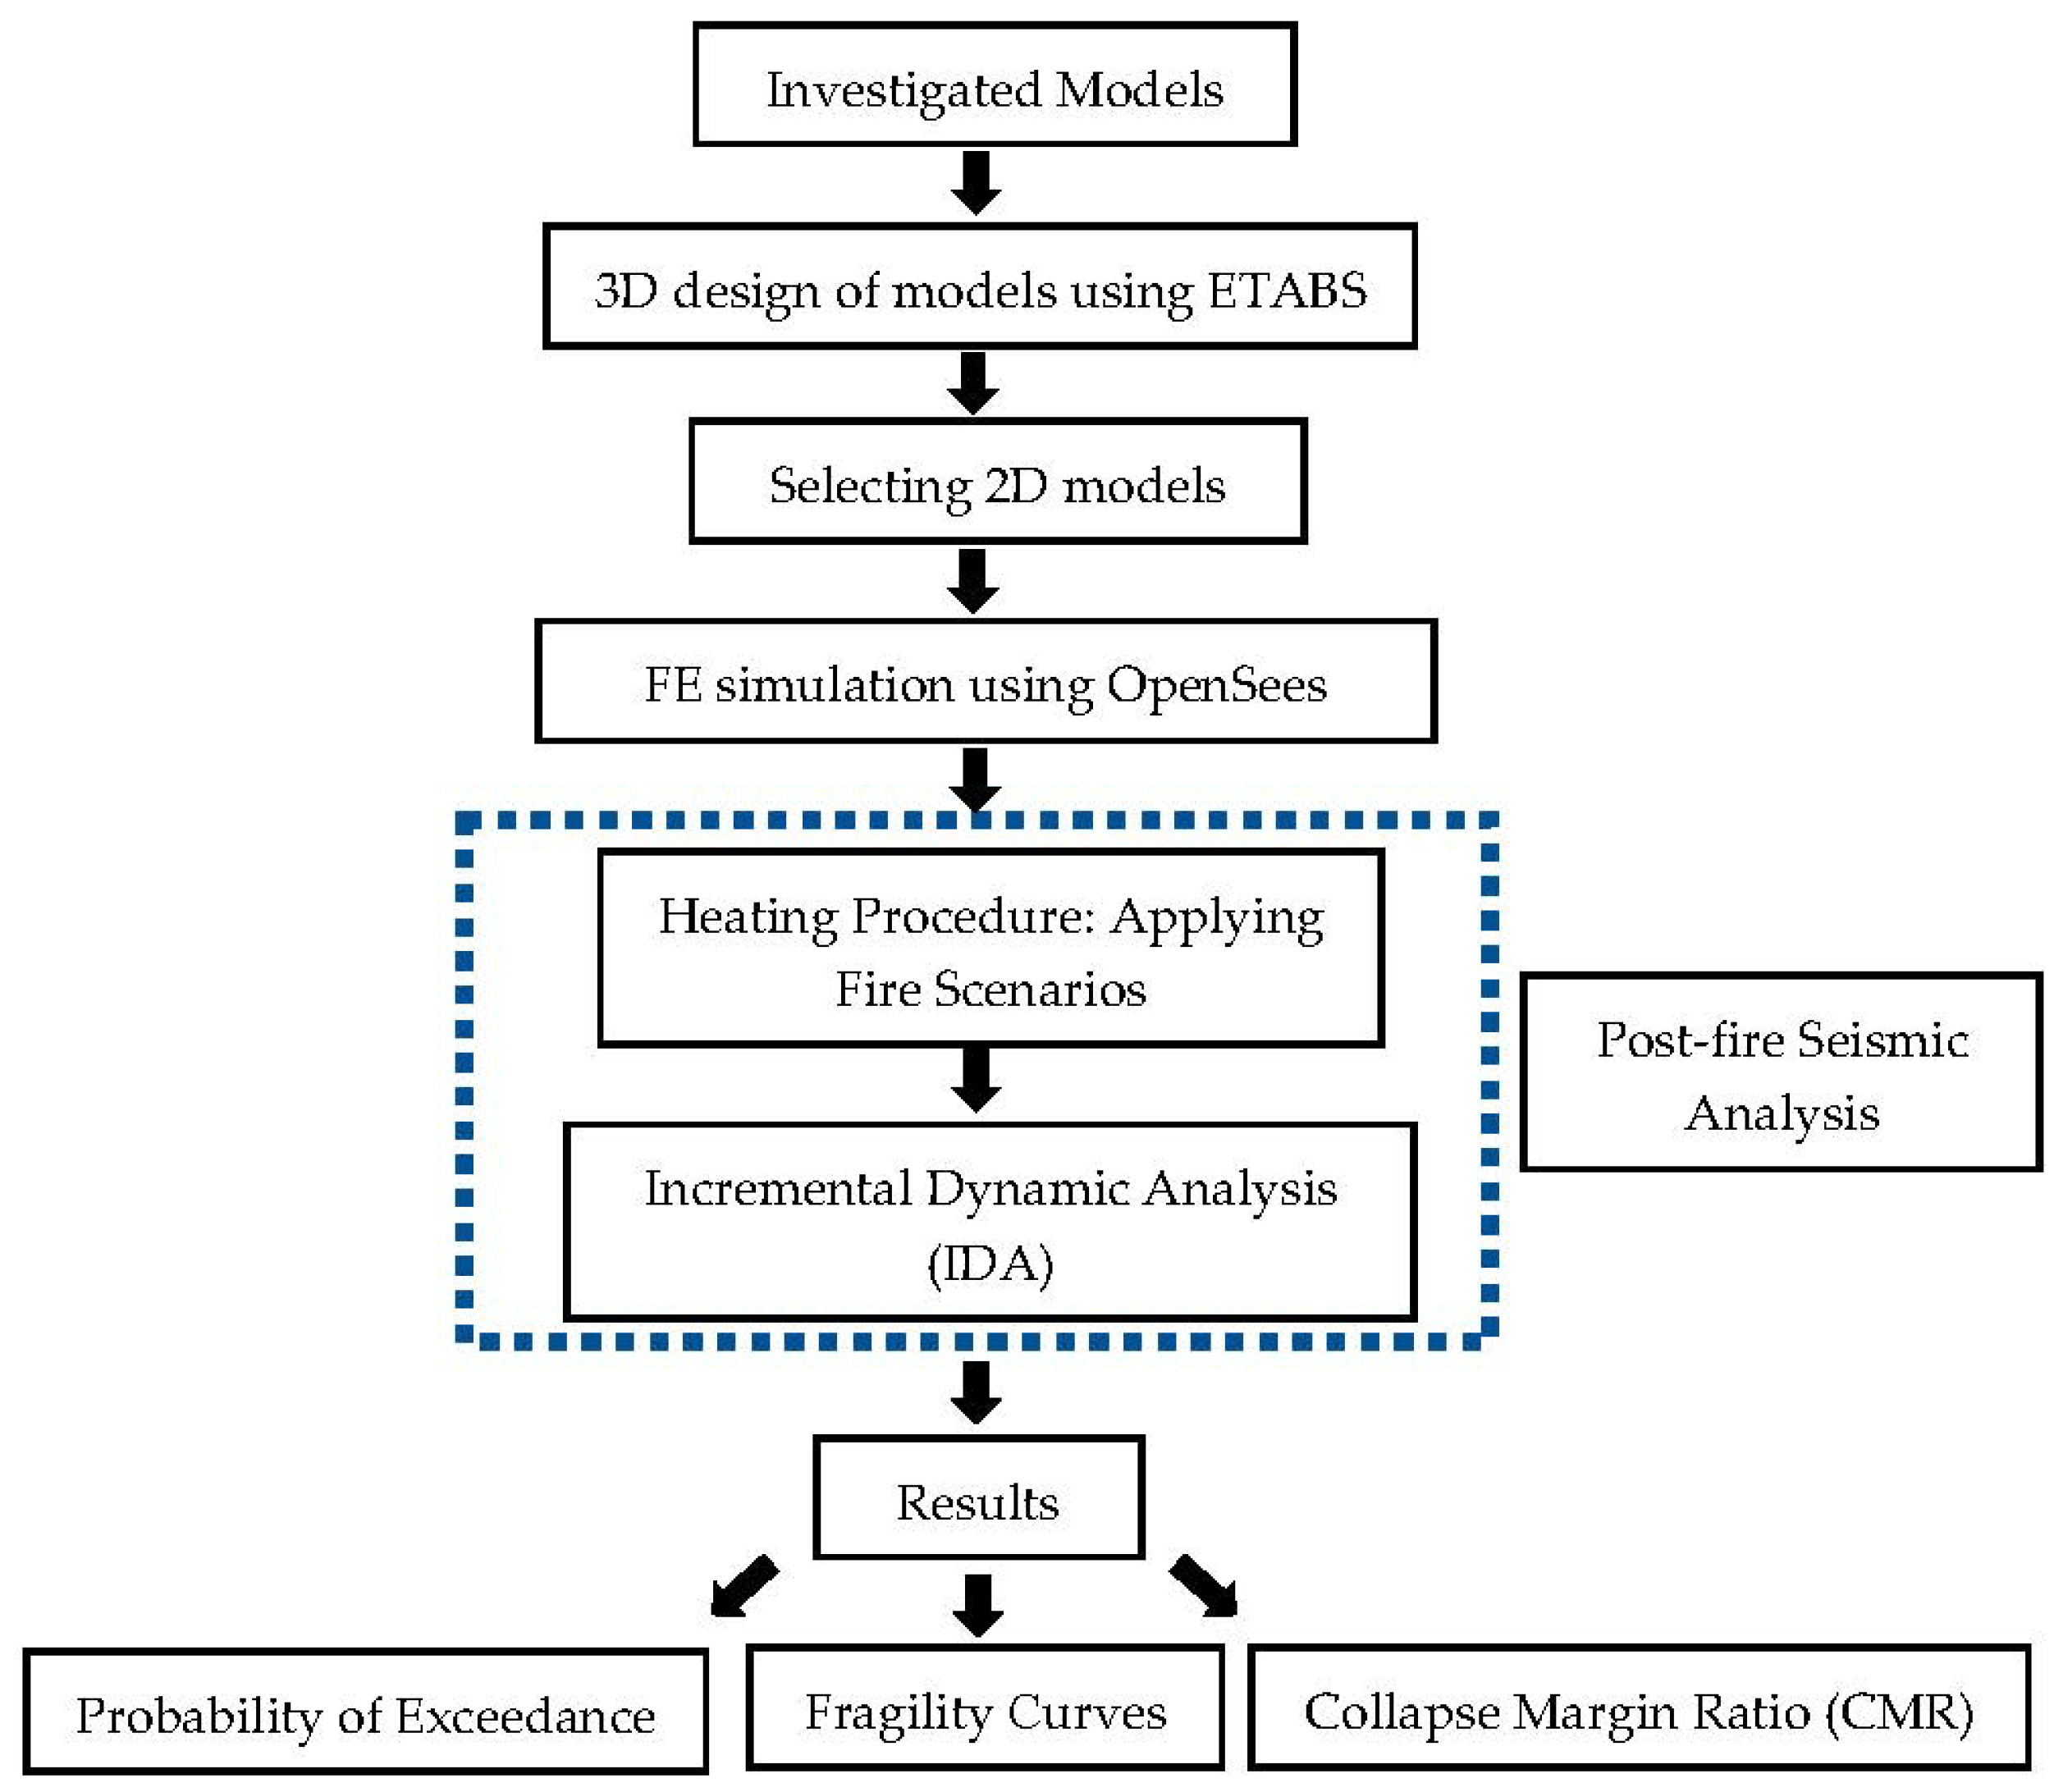
2.1. Assessment Procedure
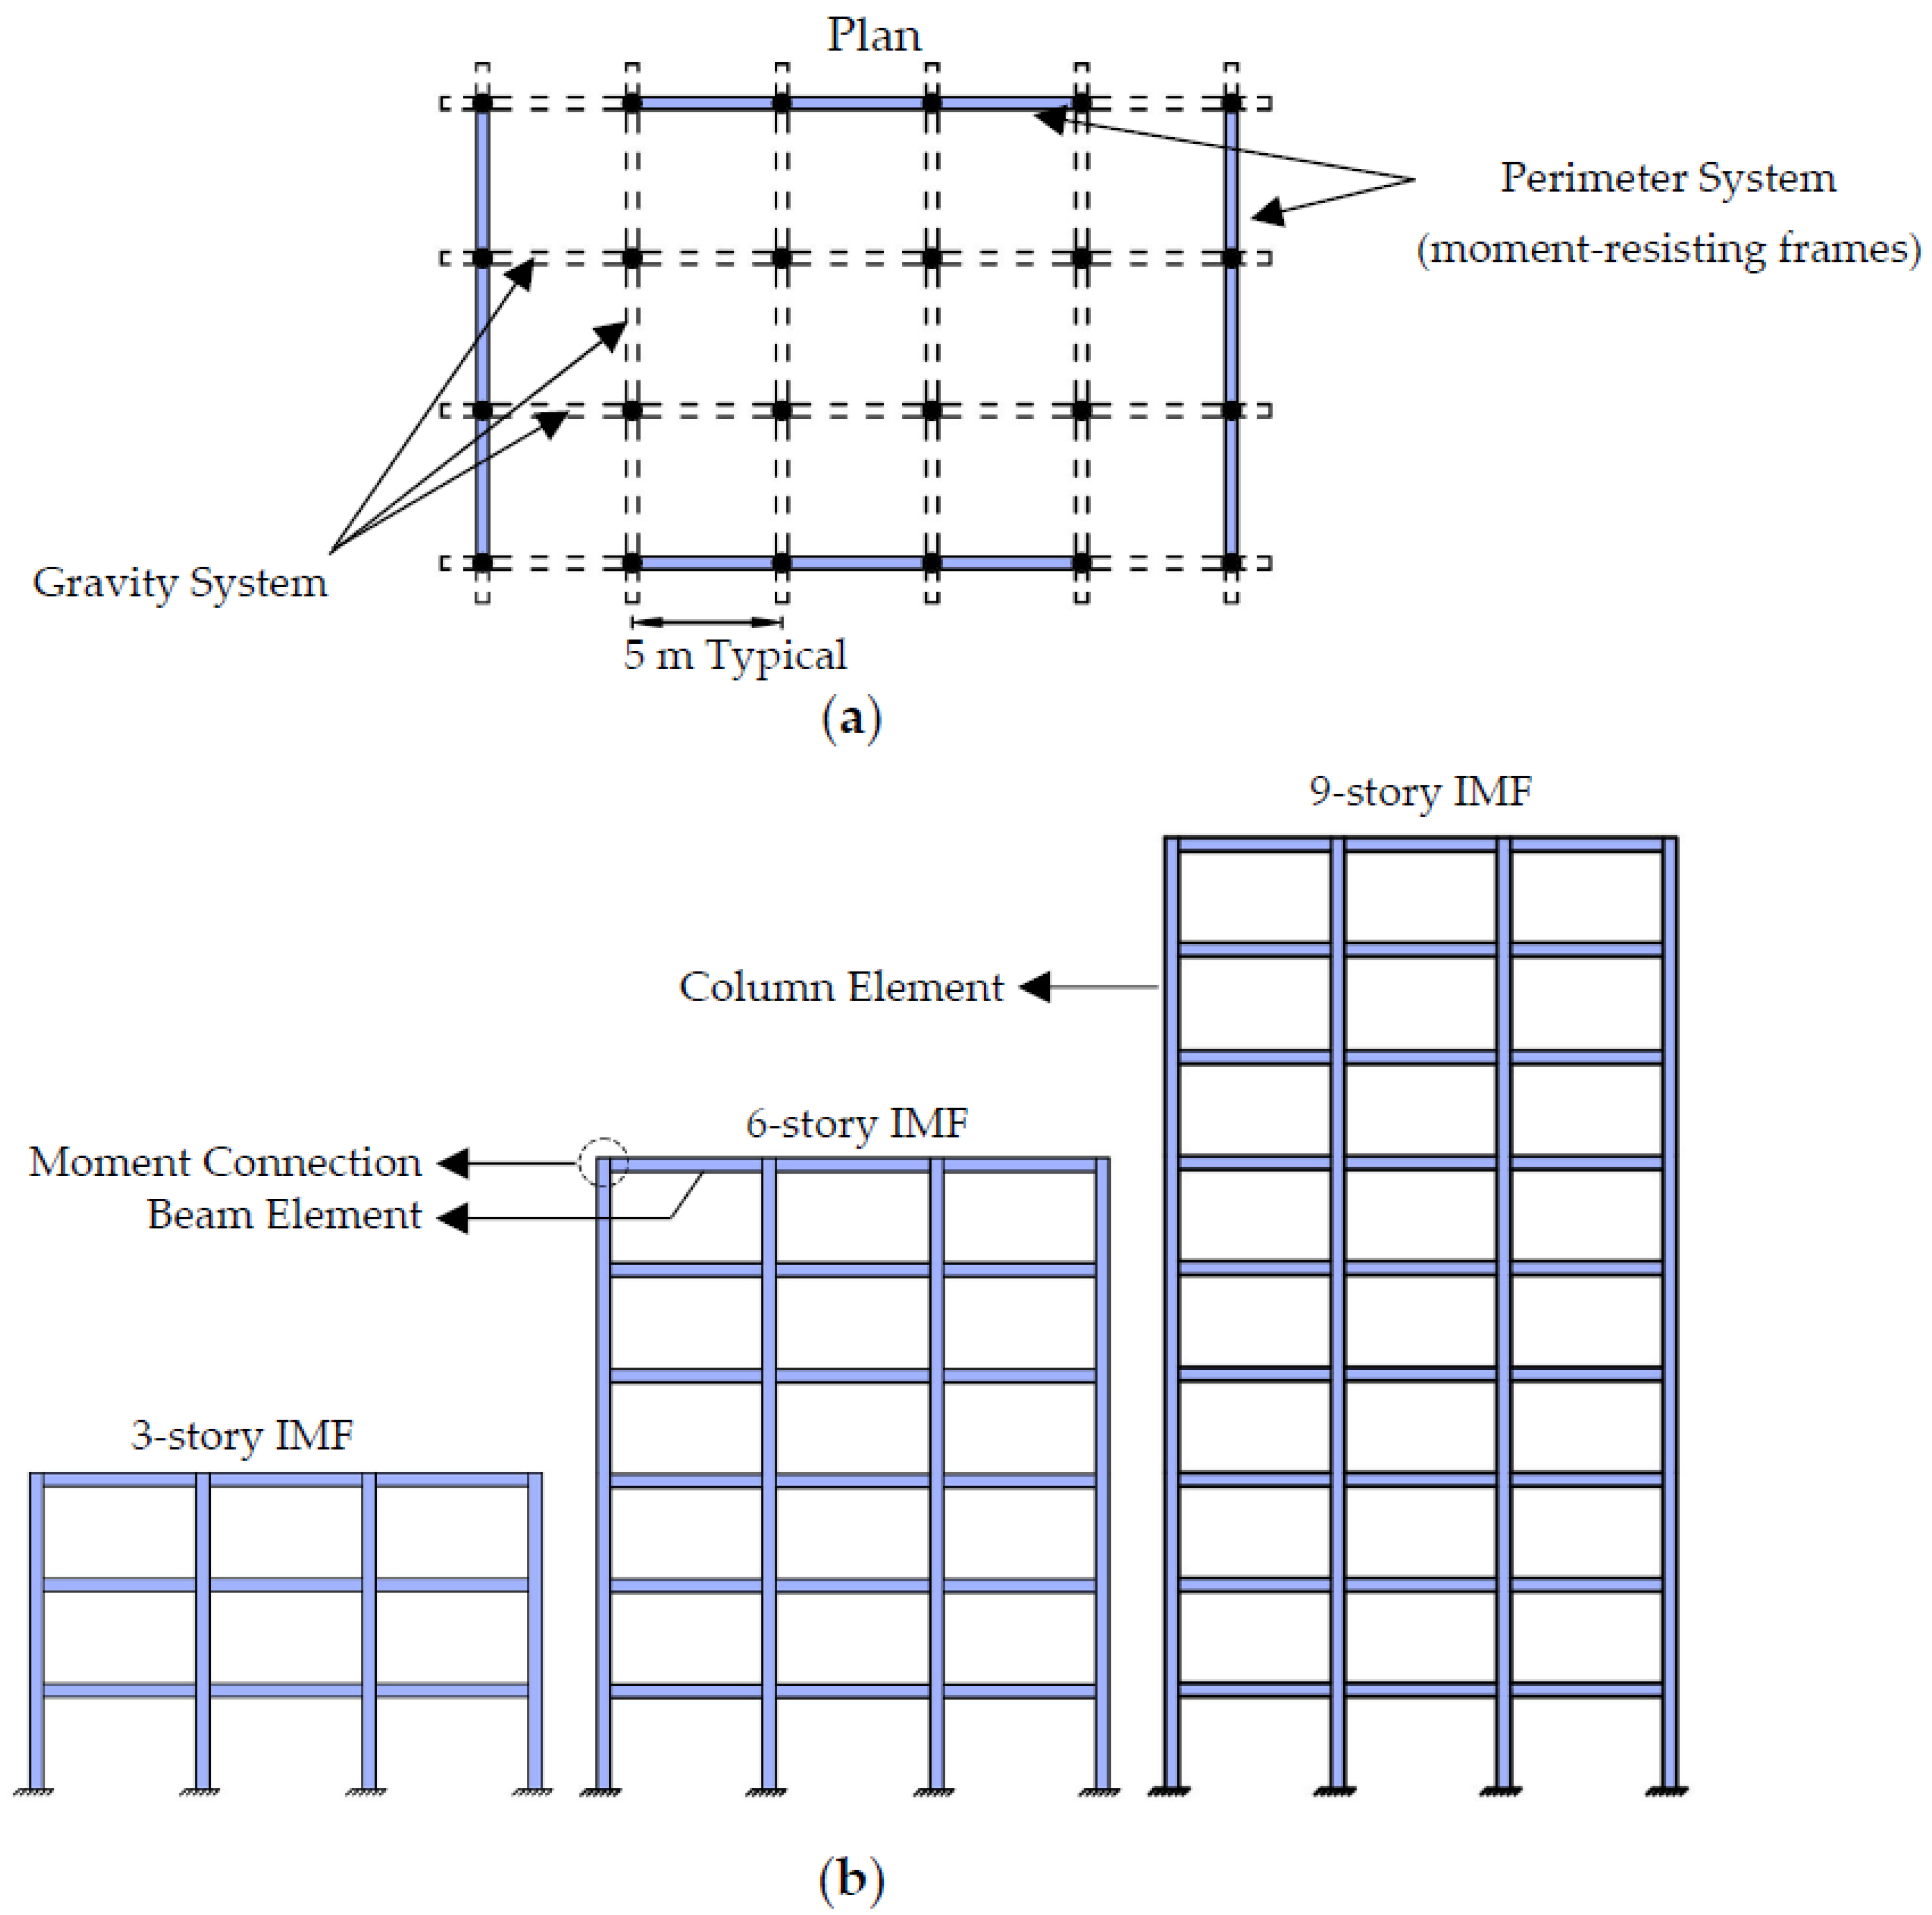
2.2. Specifications of Archetypes
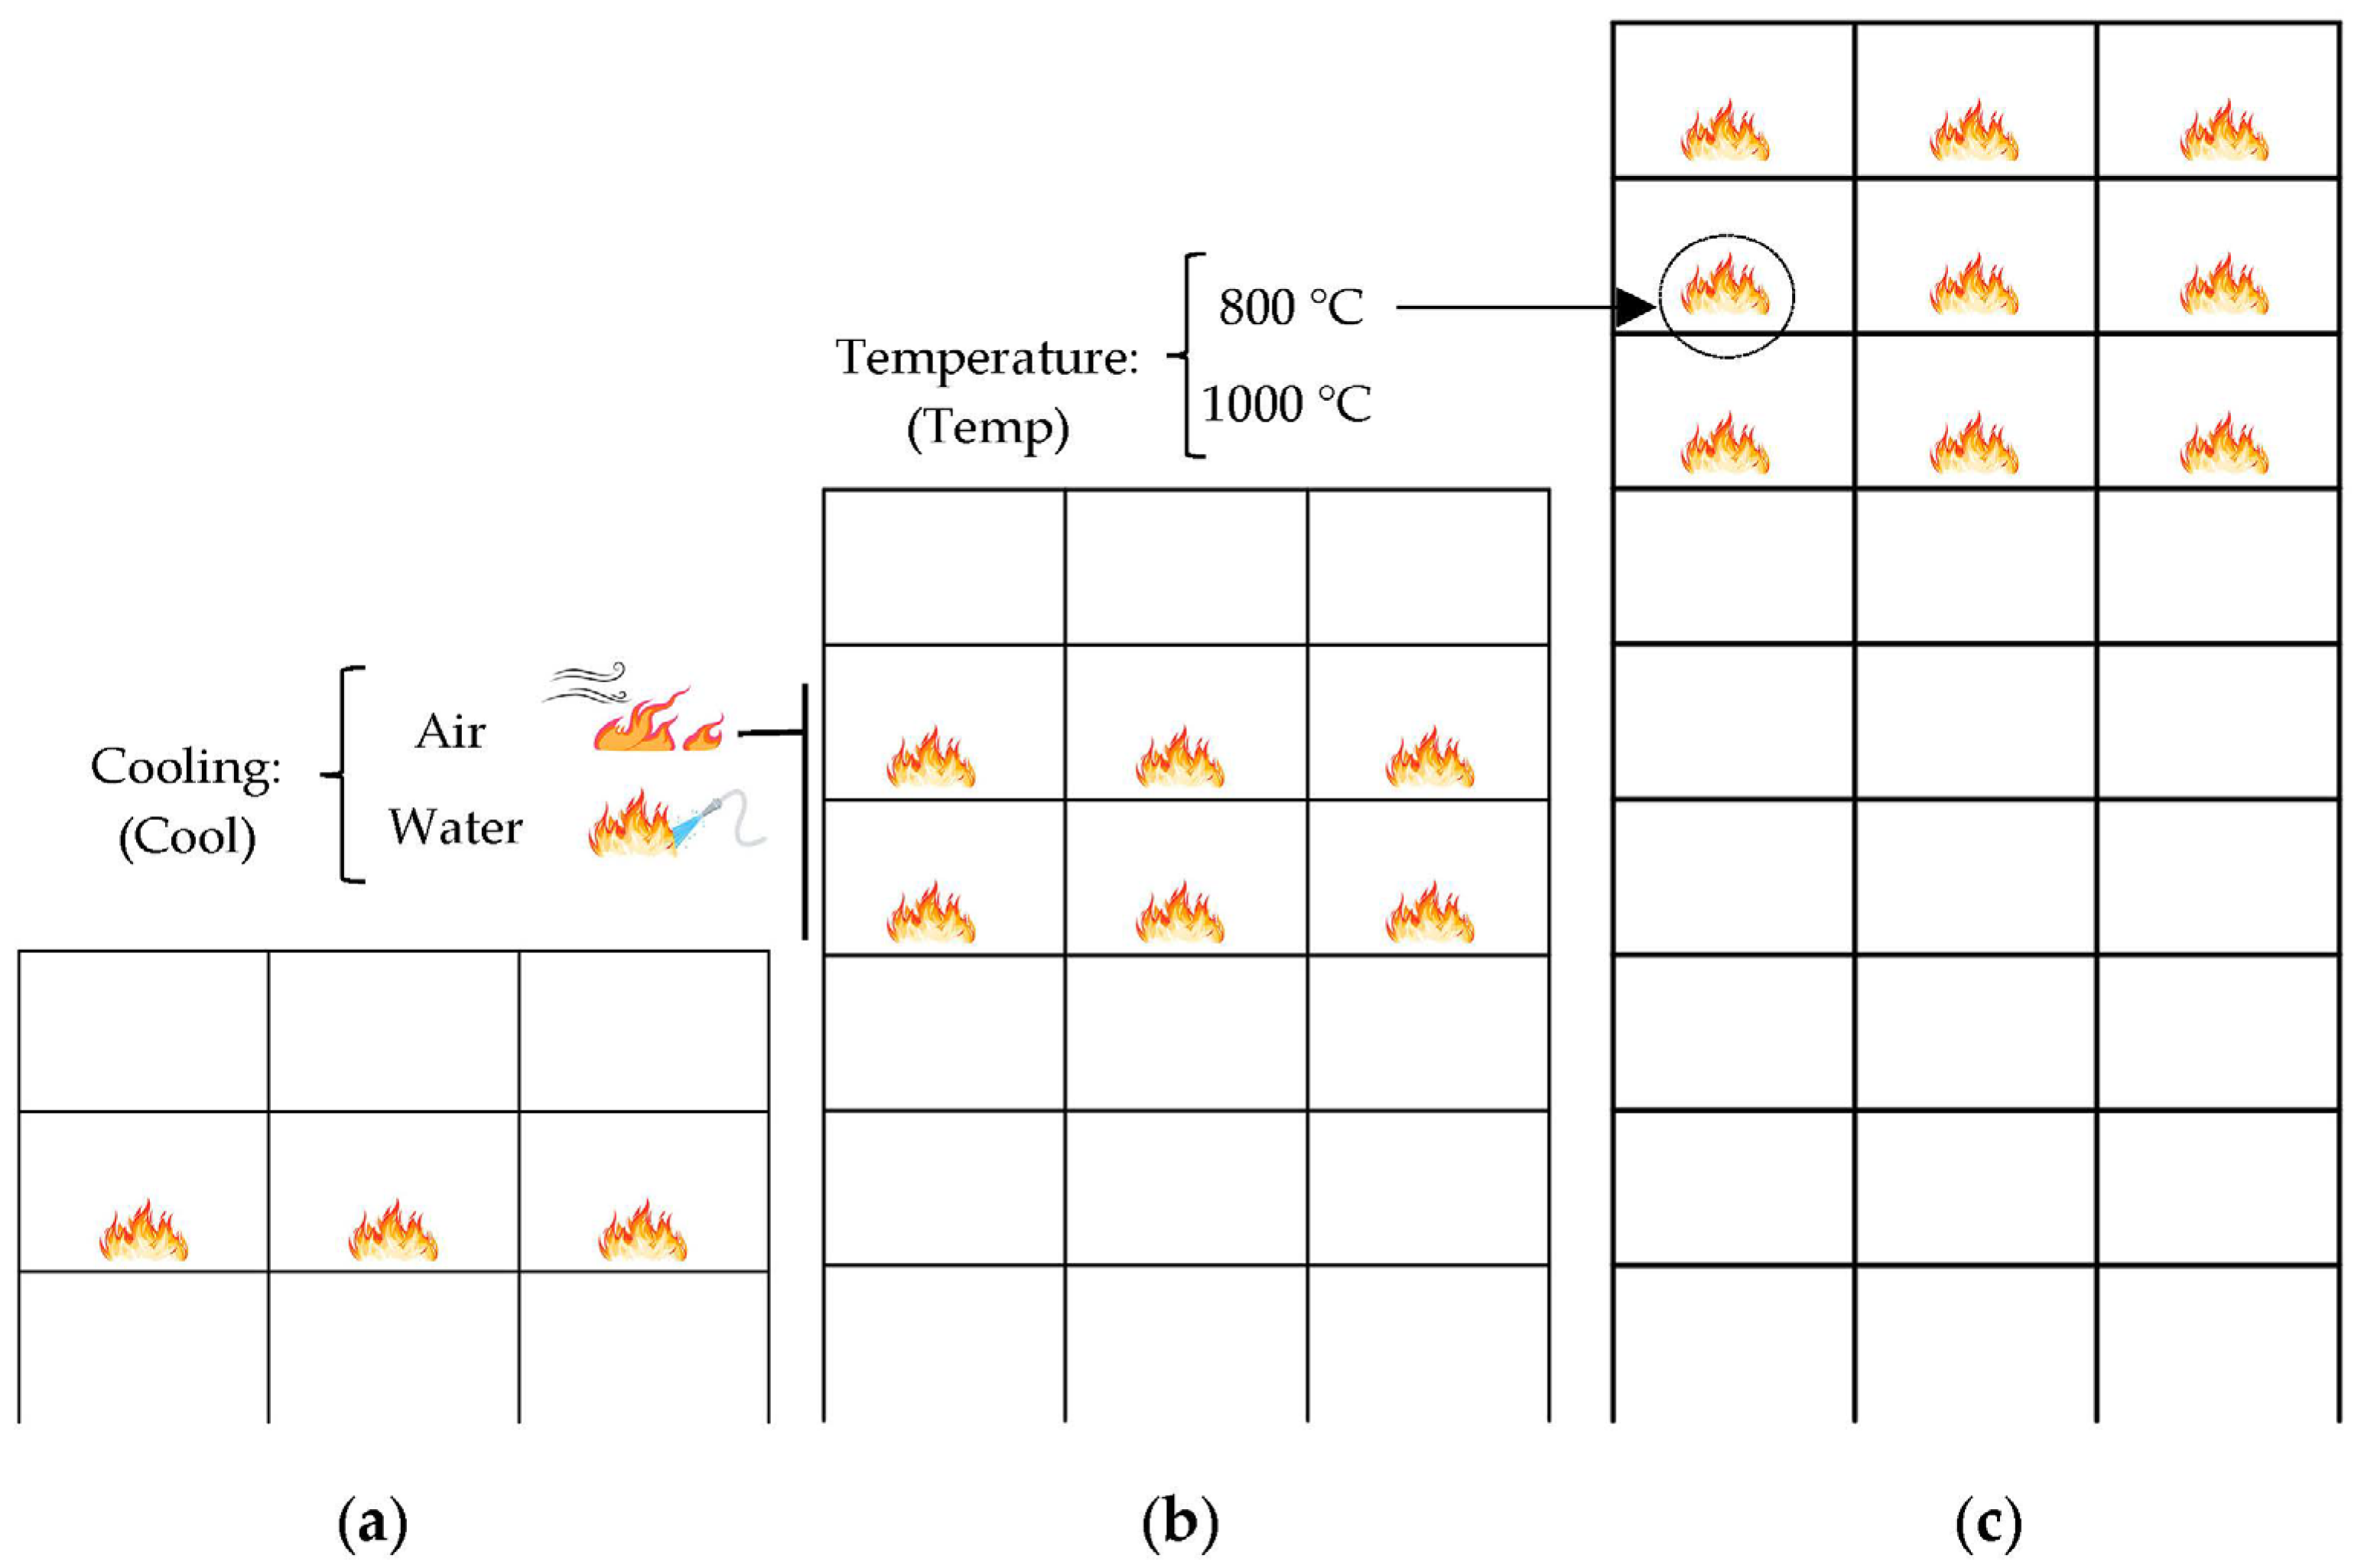
2.3. Fire Scenarios
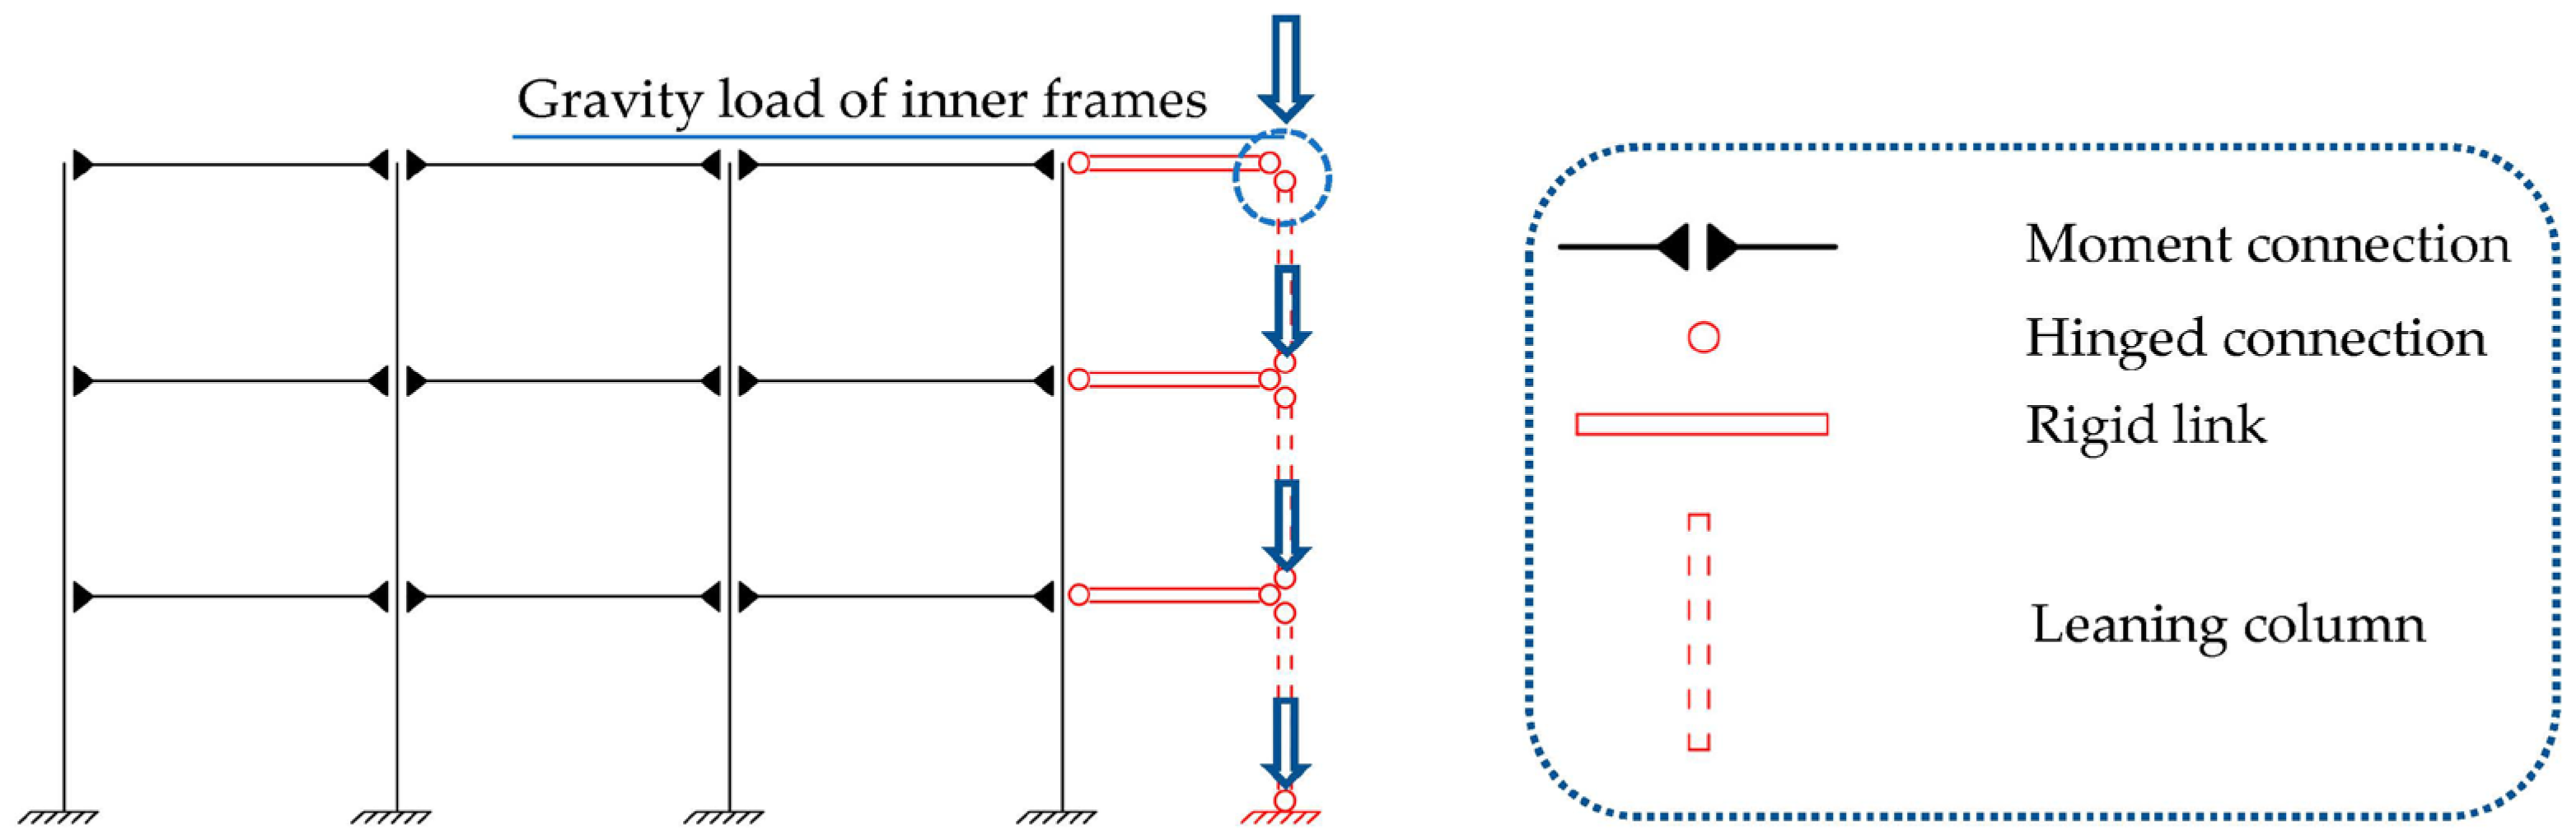
2.4. Numerical Simulation
2.5. Time-History Analysis
2.5.1. Record Selection
2.5.2. Development of Fragility Curves
2.5.3. Collapse Margin Ratio
3. Results
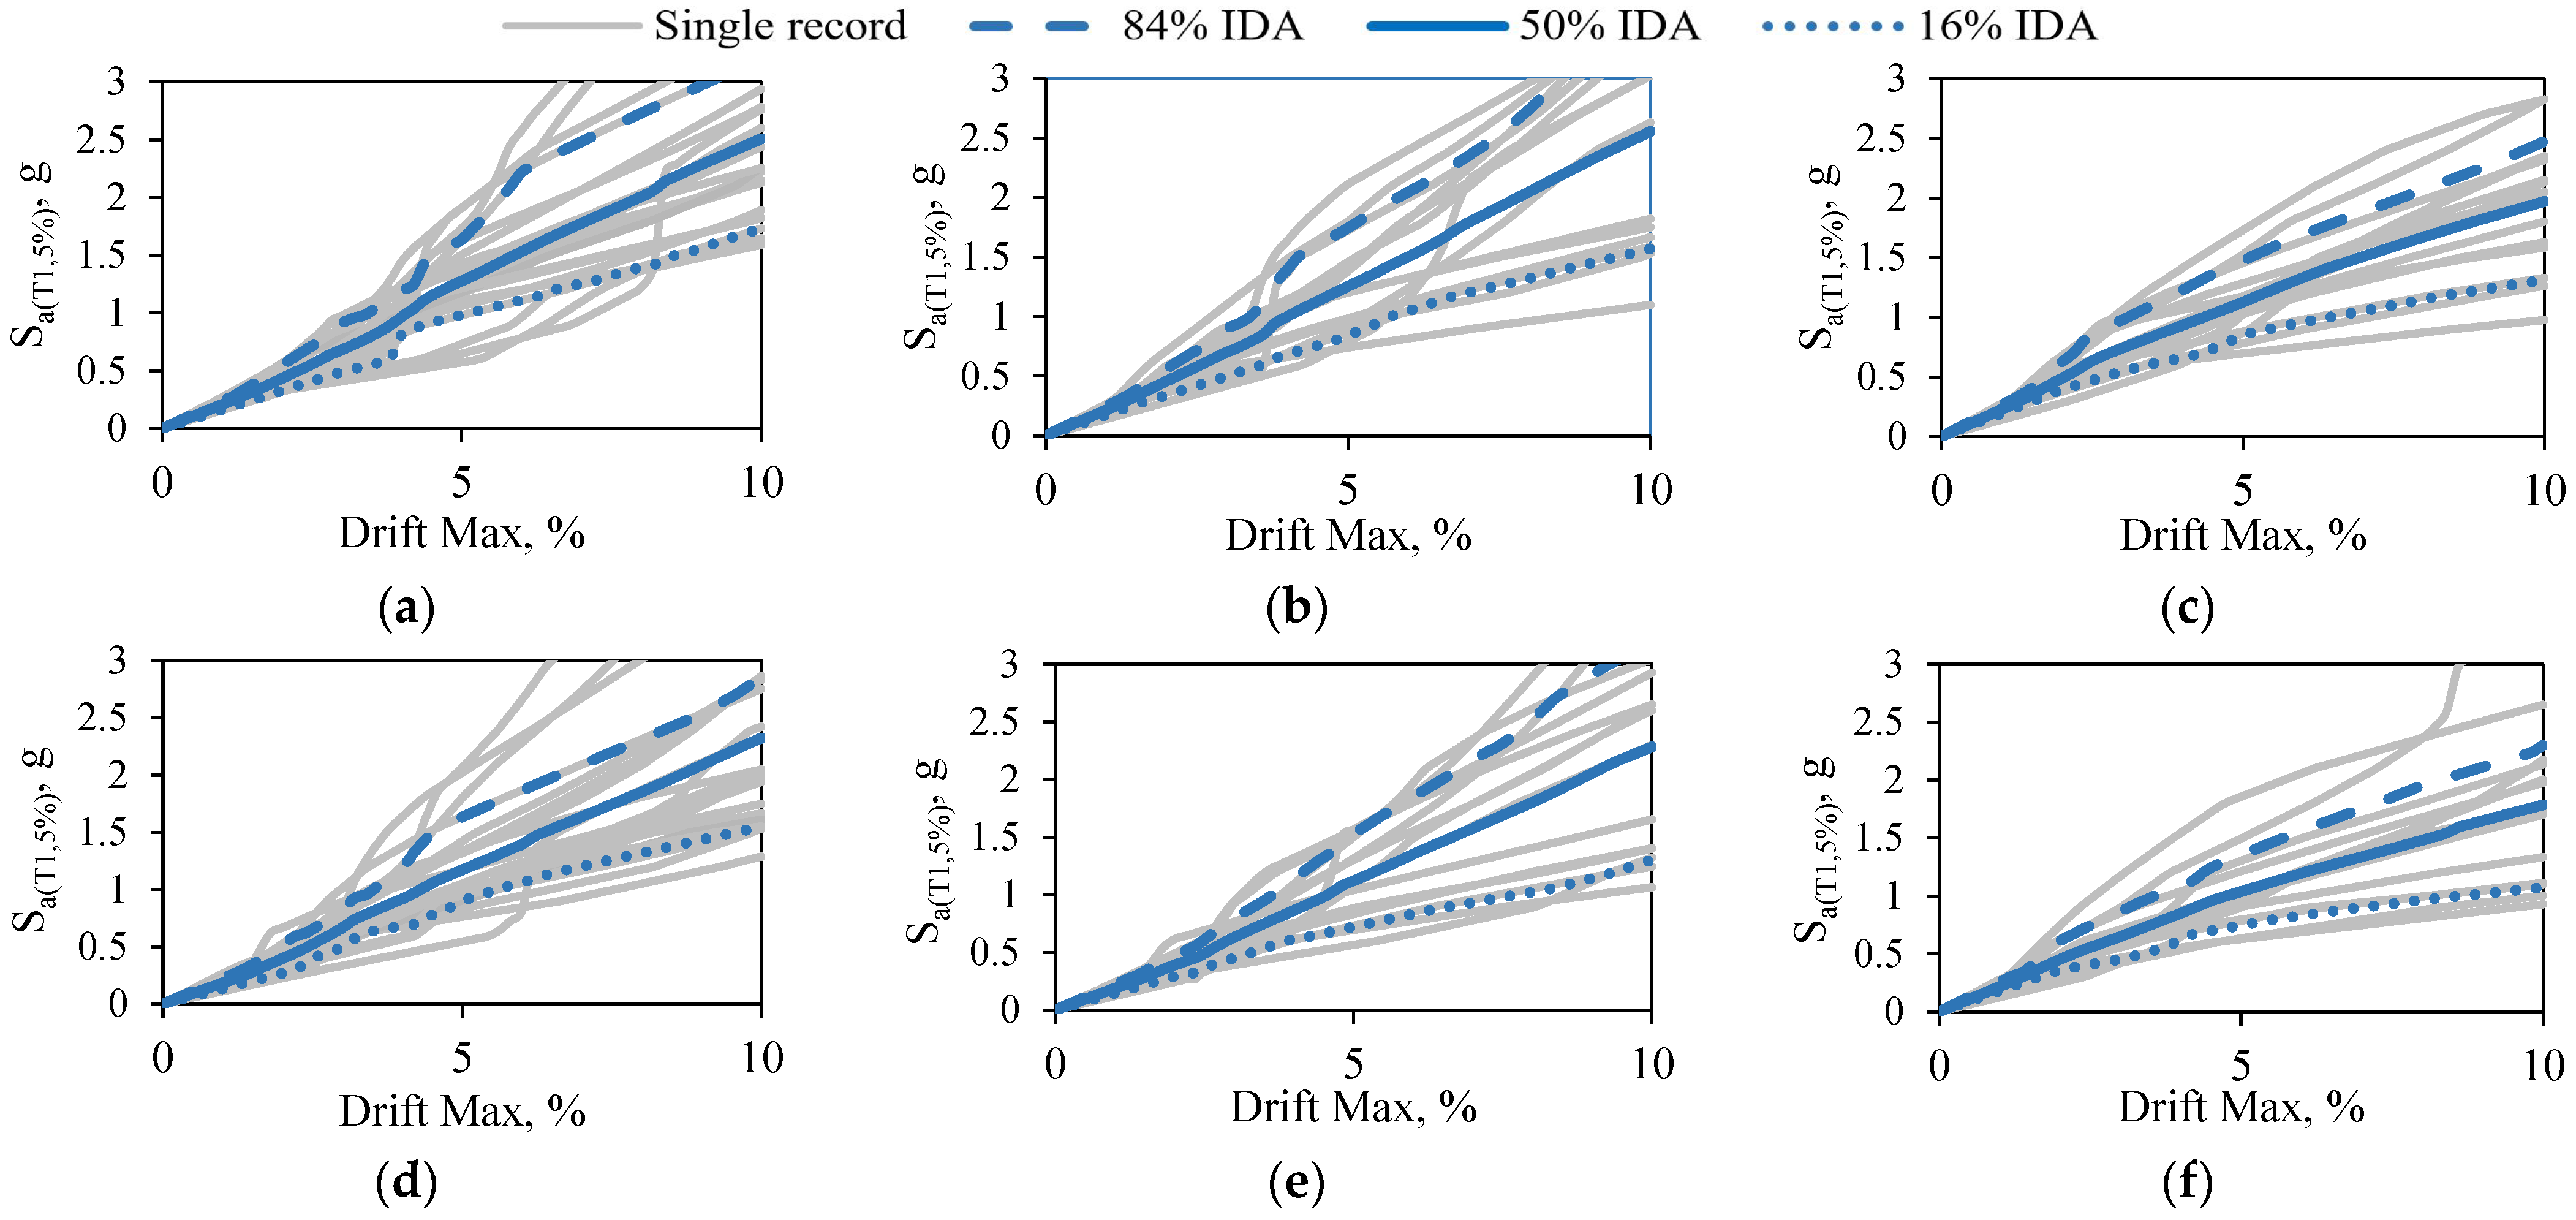
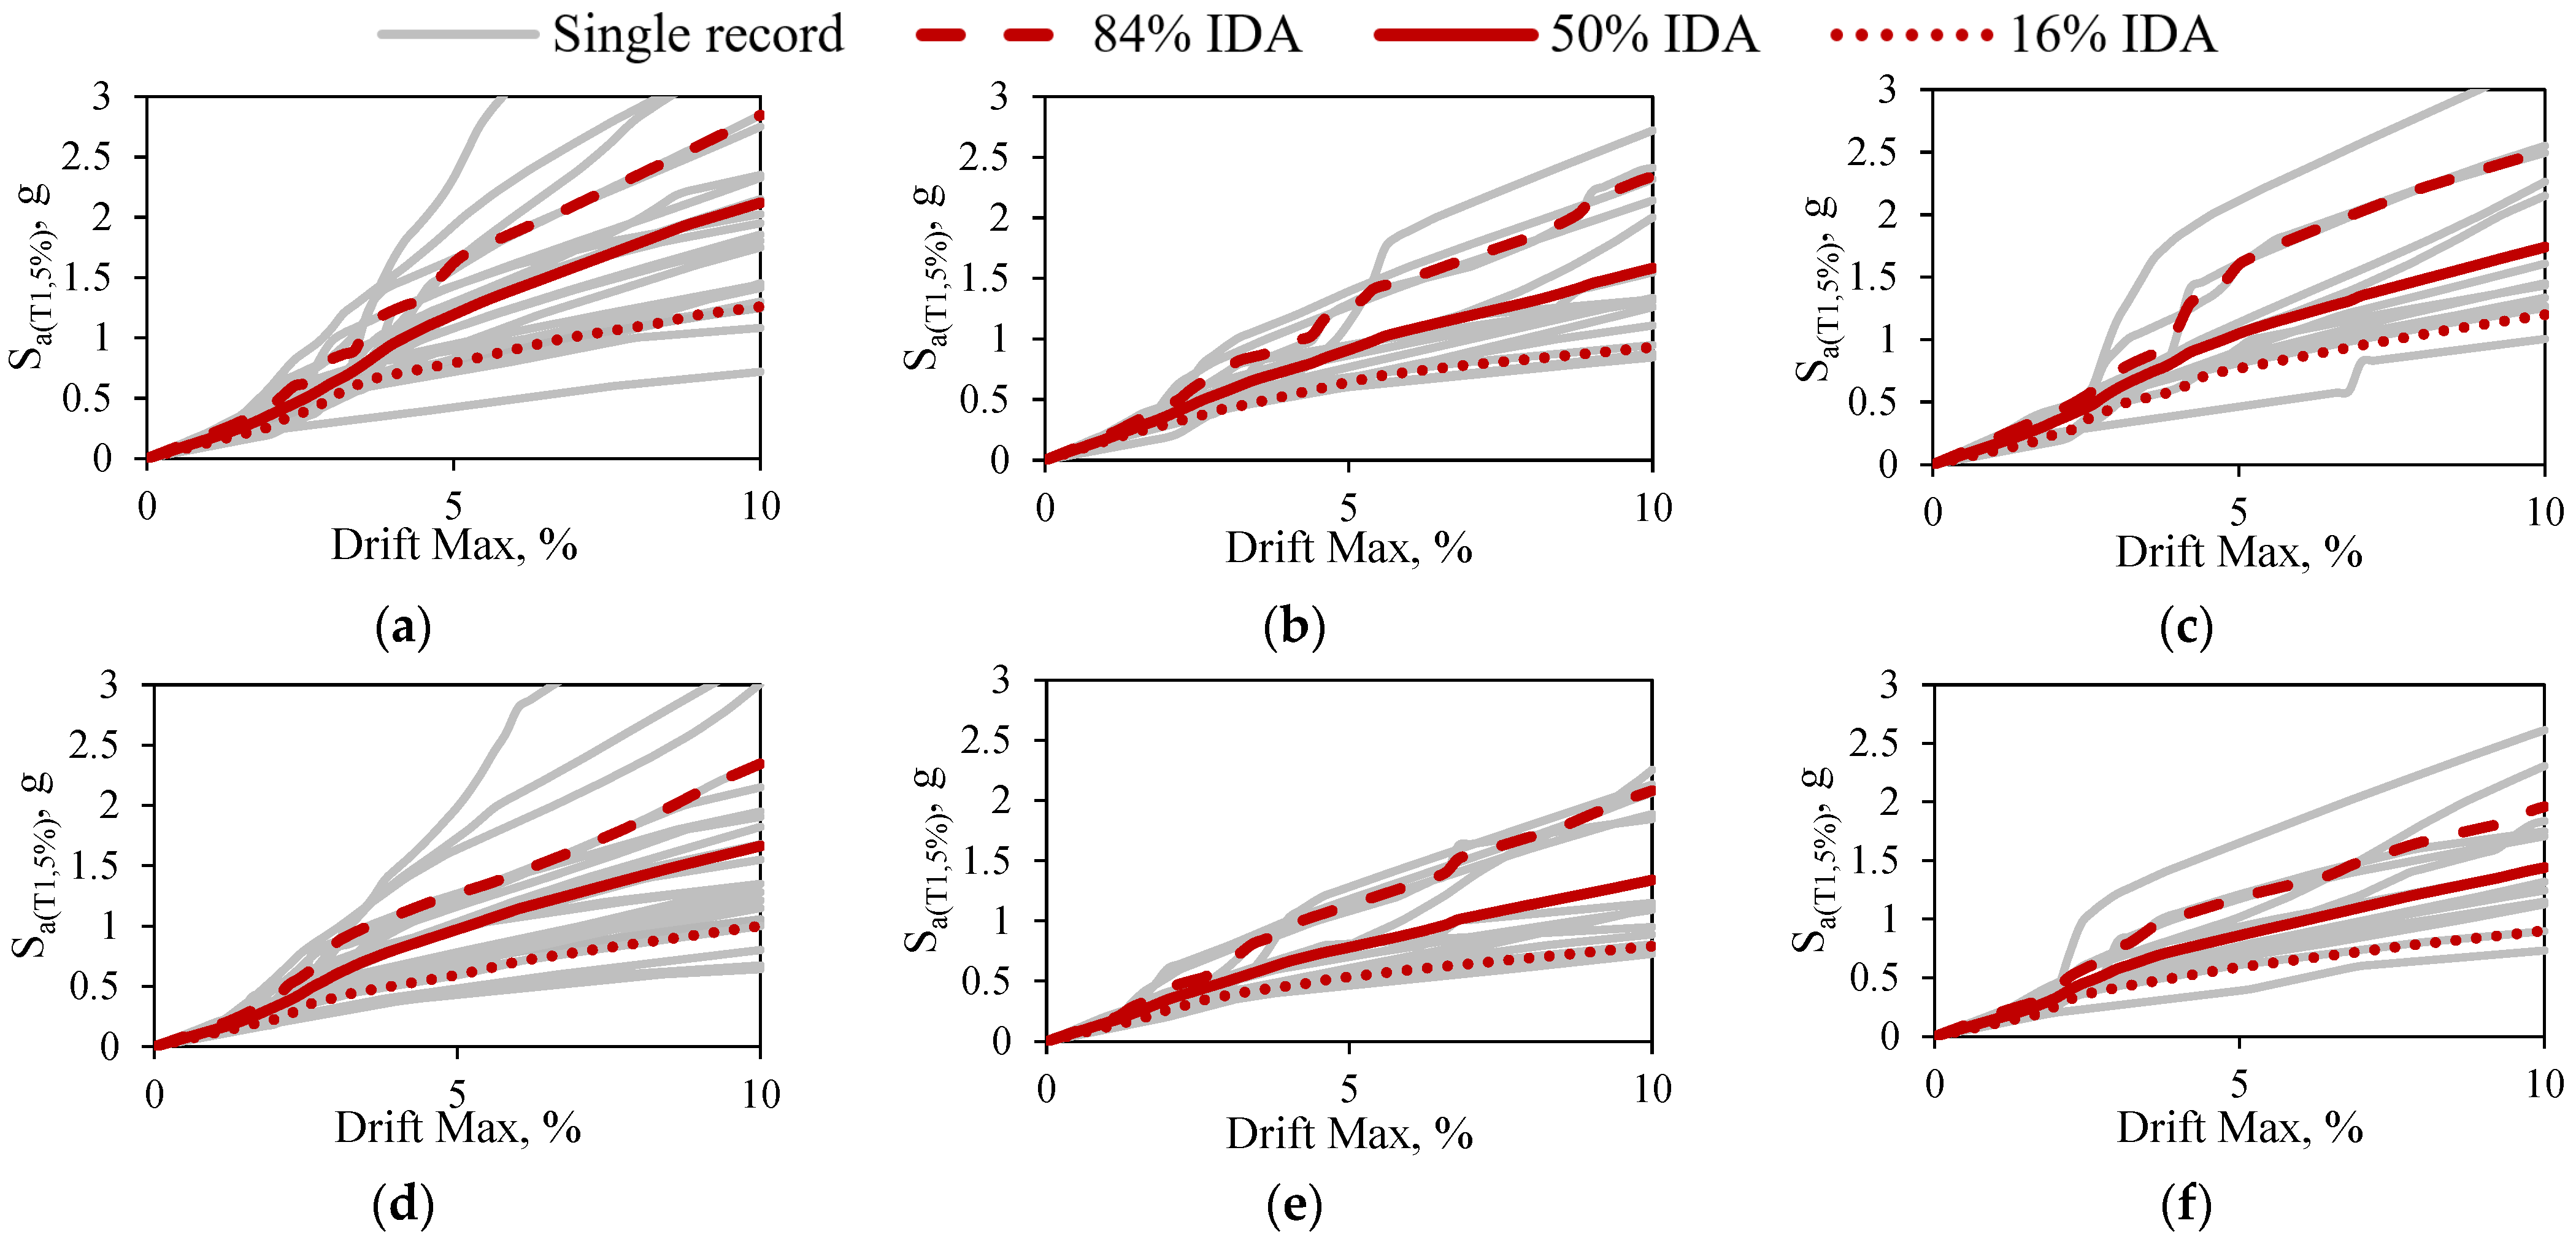
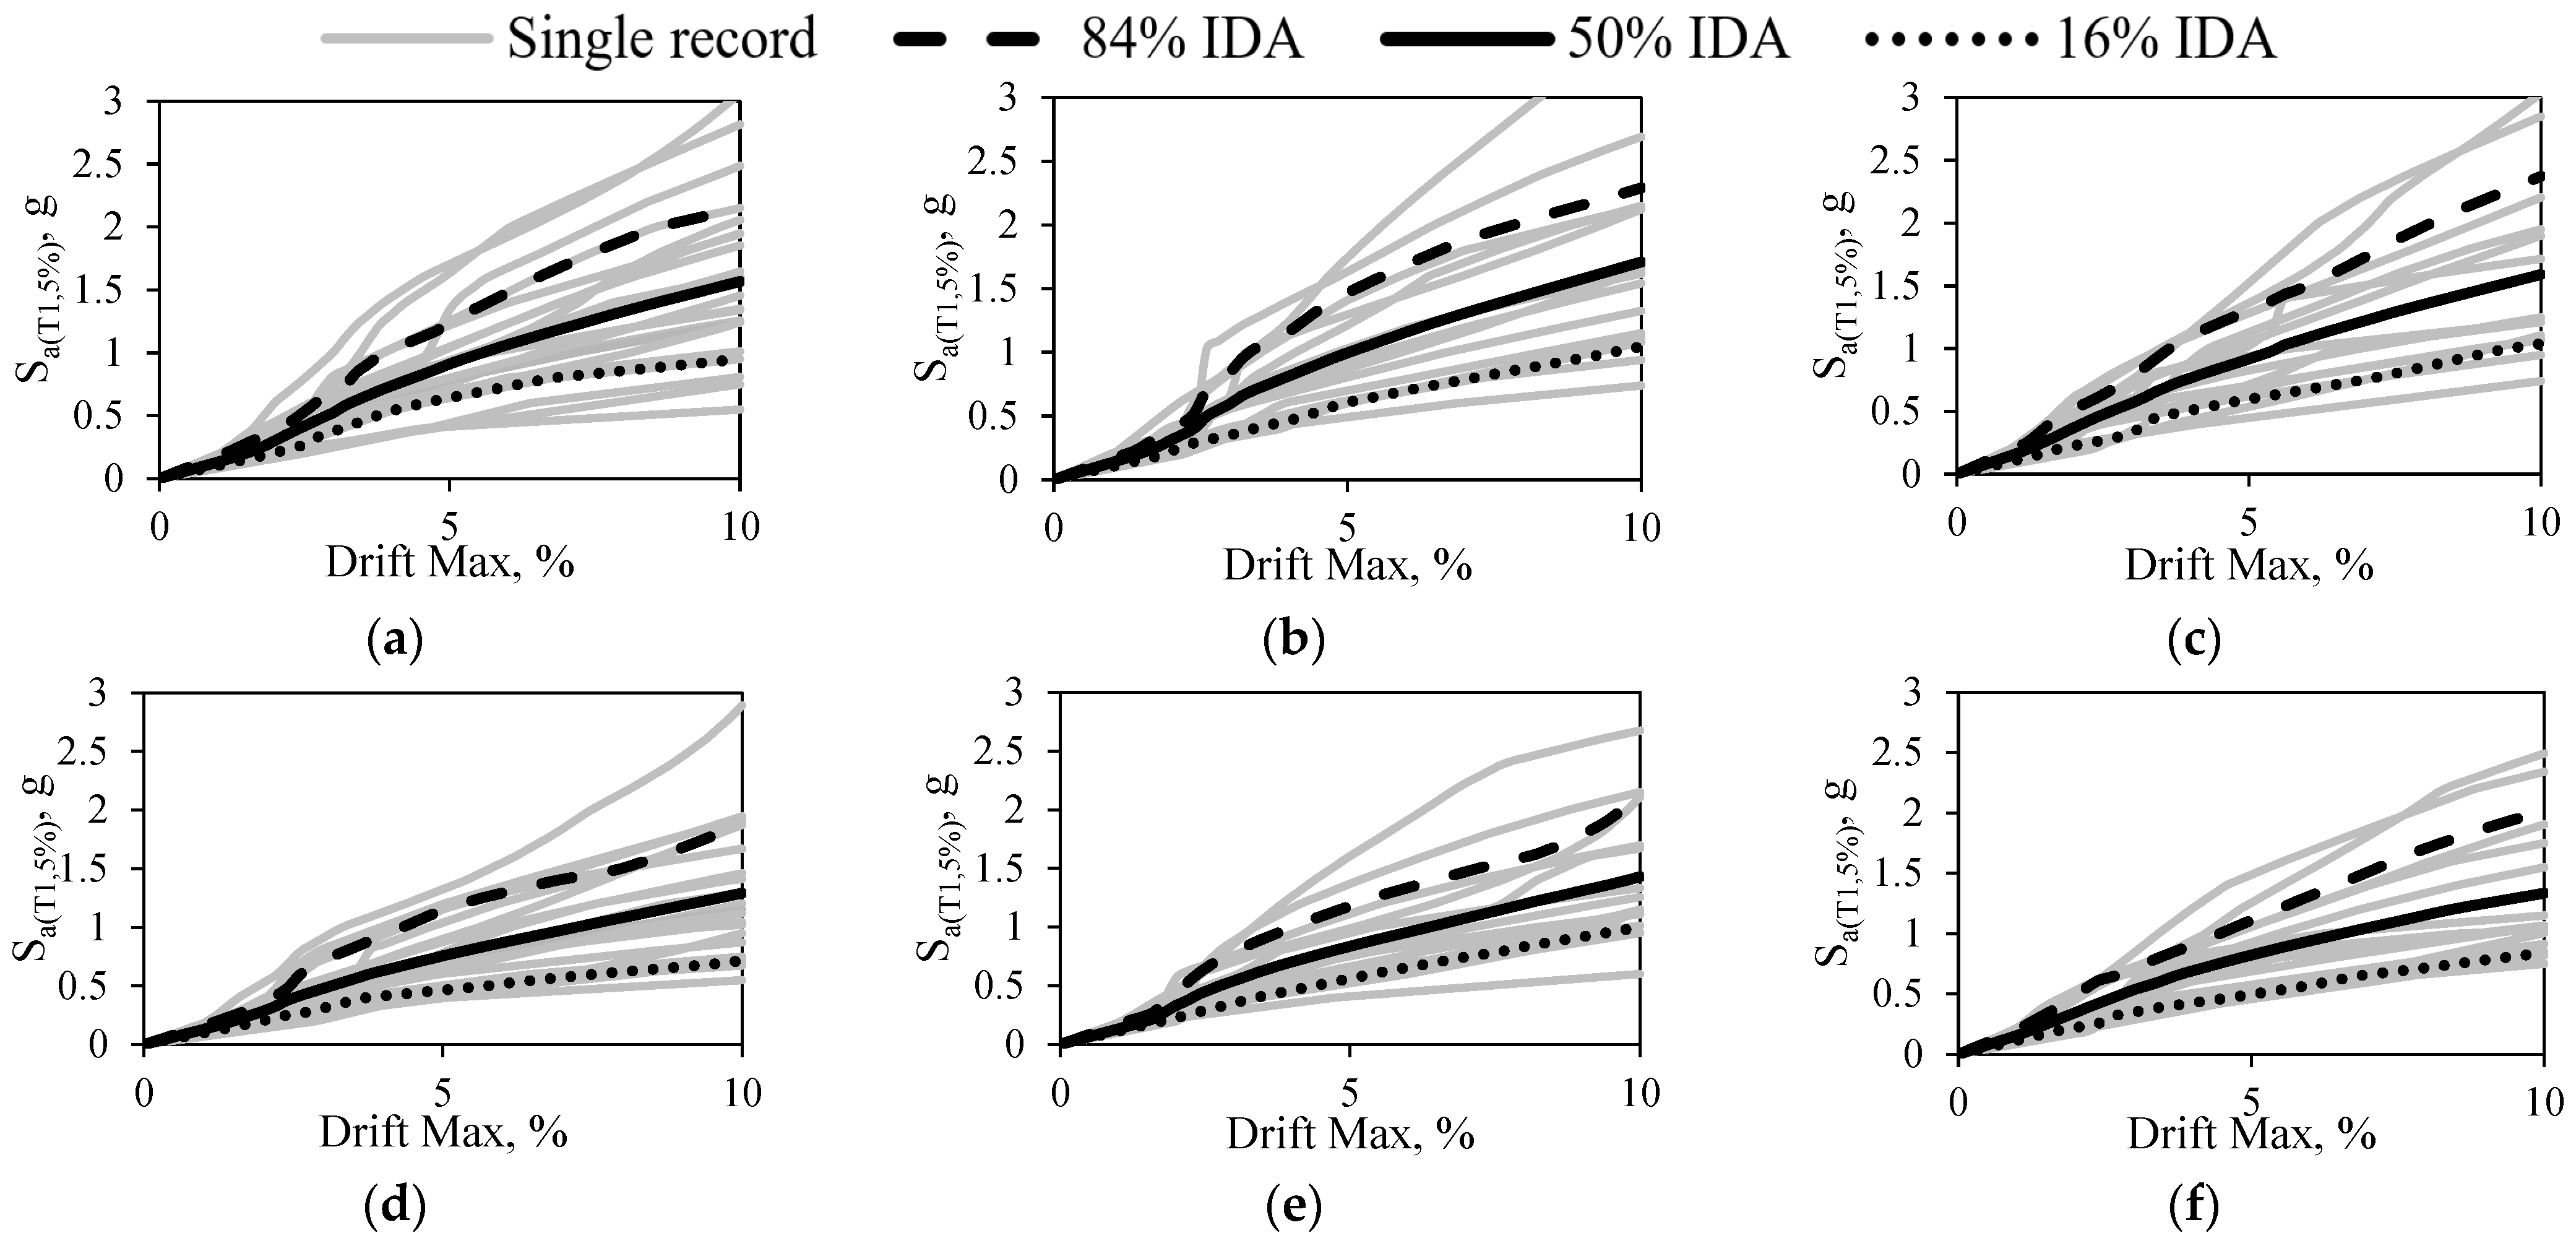
3.1. IDA Curves
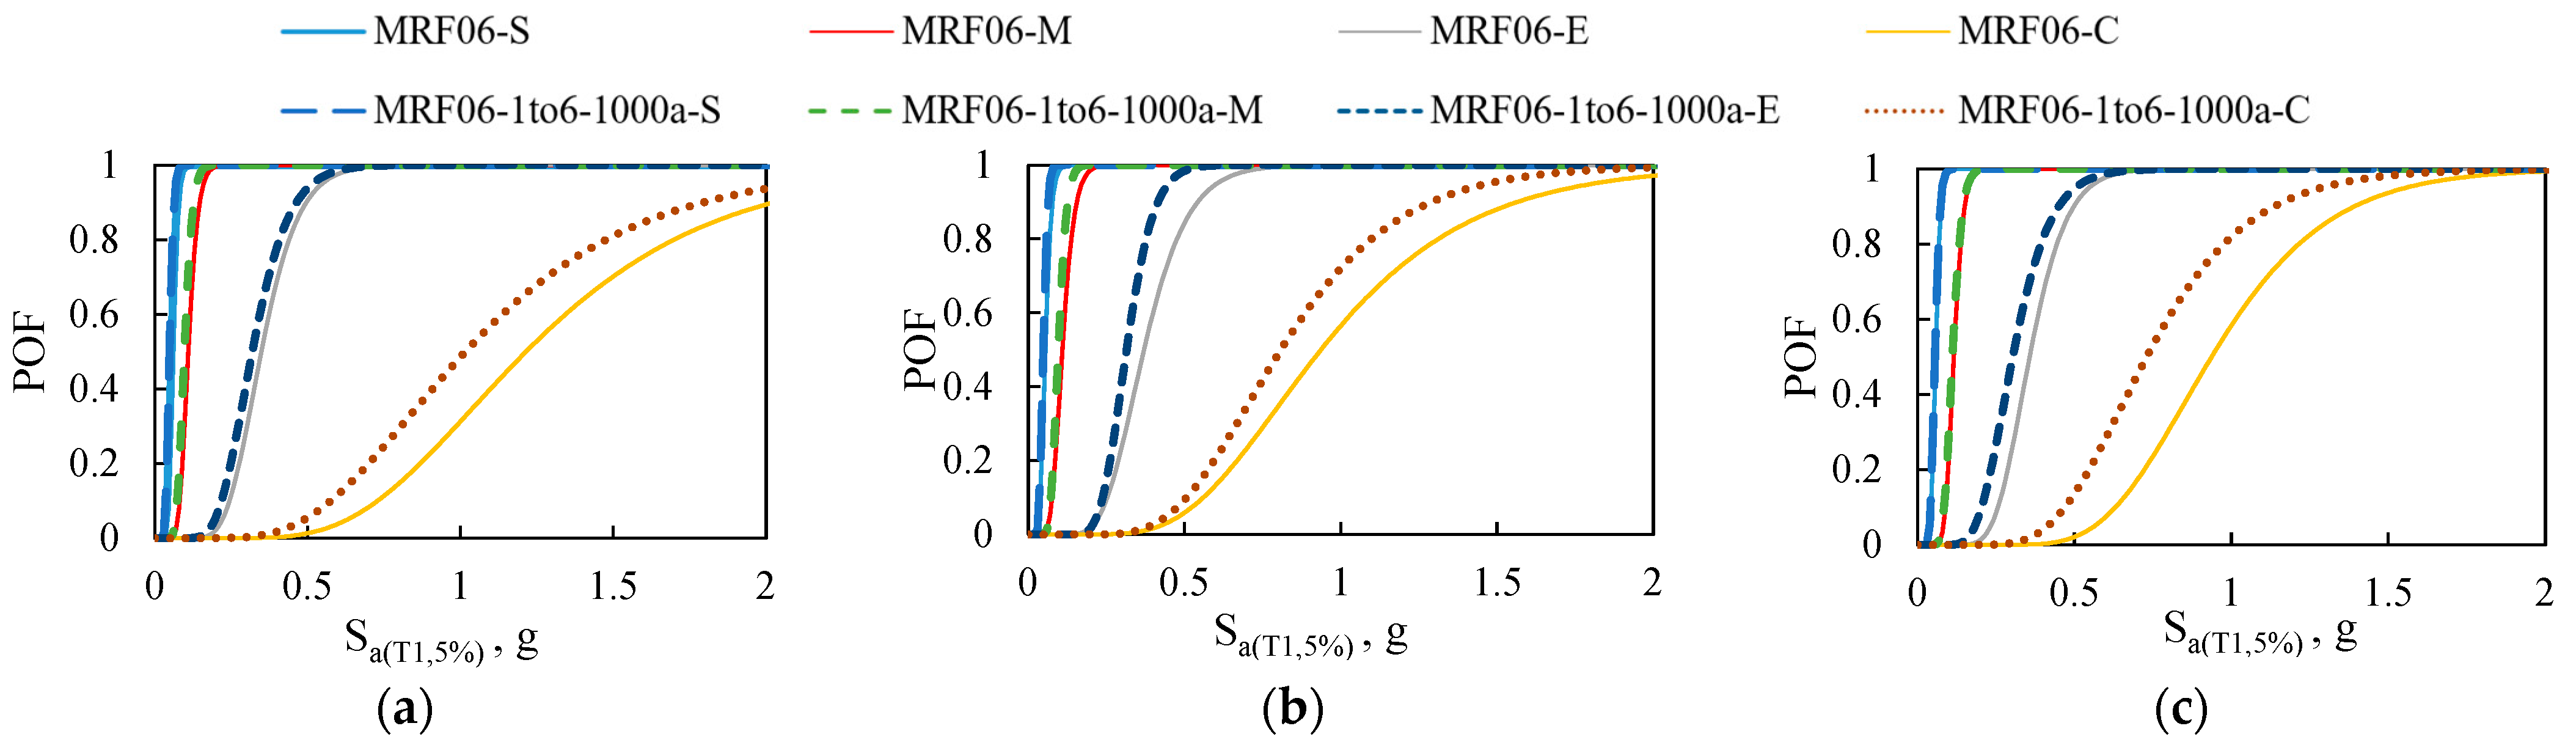
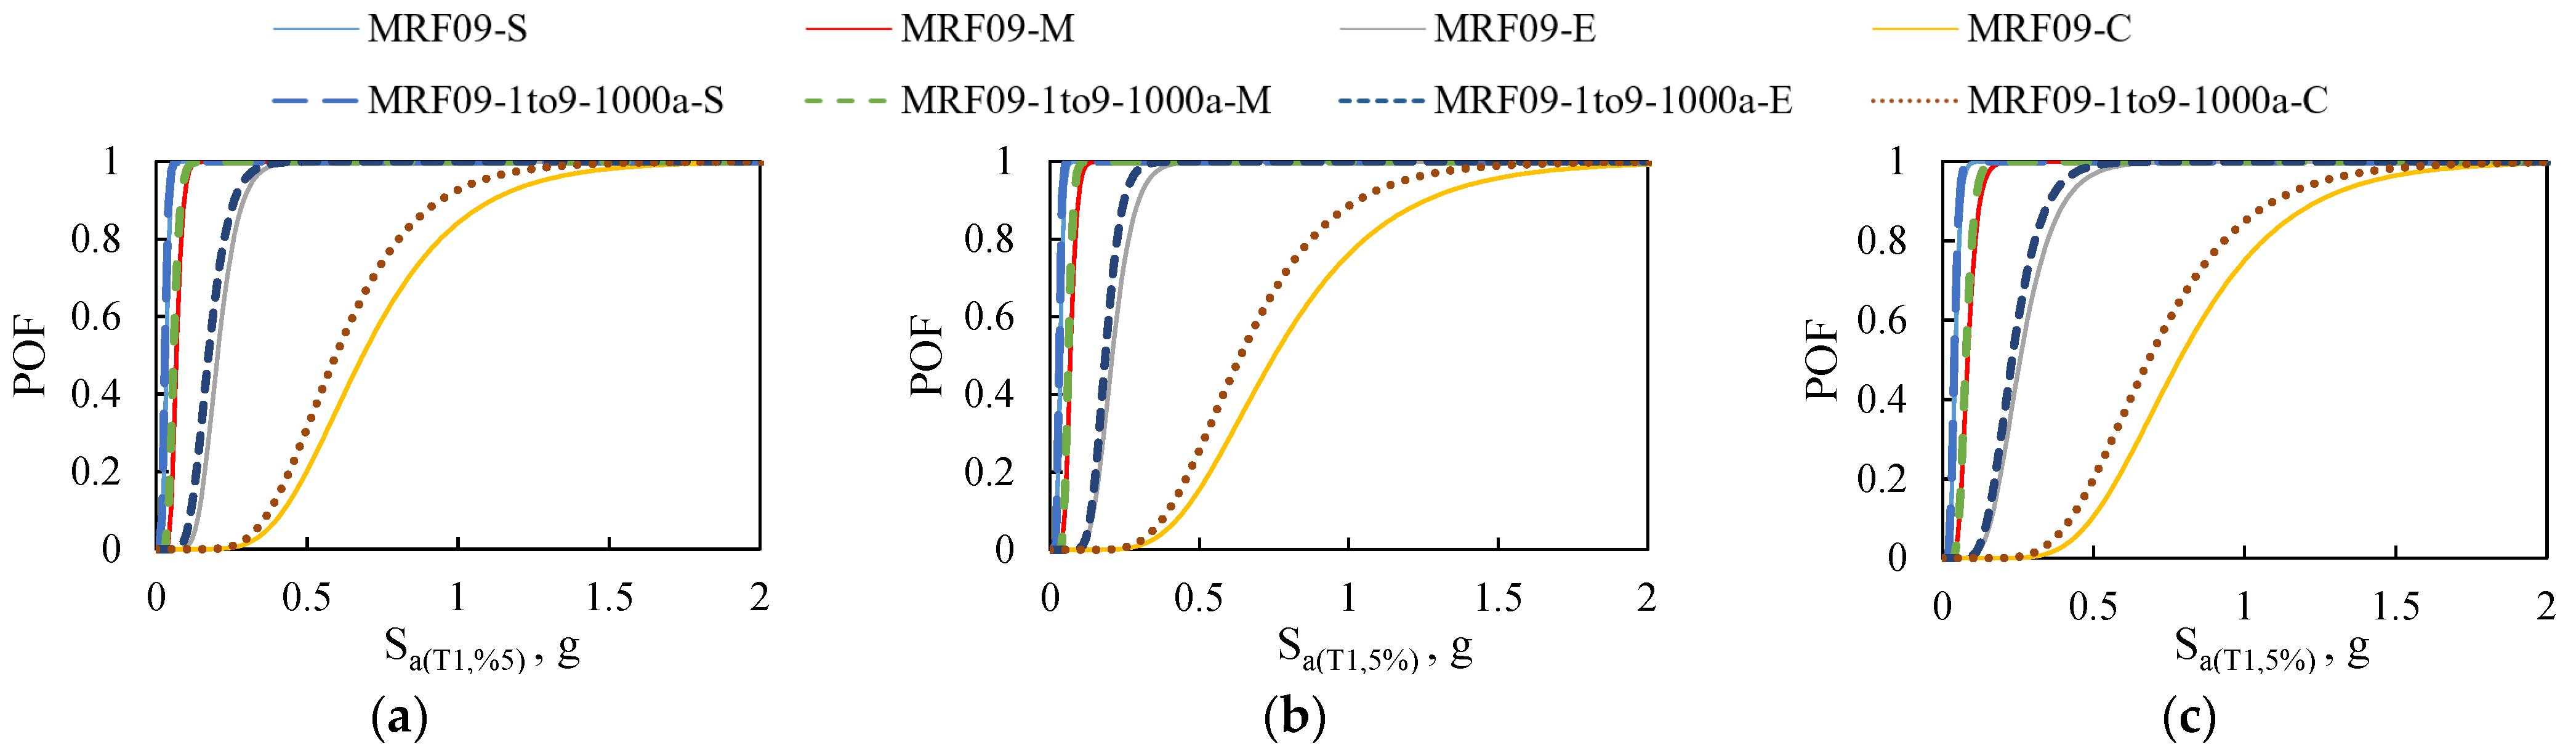
3.2. Fragility Curves
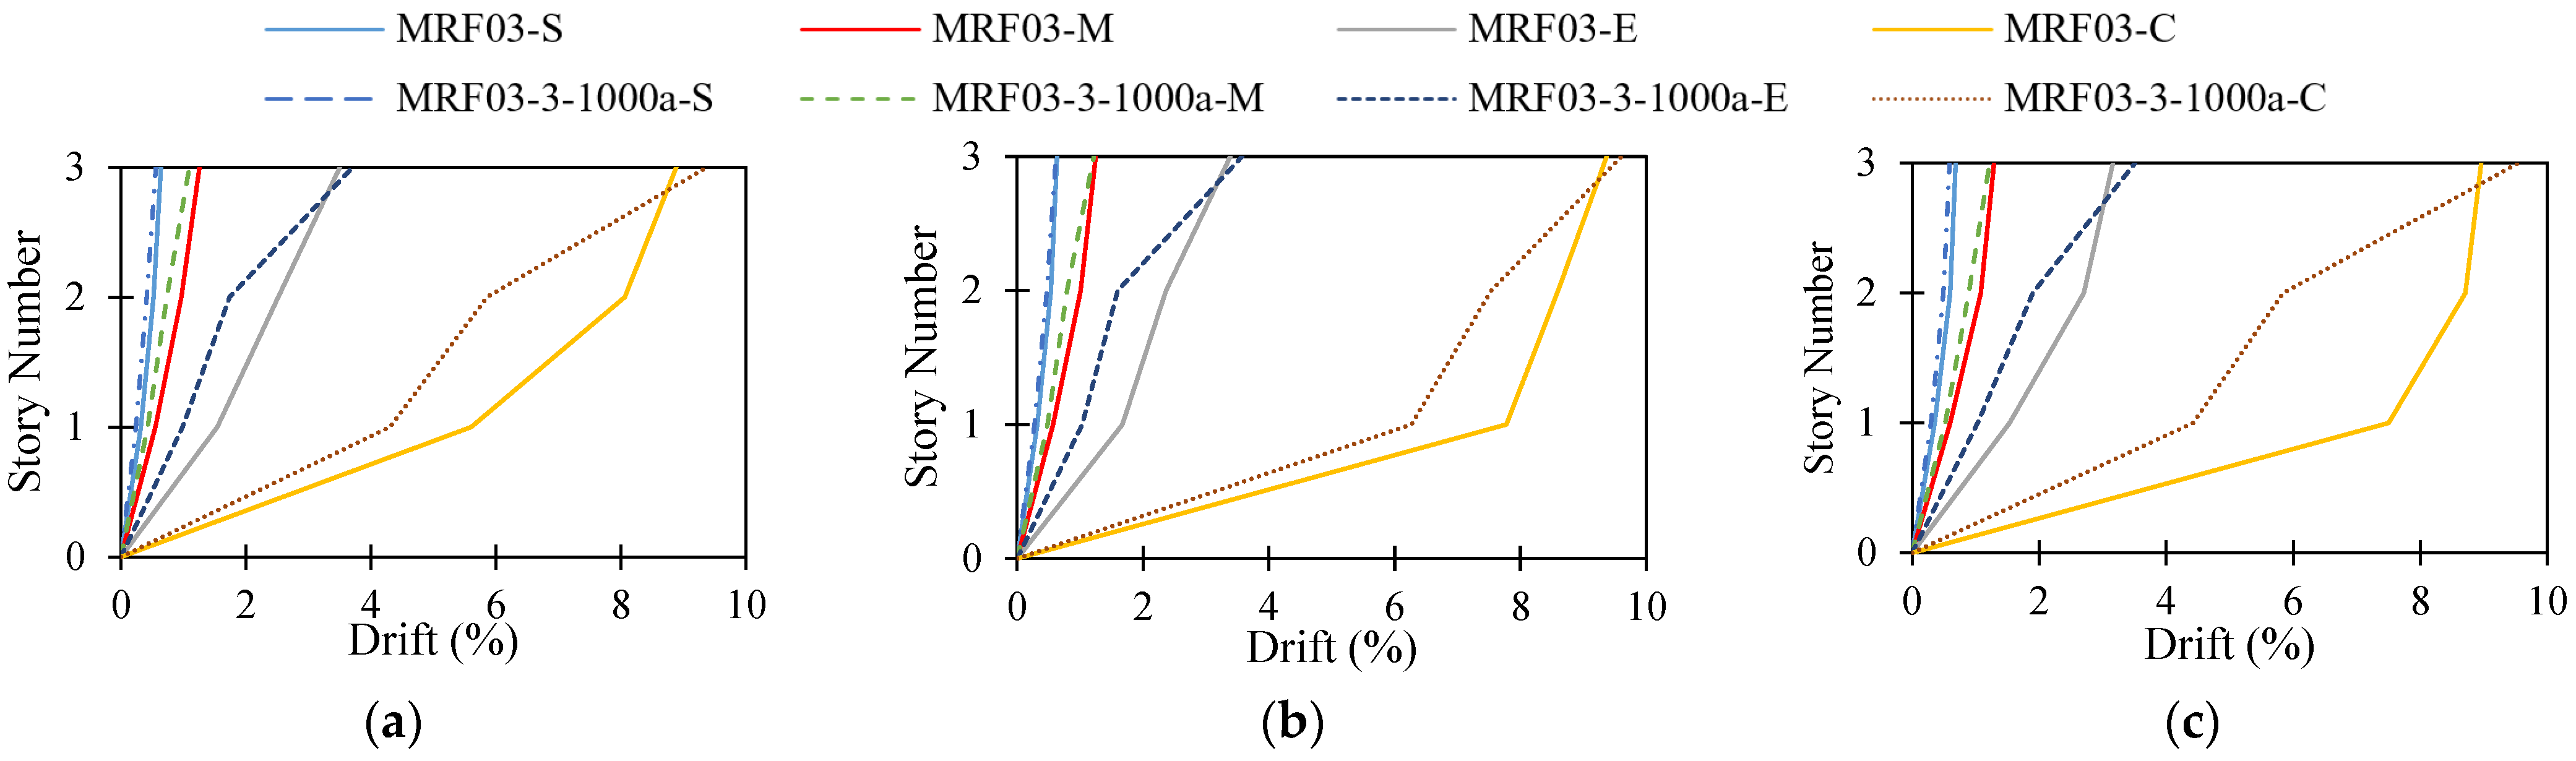
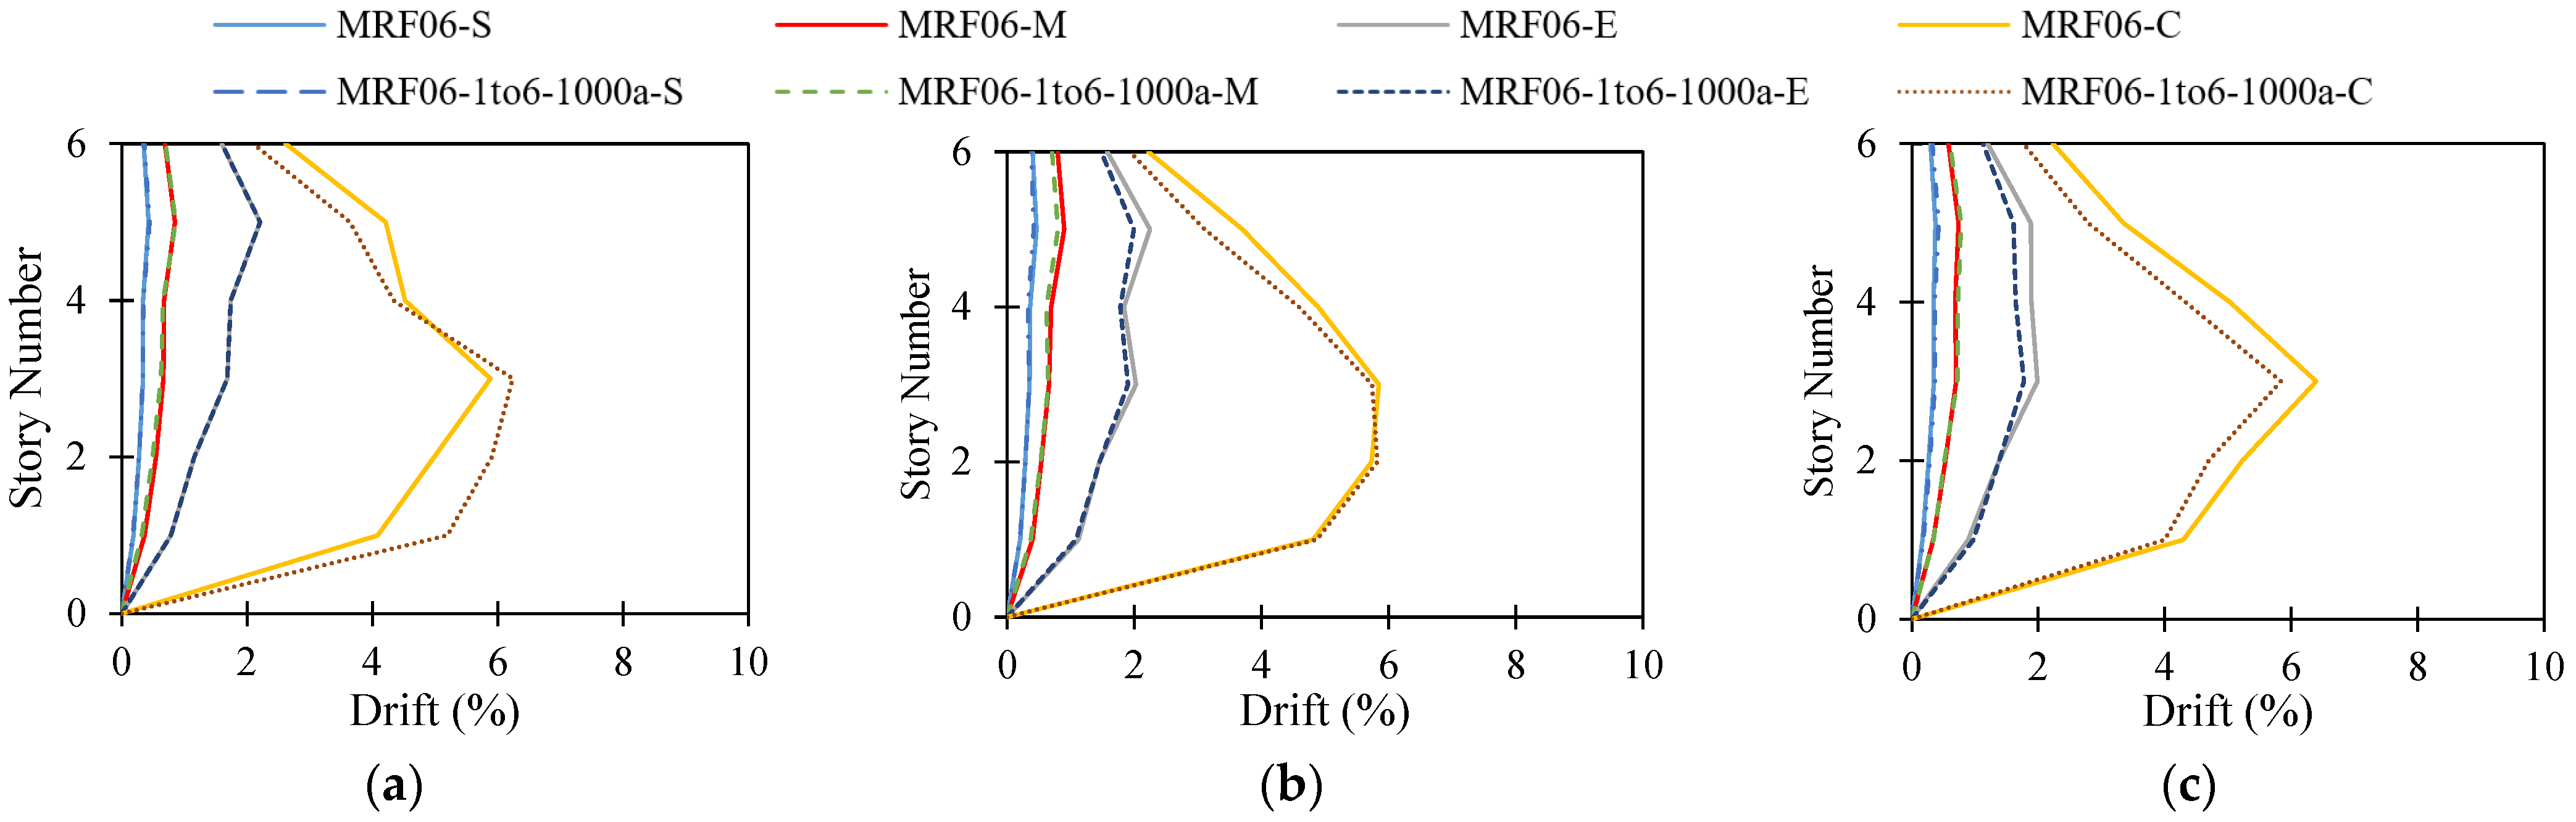
3.3. Inter-Story Drift Ratio
3.4. Exceedance Probability at Sa(T1)
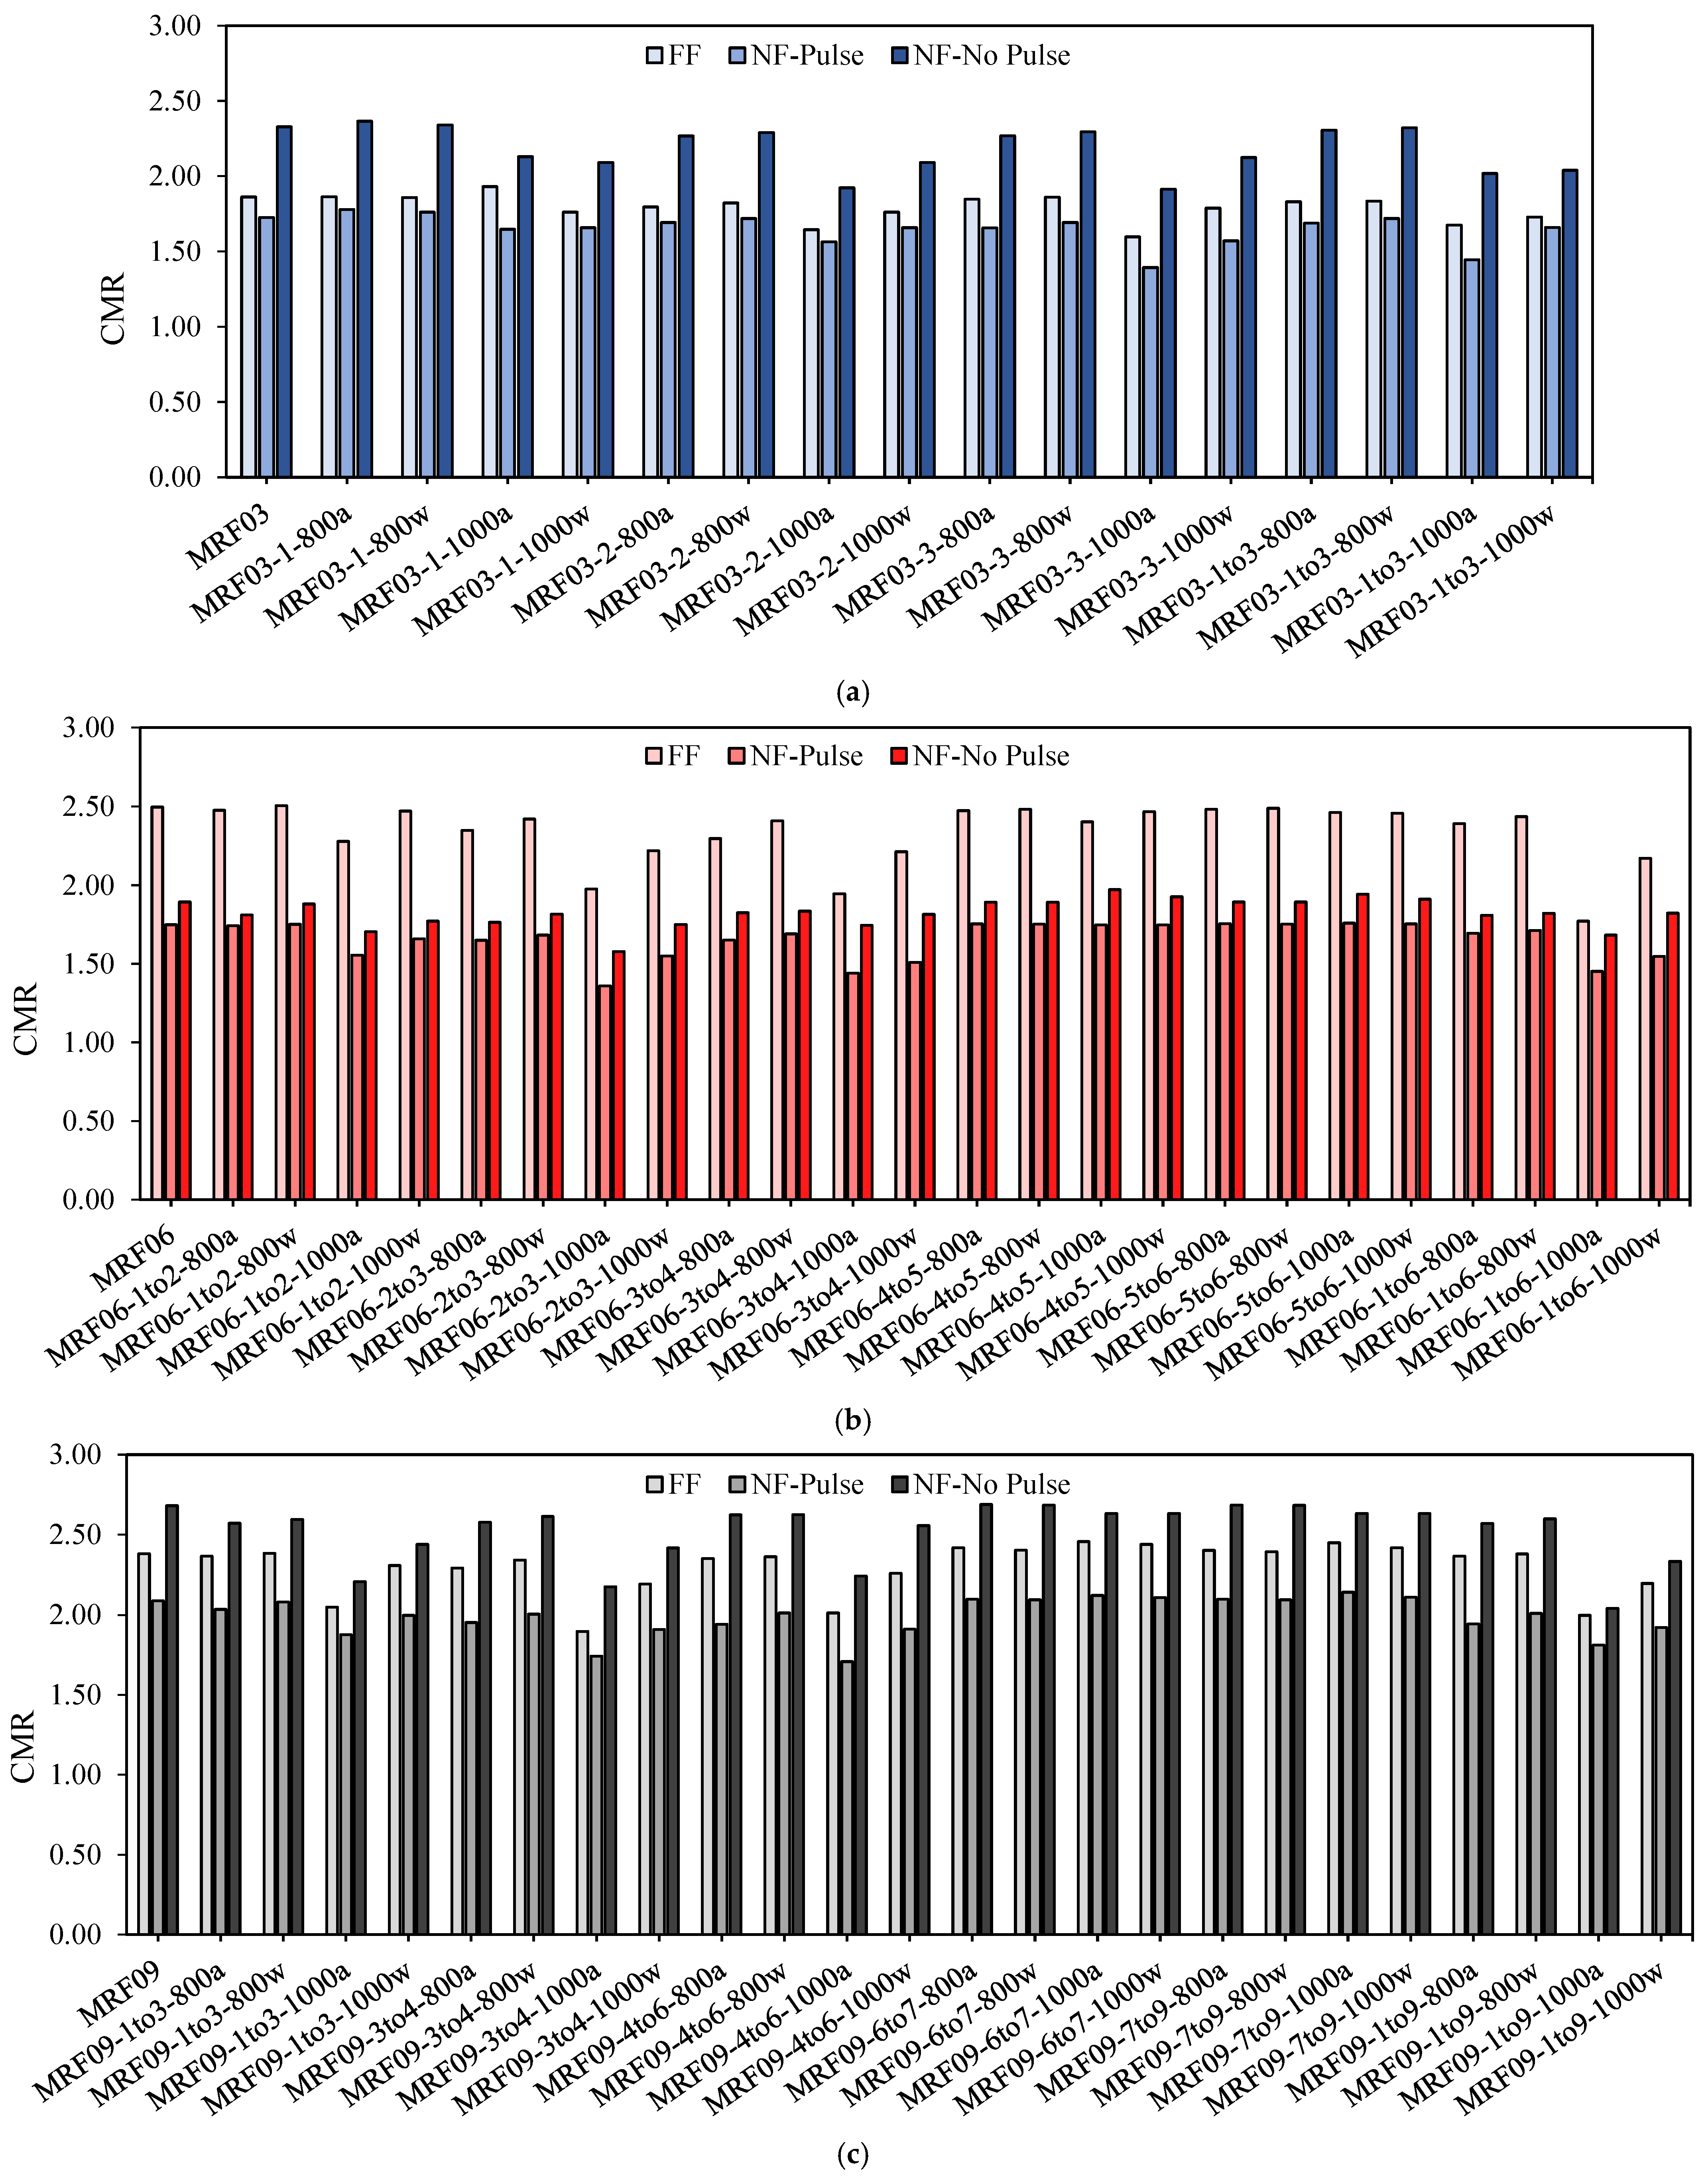
3.5. CMR Results
4. Conclusions
- Investigating the comparative fragility curves, a greater POF can be seen with increasing the height of structures. This can be illustrated by the probability of extensive failure at Sa(T1) for the initial 3-, 6-, and 9-story structures subjected to NF-No Pulse ground motions which equals to 42%, 78%, and 96%, respectively. Moreover, the 9-story structures subjected to NF-Pulse records are predicted to demonstrate earlier failures at their complete damage level, whereas the 3- and 6-story structures are the most susceptible to FF ground motions.
- Inter-story drift ratios were lower in the critical fire scenarios compared to the initial cases except for the stories affected by fire. For example, in the 3-story structure subjected to NF-Pulse records, drift ratio differed nearly 0.25% between the 2nd and 3rd stories of the initial model. However, the difference was 3.7% in the critical fire scenario, exceeding the roof drift ratio of the initial model. In addition, the 6-story structure showed the least variations in terms of drift percentage among all the studied structures due to its critical fire scenario.
- The CMR results show that the structures carry the lowest margins of safety when subjected to NF-Pulse records. This emphasizes the fact that pulse-like frequency contents reduce safety regardless of structural height. The minimum CMR values of NF-Pulse records in 3-, 6-, and 9-story structures were 1.39, 1.36, and 1.71, respectively.
- The air cooling method and the 1000 °C elevated temperature were found to exacerbate the seismic performance of post-fire structures. The CMR result for the most critical scenario in the 9-story structure, i.e., MRF09-3to4-1000a, subjected to NF-No Pulse ground motions was 2.18, while a value of 2.61 was determined for the fire scenario MRF09-3to4-800w.
- Generally, pre-exposing structures to fire decreases the margin of collapse safety compared to initial cases. This is evidenced by the average reduction percentages of CMR which are 20.9%, 25.0%, and 22.7% for the 3-, 6-, and 9- story structures in their most critical post-fire scenarios, respectively.
Author Contributions
Funding
Data Availability Statement
Conflicts of Interest
References
- EN 1998-1:2004; Eurocode 8: Design of Structures for Earthquake Resistance-Part 1: General Rules, Seismic Actions and Rules for Buildings. European Committee for Standardization: Brussels, Belgium, 2004.
- Giuliani, L. Structural safety in case of extreme actions. Int. J. Lifecycle Perform. Eng. 2012, 1, 22–40. [Google Scholar] [CrossRef]
- Outinen, J.; Mäkeläinen, P. Mechanical properties of structural steel at elevated temperatures and after cooling down. Fire Mater. 2004, 28, 237–251. [Google Scholar] [CrossRef]
- Tao, Z.; Wang, X.Q.; Uy, B. Stress-strain curves of structural and reinforcing steels after exposure to elevated temperatures. J. Mater. Civ. Eng. 2013, 25, 1306–1316. [Google Scholar] [CrossRef]
- Lee, J.; Engelhardt, M.D.; Taleff, E.M. Mechanical properties of ASTM A 992 steel after fire. Eng. J. 2012, 49, 33–44. [Google Scholar]
- BS 5950; Structural Use of Steelwork in Building, Part 8: Code of Practice for Fire Resistant Design. British Standard Institution: London, UK, 1990.
- Li, G.-Q.; Shou-Chao, J.; Yin, Y.-Z.; Chen, K.; Li, M.-F. Experimental studies on the properties of constructional steel at elevated temperatures. J. Str. Eng. 2003, 129, 1717–1721. [Google Scholar] [CrossRef]
- Kirby, B.; Preston, R. High temperature properties of hot-rolled, structural steels for use in fire engineering design studies. Fire Saf. J. 1988, 13, 27–37. [Google Scholar] [CrossRef]
- Maraveas, C.; Fasoulakis, Z.; Tsavdaridis, K.D. Post-fire assessment and reinstatement of steel structures. J. Str. Fire Eng. 2017, 8, 181–201. [Google Scholar] [CrossRef]
- Priyadarshini, M.; Behera, A.; Biswas, C.K.; Rajak, D.K. Experimental analysis and mechanical characterization of AISI P20 tool steel through heat-treatment process. J. Bio-Tribo-Corros. 2022, 8, 1–10. [Google Scholar] [CrossRef]
- Tide, R.H. Integrity of structural steel after exposure to fire. Eng. J.-Am. Inst. Steel Constr. 1998, 35, 26–38. [Google Scholar]
- Smith, C.I.; Kirby, B.R.; Lapwood, D.G.; Cole, K.J.; Cunningham, A.P.; Preston, R.R. The reinstatement of fire damaged steel framed structures. Fire Saf. J. 1981, 4, 21–62. [Google Scholar] [CrossRef]
- Kirby, B.; Lapwood, D.; Thomson, G. The reinstatement of fire damaged steel and iron framed structures. Br. Steel Corp. Swinden Lab. 1986, 1986, 79. [Google Scholar]
- ASTM-A6; Standard Specification for General Requirements for Rolled Structural Steel Bars, Plates, Shapes, and Sheet Piling. American Society for Testing and Materials: West Conshohocken, PA, USA, 2011.
- Quayyum, S.; Hassan, T. Seismic performance of a fire-exposed moment-resisting frame. J. Str. Eng. 2018, 144, 04018206. [Google Scholar] [CrossRef]
- Wald, F.; Simões da Silva, L.; Moore, D.B.; Lennon, T.; Chladná, M.; Santiago, A.; Beneš, M.; Borges, L. Experimental behaviour of a steel structure under natural fire. Fire Saf. J. 2006, 41, 509–522. [Google Scholar] [CrossRef]
- Rahnavard, R.; Thomas, R.J. Numerical evaluation of the effects of fire on steel connections; Part 1: Simulation techniques. Case Stud. Therm. Eng. 2018, 12, 445–453. [Google Scholar] [CrossRef]
- Pantousa, D.; Karavasilis, T.; Maraveas, C. Numerical Investigation of the Post-Fire Performance of Steel Columns. Buildings 2022, 12, 288. [Google Scholar] [CrossRef]
- Wang, G.-Y.; Zhang, C.; Xu, J.; Zhang, D.-M. Post-fire seismic performance of SRC beam to SRC column frames. Structures 2020, 25, 323–334. [Google Scholar] [CrossRef]
- Mohebi, B.; Yazdanpanah, O.; Kazemi, F.; Formisano, A. Seismic damage diagnosis in adjacent steel and RC MRFs considering pounding effects through improved wavelet-based damage-sensitive feature. J. Build. Eng. 2021, 33, 101847. [Google Scholar] [CrossRef]
- Taiyari, F.; Formisano, A.; Mazzolani, F.M. Seismic behaviour assessment of steel moment resisting frames under near-field earthquakes. Int. J. Steel Str. 2019, 19, 1421–1430. [Google Scholar] [CrossRef]
- Sadeghi, A.; Kazemi, H.; Mehdizadeh, K.; Jadali, F. Fragility analysis of steel moment-resisting frames subjected to impact actions. J. Build. Pathol. Rehabil. 2022, 7, 26. [Google Scholar] [CrossRef]
- Mazza, F.; Alesina, F. Fragility analysis of RC seismically-isolated structures with residual mechanical properties after fire exposure. Soil Dyn. Eq. Eng. 2019, 121, 383–398. [Google Scholar] [CrossRef]
- Saadatmorad, M.; Talookolaei, R.-A.J.; Pashaei, M.-H.; Khatir, S.; Wahab, M.A. Pearson correlation and discrete wavelet transform for crack identification in steel beams. Mathematics 2022, 10, 2689. [Google Scholar] [CrossRef]
- Ouladbrahim, A.; Belaidi, I.; Khatir, S.; Magagnini, E.; Capozucca, R.; Wahab, M.A. Prediction of Gurson damage model parameters coupled with hardening law identification of Steel X70 pipeline using neural network. Met. Mater. Int. 2022, 28, 370–384. [Google Scholar] [CrossRef]
- ASCE/SEI 7-16; Minimum Design Loads and Associated Criteria for Buildings and Other Structures. American Society of Civil Engineers: Reston, WV, USA, 2017.
- Applied Technology Council. FEMA P-695; Quantification of Building Seismic Performance Factors. Federal Emergency Management Agency (FEMA): Washington, DC, USA, 2009.
- CSI Analysis Reference Manual for SAP2000, ETABS, and SAFE; Computers and Structures, Inc.: Walnut Creek, CA, USA, 2016.
- Sabouniaghdam, M.; Mohammadi Dehcheshmeh, E.; Safari, P.; Broujerdian, V. Probabilistic collapse assessment of steel frame structures considering the effects of soil-structure interaction and height. Sci. Iran. 2022, 29, 2979–2994. [Google Scholar] [CrossRef]
- Lu, J.; Liu, H.; Chen, Z.; Liao, X. Experimental investigation into the post-fire mechanical properties of hot-rolled and cold-formed steels. J. Constr. Steel Res. 2016, 121, 291–310. [Google Scholar] [CrossRef]
- Mazzoni, S.; McKenna, F.; Scott, M.H.; Fenves, G.L. OpenSees Command Language Manual; Pacific Earthquake Engineering Research (PEER) Center: Berkeley, CA, USA, 2006; Volume 264, pp. 137–158. [Google Scholar]
- Mehdizadeh, K.; Karamodin, A. Probabilistic assessment of steel moment frames incremental collapse (ordinary, intermediate and special) under earthquake. J. Str. Constr. Eng. 2017, 4, 129–147. [Google Scholar]
- Ebrahimi Majumerd, M.J.; Mohammadi Dehcheshmeh, E.; Broujerdian, V.; Moradi, S. Self-centering rocking dual-core braced frames with buckling-restrained fuses. J. Constr. Steel Res. 2022, 194, 107322. [Google Scholar] [CrossRef]
- Broujerdian, V.; Mohammadi Dehcheshmeh, E. Locating the rocking section in self-centering bi-rocking walls to achieve the best seismic performance. Bull. Eq. Eng. 2022, 20, 2441–2468. [Google Scholar] [CrossRef]
- Mohammadi Dehcheshmeh, E.; Broujerdian, V. Determination of optimal behavior of self-centering multiple-rocking walls subjected to far-field and near-field ground motions. J. Build. Eng. 2022, 45, 103509. [Google Scholar] [CrossRef]
- Suita, K.; Yamada, S.; Tada, M.; Kasai, K.; Matsuoka, Y.; Shimada, Y. Collapse experiment on 4-story steel moment frame: Part 2 detail of collapse behavior. In Proceedings of the 14th World Conference on Earthquake Engineering, Beijing, China, 12–17 October 2008. [Google Scholar]
- Ramhormozian, S.; Charles Clifton, G.; Latour, M.; MacRae, G.A. Proposed simplified approach for the seismic analysis of multi-storey moment resisting framed buildings incorporating friction sliders. Buildings 2019, 9, 130. [Google Scholar] [CrossRef]
- Department of Homeland Security. Multi-Hazard Loss Estimation Methodology: Earthquake Model; Federal Emergency Management Agency (FEMA): Washington, DC, USA, 2003; pp. 235–260. [Google Scholar]
- Baker, J.W. Efficient analytical fragility function fitting using dynamic structural analysis. Earthq. Spectra 2015, 31, 579–599. [Google Scholar] [CrossRef]
- Mohammadi Dehcheshmeh, E.; Broujerdian, V. Probabilistic Evaluation of Self-Centering Birocking Walls Subjected to Far-Field and Near-Field Ground Motions. J. Str. Eng. 2022, 148, 04022134. [Google Scholar] [CrossRef]


| Steel Type | Temperature (°C) | |||
|---|---|---|---|---|
| 800 | 1000 | |||
| Cooling Method | ||||
| Air | Water | Air | Water | |
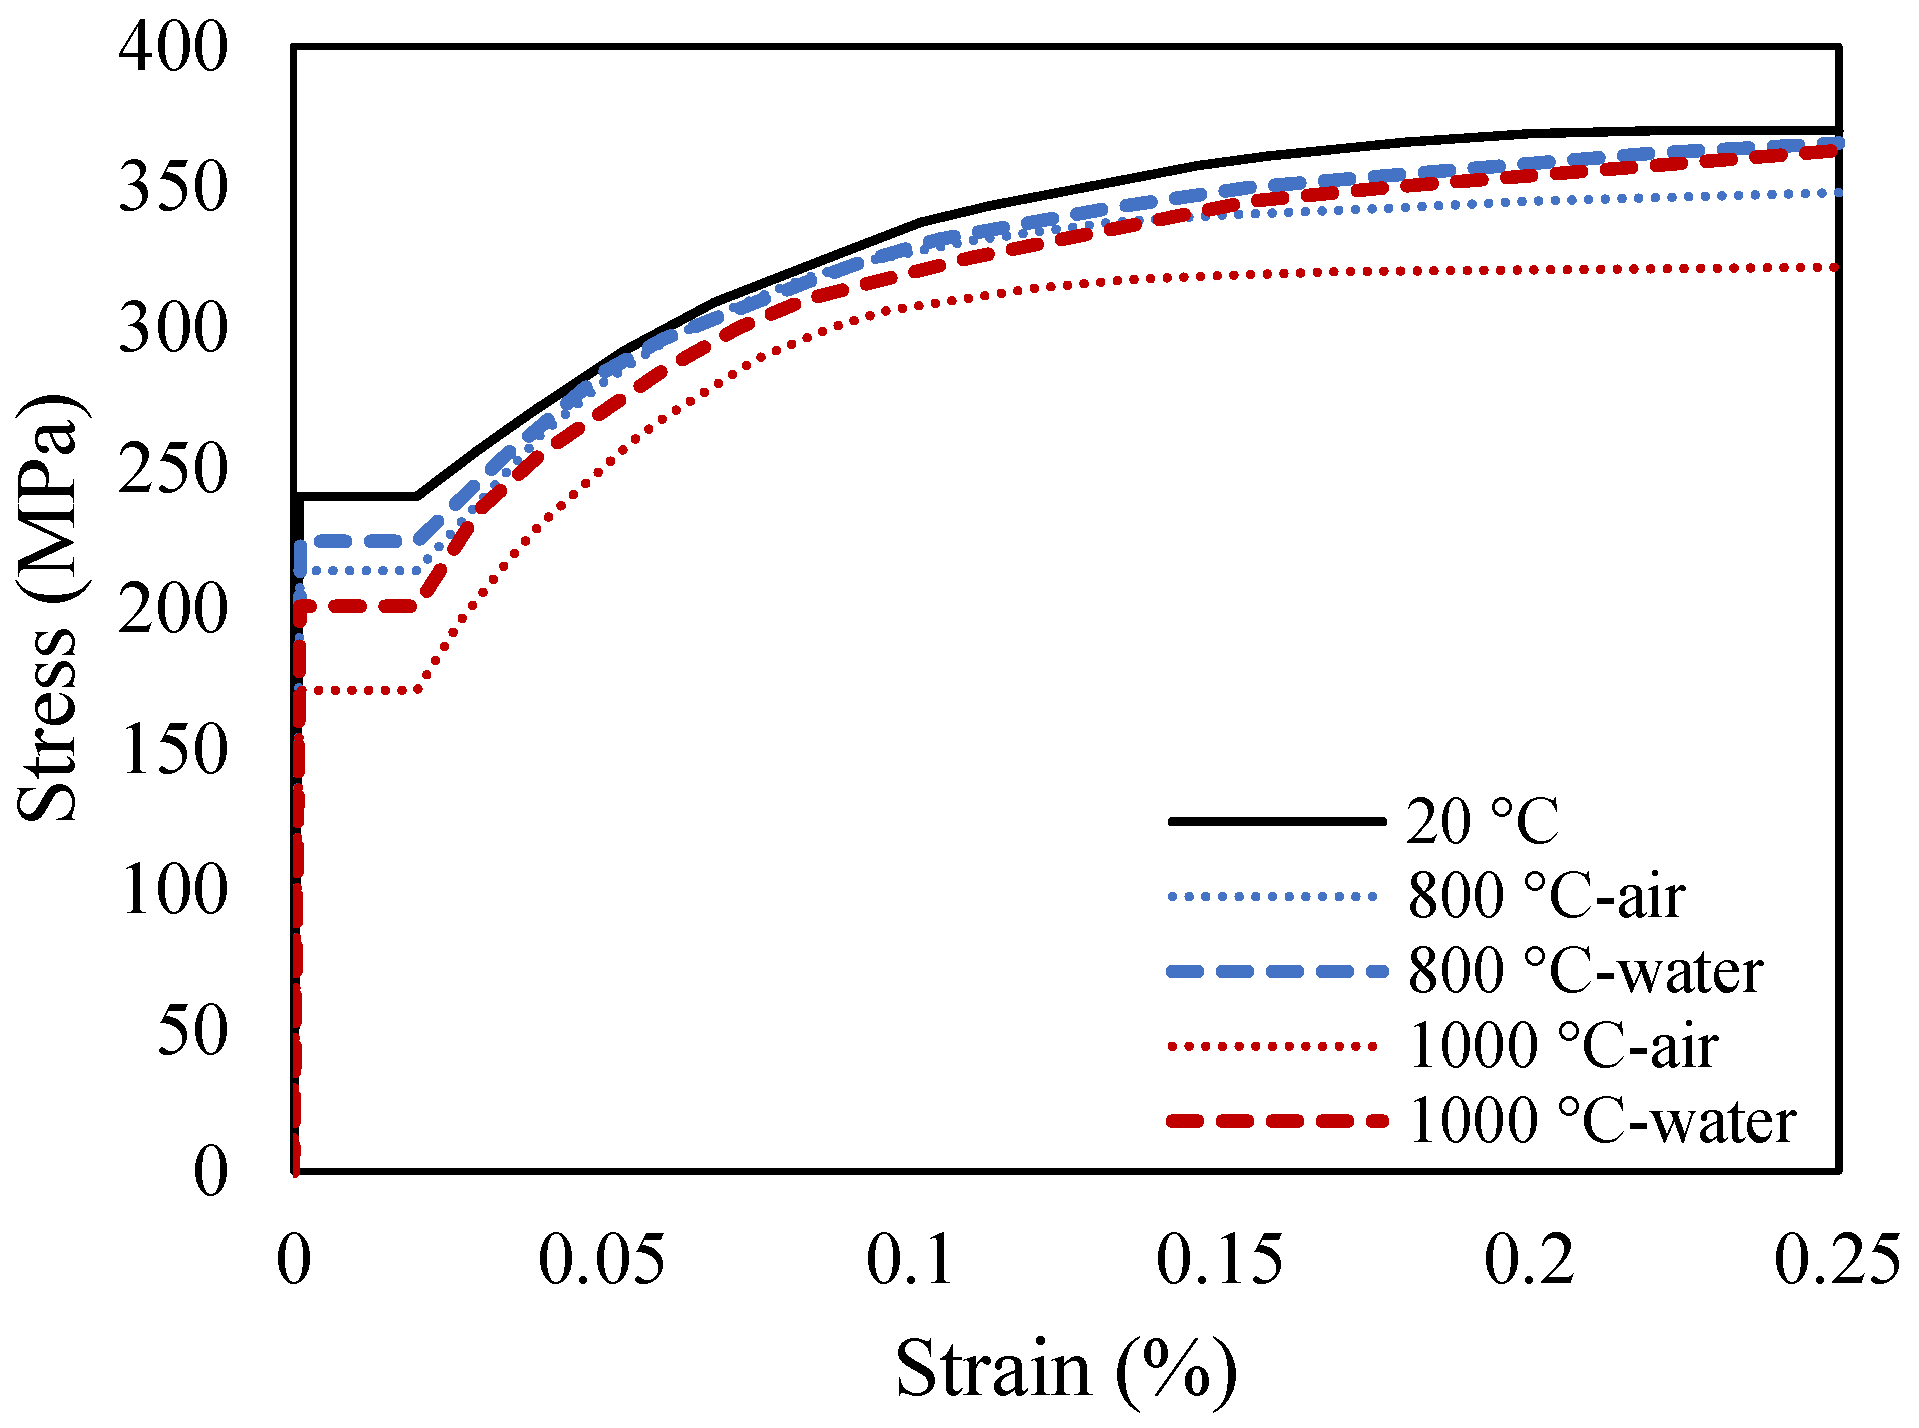
| E (MPa) | 2.0 × 10⁵ | 2.0 × 10⁵ | 1.8 × 10⁵ | 1.9 × 10⁵ |
| fy (MPa) | 213.5 | 224 | 171 | 201 |
| fu (MPa) | 348 | 365.6 | 321.5 | 363 |
| εy (-) | 0.001 | 0.001 | 0.0009 | 0.001 |
| εu (-) | 0.20 | 0.21 | 0.19 | 0.2 |
| εp (-) | 0.19 | 0.16 | 0.18 | 0.13 |
| Structure | Stories Exposed to Fire | Temperature (°C) | |||
|---|---|---|---|---|---|
| 800 | 1000 | ||||
| Cooling Method | |||||
| Air | Water | Air | Water | ||
| 3 | 1st | MRF03-1-800a | MRF03-1-800w | MRF03-1-1000a | MRF03-1-1000w |
| 2nd | MRF03-2-800a | MRF03-2-800w | MRF03-2-1000a | MRF03-2-1000w | |
| 3rd | MRF03-3-800a | MRF03-3-800w | MRF03-3-1000a | MRF03-3-1000w | |
| 1st to 3rd | MRF03-1to3-800a | MRF03-1to3-800w | MRF03-1to3-1000a | MRF03-1to3-1000w | |
| 6 | 1st + 2nd | MRF06-1to2-800a | MRF06-1to2-800w | MRF06-1to2-1000a | MRF06-1to2-1000w |
| 2nd + 3rd | MRF06-2to3-800a | MRF06-2to3-800w | MRF06-2to3-1000a | MRF06-2to3-1000w | |
| 3rd + 4th | MRF06-3to4-800a | MRF06-3to4-800w | MRF06-3to4-1000a | MRF06-3to4-1000w | |
| 4th + 5th | MRF06-4to5-800a | MRF06-4to5-800w | MRF06-4to5-1000a | MRF06-4to5-1000w | |
| 5th + 6th | MRF06-5to6-800a | MRF06-5to6-800w | MRF06-5to6-1000a | MRF06-5to6-1000w | |
| 1st to 6th | MRF06-1to6-800a | MRF06-1to6-800w | MRF06-1to6-1000a | MRF06-1to6-1000w | |
| 9 | 1st to 3rd | MRF09-1to3-800a | MRF09-1to3-800w | MRF09-1to3-1000a | MRF09-1to3-1000w |
| 3rd + 4th | MRF09-3to4-800a | MRF09-3to4-800w | MRF09-3to4-1000a | MRF09-3to4-1000w | |
| 4th to 6th | MRF09-4to6-800a | MRF09-4to6-800w | MRF09-4to6-1000a | MRF09-4to6-1000w | |
| 6th + 7th | MRF09-6to7-800a | MRF09-6to7-800w | MRF09-6to7-1000a | MRF09-6to7-1000w | |
| 7th to 9th | MRF09-7to9-800a | MRF09-7to9-800w | MRF09-7to9-1000a | MRF09-7to9-1000w | |
| 1st to 9th | MRF09-1to9-800a | MRF09-1to9-800w | MRF09-1to9-1000a | MRF09-1to9-1000w | |
| Record Type | PGA (g) | PGV (cm/s) | Distance ** (km) | ||||||
|---|---|---|---|---|---|---|---|---|---|
| Min. | Max. | Ave. * | Min. | Max. | Ave. | Min. | Max. | Ave. | |
| FF | 0.21 | 0.82 | 0.43 | 19 | 115 | 46 | 11.7 | 35.5 | 18.5 |
| NF-Pulse | 0.22 | 0.87 | 0.53 | 29.8 | 169.3 | 98.99 | 3.5 | 10.8 | 6.17 |
| NF-No Pulse | 0.28 | 1.43 | 0.65 | 34.7 | 126.4 | 80.1 | 3.9 | 12.1 | 7.6 |
| Structures | Drift Ratio of Damage State Levels | |||
|---|---|---|---|---|
| S | M | E | C | |
| 3-story | 0.6 | 1.2 | 3.0 | 8.0 |
| 6-story | 0.4 | 0.8 | 2.0 | 5.33 |
| 9-story | 0.3 | 0.6 | 1.5 | 4.0 |
| Scenario | FF (%) | NF-No Pulse (%) | NF-Pulse (%) | ||||||||||
|---|---|---|---|---|---|---|---|---|---|---|---|---|---|
| S | M | E | C | S | M | E | C | S | M | E | C | ||
| 3-story | Initial | 100.0 | 100.0 | 69.7 | 0.4 | 100.0 | 100.0 | 67.6 | 0.5 | 100.0 | 100.0 | 72.7 | 0.6 |
| PF * | 100.0 | 100.0 | 74.14 | 0.77 | 100.0 | 100.0 | 75.19 | 0.87 | 100.0 | 100.0 | 77.53 | 1.44 | |
| 6-story | Initial | 100.0 | 100.0 | 91.4 | 1.4 | 100.0 | 100.0 | 85.5 | 6.4 | 100.0 | 100.0 | 91.2 | 2.4 |
| PF | 100.0 | 100.0 | 91.9 | 2.5 | 100.0 | 100.0 | 89.7 | 7.6 | 100.0 | 100.0 | 93.7 | 5.8 | |
| 9-story | Initial | 100.0 | 100.0 | 99.5 | 7.0 | 100.0 | 100.0 | 98.9 | 5.3 | 100.0 | 100.0 | 88.2 | 2.7 |
| PF | 100.0 | 100.0 | 99.4 | 9.7 | 100.0 | 100.0 | 99.3 | 7.0 | 100.0 | 100.0 | 91.6 | 5.2 | |
| Scenario | FF | % ** | NF-No Pulse | % | NF-Pulse | % | Avg. *** | % | |
|---|---|---|---|---|---|---|---|---|---|
| 3-story | Initial | 1.86 | 2.33 | 1.73 | 1.97 | ||||
| PF * | 1.79 | −3.9 | 2.17 | −7.4 | 1.64 | −5.5 | 1.87 | −5.3 | |
| PFc * | 1.60 | −16.2 | 1.91 | −22.0 | 1.39 | −24.5 | 1.63 | −20.9 | |
| 6-story | Initial | 2.50 | 1.89 | 1.75 | 2.05 | ||||
| PF | 2.34 | −6.8 | 1.82 | −3.8 | 1.65 | −6.1 | 1.94 | −5.7 | |
| PFc | 1.77 | −41.2 | 1.68 | −12.5 | 1.45 | −20.7 | 1.64 | −25.0 | |
| 9-story | Initial | 2.38 | 2.68 | 2.09 | 2.38 | ||||
| PF | 2.30 | −3.5 | 2.52 | −6.3 | 1.99 | −5.0 | 2.27 | −4.8 | |
| PFc | 1.90 | −25.3 | 2.18 | −22.9 | 1.74 | −20.1 | 1.94 | −22.7 | |
Disclaimer/Publisher’s Note: The statements, opinions and data contained in all publications are solely those of the individual author(s) and contributor(s) and not of MDPI and/or the editor(s). MDPI and/or the editor(s) disclaim responsibility for any injury to people or property resulting from any ideas, methods, instructions or products referred to in the content. |
© 2023 by the authors. Licensee MDPI, Basel, Switzerland. This article is an open access article distributed under the terms and conditions of the Creative Commons Attribution (CC BY) license (https://creativecommons.org/licenses/by/4.0/).
Share and Cite
Dehcheshmeh, E.M.; Rashed, P.; Broujerdian, V.; Shakouri, A.; Aslani, F. Predicting Seismic Collapse Safety of Post-Fire Steel Moment Frames. Buildings 2023, 13, 1091. https://doi.org/10.3390/buildings13041091
Dehcheshmeh EM, Rashed P, Broujerdian V, Shakouri A, Aslani F. Predicting Seismic Collapse Safety of Post-Fire Steel Moment Frames. Buildings. 2023; 13(4):1091. https://doi.org/10.3390/buildings13041091
Chicago/Turabian StyleDehcheshmeh, Esmaeil Mohammadi, Parya Rashed, Vahid Broujerdian, Ayoub Shakouri, and Farhad Aslani. 2023. "Predicting Seismic Collapse Safety of Post-Fire Steel Moment Frames" Buildings 13, no. 4: 1091. https://doi.org/10.3390/buildings13041091
APA StyleDehcheshmeh, E. M., Rashed, P., Broujerdian, V., Shakouri, A., & Aslani, F. (2023). Predicting Seismic Collapse Safety of Post-Fire Steel Moment Frames. Buildings, 13(4), 1091. https://doi.org/10.3390/buildings13041091