Article

Effects of Geogrid Reinforcement on the Backfill of Integral Bridge Abutments

by
Visar Farhangi
1,*,
Mehdi Zadehmohamad
2,*,
Armaghan Monshizadegan
2,
MohammadAli Izadifar
2,
Mohammad Javad Moradi
3 and
Hamed Dabiri
4
1
Department of Civil Engineering, Construction Management, and Environmental Engineering, Northern Arizona University, Flagstaff, AZ 86011, USA
2
The Department of Civil and Environmental Engineering, Louisiana State University, Baton Rouge, LA 70803, USA
3
Department of Civil and Environmental Engineering, Carleton University, Ottawa, ON K1S 5B6, Canada
4
Department of Earth Sciences, Sapienza University of Rome & CERI Research Center, P.le Aldo Moro 5, 00185 Roma, Italy
*
Authors to whom correspondence should be addressed.
Buildings 2023, 13(4), 853; https://doi.org/10.3390/buildings13040853
Submission received: 30 January 2023 / Revised: 27 February 2023 / Accepted: 2 March 2023 / Published: 24 March 2023
(This article belongs to the Section Building Structures)

Abstract

:
The construction of integral bridges is one of the most effective methods to reduce bridges’ construction and in-service costs. However, there are associated geotechnical problems with their abutments backfill due to the integrated abutments. The main goal of this study is to evaluate and quantify the benefits of geogrid reinforcement for reducing the backfill’s geotechnical problems. For this purpose, using small-scale physical modeling, the benefits of geogrid reinforcing of the backfill of an integral abutment bridge subjected to cyclic movements are evaluated. The results are then compared with a previous study performed on unreinforced backfill and two types of geocells. In this study, 120 loading cycles are applied to geogrid-reinforced soil to simulate the cyclic loadings on integral abutment backfill due to seasonal abutment displacement. The horizontal reaction load at the top of the wall, changes in pressure behind the wall, and deformation in backfill soil are measured during the test. Then the results are discussed in terms of equivalent peak lateral soil coefficient (Kpeak), lateral earth pressure coefficient (K*), and normalized settlement behind the wall (Sg/H). The derived lateral soil coefficients and settlement behind the abutment show that geogrid substantially reduces pressure and settlements after 120 cyclic loads. Based on the results, Kpeak and K* of the geogrid-reinforced backfill decrease by up to 36%, and Sg/H behind the wall decreases by 62%. In addition, the comparison of the results for geogrid with two geocell types shows that geogrid is more efficient in terms of lateral soil coefficients.

1. Introduction

Recently, many efforts have been made to attenuate pavement- and bridge-associated design and performance problems [1,2,3,4,5,6]. In conventional bridges, the malfunctioning sliding bearings and expansion joints are the main sources of service life costs, primarily due to corrosion problems [7,8,9].
By eliminating the joints between the deck and abutments, corrosion problems in joints/deck and the associated costs of maintenance and replacement would be eliminated. Integral Abutment Bridges are structures with fixed connections between the superstructure and the abutments. The construction of integral bridges (jointless bridges) is one of the most effective methods of reducing construction and service-life costs.
Besides the economic benefits, integral bridges are structurally more resistant to seismic loads than conventional bridges. In the integral bridge design, sliding bearings and joints are eliminated, and the bridge deck is fully integrated with abutments [10,11,12,13]. In addition, integral abutment bridges have many other benefits, such as rapid construction and simpler inspection and maintenance, smaller foundations, and higher structural capacity during floods and earthquakes [14,15,16,17,18,19].
However, the integrated abutment generates a geotechnical problem for the backfill soil. The integrated joints would push or pull abutments during elongation or shortening of the deck due to changes in air temperature [20,21,22,23,24]. As a result, the backfill soil would be subjected to cyclic loading due to daily and seasonal abutment displacement (Figure 1).
This loading would result in two main problems: an increase in soil pressure behind the abutment because of a phenomenon called “soil ratcheting” [25] and excessive settlement behind the abutment despite the small displacements due to the “dual ratchet mechanism” [26].
In order to attenuate these geotechnical problems, researchers have proposed and investigated different methods, such as using lightweight and compressible materials behind abutments and utilization of geosynthetics for backfill soil reinforcement.
The increasing lateral pressures at the backfill during deck elongation will be attenuated by using low stiffness and compressible materials behind abutments [27,28,29,30,31,32,33,34,35]. Carder and Card (1997) studied the applicability of using different elastic-compressible materials, such as geocomposites and polymers to reduce high lateral pressures behind abutments [36]. Horvath (2000b) reports that by using a compressible material as inclusion between the backfill and abutments, the lateral pressures decrease significantly behind the abutments in summers that abutments push the backfill due to deck elongation [11]. Utilization of Expanded Polystyrene (EPS) geofoam as inclusion between abutments and backfill soil has also shown great benefits for backfill soil and bridge structure [37]. Hoppe (2005) reports that EPS inclusion significantly reduces maximum lateral pressures behind the abutments and lessens the backfill settlements to a tolerable level. In addition, the EPS inclusion greatly reduces the vertical pressures from the overlayed granular material and approach slab transferring to the natural soil below it [38]. Al-Qarawi et al. (2020) reported that using EPS geofoam inclusion is effective in alleviating the abutment movement transferred to the approach soil, lowering the lateral pressure on the abutment and reducing the magnitude of approach settlements [20].
Several studies are also performed on using mixed recycled tire materials with soil as low-stiffness compressible material behind integral bridge abutments [39,40]. Zadehmohamad et al. (2021) reported that using recycled tire rubbers behind abutments significantly reduces the backfill pressure and the corresponding lateral earth pressure coefficient. Furthermore, with a reduction in backfill pressures, the associated backfill settlements are attenuated [41].
The other important solution for attenuating geotechnical problems in integral bridge backfill soil is using geosynthetic layers to reinforce the backfill aggregate material, investigated in different research studies. Tatsuoka et al. (2009) studied the performance of the Geosynthetic Reinforced Soil (GRS) integral bridge. They reported that despite the simple construction procedure and low construction cost, GRS integral bridge shows high performance [26]. Monitoring a constructed GRS integral bridge on a high-speed Hokkaido train line shows great performance during service life and imposed seismic loads [42]. Liu et al. (2021b), using a physical model of geogrid-reinforced backfill, reported that the geogrid reinforcements increased the stability of the backfill and minimized the yielded zone [28]. In addition, GRS integral bridges show high dynamic stability during seismic loading [43]. Zadehmohamad et al. (2017) reported that using different geocell layers in backfill soil reduces the backfill pressure and settlements behind abutments [44].
Despite the recent developments of GRS integral bridges, there is insufficient guidance and manuals to help designers for these bridges. In particular, the estimation of reinforced backfill pressure behind abutments is one of the most critical keys in GRS integral bridge design. In addition, in most research on the same topic, the reinforced backfill is a separated system from the integral bridge abutment. This study aims to shed light on the behavior of the connected geogrid-reinforced backfill of integral abutment bridges and compare the geogrid with two types of geocell reinforcement. Moreover, it tries to illustrate the backfill pressure distribution and backfill surface settlement and quantify the benefits of geogrid reinforcement in terms of backfill pressure and settlement. For this reason, a small-scale physical model of geogrid-reinforced backfill behind a wall is subjected to cyclic loading, and the changes in pressure and settlements are measured and evaluated. The results are then compared to unreinforced and geocell-reinforced case studies.

2. Equipment and Materials

The following section describes the modeling setup for performing small-scale cyclic loading on a geogrid-reinforced backfill of an integral bridge. The model measures the backfill pressure and settlement during cyclic loading imposed by a stiff wall rotating on its pind base. The model simulates the applied cyclic displacement of the deck to the top of the abutment due to its yearly elongation and shortening. The abutment displacement is assumed to have only rotational displacement, and the model’s condition is plane-strain.

2.1. Model Box

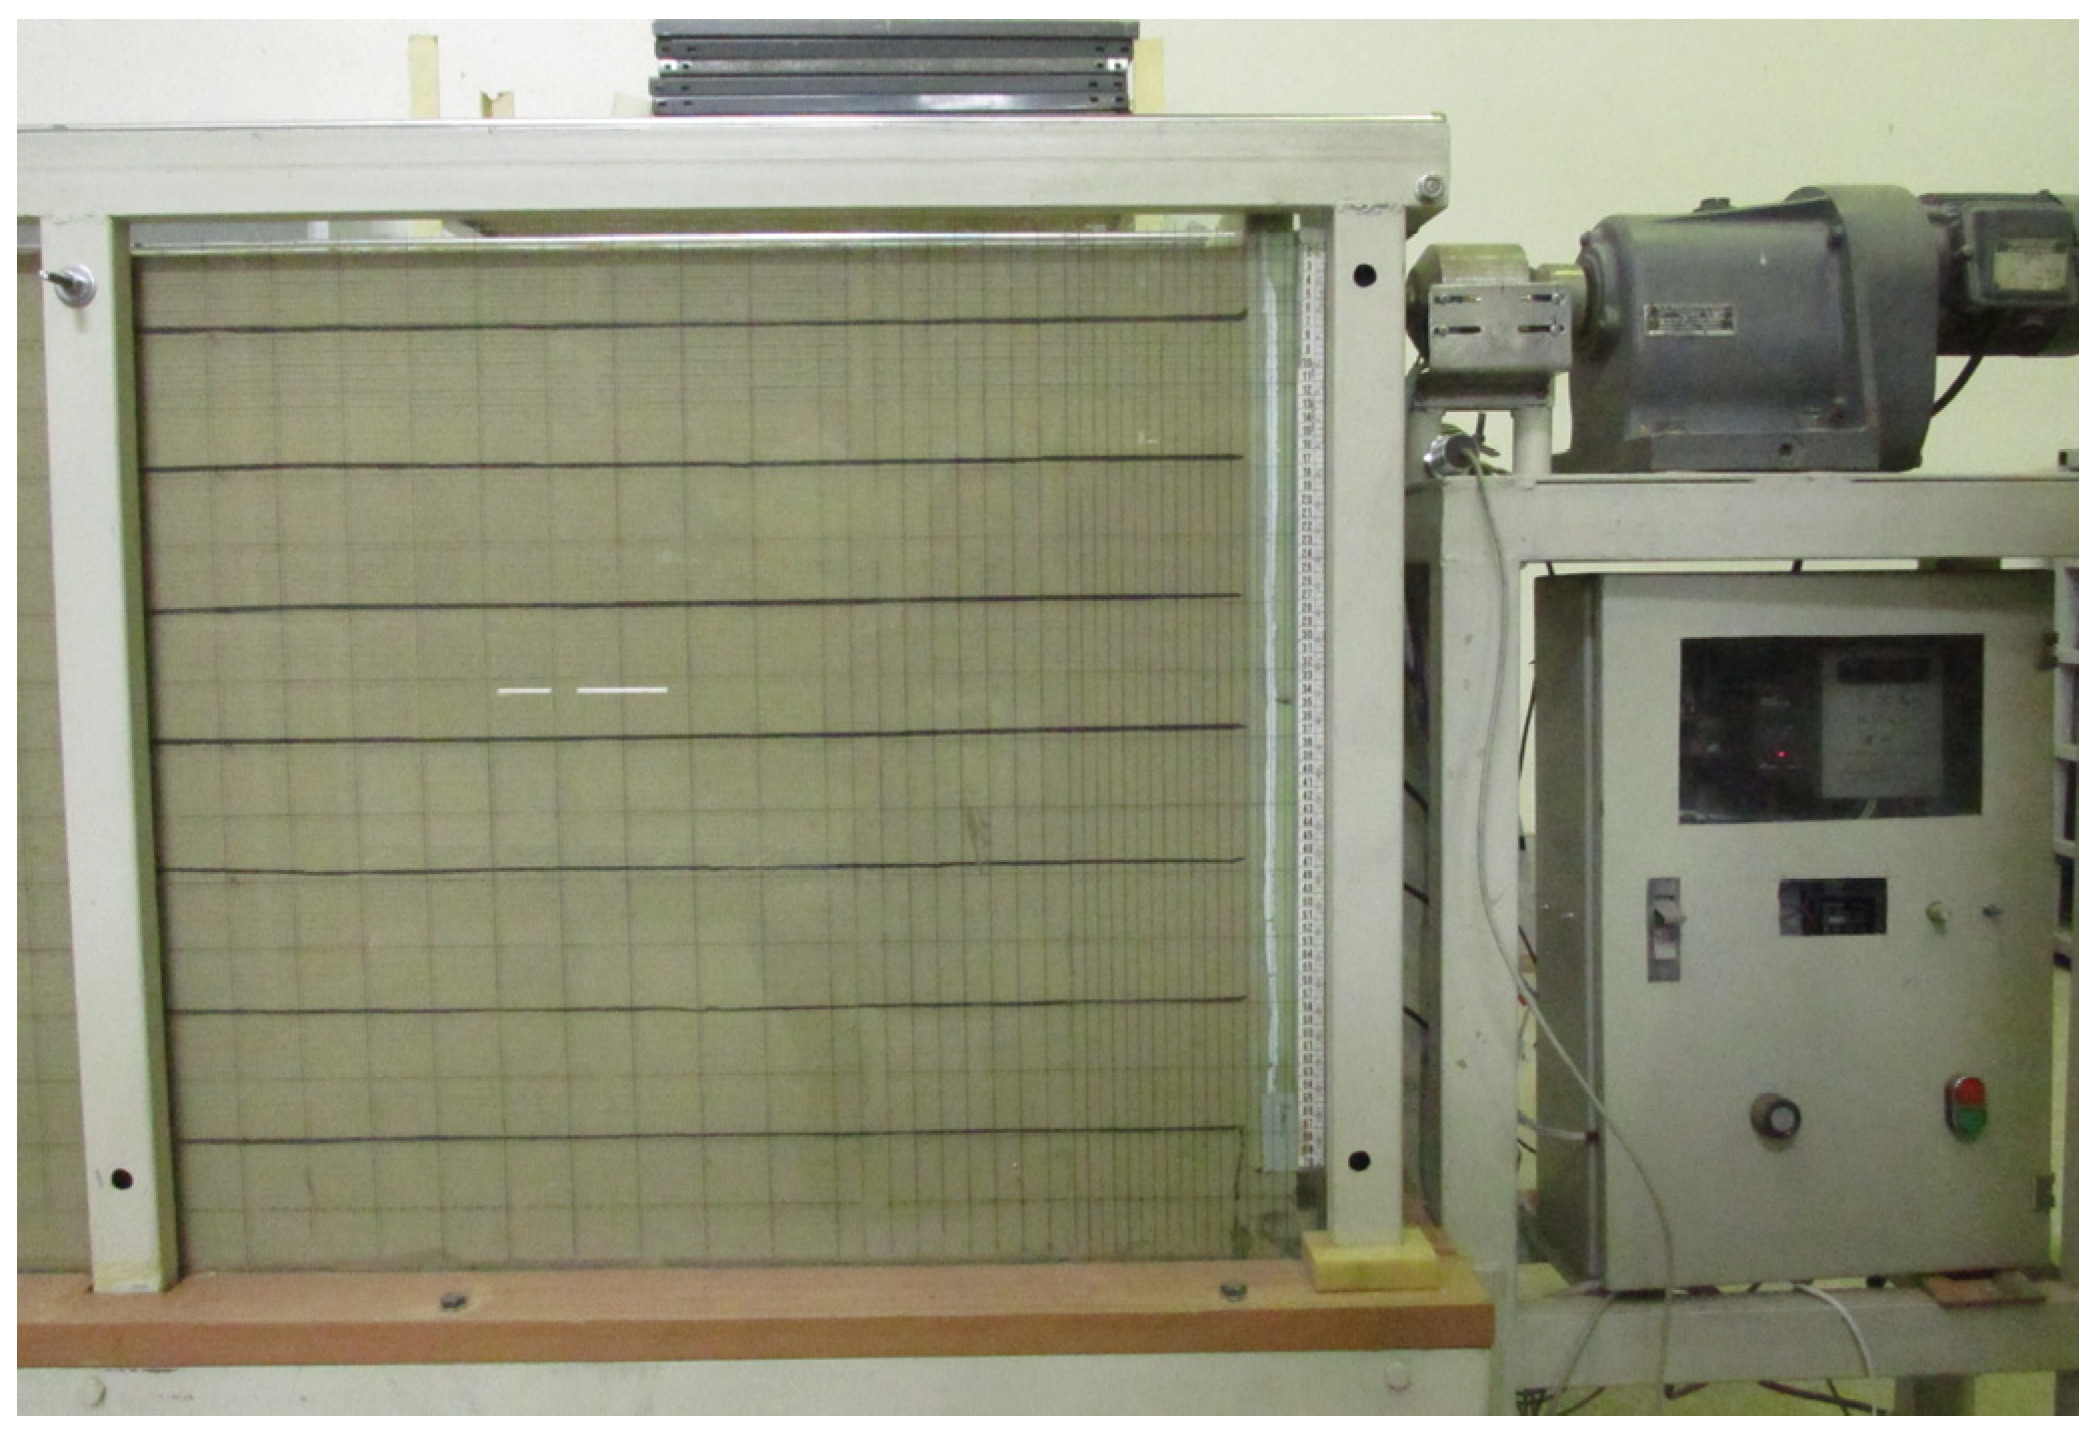
The experimental setup consisted of a modeling box with dimensions of 1.9 × 0.85 × 0.4 m of length, height, and width, respectively. Of the four sides of this box, the two longer sides are made from 10 mm thick glass, which helps to reduce the side friction and observe backfill deformation during the test. The rotating abutment of the box is made of Poly Tetra Fluoro Ethylene (PTFE) Teflon to guarantee the minimum friction angle and enough strength (Figure 2). Steel frames also stiffen the wall to ensure rigid behavior during cyclic displacement [41].
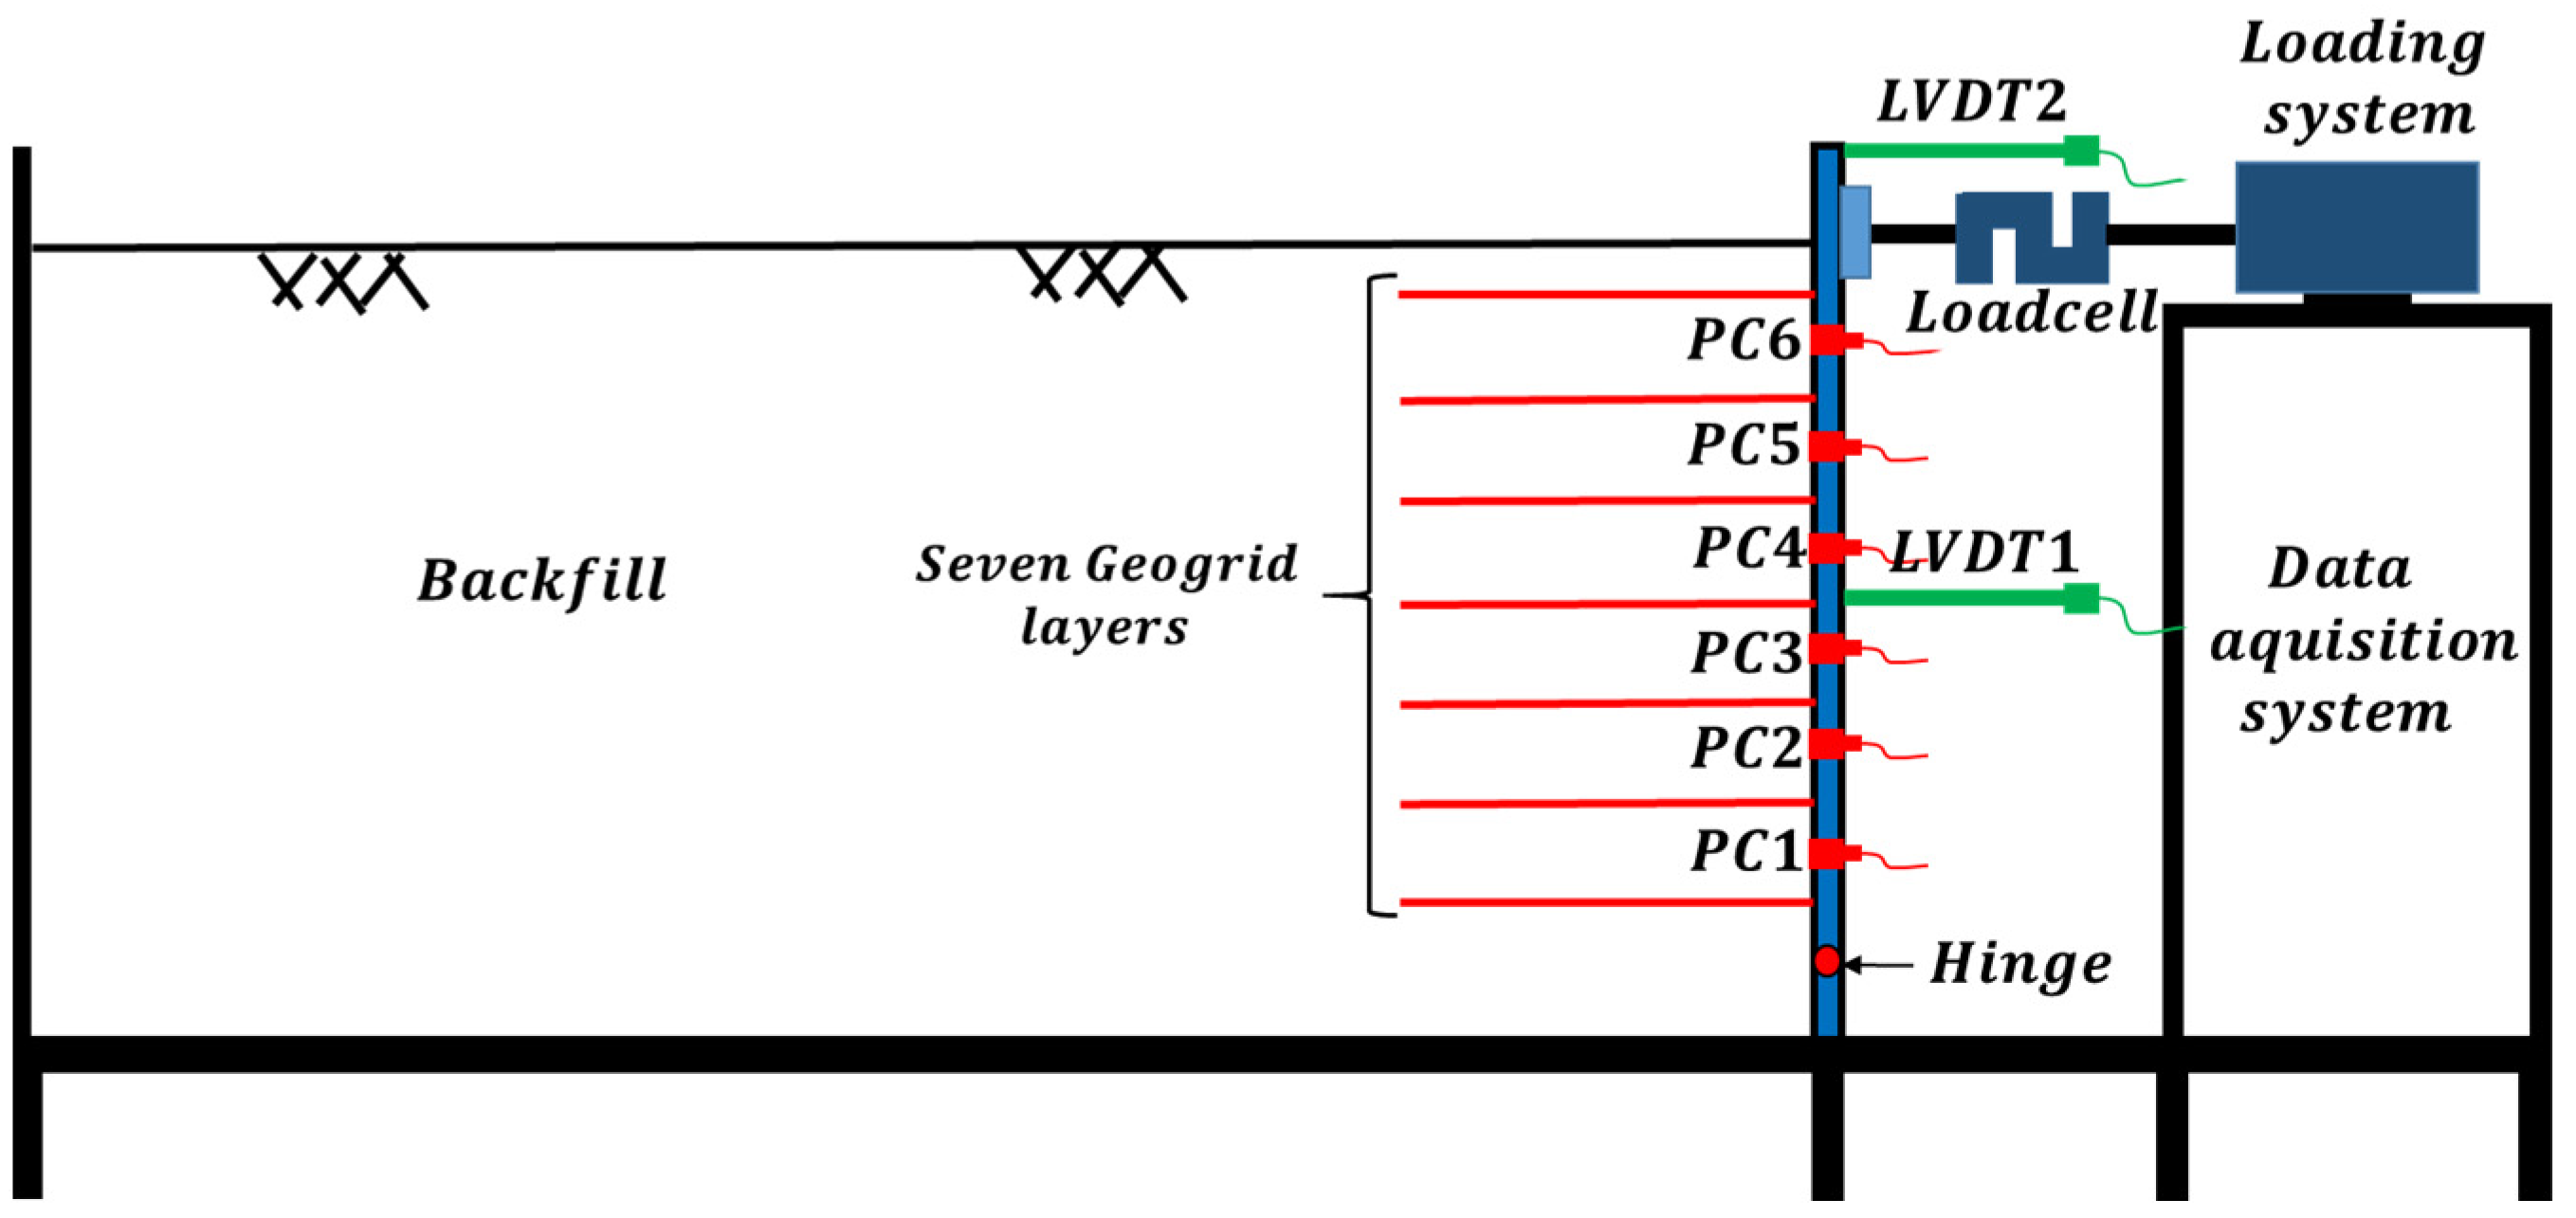
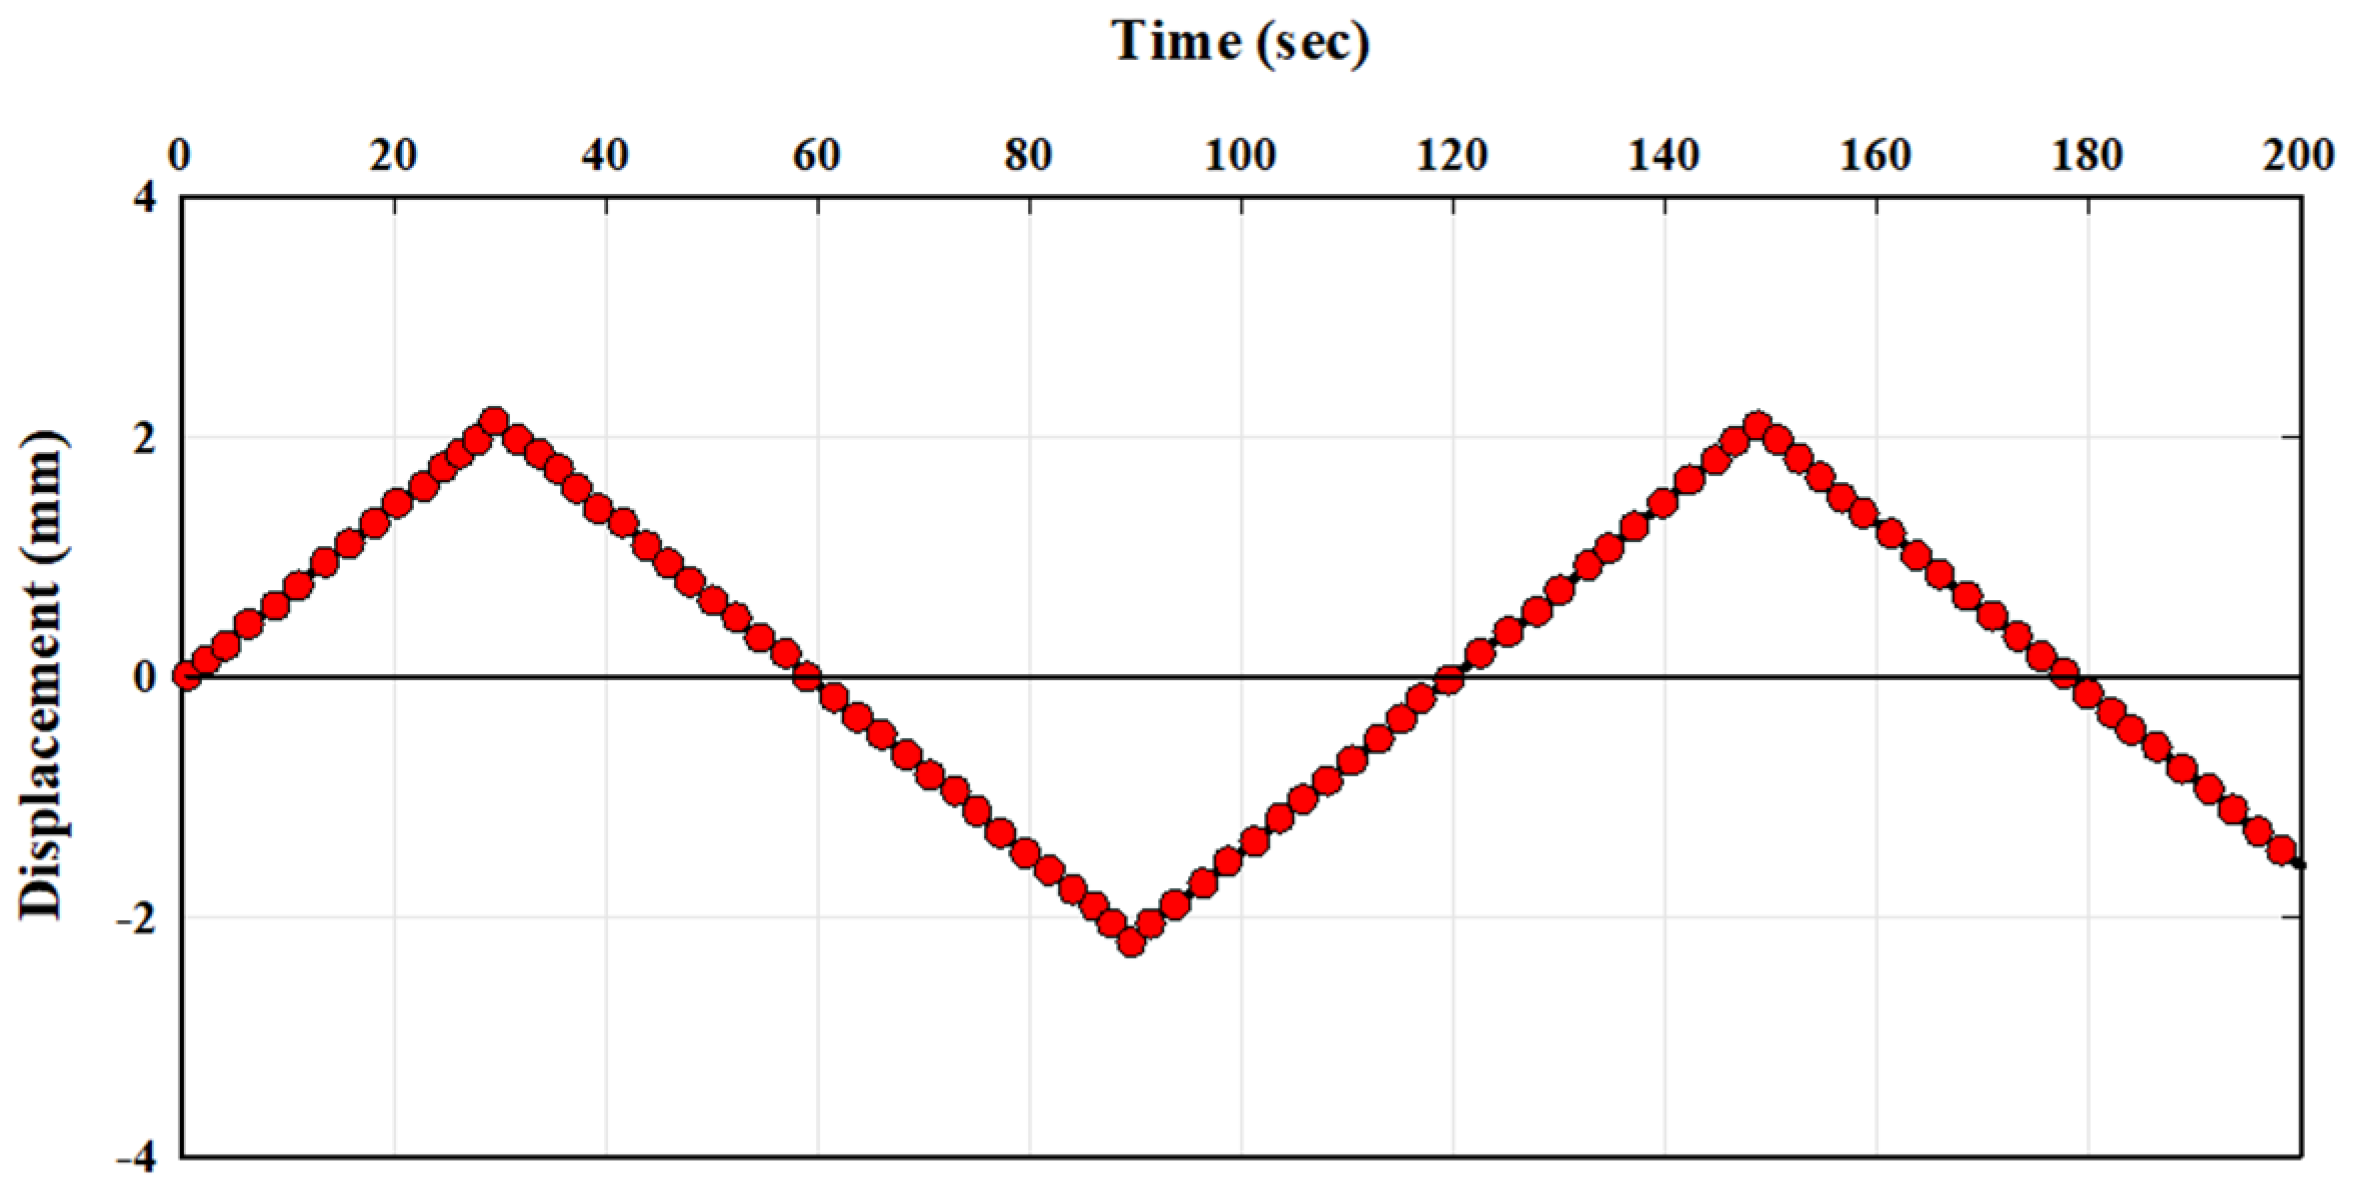
The wall is allowed to rotate about a pin installed 10 cm above the box bottom. The wall is instrumented by six Pressure Cells (PC), two Linear Variable Differential Transformers (LVDT), and one load cell, allowing continuous logging of the measured data during the test (Figure 3). The back-and-forth displacement of the wall with any desired speed is attained by employing an actuator connected to the wall at its top. The amplitude of wall displacement at the top of the wall is 4.2 mm, with a cycle duration of about 120 s. The velocity of wall movement is about 0.07 mm/s, which can be considered a static loading condition.

2.2. Sand Pluviator

In order to have a homogeneous backfill with the desired relative density (RD), a newly designed portable curtain sand pluviator is used to prepare uniform sand layers in the modeling box. The sand pluviator consists of a hopper mounted on a stiff modular frame [45]. An aperture below the hopper allows the sand to pour inside the modeling box when the pluviator is moving on the installed pair of rails on the box.
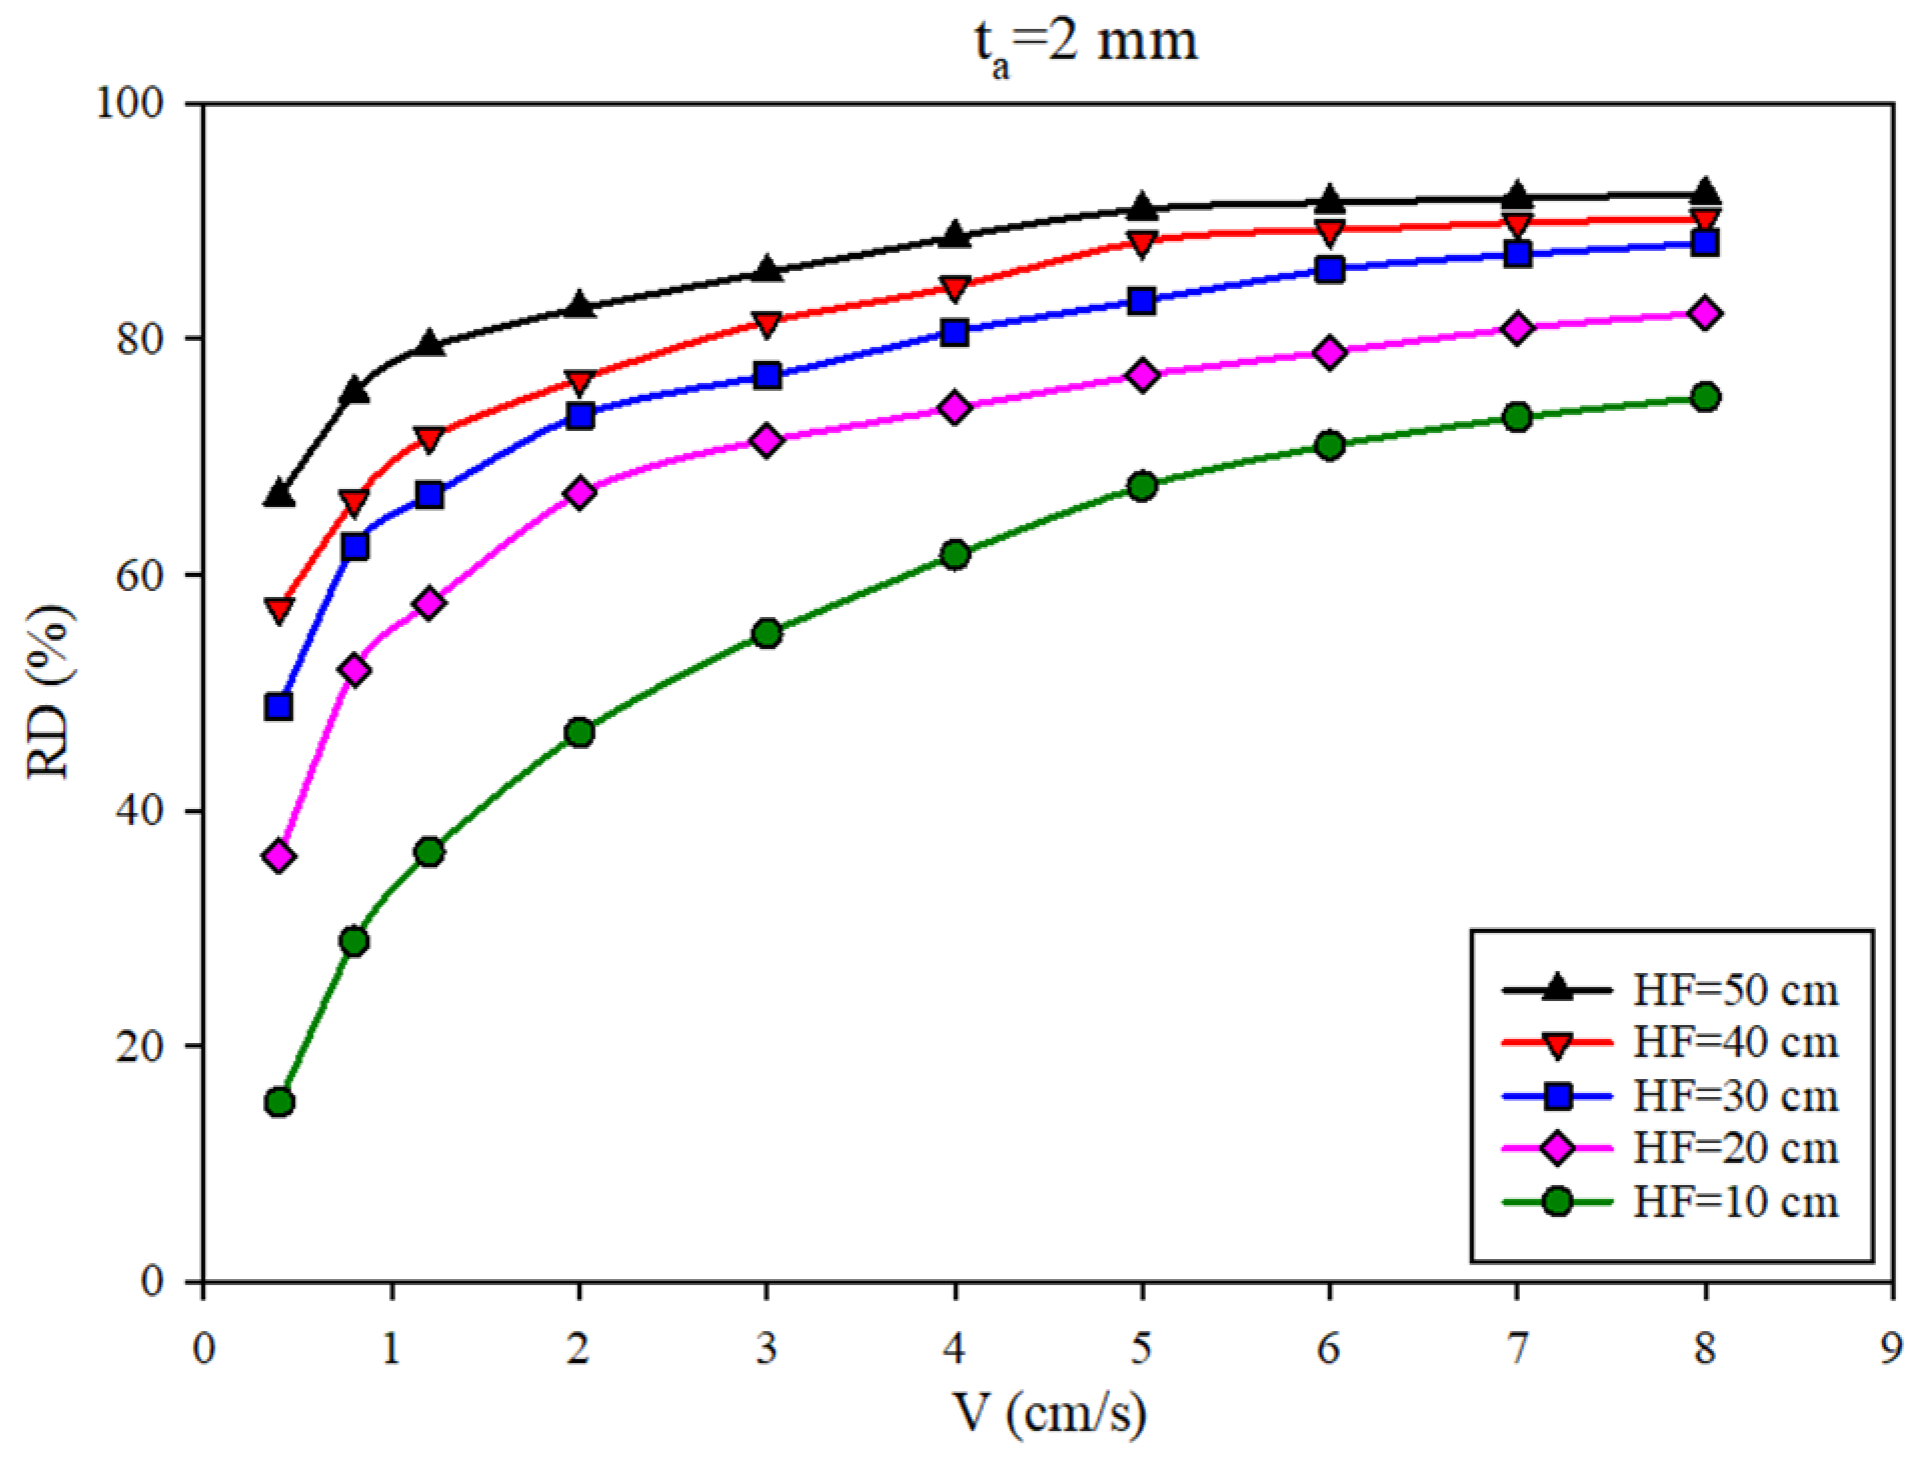
The relative density of sand beds is maintained constant by adjusting the aperture width, the sand height of fall, and pluviator speed. The sand pluviator is capable of reproducing sand beds with a wide range of relative densities between 15% and 90% (Figure 4).
In this study, the relative density of sand layers in the modeling box is chosen to be in dense condition with a relative density equal to 85% (aperture width 2 mm, the height of fall 50 cm, and pluviator speed 4 cm/s).

2.3. Instruments and Measurement

As mentioned before, an actuator is used for wall movements. In order to measure the required horizontal load for wall movement, the actuator is connected to the wall through a load cell. In order to prevent any unintended applied bending moment during wall displacement, the load cell is joined to the wall by using a spherical bearing hinge.
The backfill pressure during wall displacement in active and passive mode is measured using six flat film Pressure Cells (PC) with a resolution of 62.5 Pascals installed at 10 cm intervals from the bottom wall pin (Figure 5). When pressure is applied to this type of pressure cell, the thin-film element undergoes deformation or strain, causing its resistance to change. This change in resistance is proportional to the pressure applied and can be measured and converted into an electrical signal that can be read by a data acquisition system or another electronic device. In addition, two Linear Variable Differential Transformers (LVDT) are installed at the middle and top of the wall to ensure the rigid behavior of the wall during wall rotation. Before the test, instruments are calibrated and connected to an acquisition system that is able to log the measured values with a 1 Hz logging frequency.

2.4. Soil

In the current study, Firoozkooh No.161 sand, a poorly graded sand used at research centers for geotechnical research, is used for model construction. The sand’s characteristics and size distribution are shown in Table 1.

2.5. Geogrid

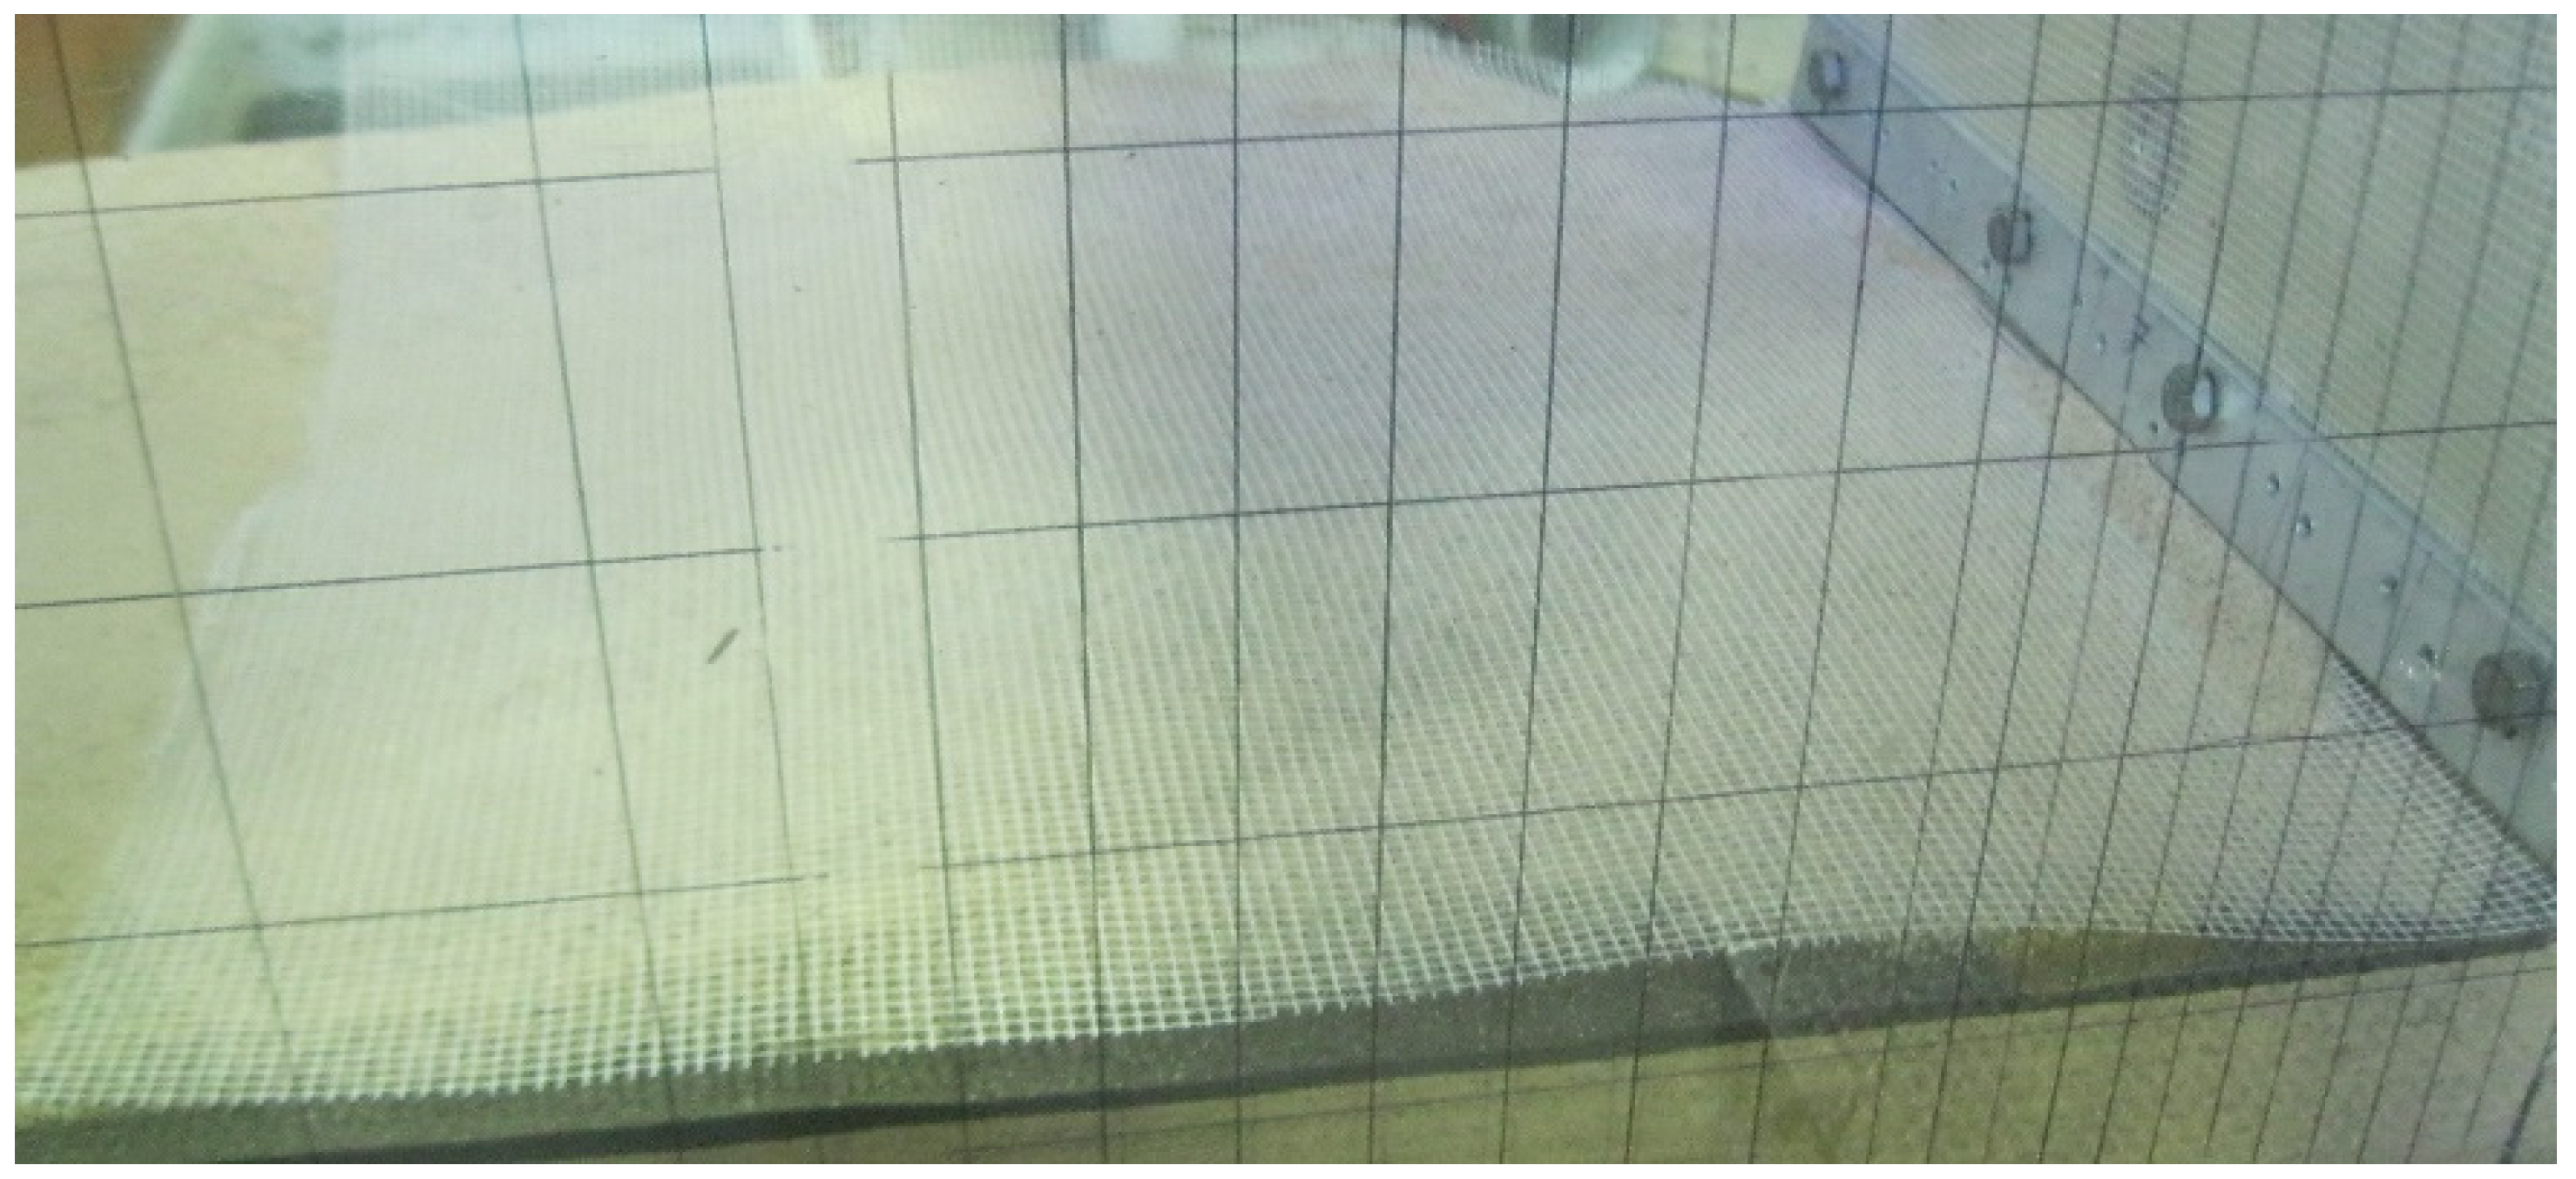
Geogrids are typically manufactured using High-Density Polyethylene (HDPE) materials. HDPE can resist elongation for long periods when subjected to tensile loads. A noncommercial PolyEthylene grid with an aperture diameter of 3 mm was selected as the model geogrid, based on   π 7 dimensionless factor in accordance with a medium-stiff geogrid with a tensile strength of 52 kN/m (Figure 5). The tensile strength of the model geogrid based on ASTM D4595 is 1.02 kN/m.

3. Model Similarity of Law

In order to derive governing parameters in the model, the low-speed cyclic loading condition in the present study can be considered static loading. The governing parameters for the rigid abutment of an integral bridge with a geogrid-reinforced cohesionless backfill subjected to a cyclic displacement at its top are as shown in Equation (1):
f     ρ , g , E s , υ , Φ , H , D , δ , L , T = 0
where ρ is the soil density, g is the gravity acceleration, E s is the soil elastic modulus, υ is the soil Poisson ratio,   Φ is the soil internal friction angle, H is the height of backfill, D is the distance between geogrid layers, δ the wall displacement at one cycle at the top of the wall, L is the geogrid length, and T is the geogrid tensile strength.
Based on Buckingham’s Theorem, a homogeneous equation can be reduced to the correlation between sets of dimensionless products. The study on the problem then would be performed on the dimensionless products through dimensional analysis, which has great importance in geotechnical physical modeling studies.
In this study, three parameters of ρ , g , and H are chosen as basic parameters. Based on the selected parameters, seven dimensionless π factors are obtained as Equation (2):
π = f π 1 , π 2 , π 3 , π 4 , π 5 , π 6 , π 7
where π 1 = E s ρ g H , π 2 = υ , π 3 = δ H ,   π 4 = Φ ,   π 5 = D H ,   π 6 = L H ,   π 7 = T ρ g H 2 .
The selection of governing parameters and dimensionless π factors through dimensional analysis is an important aspect of geotechnical physical modeling studies. While it may not always be possible to set prototype identical π factors in small-scale models, it is crucial to identify and keep equal the most important π factors that affect the behavior of the system. For small-scale geotechnical physical models, it is not always possible to set prototype identical π factors. As a result, based on the characteristics of the problem, the most important π factors on the problem behavior are selected to keep it equal for both the model and prototype. The closeness of parameters between the model and prototype can vary depending on the characteristics of the problem, and careful analysis is necessary to ensure that the critical parameters are appropriately addressed. By taking these steps, one can have confidence in the accuracy and applicability of the model for predicting the behavior of the full-scale system. Table 2 shows the values of   π 7 based on the strength of the model and prototype geogrid, which is the most important dimensionless π factor in the current problem. Considering the dense state of soil in models, π 1 ,   π 2 and π 4 in the models and prototype are almost equal. Parameters π 3 ,   π 5 , and   π 7 also can be very close in the model and prototype based on the geometry and design characteristics of the geogrid reinforcement numbers and length behind the abutment.

4. Test Program and Model Preparation

A physical model of geogrid-reinforced backfill behind the rotating abutment of an integral bridge is constructed and tested during this study. The assumed lifespan for a typical integral bridge is 120 years. The backfill would be subjected to at least 120 cyclic displacements throughout its lifetime due to the seasonal elongation and contraction in summer and winter seasons, with an amplitude that depends on deck expansion coefficient, deck length, and changes in temperature throughout the year. Seven layers of geogrid with a length of 35 cm are connected to the wall at 10 cm intervals (Figure 6). Based on the model similarity of law, the model simulates a prototype wall of about 5 m [44]. The selected spacing (10 cm) would resemble a spacing of about 60 cm between geogrid layers. Based on the magnitudes considered for abutment displacement in previous research, the normalized displacement of the wall at its top was adopted to be δ / H = 0.6% (4.2 mm) [25,26,46]. The test is displacement control, and the first cycle started with the passive side by the movement of the wall toward the backfill soil (Figure 7).
As discussed before, the sand exits from the pluviator in a curtain shape and lays in thin horizontal layers inside the box. When the height of sand reaches the elevation of a geogrid layer, the pluviation is stopped, and the geogrid layer is placed at its location and tightly connected to the wall with the help of an aluminum strip (Figure 8). Then the rest of the geogrid layer (15 cm) rounds up to the backfill after 7 cm of sand pluviation.
In order to detect possible slip lines and measure vertical settlement in the backfill soil, layers of thin horizontal black sand are used adjacent to the glass wall in 10 cm intervals. The settlements behind the wall are measured by using a mesh drawn on the sidewall from photographic images.

Lateral Soil Pressure Coefficients

The lateral soil coefficient is the horizontal and vertical pressure ratio on a soil element in its natural state or behind retaining walls. In geotechnical engineering, there are three well-defined lateral soil coefficients behind a retaining wall: passive, active, and at rest. These coefficients are used in problems based on the relative movement of the wall and backfill soil. The at-rest coefficient is used when there is no relative movement between the wall and backfill. The passive and active coefficients are used when the wall moves toward or backward from the backfill. These two values can be obtained from limit analysis based on the large wall movements and are theoretically the upper and lower bound of the lateral earth pressure. The abutment movements of an integral bridge toward and backward from the backfill are not large enough to be considered upper or lower bounds. However, the cyclic nature of movements followed by a phenomenon called the “dual ratchet mechanism” makes it challenging to choose a design earth pressure coefficient for the backfill of integral abutments.
These measurements would help derive lateral soil coefficients in this study: pressure cells and load cell readings. Using the pressure cells’ readings at wall height by six pressure cells (PCs), the changes in lateral backfill pressure are measured continuously during wall movements. The maximum lateral pressure ( σ h m a x ) during 120 cycles measured by each PC is then normalized to its initial vertical stress (σv0), which gives the value of ‘lateral earth pressure coefficient’ (K*) at each depth (Equation (3)).
K * = σ h m a x   σ v 0
The measurements of the load cell represent the deck’s internal reaction force during wall movements. The equivalent lateral earth pressure coefficient (Keq) is then calculated based on the measured force by using moment equilibrium about the pin (Equation (4)), assuming that lateral soil pressure distribution is triangular (Figure 9).
K e q = 6 P   γ H 2
where P is the lateral load measured by the load cell during movements, H is the soil height above the pin, and γ is the unit weight of the dry soil (15.93 kN/m3).

5. Results and Discussion

In the following section, the results derived from this study are evaluated and compared with the results obtained in previous research on the unreinforced backfill and reinforced backfill models with two types of geocell reinforcement. The geocells are made of cardboard due to the model similarity law. The arrangement of the geogrid reinforcement (length and number of layers) is considered similar to the geocell reinforcement for better comparison. In the previous research, two types of honey-shaped and square-shaped geocells were evaluated for reinforcement and showed great benefits in lateral pressure and settlement behind abutment [44].
These results are evaluated and compared in terms of equivalent lateral earth pressure coefficient (Keq), lateral earth pressure coefficient (K*), and normalized settlement at the backfill surface (Sg/H) behind the wall.

5.1. Equivalent Lateral Earth Pressure Coefficient (Keq)

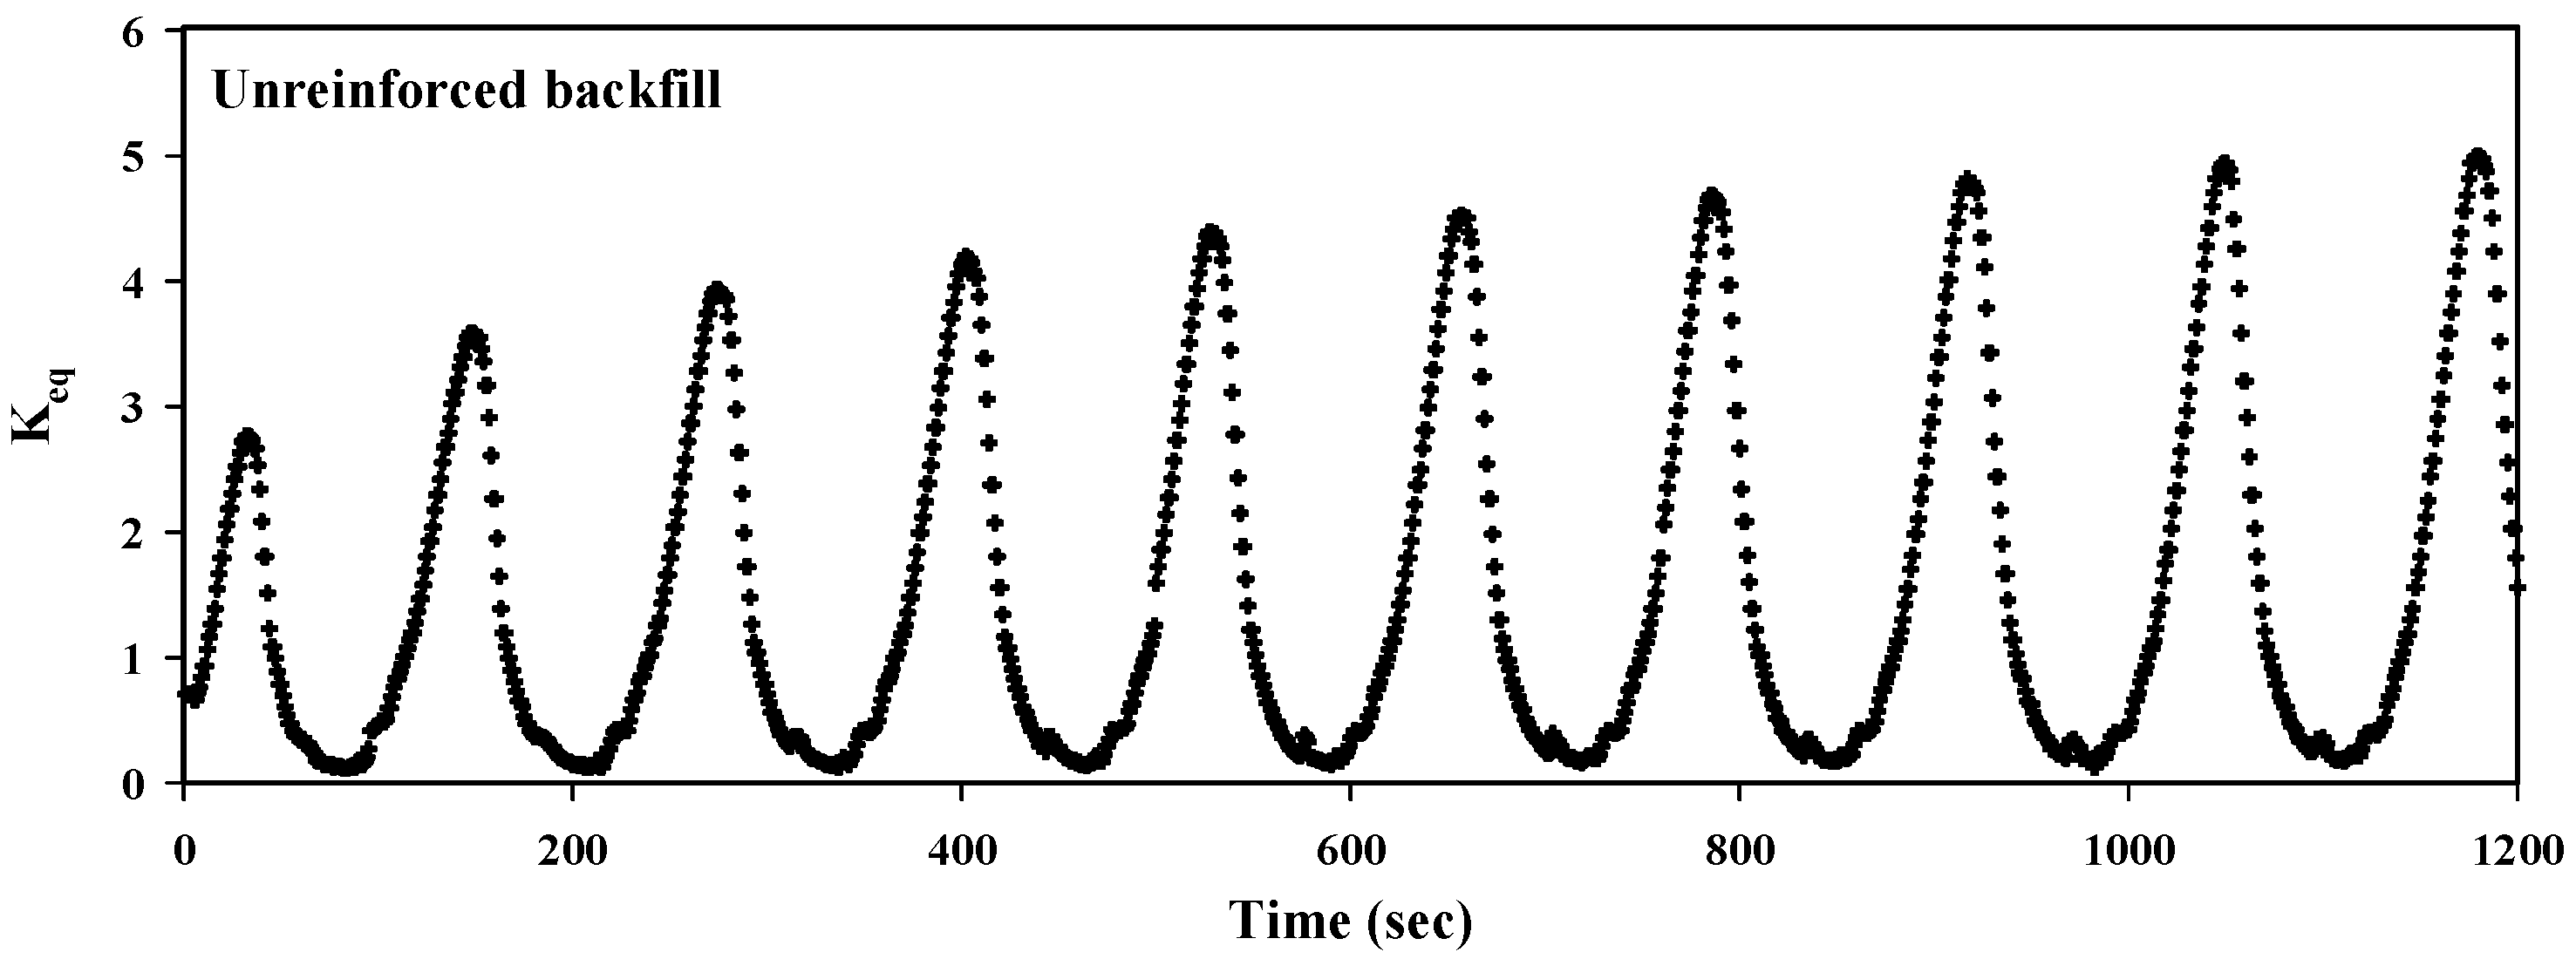
As mentioned before, the load cell measured the required force for the wall displacement on passive and active movements during the test. Figure 10 illustrates the changes in Keq versus elapsed time during the unreinforced backfill test. As shown in Figure 10, the value of Keq in a loading cycle reaches a maximum point in passive mode. After the maximum point, Keq decreases to its minimum value, which remains constant during loading cycles. The maximum value of Keq increases with an increase in cycles. The rate of increase in Keq maximum values (Keq,max) for the first 20 cycles is high; however, the increase in rate slows down toward the end of cycles, suggesting an asymptotic value for Keq,max.
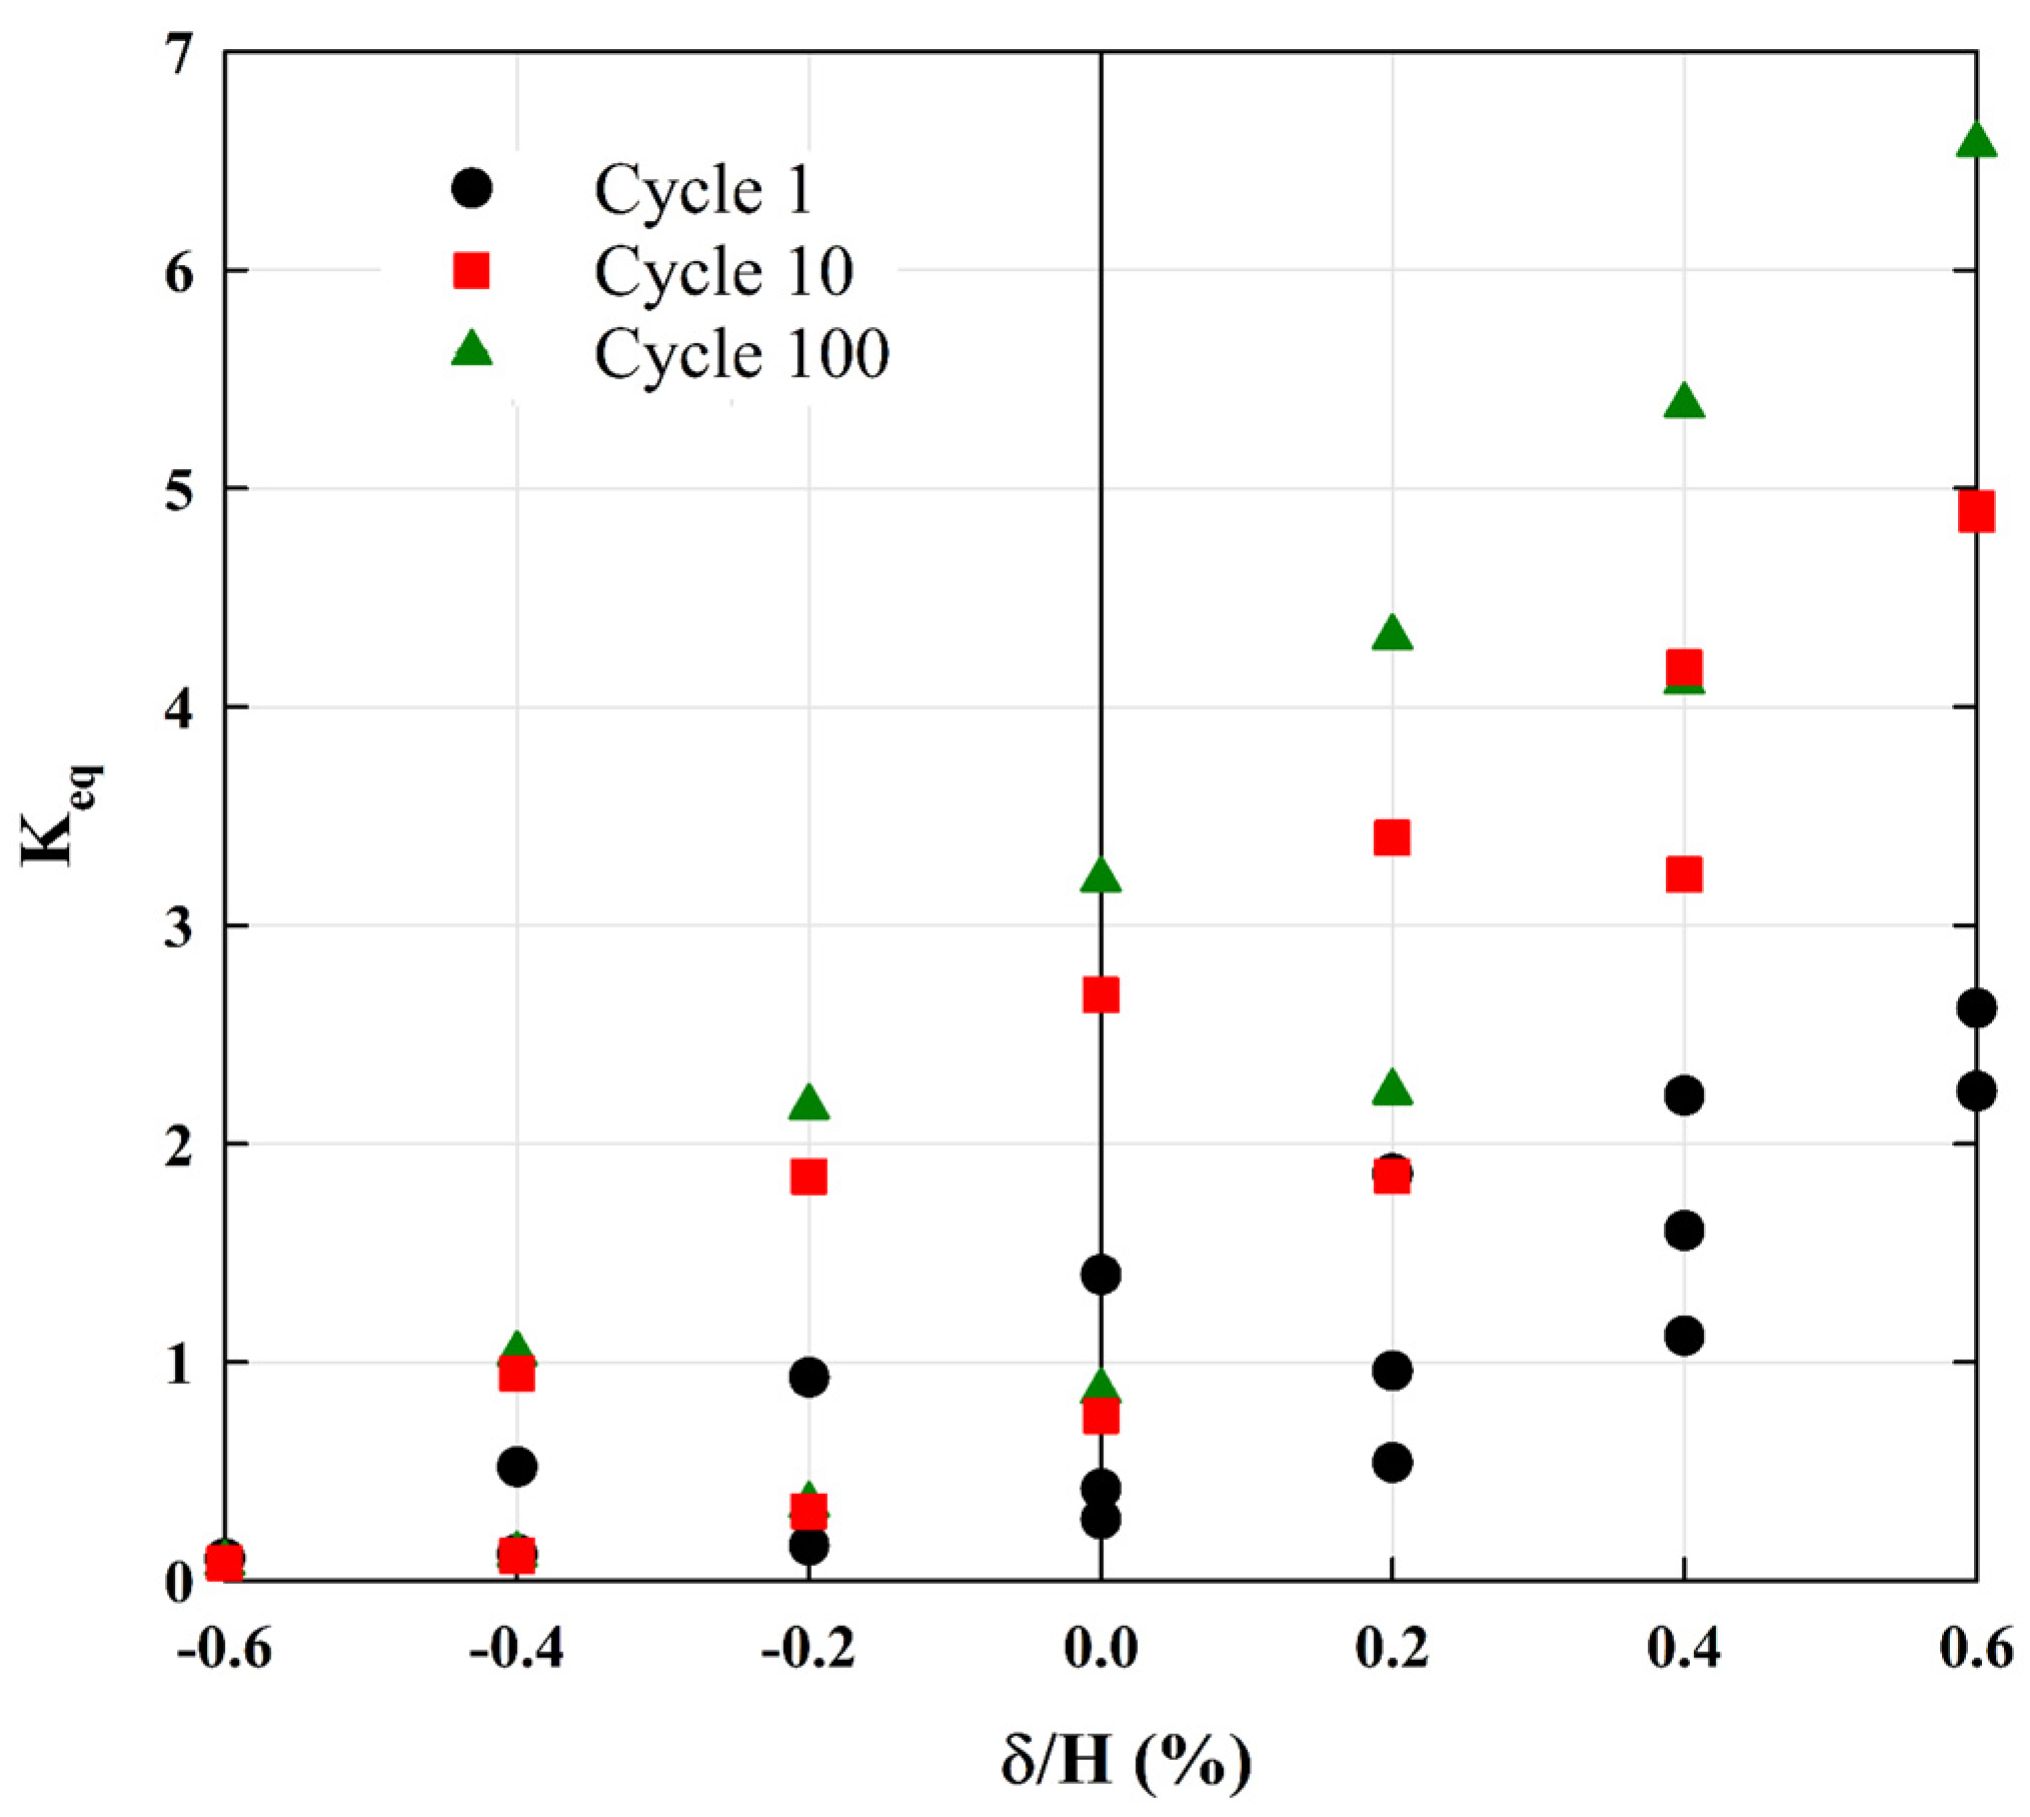
The changes in Keq versus horizontal displacement of the unreinforced model for the first and last cycles are shown in Figure 11. The variation in Keq values shows a linear increase during the passive mode due to the incremental formation of the passive zone behind the abutment. However, in the active mode, the Keq values drop sharply due to shear zone formation, which is the cause of the nonlinear changes of Keq in this mode.
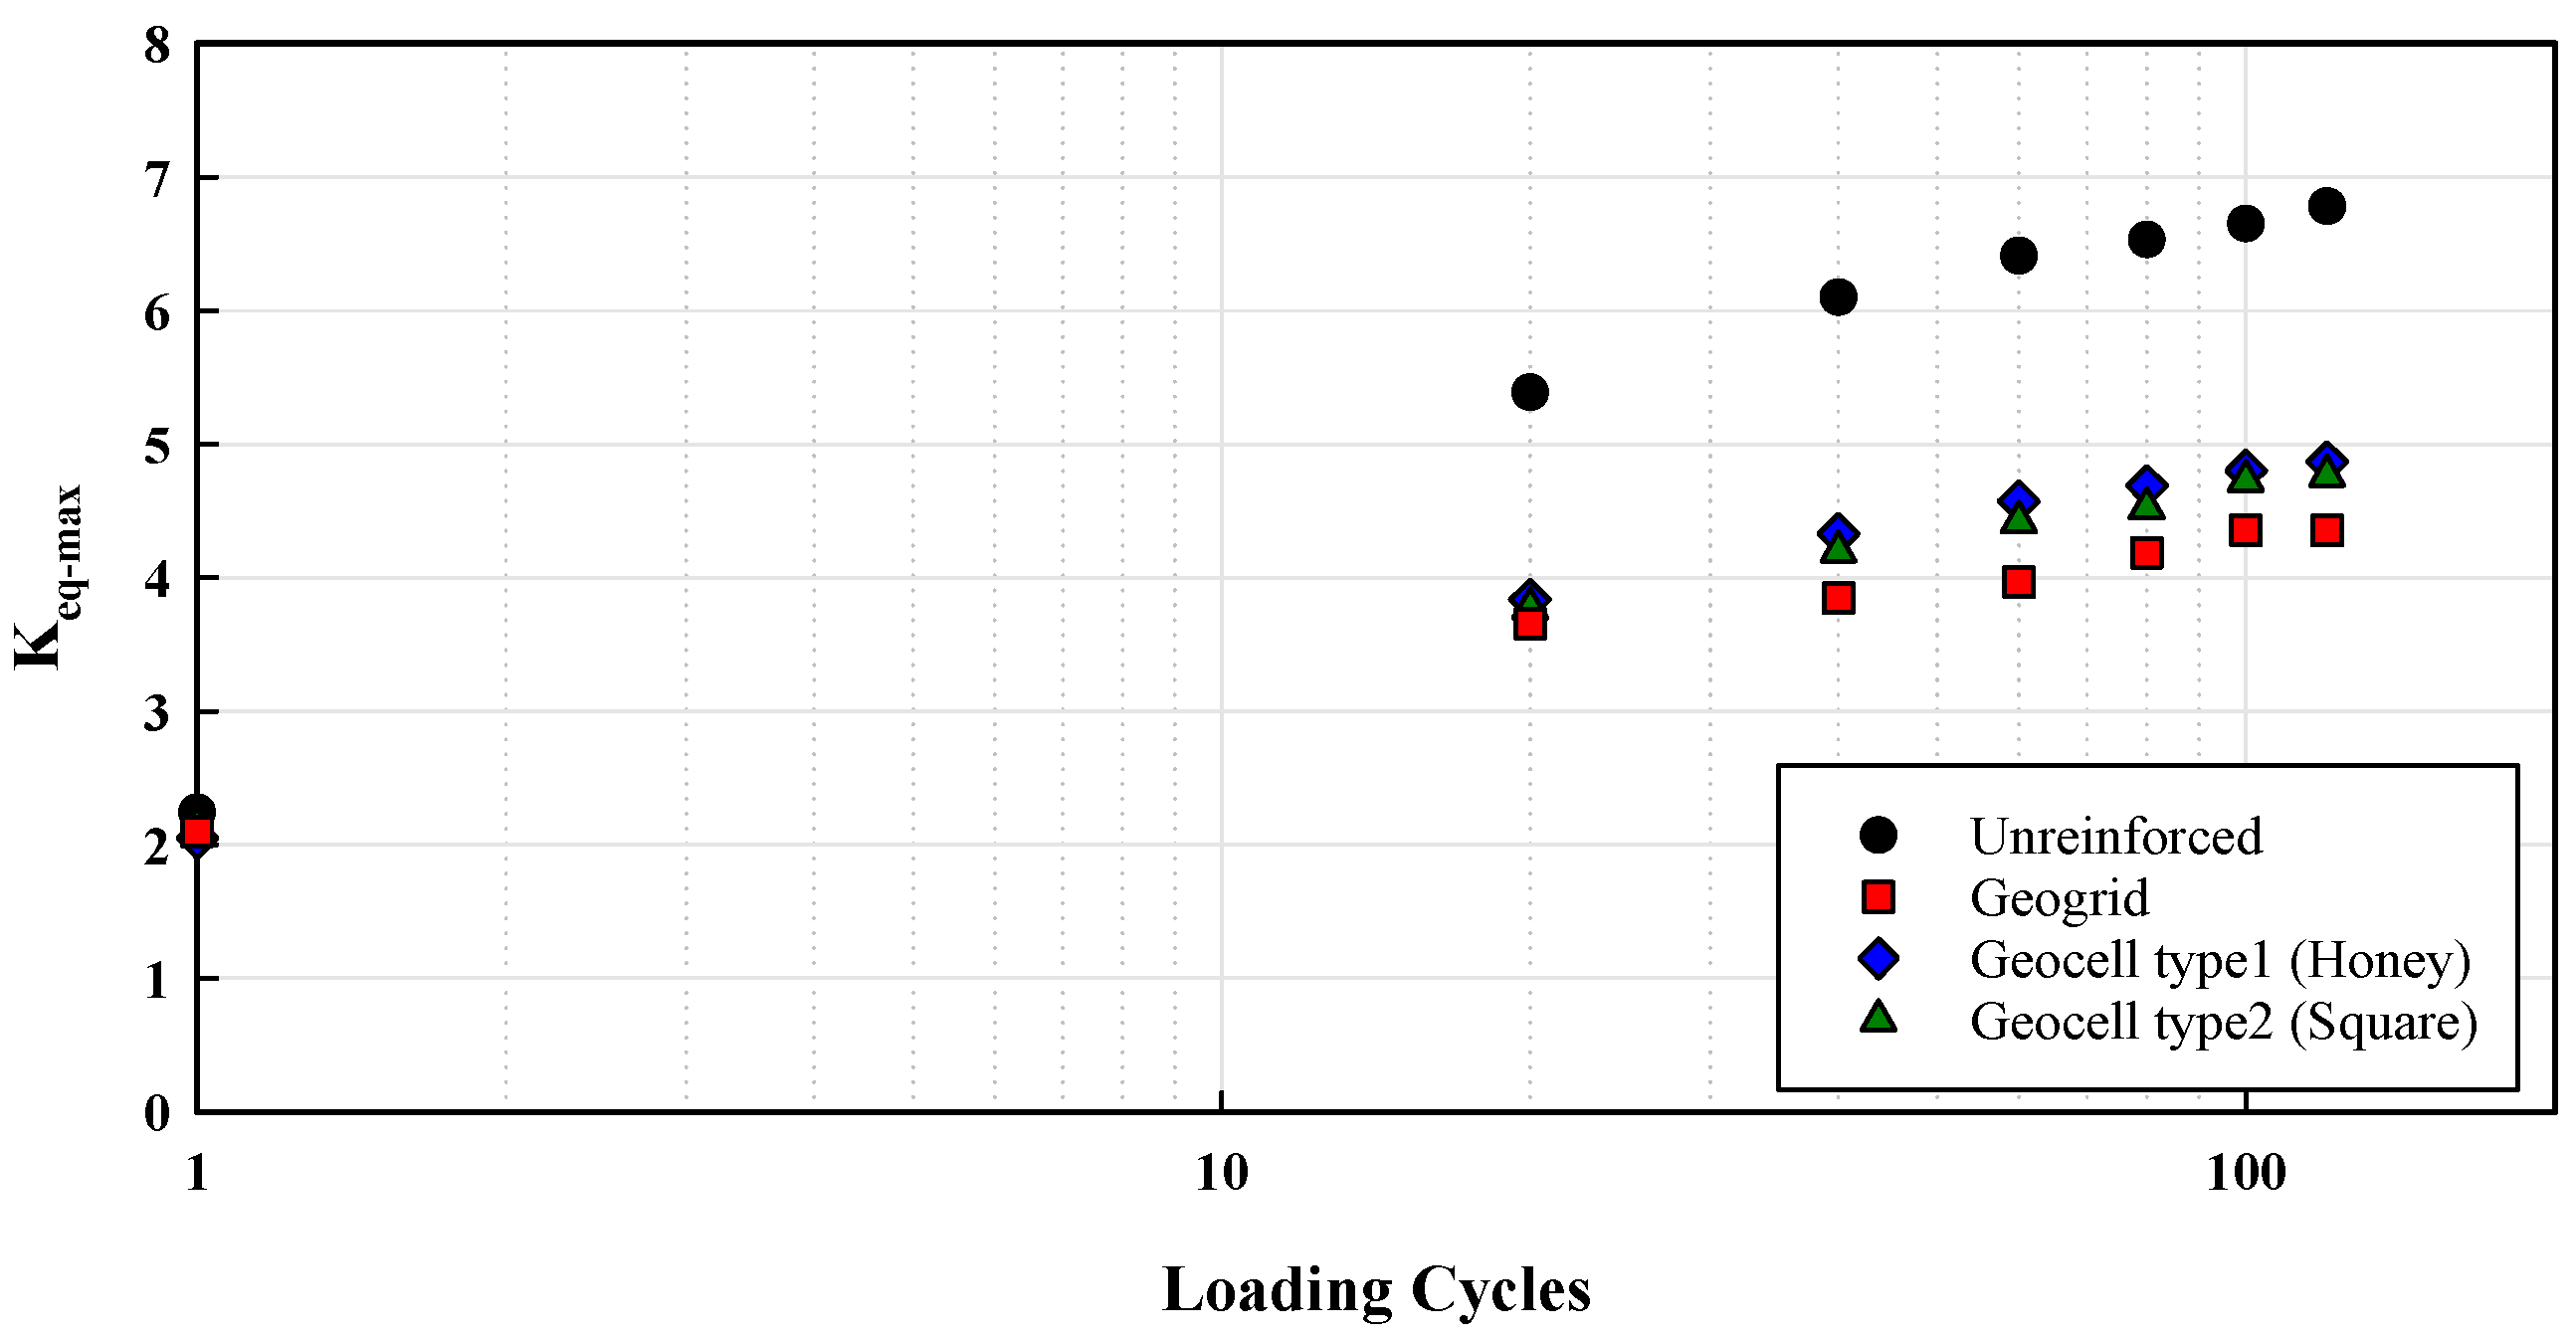
The evolution of the maximum equivalent lateral earth pressure coefficient (Keq,max) during loading cycles of four tests is compared in Figure 12. For all tests, it is evident that Keq,max increases during cycles, with a high rate of increase in the first 20 cycles. The results show that geogrid reinforcement decreases the Keq,max after 120 cycles, by about 36%. In addition, the Keq,max for the geogrid case is stabilized after a point, while for the unreinforced case, it shows an increase until the end of cycles. The comparison between geogrid and two types of geocell shows that geogrid is more efficient than geocell types in decreasing Keq,max. The values of Keq,max for geogrid-reinforced backfill at cycle 120 is about 10% lower than both geocell types.

5.2. Lateral Earth Pressure Coefficient

The backfill pressure during the test is measured by six pressure cells mounted at different wall heights. Like reaction force, the lateral pressure reaches a maximum point in passive mode and decreases during active mode. The maximum developed lateral earth pressures behind the wall of four tests during loading cycles are compared in Figure 13. As can be seen in this figure, the maximum value of the lateral earth pressure ( σ h m a x ) during cycles occurs in the upper half of the wall due to the rotating nature of wall displacement. This value is 5.92 kPa lower for the geogrid reinforcement (about 24%). In addition, for the unreinforced test, the σ h m a x occurs about the middle of the wall (z/H = 0.42 in which z is the distance from the surface and H is the wall height); however, the σ h m a x for geogrid-reinforced backfill occurs at upper heights (z/H = 0.28).
The magnitude of lateral pressure in the backfill soil is a function of relative lateral displacement of wall and soil and also soil confinement. The geogrid reinforcement in the backfill prevents the formation of shear zones behind the abutment. As a result, it can be seen that for the geogrid-reinforced backfill with a trivial settlement, the maximum pressure occurs at the normalized depth of 0.3 (z/H = 0.3). The lower lateral earth pressure ( σ h m a x ) during cycles in geosynthetic reinforced backfill can be attributed to the prevention of shear zone formation. For the unreinforced backfill, when the wall is pulled away from the backfill in the active mode of wall movement at each cycle, the soil slides and fills the gap created by the moving wall. As a result, the soil behind the wall accumulates behind the wall in the normalized depth between 0.1 and 0.5. When the wall pushes the backfill in the passive mode of wall movement, it cannot move the settled soil upward and would push the soil horizontally. Thus, the maximum lateral pressure occurs at a higher wall depth with higher magnitudes.
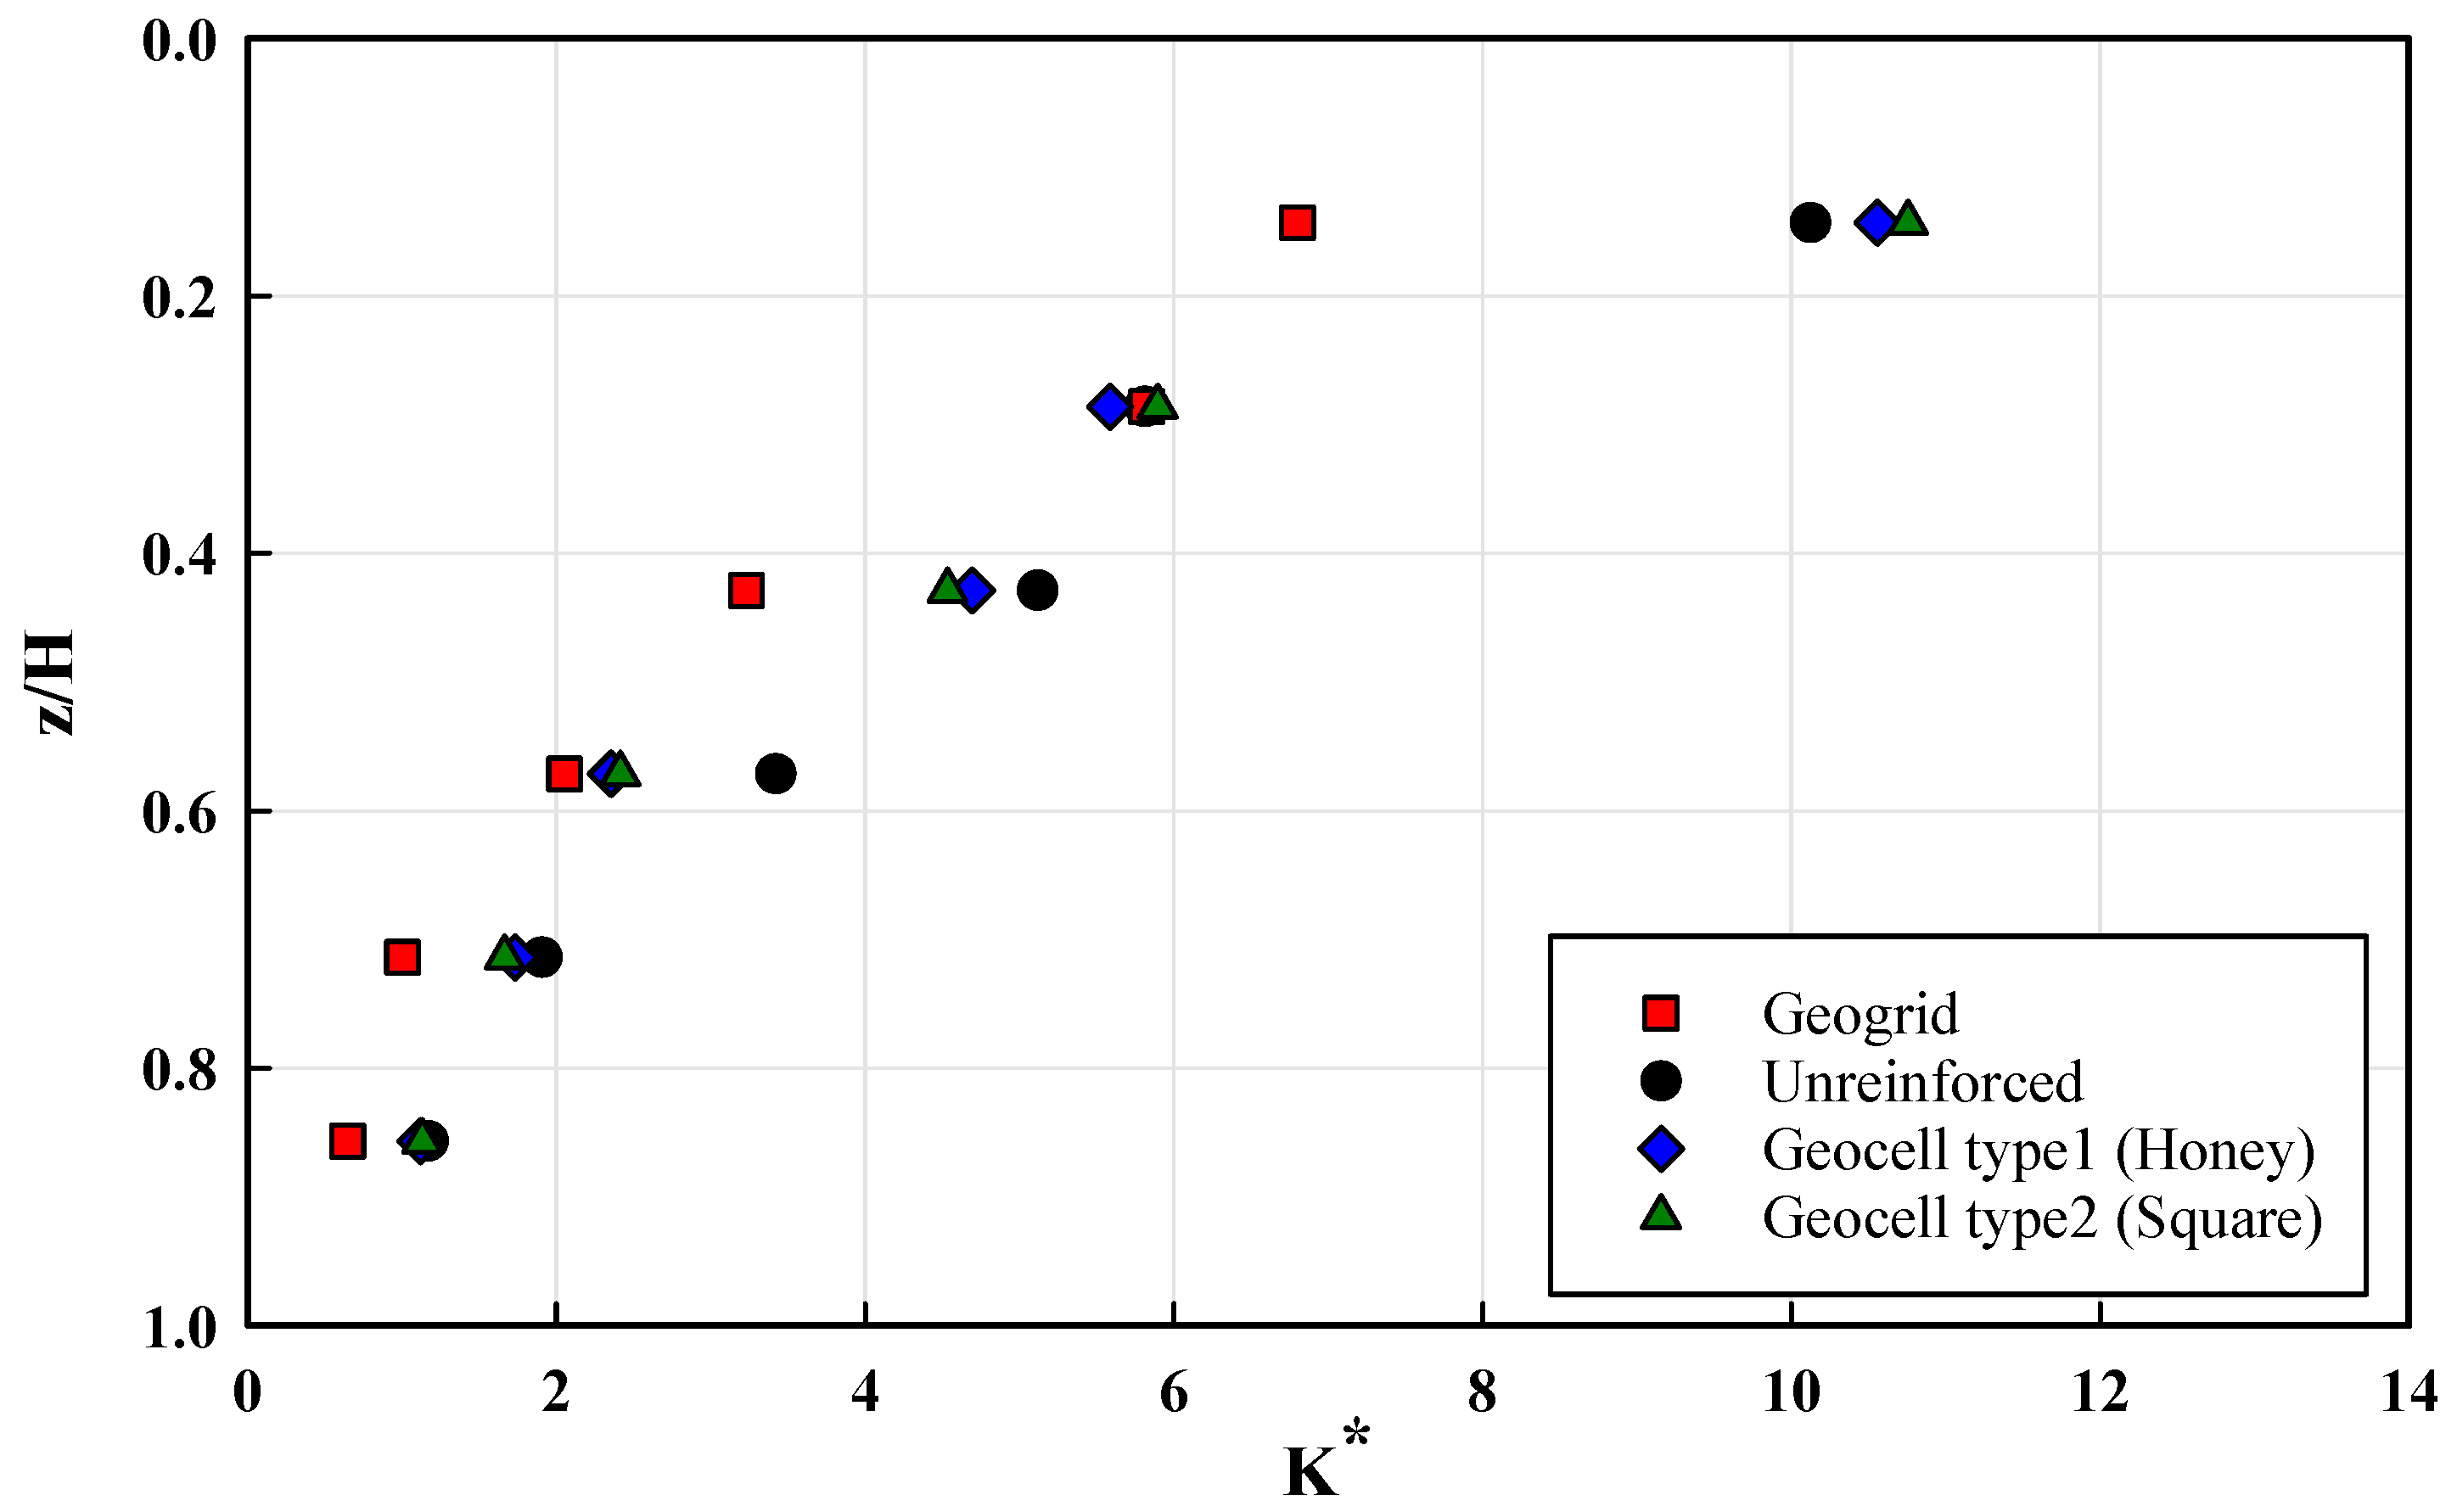
In most cases, the σ h m a x occurred at the last loading cycle; however, at some points in the upper part of the wall, σ h m a x is measured before the last cycle. The value of K* can be obtained by dividing the σ h m a x over the σ v 0 at each height. As shown in Figure 14, geogrid reinforcement would decrease the K* values at wall height by up to 36% at some points.
In all cases, the K* value decreases at wall height, reaching the wall bottom. In the lower half of the wall, the differences between K* values for the unreinforced and reinforced cases are low due to lower settlement and densification in this backfill.
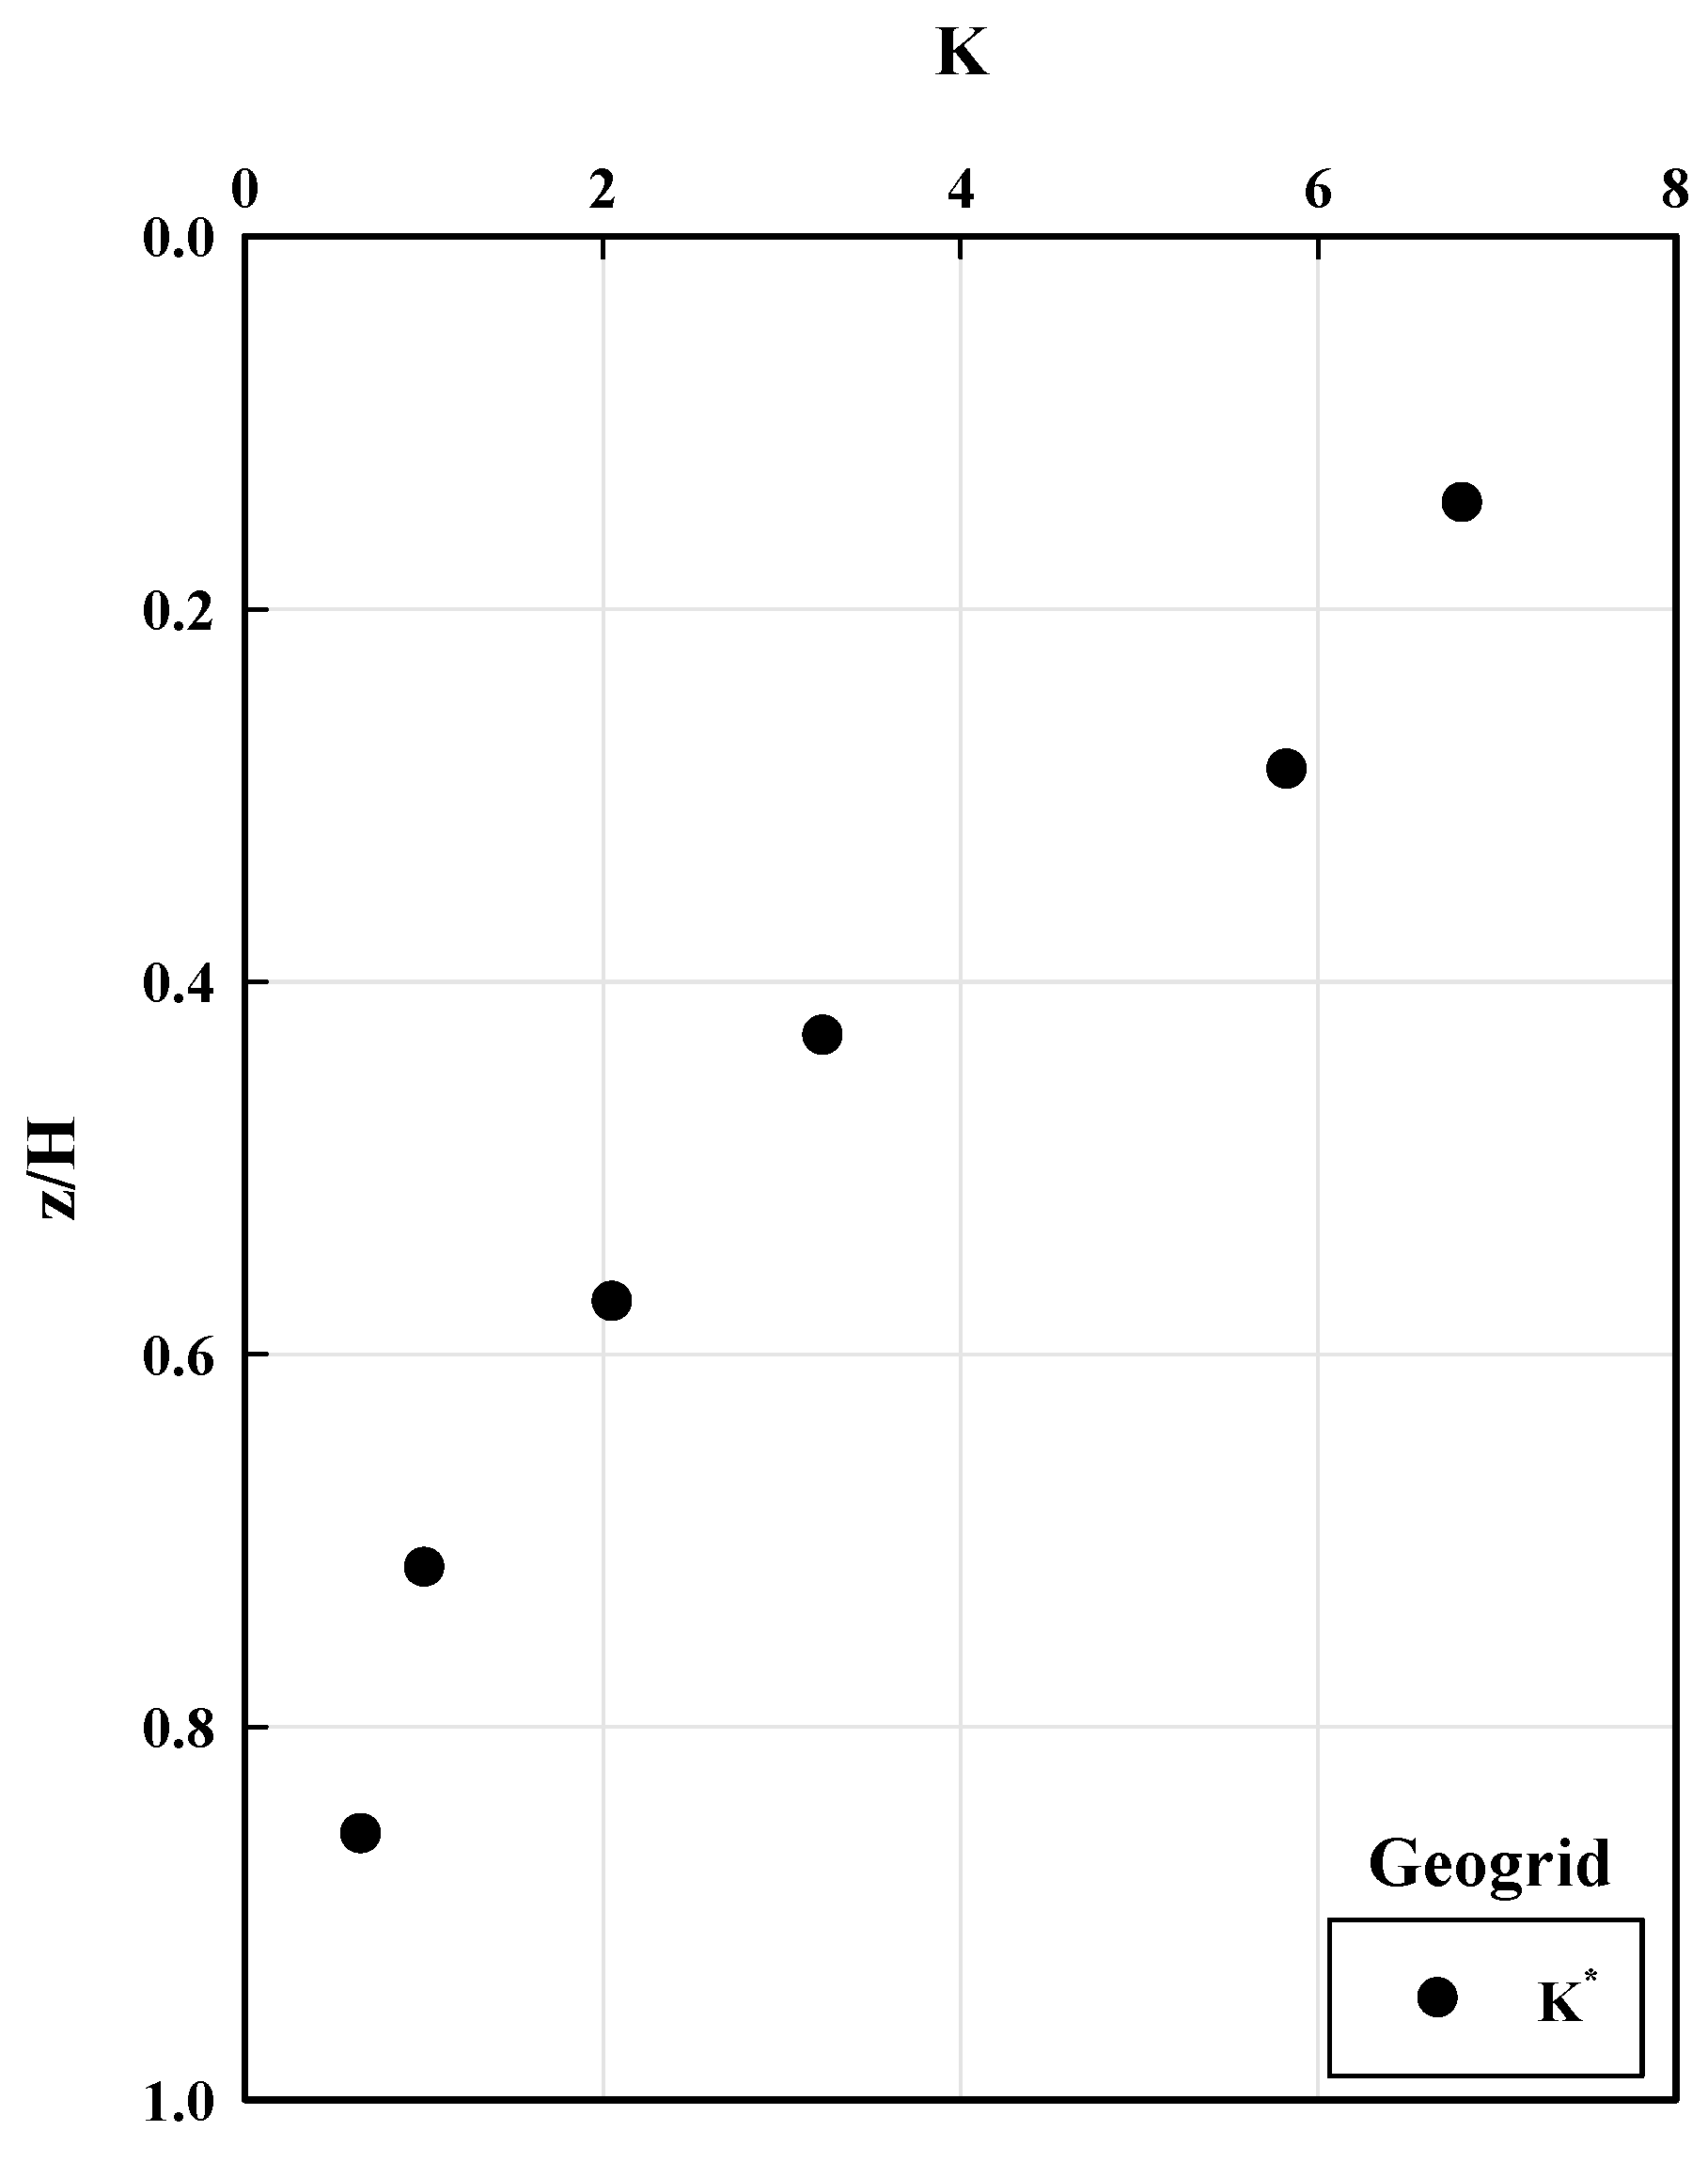
The derived values of Keq,max (Keq at cycle 120) are compared with the derived values of K* in each test at wall height in Figure 15. This Figure shows important differences between the Keq,max, and K* values at wall height for geogrid-reinforced and unreinforced backfill models. While the Keq,max is assumed to be constant in the wall height, the K* values decrease at wall height toward the wall bottom as a result of the rotating nature of wall movements. The variation of K* values at wall height suggests that assuming a single lateral earth pressure coefficient value for integral bridge abutments design might cause substantial errors by underestimating the backfill pressure in the upper parts of the wall and overestimating backfill pressure in the lower parts.

5.3. Settlements

The deformations of geogrid-reinforced and unreinforced backfills after 120 loading cycles are shown in Figure 16. Several slip lines are observed in the unreinforced backfill after 120 loading cycles, resulting in significant settlements behind the wall. Apart from the geogrid-reinforced backfill, the deformation of colored sand lines illustrates that geogrid reinforcement effectively prevents the formation of active shear zones behind the wall due to the addition of tensile strength to the backfill. The only cause of settlement behind the wall for geogrid-reinforced backfill is forming a “rolling up” zone. In this zone, the colored sand lines fade away, illustrating that sand particles roll up during active mode displacement and deposit in a gap that was formed between the backfill and moving wall. The surface settlements show that a small bump is formed behind the reinforced zone, which can be a sign of developing a shear zone due to the displacement of the reinforced zone during active mode displacement.
The settlements behind the wall at the soil surface were measured using close-up images with the help of meshed side glass. The variation of normalized settlements (Sg/H) versus normalized distance from the wall (x/H) at the end of the loading cycles of four tests is shown in Figure 17. As can be seen, the geogrid reinforcement significantly reduces the backfill settlement compared to unreinforced backfill by preventing the formation of shear zones behind the wall. This reduction reaches 63% adjacent to the wall. In comparison with honeycomb geocell, geogrid works better in reducing settlements. However, square-shaped geocell has a better performance in this regard.

6. Conclusions

This study presents the results derived from a physical model of a geogrid-reinforced backfill behind a rigid wall, subjected to cyclic displacement from the wall, simulating the cyclic movements of integrated abutments due to elonagation and contraction of the integral bridge deck. The results are then evaluated and compared with unreinforced and geocell-reinforced backfill to clarify the benefits of geogrid reinforcement. The significant results of the study are as follows:
  • Geogrid reinforcement effectively reduced the excessive pressure and settlement behind abutments, problems associated with the cyclic movements of the abutments of integral bridges.
  • Geogrid reinforcement reduced the maximum lateral earth pressure coefficient (Keq,max) by 36 percent compared to unreinforced backfill. This reduction in lateral earth pressure coefficient can be attributed to the mechanical interaction between the geogrid and the surrounding soil. In addition, geogrids can improve the soil’s shear strength and increase its overall stability, which further contributes to the reduction in lateral earth pressures.
  • The derived K* are larger than Keq,max at upper parts of the wall, and smaller at lower parts, suggesting the value of considering different lateral earth pressure coefficient values for design at the wall height. This difference can be attributed to the variation in wall displacement at different heights of the wall.
  • Geogrid reinforcement significantly reduced the settlement behind the wall (62%) by preventing the formation of active shear zones. This reduction can be attributed to the improved mechanical interaction between the geogrid and the surrounding soil and the soil’s shear strength, which helps distribute loads and reduce stress concentrations in the soil, prevents the formation of slip lines in soil behind the wall. However, a small bump behind the reinforced zone suggests that cyclic movement is not entirely attenuated in the geogrid-reinforced zone.
  • Geogrid reinforcement shows better performance than the two types of geocell. The calculated Keq,max for the geogrid-reinforced backfill test is 10% lower than the Keq, which is calculated for the geocell-reinforced backfill tests. The settlements are quite similar for geogrid- and geocell-reinforced backfill tests. Overall, the findings of this study suggest that geogrid reinforcement may be a more effective and efficient solution for retaining walls compared to geocell reinforcement. However, it is important to note that the performance of geogrid and geocell reinforcement can vary depending on various factors such as soil type, slope angle, and groundwater conditions.

Author Contributions

Conceptualization, V.F., M.Z. and A.M.; Methodology, V.F., M.Z., A.M., M.I. and M.J.M.; Software, M.Z. and M.J.M.; Validation, V.F., M.Z., A.M., M.I., M.J.M. and H.D.; Formal analysis, V.F., M.Z., A.M., M.I. and H.D.; Investigation, V.F., M.Z., A.M., M.I., M.J.M. and H.D.; Resources, V.F., M.Z. and M.J.M.; Data curation, M.Z., A.M., M.I. and H.D.; Writing—original draft, V.F., M.Z. and A.M.; Writing—review & editing, V.F. and M.Z.; Visualization, M.Z. and M.I.; Supervision, V.F.; Project administration, V.F. and M.Z.; Funding acquisition, V.F. All authors have read and agreed to the published version of the manuscript.

Funding

This research received no external funding.

Institutional Review Board Statement

Not applicable.

Informed Consent Statement

Not applicable.

Data Availability Statement

The data presented in this study are available on request from the corresponding authors.

Conflicts of Interest

The authors declare no conflict of interest.

Abbreviations

Abbreviations
LVDTlinear variable differential transformer
HDPEhigh-density polyethylene
PCPressure Cell
GRSGeosynthetic-Reinforced Structure
EPSExpanded Poly Styrene
Nomenclature
ρ Soil density
gGravity acceleration
E s Elastic modulus of soil
υ   Poisson’s ratio of soil
Φ   Internal friction angle of soil (degrees)
HHeight of soil behind the wall
DDistance between two geogrid layers
δ   Wall displacement at its top during one cycle
L   Length of geogrid
T Tensile strength of geocell material (kN/m)
π i Dimensionless factors
RDRelative Density (%)
CcCoefficient of curvature
CuCoefficient of uniformity
emaxMaximum void ratio
eminMinimum void ratio
GsThe specific gravity of soil
σ h m a x ' Maximum lateral pressure measured by a pressure cell
σ v 0 ' Initial vertical stress
σ h 0 ' Initial horizontal stress
K * Lateral soil coefficient (calculated by dividing maximum lateralpressure cell to initial vertical stress)
K eqLateral soil coefficient (calculated by load cell force)
P Lateral force measured by the load cell
γ Soil moist unit weight (KN/m3)
Keq,maxMaximum lateral soil coefficient in all cycles
zDistance from the surface
xDistance from the wall

References

  1. Karakouzian, M.; Farhangi, V.; Farani, M.R.; Joshaghani, A.; Zadehmohamad, M.; Ahmadzadeh, M. Mechanical Characteristics of Cement Paste in the Presence of Carbon Nanotubes and Silica Oxide Nanoparticles: An Experimental Study. Materials 2021, 14, 1347. [Google Scholar] [PubMed]
  2. Zadehmohamad, M.; Moradi, M.; Ghalandarzadeh, A. Seismic behavior of pile group in soil slope. engrXiv 2021. [Google Scholar] [CrossRef]
  3. Zadehmohamad, M.; Moradi, M.; Ghalandarzadeh, A. The effect of pile group location in slope on its seismic behavior. engrXiv 2021. [Google Scholar] [CrossRef]
  4. Zadehmohamad, M.; Luo, N.; Abu-Farsakh, M.; Voyiadjis, G. Evaluating long-term benefits of geosynthetics in flexible pavements built over weak subgrades by finite element and Mechanistic-Empirical analyses. Geotext. Geomembr. 2022, 50, 455–469. [Google Scholar]
  5. Abu-Farsakh, M.; Zadehmohamad, M.; Voyiadjis, G.Z. Incorporating the Benefits of Geosynthetic into MEPDG. Infrastructures 2023, 8, 35. [Google Scholar] [CrossRef]
  6. Momeni, E.; Poormoosavian, M.; Salmani Tehrani, H.; Fakher, A. Reliability analysis and risk assessment of deep excavations using random-set finite element method and event tree technique. Transp. Geotech. 2021, 29, 100560. [Google Scholar] [CrossRef]
  7. Krier, D. Modeling of Integral Abutment Bridges Considering Soil-Structure Interaction Effects; The University of Oklahoma: Norman, OK, USA, 2009. [Google Scholar]
  8. Wallbank, E. The Performance of Concrete in Bridges. A Survey of 200 Highway Bridges; National Academies of Sciences, Engineering, and Medicine: Washington, DC, USA, 1989. [Google Scholar]
  9. Wolde-Tinsae, A.M.; Klinger, J.E. Integral Abutment Bridge Design and Construction; National Academies of Sciences, Engineering, and Medicine: Washington, DC, USA, 1987. [Google Scholar]
  10. Cosgrove, E.F.; Lehane, B.M. Cyclic loading of loose backfill placed adjacent to integral bridge abutments. Int. J. Phys. Model. Geotech. 2003, 3, 9–16. [Google Scholar]
  11. Horvath, J.S. Integral-Abutment Bridges: Problems and Innovative Solutions Using EPS Geofoam and Other Geosynthetics; Res. Rpt. No. CE/GE-00, 2; Manhattan College: Bronx, NY, USA, 2000. [Google Scholar]
  12. Zadehmohamad, M. Evaluation of Cyclic Displacement Amplitude of Integral Bridge Abutment on Backfill Soil Pressure and Settlements. J. Transp. Res. 2020. Available online: http://www.trijournal.ir/article_119193.html?lang=en (accessed on 5 March 2022).
  13. Khodair, Y.; Hassiotis, S. Numerical and experimental analyses of an integral bridge. Int. J. Adv. Struct. Eng. 2013, 5, 1–12. [Google Scholar] [CrossRef] [Green Version]
  14. Fiorentino, G.; Cengiz, C.; De Luca, F.; Mylonakis, G.; Karamitros, D.; Dietz, M.; Dihoru, L.; Lavorato, D.; Briseghella, B.; Isakovic, T. Integral abutment bridges: Investigation of seismic soil-structure interaction effects by shaking table testing. Earthq. Eng. Struct. Dyn. 2021, 50, 1517–1538. [Google Scholar]
  15. Hirakawa, D.; Nojiri, M.; Aizawa, H.; Nishikiori, H.; Tatsuoka, F.; Watanabe, K.; Tateyama, M. Effects of the tensile resistance of reinforcement in the backfill on seismic stability of GRS integral bridge. New Horiz. Earth Reinf. 2007, 811–817. [Google Scholar]
  16. Mitoulis, S.A. Challenges and opportunities for the application of integral abutment bridges in earthquake-prone areas: A review. Soil Dyn. Earthq. Eng. 2020, 135, 106183. [Google Scholar]
  17. Kawabe, S.; Kikuchi, Y.; Watanabe, K.; Tatsuoka, F. Model tests on the stability of GRS integral bridge against tsunami load. Jpn. Geotech. Soc. Spec. Publ. 2016, 2, 2313–2318. [Google Scholar] [CrossRef] [Green Version]
  18. Tatsuoka, F.; Tateyama, M.; Koda, M.; Kojima, K.-I.; Yonezawa, T.; Shindo, Y.; Tamai, S.-I. Research and construction of geosynthetic-reinforced soil integral bridges. Transp. Geotech. 2016, 8, 4–25. [Google Scholar]
  19. Wasserman, E.P.; Walker, J.H. Integral Abutments for Steel Bridges; National Academies of Sciences, Engineering, and Medicine: Washington, DC, USA, 1996. [Google Scholar]
  20. Al-Qarawi, A.; Leo, C.; Liyanapathirana, D. Effects of wall movements on performance of integral abutment bridges. Int. J. Geomech. 2020, 20, 04019157. [Google Scholar]
  21. Arsoy, S.; Barker, R.M.; Duncan, J.M. The Behavior of Integral Abutment Bridges; Virginia Transportation Research Council: Charlottesville, VA, USA, 1999. [Google Scholar]
  22. LaFave, J.M.; Brambila, G.; Kode, U.; Liu, G.; Fahnestock, L.A. Field Behavior of Integral Abutment Bridges under Thermal Loading. J. Bridge Eng. 2021, 26, 04021013. [Google Scholar] [CrossRef]
  23. Huang, F.; Shan, Y.; Chen, G.; Lin, Y.; Tabatabai, H.; Briseghella, B. Experiment on Interaction of Abutment, Steel H-Pile and Soil in Integral Abutment Jonitless Bridges (IAJBs) under Low-Cycle Pseudo-Static Displacement Loads. Appl. Sci. 2020, 10, 1358. [Google Scholar] [CrossRef] [Green Version]
  24. Perić, D.; Miletić, M.; Shah, B.R.; Esmaeily, A.; Wang, H. Thermally induced soil structure interaction in the existing integral bridge. Eng. Struct. 2016, 106, 484–494. [Google Scholar]
  25. England, G.; Tsang, N. Towards the Design of Soil Loading for Integral Bridges-Experimental Evaluation; Department of Civil and Environmental Engineering, Imperial College: London, UK, 2001. [Google Scholar]
  26. Tatsuoka, F.; Hirakawa, D.; Nojiri, M.; Aizawa, H.; Nishikiori, H.; Soma, R.; Tateyama, M.; Watanabe, K. A new type of integral bridge comprising geosynthetic-reinforced soil walls. Geosynth. Int. 2009, 16, 301–326. [Google Scholar]
  27. Liu, H.; Han, J.; Parsons, R.L. Reduction of lateral earth pressures behind retaining walls using EPS and geosynthetic reinforcement. In Proceedings of the Geosynthetics Conference 2021, Kansas City, MO, USA, 5–8 February 2021; pp. 561–569. [Google Scholar]
  28. Liu, H.; Han, J.; Parsons, R.L. Mitigation of seasonal temperature change-induced problems with integral bridge abutments using EPS foam and geogrid. Geotext. Geomembr. 2021, 49, 1380–1392. [Google Scholar]
  29. Xie, M.; Zheng, J.; Shao, A.; Miao, C.; Zhang, J. Study of lateral earth pressures on nonyielding retaining walls with deformable geofoam inclusions. Geotext. Geomembr. 2020, 49, 684–690. [Google Scholar]
  30. Kim, H.; Witthoeft, A.F.; Kim, D. Numerical study of earth pressure reduction on rigid walls using EPS geofoam inclusions. Geosynth. Int. 2018, 25, 180–199. [Google Scholar]
  31. Hazarika, H.; Kohama, E.; Sugano, T. Underwater shake table tests on waterfront structures protected with tire chips cushion. J. Geotech. Geoenviron. Eng. 2008, 134, 1706–1719. [Google Scholar]
  32. Horvath, J.S. Lateral pressure reduction on earth-retaining structures using geofoams: Correcting some misunderstandings. In Proceedings of the Earth Retention Conference 3; ASCE: Reston, VA, USA, 2010; pp. 862–869. [Google Scholar]
  33. Horvath, J.S. Geofoam compressible inclusions: The new frontier in earth retaining structures. In Geotechnical Engineering for Transportation Projects; ASCE: Reston, VA, USA, 2004; pp. 1925–1934. [Google Scholar]
  34. Horvath, J.S. The compressible inclusion function of EPS geofoam. Geotext. Geomembr. 1997, 15, 77–120. [Google Scholar] [CrossRef]
  35. Tweedie, J.; Humphrey, D.; Sandford, T. Tire shreds as lightweight retaining wall backfill: Active conditions. J. Geotech. Geoenviron. Eng. 1998, 124, 1061–1070. [Google Scholar]
  36. Carder, D.; Card, G. Innovative Structural Backfills to Integral Bridge Abutments; TRL REPORT NO. 290; Transport Research Laboratory: Crawthorne, UK, 1997. [Google Scholar]
  37. Lutenegger, A.J.; Ciufetti, M. Full-Scale Pilot Study to Reduce Lateral Stresses in Retaining Structures Using Geofoam; Final Report, Project No. RSCH010-983 Vermont DOT; University of Massachusetts: Amherst, MA, USA, 2009. [Google Scholar]
  38. Hoppe, E.J. Field Study of Integral Backwall with Elastic Inclusion; Virginia Transportation Research Council: Charlottesville, VA, USA, 2005. [Google Scholar]
  39. Cecich, V.; Gonzales, L.; Hoisaeter, A.; Williams, J.; Reddy, K. Use of shredded tires as lightweight backfill material for retaining structures. Waste Manag. Res. 1996, 14, 433–451. [Google Scholar] [CrossRef]
  40. Lee, H.J.; Roh, H.S. The use of recycled tire chips to minimize dynamic earth pressure during compaction of backfill. Constr. Build. Mater. 2007, 21, 1016–1026. [Google Scholar]
  41. Zadehmohamad, M.; Bazaz, J.B.; Riahipour, R.; Farhangi, V. Physical modelling of the longterm behavior of integral abutment bridge backfill reinforced with tire-rubber. Int. J. Geo-Eng. 2021, 12, 1–19. [Google Scholar]
  42. Yonezawa, T.; Yamazaki, T.; Tateyama, M.; Tatsuoka, F. Design and construction of geosynthetic-reinforced soil structures for Hokkaido high-speed train line. Transp. Geotech. 2014, 1, 3–20. [Google Scholar]
  43. Munoz, H.; Tatsuoka, F.; Hirakawa, D.; Nishikiori, H.; Soma, R.; Tateyama, M.; Watanabe, K. Dynamic stability of geosynthetic-reinforced soil integral bridge. Geosynth. Int. 2012, 19, 11–38. [Google Scholar] [CrossRef]
  44. Zadehmohamad, M.; Bazaz, J.B. Cyclic behaviour of geocell-reinforced backfill behind integral bridge abutment. Int. J. Geotech. Eng. 2017, 13, 438–450. [Google Scholar] [CrossRef]
  45. Bolouri Bazaz, J.; Zadehmohamad, M.; Hashemi, S.S. Developing a Portable Curtain Sand Pluviator for Reconstitution of Soil Models. Modares Civ. Eng. J. 2018, 18, 231–242. [Google Scholar]
  46. Lehane, B. Lateral soil stiffness adjacent to deep integral bridge abutments. Géotechnique 2011, 61, 593–603. [Google Scholar] [CrossRef]
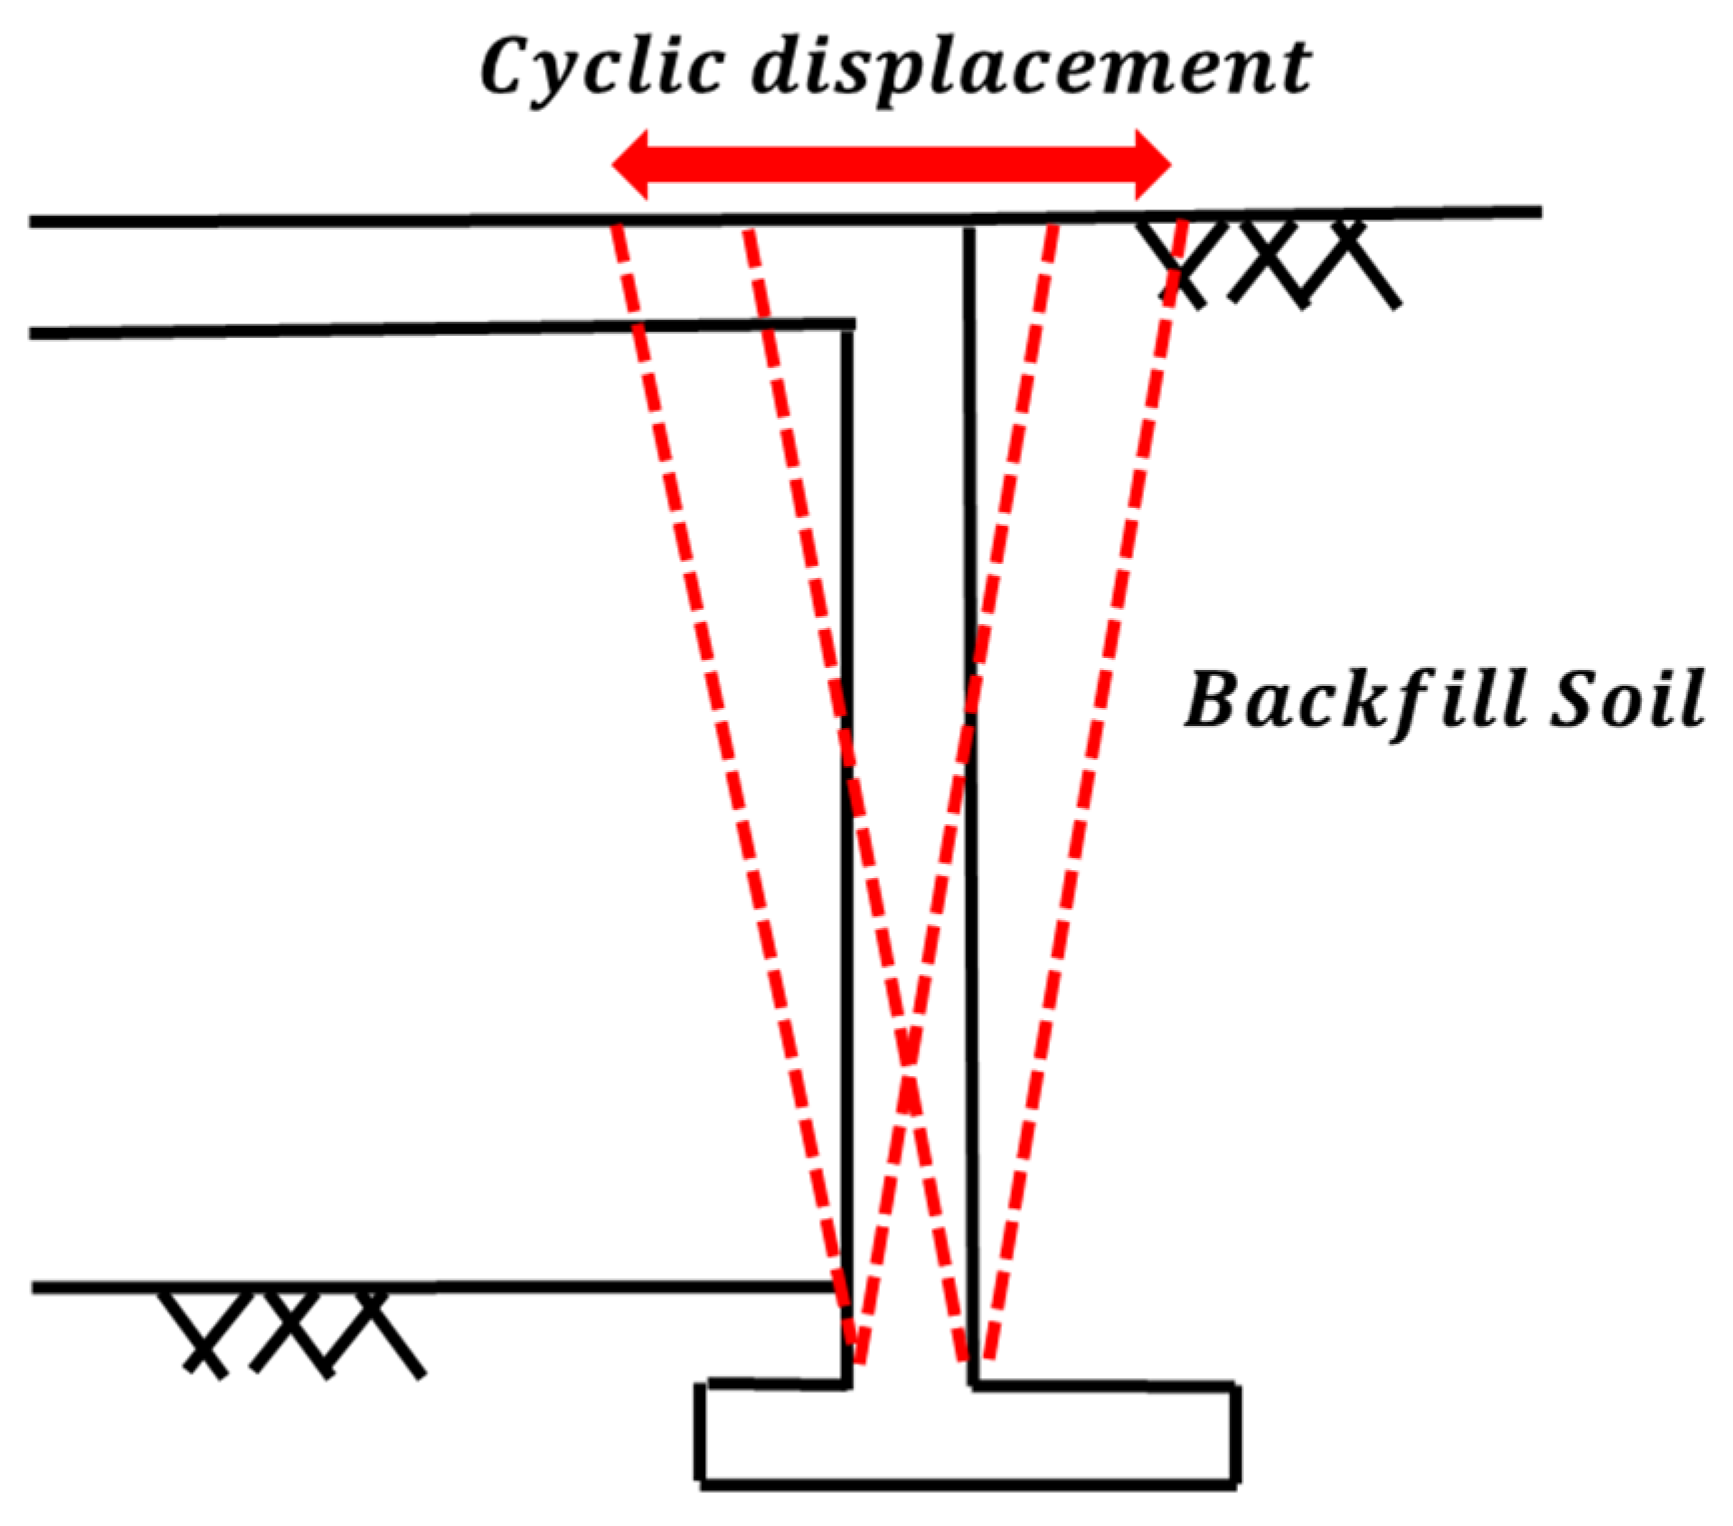
Figure 1. Cyclic displacement of abutment due to changes in deck length.
Buildings 13 00853 g001
Figure 2. Picture of model box.
Buildings 13 00853 g002
Figure 3. Schematic view of model box, instruments, and data acquisition system.
Buildings 13 00853 g003
Figure 4. Relative density of pluviated Firoozkooh sand 161 with different parameters of sand pluviator.
Buildings 13 00853 g004
Figure 5. Noncommercial PolyEthylene grid selected for the modeling.
Buildings 13 00853 g005
Figure 6. Schematic view of test with details.
Buildings 13 00853 g006
Figure 7. Characterization of the applied displacement cycles to the top of the wall.
Buildings 13 00853 g007
Figure 8. Pluviation and geogrid connection to the wall.
Buildings 13 00853 g008
Figure 9. Assumed distribution of the soil pressure required to equilibrate the force P applied on the top.
Buildings 13 00853 g009
Figure 10. Variation of the equivalent lateral earth pressure coefficient (Keq) of unreinforced backfill.
Buildings 13 00853 g010
Figure 11. Variation of the equivalent lateral earth pressure coefficient (Keq) during cycles 1, 10 and 100.
Buildings 13 00853 g011
Figure 12. Variation of Keq,max with cycles during tests.
Buildings 13 00853 g012
Figure 13. Variation of lateral pressure during loading cycles for geogrid-reinforced backfill.
Buildings 13 00853 g013
Figure 14. Variation of K* along the abutment after 120 cycles.
Buildings 13 00853 g014
Figure 15. K* after 120 cycles.
Buildings 13 00853 g015
Figure 16. Settlements behind the wall after 120 cycles for geogrid-reinforced.
Buildings 13 00853 g016
Figure 17. Settlements near the abutment after 120 cycles.
Buildings 13 00853 g017
Table 1. Characteristics of Firoozkooh 161 sand.
SandD10 (mm)D30 (mm)D60 (mm)CuCcemaxeminGs
Firuzkooh NO.1610.160.210.281.870.880.9430.5482.65
Table 2. Comparision of π 7 factor of a 5 m abutment and model.
Geogrid MaterialPrototypeModel (kN/m)
Tensile Strength (T)52 (kN/m)1.02 (kN/m)
Height of wall (H)5 m0.7
Soil   Density   ( ρ g )
15.93 (kN/m3)15.93 (kN/m3)
π 7 = T ρ g H 2
0.130.13
Disclaimer/Publisher’s Note: The statements, opinions and data contained in all publications are solely those of the individual author(s) and contributor(s) and not of MDPI and/or the editor(s). MDPI and/or the editor(s) disclaim responsibility for any injury to people or property resulting from any ideas, methods, instructions or products referred to in the content.