1. Introduction
In recent decades, continuous rigid-frame bridges have been widely used in the world’s infrastructure construction, especially in China.
Figure 1 shows the trend and number of continuous reinforced concrete rigid-frame (CRCR) bridges constructed in China [
1]. CRCR bridges have been built in large numbers, benefiting from many advantages: (i) more rigidity of the structure; (ii) fewer moments in the deck being partly transferred to the supporting members; and (iii) no bridge bearings are required to be set since the pier and the beam are integrated as one solid structure. At the moment, a large number of studies have been conducted on the mechanical properties and behavior prediction of continuous rigid-frame bridges. The influence factors, such as shear lag [
2,
3], shear deformation [
4,
5,
6], temperature stress [
7,
8], shrinkage, and creep [
9], are gradually considered in the mechanical analysis of CRCR bridge, and the cracking and the long-time deflection are of great concern [
10,
11]. The manual calculation based on formulas is mainly used for theoretical deduction and simple inspection [
12,
13], and its application in complex structure design and verification is limited. The finite-element method has become an important tool for structural analysis. It has been a research hotspot to reflect the actual performance of the bridge and predict its future behavior by considering the influence of different action factors and updating the finite-element model with measured data [
14,
15,
16,
17,
18,
19]. This paper shows that the influence of volume deviation caused by construction methods on bridges is not negligible.
Due to the factors, such as casting mold making and construction operation errors, the bridge structure, inevitably, has the issue of pouring concrete volume deviation (PCVD), which is random in the amount and position. The distribution characteristics of PCVD are unclear, which brings uncertainty to the internal-force calculation and service performance analysis of large-span CRCR bridges. At present, only a few existing studies pay attention to the volume deviation of components. Mutashar R. et al. [
20] analyzed the reasons for the deterioration of concrete at the lower edge of hinge joints of hollow-plate small-box girders and believed that the sudden change of contact stress caused by dimensional variation was one of the important reasons. Holicky et al. [
21] described the influence of volume deviation on the structure from the design point of view but did not explain its causes. Luo et al. [
22] investigated the PCVD of prefabricated concrete components and found that the deviation of prefabricated components was very small, while the PCVD of the cantilever-casting method was unknown. Theoretically, the influence of PCVD on the superstructure of CRCR bridge is mainly reflected in two aspects: one is that the pouring volume is different from the design resulting in uneven dead-load distribution, and the other is that the volume deviation of different parts of the structure results in the inconsistency of structural stiffness. Existing studies cannot explain the effect of PCVD on the service performance of CRCR bridges from the above perspectives.
Currently, hardly any measured data of PCVD about CRCR bridges are available. The detection of PCVD mainly adopts the coring sampling measurement method and non-contact measurement method [
23,
24]. The coring sampling method is somewhat destructive to the structure. Drilling coring will weaken the section and cause stress redistribution. Moreover, the method can only be used for typical section checks, which is difficult to reflect the overall condition of the bridge due to the limited feasible sampling locations of the bridge. Non-contact measurement mostly adopts a three-dimensional laser point cloud, which is limited by the occlusion of the test perspective, the correction of position coordinates, as well as the test-environment conditions. In practice, it has the shortcomings of low-test efficiency and difficulty to distinguish the main structure from the auxiliary facilities and has not been widely used in the field of bridge dimension identification. In the current AASHTO [
25] specification, for structural design, the dead-load coefficient is 1.25, and the Chinese specification [
26] considers the dead-load coefficient to be 1.2 when it is unfavorable to the structure. The abovementioned specifications only consider the coefficient that increases the dead load in the calculation and have not yet considered the influence of volume deviation at different parts on the stiffness of the structure, which results in a conservative design.
In this paper, a finite element model was established to compare and analyze the structural response under dead load and live load, and the influence of PCVD at different positions on the performance of CRCR bridge. Combined with the superstructure demolition and replacement project of four CRCR bridges with main span length of more than 70 m, the concrete pouring condition of different sections of different parts of the continuous rigid-frame bridge was obtained by measuring section by section, and the distribution characteristics of the PCVD of the continuous rigid-frame bridge was analyzed. The influence of volume deviation on the stiffness of the bridge was analyzed, and the correction coefficient considering the change of dead load and stiffness was proposed, which is helpful for the refined design of future bridges and the internal-force calculation of bridges in service.
3. Case Study
3.1. Engineering Background
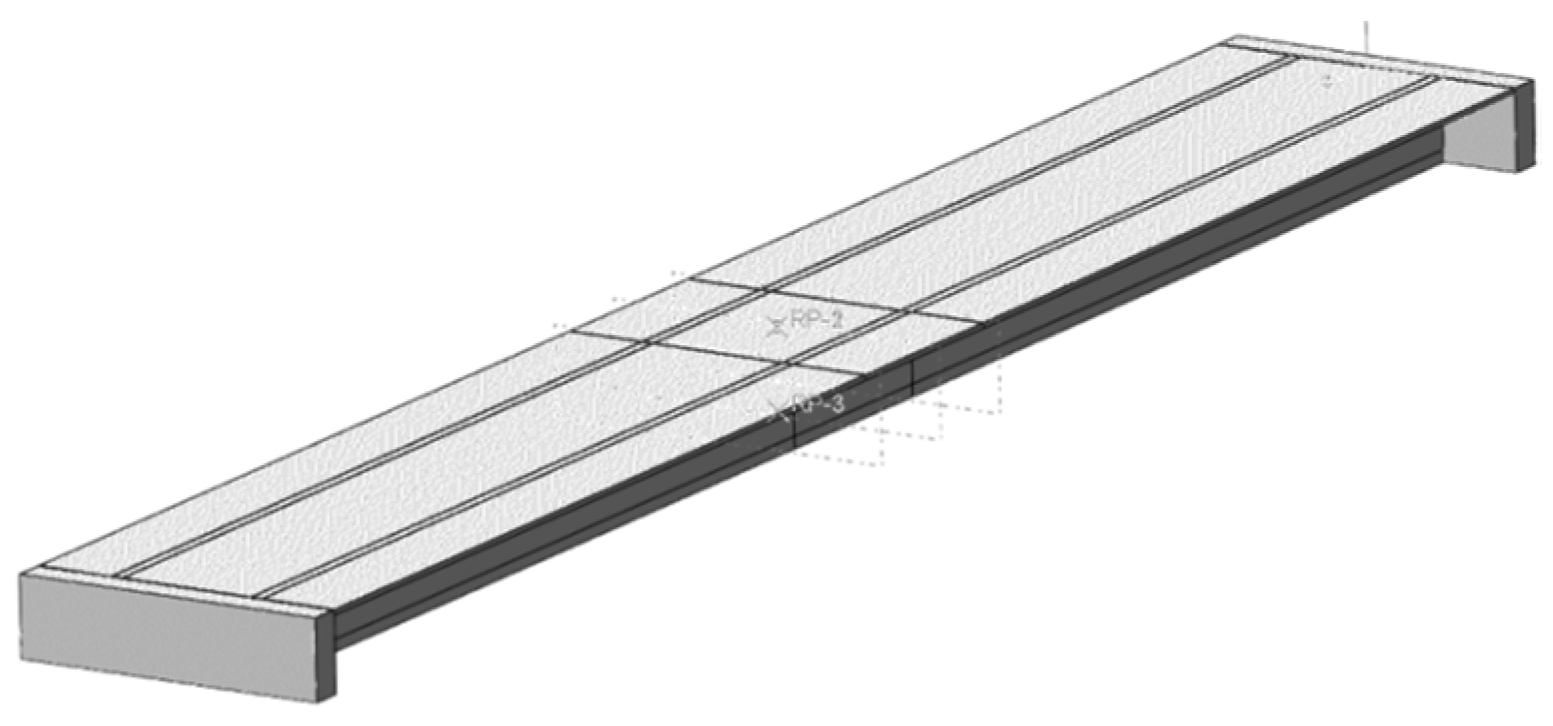
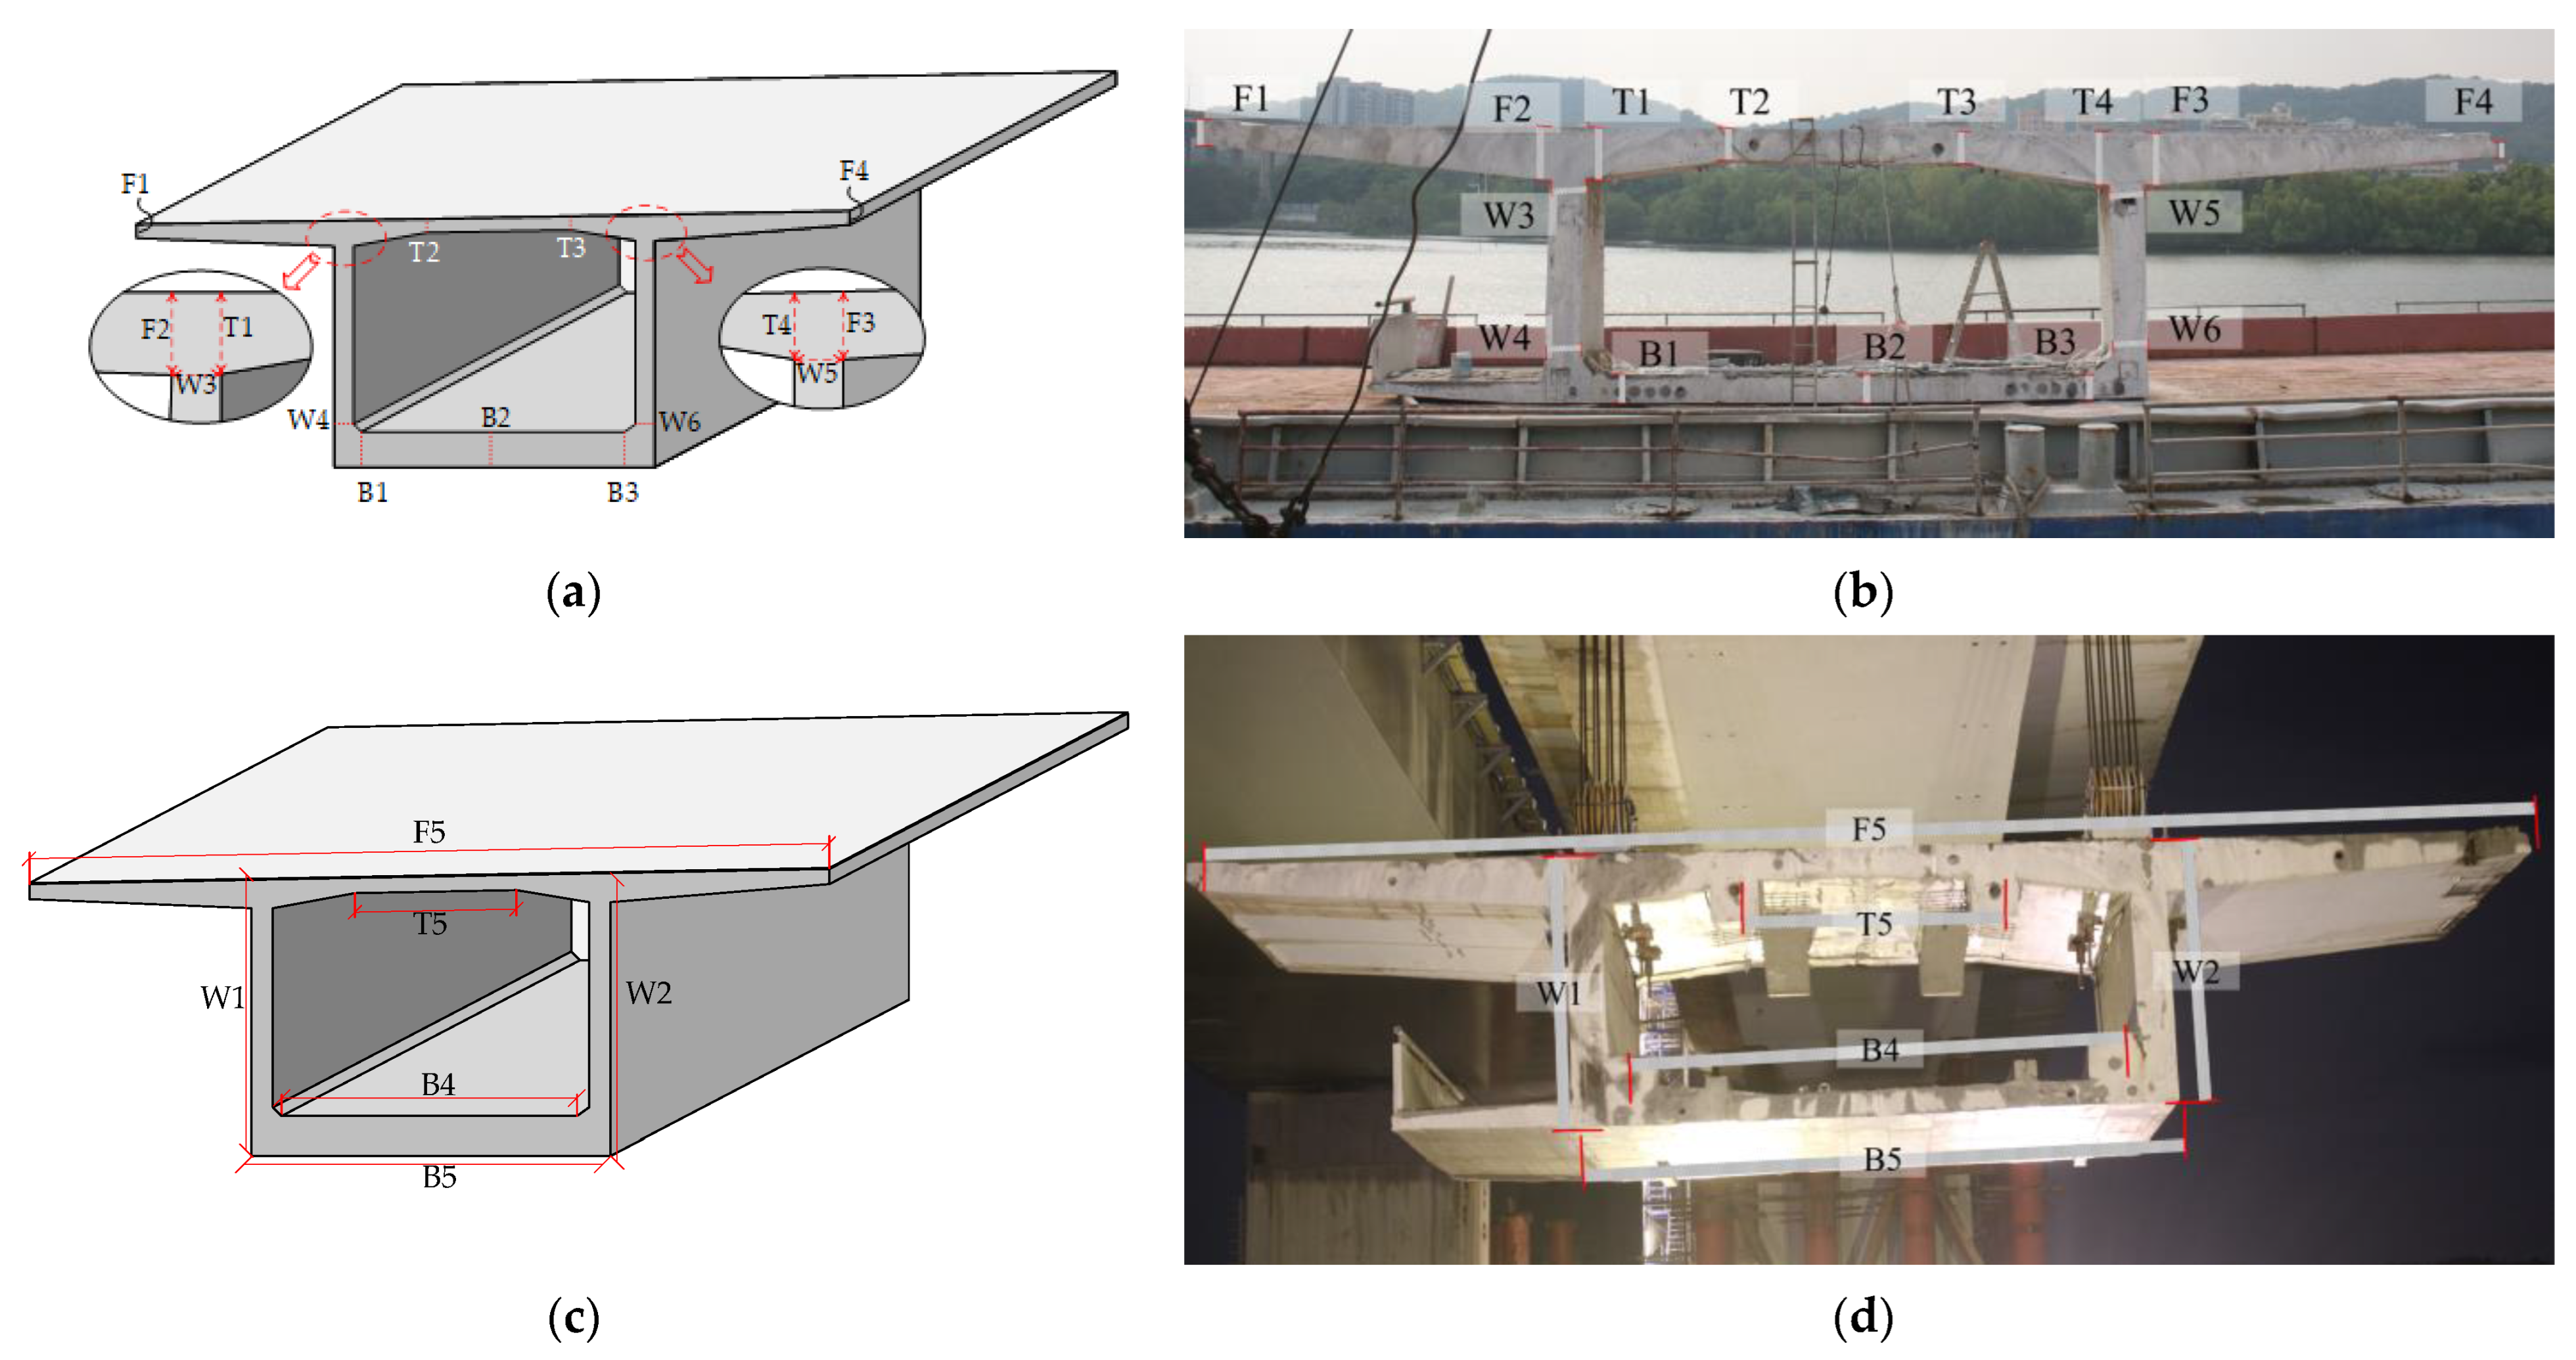
Bridge A is a four-span continuous rigid-frame bridge with a span arrangement of 59 m + 105 m + 105 m + 59 m. Bridge B is a three-span continuous rigid-frame bridge with a span arrangement of 39 m + 79 m + 39 m, both of which were built in 1996. The section layout and design control dimensions of the two bridges are shown in
Figure 6. The cross-section height varies and follows a quadratic curve along the longitudinal bridge direction. As existing indirect measurement methods for operating bridges contains a certain amount of error, with the help of the complete section dimension data obtained after the demolition of the bridge, the indirect measurement error can be avoided, making the measurement data result more accurate and more convincing.
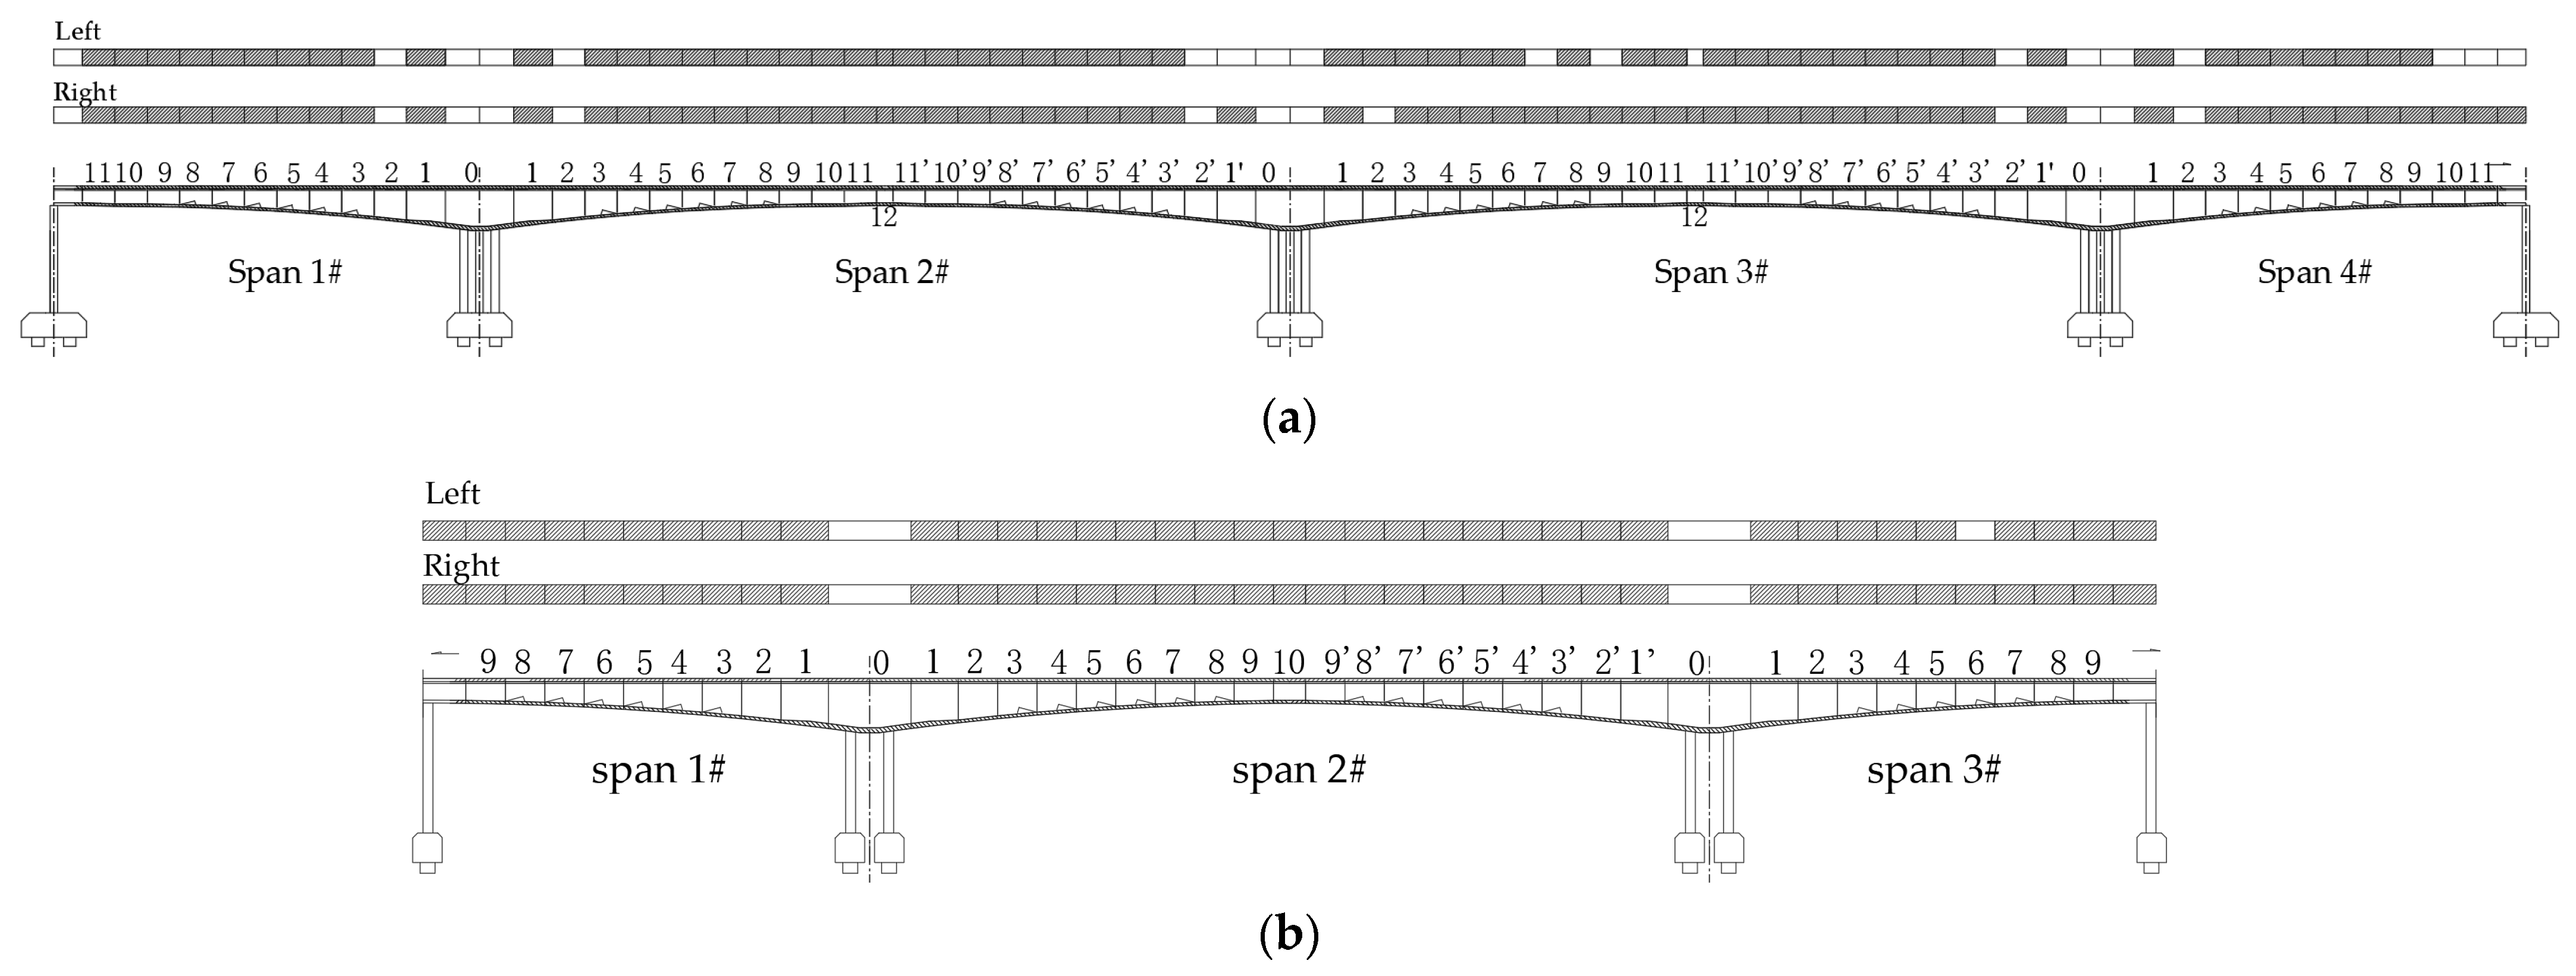
The demolition of the bridge superstructure adopts the opposite sequence of construction and installation, which is called the “inverted demolition method”. Due to severe defects and long-lasting deflection of the two CRCR bridges, for the sake of bridge safety, the superstructure of the two bridges has been dismantled in 2022. After segment 12# of bridge A was released, each beam segment was symmetrically cut and dismantled. A detailed investigation was carried out on the generated cutting surface and the geometric properties of the sections were calculated according to the measured parameters, and compared with the design value to determine the amount of deviation.
There are 136 segments in the double span of bridge A, and 104 segments have been checked. Bridge B has 76 segments, 75 of which have been checked. As shown in
Figure 7, shaded sections are completed checks.
3.2. Measuring Approach
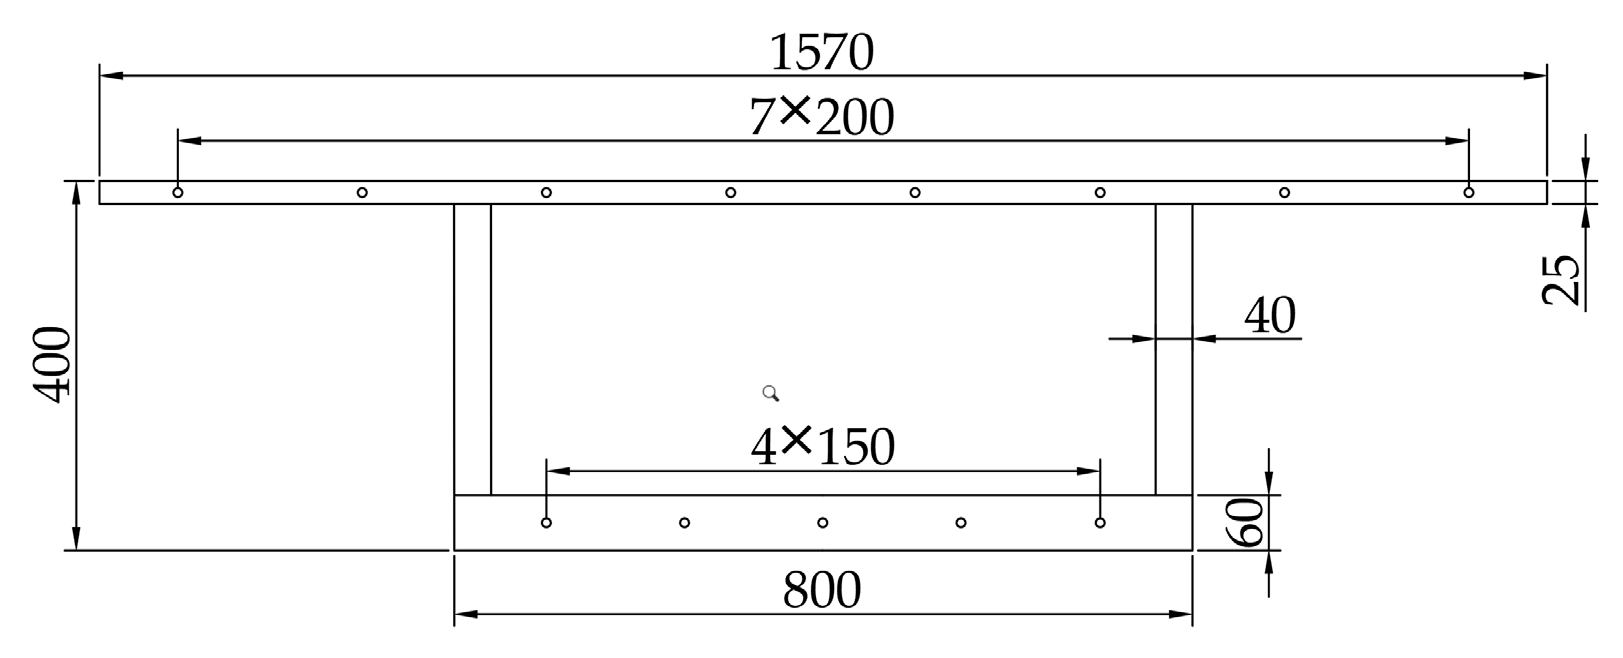
According to the section characteristics of each part, 21 measuring points that reflect the thickness variation characteristics of the box girder are set up. The specific arrangement of measuring points is shown in
Table 3 and
Figure 8.
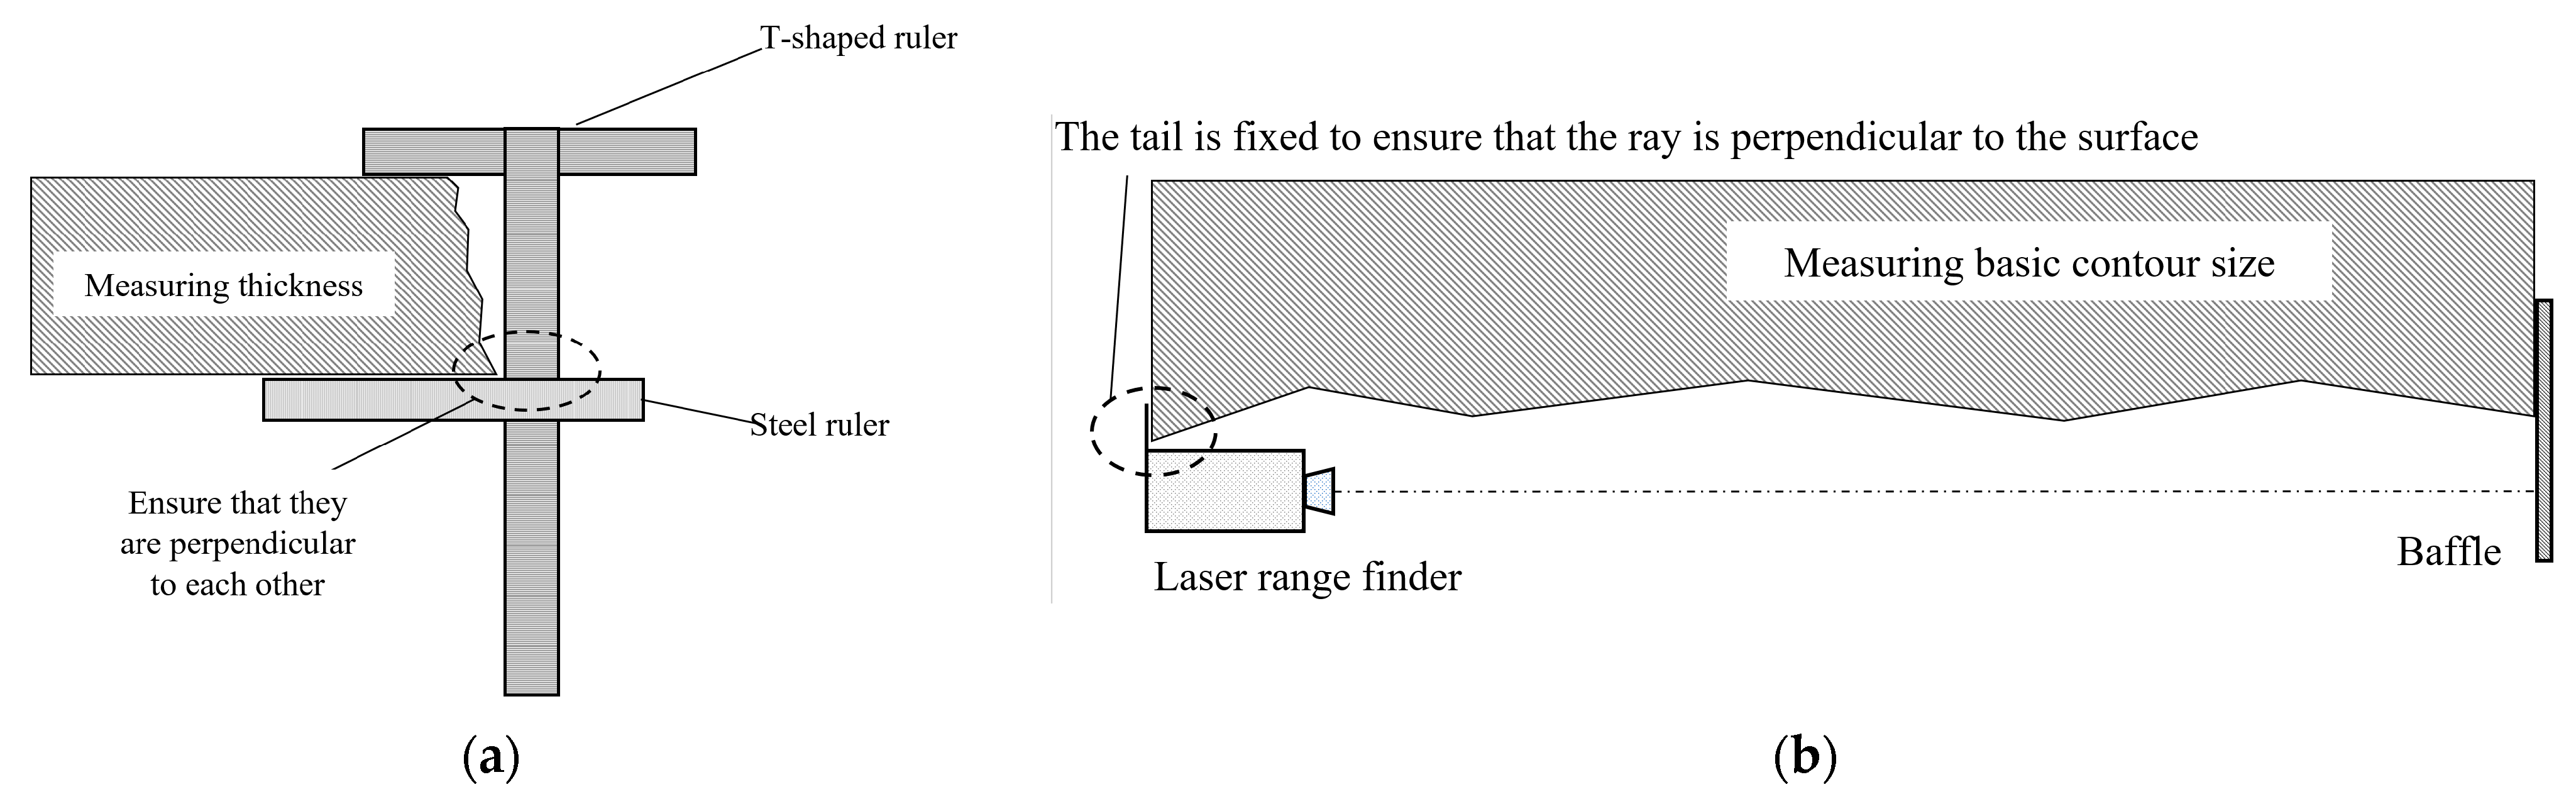
The thickness is measured with a T-shaped steel ruler, and the basic contour size of the box girder is measured with a laser rangefinder. The measuring accuracy of the two methods is less than 1 mm, which can meet the requirements of measuring accuracy. The two measuring methods are shown in
Figure 9.
3.3. The Status of PCVD of the Whole Cross Section
Compared to the design, the measured dimension is a random variable. In order to standardize the size of the measured components at variable sections and positions into samples of the same specification, the ratio of the measured section area to the designed section area is adopted as the indicator of deviation rate, namely:
where
is the deviation rate caused by pouring concrete volume deviation;
is the section area calculated from the measured data;
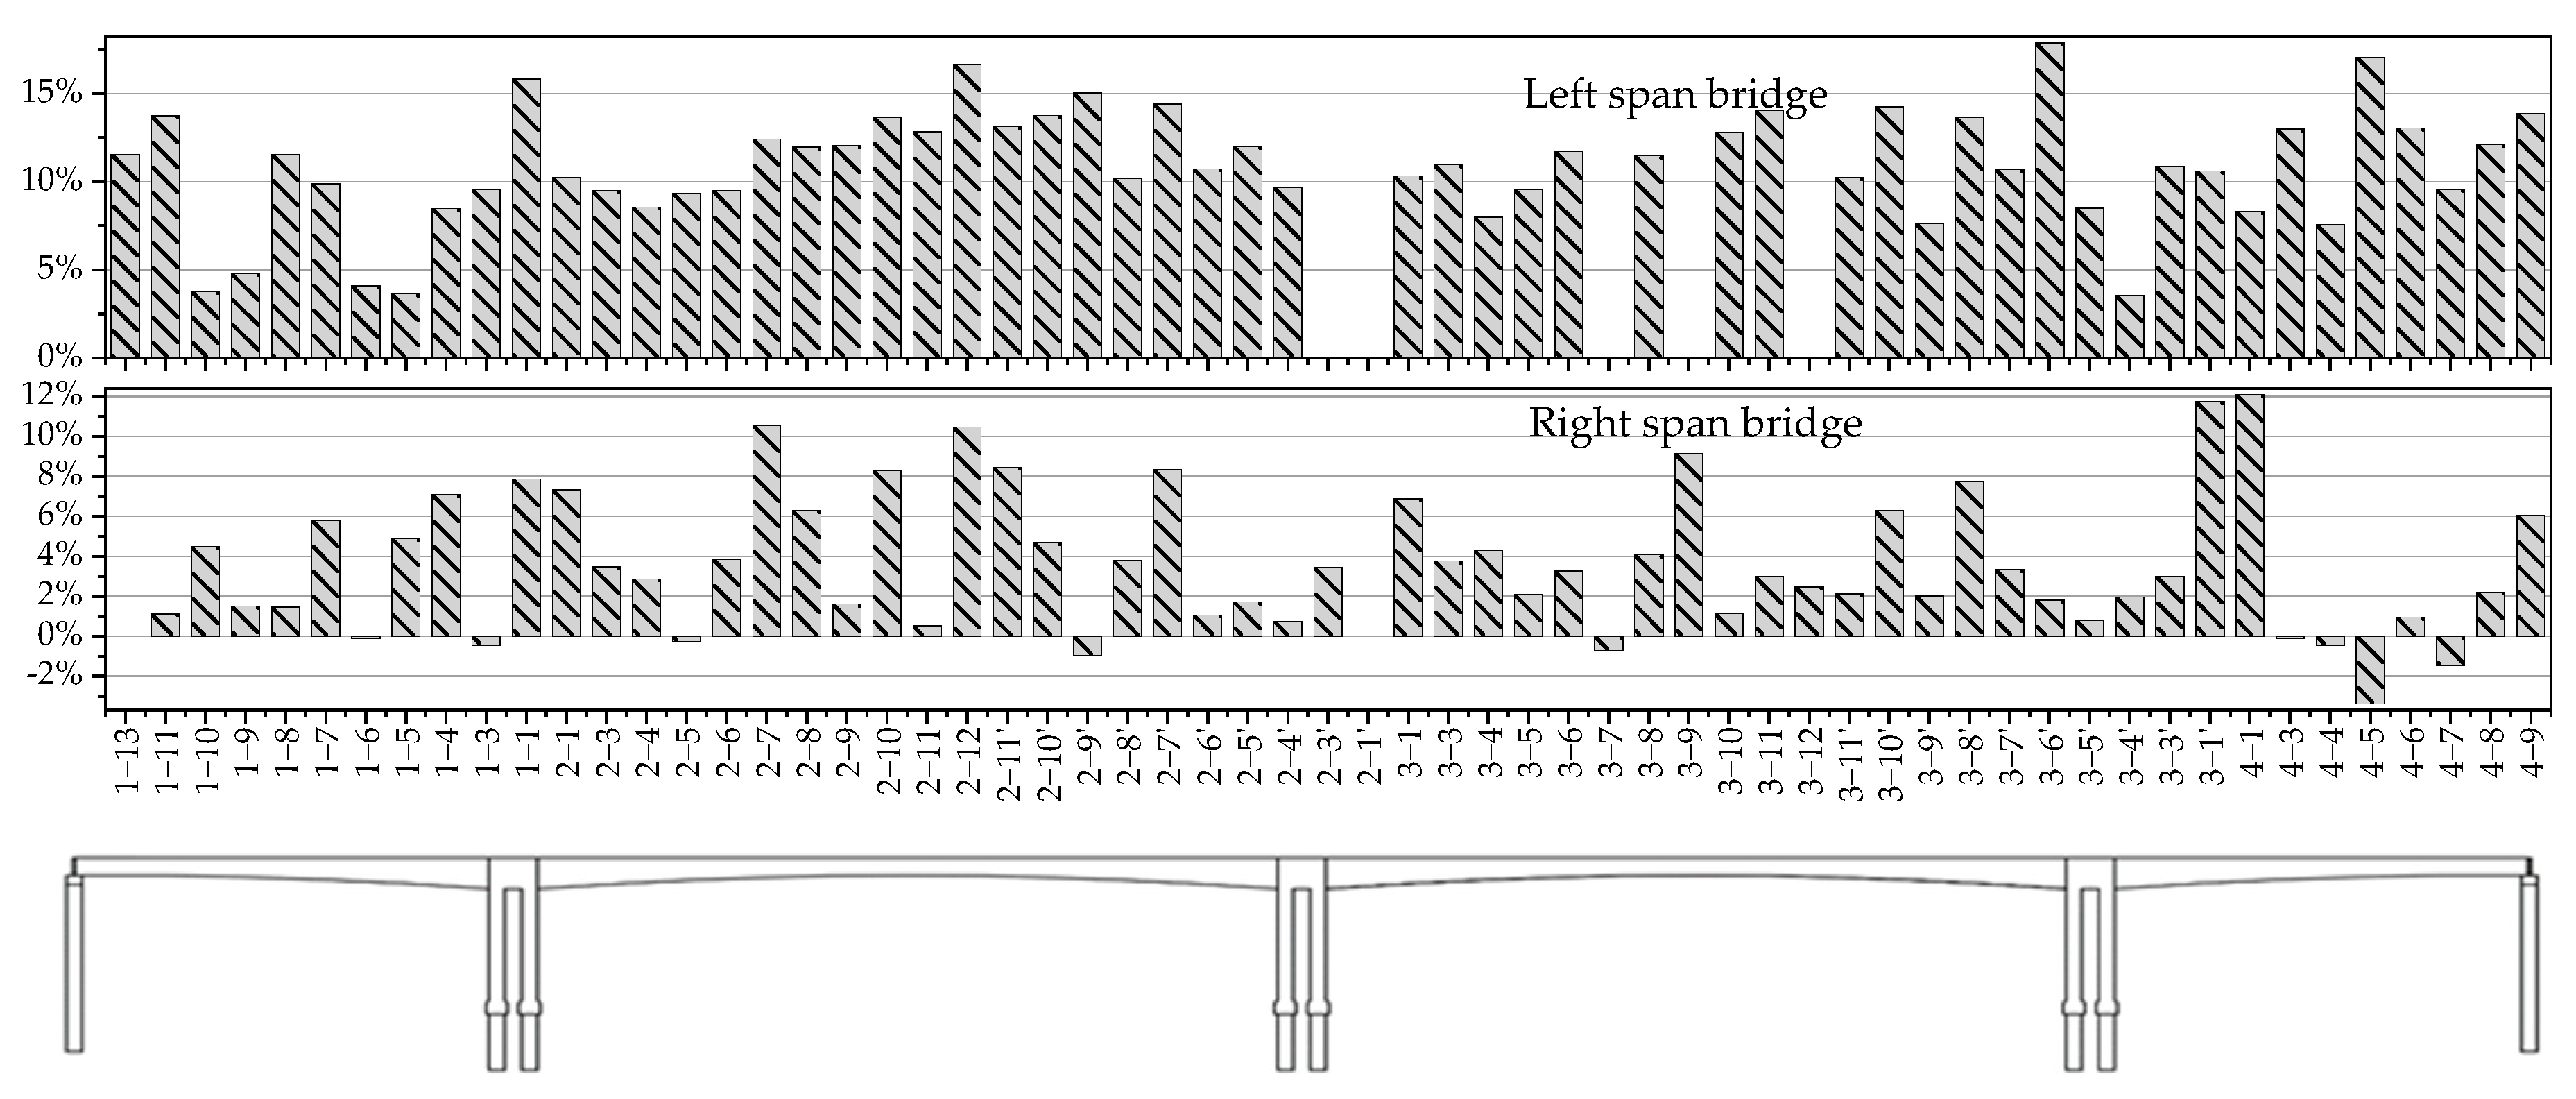
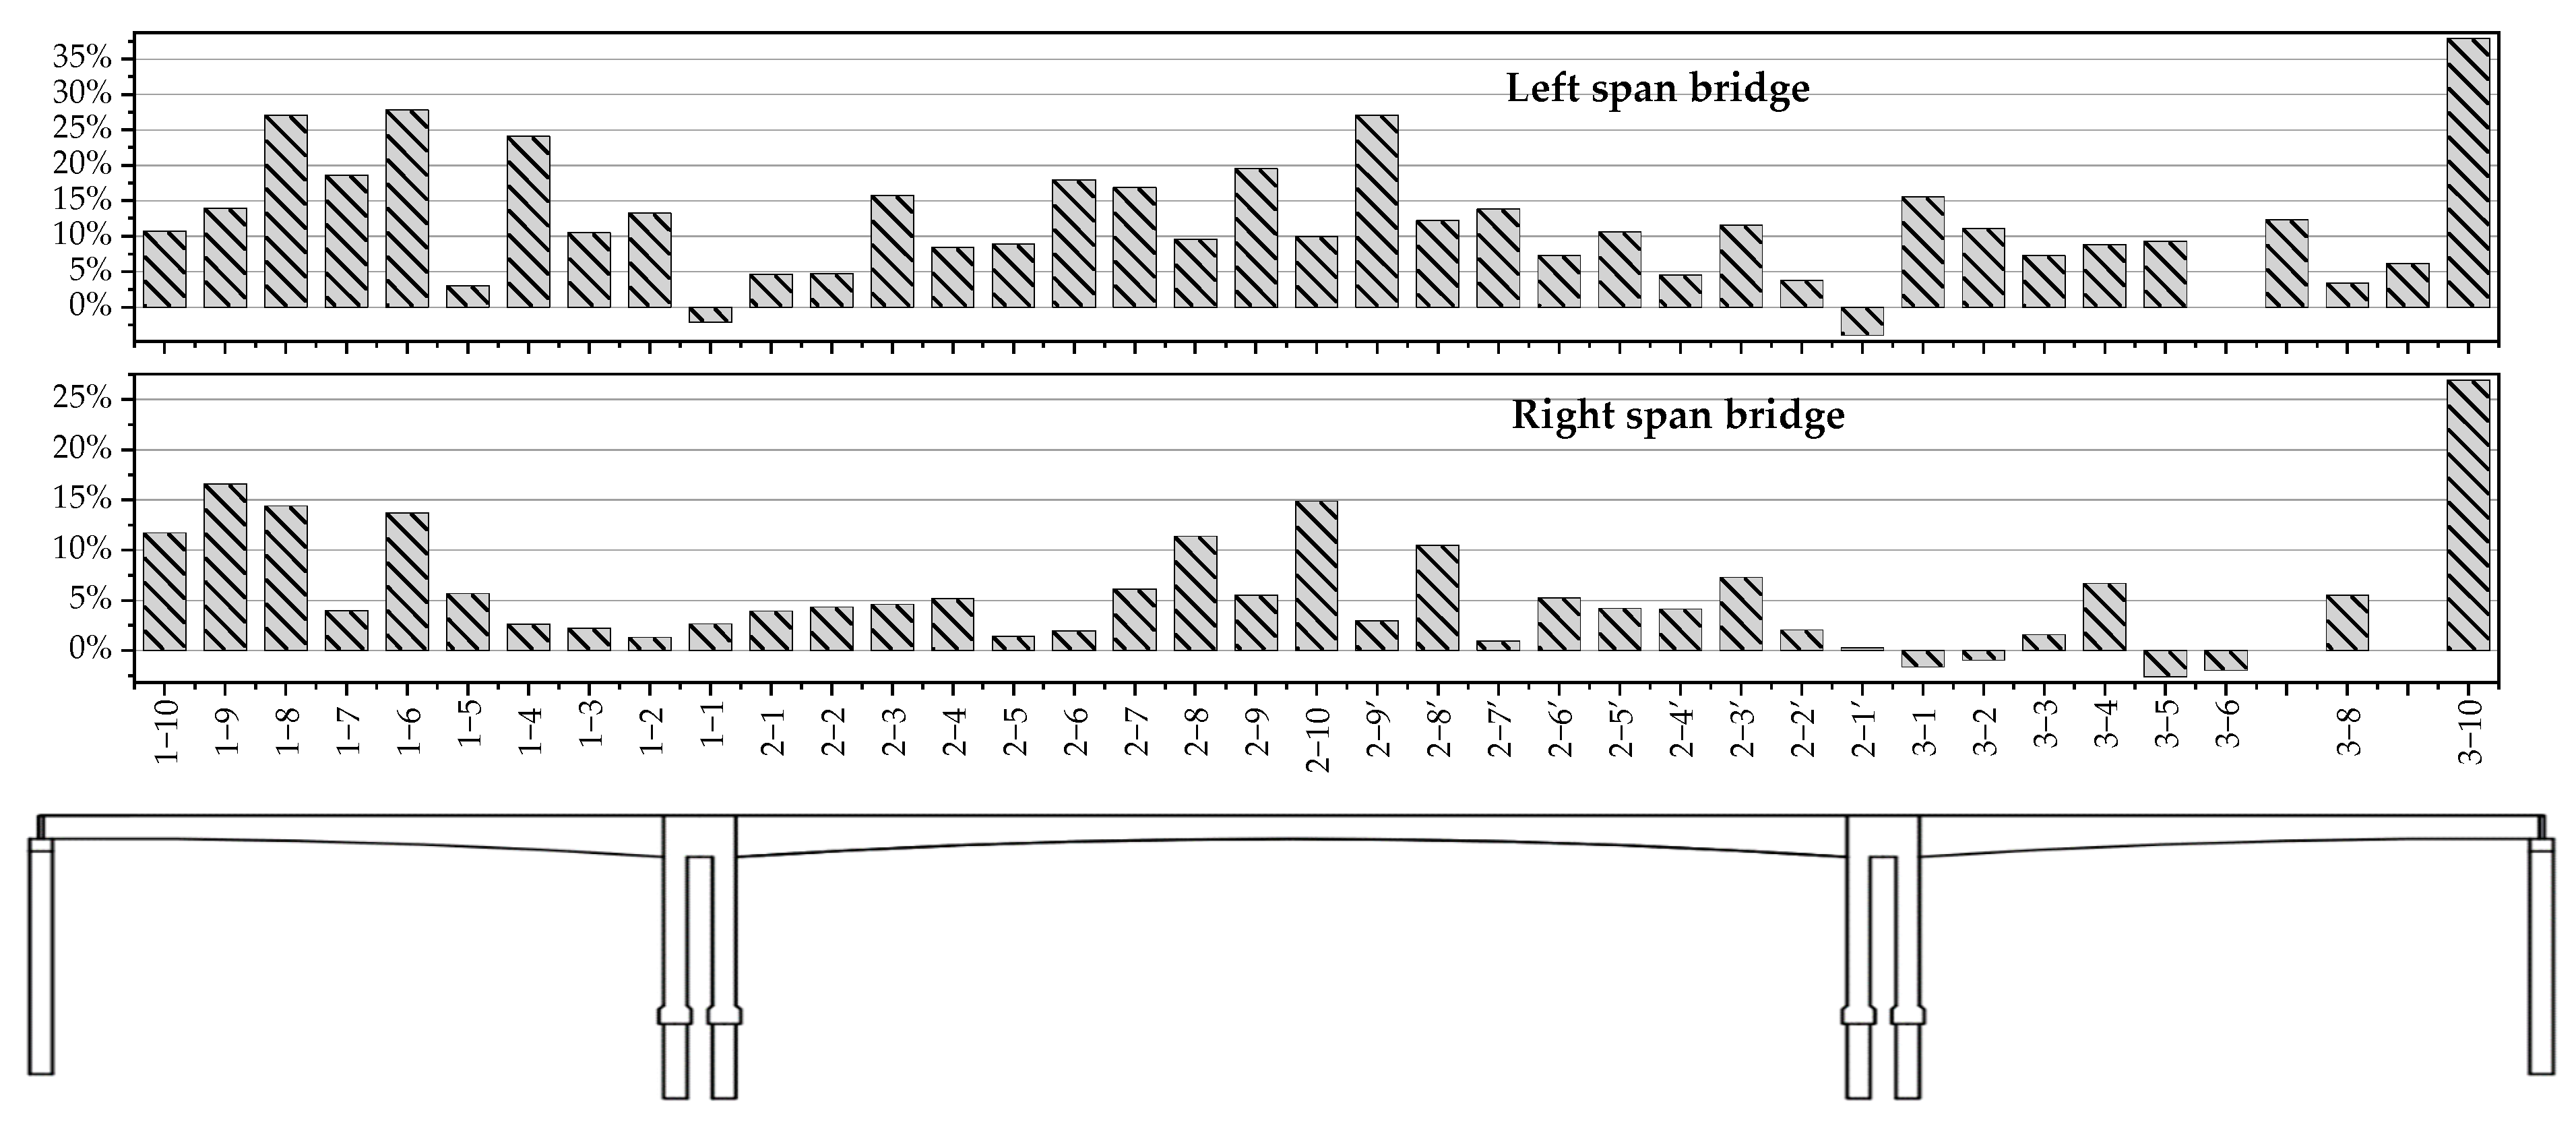
is the design section area. The
of each cross-section of bridge A and bridge B is shown in
Figure 10 and
Figure 11, respectively.
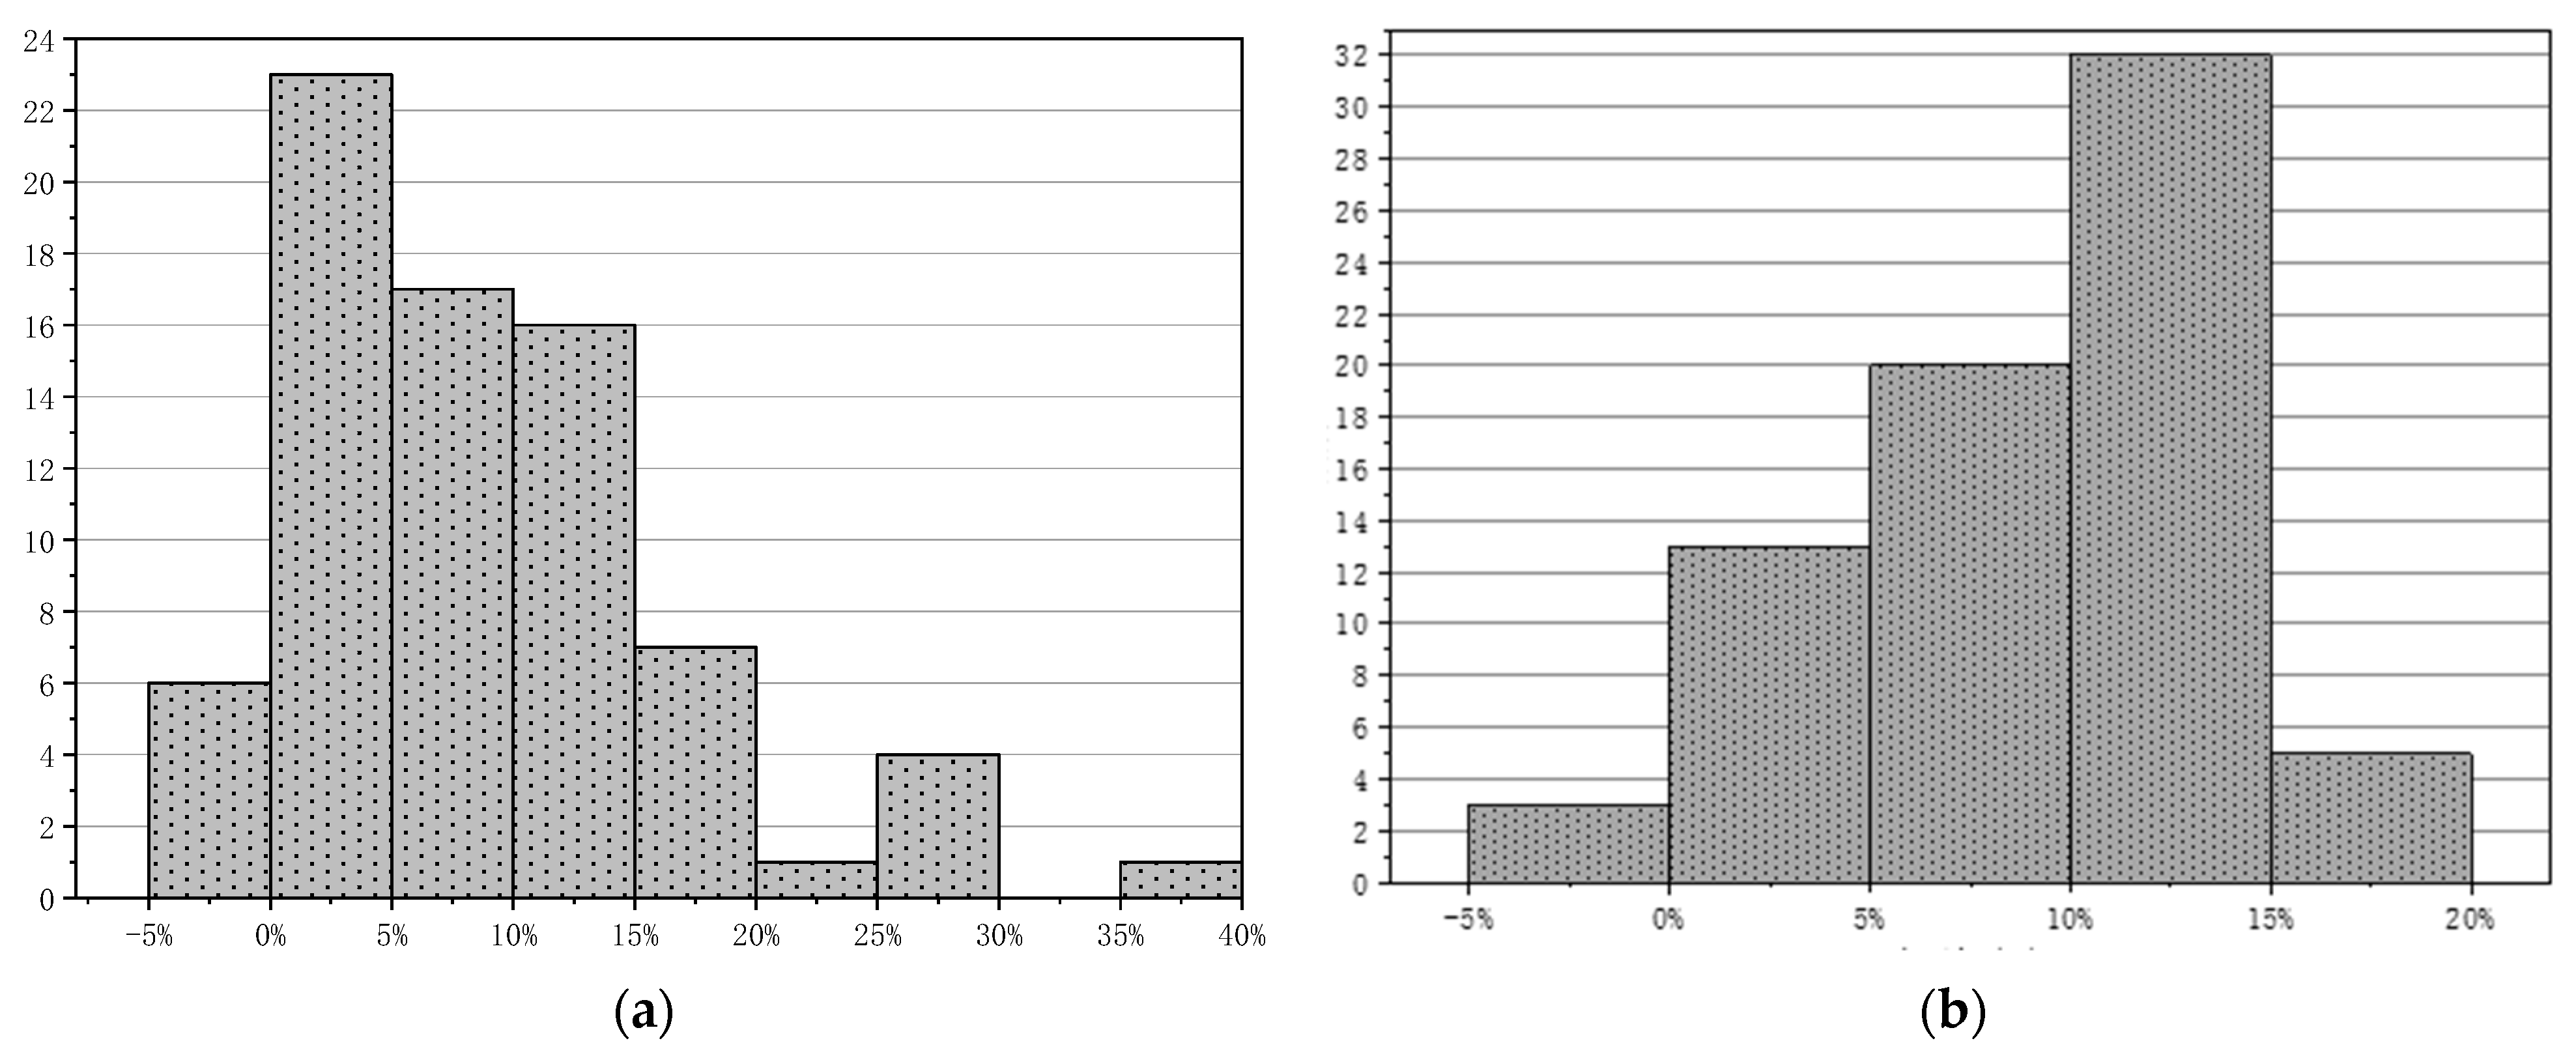
As shown in
Figure 12, the
of each cross-section was statistically analyzed. Moreover, the total number of samples, mean value, standard deviation, and 95% confidence interval were obtained, as shown in
Table 4.
The measured sectional size is generally larger than the design size, only a few segments are slightly smaller than the design size. The mean deviation rate of bridge A is 7.24%, and ranges from −3.38% to 17.87%. The mean deviation rate of bridge B is 8.89%, and ranges from −3.98% to 37.88%. The 95% confidence intervals of bridge A and B are [6.33%, 8.16%] and [7.04%, 10.75%], respectively.
The deviation rate reaches an extreme value of 37.88% for the section at the end of bridge B, and another extreme value of −3.38% is observed in bridge A. The standard deviations of the two bridges are 4.95% and 8.06%, respectively. It can be seen that the variation in the deviation rate along the bridge is huge.
Assume that the deviation rate
follows a normal distribution
. Skewness and kurtosis are one of the methods to measure whether a distribution follows a normal distribution [
30,
31,
32,
33]. According to Demir [
34], the kurtosis and skewness of distribution are affected by the sample size, thus the thresholds of skewness and kurtosis should be adjusted accordingly. In this paper, the absolute values of skewness and kurtosis are set to be less than 2.5 and 6, respectively. The skewness and kurtosis are calculated according to Formulas (2) and (3), and the results are shown in
Table 5.
where
and
is the mean value and standard deviation of
, and
E [·] is the mathematical expectation.
According to the results of skewness and kurtosis, the deviation rate of bridge A and bridge B conforms to the normal distribution and , respectively.
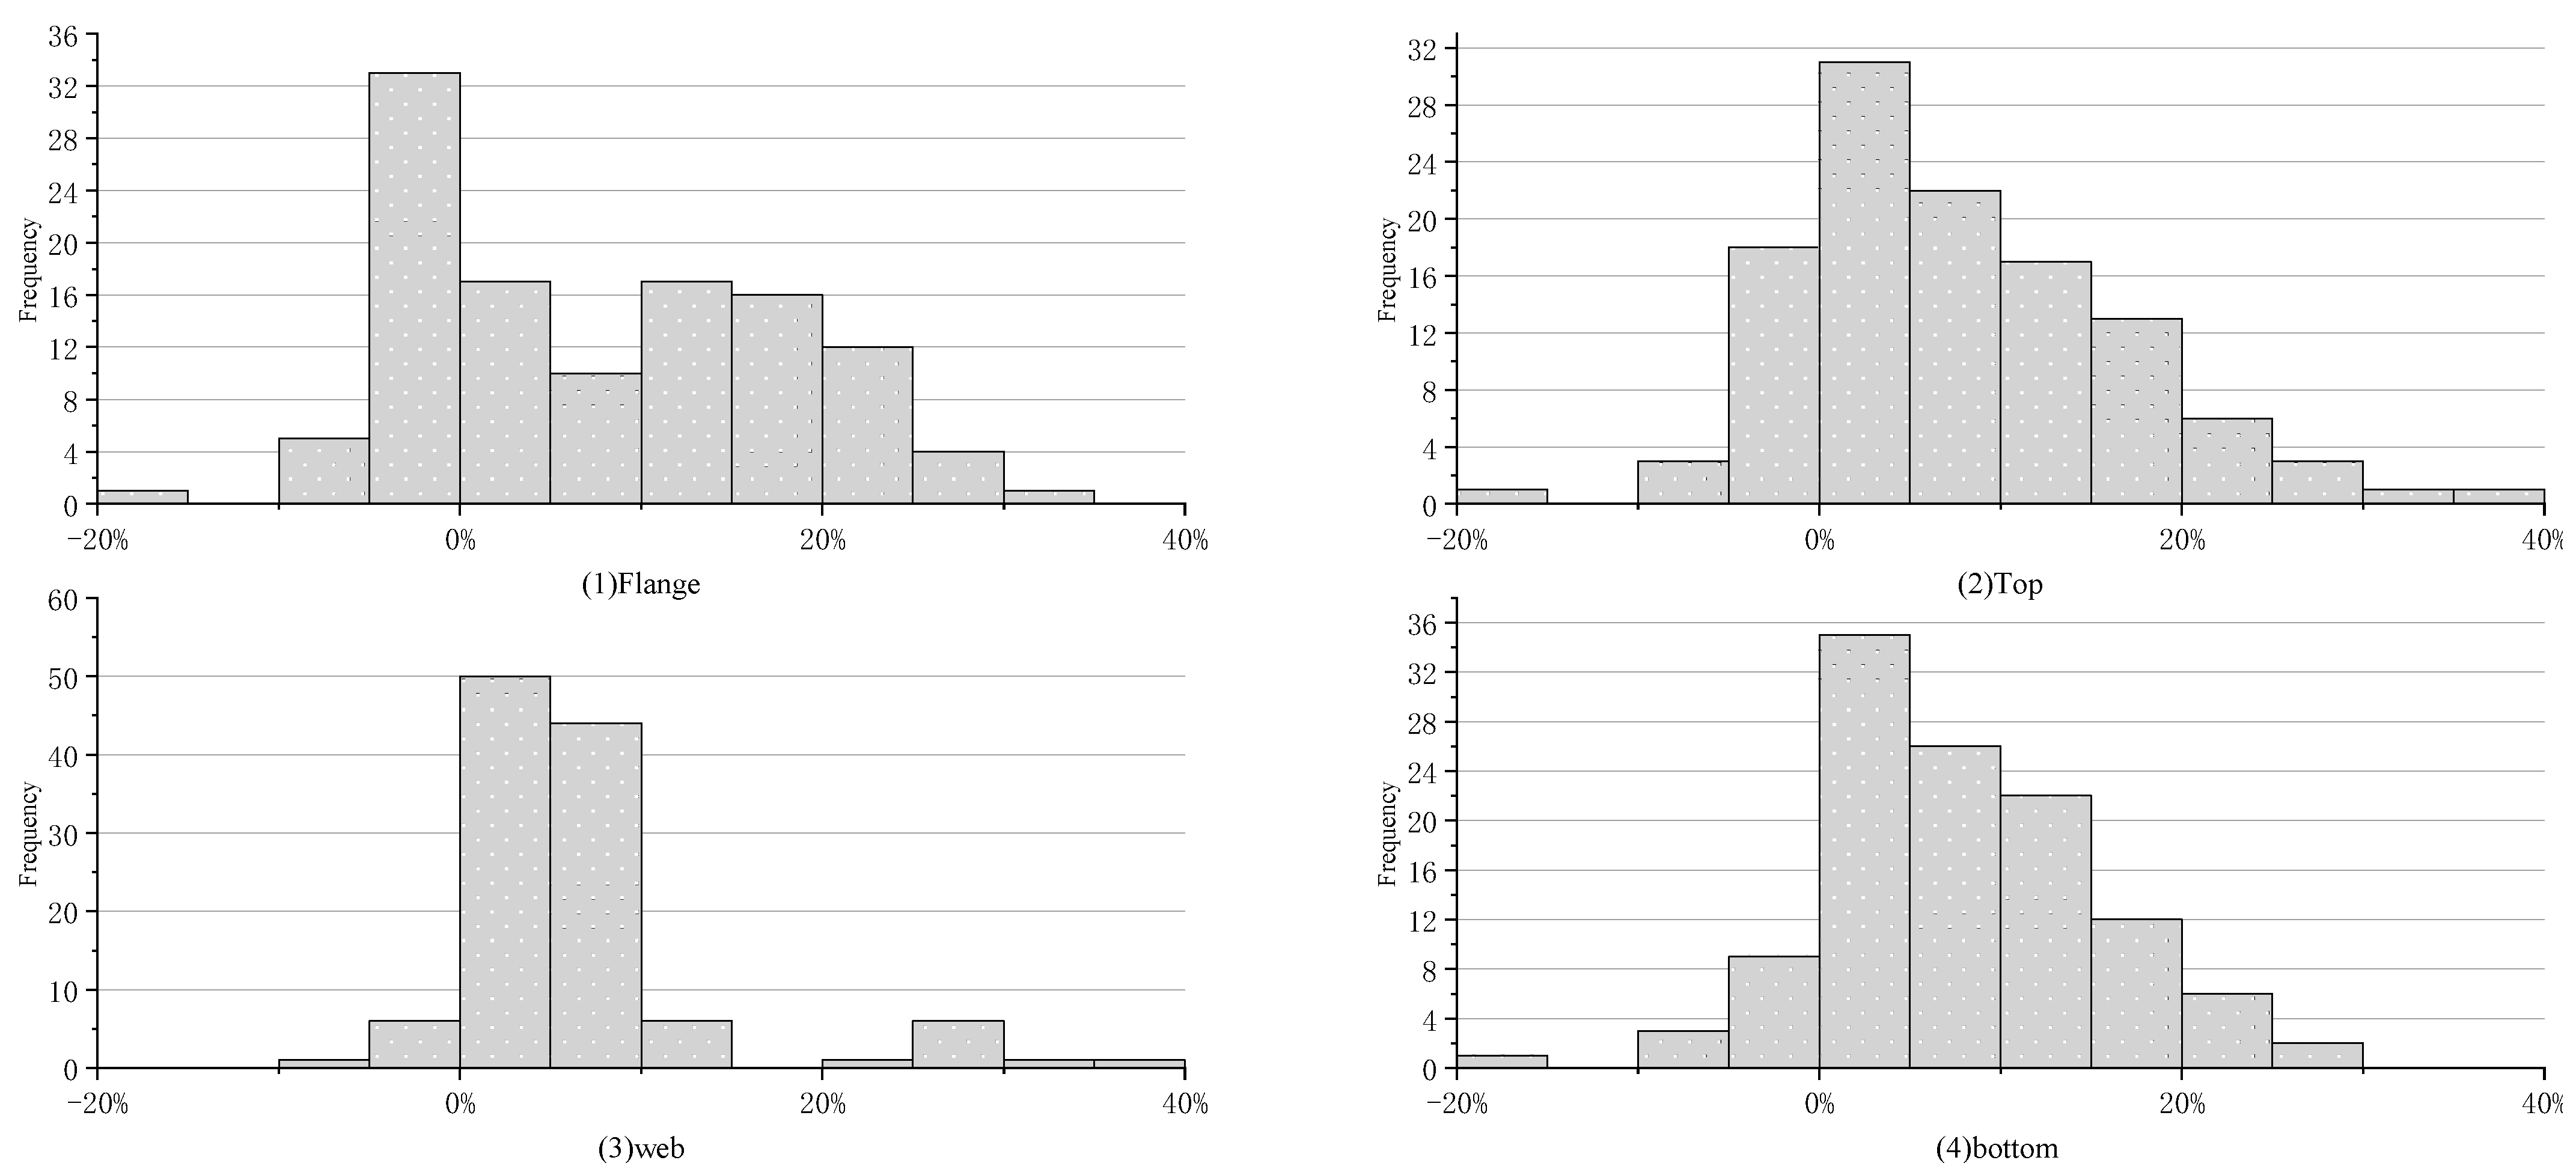
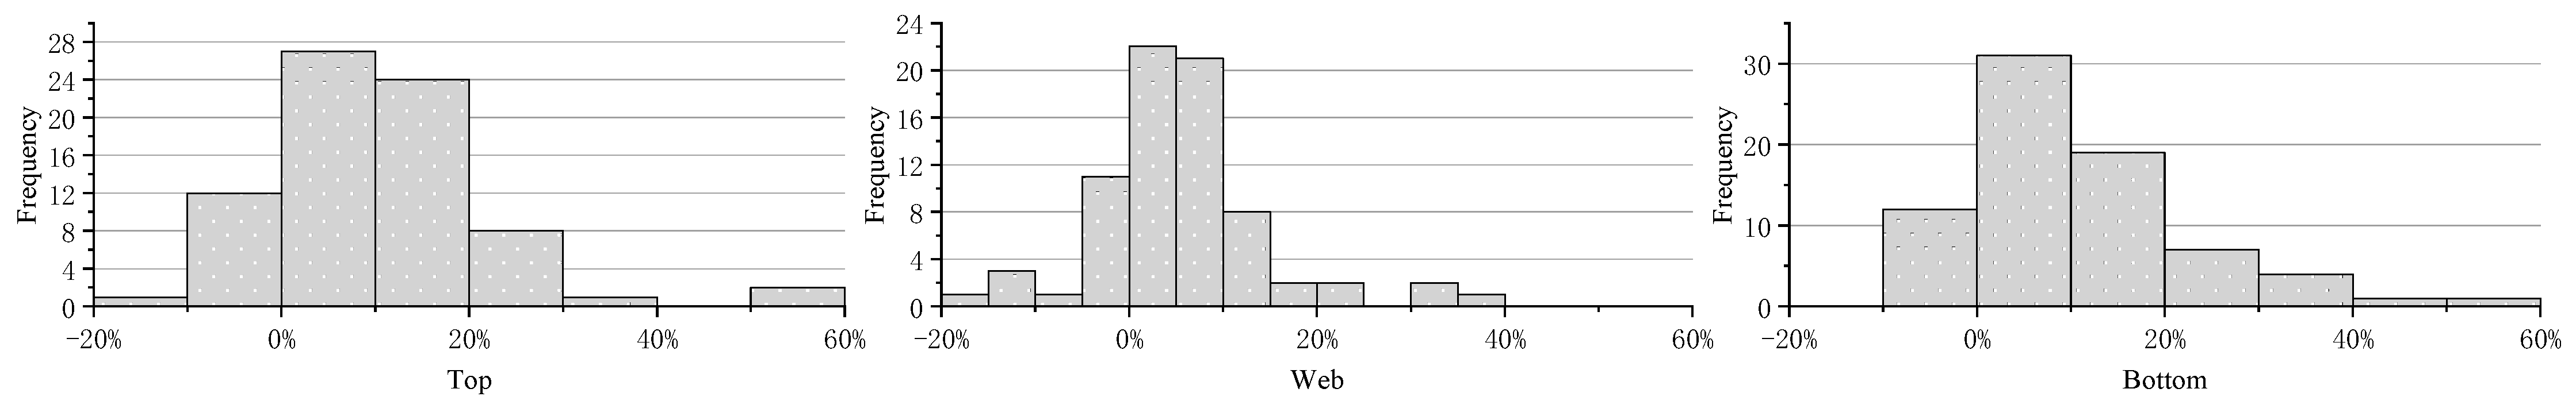
3.4. The Status of PCVD of Each Part in Cross-Section
According to the model analysis in
Section 2, the impact of pouring deviation on the stiffness of different parts is different. The deviation-distribution characteristics of each part of the two bridges are shown in
Figure 13 and
Figure 14, and
Table 6 and
Table 7.
The average deviation rates of the different parts of the cross-section are close to each other. The average deviation rates of the flange, top slab, web plate, and bottom slab of Bridge A are 7.83%, 7.68%, 6.38%, and 7.70%, respectively. The average deviation rates of the top slab, web plate, and bottom slab of Bridge B are 10.15%, 5.70%, and 10.20%, respectively. The deviation rates of different parts of the bridge A cross-section are within the range of −16% to 35%, and the deviation rate of the bridge B cross-section is within the range of −15% to 40%.
The kurtosis and skewness of the deviation rates of the different parts of bridge A and bridge B cross-sections are shown in
Table 8. It can be considered that the deviation rates of different parts of a cross-section conform to the normal distribution.
The deviation rate of the same part varies greatly in different positions along the bridge, and occasionally large deviation rate appears. The deviation rate of the bottom plate of the side span at the end of bridge B reaches 58.27%, and the deviation rate of the web near the pier of bridge B reaches −17.45%
It can be seen that all the high deviation rates of bridge B occur at the end of the side span. A possible reason for this result is that in the bridge design, the section at the end of the bridge span has a different form and dimension than the rest of the sections and needs to be constructed separately. The construction technology at that time is relatively poor and caused problems such as formwork deformation and inaccurate formwork lofting, which in turn led to insufficient fulfillment of the design requirements [
35,
36]. Additionally, the side span is located on the pier and the deviation has a relatively small impact on the superstructure, making the pouring volume deviation neglected during construction.
3.5. Absolute Quantity Analysis of PCVD of Each Part
The deviation rate characteristics of each part have been described in detail. The deviation rates of each part represent the deviation degree of the actual size relative to the design size. The area of different parts in the box-girder section is different, and the absolute excess square amount varies greatly under the same deviation rate. According to Formula (4), the weighted mean deviation area at different sectional parts is calculated to reflect the contribution degree of deviation at different positions.
where
and
are the mean value of deviation rate and weighted area of one part in the cross-section, respectively;
is the sum of this particular sectional part over the whole bridge; and
is the weighted mean deviation area of this part.
As can be seen from the calculation results in
Figure 15, the influence of both variable and equal-thickness webs on dimensional variation is limited. The weighted deviation area of the bottom slab near the pier are large, indicating that the bottom slab near the pier has a great influence on the deviation of the whole bridge.
3.6. Coefficient of Variation of Dead Load Due to Casting Size Deviation
The cross-section casting deviation rate follows a normal distribution. When considering the dead-load variation caused by the casting size deviation, the design and operation period calculation of continuous rigid-frame bridges should adopt the probability limit state design method to ensure that the load value takes into account the influence of casting deviation within a certain probability. The load value should be calculated according to Formula (5):
where
is the value of dead load considering the PCVD,
is the standard value of dead load,
is the average deviation rate of the whole cross-section,
is reliability coefficient corresponding to the specified probability of
, and
is the standard deviation of the deviation rate of the whole cross-section.
Let
be the coefficient of dead load due to casting deviation, and the calculation formula of
is as follows.
When the specified probability is set to 95%, the corresponding reliability coefficient = 1.645, and the of bridge A and bridge B are 1.15 and 1.22, respectively. It is necessary to consider when considering the variation of dead load caused by casting deviation.
4. Analysis of the Influence of PCVD on Stiffness
The deflection of the beam with variable section is closely related to the external force and the section moment of inertia. The calculation formulas of deflection in literature [
12,
13] all show that the deflection is related to the section moment of inertia. The cross-section moment of inertia is selected as the index to reflect the macroscopic stiffness of the bridge, and the stiffness deviation coefficient
is defined to reflect the influence of pouring volume deviation on the bridge stiffness. The stiffness deviation coefficient
calculated as shown in Formula (7).
where I and
are section moment of inertia calculated by measured value and designed value, respectively.
The frequency distribution histogram of
of bridge A is shown in
Figure 16, and the descriptive statistics are shown in
Table 9.
From the value of eccentricity kurtosis, it can be estimated that the stiffness correction coefficient , the mean stiffness correction coefficient is 0.013377 and ranges from −0.138 to 0.327, and the 95% confidence interval is [0.11871, 0.14882].
As mentioned above, the variation of the moment of inertia of the section is affected differently by the deviation of each part. With the deviation rate of each part of each section as the independent variable and the deviation coefficient of stiffness of each section as the dependent variable, a multiple linear regression model was established, as shown in Formula (8), and the least-square method was used for fitting.
where
,
and
are regression coefficients,
is the intercept.
There are 116 observed values, and the fitting results are as follows: = 0.130121, = −0.00244, = 0.110192, = 0.75923, C = 0.058293.
Multiple R = 0.748, indicating that the casting size deviation of each part has a strong correlation with the change of section moment of inertia. F-test was used to determine whether the global linear relationship of the independent variable was significant. F = 35.3, significance F = 5.2 × 10⁻¹⁹ < 0.01, in general, the pouring deviation ratio of all parts had a strong correlation with the stiffness-deviation coefficient, indicating a strong significance.
An Independent sample
t-test was conducted for each parameter. The hypothesis was set as
= 0, i = 1, 2, 3, 4. The t statistic and the hypothesis probability
p-value of each parameter are shown in
Table 10. At the 95% confidence level,
and
both have poor significance and cannot meet the standard, so it can be concluded that the hypothesis is true, that is,
and
= 0.
The fitting formula is shown in (9). It can be seen from the parameter values that the casting size deviation of the flange and the bottom slab has a significant impact on the stiffness deviation coefficient. Due to the change of the actual CRCR bridge section along the bridge direction, it can be seen from the analysis of the absolute value of the casting size deviation in
Section 3.5 that the deviation of the bottom slab dominates near the pier position, so it is reasonable that the bottom plate has a significant impact on the stiffness deviation coefficient.
Based on the survey results mentioned above, for the inspection of an existing continuous rigid-frame bridge, the mean value can be considered, that is, = 0.13; for the design of cantilever cast continuous rigid-frame bridge, the lower limit value in the 95% confidence interval of the statistical quantity can be considered, that is, = 0.12.


