


Research on Corrosion Rate Model of Reinforcement in Concrete under Chloride Ion Environments
Abstract
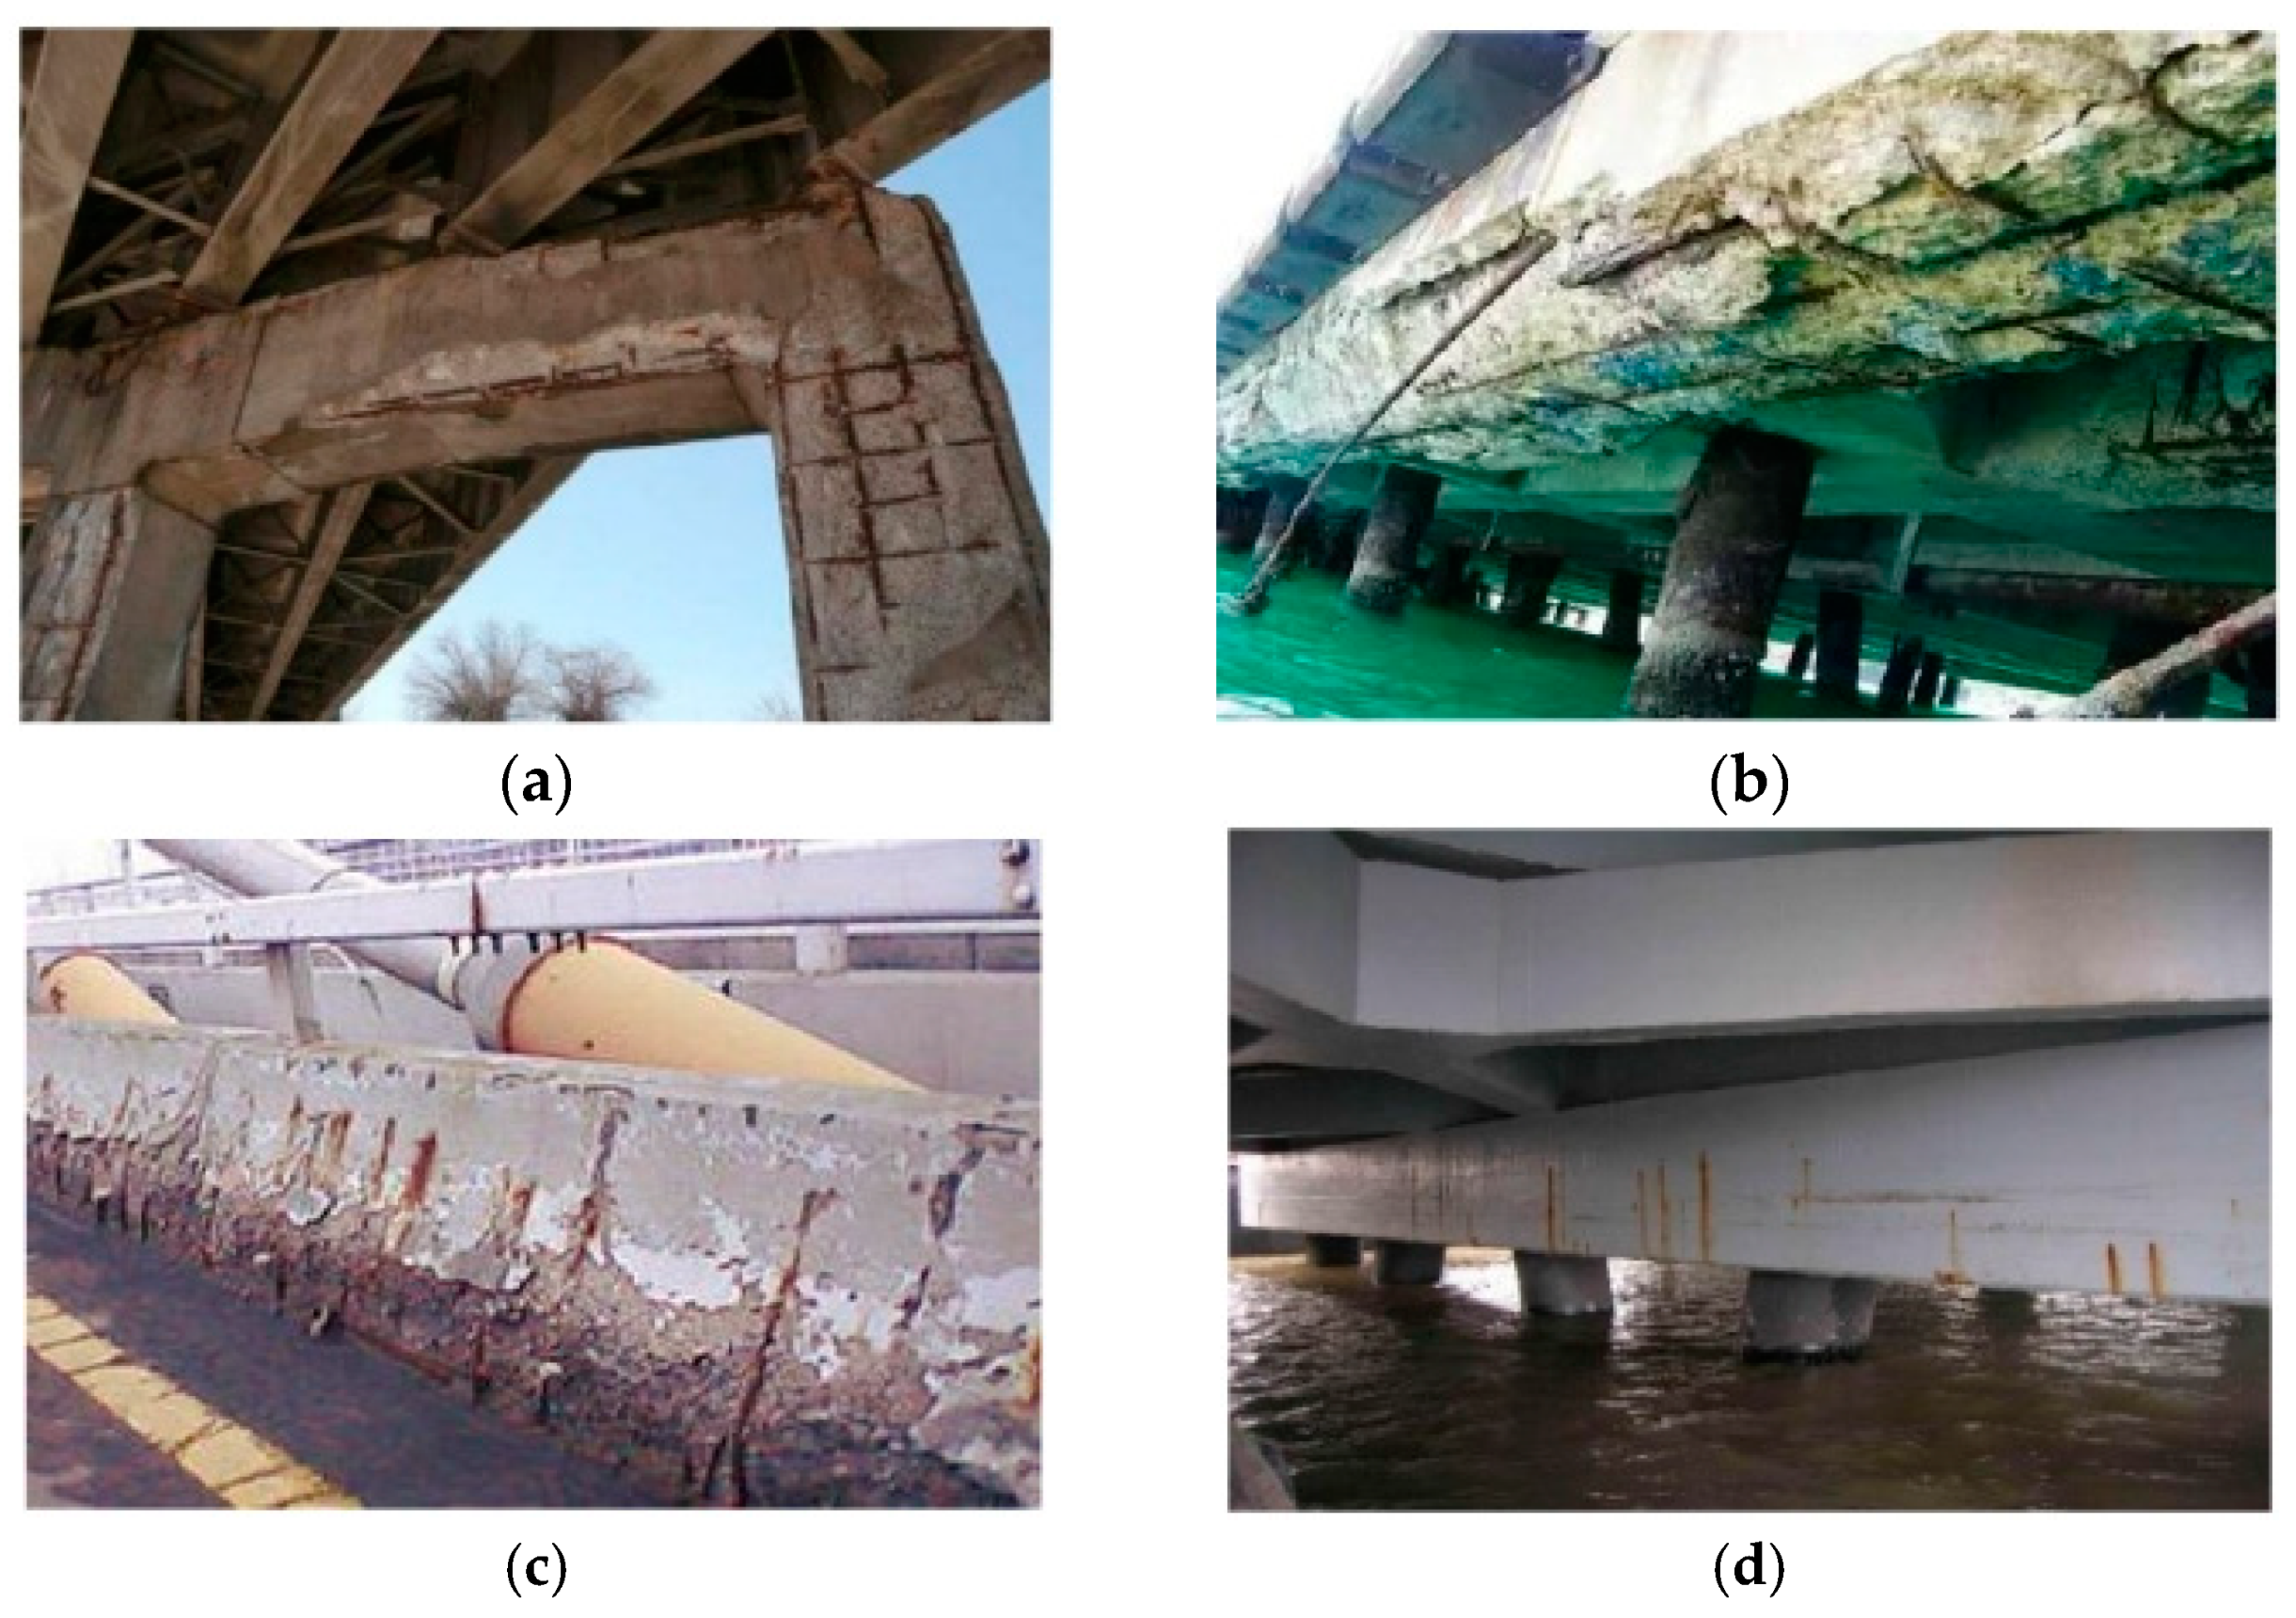
:1. Introduction
2. Empirical Models for Predicting Corrosion Rate
3. Result and Discussion
3.1. Data Sorting
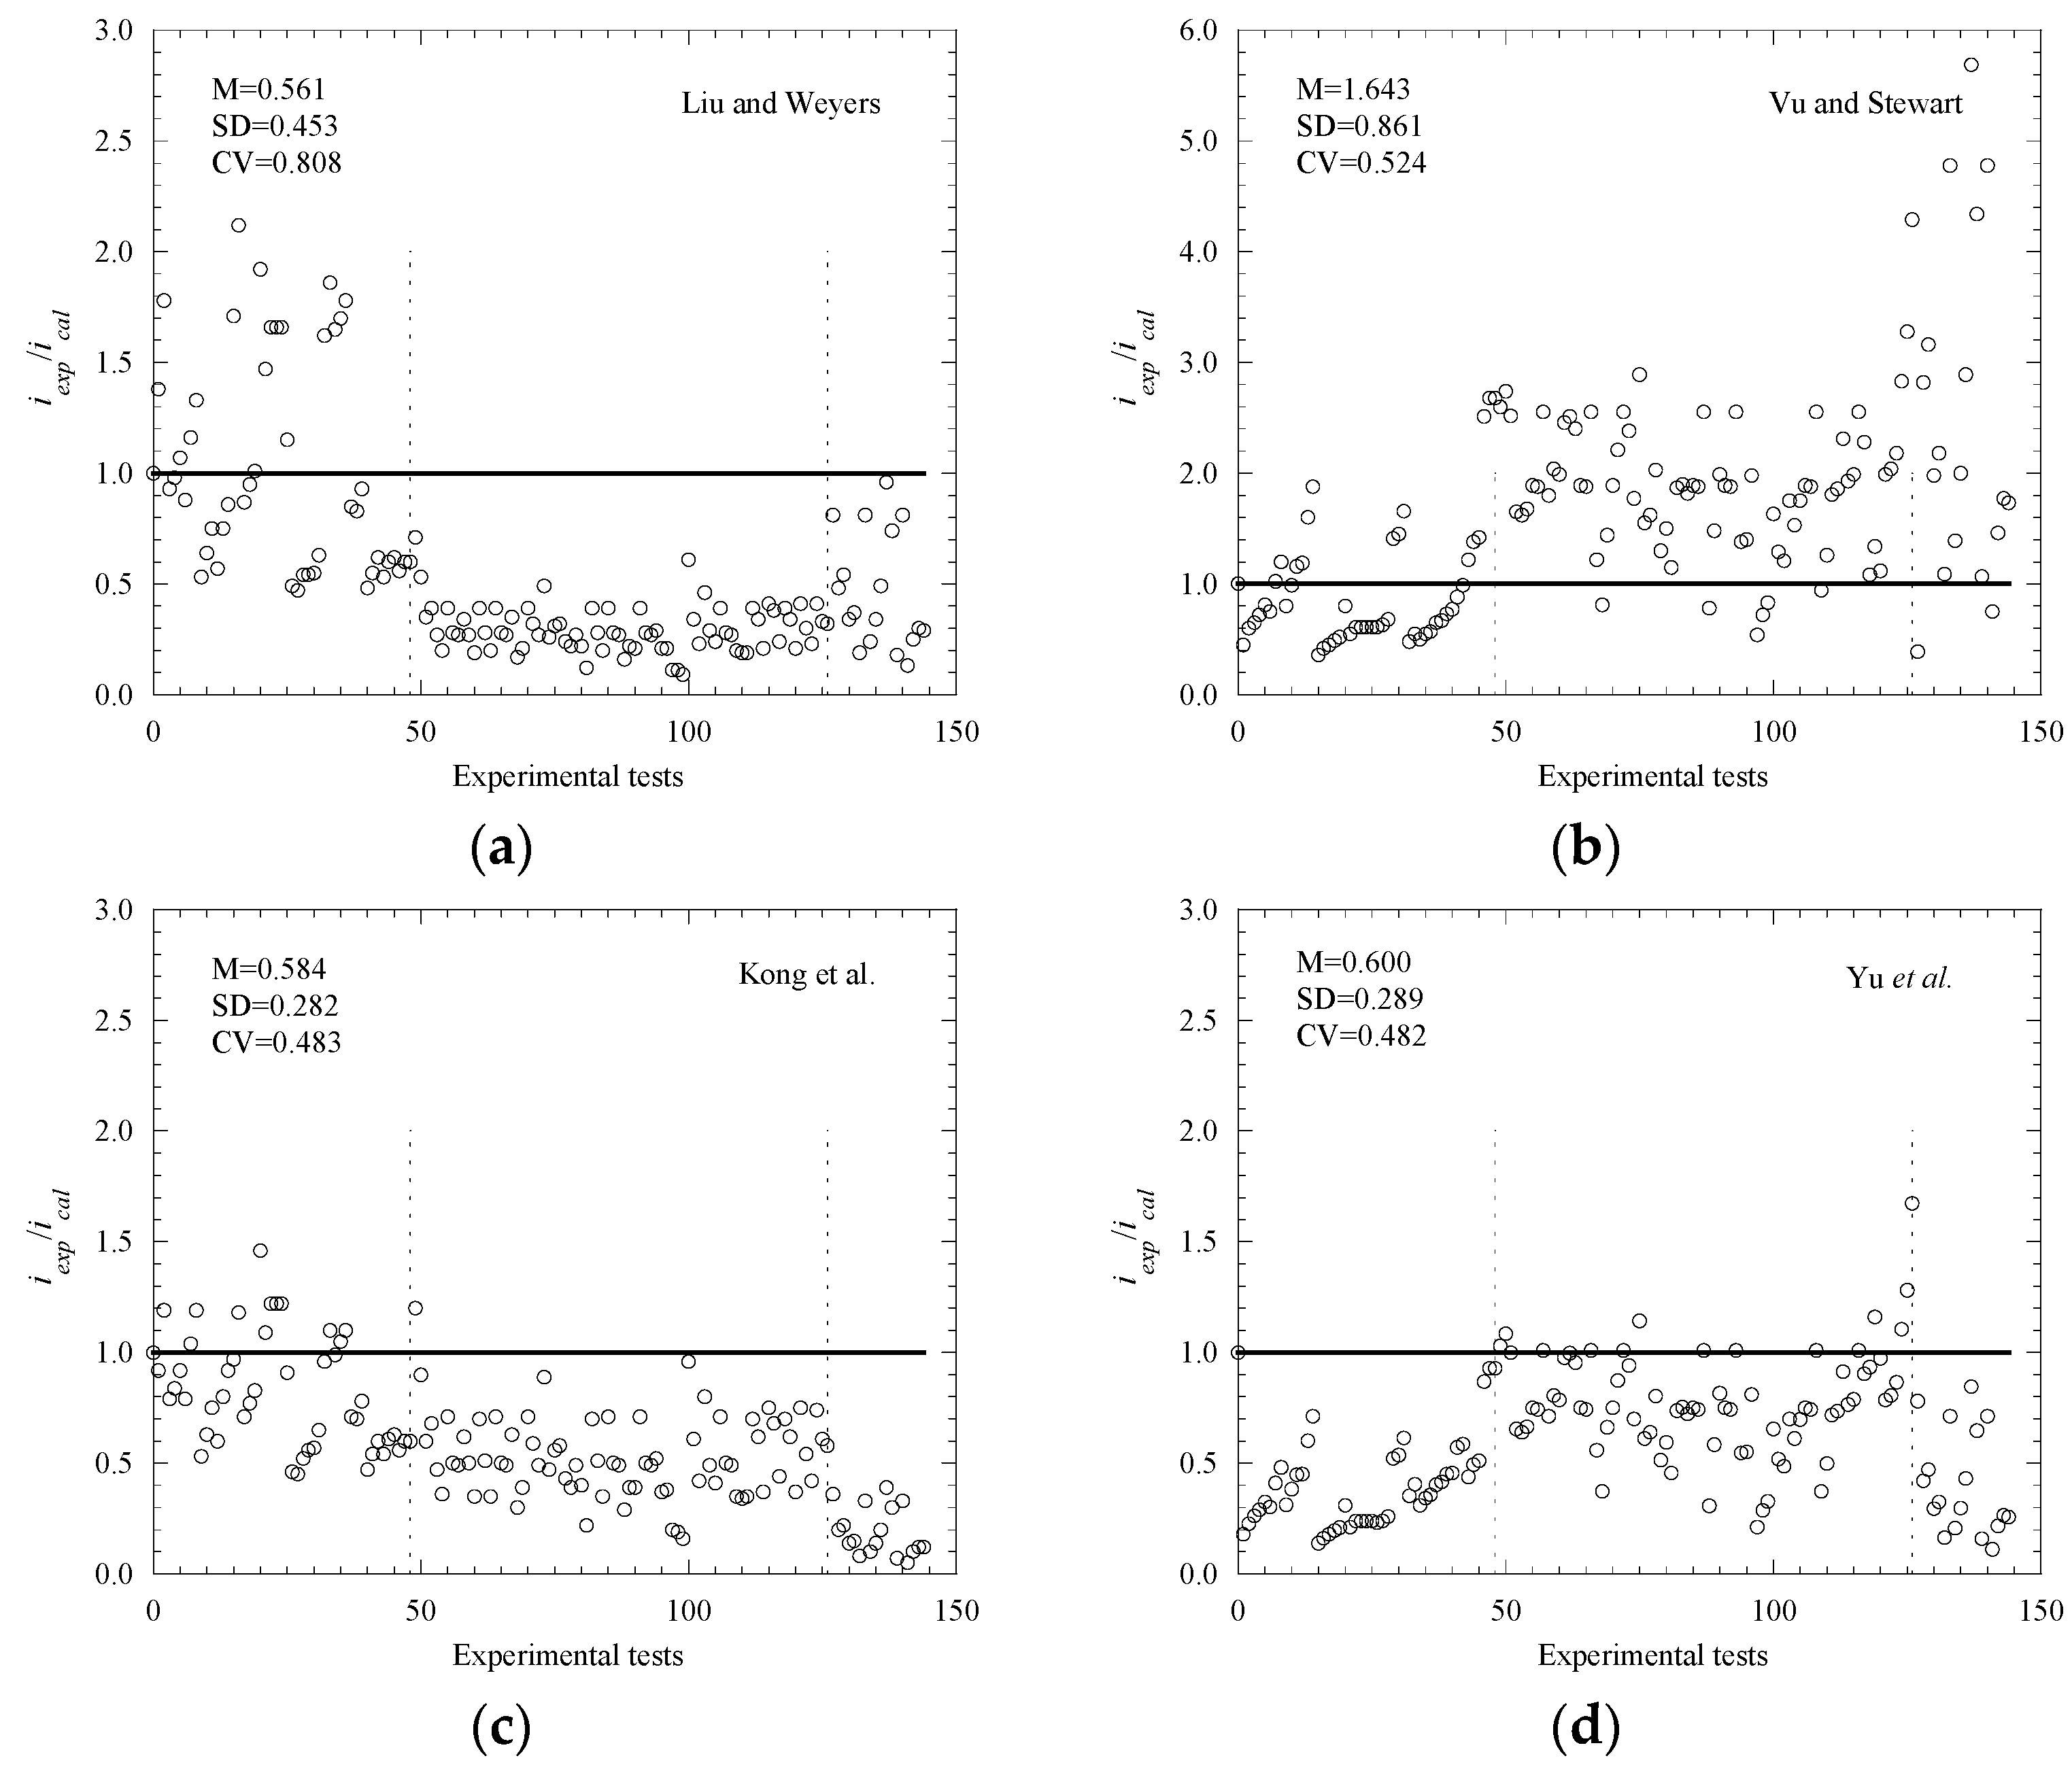
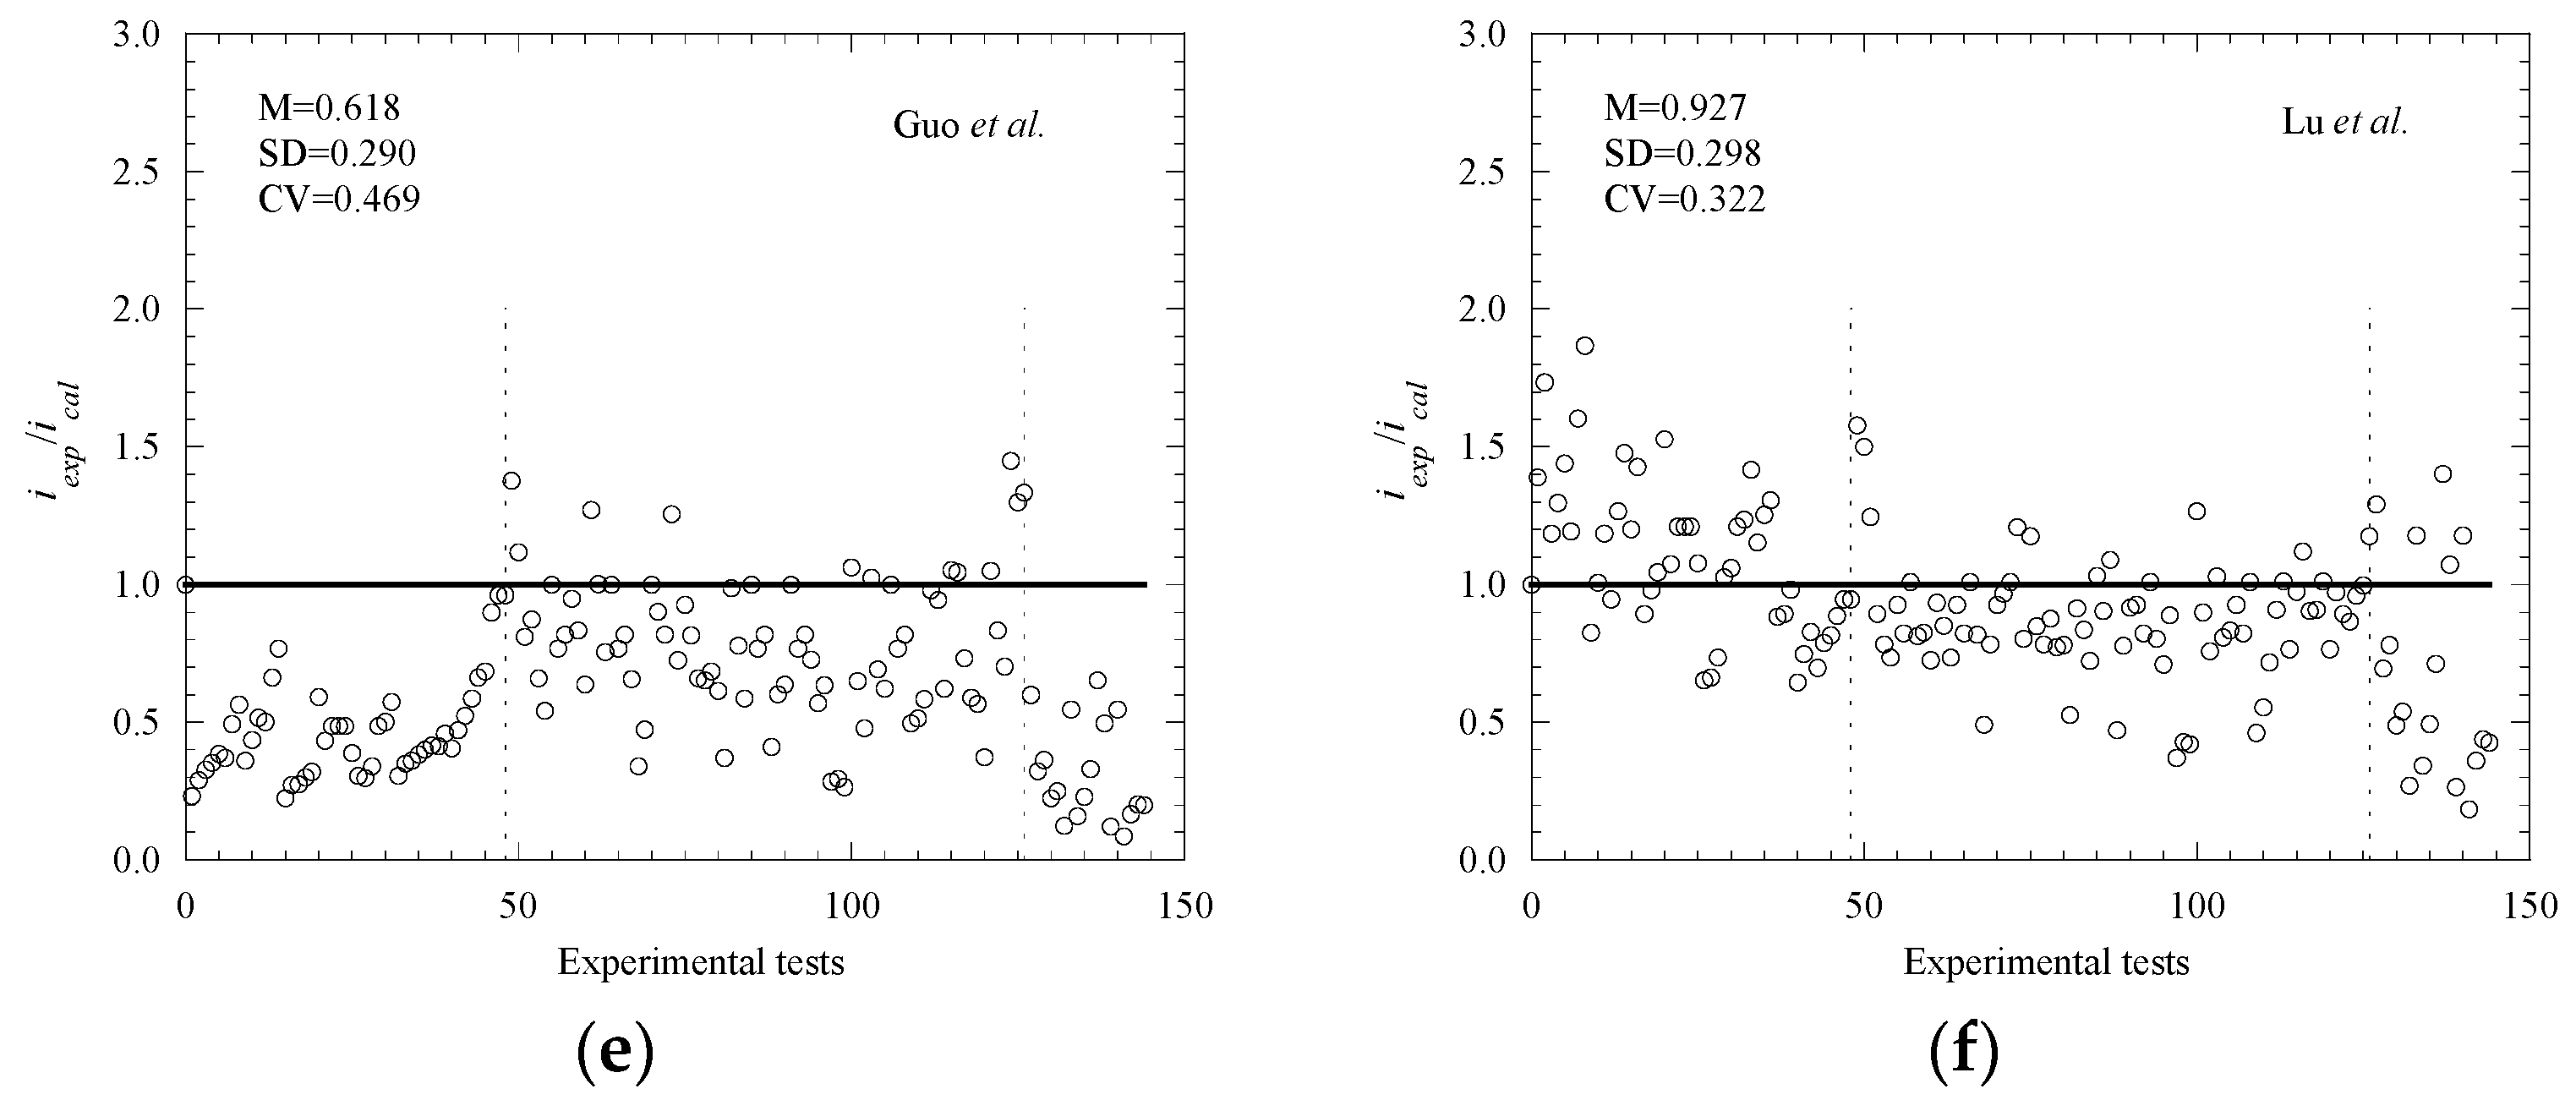
3.2. Analysis of Comparison Results
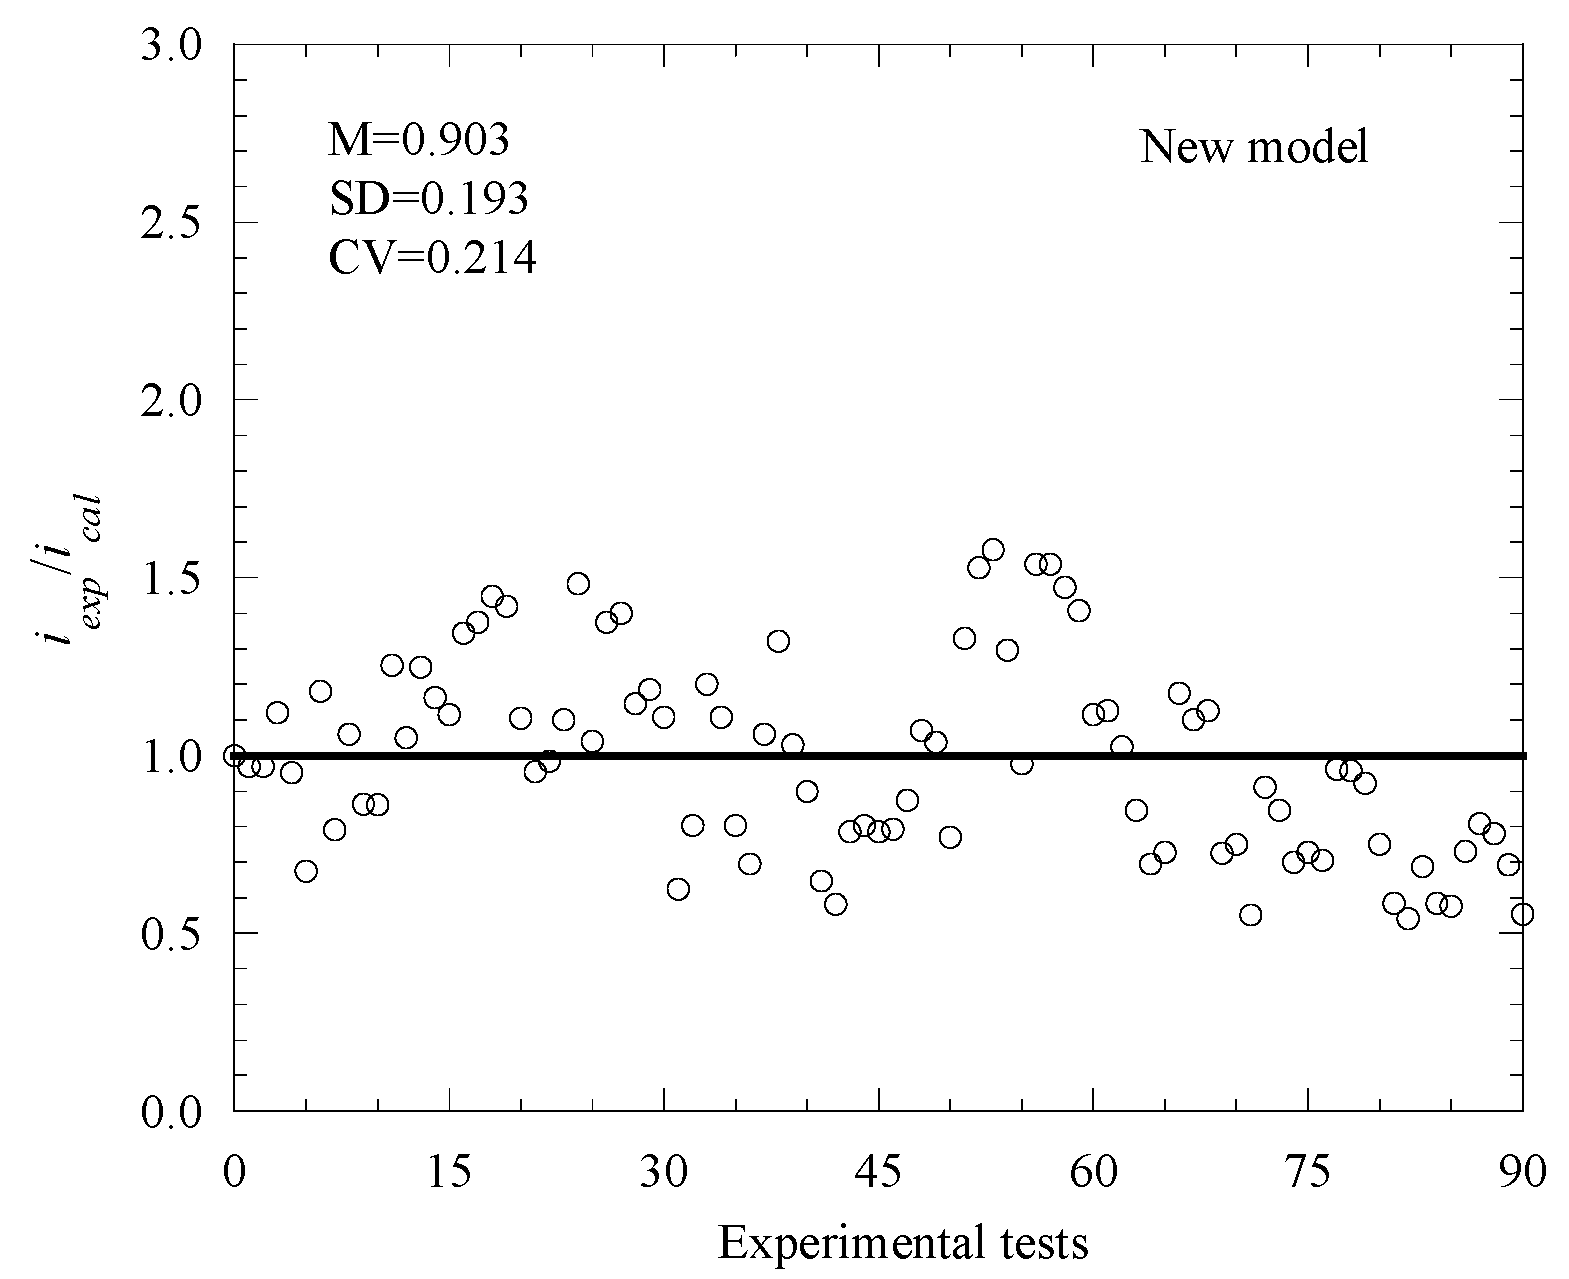
3.3. New Model Proposal and Verification
3.3.1. Proposal of a New Model
3.3.2. Model Validation
3.4. Model Error Analysis
4. Conclusions
- (1)
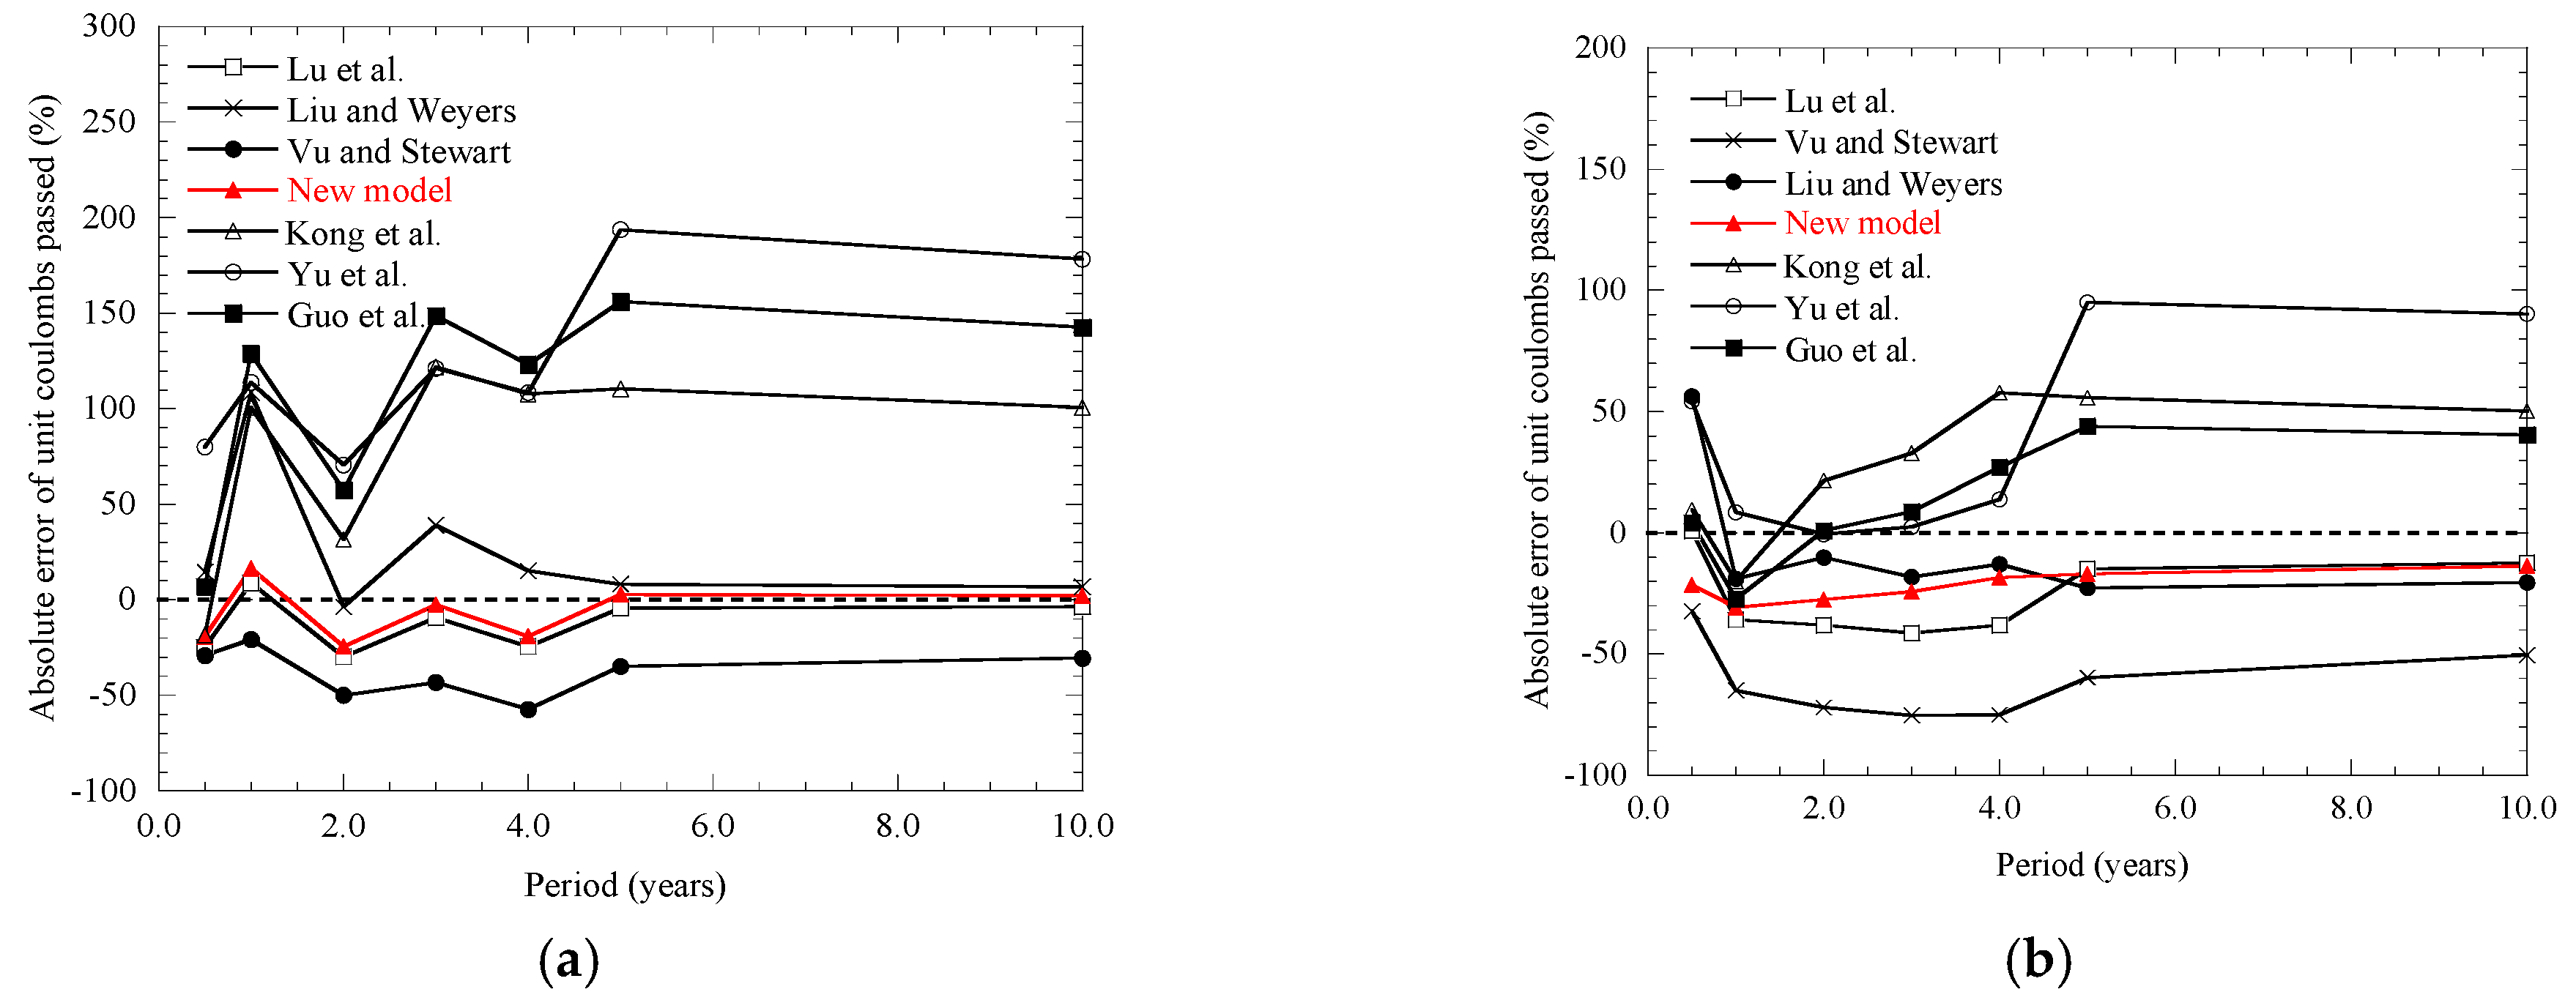
- Through the comparative analysis of existing prediction models, the prediction results of Liu and Weyers, Kong, et al., Guo et al. and Yu et al. overestimated the experimental results; on the whole, the predicted result of Vu and Stewart underestimated the experimental results, while Lu et al.’s prediction results are generally better than those of other models.
- (2)
- This paper proposes a new prediction model, which can also conduct in-depth analyses of environmental temperature and humidity, concrete resistivity, chloride ion content, corrosion duration time, water–cement ratio and cover thickness. Based on various experimental data obtained in this paper, it is verified that the new model has good applicability and universality.
- (3)
- Through model error analysis, the probability distribution characteristics of the new model, as well as the Lu et al. and Yu et al. models, all follow a lognormal distribution. Vu and Stewart, Liu and Weyers, and Guo et al. obey the Weibull distribution; the Kong et al. model obeys the Gumbel distribution. During the research of concrete cover, the theoretical foundation is laid for the analysis of its reliability and the research of cracking problems.
Author Contributions
Funding
Data Availability Statement
Conflicts of Interest
References
- Liu, J.R. Study on Adhesion Properties between Inhomogeneous Rusted Steel Bars and Concrete under Continuous Loading; Qingdao University of Technology: Qingdao, China, 2021. [Google Scholar]
- Li, T. Study on Interface Bonding Strength of Reinforced Concrete under Freeze-Thaw-Chloride Ion Coupling; Xi’an Technological University: Xi’an, China, 2022. [Google Scholar]
- Li, F.M.; Yuan, Y.S.; Geng, O. Theoretical model of corrosion rate of reinforcement in concrete. J. South China Univ. Technol. 2009, 37, 83–87. (In Chinese) [Google Scholar]
- Geng, O. Study on Prediction Model of Reinforcement Corrosion Rate in Concrete Members. Ph.D. Thesis, China University of Mining and Technology, Xuzhou, China, 2008. (In Chinese). [Google Scholar]
- Kim, S.H.; Ann, K.Y. Modeling steel corrosion in concrete structures—Part Ⅰ: A newinverse relation between current density and potential for the cathodic reaction. Int. J. Electrochem. Sci. 2010, 5, 302–313. [Google Scholar]
- Otieno, M.; Beushausen, H.; Alexander, M. Chloride-induced corrosion of steel in cracked concrete—Part Ⅰ: Experimental studies under accelerated and natural marine environments. Cem. Concr. Res. 2016, 79, 373–385. [Google Scholar] [CrossRef]
- Lun, P.Y.; Zhang, X.G.; Jiang, C.; Ma, Y.F.; Fu, L. Modelling of Corrosion-Induced Concrete Cover Cracking Due to Chloride Attacking. Materials 2021, 14, 1440. [Google Scholar] [CrossRef]
- Siamphukdee, K.; Collins, F.; Zou, R. Sensitivity analysis of corrosion rate prediction models utilized for reinforced concrete affected by chloride. J. Mater. Eng. Perform. 2013, 22, 1530–1540. [Google Scholar] [CrossRef]
- Lu, Z.H.; Zhao, Y.G.; Yu, K. Stochastic Modeling of Corrosion Propagation for Service Life Prediction of Chloride Contaminated RC Structures. In Proceedings of the 1st International Symposium on Life-Cycle Civil Engineering, Lake Como, Italy, 11–14 June 2008; pp. 195–201. [Google Scholar]
- Otieno, M.B.; Beushausen, H.D.; Alexander, M.G. Modelling corrosion propagation in reinforced concrete structures—A critical review. Cem. Concr. Compos. 2011, 33, 240–245. [Google Scholar] [CrossRef]
- Raupach, M. Models for the propagation phase of reinforcement corrosion—An overview. Mater. Corros. 2006, 57, 605–613. [Google Scholar] [CrossRef]
- Song, X.B.; Liu, X.L. Experiment research on corrosion of reinforcement in concrete through cathode-to-anode area ratio. ACI Mater. J. 2000, 97, 148–155. [Google Scholar]
- Pour-Ghaz, M.; Isgor, O.B.; Ghods, P. The effect of temperature on the corrosion of steel in concrete. Part 1: Simulated polarization resistance tests and model development. Corros. Sci. 2009, 52, 415–425. [Google Scholar] [CrossRef]
- Morinaga, S. Prediction of Service Lives of Reinforced Concrete Buildings Based on Rate of Corrosion of Reinforcement Steel; Special Report of Institute of Technology; Shimizu Corporation: Tokyo, Japan, 1988. [Google Scholar]
- Liu, T.; Weyers, R.W. Modeling the dynamic corrosion process in chloride contaminated concrete structures. Cem. Concr. Res. 1998, 28, 365–379. [Google Scholar] [CrossRef]
- Vu, K.A.T.; Stewart, M.G. Structural reliability of concrete bridges including improved chloride-induced corrosion models. Struct. Saf. 2000, 22, 313–333. [Google Scholar] [CrossRef]
- Ahmad, S.; Bhattacharjee, B. Empirical modeling of indicators of chloride induced rebar corrosion. J. Struct. Eng. 2000, 27, 195–207. [Google Scholar]
- Jung, W.Y.; Yoon, Y.S.; Sohn, Y.M. Predicting the remaining service life of land concrete by steel corrosion. Cem. Concr. Res. 2003, 33, 663–677. [Google Scholar] [CrossRef]
- Li, C.Q. Reliability Based Service Life Prediction of Corrosion Affected Concrete Structures. J. Struct. Eng. 2004, 130, 1570–1577. [Google Scholar]
- Yu, H.; Zhang, Y.H.; Wang, Q.; Xu, Q.; Deng, Y.M. Forecast model of steel corrosion rate of marine concrete. J. Build. Mater. 2009, 12, 478–481. [Google Scholar]
- Li, G. Durability behaviour and basic models of reinforced concrete deterioration under climate environments. Ph.D. Thesis, China University of Mining and Technology, Xuzhou, China, 2004. (In Chinese). [Google Scholar]
- Kong, Q.; Gong, G.; Yang, J.; Song, X. The corrosion rate of reinforcement in chloride contamination concrete. Low Temp. Archit. Technol. 2006, 111, 1–2. (In Chinese) [Google Scholar]
- Yu, B.; Yang, L.; Wu, M.; Li, B. Practical model for predicting corrosion rate of steel reinforcement in concrete structures. Constr. Build. Mater. 2014, 54, 315–328. [Google Scholar] [CrossRef]
- Guo, Y.; Trejo, D.; Yim, S. New model for estimating the time-variant seismic performance of corroding RC bridge columns. J. Struct. Eng. 2015, 141, 04014158. [Google Scholar] [CrossRef]
- Lu, Z.H.; Lun, P.Y.; Li, W.; Luo, Z.; Li, Y.; Liu, P. Empirical model of corrosion rate for steel reinforced concrete structures in chloride-laden environments. Adv. Struct. Eng. 2019, 22, 223–239. [Google Scholar] [CrossRef]
- Shi, J.J.; Sun, W. Recent research on steel corrosion in concrete. J. Chin. Ceram. Soc. 2010, 38, 1753–1764. (In Chinese) [Google Scholar]
- Yang, Y.T. Research on Concrete Resistivity and Reinforced Concrete Steel Corrosion Rate; Dalian University of Technology: Dalian, China, 2009. (In Chinese) [Google Scholar]
- Lun, P.Y. Research on Corrosion Rate of Reinforcement and Concrete Cover Cracking Reliability in Chloride Environment. Ph.D. Thesis, Central South University, Changsha, China, 2019. (In Chinese). [Google Scholar]
- Liu, Y.P. Modeling the Time-to-Corrosion Cracking in Chloride Contaminated Reinforced Concrete Structures. Ph.D. Thesis, Virgina Polytechnic Institute and State University, Blacksburg, VA, USA, 1996. [Google Scholar]
- Ellingwood, B.R.; Galambos, T.V. Probability-based criteria for structural design. Struct. Saf. 1982, 1, 15–26. [Google Scholar] [CrossRef]
- Ang, A.H.S.; Tang, W.H. Probability Concepts in Engineering: Emphasis on Applications to Civil & Environmental Engineering, 2nd ed.; John Wiley & Sons: New York, NY, USA, 2006. [Google Scholar]


| Source of Literature | Normalized Corrosion Rate Prediction Model icorr (μA/cm2) | Analysis of Applicability |
|---|---|---|
| Liu and Weyers [15] | Foreign scholars frequently use this model because this model can truly reflect the dynamic changes of reinforcement under natural corrosion, which is in line with practical engineering. However, in the study of the corrosion rate of reinforcement, the influence of relative humidity was not considered. | |
| Vu and Stewart [16] | The influencing factors considered in this model are simple and practical, thus it is frequently used. However, the model does not consider the external influence of environmental changes on the reinforcement rate and the reinforcement corrosion process. | |
| Kong et al. [22] | The prediction model has been applied to China Standard Specification CECS220, 2007 (standard for durability evaluation of concrete structures). However, the model did not take into account factors such as relative humidity and practical changes in the process of studying the corrosion rate. | |
| Yu et al. [23] | The empirical model has a certain theoretical basis, and its construction form is simple. However, the process of solving the fitting parameters in the model is relatively complex, and the scope of the application is limited. | |
| Guo et al. [24] | The influence factors considered in the prediction model are very comprehensive, and the process of reinforcement corrosion in concrete is more truly reflected. However, some parameters are difficult to obtain in actual projects and usually require certain assumptions to take values, such as influencing factors ClTh. | |
| Lu et al. [25] | The prediction model is based on many experimental data, which has good universality and considers more comprehensive influencing factors. However, the influence of concrete cover thickness and the water–cement ratio on the corrosion rate of reinforcement is ignored, and both of these factors will affect concrete cracking. |
| Number | Cover Thickness (mm) | Reinforcement Diameter (mm) | Water–Cement Ratio | Temperature (K) | Relative Humidity (%) | Chloride Ion Content (kg/m3) | Time (Years) | Corrosion Rate (μA/cm2) |
|---|---|---|---|---|---|---|---|---|
| 1 | 51 | 16 | 0.45 | 299 | 70 | 0.31 | 0.9 | 0.72 |
| 2 | 51 | 16 | 0.45 | 300 | 70 | 0.31 | 0.9 | 0.090 |
| 3 | 51 | 16 | 0.42 | 299 | 70 | 0.63 | 0.9 | 0.094 |
| 4 | 51 | 16 | 0.42 | 300 | 70 | 0.63 | 0.9 | 0.104 |
| 5 | 51 | 16 | 0.42 | 301 | 70 | 0.63 | 0.9 | 0.117 |
| 6 | 51 | 16 | 0.42 | 299 | 70 | 0.78 | 0.9 | 0.108 |
| 7 | 51 | 16 | 0.42 | 300 | 70 | 0.78 | 0.9 | 0.147 |
| 8 | 51 | 16 | 0.42 | 300 | 70 | 0.81 | 0.9 | 0.173 |
| 9 | 51 | 16 | 0.41 | 300 | 70 | 1.43 | 0.9 | 0.112 |
| 10 | 51 | 16 | 0.41 | 300 | 70 | 1.43 | 0.9 | 0.137 |
| 11 | 51 | 16 | 0.41 | 300 | 70 | 1.43 | 0.9 | 0.161 |
| 12 | 51 | 16 | 0.44 | 299 | 70 | 2.45 | 0.9 | 0.181 |
| 13 | 51 | 16 | 0.44 | 299 | 70 | 2.45 | 0.9 | 0.243 |
| 14 | 51 | 16 | 0.44 | 300 | 70 | 2.45 | 0.9 | 0.287 |
| 15 | 51 | 16 | 0.45 | 290 | 70 | 0.31 | 1.0 | 0.055 |
| 16 | 51 | 16 | 0.45 | 289 | 70 | 0.31 | 1.0 | 0.064 |
| 17 | 51 | 16 | 0.42 | 291 | 70 | 0.63 | 0.9 | 0.065 |
| 18 | 51 | 16 | 0.42 | 291 | 70 | 0.63 | 0.9 | 0.071 |
| 19 | 51 | 16 | 0.42 | 291 | 70 | 0.63 | 0.9 | 0.075 |
| 20 | 51 | 16 | 0.42 | 282 | 70 | 0.78 | 1.0 | 0.111 |
| 21 | 51 | 16 | 0.42 | 280 | 70 | 0.78 | 1.0 | 0.076 |
| 22 | 51 | 16 | 0.42 | 280 | 70 | 0.78 | 1.0 | 0.085 |
| 23 | 51 | 16 | 0.42 | 280 | 70 | 0.78 | 1.0 | 0.085 |
| 24 | 51 | 16 | 0.42 | 280 | 70 | 0.78 | 1.0 | 0.085 |
| 25 | 51 | 16 | 0.42 | 288 | 70 | 0.78 | 1.0 | 0.085 |
| 26 | 51 | 16 | 0.41 | 295 | 70 | 1.43 | 1.0 | 0.083 |
| 27 | 51 | 16 | 0.41 | 296 | 70 | 1.43 | 1.0 | 0.085 |
| 28 | 51 | 16 | 0.41 | 295 | 70 | 1.43 | 1.0 | 0.093 |
| 29 | 51 | 16 | 0.44 | 306 | 70 | 2.45 | 1.0 | 0.210 |
| 30 | 51 | 16 | 0.44 | 306 | 70 | 2.45 | 1.0 | 0.216 |
| 31 | 51 | 16 | 0.44 | 306 | 70 | 2.45 | 1.0 | 0.247 |
| 32 | 70 | 16 | 0.45 | 290 | 63 | 0.31 | 1.0 | 0.052 |
| 33 | 70 | 16 | 0.45 | 290 | 63 | 0.31 | 1.0 | 0.060 |
| 34 | 70 | 16 | 0.42 | 285 | 63 | 0.36 | 0.9 | 0.050 |
| 35 | 70 | 16 | 0.42 | 286 | 63 | 0.36 | 0.9 | 0.055 |
| 36 | 70 | 16 | 0.42 | 286 | 63 | 0.36 | 0.9 | 0.057 |
| 37 | 70 | 16 | 0.42 | 288 | 63 | 0.78 | 0.9 | 0.065 |
| 38 | 70 | 16 | 0.42 | 289 | 63 | 0.78 | 0.9 | 0.066 |
| 39 | 70 | 16 | 0.42 | 288 | 63 | 0.78 | 0.9 | 0.072 |
| 40 | 70 | 16 | 0.41 | 292 | 63 | 1.43 | 1.0 | 0.073 |
| 41 | 70 | 16 | 0.41 | 292 | 62 | 1.43 | 1.0 | 0.084 |
| 42 | 70 | 16 | 0.41 | 292 | 63 | 1.43 | 1.0 | 0.094 |
| 43 | 70 | 16 | 0.44 | 292 | 75 | 2.45 | 0.9 | 0.129 |
| 44 | 70 | 16 | 0.44 | 292 | 75 | 2.45 | 0.9 | 0.146 |
| 45 | 70 | 16 | 0.44 | 292 | 75 | 2.45 | 0.9 | 0.151 |
| 46 | 70 | 16 | 0.43 | 293 | 75 | 4.92 | 1.0 | 0.254 |
| 47 | 70 | 16 | 0.43 | 293 | 75 | 4.92 | 1.0 | 0.272 |
| 48 | 70 | 16 | 0.43 | 293 | 75 | 4.92 | 1.0 | 0.272 |
| 49 | 50 | 20 | 0.4 | 293 | 80 | 4.14 | 0.35 | 0.485 |
| 50 | 50 | 20 | 0.4 | 303 | 80 | 4.14 | 0.35 | 0.510 |
| 51 | 50 | 20 | 0.4 | 313 | 80 | 4.14 | 0.35 | 0.470 |
| 52 | 50 | 20 | 0.4 | 293 | 80 | 4.97 | 0.35 | 0.308 |
| 53 | 50 | 20 | 0.4 | 303 | 80 | 4.97 | 0.35 | 0.301 |
| 54 | 50 | 20 | 0.4 | 313 | 80 | 4.97 | 0.35 | 0.313 |
| 55 | 50 | 20 | 0.4 | 293 | 80 | 5.80 | 0.35 | 0.353 |
| 56 | 50 | 20 | 0.4 | 303 | 80 | 5.80 | 0.35 | 0.350 |
| 57 | 50 | 20 | 0.4 | 313 | 80 | 5.80 | 0.35 | 0.475 |
| 58 | 50 | 20 | 0.4 | 293 | 80 | 6.62 | 0.35 | 0.335 |
| 59 | 50 | 20 | 0.4 | 303 | 80 | 6.62 | 0.35 | 0.380 |
| 60 | 50 | 20 | 0.4 | 313 | 80 | 6.62 | 0.35 | 0.370 |
| 61 | 50 | 20 | 0.3 | 293 | 80 | 5.80 | 0.35 | 0.348 |
| 62 | 50 | 20 | 0.3 | 303 | 80 | 5.80 | 0.35 | 0.355 |
| 63 | 50 | 20 | 0.3 | 313 | 80 | 5.80 | 0.35 | 0.340 |
| 64 | 50 | 20 | 0.4 | 293 | 80 | 5.80 | 0.35 | 0.353 |
| 65 | 50 | 20 | 0.4 | 303 | 80 | 5.80 | 0.35 | 0.350 |
| 66 | 50 | 20 | 0.4 | 313 | 80 | 5.80 | 0.35 | 0.475 |
| 67 | 50 | 20 | 0.5 | 293 | 80 | 5.80 | 0.35 | 0.313 |
| 68 | 50 | 20 | 0.5 | 303 | 80 | 5.80 | 0.35 | 0.209 |
| 69 | 50 | 20 | 0.5 | 313 | 80 | 5.80 | 0.35 | 0.370 |
| 70 | 50 | 20 | 0.4 | 293 | 80 | 5.80 | 0.35 | 0.353 |
| 71 | 50 | 20 | 0.4 | 303 | 80 | 5.80 | 0.35 | 0.411 |
| 72 | 50 | 20 | 0.4 | 313 | 80 | 5.80 | 0.35 | 0.475 |
| 73 | 50 | 20 | 0.4 | 293 | 80 | 5.80 | 0.35 | 0.443 |
| 74 | 50 | 20 | 0.4 | 303 | 80 | 5.80 | 0.35 | 0.330 |
| 75 | 50 | 20 | 0.4 | 313 | 80 | 5.80 | 0.35 | 0.538 |
| 76 | 50 | 20 | 0.4 | 293 | 80 | 5.80 | 0.35 | 0.288 |
| 77 | 50 | 20 | 0.4 | 303 | 80 | 5.80 | 0.35 | 0.301 |
| 78 | 50 | 20 | 0.4 | 313 | 80 | 5.80 | 0.35 | 0.378 |
| 79 | 50 | 20 | 0.4 | 293 | 80 | 5.80 | 0.35 | 0.242 |
| 80 | 50 | 20 | 0.4 | 303 | 80 | 5.80 | 0.35 | 0.280 |
| 81 | 50 | 20 | 0.4 | 313 | 80 | 5.80 | 0.35 | 0.215 |
| 82 | 50 | 20 | 0.4 | 293 | 80 | 5.80 | 0.35 | 0.348 |
| 83 | 50 | 20 | 0.4 | 303 | 80 | 5.80 | 0.35 | 0.355 |
| 84 | 50 | 20 | 0.4 | 313 | 80 | 5.80 | 0.35 | 0.340 |
| 85 | 50 | 20 | 0.4 | 293 | 80 | 5.80 | 0.35 | 0.353 |
| 86 | 50 | 20 | 0.4 | 303 | 80 | 5.80 | 0.35 | 0.350 |
| 87 | 50 | 20 | 0.4 | 313 | 80 | 5.80 | 0.35 | 0.475 |
| 88 | 50 | 20 | 0.4 | 293 | 80 | 5.80 | 0.35 | 0.145 |
| 89 | 50 | 20 | 0.4 | 303 | 80 | 5.80 | 0.35 | 0.275 |
| 90 | 50 | 20 | 0.4 | 313 | 80 | 5.80 | 0.35 | 0.370 |
| 91 | 50 | 20 | 0.4 | 293 | 80 | 5.80 | 0.35 | 0.353 |
| 92 | 50 | 20 | 0.4 | 303 | 80 | 5.80 | 0.35 | 0.350 |
| 93 | 50 | 20 | 0.4 | 313 | 80 | 5.80 | 0.35 | 0.475 |
| 94 | 50 | 20 | 0.4 | 293 | 80 | 5.80 | 0.35 | 0.257 |
| 95 | 50 | 20 | 0.4 | 303 | 80 | 5.80 | 0.35 | 0.260 |
| 96 | 50 | 20 | 0.4 | 313 | 80 | 5.80 | 0.35 | 0.369 |
| 97 | 50 | 20 | 0.4 | 293 | 80 | 5.80 | 0.35 | 0.100 |
| 98 | 50 | 20 | 0.4 | 303 | 80 | 5.80 | 0.35 | 0.135 |
| 99 | 50 | 20 | 0.4 | 313 | 80 | 5.80 | 0.35 | 0.154 |
| 100 | 50 | 20 | 0.4 | 293 | 80 | 2.77 | 0.35 | 0.303 |
| 101 | 50 | 20 | 0.4 | 303 | 80 | 2.77 | 0.35 | 0.240 |
| 102 | 50 | 20 | 0.4 | 313 | 80 | 2.77 | 0.35 | 0.225 |
| 103 | 50 | 20 | 0.4 | 293 | 80 | 4.28 | 0.35 | 0.327 |
| 104 | 50 | 20 | 0.4 | 303 | 80 | 4.28 | 0.35 | 0.286 |
| 105 | 50 | 20 | 0.4 | 313 | 80 | 4.28 | 0.35 | 0.326 |
| 106 | 50 | 20 | 0.4 | 293 | 80 | 5.80 | 0.35 | 0.353 |
| 107 | 50 | 20 | 0.4 | 303 | 80 | 5.80 | 0.35 | 0.350 |
| 108 | 50 | 20 | 0.4 | 313 | 80 | 5.80 | 0.35 | 0.475 |
| 109 | 50 | 20 | 0.4 | 293 | 80 | 5.80 | 0.35 | 0.175 |
| 110 | 50 | 20 | 0.4 | 303 | 80 | 5.80 | 0.35 | 0.235 |
| 111 | 50 | 20 | 0.4 | 313 | 80 | 5.80 | 0.35 | 0.338 |
| 112 | 50 | 20 | 0.4 | 293 | 80 | 5.80 | 0.35 | 0.346 |
| 113 | 50 | 20 | 0.4 | 303 | 80 | 5.80 | 0.35 | 0.430 |
| 114 | 50 | 20 | 0.4 | 313 | 80 | 5.80 | 0.35 | 0.360 |
| 115 | 50 | 25 | 0.4 | 293 | 80 | 5.80 | 0.35 | 0.371 |
| 116 | 50 | 25 | 0.4 | 303 | 80 | 5.80 | 0.35 | 0.476 |
| 117 | 50 | 25 | 0.4 | 313 | 80 | 5.80 | 0.35 | 0.425 |
| 118 | 30 | 20 | 0.4 | 293 | 80 | 5.80 | 0.35 | 0.346 |
| 119 | 30 | 20 | 0.4 | 303 | 80 | 5.80 | 0.35 | 0.430 |
| 120 | 30 | 20 | 0.4 | 313 | 80 | 5.80 | 0.35 | 0.360 |
| 121 | 50 | 20 | 0.4 | 293 | 80 | 5.80 | 0.35 | 0.370 |
| 122 | 50 | 20 | 0.4 | 303 | 80 | 5.80 | 0.35 | 0.380 |
| 123 | 50 | 20 | 0.4 | 313 | 80 | 5.80 | 0.35 | 0.407 |
| 124 | 70 | 20 | 0.4 | 293 | 80 | 5.80 | 0.35 | 0.365 |
| 125 | 70 | 20 | 0.4 | 303 | 80 | 5.80 | 0.35 | 0.423 |
| 126 | 70 | 20 | 0.4 | 313 | 80 | 5.80 | 0.35 | 0.553 |
| 127 | 65 | 20 | 0.45 | 287 | 75 | 12.25 | 16.0 | 0.230 |
| 128 | 65 | 20 | 0.45 | 287 | 75 | 12.25 | 16.0 | 0.124 |
| 129 | 65 | 20 | 0.45 | 287 | 75 | 12.25 | 16.0 | 0.139 |
| 130 | 65 | 20 | 0.45 | 287 | 75 | 12.25 | 16.0 | 0.087 |
| 131 | 65 | 20 | 0.45 | 287 | 75 | 12.25 | 16.0 | 0.096 |
| 132 | 65 | 20 | 0.45 | 287 | 75 | 12.25 | 16.0 | 0.048 |
| 133 | 65 | 20 | 0.45 | 287 | 75 | 12.25 | 16.0 | 0.210 |
| 134 | 65 | 20 | 0.45 | 287 | 75 | 12.25 | 16.0 | 0.061 |
| 135 | 65 | 20 | 0.45 | 287 | 75 | 12.25 | 16.0 | 0.088 |
| 136 | 65 | 20 | 0.45 | 287 | 75 | 12.25 | 16.0 | 0.127 |
| 137 | 65 | 20 | 0.45 | 287 | 75 | 12.25 | 16.0 | 0.250 |
| 138 | 65 | 20 | 0.45 | 287 | 75 | 12.25 | 16.0 | 0.191 |
| 139 | 65 | 20 | 0.45 | 287 | 75 | 12.25 | 16.0 | 0.047 |
| 140 | 65 | 20 | 0.45 | 287 | 75 | 12.25 | 16.0 | 0.210 |
| 141 | 65 | 20 | 0.45 | 287 | 75 | 12.25 | 16.0 | 0.043 |
| 142 | 65 | 20 | 0.45 | 287 | 75 | 12.25 | 16.0 | 0.064 |
| 143 | 65 | 20 | 0.45 | 287 | 75 | 12.25 | 16.0 | 0.078 |
| 144 | 65 | 20 | 0.45 | 287 | 75 | 12.25 | 16.0 | 0.076 |
| Comparison of Results of Existing Empirical Prediction Models | ||||||
|---|---|---|---|---|---|---|
| Mean Value | Standard Deviation | Coefficient of Variation | Maximum Value | Minimum Value | Maximum–Minimum | |
| Liu and Weyers [15] | 0.561 | 0.453 | 0.808 | 2.121 | 0.088 | 2.032 |
| Vu and Stewart [16] | 1.643 | 0.861 | 0.524 | 5.686 | 0.356 | 5.330 |
| Kong et al. [22] | 0.584 | 0.282 | 0.483 | 1.460 | 0.050 | 1.410 |
| Yu et al. [23] | 0.600 | 0.289 | 0.482 | 1.675 | 0.112 | 1.563 |
| Guo et al. [24] | 0.618 | 0.290 | 0.469 | 1.449 | 0.086 | 1.363 |
| Lu et al. [25] | 0.927 | 0.298 | 0.322 | 1.867 | 0.185 | 1.681 |
| Data Sources | Comparison of New Prediction Model Results | ||||||
|---|---|---|---|---|---|---|---|
| Mean Value | Standard Deviation | Coefficient of Variation | Maximum | Minimum | Maximum–Minimum | ||
| New model | 144 groups | 1.052 | 0.329 | 0.313 | 1.973 | 0.264 | 1.709 |
| 90 groups | 0.903 | 0.193 | 0.214 | 1.424 | 0.532 | 0.892 | |
| Model | Total Number | Frequency of Prediction | Goodness of Fit | ||||||
|---|---|---|---|---|---|---|---|---|---|
| Normal | Lognormal | Gumbel | Weibull | Normal | Lognormal | Gumbel | Weibull | ||
| Liu and Weyers [15] | 144 | 144 | 144 | 144 | 144 | 22.45 | 7.23 | 7.96 | 3.06 |
| Vu and Stewart [16] | 144 | 144 | 144 | 144 | 144 | 29.99 | 24.31 | 16.40 | 15.93 |
| Kong et al. [22] | 144 | 144 | 144 | 144 | 144 | 10.27 | 3.63 | 2.84 | 5.99 |
| Yu et al. [23] | 144 | 144 | 144 | 144 | 144 | 1.83 | 12.73 | 10.10 | 3.27 |
| Guo et al. [24] | 144 | 144 | 144 | 144 | 144 | 12.93 | 11.82 | 6.94 | 3.81 |
| Lu et al. [25] | 144 | 144 | 144 | 144 | 144 | 6.14 | 10.43 | 12.68 | 7.23 |
| New model | 144 | 144 | 144 | 144 | 144 | 6.80 | 13.09 | 14.32 | 7.75 |
| Model Uncertainty Parameters | Type of Distributions | Mean Values | Standard Deviation |
|---|---|---|---|
| Liu and Weyers [15] | Weibull | 0.561 | 0.453 |
| Vu and Stewart [16] | Weibull | 1.643 | 0.861 |
| Kong et al. [22] | Gumbel | 0.584 | 0.282 |
| Yu et al. [23] | Normal | 0.600 | 0.289 |
| Guo et al. [24] | Weibull | 0.618 | 0.290 |
| Lu et al. [25] | Normal | 0.927 | 0.298 |
| New model | Normal | 1.052 | 0.329 |
Disclaimer/Publisher’s Note: The statements, opinions and data contained in all publications are solely those of the individual author(s) and contributor(s) and not of MDPI and/or the editor(s). MDPI and/or the editor(s) disclaim responsibility for any injury to people or property resulting from any ideas, methods, instructions or products referred to in the content. |
© 2023 by the authors. Licensee MDPI, Basel, Switzerland. This article is an open access article distributed under the terms and conditions of the Creative Commons Attribution (CC BY) license (https://creativecommons.org/licenses/by/4.0/).
Share and Cite
Shi, R.; Pan, Z.; Lun, P.; Zhan, Y.; Nie, Z.; Liu, Y.; Mo, Z.; He, Z. Research on Corrosion Rate Model of Reinforcement in Concrete under Chloride Ion Environments. Buildings 2023, 13, 965. https://doi.org/10.3390/buildings13040965
Shi R, Pan Z, Lun P, Zhan Y, Nie Z, Liu Y, Mo Z, He Z. Research on Corrosion Rate Model of Reinforcement in Concrete under Chloride Ion Environments. Buildings. 2023; 13(4):965. https://doi.org/10.3390/buildings13040965
Chicago/Turabian StyleShi, Ruoli, Zhicheng Pan, Peiyuan Lun, Yali Zhan, Ziheng Nie, Yuzi Liu, Zongyun Mo, and Zhijian He. 2023. "Research on Corrosion Rate Model of Reinforcement in Concrete under Chloride Ion Environments" Buildings 13, no. 4: 965. https://doi.org/10.3390/buildings13040965
APA StyleShi, R., Pan, Z., Lun, P., Zhan, Y., Nie, Z., Liu, Y., Mo, Z., & He, Z. (2023). Research on Corrosion Rate Model of Reinforcement in Concrete under Chloride Ion Environments. Buildings, 13(4), 965. https://doi.org/10.3390/buildings13040965