Article

Effect of Stiffeners on Mechanical Behavior of T-Stubs Based on Experiment and Numerical Simulations

School of Civil and Transportation Engineering, Guangdong University of Technology, Guangzhou 510006, China
*
Author to whom correspondence should be addressed.
Buildings 2023, 13(4), 986; https://doi.org/10.3390/buildings13040986
Submission received: 8 March 2023 / Revised: 30 March 2023 / Accepted: 3 April 2023 / Published: 8 April 2023
(This article belongs to the Section Building Materials, and Repair & Renovation)

Abstract

:
T-stubs are important components in the application of the component method; hence it is crucial to clarify the T-stub mechanism for the analysis of the mechanical properties of steel joints. In this study, the mechanical behavior of T-stubs was assessed via 6 static tests and 18 finite element analysis models. The influences of flange thickness, bolt spacing, bolt diameter, and stiffener rib on initial stiffness, ultimate bearing capacity, and bolt force of T-stubs were analyzed. Furthermore, the development process and relations of the T-stub bolt force with and without stiffeners were analyzed. The results show that an effective stiffener arrangement can reduce the bending moment and prying force to a certain degree; however, offsetting the bending moment and prying force entirely is difficult. Furthermore, the influence of bending moment and prying force on the bearing capacity should be considered in the design.

1. Introduction

The connection design of joints is important in steel structure design, and the connection performance is related to structural economy and safety. The component method is used to study steel structure joints, and it assumes that the joint area of steel structure joints can be divided into several components, among which the T-stub is important [1]. Hence, it is essential to clarify the force process of the T-stub to conduct mechanical performance analysis of joints.
Several scholars have researched T-stub parts. The planar plastic hinge line method [2] was first proposed in the 1950s and 1960s and is currently a popular method for studying T-stub parts. Zoetemeijer [3] derived the effective length of the tensioned column flange without transverse stiffeners. According to the two modes of column flange yield and bolt yield, a design method of the tension zone of bolted beam–column connection under static load was proposed. Bao et al. [4] studied the internal force performance of T-stub bolts without stiffening ribs and analyzed the influence of bending moment on the bearing capacity of bolts. Wang et al. [5] studied the influence of stiffeners on the mechanical properties of T-stub beam–column joints. In the literature [6,7,8], the influence of bolt components on the mechanical behavior of T-stubs was studied, and it was found that bolt failure is the common result of bending moment, axial force, and shear force. Özkılıç et al. [9,10,11] conducted a comprehensive numerical and experimental analysis of unstiffened and stiffened T-stub connections in aspects of stiffener configuration and detailed parameters of bolts and T-stubs. The bearing capacity expressions of unstiffened and stiffened T-stubs were proposed.
The component method analyzes the constitutive relationship of steel structure joints [12]. In this method, first, a stress analysis of the complex stress area of the joint is conducted. According to the stress characteristics of the joint area, the area subjected to the same type of load is regarded as a set of basic stress components. Then, each basic component is extracted and analyzed separately to obtain its basic force displacement relationship. The basic components are integrated and assembled together to reflect the rotational characteristics of the joint. Shu et al. [13,14] used the component method to study the mechanical model of joints. Sun et al. [15,16] studied the seismic performance of end-plate connection beam–column joints, and designed a calculation model based on the EC3 specification component method for the capacity of high-strength steel extended end-plate stiffened connection joints, which can accurately predict the failure mode of the joints.
In the process of tension, due to the deformation of the flange, the extrusion between the bottom plate and the flange produces contact force, that is, prying force. Couchaux’s study [17,18] confirms that the prying force increases as the ratio of flange stiffness to bolt stiffness decreases. Bai et al. [19] compared the content of T-stub parts in regulations from different areas, used finite element software to analyze the stress of each component of the T-stub, and proposed a simplified model of T-stub mechanics and a formula to calculate prying force and bending moment according to the differential equation. In [20,21,22,23], numerical simulations and experiments were carried out, national codes were analyzed and compared, and a simplified formula to calculate prying force was obtained. In the literature [24], the prying force positions of ordinary steel and high-strength steel T-stubs were deduced by using the principle of energy stationary value. Huang et al. [25] conducted tensile tests and finite element analyses on three typical flexible flange connections. They observed that the prying force is distributed between approximately 0.6–0.71 of the distance from the edge of the end-plate to the centerline of the bolt. In [26,27,28,29,30,31], the variation and distribution of prying force and bolt tension were numerically simulated. Liu et al. [32,33,34] analyzed the prying force in the connection node of the extended end-plate using numerical simulation and observed that the prying force is an uneven surface load distributed in the extended part of the end-plate. Increasing the connecting bolt diameter of the extended end-plate and the flange plate thickness can improve the bearing capacity of the extended end-plate connection and reduce deformation and prying force. Many other scholars [26,35,36,37,38,39,40,41] have also studied the influence of the bolt prying force of the T-stub part on its mechanical performance through experiments or simulation, explored the relationship between the bolt prying force and the relevant parameters of the bolt, and proposed calculation formulae.
In addition, researchers have developed and studied the mechanical properties of new T-stub connectors with bolts. Min et al. [42] conducted monotonic tensile tests on Q690 high-strength steel T-stubs and found that the increase in bolt pre-tightening force would increase the axial force and reduce the bending moment of the bolt. Si [43] compared and analyzed T-stubs composed of Q690 D high-strength steel-12.9 s ultra-high-strength bolts and Q345 B ordinary steel-10.9 s high-strength bolts. The results showed that the T-stub connector with high-strength steel and an ultra-high-strength bolt has higher bearing capacity, but its plastic bearing capacity is low and brittle failure occurs easily. Özkılıç et al. [44,45,46,47] conducted a comprehensive numerical and experimental analysis of stiffened and unstiffened extended end-plate connections with thin end-plates and large sized bolts. The plastic bending moment capacity of the unstiffened extended end-plate was predicted, and an expression for the observed yield line pattern was developed.
Researchers have obtained several results from bolt force studies, but few studies have focused on the force distribution and prying force analysis of T-stubs with stiffeners. This study focuses on the force analysis of bolts with stiffening ribs; axial tensile damage is the damage mode of T-piece bolts that is considered. Actual bolt force performance is more complex. To determine the bolt force performance, a total of seven T-stub connectors are designed in this study. The influence of the flange thickness, stiffening ribs, and bolt spacing on the mechanical performance of T-stub connectors is considered, which provides a reference for connection safety design.

2. Materials and Methods

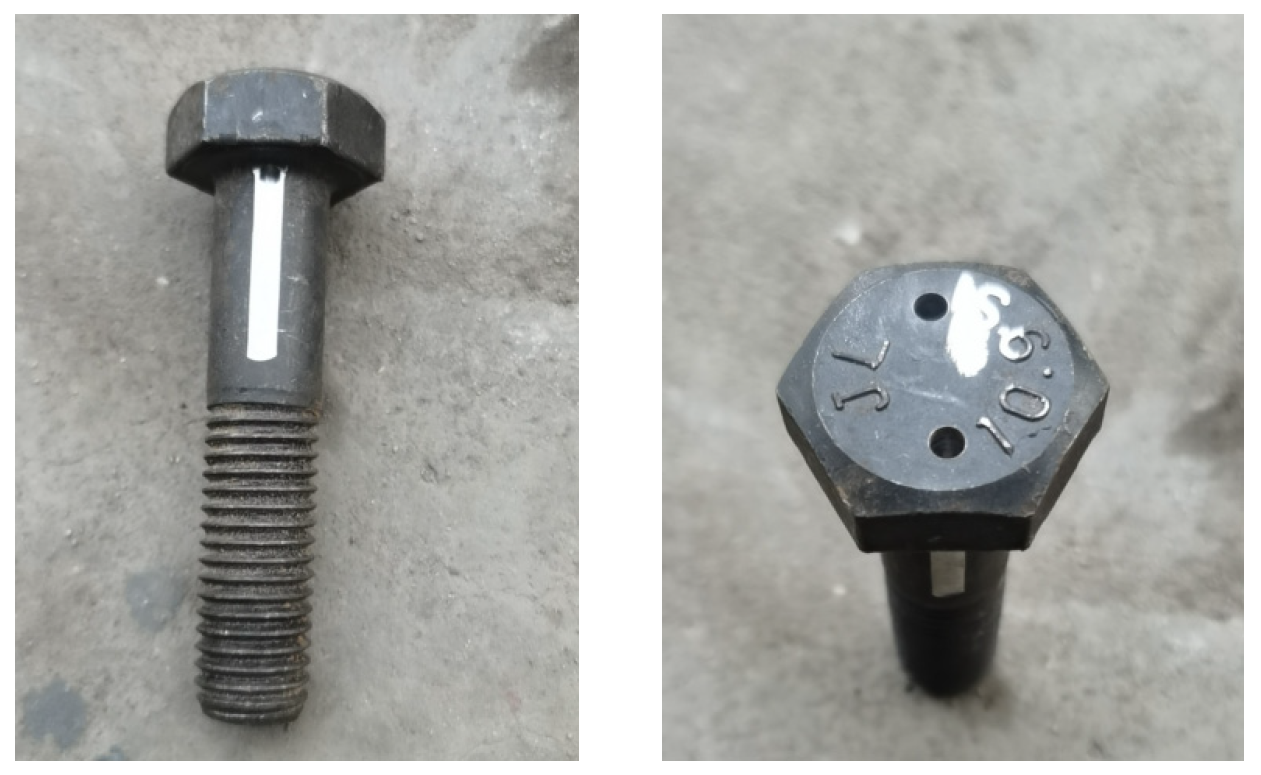
2.1. Fabrication and Design of Specimens

In this study, seven T-stub connectors were designed for monotonic tensile testing. The purpose of the tests is to investigate the influence of parameter variations of T-stub connectors on the bolt force. Therefore, the deformation of the base and web were not considered. The base used was rigid, and the web of the T-stub connector was a 20 mm thick steel plate. The steel grade was Q345. The bolts were 10.9-grade high-strength bolts. All specimens were made of hot-rolled steel plates processed using full fusion penetration welding seams. The specimens were divided into three control groups: T1, T2, and T3 as the flange thickness group; T1, T4, and T5 as the bolt spacing group; and T6 and T7 as the stiffening rib group. The dimensions of the specimens are shown in Table 1, and the basic structure of the T-stub pieces is shown in Figure 1. Before test loading, a preload force of 100 kN of high-strength bolts was applied according to the provisions of GB50017-2017 “Steel Structure Design Standards” [48].
The material properties of each steel plate thickness must be tested before test loading to provide the mechanical properties required for the next step. Each component must meet the “Tensile Test on Metallic Materials Part 1: Room Temperature Test Methods” [49] requirements, in which the steel plate specimen is a plate specimen, whereas the bolt specimen is a rod specimen, which is fabricated by weakening the middle section with half-threaded bolts. The results of the material property tests are shown in Table 2.

2.2. Loading Device and Loading System

The test was conducted in a WAW-1000 universal material testing machine in the structural laboratory of the Guangdong University of Technology, and the specimen was directly clamped by the jig of the testing machine (Figure 2a,b). To ensure the accuracy of the loaded displacement, YHD-50 displacement gauges were set at both ends of the web to record the web vertical displacement of the T-piece, and the average of the two displacement gauge readings was used as the displacement. The displacement gauges were fixed using L-shape brackets, as shown in Figure 2c. The test was conducted under displacement loading. To explore the complete failure process of the T-stub connector, a specimen was loaded to failure, and the loading rate was controlled at 0.5 mm/min.

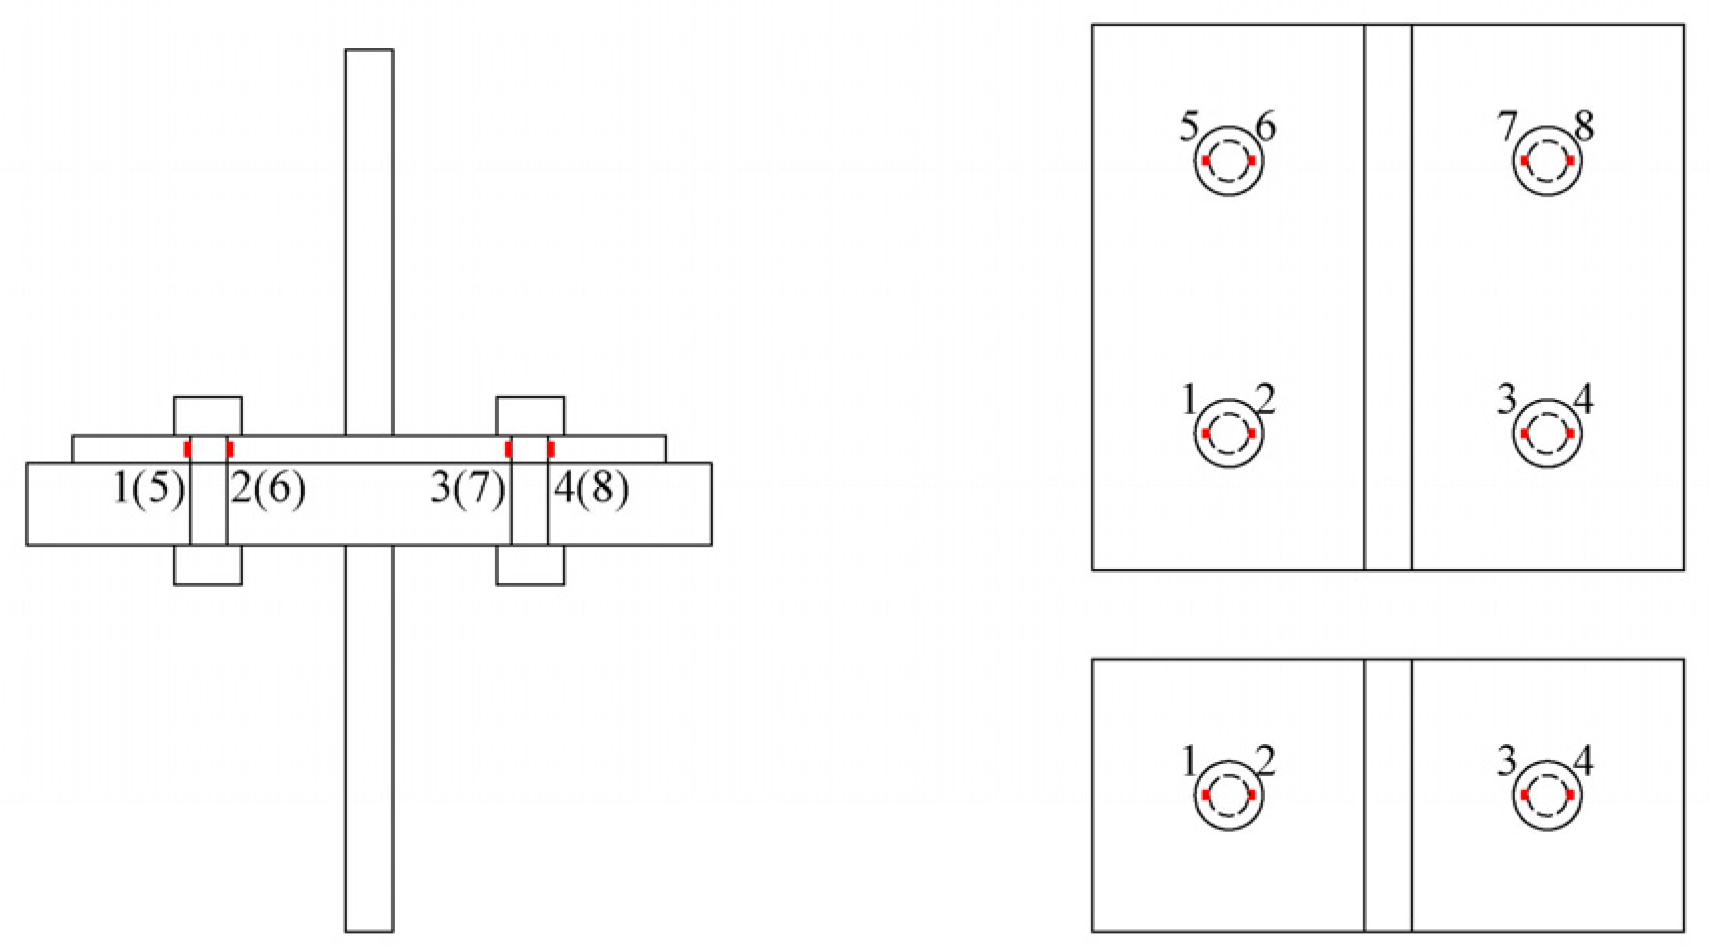
2.3. Arrangement of Strain Measuring Points

Because bolt force cannot be measured directly, this study reflects the bolt force variation indirectly by measuring the strain on both sides of the bolt. The strain measurement arrangement is shown in Figure 3. The strain gauges are arranged symmetrically on both sides of the bolt, and the nut is drilled with a hole of approximately 3 mm in diameter above the corresponding patch position for the lead (Figure 4). The connecting direction of the strain gauges was maintained perpendicular to the web of the T-piece when screwing the bolts.

3. Loading Test Results and Analysis

3.1. Test Phenomenon and Failure Mode

At the initial stage of loading, the T-stub was tightly attached to the contact surface of the base under the preload force. As the load increased, the deformation was concentrated on the T-stub owing to the large base stiffness, and the T-stub showed a strong plastic deformation capacity. The damage mode for most of the specimens in the test was the bending yielding of the T-stub flange and bolt pulling and bending damage; the nearer the bolt position to the T-stub web, the greater the degree of bolt tension (Figure 5a). The flange thickness of specimen T2 determined the next nearest distance. The flange showed flared plastic deformation at the center of the bolt, and one bolt had almost no bending deformation; whereas, the other bolt near the bolt head had a visible shear notch (Figure 5b). When the flange was 8 mm thick, the damage mode of the bolt was a tensile–shear combination. The flange thickness of specimen T3 was thicker and there was insignificant flange deformation, so both bolts were pulled off.
After the stiffener ribs were arranged, the damage mode of the T-stub was bending in both directions of the flange owing to the partial force transmitted by the web borne by the stiffener ribs. Simultaneously, T-stub deformation in the direction of the web and stiffener ribs is inconsistent, and the stiffener ribs are involved in the overall deformation.

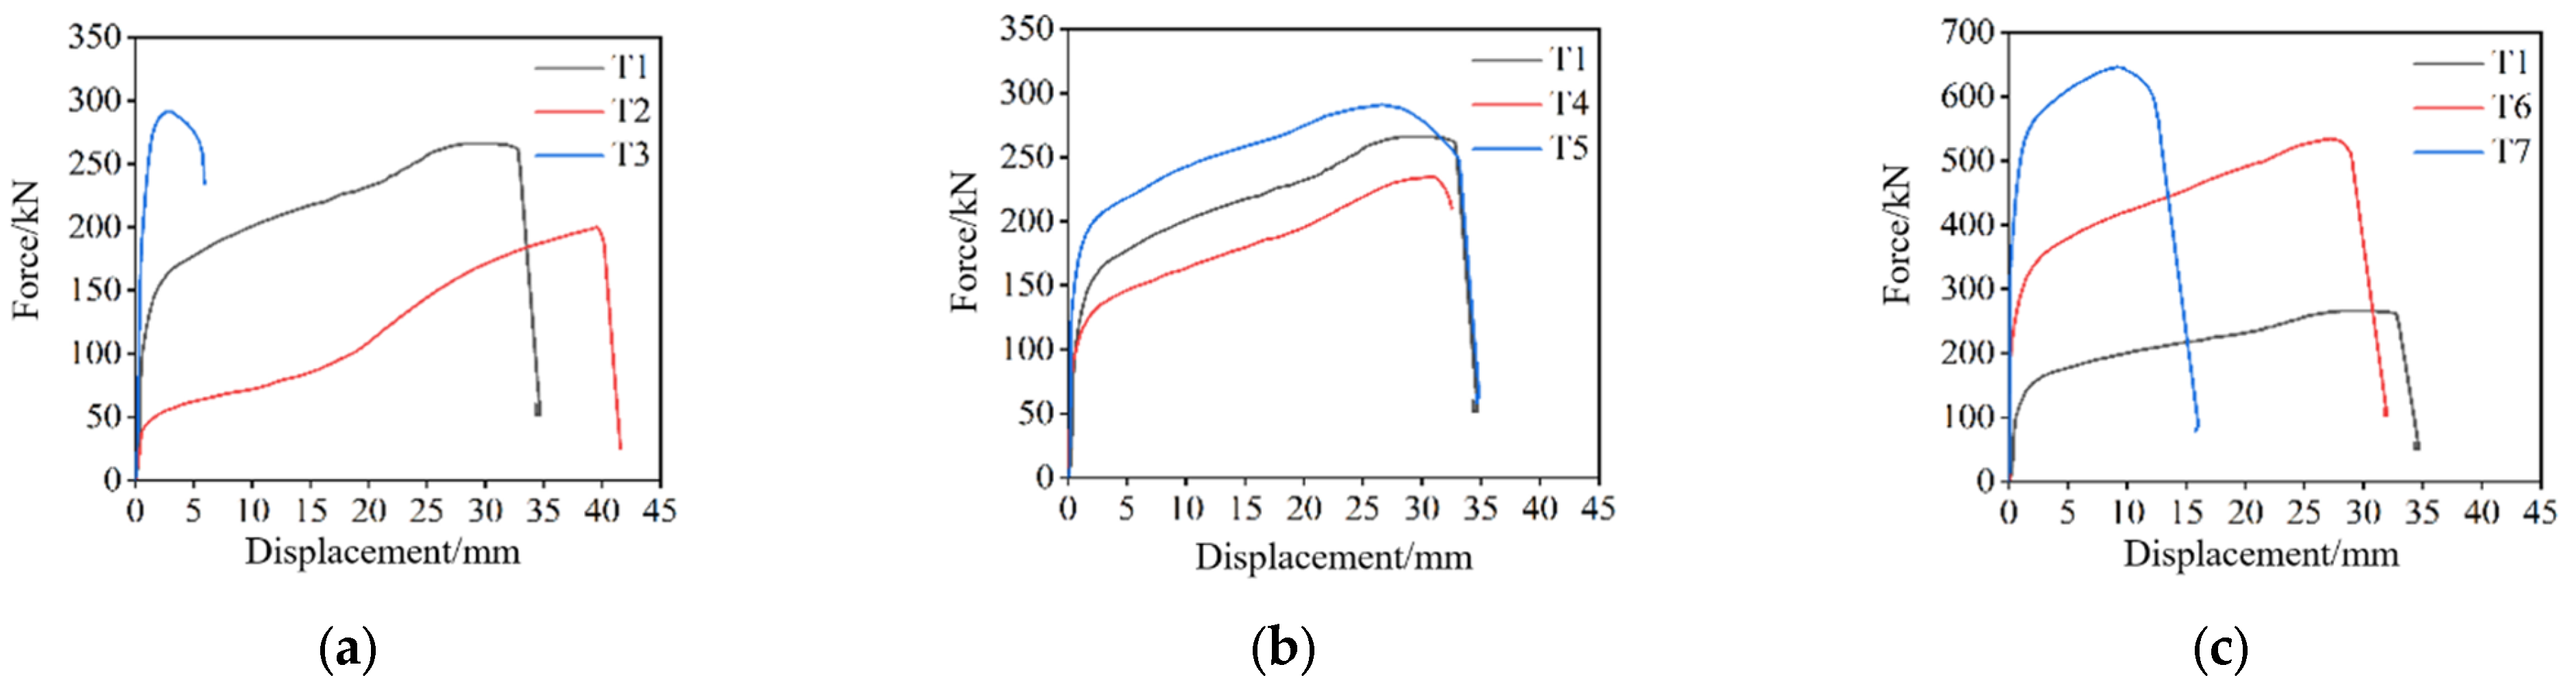
3.2. Stiffness, Bearing Capacity, and Deformation

Figure 6 shows the load–displacement curve of each specimen, and Table 3 lists the mechanical properties of each specimen. It can be seen that as the flange thickness increased from 8 mm to 12 mm, initial stiffness increased by 5.5 times, and ultimate bearing capacity increased by 1.3 times. From 8 mm to 20 mm, initial stiffness increased by 7 times, and ultimate bearing capacity increased by 3 times; whereas, the yield displacement and ultimate displacement were reduced correspondingly. This indicates that an increase in flange thickness improves mechanical properties such as initial stiffness, yield strength, and ultimate strength, and the deformation capacity of the T-piece is reduced. For specimen T3, flange thickness was the largest, flange deformation was small, and the deformation was concentrated on the bolts. The ultimate strength was approximately 1.5 times the yield strength, and the yield section of the load–displacement curve was not clear.
The flange thickness is an important parameter that has a significant influence on the performance of T-stub parts.
Compared with T4, the initial stiffness of specimens T1 and T5 increased by 6.5 and 9.7%, respectively, whereas the bearing capacity increased by 13.2% and 23.8%, respectively. Therefore, reducing the distance from the bolts to the web has a small improvement on the initial stiffness, whereas it has a significant effect on the bearing capacity.
Compared with the specimens without stiffening ribs, the initial stiffness and bearing capacity of the specimens with ribs increased by 14% and 21%, respectively, whereas the deformation capacity decreased by 196%. The stiffening ribs improved the properties of the T-piece such as stiffness and bearing capacity but significantly limited the deformation of the T-stub flange.

3.3. Bolt Stress

The measured strains can be converted into stresses. Figure 7 shows the bolt stress–load curves during loading. T2 data are not given in the figure because the T2 strain gauge failed prematurely. The “−1” measurement point is far from the web side of the T-stub, whereas the “−2” measurement point is near the web side of the T-stub. As shown in Figure 7, the stress difference between the two measurement points is large. In addition, an increase in the external load results in an increase in the measurement point stress near the web of the T-stub, and the measurement point stress far from the T-stub web decreases. This indicates that the force on both sides of the bolt is not uniform, which is owed to the pulling of the inner side of the flange under the external load, whereas the flange and base outer sides are pressed against each other, resulting in bolt bending deformation.
T1 and T3 formed the thickness group, and the stresses on both sides of the bolt were nearer as the thickness increased under the same load. The increase in flange thickness increased flange stiffness and reduced the bending deformation of the flange, which resulted in a decrease in the additional bending moment of the bolt. T4, T1, and T5 formed the bolt spacing group, the further the bolt is from the T-stub web under similar load levels, the larger the difference in stress between the two sides and the greater the bending of the bolt.
The stress change development paths of T1 and T6 were the same, indicating that the number of bolt rows does not affect the bolt force. Compared with T6, the stress growth of T7 was relatively slow. After arranging the stiffening ribs, the stiffness of the T-stub flange increased, which effectively discontinued the deformation of the flange and simultaneously reduced the bending deformation of the bolts.

4. Finite Element Analysis

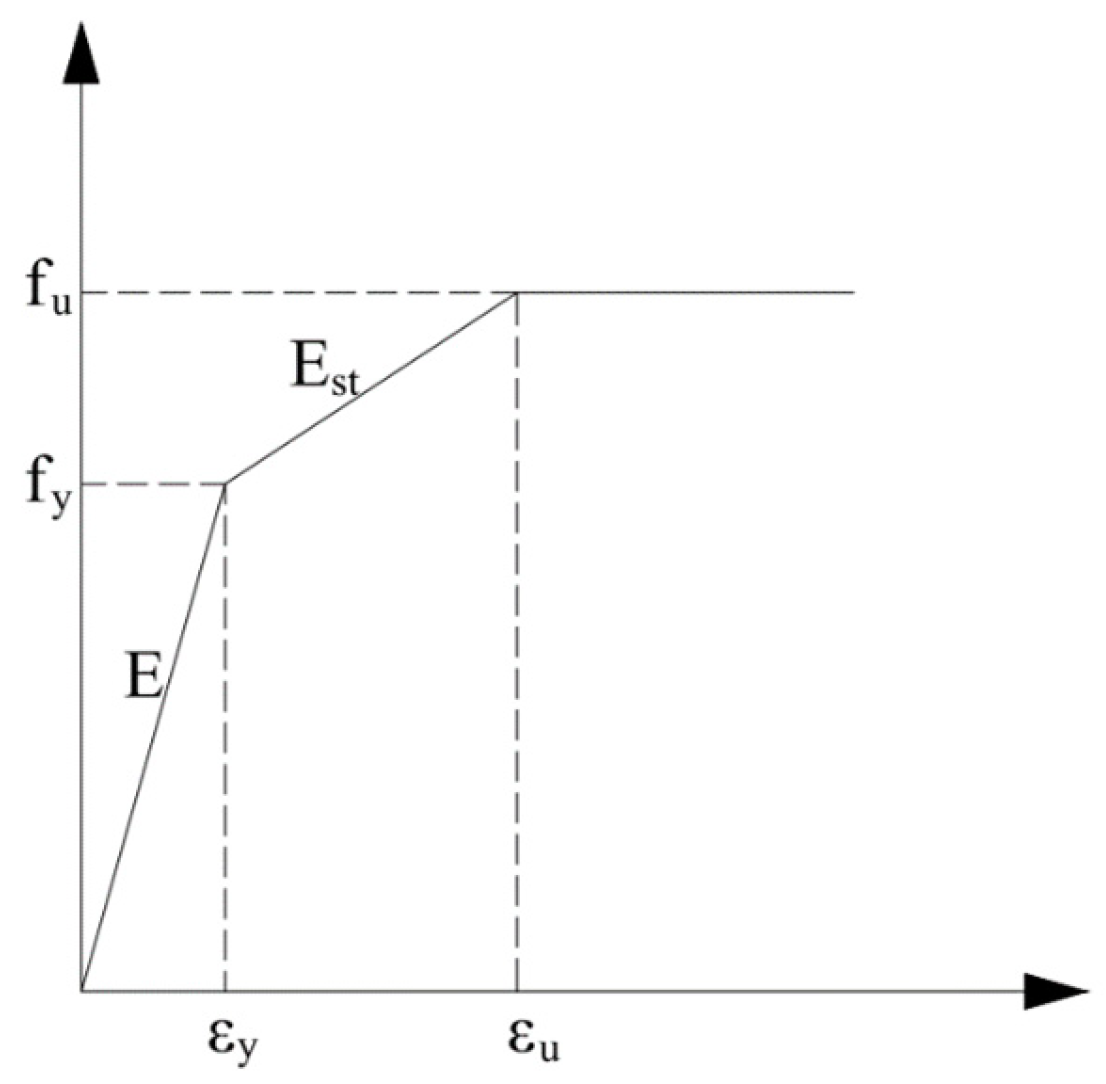
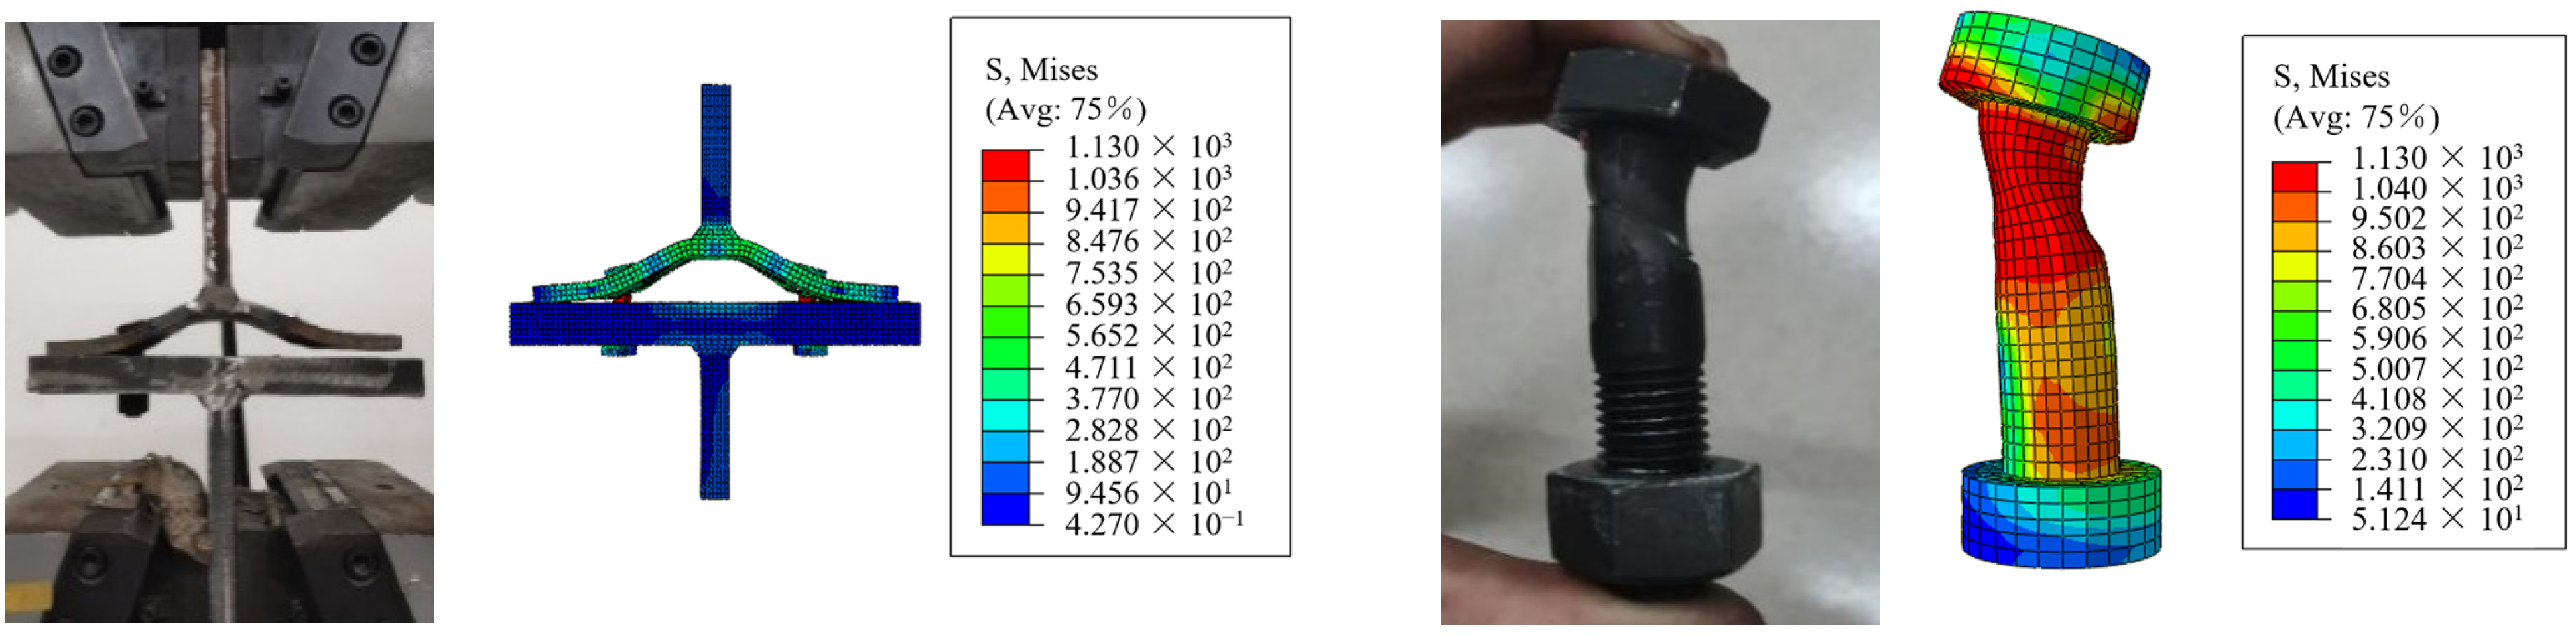
4.1. Modeling and Verification

In this study, the T-connecter was simulated using ABAQUS. The aim of simulating was to observe the deformation of the T-piece and bolt, and the development of internal forces in the bolt. The finite element model considers geometric nonlinearity, material nonlinearity, and contact between connections. The material properties used for the finite element analysis of steel are listed in Table 2. The steel constitutive is an isotropic strengthening model with three folds, whereas the bolt constitutive is an isotropic strengthening model with two folds. The stiffness of the steel strengthening section was Est = 0.01E [50], as shown in Figure 8. To ensure that the base does not deform, the elastic modulus of the base was enlarged by a factor of 10.
The finite element model adopted an eight-node linear hexahedral reduced integration cell (C3D8R), which is accurate for the displacement solution and is suitable for “small slip” contact analysis. Because the model used in this study is not large, calculation efficiency is fast, and all the meshes can be encrypted to ensure the accuracy of the model. A mesh size of 4 mm was used for the T-piece and base, whereas for the bolt it was set to 2 mm.
To avoid the contact surfaces from intruding into one another during the force process, the normal direction of the contact surface was set to “hard contact”, whereas the tangential direction was set to “penalty function”. According to the literature [51], the friction coefficient was set to 0.2.
To verify the reliability of the model in this study, for example using specimen T1, the finite element results were compared with the load–displacement curve and damage mode of the test results. In addition, the relative errors of the initial stiffness and ultimate bearing capacity of the two T-stub parts were examined. As shown in Figure 9, the finite element simulation and test load–displacement curve are in good agreement. The initial stiffness test value of T1 was 375.17 kN/mm and the finite element value was 359.35 kN/mm, with a relative error of 2.1%. The ultimate bearing capacity test value of T1 was 266.14 kN/mm and the finite element value is 256.82 kN/mm, with a relative error of 5.1%. From the damage mode, as shown in Figure 10, there was a good match between the deformation state of the finite element model and the damage state of the specimen. The damage mode of the bolt of specimen T1 was tensile bending damage, and the finite element model reflected this feature. Therefore, this finite element model can simulate the mechanical properties of the T-piece more accurately.

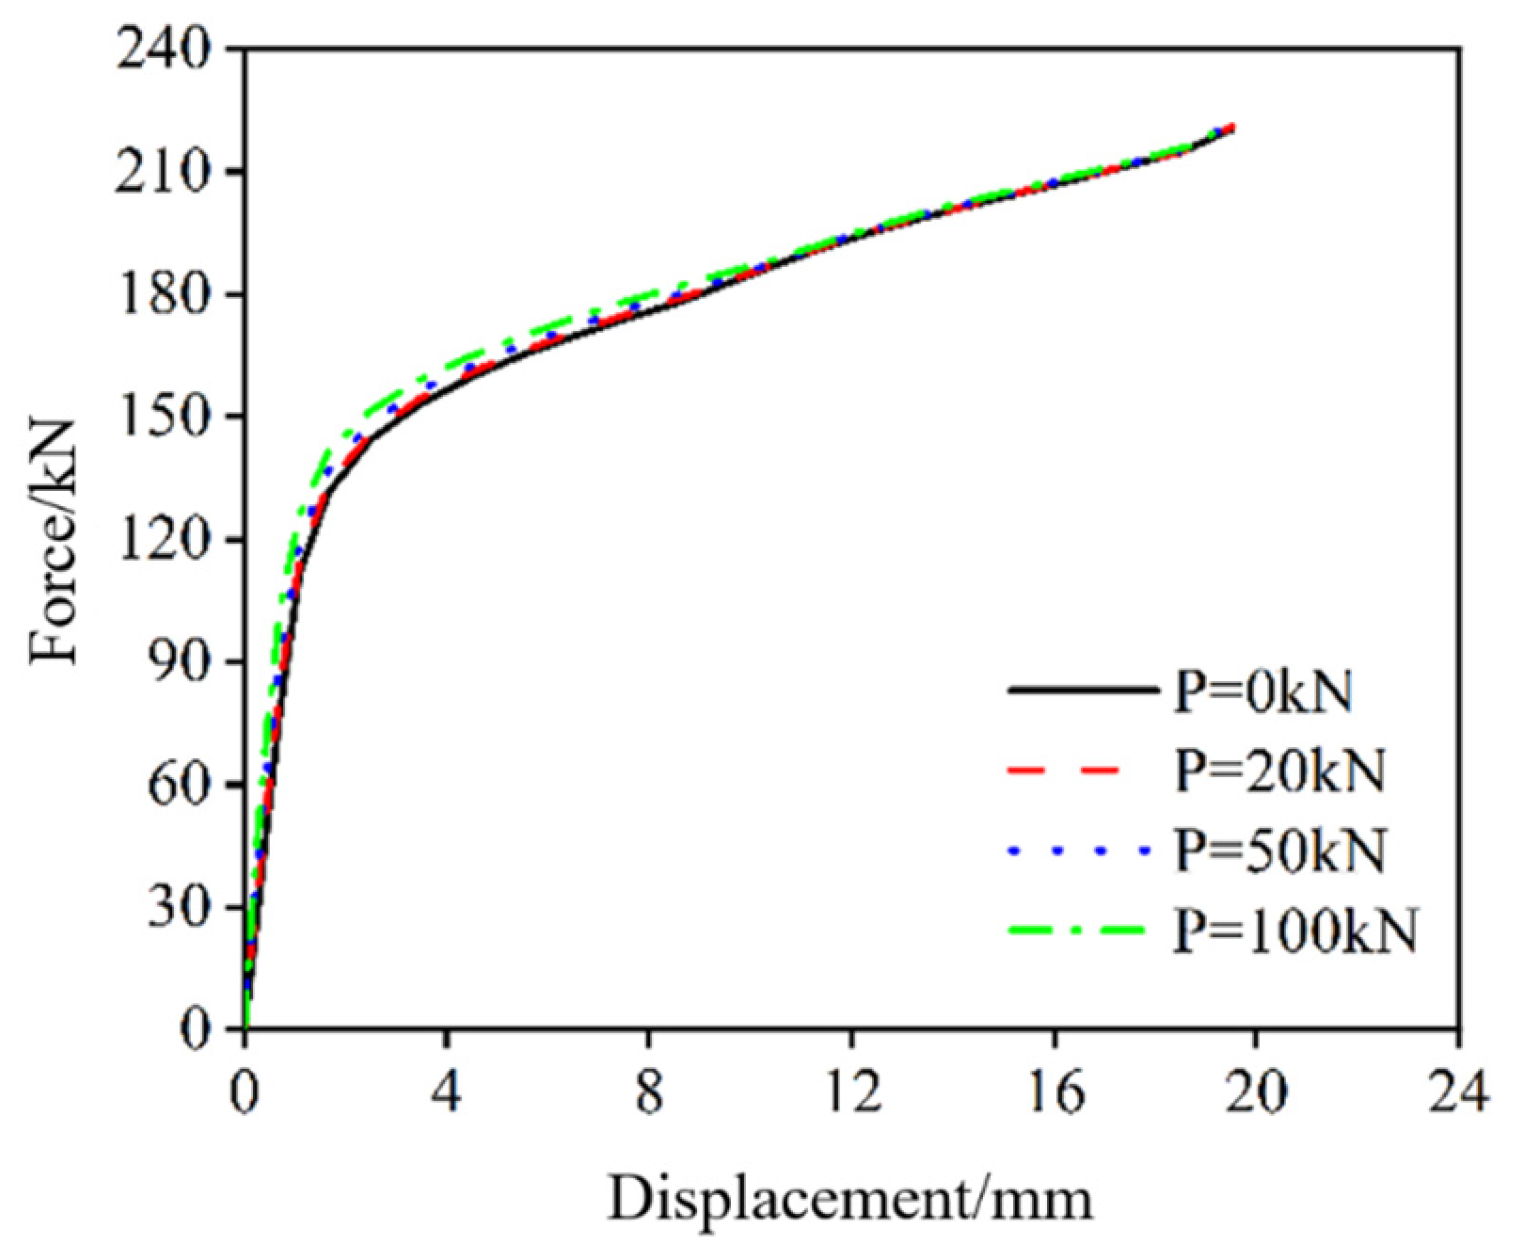
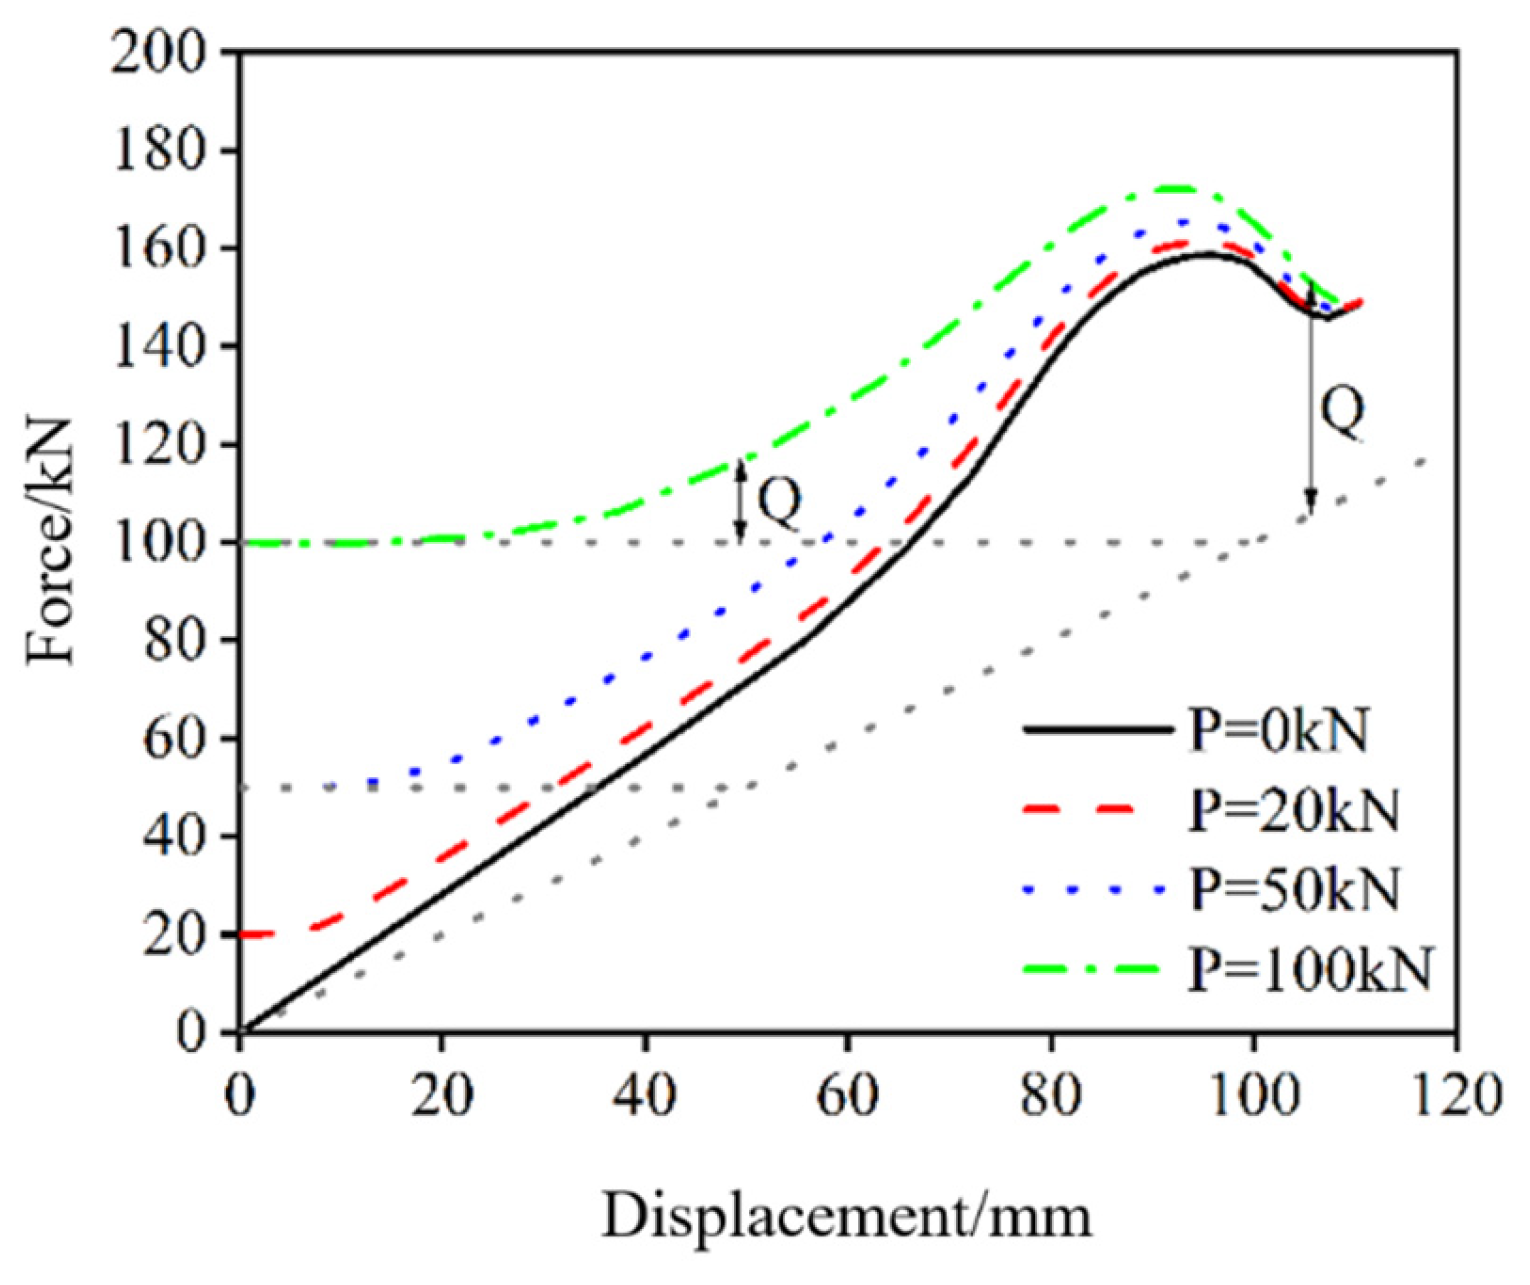
4.2. Effect of Preload Force

Figure 11 and Figure 12 respectively show the load–displacement and bolt force curves of specimen T1 under different preload forces. According to the definition in the literature [9], with preload, when the external load is less than the preload, the prying force should be equal to the value of the difference between the bolt force and the preload, that is, Q = B − P; when the external load is greater than the preload, the prying force is equal to the value of the difference between the bolt force and the external load, that is, Q = B − T. From Figure 11, the load–displacement curves overlap, whereas the bolt force has a noticeable difference at the beginning of loading under the influence of different preload forces; however, the influence of preload force decreases gradually as the external load increases. The comparison of specimens with and without different preload forces in the limit state differed with the bolt force by 1.7%, 4.1%, and 7.9%, respectively, which indicates that the preload force has less influence on the load-bearing performance and bolt force of the connection.

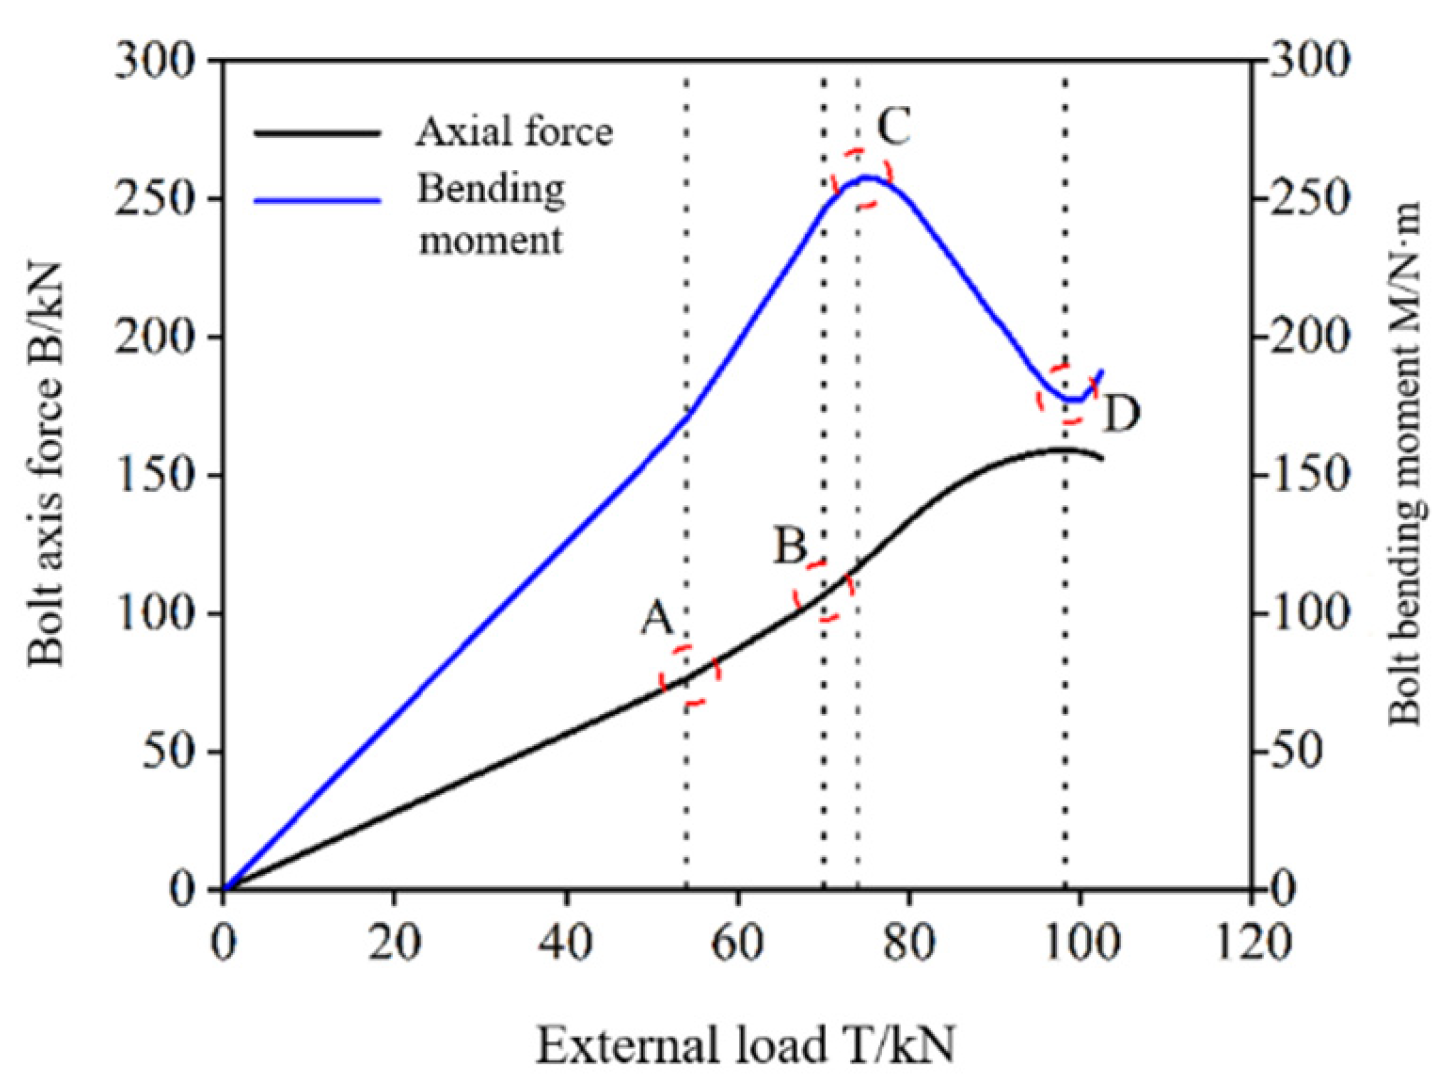
4.3. Development Process of Bolt Internal Force

The preload and prying forces are the same contact forces between the plates to avoid the influence of the preload force on the prying force during the analysis, hence the bolt without preload force is used for the analysis in this study. Taking T1 as an example, the internal force of the cross-section where the bolt is located at the plate junction is extracted, and the internal force development and stress cloud processes are shown in Figure 13 and Figure 14, respectively. Therefore, the peak bending moment of the bolt is independent of the flange yield state, and the web position to the bolt centerline of the T-stub is pulled apart, leading to inconsistent contact stress on both sides of the bolt head. The contact stress on the side near the web is larger, resulting in the development of a bolt bending moment. The points that occur in Figure 14 are listed as follows:
  • Point A: Yielding at the root of the T-stub flange;
  • Point B: Yielding at the corresponding position of the flange bolt of the T-stub;
  • Point C: Bolt bending moment peak, yielding of bolt half sections;
  • Point D: Lowest bending moment of the bolt, yielding the diagonal full section.

4.4. Analysis of Internal Force Parameters of Bolts

To compare and analyze the influencing factors and correlation between the bolt internal force of T-stubs without stiffener ribs and T-stubs with stiffener ribs, 18 finite element models were established in this study with T6 and T7 as prototypes, considering the flange thickness, transverse distance ratio, and longitudinal distance ratio. The T-stub model parameters are shown in Table 4, and the identification of dimensions is shown in Figure 1b,c.
The internal force curves of the bolts under different parameters are shown in Figure 15. Before the yielding of the T-stub, the internal force curves of the bolts are linear. For the convenience of analysis, the performance in this study was evaluated uniformly for the corresponding internal force of the bolts at an external load of 50 kN, as shown in Table 5. The following is evident that under the same load:
  • As shown in Figure 15a,d, with the increase in flange thickness, the flexural stiffness of the flange increased, which reduced the prying of the flange to the bolt. Furthermore, the bolt axial force, bending moment, and prying force gradually decreased. The bolt axial force decreased by 6.1% as flange thickness increased from 12 mm to 16 mm, and the bolt axial force decreased by 6.1%. As thickness increased, the bolt axial force tended to decrease smoothly. The bending moment is influenced by flange thickness, and the bending stress accounted for 27.9% to 52.7% of the total stress without stiffener ribs. After the arrangement of stiffener ribs, it accounted for 19.9% to 44.3% of the total stress, and the bending stress was reduced by approximately 8% compared with the overall.
  • As shown in Figure 15b,e, without stiffener ribs, the transverse spacing ratio e2/e1 increased from 0.57 to 1.75, and the difference in bolt axial force, bending moment, bending moment stress ratio, and prying force did not exceed 5%, which shows that the bolt internal force was unaffected by the transverse spacing ratio without stiffener ribs. After placing the stiffening ribs, the internal force of the bolt of the T-stub part was reduced with the increase of the transverse spacing ratio, which was because of the force diversion caused by the stiffening ribs, resulting in the warpage of the T-stub flange in the direction of the vertical stiffening ribs. The bending stress ratio of the FE series specimens was 53% and the prying force ratio was 23%, whereas the bending stress of the ES series accounts for approximately 39.9–47.3% of the total stress, and the prying force ratio was approximately 5.8–~13.2%. Hence, the stiffening ribs can reduce the bending moment and prying force of the bolts; however, the prying force effect cannot be eliminated in the case of a small transverse distance ratio e2/e1.
  • As shown in Figure 15c,f, the internal force of the bolts decreased with increasing longitudinal distance ratio n/m in both the ribbed and unribbed cases, indicating that the larger the n/m, the less pronounced the prying of the flange. Compared with the unribbed T-piece, the prying force ratio of the ribbed T-piece was reduced by 12.2% to 15.6%, and the bending stress ratio was reduced by approximately 8%.

5. Conclusions

In this paper, a number of T-stub connectors were designed and monotonic tensile tests were conducted to analyze their failure process and failure mode. The effects of flange thickness, bolt spacing, bolt diameter, and stiffener on the initial stiffness, ultimate bearing capacity, and bolt stress of the T-stub connectors were studied. Using ABAQUS to expand parameter analysis, the development process and correlation of bolt internal force between T-stub with and without stiffener are compared and analyzed. The specific conclusions are as follows:
  • In the case of no stiffener rib, the internal force of the bolt and transverse distance ratio are unrelated, and the internal force of the bolt is mainly influenced by the flange thickness and longitudinal distance ratio. Under the same load, the thinner the flange and the smaller the longitudinal distance ratio, the greater the bolt axial force, bending moment, and prying force.
  • When the flange thickness increases from 12 mm to 20 mm, the bolt prying force decreases by 26.0% when there is no stiffener rib, but the bolt prying force decreases by 58.1% when there are stiffener ribs. This indicates that compared with the T-stub without stiffener ribs, the reduction in bolt prying force is greater with the increase in flange thickness for the T-stub with stiffener ribs. Furthermore, without stiffener ribs, the overall bolt prying force accounts for approximately 20% of the bolt force. The arrangement of stiffener ribs can reduce this to lower than 10%.
  • With or without stiffener ribs, the bolt bending moment is generated by the uneven force on both sides. In the elastic range, the overall bending stress of the bolt was high, and the influence of the bolt bending moment on the bolt load capacity should be considered in the design.
  • Compared with the T-stub without stiffener ribs, the bolt internal force with stiffener ribs is mainly affected by the thickness of the flange, transverse distance ratio, and longitudinal distance ratio of the bolt. Under the same load, the smaller the flange thickness, transverse distance ratio, and longitudinal distance ratio, the larger the bolt axial force, bending moment, and prying force.

Author Contributions

Conceptualization, S.C.; methodology, B.F. and Y.Z.; formal analysis, B.F. and Y.Z.; data curation, B.F. and L.W.; writing—original draft preparation, B.F., L.W. and Y.Z.; writing—review and editing, L.W. and Y.Z.; visualization, B.F. and L.W.; supervision, S.C.; project administration, S.C. and J.H.; funding acquisition, S.C. All authors have read and agreed to the published version of the manuscript.

Funding

This study was supported by National Natural Science Foundation of China (Grant No. 51708226, 51638009, 51808357).

Data Availability Statement

Not applicable.

Conflicts of Interest

The authors declare no conflict of interest.

References

  1. Chen, Y.; Tong, L.; Chen, Y. Research Developments of Component Method for Behavior of Joints in Steel Structures. J. Archit. Civ. Eng. 2012, 29, 81–89. [Google Scholar] [CrossRef]
  2. Fincher, J.R. Investigation of Basic Requirements for a Direct Moment Connection Using High-Strength Structural Bolts and Wide Flange Beams; Georgia Institute of Technology: Atlanta, GA, USA, 1957. [Google Scholar]
  3. Zoetemeijer, P. A Design Method for the Tension Side of Statically Loaded, Bolted Beam-to-Column Connections; Delft University of Technology: Delft, The Netherlands, 1974. [Google Scholar]
  4. Bao, W.; Zhou, X.; Ban, M.; Qiu, J. Research on Mechanical Property of High-Strength Bolts in Tensioned T-Stub Connections. J. Build. Struct. 2016, 37, 380–387. [Google Scholar]
  5. Wang, H.; Yang, X. Optimization Analysis of Mechanical Performance of Stiffener Connections to T Shaped Beam Column Connections. Eng. Constr. 2017, 49, 38–43+54. [Google Scholar] [CrossRef]
  6. Abidelah, A.; Bouchair, A.; Kerdal, D.E. Influence of the Flexural Rigidity of the Bolt on the Behavior of the T-Stub Steel Connection. Eng. Struct. 2014, 81, 181–194. [Google Scholar] [CrossRef]
  7. D’Aniello, M.; Cassiano, D.; Landolfo, R. Monotonic and Cyclic Inelastic Tensile Response of European Preloadable Gr10.9 Bolt Assemblies. J. Constr. Steel Res. 2016, 124, 77–90. [Google Scholar] [CrossRef]
  8. Tartaglia, R.; D’Aniello, M.; Zimbru, M. Experimental and Numerical Study on the T-Stub Behaviour with Preloaded Bolts under Large Deformations. Structures 2020, 27, 2137–2155. [Google Scholar] [CrossRef]
  9. Özkılıç, Y. The Effects of Stiffener Configuration on Stiffened T Stubs. Steel Compos. Struct. 2022, 44, 475–488. [Google Scholar]
  10. Özkılıç, Y.O. The Capacities of Unstiffened T-Stubs with Thin Plates and Large Bolts. J. Constr. Steel Res. 2021, 186, 106908. [Google Scholar] [CrossRef]
  11. Özkılıç, Y.O. The Capacities of Thin Plated Stiffened T-Stubs. J. Constr. Steel Res. 2021, 186, 106912. [Google Scholar] [CrossRef]
  12. Chen, S. Application of Modified and Improved Component Method in the Constitutive Relation Research for Steel Connections. Ph.D. Thesis, South China University of Technology, Guangzhou, China, 2015. [Google Scholar]
  13. Shu, X.; Zhang, Z.; Wang, Y. Analysis on the Initial Rotational Stiffness of End-Plate Beam-to-Column Composite Joint. J. Hunan Univ. 2007, 34, 12–15. [Google Scholar]
  14. Yuan, H. Analysis of Joint Stiffness Based on Component Method and Improved Response Surface Method. Ph.D. Thesis, South China University of Technology, Guangzhou, China, 2017. [Google Scholar]
  15. Sun, F.; Sun, M.; Li, G.; Xiao, Y.; Wei, M.; Liu, L. Experimental Study on Seismic Behavior of High-Strength Steel Beam-to-Column End-Plate Connections. J. Build. Struct. 2014, 35, 116–124. [Google Scholar] [CrossRef]
  16. Liang, G.; Guo, H.; Liu, Y.; Yang, D. Experimental Study on Seismic Behavior of Extended Stiffened End-Plate Bolted Connections Using Q690 High Strength Steel. J. Build. Struct. 2022, 43, 57–67. [Google Scholar] [CrossRef]
  17. Couchaux, M.; Hjiaj, M.; Ryan, I.; Bureau, A. Effect of Contact on the Elastic Behaviour of Tensile Bolted Connections. J. Constr. Steel Res. 2017, 133, 459–474. [Google Scholar] [CrossRef]
  18. Couchaux, M.; Hjiaj, M.; Ryan, I.; Bureau, A. Tensile resistances of bolted circular flange connections. Eng. Struct. 2018, 171, 817–841. [Google Scholar] [CrossRef]
  19. Bai, R.; Chan, S.-L.; Hao, J.-P. Improved Design of Extended End-Plate Connection Allowing for Prying Effects. J. Constr. Steel Res. 2015, 113, 13–27. [Google Scholar] [CrossRef]
  20. Shi, G.; Shi, Y.; Wang, Y.; Li, S.; Chen, H. Finite Element Analysis and Tests on Bolted End-Plate Connections in Steel Portal Frames. Adv. Struct. Eng. 2004, 7, 245–256. [Google Scholar] [CrossRef]
  21. Shi, G.; Chen, X.; Wang, D. Experimental Study of Ultra-Large Capacity End-Plate Joints. J. Constr. Steel Res. 2017, 128, 354–361. [Google Scholar] [CrossRef]
  22. Shi, G.; Chen, X. Moment-Rotation Curves of Ultra-Large Capacity End-Plate Joints Based on Component Method. J. Constr. Steel Res. 2017, 128, 451–461. [Google Scholar] [CrossRef]
  23. Jia, D. Calculation of the Pry Action in Steel Structure Connection. J. Hefei Univ. Technol. 2005, 28, 514–517. [Google Scholar] [CrossRef]
  24. Qiang, X.; Wu, N.; Luo, Y. Theoretical Analysis of Initial Stiffness of T-Stubs Considering the Location of Prying Force. J. Tianjin Univ. (Sci. Technol). 2018, 51, 1230–1237. [Google Scholar] [CrossRef]
  25. Huang, F.; Zhang, D.; Hong, W.; Li, B. Mechanism and Calculation Theory of Prying Force for Flexible Flange Connection. J. Constr. Steel Res. 2017, 132, 97–107. [Google Scholar] [CrossRef]
  26. Wang, Y.; Zheng, J. Study on The Prying Force of High Strength Bolt in Extended End-Plate Connection. Ind. Constr. 2008, 38, 99–103. [Google Scholar]
  27. Wang, Y.; Zheng, J.; Hou, Z. Design and Finite Element Study on the Prying Force of High Strength Bolt in Extended End-Plate Connections. Build. Struct. 2009, 39, 68–75. [Google Scholar] [CrossRef]
  28. Zheng, J.; Wang, Y. Present Situation of Design on Hign Strength Bolt T-Shaped Tensile Connection Considering Prying Action. Steel Struct. 2006, 021, 15–18. [Google Scholar] [CrossRef]
  29. Wang, Y.; Sun, Y.; Liu, X. Analysis of High-Strength Bolts Resistance for Extended end Plate Connections. Steel Constr. 2011, 26, 1–10. [Google Scholar] [CrossRef]
  30. Liu, X.; Wang, Y. Comparison of Design Methods for Extended End-Plate Connections of High Strength Bolts between China, the United States and Europe. J. Xi’an Univ. Archit. Technol. 2012, 44, 41–49. [Google Scholar] [CrossRef]
  31. Liu, X.; Wang, Y. Study on the Design Method of High Strength Bolts of Extended End-Plate Tensile Connections. Prog. Steel Build. Struct. 2013, 15, 29–36. [Google Scholar]
  32. Liu, X.; Wang, Y. Influence of Extended End-Plate Connection Construction Parameters Change on Prying Force in Extended End Plate. World Earthq. Eng. 2015, 31, 148–155. [Google Scholar]
  33. Liu, X.; Wang, Y.; Li, M.; Han, M. Experimental Study on the T-Stub Connections in Steel Structure. Xi’an Jianzhu Keji Daxue Xuebao/J. Xi’an Univ. Archit. Technol. 2015, 47, 848–853. [Google Scholar] [CrossRef]
  34. Liu, X.; Wang, Y.; Li, M.; Han, M. Force Analysis and Numerical Simulation of High Strength Bolts in T-Stub Connection of Steel Structure. J. Archit. Civ. Eng. 2016, 33, 63–70. [Google Scholar]
  35. Khani, R.; Hosseinzadeh, Y.; Asl, M.H. Investigating the Prying Force Magnitude and Location in the T-Stub Connection Based on the Energy Method. Eng. Struct. 2023, 280, 115655. [Google Scholar] [CrossRef]
  36. Wang, Y.; Li, J. Analysis on Prying Force of Semi-Rigid Beam-to-Column Connections in Steel Structure. Ind. Constr. 2004, 34, 70–72. [Google Scholar] [CrossRef]
  37. Yang, J.; Park, J.; Kim, H.; Back, M. A Prying Action Force and Contact Force Estimation Model for a T-Stub Connection with High-Strength Bolts. J. Asian Archit. Build. Eng. 2013, 12, 309–316. [Google Scholar] [CrossRef]
  38. Nair Rajasekharan, S.; Birkemoe Peter, C.; Munse William, H. High Strength Bolts Subject to Tension and Prying. J. Struct. Div. 1974, 100, 351–372. [Google Scholar] [CrossRef]
  39. Swanson James, A.; Leon Roberto, T. Bolted Steel Connections: Tests on T-Stub Components. J. Struct. Eng. 2000, 126, 50–56. [Google Scholar] [CrossRef]
  40. Swanson James, A.; Leon Roberto, T. Stiffness Modeling of Bolted T-Stub Connection Components. J. Struct. Eng. 2001, 127, 498–505. [Google Scholar] [CrossRef]
  41. Kim, Y.J.; Madugula, M.K.S. Behavior of Bolted Circular Flange Connections Subject to Tensile Loading. Int. J. Steel Struct. 2010, 10, 65–71. [Google Scholar] [CrossRef]
  42. Min, Y. Experimental Study and Bearing Capacity Analysis of T-Shaped Connection Joints under Bending Moments and Prying Forces. Ph.D. Thesis, Jilin University, Changchun, China, 2018. [Google Scholar]
  43. Si, Y. Experimental Study on the Mechanical Behavior of T-Stubs with Q690 High Strength Steel and 12.9 High Strength Bolts. Ph.D. Thesis, Chongqing University, Chongqing, China, 2019. [Google Scholar]
  44. Özkılıç, Y.O. Cyclic and Monotonic Performance of Stiffened Extended End-Plate Connections with Large-Sized Bolts and Thin End-Plates. Bull. Earthq. Eng. 2022, 20, 7441–7475. [Google Scholar] [CrossRef]
  45. Özkılıç, Y.O. Cyclic and Monotonic Performance of Unstiffened Extended End-Plate Connections Having Thin End-Plates and Large-Bolts. Eng. Struct. 2023, 281, 115794. [Google Scholar] [CrossRef]
  46. Özkılıç, Y.O.; Topkaya, C. Extended End-Plate Connections for Replaceable Shear Links. Eng. Struct. 2021, 240, 112385. [Google Scholar] [CrossRef]
  47. Özkılıç, Y.O.; Topkaya, C. The Plastic and the Ultimate Resistance of Four-Bolt Extended End-Plate Connections. J. Constr. Steel Res. 2021, 181, 106614. [Google Scholar] [CrossRef]
  48. GB50017-2017; Steel Structure Design Standard. China Construction Industry Press: Beijing, China, 2018.
  49. GB/T228.1-2010; Tensile Test of Metallic Materials Part 1: Room Temperature Test Method. China Planning Press: Beijing, China, 2010.
  50. Choi, C.K.; Chung, G.T.; Song, M.K. Refined Three-Dimensional Finite Element Model for End-Plate Connections. In Advances in Steel Structures (ICASS ’96); Chan, S., Teng, J., Eds.; Pergamon: Oxford, UK, 1996; pp. 365–370. ISBN 978-0-08-042830-7. [Google Scholar]
  51. Bezerra, L.; Bonilla, J.; Silva, W.; Matias, W. Experimental and Numerical Studies of Bolted T-Stub Steel Connection with Different Flange Thicknesses Connected to a Rigid Base. Eng. Struct. 2020, 218, 110770. [Google Scholar] [CrossRef]
Figure 1. Schematic diagram of T-stub parameters: (a) T1~T5; (b) T6; (c) T7.
Buildings 13 00986 g001aBuildings 13 00986 g001b
Figure 2. Loading device: (a) acquisition device; (b) loading device; (c) schematic diagram of loading.
Buildings 13 00986 g002
Figure 3. Strain measuring point position.
Buildings 13 00986 g003
Figure 4. Bolt processing.
Buildings 13 00986 g004
Figure 5. Typical specimen damage: (a) deformation of connections; (b) deformation of bolts.
Buildings 13 00986 g005aBuildings 13 00986 g005b
Figure 6. Load–displacement curve: (a) thickness group; (b) bolt spacing group; (c) stiffener rib group.
Buildings 13 00986 g006
Figure 7. Stress−load curve: (a) thickness group; (b) bolt spacing group; (c) stiffener rib group.
Buildings 13 00986 g007
Figure 8. Material constitutive model.
Buildings 13 00986 g008
Figure 9. Load–displacement curve comparison of T1.
Buildings 13 00986 g009
Figure 10. Test and finite element model failure mode.
Buildings 13 00986 g010
Figure 11. Load–displacement curve.
Buildings 13 00986 g011
Figure 12. Bolt force curve.
Buildings 13 00986 g012
Figure 13. T-stub connection stress cloud diagram during loading: (a) stress cloud diagram at point A; (b) stress cloud diagram at point B; (c) stress cloud diagram at point C; (d) stress cloud diagram at point D.
Buildings 13 00986 g013aBuildings 13 00986 g013b
Figure 14. Bolt internal force development curve.
Buildings 13 00986 g014
Figure 15. Bolt internal force curve under different parameters: (a) Bolt axial force curves at different thicknesses; (b) bolt axial force curves at different transverse distance ratios; (c) bolt axial force curves at different longitudinal distance ratios; (d) bolt bending moment curves at different thicknesses; (e) bolt bending moment curves at different transverse distance ratios; (f) bolt bending moment curves at different longitudinal distance ratios.
Buildings 13 00986 g015
Table 1. Sizes of T-stubs.
Specimen No.Geometric DimensionsBolt SpecificationStiffener Rib Arrangement
t
/mm
m/
mm
n/
mm
e1/
mm
e2/
mm
n/m
T11265655555110.9M16no
T2865655555110.9M16no
T32065655555110.9M16no
T412755555551.3610.9M16no
T512557555550.7310.9M16no
T61265655555110.9M16no
T71265655555110.9M16yes
Table 2. Material property test results.
Pickup LocationYield Strength
fy (MPa)
Ultimate Strength
fu (MPa)
Elastic Modulus E (MPa)Elongation
Δ (%)
8 mm Steel Plate306.17447.71197,526.541.41
12 mm Steel Plate462.56550.09198,431.928.58
16 mm Steel Plate378.10526.31207,600.431.55
20 mm Steel Plate377.33523.55205,644.929.06
10.9M161053.611128.24210,000 *14.31
Note: * elastic modulus of the bolt is assumed to be 210,000 MPa, Poisson’s ratio is 0.3.
Table 3. Mechanical properties of a T-stub.
Specimen No.Ki/kN·mmKi/K1Fy,i/kNFmax,i/kNFmax,i/Fmax,1Δy/mmΔu/mm
T1375.171.00104.05266.141.000.6531.17
T268.310.1846.02200.100.751.0739.55
T3570.741.52196.10291.151.090.63.15
T4352.320.9494,05235.120.880.5130.88
T5386.821.03140.07291.151.090.426.56
T64190.5811.17346.66534.272.010.6527.16
T74782.2812.75549.55646.332.430.229.17
Table 4. T-stub finite element model parameters.
Specimen No.Geometric DimensionsBolt DiameterStiffener Rib Arrangement
t
/mm
m/
mm
n/
mm
e1/
mm
e2/
mm
n/me2/e1
FT112656555551110.9M16no
FT216656555551110.9M16no
FT320656555551110.9M16no
TS112656555551110.9M16yes
TS216656555551110.9M16yes
TS320656555551110.9M16yes
FE1126565407011.7510.9M16no
FE212656555551110.9M16no
FE3126565704010.5710.9M16no
ES1126565407011.7510.9M16yes
ES212656555551110.9M16yes
ES3126565704010.5710.9M16yes
FM112508055551.6110.9M16no
FM212656555551110.9M16no
FM312805055550.63110.9M16no
MS112508055551.6110.9M16yes
MS212656555551110.9M16yes
MS312805055550.63110.9M16yes
Table 5. Bolt internal force under different parameters.
Model No.Axial Force (kN)Bending Moment (N·m)Prying Force (kN)Axial Stress (N·mm−2)Bending Stress (N·mm−2)Bending Stress ratioPrying Force Ratio
FT170.45157.0120.45350.56390.650.5270.225
FT266.1782.7716.17329.25205.930.3850.196
FT365.1450.4815.14324.13125.610.2790.189
TS154.8287.074.82272.81216.640.4430.081
TS252.8741.542.87263.10103.350.2820.052
TS352.0225.792.02258.8364.180.1990.037
FE172.84164.6722.84362.46409.720.5310.239
FE270.45157.0120.45350.56390.650.5270.225
FE371.80161.8821.80357.30402.760.5300.233
ES153.2570.803.25264.98176.160.3990.058
ES254.8287.074.82272.81216.640.4430.081
ES358.99105.958.99293.56263.600.4730.132
FM161.90126.8511.90308.02315.600.5060.161
FM270.45157.0120.45350.56390.650.5270.225
FM384.57201.1434.57420.81500.450.5430.290
MS152.1174.782.11259.29186.060.4180.039
MS254.8287.074.82272.81216.640.4430.081
MS359.11100.629.11294.16250.340.4600.134
Disclaimer/Publisher’s Note: The statements, opinions and data contained in all publications are solely those of the individual author(s) and contributor(s) and not of MDPI and/or the editor(s). MDPI and/or the editor(s) disclaim responsibility for any injury to people or property resulting from any ideas, methods, instructions or products referred to in the content.

