Article

Research on the Carbon Emission Baselines for Different Types of Public Buildings in a Northern Cold Areas City of China

1
China Academy of Building Research, Beijing 100013, China
2
National Engineering Research Center of Building Technology, Beijing 100013, China
3
China Academy of Building Research Tianjin Institute, Tianjin 300380, China
4
School of Energy and Environmental Engineering, Hebei University of Technology, Tianjin 300401, China
*
Author to whom correspondence should be addressed.
Buildings 2023, 13(5), 1108; https://doi.org/10.3390/buildings13051108
Submission received: 1 March 2023 / Revised: 1 April 2023 / Accepted: 12 April 2023 / Published: 22 April 2023
(This article belongs to the Special Issue Healthy Green Building Planning and Design)

Abstract

:
Global excessive CO2 emissions have caused serious environmental and health problems, such as global warming, melting glaciers, droughts, floods, and extreme temperatures, and have become a common challenge for the world. China has set a dual carbon goal, with the peak carbon emissions before 2030. In China, the building sector accounts for 50.9% of the country’s carbon emissions. In particular, public buildings are characterized by a high carbon emission intensity, accounting for 38.6% of carbon emissions in the building sector, which affects the achievement of the dual carbon goal in China’s building sector. Establishing a reasonable baseline of carbon emissions contributes to quota management and trading of carbon emissions for public buildings in Tianjin, China, and will ultimately contribute to the reduction of carbon emissions. This study investigates the operational energy consumption and carbon emissions of 721 public buildings in Tianjin (including electricity, natural gas, and district heating). The applicability of the Quartile method and the K-means clustering algorithm was compared to determine the carbon emission baseline of different types of public buildings, such as constraint value, guiding value, and advanced value, based on which the dynamic baseline from 2022 to 2030 was determined. The results show that the advanced value, guiding value, and constraint value of the Tianjin public building carbon emission baseline obtained using the Quartile method are more reasonable than those obtained by the K-means clustering algorithm. Furthermore, the carbon emission baseline in 2030 will be reduced by 3.4~9.2% compared to 2022. This study can guide the formulation of carbon emission trading schemes, and support Tianjin’s building sector to achieve the “carbon peak”.

1. Introduction

After the Industrial Revolution, excessive emissions of greenhouse gases caused by human activities were the main cause of environmental and health problems such as global warming, melting glaciers, drought, floods, and extreme temperatures [1,2]. To tackle climate change and its negative impacts, the Paris Agreement sets long-term goals that will guide all nations in order to “substantially reduce global greenhouse gas emissions to limit the global temperature increase in this century to 2 °C while pursuing efforts to limit the increase even further to 1.5 °C” [3]. Many countries have formulated carbon neutral plans to achieve this goal. The United States plan to decarbonize the power sector in 2035 and achieve carbon neutrality in 2050 [4]. The carbon neutral time set by the European Union is in line with the United States [5]. China plans to reach a carbon peak before 2030 and carbon neutrality before 2060 [6]. According to the 2022 Emissions Gap Report issued by the UN Environment Programme, the buildings sector contributed 3.1 GtCO2e (5.7%) of all global carbon emissions in 2020. Reallocation of emissions associated with electricity and heat production (e.g., in the energy supply sector) to the final consumption sectors increases the contribution of the buildings sector to 16% [7]. This proportion is higher in China, i.e., the carbon emission from the entire building process accounted for 50.9% of the national carbon emission, and the carbon emission in the building operation stage was 21.7% in 2020 [8]. In particular, public buildings are characterized by a high carbon emission intensity, accounting for 38.6% of carbon emissions in the building sector. It can be seen that reducing carbon emissions in the public building sector is of great importance for carbon neutrality.
Reducing carbon emissions in buildings requires simultaneous consideration of the building’s energy consumption and utilization structure. On the one hand, energy used for heating, cooling, and appliances per square meter of the floor area must be reduced globally by 10–30% in public buildings by 2030 when compared to 2015 levels. On the other hand, a transition from fossil fuels to electric power (from renewable energy) is needed. In buildings, this means installing and replacing cooking and heating devices with cleaner technologies, such as heat pumps instead of oil or gas heating or district heating in dense urban areas. Emission intensity in buildings should decrease by 65–75% for public buildings by 2030 when compared to 2015 levels [7]. Although emissions intensity is constantly decreasing, it is necessary to accelerate the pace in order to meet these targets [9].
To promote energy conservation and the development of the low-carbon building sector, China launched the first mandatory code for carbon emissions in buildings named the General code for energy efficiency and renewable energy application in buildings (GB 55015-2021) [10], stipulating that the average carbon emission intensity of new residential and public buildings should be reduced by 40% based on the standards for energy efficiency design of buildings from 2016 [11], and the average carbon emission intensity reduced by more than 7 kgCO2/(m2.a). Some regions have started an emissions trading scheme for public buildings to reduce carbon emissions. In addition, several government departments jointly issued an Implementation Plan for Establishing and Improving the Standard Measurement System of Carbon dioxide peaking and Carbon Neutrality, which requires research to be conducted on test methods for measuring the carbon emissions of typical energy-using facilities and energy-using systems in different industries and establishing a carbon emission baseline database [12]. Establishing a reasonable baseline for carbon emissions in buildings will enable the measurement of the carbon emission level of different types of buildings and provide support for the formulation of carbon emissions trading schemes and related policies.
Carbon emission baseline, a holistic environmental performance indicator that reflects the level to which resources are used for buildings, has not been studied as widely as energy use. Most research on carbon emissions focuses on the level of carbon emissions in specific buildings. Droutsa K.G. et al. [13] obtained the average primary energy use and CO2 emission intensity through the analysis of data from 30,000 energy performance certificates of non-residential buildings in Greece. Wu et al. [14] and Huang et al. [15] benchmarked the carbon emissions of hotels in Singapore and Taiwan, respectively. Joseph Lai et al. [16] conducted a study of 32 buildings in Hong Kong, analyzed six years of monthly data on energy use and carbon emission for commercial buildings, and compared the carbon emission levels of public buildings in several countries around the world (Table 1). However, due to differences in building type, location, and sample size in different studies, it becomes difficult to compare them horizontally.
Regarding research methods, there are two main directions related to building energy consumption and carbon emission baseline: self-comparison for individual buildings and benchmarking of energy consumption for building groups. The research methods adopted mainly include building energy consumption simulation, statistical methods, and data mining. The method of establishing an ideal model through energy consumption simulation software [17,18] is commonly used for individual buildings to analyze the energy-saving effect of high-performance envelopes [19], lighting, HVAC systems [20], personnel behavior [21], renewable energy [22], etc. Statistical [23] and data mining methods [24] are often used for building groups. Statistical methods are often used to determine the level of regional energy consumption of buildings when there is a large amount of real data. When there are many factors affecting building energy consumption, multiple regression is often used to analyze these factors and establish a regression model [23]. Detailed statistical data combined with the Quartile method can also be used to obtain the distribution of building energy consumption [25]. Data mining methods are mainly related to cluster analysis [24], data envelopment analysis (DEA) 26, stochastic frontier analysis (SFA) 27, and artificial neural network [26]. Cluster analysis is often used to process data with similar characteristics. Jeong et al. [27] established a database and used a decision tree (DT) for cluster analysis and proposed a CO2 emission benchmark value corresponding to a national CO2 emission reduction target. The clustering algorithm has many advantages, such as efficiency in processing large data sets and convenience for researchers to better understand the data by generating cluster descriptions [28]. The SFA method considers the statistical characteristics and authenticity of the samples. For example, Yang et al. [29] proposed an SFA-based urban energy benchmark evaluation method (DUE-B). A test on more than 1,000 buildings in New York showed that this method is more efficient than the traditional method. However, SFA has the problem that the random boundary model perceives too much noise in the data due to its outliers, which makes it impossible to determine the energy consumption of buildings [30]. DEA is often used to compare the efficiency between multiple units providing similar services, especially when there are multiple input and output parameters [31]. Lee et al. [32] investigated a Taiwanese government office building and used the DEA method to evaluate the effectiveness of energy management. DEA has a problem in that a single outlier can lead to abnormal values of energy consumption of other buildings. The artificial neural network has disadvantages such as it requires a large amount of data, can be overfitted, takes a long time to train, etc. [33]. Existing studies have shown that data mining can better deal with the relationship between building energy consumption benchmark and building characteristics [34] and has advantages for extracting data with atypical characteristics.
To achieve the dual carbon goal in China’s building sector, a plan is being considered to expand the emissions trading scheme from the industry sector to the building sector, which offers a high CO2 emission reduction effect. To scale up the scheme more effectively, it is very important to establish a reasonable CO2 emission baseline for public buildings. However, cities in the cold regions of northern China, represented by Tianjin, have yet to have a clear carbon emissions baseline for public buildings. Conducting research on this topic often faces difficulties in obtaining a large amount of real data. In addition, previous studies have paid little attention to the dynamic changes of carbon emissions in Tianjin in the case of future energy decarbonization. This study investigated the basic information of 721 public buildings in Tianjin, such as power consumption per unit area, gas consumption, central heating energy consumption, building area, and year of construction, covering eight types of public buildings. The distribution of energy consumption and the intensity of carbon emissions in public buildings were analyzed, and the correlation between the building area, the building construction year, and carbon emissions per unit area was also made. Subsequently, the advanced value, guiding value, and constraint value of the carbon emission baseline in Tianjin were formulated, and the dynamic changes between 2020 and 2030 were analyzed. The framework of this study is shown in Figure 1.

2. Materials and Methods

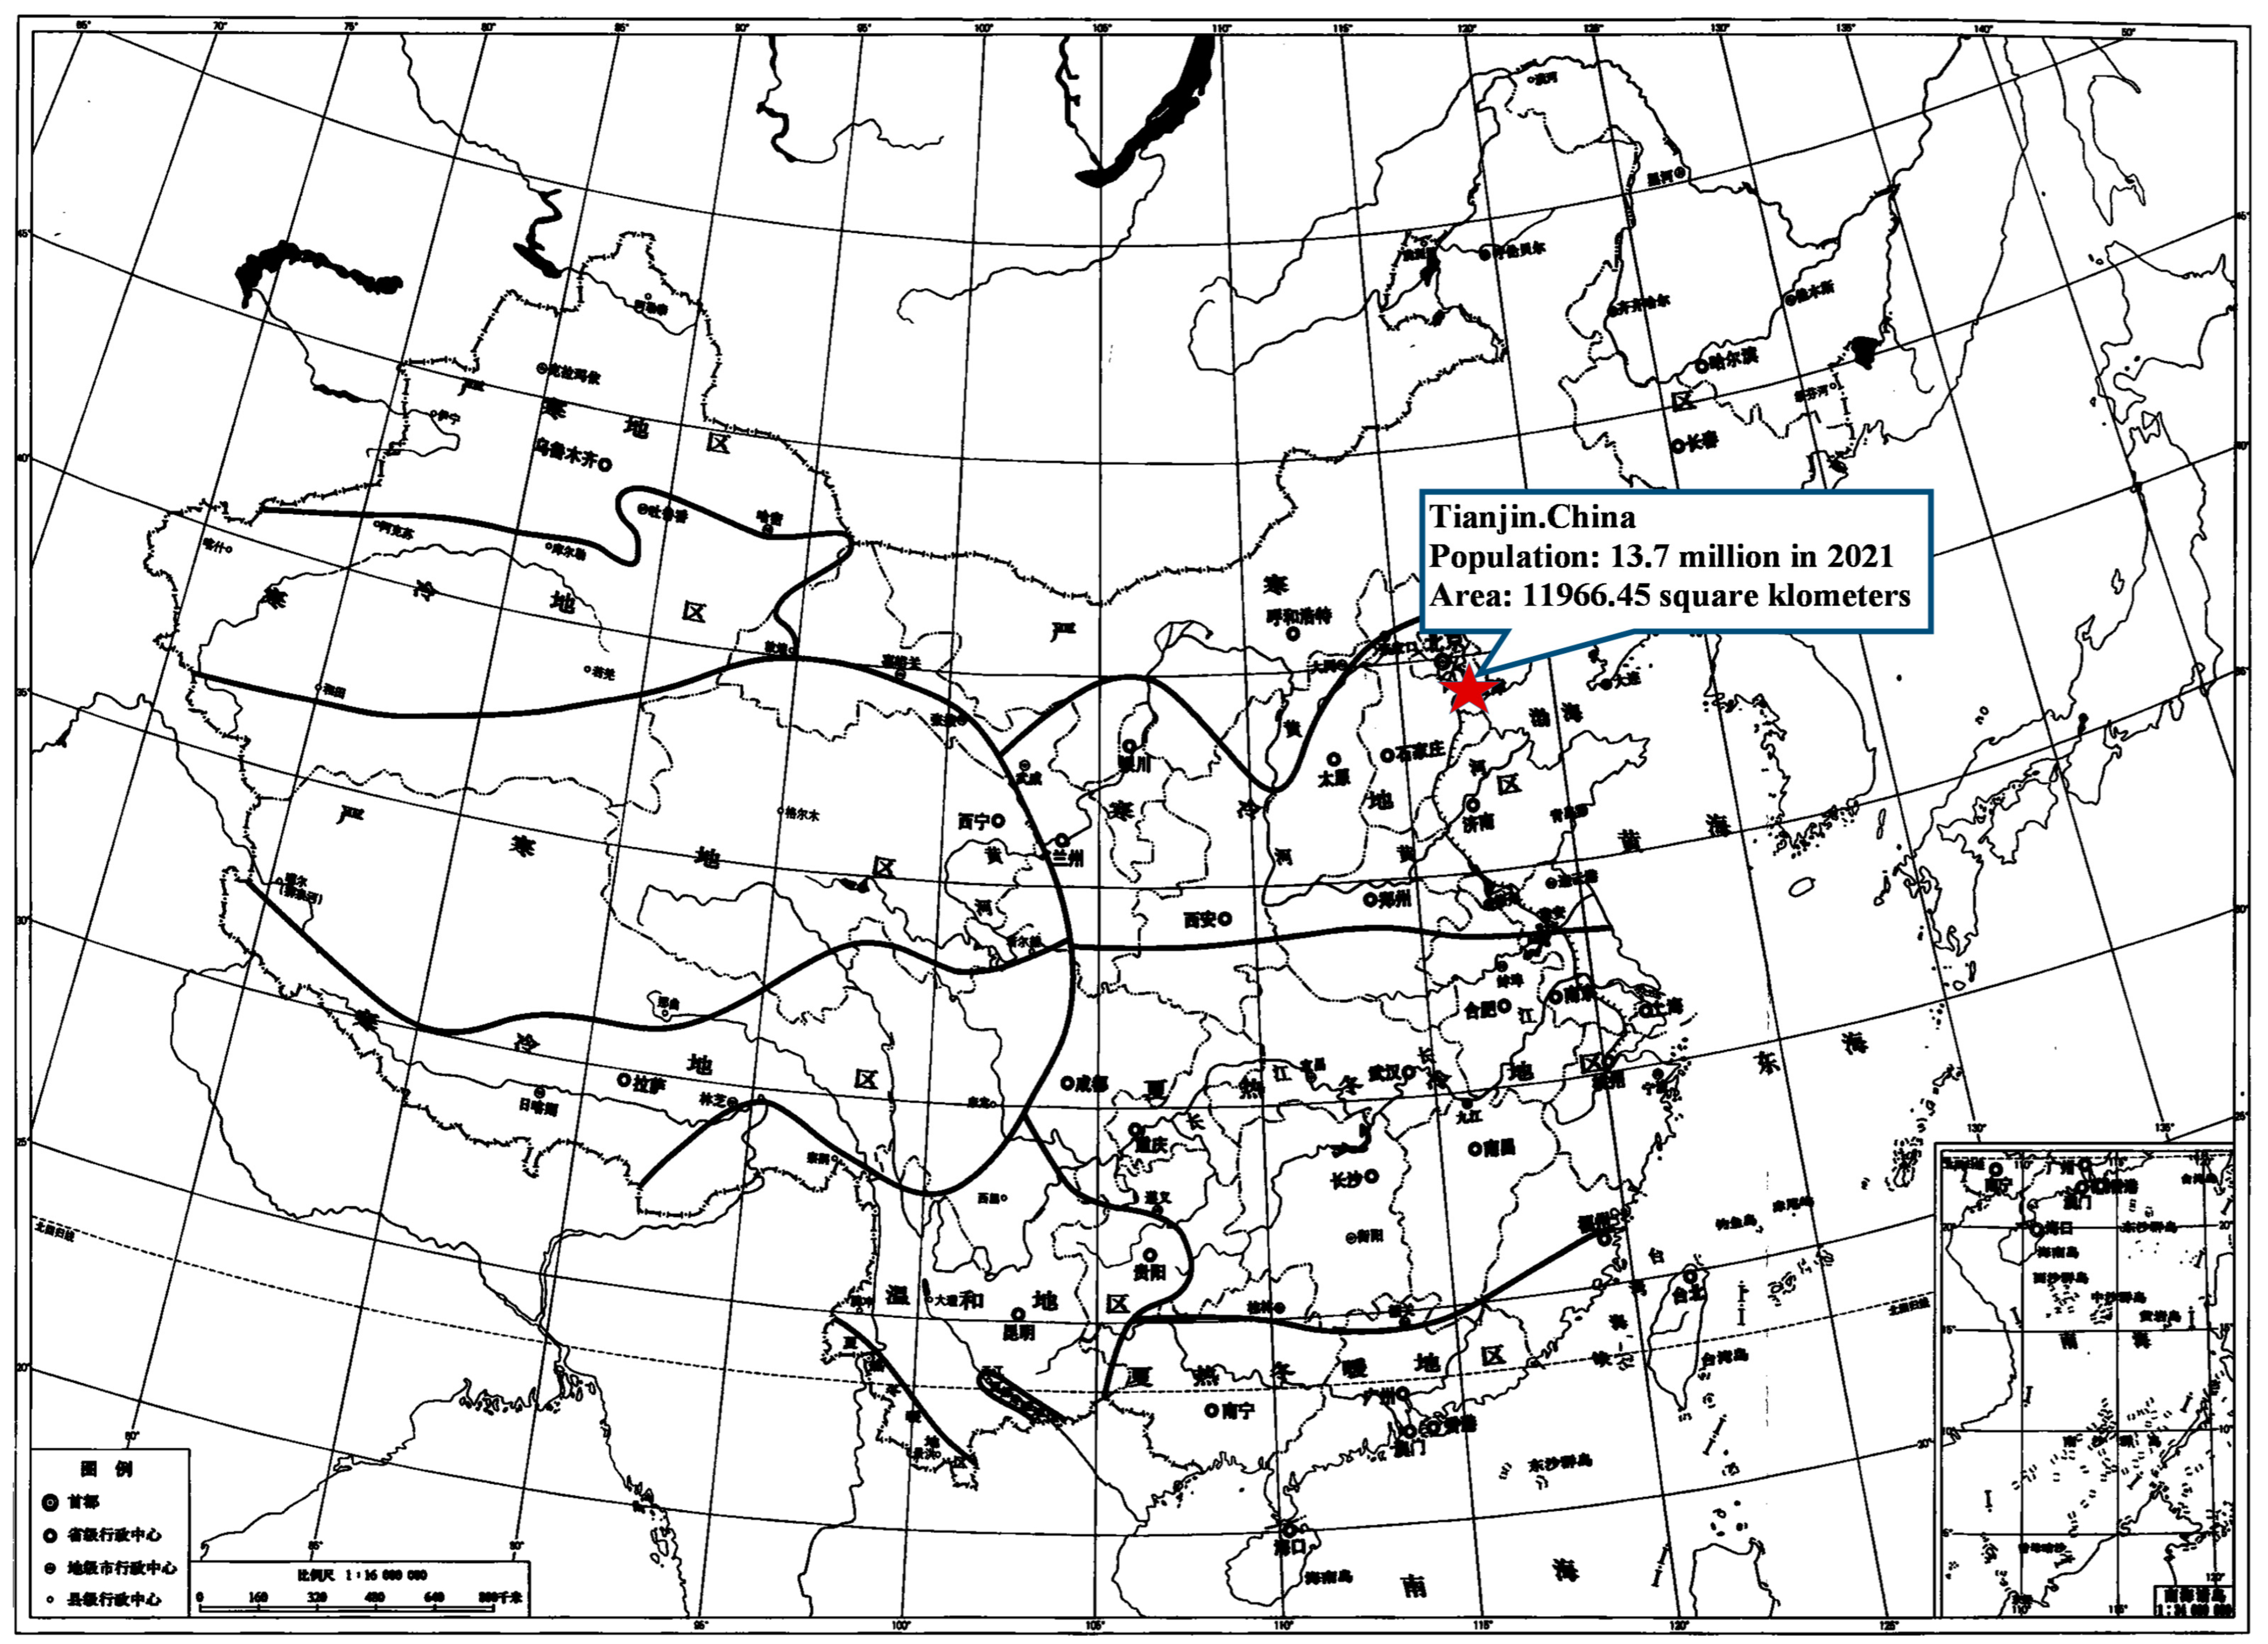
2.1. Study Area and Data

The study area is Tianjin, China, with a population of 13.7 million in 2021. This is a typical city in China’s cold climate zone, as shown in Figure 2. The average annual temperature in Tianjin is about 14 °C. The hottest month is July, with an average monthly temperature of 28 °C; January is the coldest month with an average monthly temperature of −2 °C. There are a large number of public buildings in the city, including office buildings, commercial buildings, school buildings, etc., which provide data sources for the study.
With the support of relevant government departments, a survey of public buildings involving 16 municipal districts in Tianjin was conducted from 2015 to 2022, requiring management personnel of public buildings to fill out energy consumption survey forms. Management personnel was trained before the report was completed. A total of 721 public buildings were surveyed, including government office buildings, commercial office buildings, shopping malls, 3-star and below hotels, 4-star and 5-star hotels, high schools, primary schools, and kindergartens. The main reported information includes building area, construction year, building function, annual electricity consumption, natural gas consumption, coal consumption, municipal heat consumption, etc.
Buildings that were functioning normally and with complete data records (at least one year or more) in recent years were selected as a survey sample. Moreover, if the building is retrofitted for energy efficiency, only the operational energy consumption of the retrofitted building will be recorded. The number of samples of different building types is basically consistent with the proportion of building types in Tianjin, namely, office buildings (40%), shopping malls (30%), hotels (11%), and schools (19%).
The construction time of the buildings involved in the study is from 1985 to 2019, which is also the construction time of most public buildings in Tianjin. Buildings built in earlier years and without retrofitting tend to have poor wall materials, such as buildings built before 2005 (with a survey sample size of 223), typically using mixed brick and concrete structures, with heat transfer coefficients typically higher than 0.6 W/(m2·k). The majority of buildings built after 2005 (498 samples surveyed) are structured with concrete frames and shear walls, with a heat transfer coefficient between 0.45 and 0.6 W/(m2·k).
Due to Tianjin’s low-carbon policy in recent years, almost all coal-fired boilers in public buildings have been converted to gas-fired boilers. Therefore, in the data processing, the coal combustion energy consumption in the earlier period is converted to natural gas based on the corresponding conversion coefficient in order to calculate the final carbon emissions. The conversion coefficient between burning coal and natural gas is 1.2 kgce/m3 natural gas.

2.2. Algorithm for Calculating Building Carbon Emission Baseline

For large data samples of different building and energy types, this study used the K-means clustering algorithm and the Quartile method [31] for comparative calculation.
The K-means clustering algorithm is commonly used to process many different categories of data, featuring good scalability and high efficiency. SPSS software was used for the K-means cluster analysis. The number of clusters is 4, the maximum number of iterations is 100, and the convergence factor was 0. Then, according to the mean value of each cluster center, the advanced value, guiding value, and constraint value of the carbon emission baseline were determined.
The carbon emission index from buildings determined by the Quartile method is the index value of a certain proportion of buildings that is lower than that proportion, i.e., it represents the index level that a certain number of buildings can achieve. In this study, the top 25% (third percentile line), top 50% (second percentile line), and top 75% (first quantile line) of the data are selected to represent the advanced value, guidance value, and constraint value of the carbon emission baseline, respectively.

2.3. Carbon Emission Calculation Method

The carbon emission calculation method follows the Standard for building carbon emission calculation (GB/T51366-2019) [35], in which the total carbon emissions of a building are determined based on the product of the building’s energy consumption and the corresponding carbon emission factors. In Tianjin, the types of energy used in public buildings include electricity, natural gas, and municipal heating. Due to coal phase-out policies in recent years, coal no longer exists in the energy consumption of buildings. Therefore, carbon emissions in the construction sector include only direct carbon emissions from gas, and indirect carbon emissions from building electricity and municipal heating, as shown in Formula (1).
Since China no longer published provincial power carbon emission factors in recent years, in this study, the power carbon emission factors were calculated according to the latest data and the method of China’s Average Carbon Dioxide Emission Factor of Regional and Provincial Power Grids published in 2010 [36]. The carbon emission factor of natural gas was selected from the GB/T51366-2019, and the regional central heating carbon emission factor of Tianjin is calculated from the heating data collected by government departments, as shown in Table 2. To measure the impact of the building’s energy consumption structure on carbon emissions, a comprehensive carbon emission factor (EFc), i.e., the ratio of carbon emissions in buildings to energy consumption, was proposed, As shown in Formula (2), when a building fully adopts zero carbon energy, the EFc value is zero and the building is zero carbon. When the building fully adopts high-carbon emission energy such as coal, the EFc value is large, and then the building has high carbon emission. Therefore, the EFc value is mainly affected by the type of energy used in the building and can be used as an important parameter to characterize the low-carbon performance of the building’s energy structure.
C = E C e × E F g r i d + E C g × E F n a t u r a l   g a s + E C m × E F m u n i c i p a l   h e a t
E F c = C / E C
where, ECe is the electricity consumption per unit area, in kWh/m2; ECg represents the natural gas consumption per unit area, in m3/m2; ECm is the municipality’s thermal energy consumption per unit area, in kWh/m2; C is the carbon emission per unit area, in kgCO2/m2; EC is the total energy consumption per unit area of the building, in kWh/m2; EFgrid is the carbon emission factor of the power grid in Tianjin; EFnatural gas is the carbon emission factor of natural gas per unit mass; EFmunicipal heat is the carbon emission factor of regional central heating in Tianjin; and EFc is a comprehensive carbon emission factor.
The Pearson correlation coefficient method was used to analyze the relationship between building carbon emissions and characteristics, such as building area and building age, in order to determine the correlation between building characteristics and carbon emissions. If strongly correlated data exist, an appropriate parameter can be used to fairly represent carbon emissions from buildings.

3. Results and Discussion

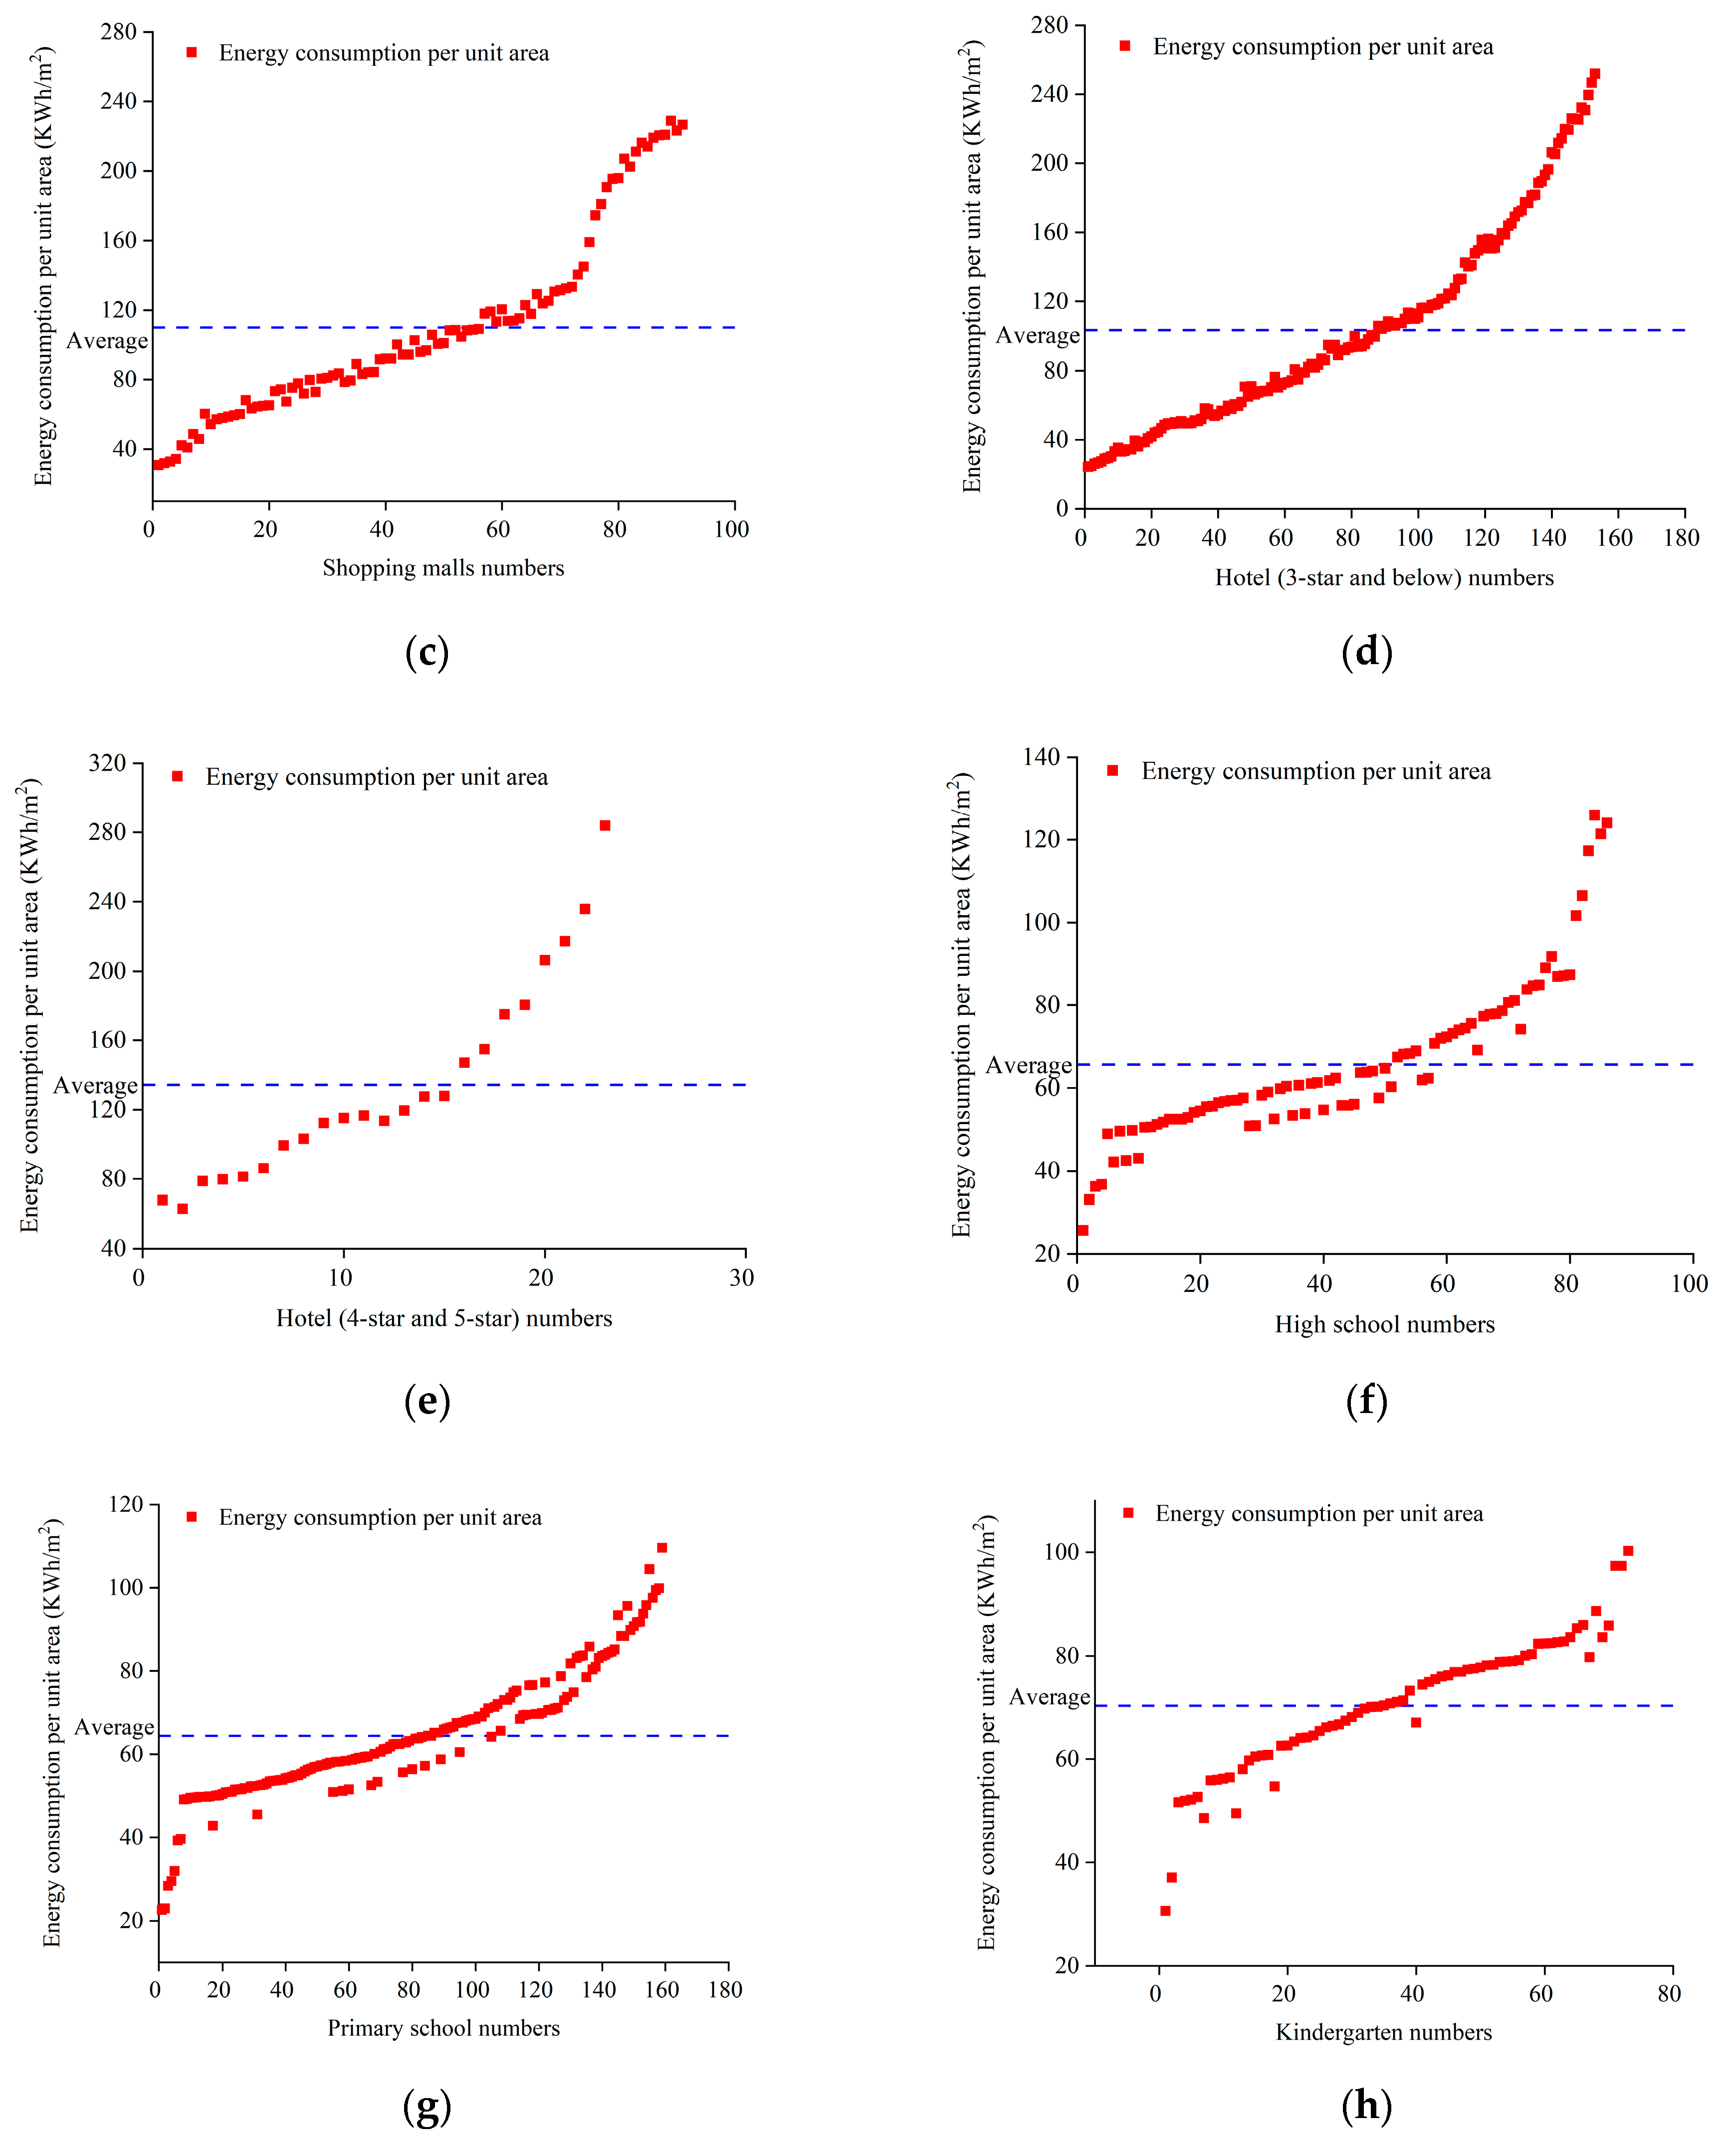
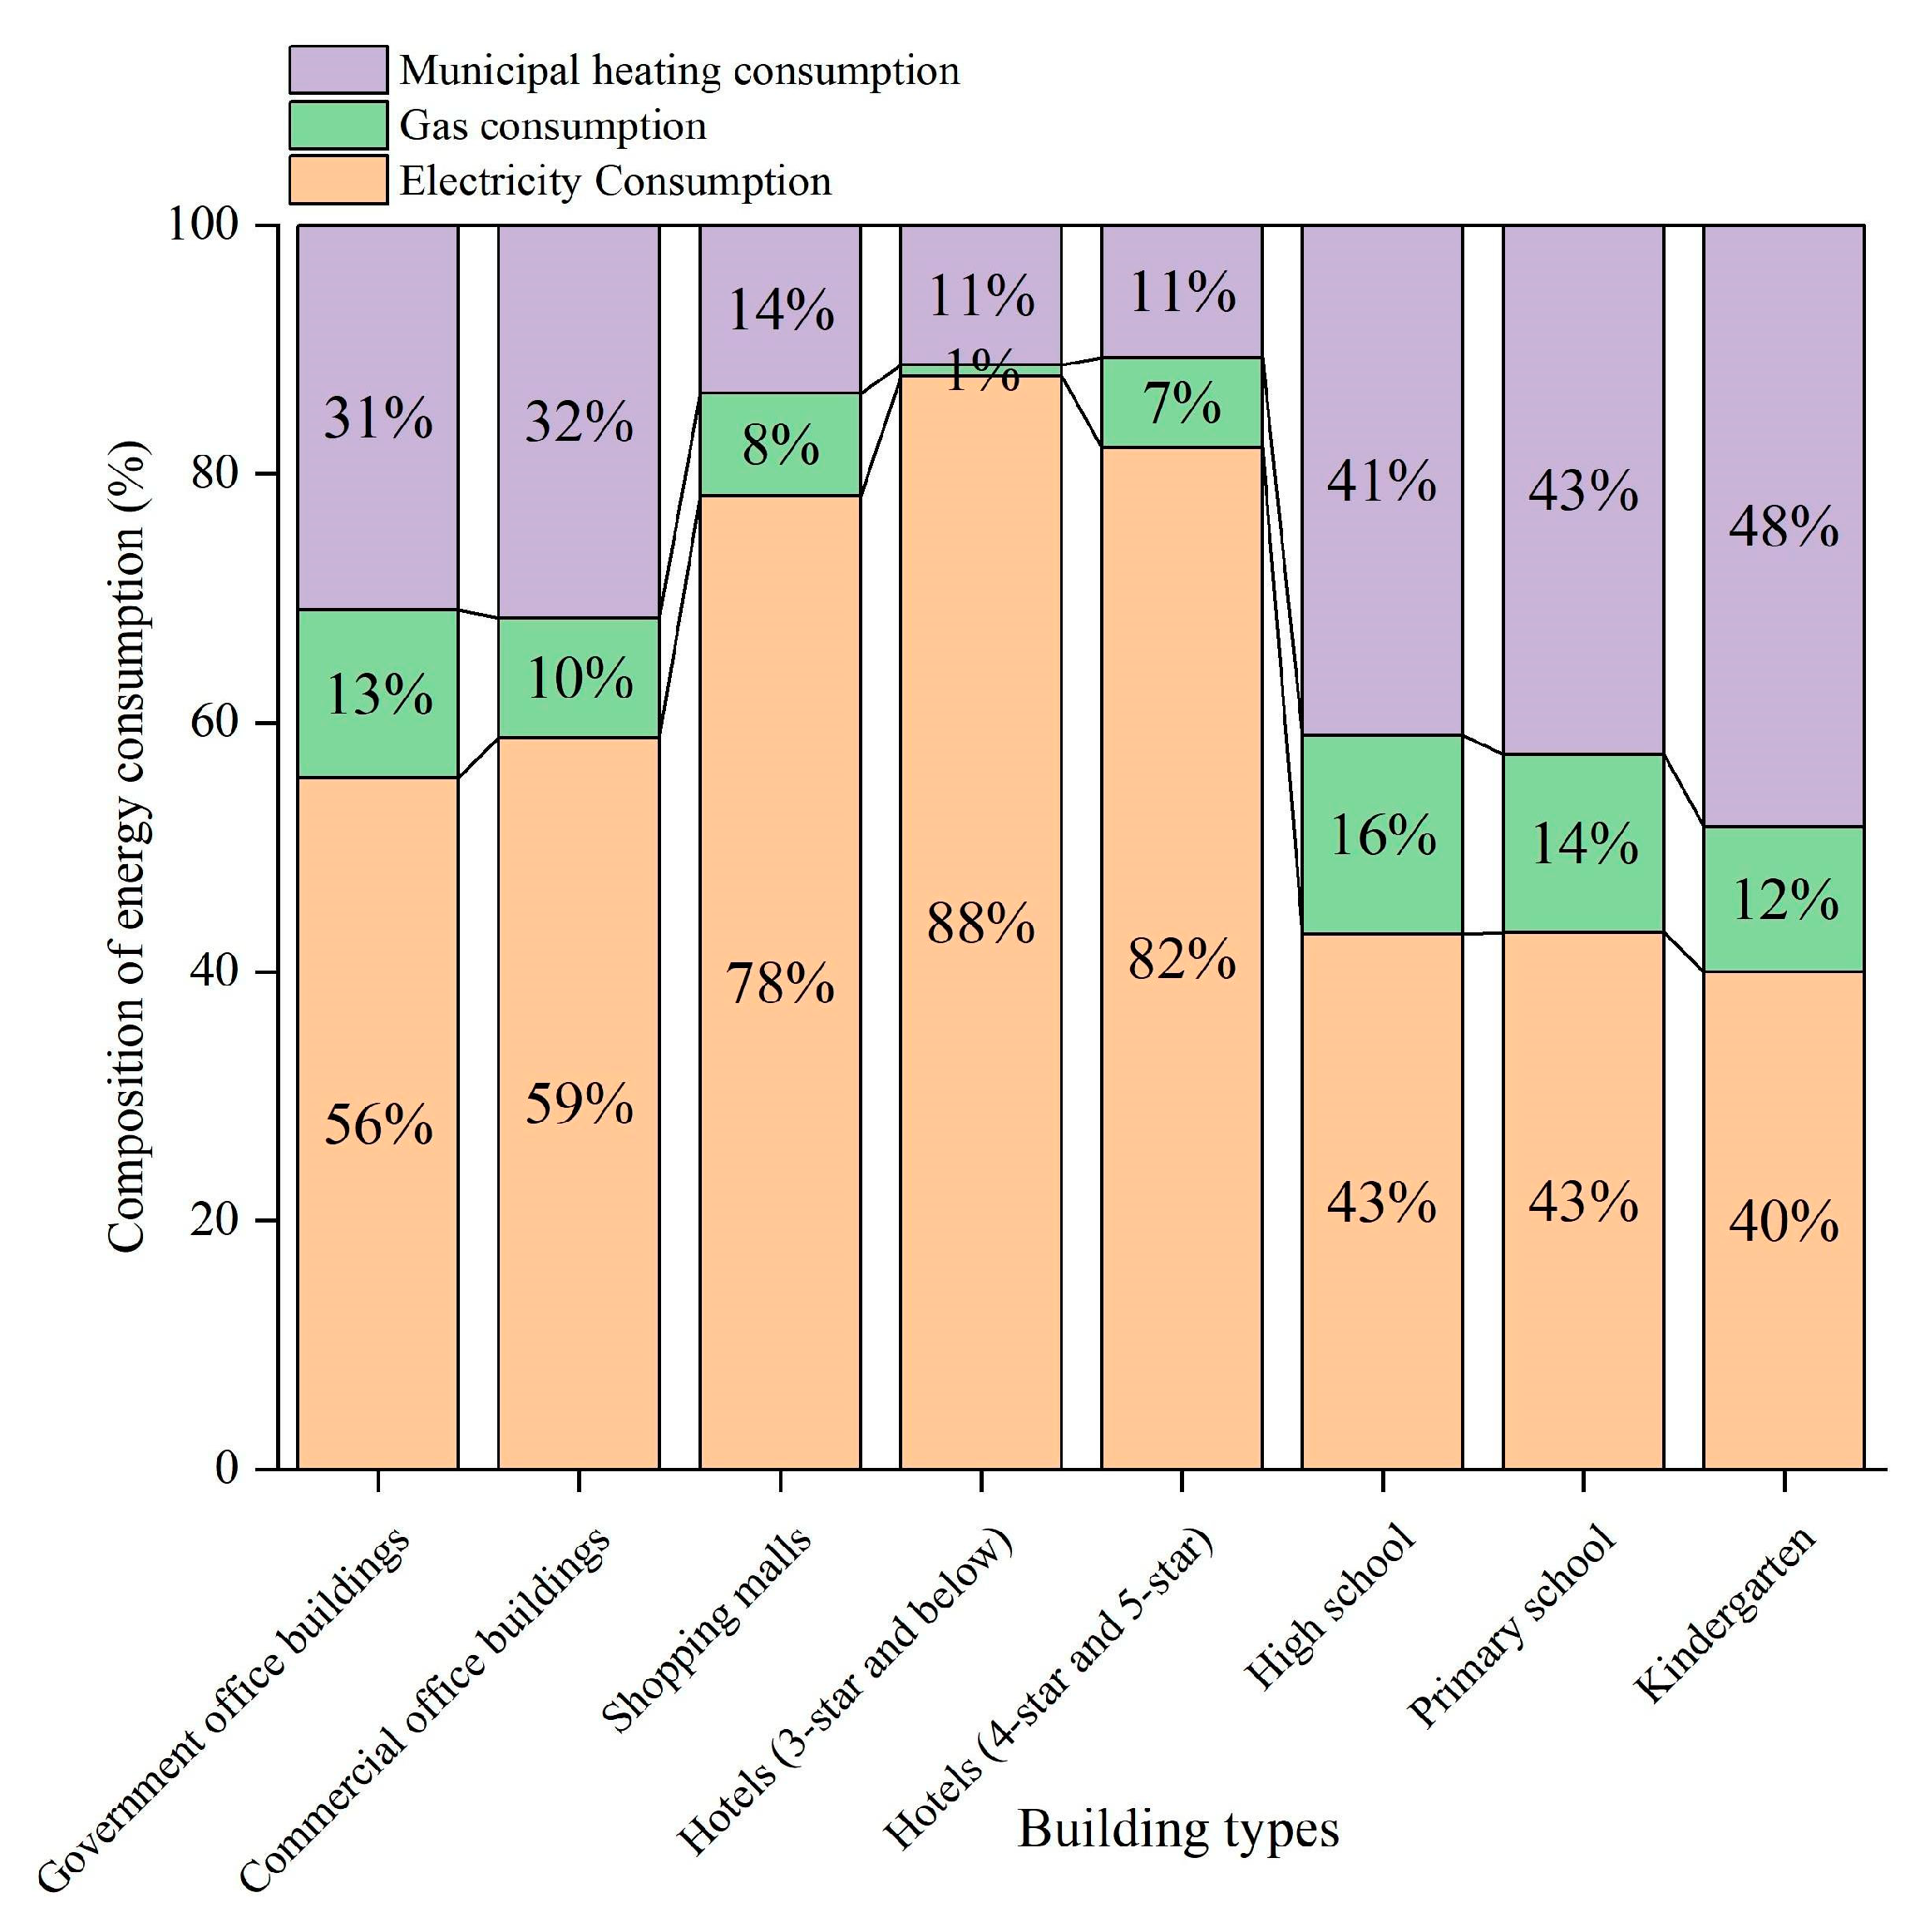
3.1. Energy Consumption

The level of energy consumption is shown in Figure 3. The average energy consumption for the three types of schools was 66.82 kWh/m2, which makes it the lowest of all the building types examined. In contrast, hotels have the highest average energy consumption of 118.88 kWh/m2. Energy consumption in 4-star and 5-star hotels is 30% higher than that in 3-star (and below) hotels. Overall, energy consumption in buildings is as follows: star hotels > shopping malls > office buildings > schools.
The reasons for the difference in energy consumption between different building types are numerous. For example, due to the winter and summer vacations, the energy consumption of school buildings throughout the year is lower than that of other buildings. Hotel buildings and shopping malls generally require better indoor environments and longer working hours, resulting in higher overall energy consumption than office buildings. There are also differences in energy consumption among the same building types, e.g., energy consumption in commercial office buildings is lower than in government office buildings, which indicates that managers of commercial office buildings should pay more attention to the benefits of building energy efficiency. Due to the provision of a more comfortable indoor environment (e.g., lighting and temperature) and more advanced services (such as thermostatic bathrooms), 5-star hotels consume more energy than 3-star (and below) hotels.
The composition of energy consumption (electricity, natural gas, and municipal heat) in public buildings in Tianjin is shown in Figure 4. Except for schools, the electricity consumption of other types of public buildings accounts for more than 50% of the total energy consumption, while in star-rated hotels exceeds 80%. All three types of schools use the largest share of municipal heat, an average of 45%. On the other hand, natural gas contributes the smallest share of energy consumption, with less than 20% for all building types.

3.2. Analysis of Carbon Emissions

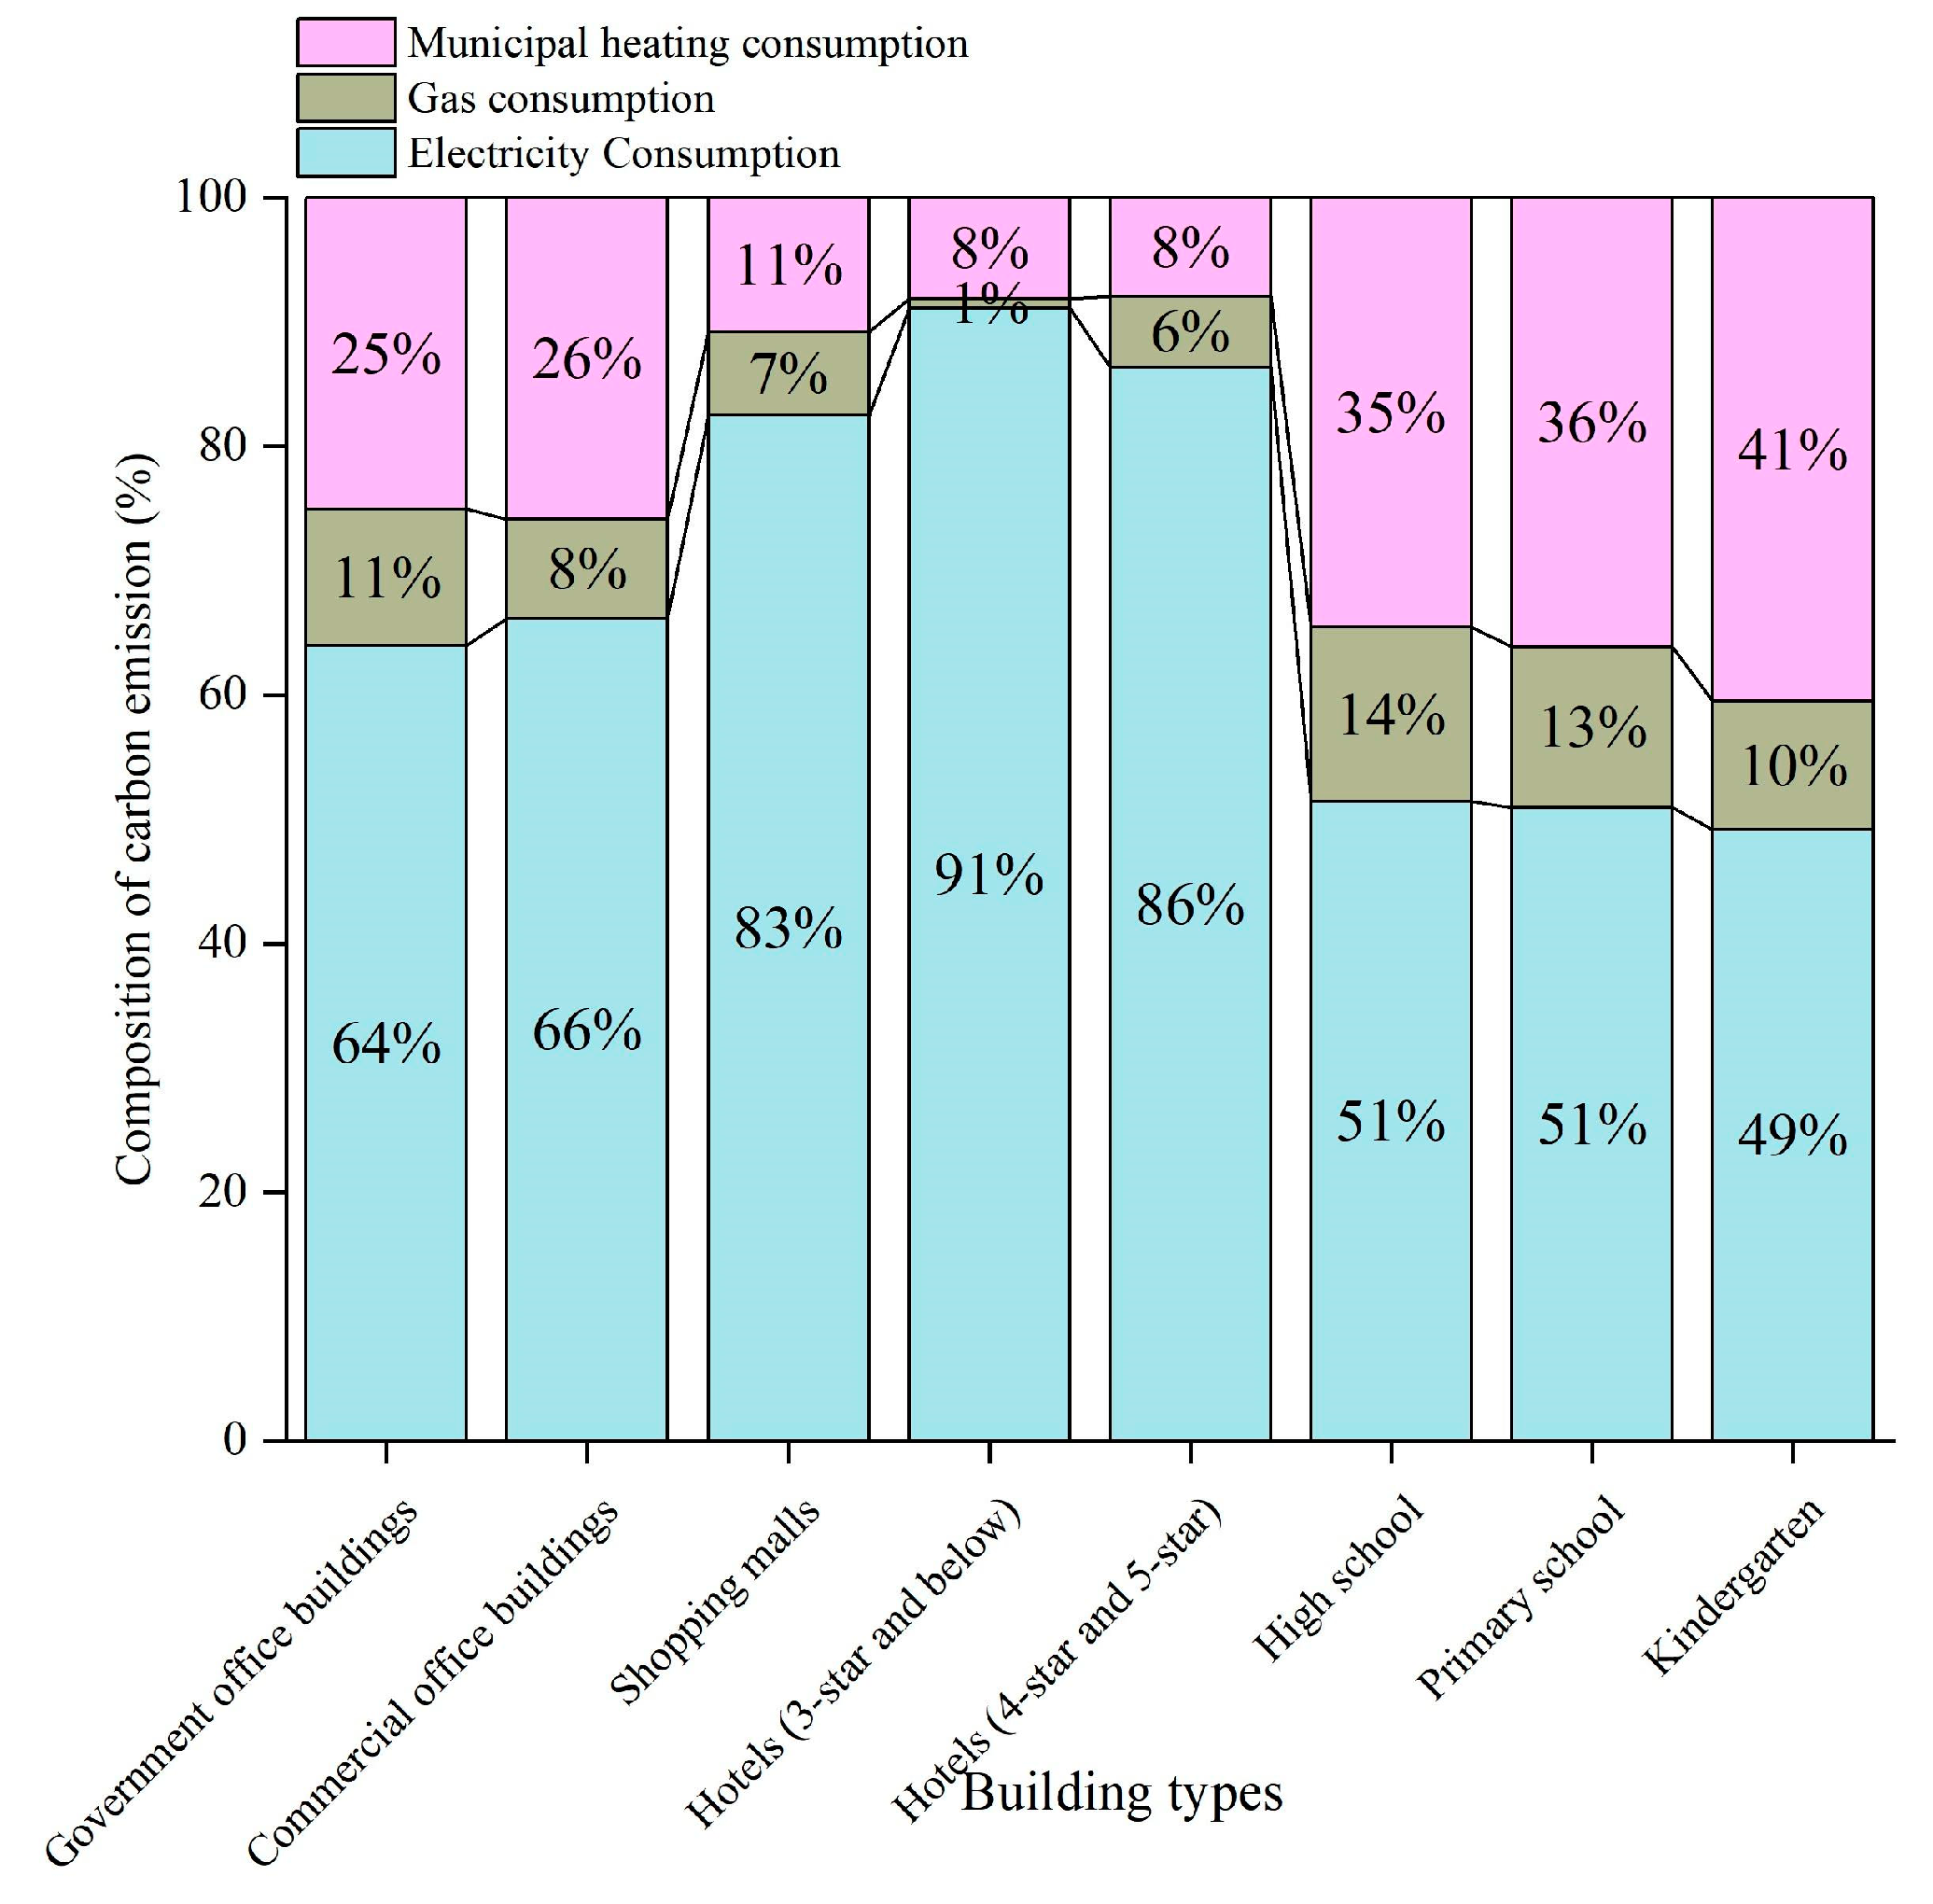
3.2.1. Composition of Carbon Emissions

According to Figure 5, the highest carbon emission per unit area is produced by 4-star and 5-star hotels, which emit 90.39 kgCO2/m2, while kindergartens emit only 36.46 kgCO2/m2, which is about 40% of that amount. Carbon emissions of 4-star and 5-star hotels are higher compared to 3-star (and below) hotels, the main contributors being higher indoor environmental requirements and higher energy demand. The different EFc values are caused by variations in energy structure, with 3-star (and below) hotels having the highest EFc of 0.68 and kindergartens having the lowest EFc of 0.56. The reason for the mentioned phenomenon is that 3-star (and below) hotels have the largest share of electricity consumption, which reaches 91%, while the current decarbonization of the power system has not been completed. This value will gradually decrease in the future due to the continuous reduction of the carbon emission factor of the power grid. Most of the kindergarten buildings use central heating, with a relatively low carbon emission factor of the heat source, as shown in Figure 6.

3.2.2. Correlation Analysis between Building Area and Carbon Emissions

Pearson’s correlation coefficient was used to determine the relationship between building area and carbon emission intensity (Table 3). It is generally believed that an absolute Pearson correlation coefficient value above 0.3 indicates a certain correlation, while a value above 0.5 indicates a strong correlation. The only building type that shows a certain correlation is 3-star (and below) hotels, where the Pearson correlation coefficient between carbon emission intensity and the building area is 0.448. The level of service and energy demand increases with hotel size, which ultimately leads to a relationship between the intensity of carbon emissions and the area of the building. The building envelope can be optimized [34], cleaner energy sources can be used (e.g., increasing solar energy supply [35]), and the energy efficiency of building equipment can be increased [36], all of which will reduce the level of carbon emissions from buildings.

3.2.3. Correlation Analysis between Building’s Construction Age and Carbon Emissions

China started promoting new wall materials and energy-efficient buildings around the 1980s (1987–1992). Taking the release time of the Design Standard for Energy Efficiency of Public Buildings (GB50189-2005) [11] as a critical time point, the carbon emission intensity of existing public buildings in Tianjin can be analyzed in three stages, i.e., 1987 and earlier, from 1988 to 2005, and 2006 and later (Table 4). The carbon intensity of commercial office buildings shows a strong negative correlation with construction age, followed by kindergartens. For these two building types, the later the building was built, the lower the carbon intensity. The carbon emission intensity of both types of buildings decreases with the construction age of the building. The decrease in the level of carbon emissions in the commercial office buildings constructed before 1987 and after 2006 is 42%. This phenomenon is a result of China’s buildings continuously promoting energy efficiency regulations, which have improved the efficiency of HVAC systems, thermal performance, and operational management [33]. The carbon emission intensity of other building types shows a weaker correlation with construction age. This is caused by a combination of two opposing factors, i.e., the later the construction age, the higher the level of service and environmental control required and the greater the energy demand, while the energy efficiency of buildings is steadily increasing as a result of the ongoing development of new technologies.

3.3. Comparison of Building Carbon Emission Baselines according to two Calculation Methods

The baselines of carbon emissions from public buildings for the two calculation methods are shown in Figure 7. Due to the high carbon emissions of some buildings, the baseline for carbon emissions provided by the K-means clustering algorithm is typically higher compared to the Quartile method. Taking the constraint value of carbon emission baseline as an example, the unsatisfactory rates of existing government office buildings, commercial office buildings, shopping malls, 3-star (and below) hotels, 4-star and 5-star hotels, high schools, primary schools, and kindergartens are 9.09%, 16.67%, 16.48%, 15.69%, 4.35%, 1.16%, 6.92%, and 8.22%, respectively. Except for kindergartens, advanced baseline carbon values for all building types are above the first quartile line. In summary, for the smooth promotion of carbon neutrality and peak carbon value, it is recommended to use the Quartile method as the baseline method, using the results of the first, second, and third quartiles as the advanced, guiding, and constraint values for the carbon baseline in Tianjin.
Compared with previous studies in other Chinese cities and provinces such as Beijing [37], Shanghai [37], Hong Kong [38,39], and Taiwan [15], the carbon emissions per unit area of buildings are lower in this study, reflecting a better low-carbon performance of public buildings in Tianjin. This phenomenon is closely related to the development of energy-saving and low-carbon building policies in Tianjin in recent years. For example, energy conservation efforts in public buildings in Tianjin began in 2005, and mandatory energy conservation standards (Tianjin Design Standard for Energy Efficiency of Public Buildings DB 29-153) were revised in 2010 and 2014, respectively. In addition, for existing public buildings, Tianjin has joined the list of key cities to improve energy efficiency, implementing energy-saving retrofit of nearly 10 million m2 of public buildings. Furthermore, coal substitution has been implemented in recent years. The comprehensive implementation of the above measures brings enormous advantages for energy conservation and carbon emission reduction in public buildings in Tianjin compared to other provinces and cities.
Compared with the relevant results of foreign research, such as for Singapore [13], Sweden [40], Sydney (Australia) [41], Gujarat (India) [42], and Bristol (UK) [43], energy consumption and carbon emissions in this study are lower. Research of 29 hotels in Singapore [13] shows that the carbon emission per unit area is 221.8 kg/(m2. a), while in this study is 61.44~74.03 kg/(m2. a) (the median). The higher level of energy consumption in Singapore is the main source of this difference, which is 3.2 times higher than the average energy consumption of hotels in Tianjin. This is related to the difference in climate conditions and the level of building services in the two regions. Compared to commercial buildings in Bristol (UK) [43], the carbon emissions of shopping malls in Tianjin are one-quarter of that, while the energy consumption is one-seventh, indicating that although Bristol (UK) has high energy consumption, it has a low-carbon energy structure due to the extensive application of renewable energy. The transformation of the energy structure is also an important path for the low-carbon development of public buildings in Tianjin.

3.4. Dynamic Baseline of Carbon Emissions in Public Buildings during the Period 2022–2030

Building carbon emissions caused by electricity consumption change dynamically with the change in the carbon emission factor of the power grid, and the future carbon emission baseline of buildings should be dynamically adjusted. According to the requirements of the Implementation Plan of Carbon Peak in Tianjin [44] by 2025, the share of green electricity in the external power supply of Tianjin should reach one-third, according to which the carbon emission factors of electricity from 2022 to 2030 were calculated. Accordingly, the advanced, guiding, and constraint values of the dynamic carbon emission baseline in Tianjin from 2022 to 2030 are shown in Table 5. The advanced value of the carbon emission baseline of government office buildings, commercial office buildings, shopping malls, 3-star (and below) hotels, 4-star and 5-star hotels, high schools, primary schools, and kindergartens decreased by 6.70%, 5.48%, 10.31%, 9.43%, 10.80%, 5.08%, 4.18% and 4.91%, respectively, in 2030 compared to 2020.

4. Conclusions

As a typical city in the cold regions of northern China, Tianjin has long been an uninvestigated area in the study of carbon emission baseline for public buildings. In addition, in previous studies of the carbon emission baseline in other regions, the dynamic changes of the energy carbon emission factors were rarely considered, which is why the application of the research results is limited. To solve this problem, this study established a CO2 emission baseline and considered its dynamic changes over the next few years, which is used to allocate current and future CO2 emission allowances for various public buildings in Tianjin.
The carbon emission baseline is based on the annual energy consumption data (i.e., building power, gas, and municipal heat consumption) of 721 public buildings in Tianjin, China. For the used data, due to the high carbon emissions of individual buildings, the carbon emission baseline obtained by the K-means clustering algorithm will be 5~44% higher than the Quartile method, while the Quartile method will not be affected by the high or low carbon emission data of several individual buildings. Therefore, it is reasonable to use the Quartile method to obtain the advanced value, guiding value and constraint value of the public building carbon emission baseline in Tianjin.
Through correlation analysis of building carbon emissions, it has been determined that the age of a building can to some extent impact its unit area carbon emissions. However, this influence may be positive for some buildings and negative for others, as many other factors may have a greater impact. For instance, a favorable factor for reducing carbon emissions is that younger buildings tend to be more energy-efficient. Nevertheless, this may also indicate higher energy consumption due to more functional requirements and a comfortable environment, which constitutes a disadvantage for carbon reduction. Therefore, relying solely on building age to assess the level of carbon emissions may lead to unreliable conclusions, and a comprehensive analysis using more factors is required.
Due to the change in the proportion of green electricity in the future, the carbon emission of public buildings with electricity consumption as the main form of energy consumption will be dynamic. The carbon emission baseline in 2030 will be reduced by 3.4~9.2% compared to 2022. The different reduction proportions are mainly influenced by the building type and energy consumption structure. The proposed carbon emission baseline is applicable to government office buildings, commercial office buildings, shopping malls, hotels, high schools, primary schools, kindergartens and other building types in Tianjin, which will play an important role in guiding the formulation of the emission trading scheme and policies for public buildings from 2022 to 2030.
The study found that there are significant differences in the carbon emission intensity of different types of public buildings. This is mainly related to factors such as operational characteristics, service levels, and energy structure. Even for the same building type, such as hotels (3-star and below) and hotels (4-star and 5-star), there are differences in carbon emission intensity. Therefore, when formulating policies to limit carbon emissions, the government should apply a differentiated and refined management based on the differences between buildings. For the method used in this study, the building sample size can be expanded in the future, and the research scope of public buildings should also be extended to all types of buildings in Tianjin, so that the government can have a more comprehensive basis when formulating and evaluating the carbon peak policies.

Author Contributions

X.L.: Writing, review and editing; Y.L.: Investigation and visualization; H.Z.: Writing, review, editing, and visualization; Z.F.: Investigation, software, and data curation; X.C.: Conceptualization, resources, and methodology; and W.Z.: Project administration and formal analysis. All authors have read and agreed to the published version of the manuscript.

Funding

This study was supported by the Research Fund of the Chinese Academy of Building Research (Project Name: Research on Low-carbon and carbon-neutral Design Methods and Key Technologies for Residential Buildings and Public Buildings (20222001330730006).

Data Availability Statement

Not applicable.

Conflicts of Interest

The authors declare no conflict of interest.

Nomenclature

EFcComprehensive carbon emission factor of the building
ECeElectricity consumption per unit area of the building
ECgNatural gas consumption per unit area of the building
ECmMunicipal thermal energy consumption per unit area of the building
CCarbon emission per unit area of the building
HVACHeating Ventilation and Air Conditioning
ECTotal energy consumption per unit area of the building
EFgridCarbon emission factor of the power grid in Tianjin
EFnatural gasCarbon emission factor of natural gas per unit mass
EFmunicipal heatCarbon emission factor of regional central heating in Tianjin
EUITotal energy consumption per unit of floor area

References

  1. Keatinge, W.R.; Donaldson, G.C. The impact of global warming on health and mortality. South. Med. J. 2004, 97, 1093–1100. [Google Scholar] [CrossRef] [PubMed]
  2. Röck, M.; Saade, M.; Balouktsi, M.; Rasmussen, F.; Birgisdottir, H.; Frischknecht, R. Embodied GHG emissions of buildings—The hidden challenge for effective climate change mitigation. Appl. Energy 2020, 258, 114107. [Google Scholar] [CrossRef]
  3. Schleussner, C.F.; Rogelj, J.; Schaeffer, M.; Lissner, T.; Licker, R.; Fischer, E.M.; Knutti, R.; Levermann, A.; Frieler, K.; Hare, W. Science and policy characteristics of the Paris Agreement temperature goal. Nat. Clim. Chang. 2016, 6, 827–835. [Google Scholar] [CrossRef]
  4. American Government. Executive Order on Tackling the Climate Crisis at Home and Abroad. Available online: https://www.whitehouse.gov/briefing-room/presidential-actions/2021/01/27/executive-order-on-tackling-the-climatecrisis-at-home-and-abroad/ (accessed on 15 December 2022).
  5. European Commission. European Climate Law. Available online: https://ec.europa.eu/clima/policies/eu-climate-action/law_en (accessed on 15 December 2022).
  6. The Government of China. The Outline of the 14th Five-Year Plan (2021–2025) for National Economic and Social Development and the Long-Range Objectives through the Year 2035. Available online: http://www.gov.cn/xinwen/2021-03/13/content_5592681.htm (accessed on 15 December 2022).
  7. United Nations Environment Programme. Emissions Gap Report 2022: The Closing Window—Climate Crisis Calls for Rapid Transformation of Societies, Nairobi, 2022. Available online: https://www.unep.org/emissions-gap-report-2022 (accessed on 15 December 2022).
  8. CABEE. China Building Energy Consumption and Carbon Emissions Research Report. Chongqing, 2020. Available online: https://www.cabee.org/site/content/24021.html (accessed on 15 December 2022).
  9. Boehm, S.; Jeffery, L.; Levin, K.; Hecke, J.; Schumer, C.; Fyson, C.; Majid, A.; Jaeger, J.; Nilsson, A.; Naimoli, S.; et al. State of Climate Action 2022; World Resources Institute: Washington, DC, USA, 2022. [Google Scholar] [CrossRef]
  10. MOHURD. General Code for Energy Efficiency and Renewable Energy Application in Buildings; GB 55015-2021; China Architecture & Building Press: Beijing, China, 2021. (In Chinese)
  11. MOHURD. Design Standard for Energy Efficiency of Public Buildings; GB 50189-2015; China Architecture & Building Press: Beijing, China, 2015. (In Chinese)
  12. The Government of China. Establish and Improve the Implementation Plan of Carbon Peaking Carbon Neutral Standard Metering System. Available online: http://www.gov.cn/zhengce/zhengceku/2022/11/01/content_5723071.htm (accessed on 17 December 2022).
  13. Droutsa, K.G.; Balaras, C.A.; Lykoudis, S.; Kontoyiannidis, S.; Dascalaki, E.G.; Argiriou, A.A. Baselines for energy use and carbon emission intensities in hellenic nonresidential buildings. Energies 2020, 13, 2100. [Google Scholar] [CrossRef]
  14. Wu, X.; Priyadarsini, R.; Eang, L.S. Benchmarking energy use and greenhouse gas emissions in Singapore’s hotel industry. Energy Policy 2010, 38, 4520–4527. [Google Scholar]
  15. Huang, K.-T.; Wang, J.C.; Wang, Y.-C. Analysis and benchmarking of greenhouse gas emissions of luxury hotels. Int. J. Hosp. Manag. 2015, 51, 56–66. [Google Scholar] [CrossRef]
  16. Lai, J.; Lu, M. Analysis and benchmarking of carbon emissions of commercial buildings. Energy Build. 2019, 199, 445–454. [Google Scholar] [CrossRef]
  17. Feng, F.; Fu, Y.; Yang, Z.; O’Neill, Z. Enhancement of phase change material hysteresis model: A case study of modeling building envelope in EnergyPlus. Energy Build. 2022, 276, 112511. [Google Scholar] [CrossRef]
  18. Queiroz, N.; Westphal, F.S.; Pereira, F.O.R. A performance-based design validation study on EnergyPlus for daylighting analysis. Build. Environ. 2020, 183, 107088. [Google Scholar] [CrossRef]
  19. Park, J.H.; Jeon, J.; Lee, J.; Wi, S.; Yun, B.Y.; Kim, S. Comparative analysis of the PCM application according to the building type as retrofit system. Build. Environ. 2019, 151, 291–302. [Google Scholar] [CrossRef]
  20. Li, H.; Fu, Z.; Xi, C.; Li, N.; Li, W.; Kong, X. Study on the impact of parallel jet spacing on the performance of multi-jet stratum ventilation. Appl. Energy 2022, 306, 118135. [Google Scholar] [CrossRef]
  21. Huang, H.; Wang, H.; Hu, Y.J.; Li, C.; Wang, X. Optimal plan for energy conservation and CO2 emissions reduction of public buildings considering users’ behavior: Case of China. Energy 2022, 261, 125037. [Google Scholar] [CrossRef]
  22. Mazzeo, D.; Matera, N.; Cornaro, C.; Oliveti, G.; Romagnoni, P.; De Santoli, L. EnergyPlus, IDA ICE and TRNSYS predictive simulation accuracy for building thermal behaviour evaluation by using an experimental campaign in solar test boxes with and without a PCM module. Energy Build. 2020, 212, 109812. [Google Scholar] [CrossRef]
  23. Lu, S.; Wei, S.; Zhang, K.; Kong, X.; Wu, W. Investigation and analysis on the energy consumption of starred hotel buildings in Hainan Province, the tropical region of China. Energy Convers. Manag. 2013, 75, 570–580. [Google Scholar] [CrossRef]
  24. Lu, Y.; Tian, Z.; Zhou, R.; Liu, W. A general transfer learning-based framework for thermal load prediction in regional energy system. Energy 2021, 217, 119322. [Google Scholar] [CrossRef]
  25. Kong, X.; Lu, S.; Gao, P.; Zhu, N.; Wu, W.; Cao, X. Research on the energy performance and indoor environment quality of typical public buildings in the tropical areas of China. Energy Build. 2012, 48, 155–167. [Google Scholar] [CrossRef]
  26. Khayatian, F.; Sarto, L. Application of neural networks for evaluating energy performance certificates of residential buildings. Energy Build. 2016, 125, 45–54. [Google Scholar] [CrossRef]
  27. Jeong, K.; Hong, T.; Kim, J. Development of a CO2 emission benchmark for achieving the national CO2 emission reduction target by 2030. Energy Build. 2018, 158, 86–94. [Google Scholar] [CrossRef]
  28. Ikotun, A.M.; Ezugwu, A.E.; Abualigah, L.; Abuhaija, B.; Heming, J. K-means Clustering Algorithms: A Comprehensive Review, Variants Analysis, and Advances in the Era of Big Data. Inf. Sci. 2022, 622, 178–210. [Google Scholar] [CrossRef]
  29. Yang, Z.; Roth, J.; Jain, R.K. DUE-B: Data-driven urban energy benchmarking of buildings using recursive partitioning and stochastic frontier analysis. Energy Build. 2018, 163, 58–69. [Google Scholar] [CrossRef]
  30. Chung, W. Review of building energy-use performance benchmarking methodologies. Appl. Energy 2011, 88, 1470–1479. [Google Scholar] [CrossRef]
  31. Zeng, X.; Zhou, Z.; Gong, Y.; Liu, W. A data envelopment analysis model integrated with portfolio theory for energy mix adjustment: Evidence in the power industry. Socio-Econ. Plan. Sci. 2022, 83, 101332. [Google Scholar] [CrossRef]
  32. Lee, W.S. Benchmarking the energy efficiency of government buildings with data envelopment analysis. Energy Build. 2008, 40, 891–895. [Google Scholar] [CrossRef]
  33. Qaisar, I.; Zhao, Q. Energy baseline prediction for buildings: A review. Results Control. Optim. 2022, 7, 100129. [Google Scholar] [CrossRef]
  34. Xiao, F.; Fan, C. Data mining in building automation system for improving building operational performance. Energy Build. 2014, 75, 109–118. [Google Scholar] [CrossRef]
  35. MOHURD. Standard for Building Carbon Emission Calculation; GB/T51366-2019; China Architecture & Building Press: Beijing, China, 2019. (In Chinese)
  36. National Development and Reform Commission. 2010 China’s Average Carbon Dioxide Emission Factor of Regional and Provincial Power Grids. Available online: https://www.ccchina.org.cn/ (accessed on 17 December 2022).
  37. Jiang, M.P.; Tovey, K. Overcoming barriers to implementation of carbon reduction strategies in large commercial buildings in China. Build. Environ. 2010, 45, 856–864. [Google Scholar] [CrossRef]
  38. Bağcı, B. Energy saving potential for a high-rise office building. Intell. Build. Int. 2009, 1, 156–163. [Google Scholar] [CrossRef]
  39. Jing, R.; Wang, M.; Zhang, R.; Li, N.; Zhao, Y. A study on energy performance of 30 commercial office buildings in Hong Kong. Energy Build. 2017, 144, 117–128. [Google Scholar] [CrossRef]
  40. Wallhagen, M.; Glaumann, M.; Malmqvist, T. Basic building life cycle calculations to decrease contribution to climate change—Case study on an office building in Sweden. Build. Environ. 2011, 46, 1863–1871. [Google Scholar] [CrossRef]
  41. Braslavsky, J.H.; Wall, J.R.; Reedman, L.J. Optimal distributed energy resources and the cost of reduced greenhouse gas emissions in a large retail shopping centre. Appl. Energy 2015, 155, 120–130. [Google Scholar] [CrossRef]
  42. Garg, A.; Maheshwari, J.; Shukla, P.; Rawal, R. Energy appliance transformation in commercial buildings in India under alternate policy scenarios. Energy 2017, 140, 952–965. [Google Scholar] [CrossRef]
  43. Acha, S.; Mariaud, A.; Shah, N.; Markides, C.N. Optimal design and operation of distributed low-carbon energy technologies in commercial buildings. Energy 2018, 142, 578–591. [Google Scholar] [CrossRef]
  44. The People’s Government of Tianjin Municipality. Implementation Plan of Carbon Peak in Tianjin. Available online: https://www.tj.gov.cn/zwgk/szfwj/tjsrmzf/202209/t20220914_5987984.html (accessed on 20 December 2022).
Figure 1. Framework of this study.
Buildings 13 01108 g001
Figure 2. Location for public building investigation.
Buildings 13 01108 g002
Figure 3. Distribution of energy consumption in buildings surveyed in 2020: (a) government office buildings; (b) commercial office buildings; (c) shopping malls; (d) hotels with 3-star and below; (e) hotels with 4-star and 5-star, (f) high schools, (g) primary schools; and (h) kindergartens.
Buildings 13 01108 g003aBuildings 13 01108 g003b
Figure 4. Structure of energy consumption of the surveyed buildings in 2020.
Buildings 13 01108 g004
Figure 5. Levels of carbon emissions and Ec.
Buildings 13 01108 g005
Figure 6. Distribution of carbon emissions.
Buildings 13 01108 g006
Figure 7. Carbon emission baselines of public buildings for the two calculation methods: (a) government office buildings; (b) commercial office buildings; (c) shopping malls; (d) hotels with 3-star and below; (e) hotels with 4-star and 5-star, (f) high schools, (g) primary schools; and (h) kindergartens.
Buildings 13 01108 g007aBuildings 13 01108 g007b
Table 1. Studies on carbon emissions of existing buildings.
Study No.LocationBuilding TypeSample SizeEnergy Utilization Index (EUI)
(kWh/m2/a)
Carbon Emission
(kgCO2/m2/a)
1Hong Kong, ChinaOffice1330273.8
2Beijing, ChinaCommercial5173178
3Shanghai, ChinaCommercial4132119
4SingaporeHotel29427221.8
5SwedenOffice11002.7
6Hong Kong, ChinaHotel3N.A.168–288
8Taiwan, ChinaHotel58277132
9Gujarat, IndiaCommercial19798–18196–177
10Hong Kong, ChinaOffice30236190
11Bristol, UKCommercial11107250
12ChinaOffice362N.A.73.45
13Hong Kong, ChinaRetail and office32115.769.6
Table 2. Carbon emission factor.
Type of Energy SupplyCarbon Emission Factor
Power grid0.78 (kgCO2/kWh)
Natural gas2.02 (kgCO2/m3)
Regional central heating0.60 (kgCO2/kWh)
Table 3. The Pearson correlation coefficient between building area and carbon emissions.
Building TypesCorrelation Coefficient
Government office buildings0.015
Commercial office buildings−0.192
Shopping malls−0.078
Hotels (3-star and below)0.448
Hotels (4-star and 5-star)0.272
High school−0.169
Primary school−0.298
Kindergarten−0.141
Table 4. Correlation coefficient between building construction age and carbon emissions.
Building TypesCorrelation Coefficient
Government office buildings−0.121
Commercial office buildings−0.557
Shopping malls−0.152
3-star (and below) hotels−0.248
4-star and 5-star hotels−0.216
High school−0.209
Primary school−0.271
Kindergarten−0.454
Table 5. Carbon emission baselines of public buildings in Tianjin during the period 2022-2030.
YearBuilding Types/Predicted Value Government Office BuildingsCommercial Office BuildingsShopping MallsHotels (3-Star and below)Hotels (4-Star and 5-Star)High SchoolPrimary SchoolKindergarten
kgCO2/m2kgCO2/m2kgCO2/m2kgCO2/m2kgCO2/m2kgCO2/m2kgCO2/m2kgCO2/m2
2022Advanced value42.70 31.58 44.64 34.75 54.86 28.66 28.21 32.65
Guiding value52.89 42.05 63.84 61.44 74.03 34.53 35.14 39.28
Constraint value70.12 62.25 84.79 90.83 92.37 42.60 41.52 44.42
2024Advanced value42.11 31.22 43.56 34.06 53.61 28.40 27.96 32.31
Guiding value52.01 41.56 62.31 59.98 72.79 34.17 34.73 38.81
Constraint value69.30 60.91 83.10 88.72 90.74 41.90 40.95 43.86
2026Advanced value41.53 30.87 42.52 33.39 52.40 28.08 27.73 31.99
Guiding value51.04 41.07 60.82 58.56 71.59 33.67 34.33 38.35
Constraint value68.05 59.72 81.47 86.67 89.16 41.33 40.42 43.32
2028Advanced value40.98 30.53 41.52 32.74 51.22 27.68 27.49 31.68
Guiding value50.10 40.37 59.38 57.22 70.42 33.21 33.90 37.91
Constraint value66.79 58.68 79.84 84.69 87.63 40.77 40.06 42.74
2030Advanced value40.39 30.19 40.78 32.09 50.05 27.44 27.26 31.36
Guiding value49.28 39.61 57.94 56.27 69.26 32.84 33.51 37.46
Constraint value65.53 57.63 77.90 82.71 86.10 40.22 39.78 42.14
Disclaimer/Publisher’s Note: The statements, opinions and data contained in all publications are solely those of the individual author(s) and contributor(s) and not of MDPI and/or the editor(s). MDPI and/or the editor(s) disclaim responsibility for any injury to people or property resulting from any ideas, methods, instructions or products referred to in the content.

