Abstract
For improving the seismic isolation effect, traditional rubber isolation bearing provides a smaller horizontal stiffness. However, it is unfavorable for the displacement control of the seismic isolation layer under rare earthquakes. In this paper, an improved lead-core rubber isolation bearing is proposed. The improved isolation bearing can provide a small horizontal stiffness to enhance the seismic isolation effect under small earthquakes. Under large earthquakes, it can provide a large horizontal stiffness to prevent over-limit failure due to excessive displacement. The mechanical properties of the improved isolation bearing were investigated using the finite element method (FEM), and the restoring force model of the improved isolation bearing was established. Based on the FEMA P-58 theory, the earthquake loss assessment in terms of repair cost and casualty indexes was carried out for normal frame structures, normal isolation structures, and improved isolation structures. The results show that the improved isolation bearing maintains a smaller horizontal stiffness before the displacement is limited, giving full play to the isolation performance. After that, the horizontal stiffness of the bearing is enhanced, which can effectively control the displacement of the seismic isolation layer. The lead-core can give full play to the energy dissipation characteristics. Under the four performance levels, the improved isolation structure has the highest safety reserve and the best collapse resistance. The use of improved isolation bearings can reduce the repair cost of the structure and casualties.
1. Introduction
As a new type of structural vibration control technology, seismic isolation technology is widely used in practical engineering. Different from the traditional seismic design method, seismic isolation technology extends the natural vibration period of the structure by establishing the seismic isolation layer, which can reduce the seismic energy input to the superstructure. The seismic isolation systems proposed by researchers mainly include the laminated friction-slip isolation system [1], the rubber isolation system [2], and the rolling isolation system [3]. The laminated rubber isolation system has become a safe, economical, and effective vibration control method due to its advantages, such as convenience of construction and good control effect. However, in terms of performance-based seismic isolation design, the traditional rubber isolation system still has shortcomings. The seismic isolation system provides only a single horizontal stiffness. The smaller the horizontal stiffness of the seismic isolation layer, the more prominent the corresponding seismic isolation effect. But under strong earthquakes, the seismic isolation layer will produce large displacement, which might lead to the destruction of the isolation device and even the structure [4,5,6,7].
In order to solve the shortcomings of the traditional isolation system and make the isolation system achieve better isolation effect, researchers have made improvements on the basis of the traditional isolation system. Wilde et al. [8] first proposed a variable isolation system composed of laminated rubber bearings and shape memory alloy (SMA) bars. It was found that the SMA bar cannot only improve the energy dissipation capacity of the seismic isolation system, but also control the displacement. Xue and Li [9] introduced three types of SMA-based dampers and one NiTi-SMA laminated rubber bearing. The results showed that the SMA rubber bearing can effectively alleviate the seismic response in terms of acceleration and displacement. Hosseini et al. [10] evaluated the performance of SMA wire’s configurations using straight, cross, and double-cross arrangements in the seismic retrofitting of bridges by nonlinear dynamic analysis. The results showed that the maximum mid-span displacement and residual displacement of SMA-LRBs with double-cross wires were the smallest. Behrooz et al. [11] proposed a magnetorheological elastomer (MRE) isolation system with variable stiffness and conducted an experimental study. The results showed that the MRE isolation system significantly reduced the acceleration and relative displacement of floors. After that, Yang et al. [12] developed a self-powering MRE isolation system. The test and simulation results showed that this new type of isolation system can generate enough electricity to maintain the operation of isolation bearings when subjected to ground motions and significantly reduce the acceleration and relative displacement of floors. Yuan et al. [13] proposed an active control isolation system combining a linear electromagnetic spring in parallel with a conventional linear isolation system. The dynamic response of the isolator was analyzed by using the dynamic model and then validated by experiments. The research demonstrated that the stiffness of the isolation system can be adjusted by controlling the current excited to the coils. Rahnavard [14,15] proposed two innovative steel-rubber isolators with rubber cores and found that the use of rubber cores in the isolator reduced the horizontal stiffness and significantly increased the damping ratio, resulting in a reduction in the input force to the structure. Isakovic and Fischinger [16] proposed the high damping rubber bearing with variable stiffness based on the magnetically controlled elastomer, which can provide uniform stiffness over the entire range of possible displacement. Li et al. [17] conducted aging and seawater erosion cycle tests on lead rubber isolation bearings (LRBs) and found that the horizontal stiffness and vertical stiffness of LRBs increased with alternating of aging time and seawater erosion time. Huang et al. [18] investigated the seismic response characteristics of the BIS system (only a lead-rubber-bearing (LRB) base-isolated structure) under rare and very rare earthquakes. The study indicated that the shear strain of LRB under very rare earthquakes may exceed the ultimate shear strain, thus causing damage to the base-isolated structure. Gao et al. [19] conducted an experimental study on the isolation system with variable stiffness formed by the series connection of different types of isolation bearings. The results showed that the combined isolation system reduced the overall acceleration of the structure and had a significant effect on reducing the displacement of the top of the structure. Peng et al. [20] proposed a two-stage friction pendulum bearing (TSFPB) with variable stiffness based on the traditional friction pendulum bearing. It was found that the two-stage seismic isolation method has better seismic performance compared with the traditional isolation method.
For the performance-based isolation design of structures, the Federal Emergency Management Agency (FEMA) issued the FEMA P-58 report [21]. The report proposes a new generation assessment method for the seismic performance of buildings. Based on the structural response and the vulnerability of the members, the repair cost of buildings and casualties are taken as the performance indicators of structures to quantify the loss of structures under earthquakes. Most of the research on seismic isolation systems only analyzes the structural response, ignoring the potential earthquake losses caused by non-structural members. There is little research on the economic performance of the isolation structure. The analysis of large amounts of data will also consume a great deal of the researchers’ energy. With the development of artificial intelligence, it will be promising to analyze data with artificial intelligence techniques [22,23,24,25,26,27].
Currently, the research of base seismic isolation technology on the isolation bearing with variable stiffness is still relatively scarce. Therefore, based on the shortcomings of the normal rubber isolation system, an improved lead-core rubber isolation bearing with variable stiffness is proposed in this paper. The isolation bearing provides smaller horizontal stiffness under small earthquakes, which extends the structural period to improve the isolation effect and provides damping and larger horizontal stiffness under large earthquakes to prevent the isolation bearing from over-limit failure due to excessive displacement. The vertical mechanical properties and compression-shear properties of the improved isolation bearing were investigated by numerical simulation, and the restoring force model of the improved isolation bearing was established. The improved isolation bearing was applied to the isolation structure, and the seismic responses of the normal frame structure, the frame structure with normal rubber isolation bearing as the seismic isolation layer, and the frame structure with improved rubber isolation bearing as the seismic isolation layer were analyzed through dynamic time-history analysis. Based on the FEMA P-58 theory, the earthquake loss assessment in terms of repair cost and casualty indexes was carried out for normal frame structures, normal isolation structures, and improved isolation structures. The seismic isolation performance of the three structural systems was comparatively analyzed.
2. Mechanical Properties of Improved Isolation Bearings
2.1. Theoretical Analysis and Design of Improved Isolation Bearing
The principle of seismic isolation of building structures is to extend the period of the structure by establishing a seismic isolation layer, thereby reducing the effect of earthquakes on the superstructure. Within a reasonable range, reducing the horizontal stiffness of the isolation bearing can improve the isolation effect. In the seismic isolation design, it is necessary to prevent the over-limit failure of the seismic isolation layer. The horizontal stiffness of rubber isolation bearing is positively correlated with the shear modulus of rubber, so the horizontal stiffness of rubber bearing can be reduced by reducing the shear modulus of rubber.
In this paper, an improved lead-core rubber isolation bearing is proposed, as shown in Figure 1. The horizontal stiffness of the isolation bearing is changed by using rubber with different shear modulus. The upper rubber layer of the isolation bearing is made of high-modulus rubber, and a lead core is added to the middle hole. The steel baffle is arranged on the lower connecting plate of the isolation bearing. The design specification and structure of the improved isolation bearing comply with the relevant provisions of the current codes in China [28,29,30,31]. There are two working conditions for the isolation bearing. The condition that the horizontal displacement δ of the middle steel plate of the isolation bearing is less than the reserved distance d of the limiting device is taken as the first working condition. Further, the condition that δ is greater than d is taken as the second working condition. The isolated bearing provides smaller horizontal stiffness in the first working condition, which improves the seismic isolation effect. In the second working condition, only the upper rubber layer and the lead core undergo shear deformation, which provides larger horizontal stiffness and damping to prevent excessive displacement of the isolation bearing and thus meets the deformation requirement.
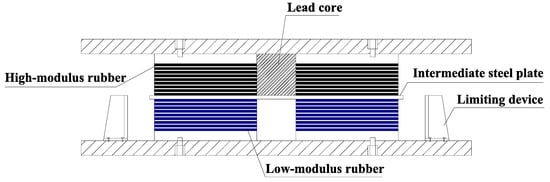
Figure 1.
Improved lead-core rubber bearing with variable stiffness.
2.2. Finite Element Analysis of Improved Isolation Bearing
The nonlinear finite element software ABAQUS (6.14) was used to establish the model of the improved rubber isolation bearing. The vertical mechanical properties and compression-shear properties of the improved rubber isolation bearing were analyzed, and the restoring force model of this isolation bearing was established.
2.2.1. Material Constitutive Model
- (1)
- Constitutive model of rubber
Rubber is a typical hyperelastic material, which can produce large displacement and strain under external force, showing complex material nonlinearity and geometric nonlinearity. The constitutive models of rubber are mainly divided into two categories: (1) Constitutive models based on thermodynamic statistics, such as the Van der Waals model [32] and the Arruda–Boyce model [33]. (2) The phenomenological constitutive model, such as the Mooney–Rivlin model [34], the Neo–Hookean model [35], and the Yeoh model [36]. In this simulation, the Mooney–Rivlin model was used to define the rubber material. The expression of the Mooney–Rivlin model is shown in Equation (1). The parameters of Mooney–Rivlin model can be determined according to Equation (2), in which C01/C10 are obtained by the nonlinear finite element analysis method in related literature [37,38,39]. The specific parameters are shown in Table 1.
where U is the strain energy; C10, C01, D1 are the positive-definite constants of the material; I1, I2 are the first and second invariants of the main elongation ratio, respectively; J is the elastic volume ratio; E0 is the elastic modulus of the rubber material.

Table 1.
Material parameters used in the Mooney–Rivlin model.
- (2)
- Constitutive model of lead core
The ideal elastic-plastic model was adopted for the model of lead core. The elastic modulus is 16 GPa, the Poisson’s ratio is 0.44, and the yield strength is 13 MPa.
- (3)
- Constitutive model of steel
The deformation in the lead-core rubber bearing is mainly borne by the rubber layer. The steel plate is always in an elastic stage, thus it can be regarded as an ideal linear elastic material. The elastic modulus of steel is 206 GPa and the Poisson’s ratio of steel is 0.3.
2.2.2. Finite Element Model of Isolation Bearing
The specific parameters of the finite element model are shown in Table 2. A device to limit the displacement was set in the model and it took effect when the shear deformation of the isolation bearing reaches 50%. The first shape coefficients S1 and S2 of the isolation bearing model are 21 and 5, respectively. For the convenience of calculation, the rubber protective layer was not considered. The finite element model is shown in Figure 2.
Table 2.
Parameters of the improved isolation bearing.
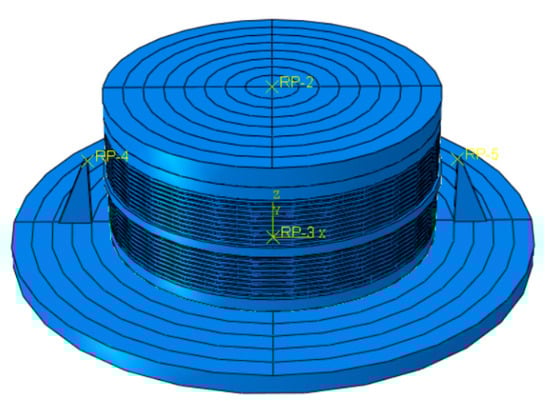
Figure 2.
Finite element model of isolation bearing.
2.2.3. Element Selection and Meshing
Rubber can be regarded as an incompressible material, so the 8-node reduced integral solid hybrid element (C3D8RH) was adopted for the rubber. In order to accurately simulate the mechanical properties of isolation bearings and improve the computational efficiency of the finite element method, the sandwich steel plate and the sealing plate were simulated by the C3D8R solid element. The meshing of the model is shown in Figure 3.
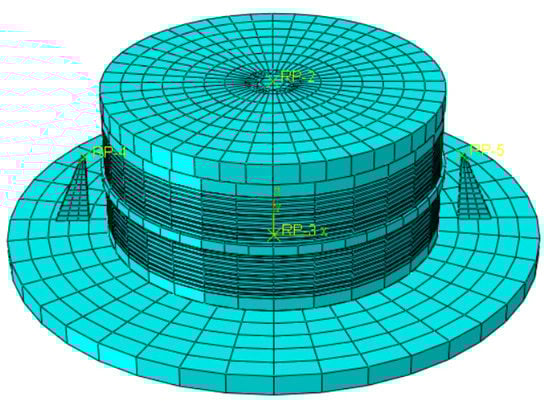
Figure 3.
Meshing of the model.
2.2.4. Boundary Conditions and Loading Scheme
In the manufacturing process of the laminated rubber bearing, the rubber and sandwich steel plate are generally bonded together through vulcanization and pressurization at high temperature. The sandwich steel plate and the rubber are not easy to peel off. Therefore, in the process of numerical analysis, the tie constraint was adopted as the constraint form between the rubber layer and the sandwich steel plate. The fixed constraint was adopted at the bottom of the rubber bearing to limit the translation and rotation of the bottom of the rubber bearing. The “hard” contact between the limiting device and the middle layer steel plate was adopted to achieve the purpose of limiting displacement.
In order to study the vertical compressive mechanical properties and horizontal compression-shear mechanical properties of the improved isolation bearing, vertical compressive stresses of 5 MPa, 10 MPa, 12 MPa, and 15 MPa were applied to the isolation bearing, respectively, according to the relevant regulations in the “Code for Seismic Design of Buildings” [40]. Through displacement control, the isolation bearing is subjected to cyclic loading with horizontal shear deformation of 50%, 75%, 100%, 125%, 150%, 175%, and 200%.
2.3. Results and Analysis
2.3.1. Compressive Mechanical Properties of Isolation Bearings
For common isolated structures, rubber isolation bearings are generally arranged under structural columns or shear walls, which need to bear the vertical load transmitted by the superstructure for a long time. Therefore, the vertical compression performance of the isolation bearing is an important index to ensure the safety of the structure and the normal operation of the isolation bearing. The vertical (Z-direction) stress cloud diagram and deformation cloud diagram of the isolation bearing under different compressive stresses were extracted, respectively. The stress cloud diagram and deformation cloud diagram are shown in Figure 4.
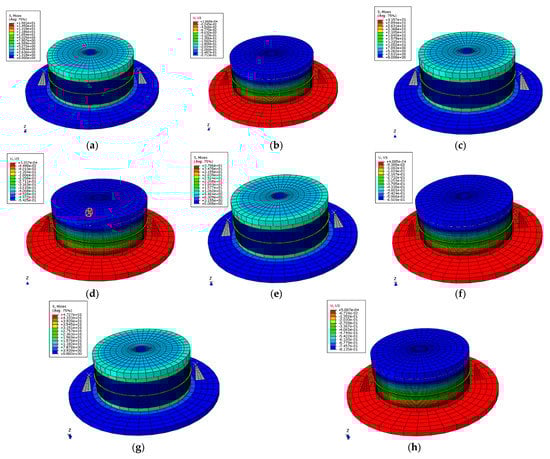
Figure 4.
Vertical (Z-direction) stress and deformation cloud diagram. (a) Stress cloud diagram (5 MPa); (b) Deformation cloud diagram (5 MPa); (c) Stress cloud diagram (10 MPa); (d) Deformation cloud diagram (10 MPa); (e) Stress cloud diagram (12 MPa); (f) Deformation cloud diagram (12 MPa); (g) Stress cloud diagram (15 MPa); (h) Deformation cloud diagram (15 MPa).
As shown in Figure 4, the vertical stress and compressive deformation of the isolation bearing increase linearly with the increase of the vertical compressive stress. When the vertical compressive stress of the isolation bearing increases from 5 MPa to 15 MPa, the peak stress on the top surface of the isolation bearing increases from 6.20 MPa to 18.61 MPa, and the maximum deformation of the isolation bearing increases from 0.271 mm to 0.814 mm.
According to the stress distribution, the stress of the isolation bearing is large in the middle annular area and small in the edge and center area of the isolation bearing. This is because under the vertical load, the rubber will produce lateral deformation in the direction of less restraint and the rubber in the middle annular area is in a three-way stress state due to the restraint of the sandwich steel plate, thus improving the bearing capacity and vertical compression stiffness of the rubber in the middle annular area. According to the deformation distribution, the vertical deformation of the upper part of the isolation bearing is larger than that of the lower part due to the accumulation of vertical compression deformation of the rubber layer. The elastic modulus of the steel plate is much larger than that of rubber. Therefore, the contribution of the steel plate layer to the vertical displacement is negligible, and the vertical displacement of the isolation bearing is caused by the compression deformation of the rubber layer.
The vertical compressive stiffness of the isolation bearing under different compressive stress is shown in Table 3. The vertical stiffness increases slightly with the increase of the compressive stress, because the vertical stiffness of the isolation bearing depends on the stiffness of the rubber. With the increase of the compressive stress, the constraint effect of the sandwich steel plate on the rubber layer increases, so the vertical compression stiffness of the isolation bearing increases accordingly.
Table 3.
Vertical stiffness of the isolation bearing.
2.3.2. Horizontal Compression-Shear Mechanical Properties of Isolation Bearings
The horizontal mechanical performance of the isolation bearing determines its isolation performance and thus determines the isolation effect of the overall structure. The stress cloud diagram and deformation cloud diagram of the improved isolation bearing model with shear deformation of 50%, 75%, 125%, and 175% under the compressive stress of 5 MPa and 15 MPa are listed, respectively. Shear deformation is represented by shear strain γ in subsequent analysis. To better display the stress distribution of the model, the stress distribution of the middle steel plate is ignored in the cloud diagram. The stress cloud diagram and deformation cloud diagram are shown in Figure 5 and Figure 6, respectively.
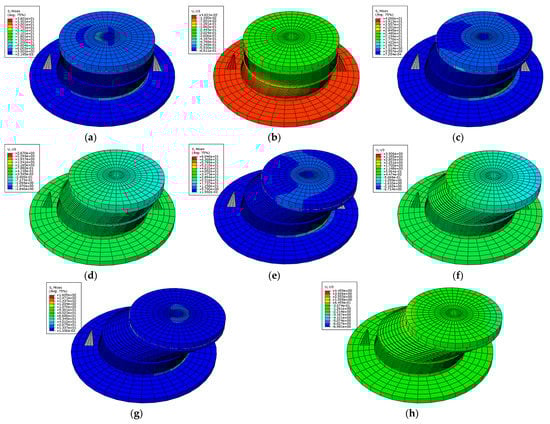
Figure 5.
Stress cloud diagram and Z-direction deformation cloud diagram (5 MPa). (a) Stress distribution (γ = 50%); (b) Z-direction deformation (γ = 50%); (c) Stress distribution (γ = 75%); (d) Z-direction deformation (γ = 75%); (e) Stress distribution (γ = 125%); (f) Z-direction deformation (γ = 125%); (g) Stress distribution (γ = 175%); (h) Z-direction deformation (γ = 175%).
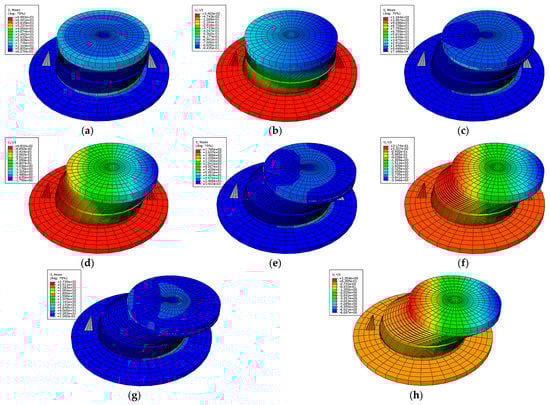
Figure 6.
Stress cloud diagram and Z-direction deformation cloud diagram (15 MPa). (a) Stress distribution (γ = 50%); (b) Z-direction deformation (γ = 50%); (c) Stress distribution (γ = 75%); (d) Z-direction deformation (γ = 75%); (e) Stress distribution (γ = 125%); (f) Z-direction deformation (γ = 125%); (g) Stress distribution (γ = 175%); (h) Z-direction deformation (γ = 175%).
As shown in Figure 5 and Figure 6, the stress concentration area of isolation bearing decreases with the increase of horizontal shear deformation. This is because the area of the core compression area of the isolation bearing decreases when the horizontal deformation of the isolation bearing occurs. According to the horizontal deformation, when the shear strain γ is less than 50%, the horizontal deformation is mainly borne by the lower rubber layer. Because of the setting of the limiting device, when the shear strain γ is greater than 50%, the lower rubber layer no longer undergoes shear deformation, and the horizontal deformation of the isolation bearing is borne by the upper rubber layer. The stress cloud diagram of isolation bearing in Z-direction is shown in Figure 7. According to Figure 7a,b, when the shear strain increases to 125%, the isolation bearing generates a tensile stress of 12.93 MPa. The area of tensile stress that appears is the area where the isolation bearing is easily damaged. As shown in Figure 7c, when the compressive stress on the isolation bearing increases from 5 MPa to 15 MPa, the tensile stress area of the isolation bearing expands, but the maximum tensile stress decreases to 12.90 MPa. This indicates that the increase of the vertical compressive stress on the isolation bearing is beneficial to the reduction of the tensile stress.
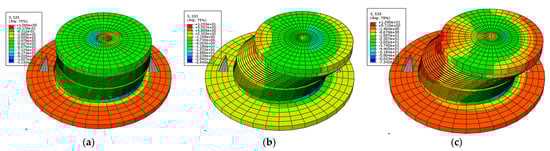
Figure 7.
Z-direction stress cloud diagram. (a) Z-direction stress (γ = 50%, 5 MPa); (b) Z-direction stress (γ = 125%, 5 MPa); (c) Z-direction stress (γ = 125%, 15 MPa).
The horizontal cyclic loading under the compressive stress of 5 MPa was carried out on the improved isolation bearing and the hysteresis curves under various shear strains were obtained, as shown in Figure 8.
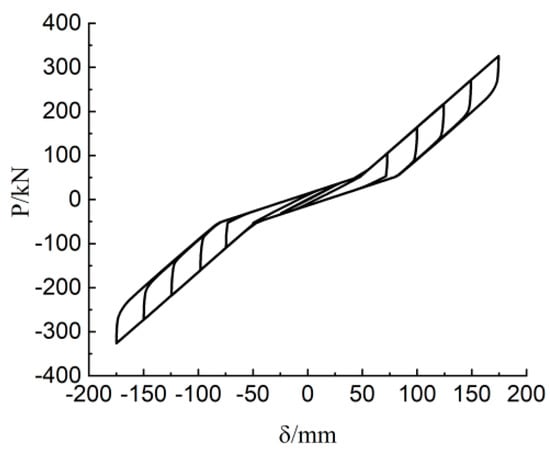
Figure 8.
Hysteresis curve.
As shown in Figure 8 and Figure 9, when γ is less than 25%, the slope of the hysteresis curve is almost unchanged. At this time, the lead core in the isolation bearing is not yielded and the isolation bearing has almost no energy dissipation capacity. When γ is greater than 25% and less than 50%, the slope of the hysteresis curve decreases. The rubber layers of the upper and lower parts of the isolation bearing work synergistically, and the stiffness decreases. When γ is greater than 50%, only the upper rubber layer and lead core undergo shear deformation. The slope of the hysteresis curve increases and the energy dissipation capacity is continuously increasing. This shows that the limiting device divides the working conditions of the improved isolation bearing into two types: (1) The first working condition is when the horizontal shear strain γ of the isolation bearing is less than 50%, as shown in Figure 10a. At this time, the rubber with low shear modulus at the lower part of the isolation bearing first undergoes shear deformation, which provides less horizontal stiffness and better seismic isolation effect. (2) The second working condition is when the horizontal shear strain γ of the isolation bearing is greater than 50%, as shown in Figure 10b. The limiting device limits the deformation of the rubber with the low shear model at the lower part of the isolation bearing, while the rubber with the high shear modulus at the upper part of the isolation bearing undergoes shear deformation to provide greater horizontal stiffness. At this time, the lead core starts to give full play to the function of energy dissipation.
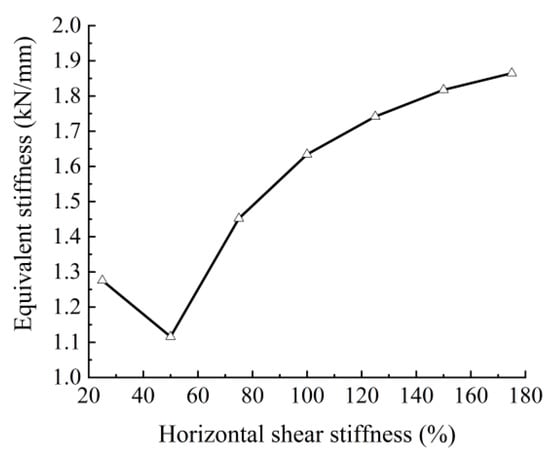
Figure 9.
Equivalent horizontal stiffness.
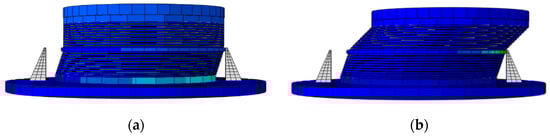
Figure 10.
Shear deformation of the improved rubber isolation bearing: (a) γ < 50%; (b) γ > 50%.
2.4. Restoring Force Model of Improved Isolation Bearing
According to the results of finite element analysis, a simplified restoring force model of the improved isolation bearing is obtained, as shown in Figure 11. When the isolation bearing is in the first working condition (δ is less than d), the restoring force model is simplified to a two-fold line model. Δ is the horizontal displacement of the bearing. D is the horizontal critical displacement of the bearing when the limiting device starts to work. In the figure, k1 is the stiffness of the isolation bearing before yielding, k2 is the stiffness of the isolation bearing after yielding, xy is the yield displacement, and x1 is the ultimate displacement.
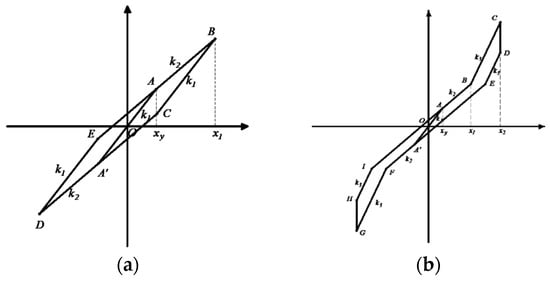
Figure 11.
Restoring force model of improved isolation bearing: (a) δ is less than d; (b) δ is greater than d.
- (1)
- The OA section is the positive elastic stage, and the initial stiffness k1 is the stiffness of the rubber layer at the lower part of the isolation bearing: .
- (2)
- The AB section is the plastic yielding stage, and the yield stiffness k2 is the parallel stiffness of the rubber layers at the upper and lower parts of the isolation bearing: .
When the isolation bearing is in the second working condition (δ is greater than d), the restoring force model is simplified to a three-fold line model. In the figure, k1 is the stiffness of the isolation bearing before yielding, k2 and k3 are the stiffness of the isolation bearing after yielding, xy is the yield displacement, x1 is the installation distance of the limiting device, and x2 is the ultimate displacement.
- (1)
- The OA section is the positive elastic stage, and the initial stiffness k1 is the stiffness of the rubber layer at the lower part of the isolation bearing: .
- (2)
- The AB section is the plastic yielding stage, and the yield stiffness k2 is the parallel stiffness of the rubber layers at the upper and lower parts of the isolation bearing: .
- (3)
- The BC section is the plastic hardening stage, and the yield stiffness k3 is the stiffness of the rubber layer at the upper part of the isolation bearing: .where G1 is the shear modulus of of the rubber layer at the lower part of the isolation bearing; G2 is the shear modulus of of the rubber layer at the upper part of the isolation bearing; A is the plane area of the rubber layer; is the total thickness of the rubber layer.
In addition to the control group U55B35, the hysteretic analysis of the horizontal shear deformation to 175% under 10 MPa compressive stress was carried out on the six groups of models with different shear modulus of the rubber layer on the upper and lower parts of the isolation bearings to obtain the horizontal stiffness in each stage. The horizontal stiffness of the models is calculated using the above stiffness calculation formula. The obtained results are shown in Table 4. According to U55B20, U55B25, U55B30, and U55B35, the initial stiffness k1 and yield stiffness k2 increase with the increase of the shear modulus of the rubber layer at the lower part of the isolation bearing but have no effect on the horizontal stiffness k3. When the isolation bearing enters the second working condition, the horizontal stiffness k3 is completely provided by the rubber layer at the upper part of the isolation bearing. According to U60B35, U65B35, U70B35, and U55B35, the change of the shear modulus of the upper rubber layer of the isolation bearing does not affect the initial stiffness k1, and the horizontal stiffness k2 and k3 increases with the increase of the shear modulus of the upper rubber layer of the isolation bearing. According to the ratio of the simulated value and the calculated value of stiffness in Table 4, the statistics of each simulation group are obtained, as shown in Table 5. The average value of k/kc of each model is between 0.9922 and 0.9982, and the standard deviation and coefficient of variation are both within 0.03. This indicates that the theoretical calculation value of the horizontal stiffness of the isolation bearing is in good agreement with the simulation value of the finite element analysis, and the theoretical calculation result can well predict the simulation result.
Table 4.
Horizontal stiffness.
Table 5.
Statistical analysis of horizontal stiffness.
3. Earthquake Loss Assessment of Isolation Structures
3.1. Establishment of Isolation Structure Models
Based on the site conditions in Xi’an, China, a reinforced concrete frame structure was designed according to the relevant codes for architectural and structural design [40,41,42,43]. There are six floors above ground. The height of the ground floor is 3.9 m, and the other layers are 3.3 m. The height of the structure is 20.4 m. The arrangement of beams and columns on the standard floor of the frame is shown in Figure 12. The fundamental period of the first vibration mode of the structure is 0.635 s. The elastic story drift angle is 1/583. The superstructure of the other two isolation structures is the same, and the layout of the bearings of the isolation layer is shown in Figure 13. The site category is the Class II area. The constant load of floor and roof is taken as 4.0. The standard value of live load is 2.0. The standard value of load for infill walls and partition walls is 8.0. The concrete strength grade is C30. The thickness of the plate is 120 mm. Longitudinal steel bars and stirrups are uniformly adopted HRB400.
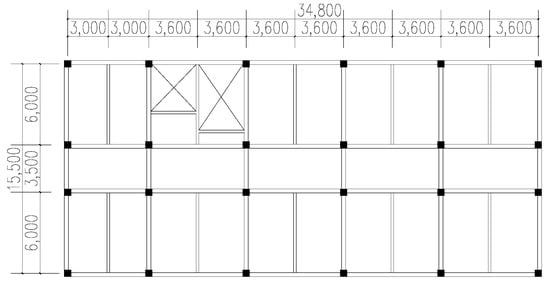
Figure 12.
Structure diagram of standard layer.
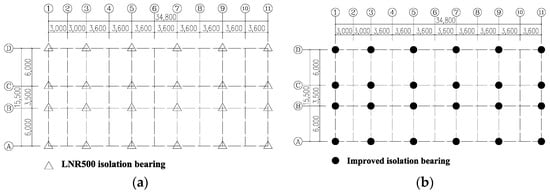
Figure 13.
Layout of the bearings of the seismic isolation layer. (a) Normal isolation bearing; (b) Normal isolation bearing.
In this paper, the ground motion records were preliminarily selected in the PEER NGA west-2 database. The design response spectrum required in the “Code for Seismic Design of Buildings” [40] was used as the target spectrum, and the target response spectrum was matched in the 0.635 s section of the fundamental period of the structure. The selection principles are as follows: (1) The range of the epicentral distance is 10–60 km; (2) The site type is the Class II site, and the corresponding VS30 is greater than 250 m/s and less than 500 m/s.
Using the single-point amplitude modulation method, as shown in Equation (3), the matched 120 ground motion records were amplitude-modulated to three intensity levels. Finally, five natural ground motion records and two artificial waves were selected for subsequent analysis. The amplitude modulation coefficients of ground motions are shown in Table 6. The mean value of the acceleration response spectrum of the seven selected waves that are amplitude modulated to the intensity of the rare earthquake is shown in Figure 14. The mean value curve of the response spectrum after amplitude modulation is similar to the curve of the design response spectrum. The error of spectral acceleration near the fundamental period of the structure (0.635 s) is small. This indicates that the selected ground motion records are reasonable.
where SF is the amplitude modulation coefficient; is the spectral acceleration value of the design response spectrum at the fundamental period point of the structure; is the spectral acceleration value of the ground motion recorded at the fundamental period point of the structure.
Table 6.
Amplitude modulation coefficients of ground motions.
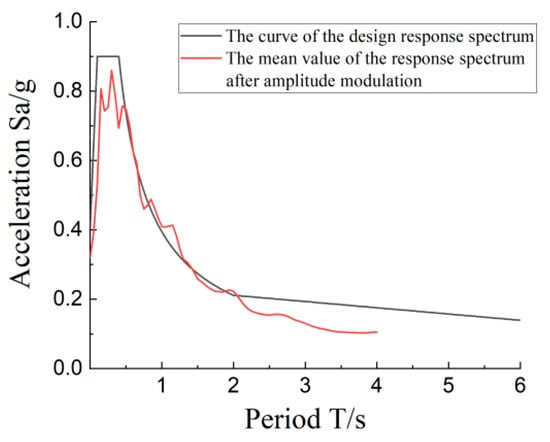
Figure 14.
Acceleration response spectrum.
Structural response analysis was carried out using SAP2000 (V21) finite element software. The plastic hinge element was used to define the elastoplasticity of beam and column elements and the membrane element was used to simulate the floor plate. The concrete damage plasticity model was used to simulate concrete. The constitutive relations in the “Code for Design of Concrete Structures” [42] were adopted for the constitutive relation of the concrete and steel bar.
The uniaxial tensile stress–strain relationship for concrete can be expressed as follows:
where is the representative value of the uniaxial tensile strength of concrete; is the peak tensile strain corresponding to ; is the parameter value of the descending segment of the uniaxial tensile stress–strain curve of concrete; is the elastic modulus.
The uniaxial compressive stress–strain relationship for concrete can be expressed as follows:
where is the representative value of the uniaxial compressive strength of concrete; is the peak compressive strain corresponding to ; is the parameter value of the descending segment of the uniaxial compressive stress–strain curve of concrete; is the elastic modulus.
The constitutive relation of the steel bar can be expressed as follows:
where E is the elastic modulus of the steel bar; ε is the strain of the steel bar; εy is the yield strain of the steel bar; fy is the yield strength of the steel bar; Et is the elastic modulus in the strengthening stage.
The built-in Rubber Isolator connection element in SAP2000 was used to simulate normal rubber isolation bearings and the equivalent stiffness and vertical stiffness of the element need to be determined. The LNR500 rubber bearing was adopted in this paper. The equivalent stiffness is 810 kN/m and the vertical stiffness is 2200 kN/mm. The built-in Multilinear Plastic element in SAP2000 was used to simulate improved lead-core rubber bearings. The restoring force model of the improved isolation bearing can be simplified into a three-fold line model, as shown in Figure 11.
The normal RC frame structure model, the RC frame structure model with normal lead-core rubber isolation bearing as the seismic isolation layer, and the RC frame structure model with improved lead-core rubber isolation bearing as the seismic isolation layer were established. Through elastoplastic time-history analysis, the responses of three structures under frequent earthquakes, fortification earthquakes, and rare earthquakes were obtained.
3.2. Vulnerability Analysis
3.2.1. Structural Performance Level
According to the relevant regulations in the “Code for Seismic Design of Buildings” [40], for general RC frame structures, the elastic and plastic story drift angle limits are 1/550 and 1/50, respectively. For the isolation structure, if the horizontal displacement of the isolation bearing exceeds the allowable displacement, the isolation bearing is regarded as occurring over-limit failure. Because of the failure of the isolation bearing, the axial force of the structural column connected to the upper part of the isolation bearing could change abruptly, which could lead to the collapse of the overall structure. Therefore, when the horizontal displacement of seismic isolation bearing exceeds the allowable limit displacement, it is considered that the structure has failed.
In the paper, the structural performance levels are classified with reference to the drift angle limits and the failure conditions of the seismic isolation layer, as shown in Table 7.
Table 7.
Maximum story drift angle limit of the normal frame structure.
3.2.2. Analysis of IDA
The incremental dynamic analysis (IDA) was used for the three structures to obtain the variation law of the maximum story drift angle of the structure under different spectral acceleration levels, so as to carry out the subsequent seismic vulnerability analysis of the structure. After it was equal to 0.9 g, the amplitude of each seismic wave was modulated to 1.2 g, 1.5 g, 1.8 g, and 2.1 g in increments of 0.3 g. The ground motions with different amplitudes were input into SAP2000, and the elastoplastic time-history analysis was carried out for the three structures. The IDA curves corresponding to the seven ground motions were drawn respectively, as shown in Figure 15.
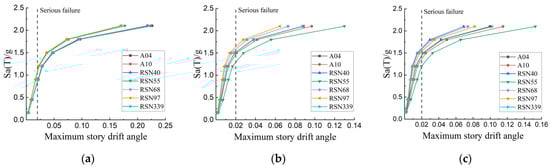
Figure 15.
IDA curve of the structure. (a) Normal frame structure; (b) Normal isolation structure; (c) Improved isolation structure.
As shown in Figure 14, the normal frame structure begins to collapse when is greater than 0.9 g and less than 1.2 g, and the normal isolation structure and the improved isolation structure begin to collapse when is greater than 1.2 g and less than 1.8 g. The maximum inter-story drift angle of the two types of isolation structures is always lower than that of the normal frame structure, and the ground motion intensity of the isolation structures is generally greater than that of the normal frame structure when the structures collapse.
3.2.3. Seismic Vulnerability Curve
The seismic vulnerability of the structure reflects the probability relationship between the structure reaching a certain performance level and the corresponding earthquake intensity. Through the related research of FEMA P-58 theory, the seismic vulnerability curve of the structure conforms to the log-normal distribution [21]. Therefore, the fitting Excel table of collapse vulnerability provided by FEMA p-58 was used in this paper to fit the IDA data. The seismic vulnerability curves of the three structures were obtained based on the four structural performance levels, as shown in Figure 16. The curve in the figure represents the relationship between the probability of reaching a certain performance level and the spectral acceleration. The corresponding parameters of each fitting vulnerability curve are shown in Table 8.
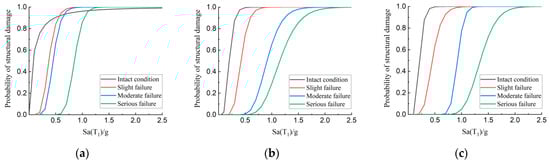
Figure 16.
Seismic vulnerability curve. (a) Normal frame structure; (b) Normal isolation structure; (c) Improved isolation structure.
Table 8.
Fitting parameters of normal distribution of vulnerability curve.
According to Figure 16 and Table 8, the safety reserve of the improved isolation structure and the normal isolation structure is higher than that of the ordinary frame structure at each performance level. The required for the improved isolation structure is the maximum at all four performance levels. According to the results of the vulnerability analysis, the probability of serious failure of the three structures is 64.84%, 16.34%, and 12.14%, respectively, under rare earthquakes ( equal to 0.9 g). The collapse probability of the two isolation structures is much lower than that of normal frame structures. In addition, the improved isolation structure has the strongest collapse resistance, and the isolation bearing can control the displacement of the seismic isolation layer under rare earthquakes.
3.3. Performance Assessment Theory for FEMA P-58
The FEMA P-58 theory puts forward a new generation of assessment methods for seismic performance of buildings. This method is based on probabilistic calculation and takes the repair costs of buildings and casualties as the performance indicators of structures to quantify the seismic losses of buildings. According to the type and distribution of structural and non-structural members in the building, combined with the seismic response results, the loss of specific members in the structure can be obtained [21]. According to the FEMA P-58 assessment theory, this paper adopted the assessment method based on earthquake intensity to evaluate the loss of casualties and repair costs for the three structures. According to the assessment results, the comparative analysis of the seismic performance of the normal frame structure, normal isolation structure, and improved isolation structure was carried out. The assessment method based on earthquake intensity can be used to evaluate whether the seismic performance of the building meets the standard and the seismic performance requirements at the beginning of the design under the design earthquake intensity in the code. Alternatively, it can be used to assess the degree of damage to buildings under rare earthquakes, as well as the time and cost of repair or reconstruction required.
3.4. PACT Performance Calculation Software
PACT (3.1.2) is an assessment tool for the seismic performance of structures developed and designed based on FEMA P-58 theory. PACT provides users with three main functions: (1) The performance model of the building structure is established by inputting the corresponding construction cost, human mobility distribution, and member performance group. (2) By inputting the structural response and vulnerability curve into the model for calculation and analysis, the corresponding performance indexes are obtained. (3) The distribution and probability of structural performance loss are displayed through data and charts. In addition to its main functions, PACT software provides a member vulnerability editor and the editing tool for population distribution models based on the content of the FEMA P-58 annex.
3.5. Basic Information of the Building
The basic information of the building is determined according to the calculation example designed in Section 3.1. The designed building is a six-story scientific research office building on the ground. By querying the urban construction and installation project cost index database in the China Construction Engineering Cost Information Network, it was obtained that the construction cost of the multi-story frame structure in Xi’an in 2021 was 2546 yuan/m2. Therefore, the construction cost was estimated based on the building area of the designed building, excluding the cost of non-structural members in the building. The reconstruction cost of the building can be considered as the construction cost according to the FEMA P-58 Volume 2 guide [44].
According to the requirements for the number of workers per unit area of a single floor in the “Standard for seismic resilience assessment of buildings” [45], the maximum number of workers per square meter of the building was determined to be 0.02. The basic information of the building entered into the PACT software is shown in Table 9.
Table 9.
Basic information of the building.
3.6. Model of Personnel Flow
The human mobility model in PACT defines the peak of personnel density and the flow of personnel with time, week, and month in the building. According to the recommended values for the indoor personnel density of various building rooms in the “Standard for seismic resilience assessment of buildings” [45], the indoor personnel density ζk of the k-th floor can be calculated according to the actual personnel density of the evaluated building or the function of the house on the floor. The indoor personnel density can be determined according to Equation (14). According to the actual functional layout of the building, the indoor personnel density is calculated as 0.5 persons/m2, which is converted into imperial units as 46 persons/1000 sf. The change of personnel density at different times of the day is shown in Figure 17. The change of personnel flow in different months of the year is shown in Figure 18.
where is the personnel density of the rooms with class m function; is the building area of the rooms with class m function in the k-th floor; is the building area of the rooms in the k-th floor.
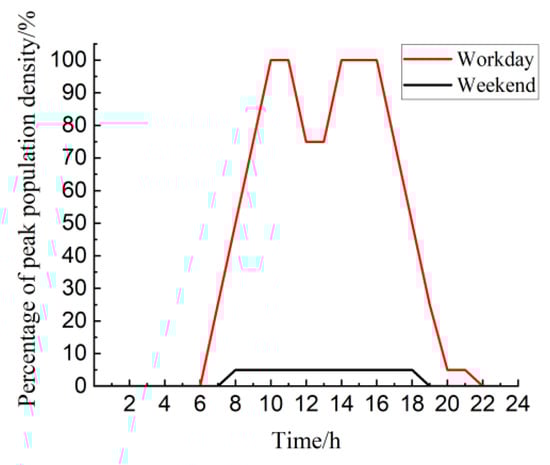
Figure 17.
Model of peak population density.
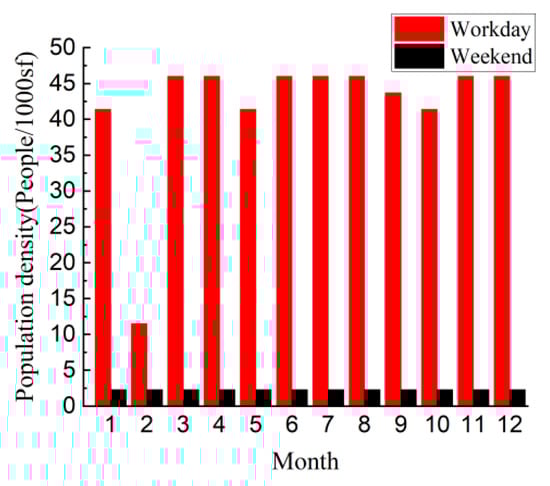
Figure 18.
Model of personnel flow.
3.7. Vulnerability Grouping and Performance Grouping of Members
The FEMA P-58 seismic performance assessment method specifies that the members in the building are in groups, so all members are divided into vulnerability groups and performance groups. The database of 764 vulnerability groups is provided in the PACT software and the specification number for each vulnerability group is given. The user can directly select the correct group through the vulnerability group database and call it directly in the program through the specification number. The vulnerability curve and consequence function are provided in the database for each vulnerability group. The vulnerability group defines the state and probability of damage through the vulnerability curve, and then corresponds the damage state to the earthquake loss through the consequence function.
According to the types of members in the designed calculation example and the information from the vulnerability group database in PACT, the vulnerability groups and performance groups of the building were classified. The research in this paper only evaluated the seismic performance in the X direction, so only the performance group data in the X direction was considered. The vulnerability groups and performance groups are summarized in Table 10.
Table 10.
Classification of vulnerability groups and performance groups of the building.
3.8. Results and Analysis
The assessment results of the three structures under the 8° frequent earthquake, the fortification earthquake, and the rare earthquake were obtained from the PACT software. Then, the assessment results are fitted by PACT software, and the probability distribution curve of each performance index was finally obtained. The loss results of the performance groups at the median value (P equal to 50%) of each performance index were extracted for comparative analysis.
3.8.1. Analysis of the Assessment Results of Repair Costs
The assessment results of the repair costs of the normal frame structure under frequent earthquakes, fortification earthquakes, and rare earthquakes are shown in Figure 19. The median repair costs were CNY 184,737, CNY 1,091,429, and CNY 1,303,500, respectively. According to the pie chart of the distribution of performance group losses, the repair costs of the normal frame structure under frequent earthquakes and fortification earthquakes are derived from non-structural members. Among them, wall decoration and air-conditioning units are the main sources of repair costs. In addition, as the seismic intensity increases, the proportion of repair costs for air-conditioning units gradually increases, from 36.69% to 55.31%. When the structure is seriously damaged, it is deemed to have collapsed, and the repair cost is the reconstruction cost of the building.
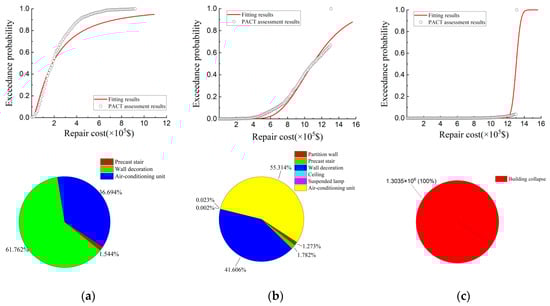
Figure 19.
Repair costs and loss distribution of performance group of the normal frame structure. (a) Frequent earthquakes; (b) Fortification earthquakes; (c) Rare earthquakes.
The assessment results of the repair costs of the normal isolation structure under frequent earthquakes, fortification earthquakes, and rare earthquakes are shown in Figure 20. The normal isolation structure has no damage of structural members under the three earthquake intensities. Under frequent earthquakes, the damaged members are only wall decoration. Under fortification earthquakes, the precast stairs begin to be damaged. The damaged members are all displacement-sensitive members, of which the repair cost of the wall decoration accounts for 95.9%. Under the intensity of rare earthquakes, the types of damaged members increase, and acceleration-sensitive members such as suspended lamps and air-conditioning units begin to be damaged.
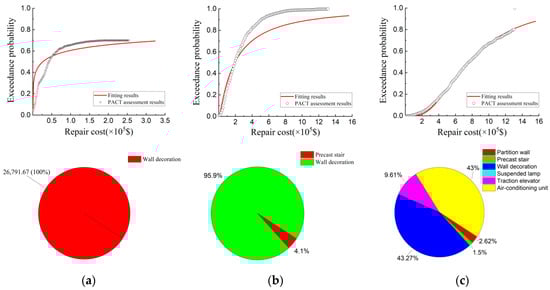
Figure 20.
Repair costs and loss distribution of performance group of the normal isolation structure. (a) Frequent earthquakes; (b) Fortification earthquakes; (c) Rare earthquakes.
The assessment results of the repair costs of the improved isolation structure under frequent earthquakes, fortification earthquakes, and rare earthquakes are shown in Figure 21. It can be found that the repair cost of the improved isolation structure under the three earthquake intensities all come from non-structural components. Among them, under the frequent earthquakes, the repair cost of the building comes from wall decoration. Under fortification earthquakes, the precast stairs and air-conditioning units begin to be damaged. The repair cost of wall decoration accounts for 81.13%, which is still the main source of repair costs.
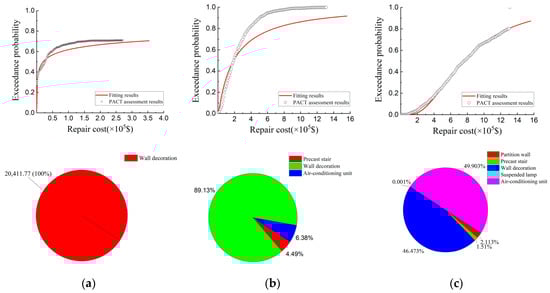
Figure 21.
Repair costs and loss distribution of performance group of the improved isolation structure. (a) Frequent earthquakes; (b) Fortification earthquakes; (c) Rare earthquakes.
According to the assessment results, the repair costs of the three kinds of frame structures under the three earthquake intensities are shown in Table 11. Comparing the repair costs of the three structures, it can be seen that the repair costs of the normal isolation structure and the improved isolation structure under the three earthquake intensities are far lower than that of the normal frame structure without isolation bearings. This is due to the addition of isolation bearings, which prolongs the structural period. The seismic isolation layer bears the main structural displacement during an earthquake, which significantly reduces the displacement and acceleration of the superstructure, thereby protecting the members in the building and greatly reducing the repair cost of the members. Comparing the two isolation structures, it can be found that the repair cost of the improved isolation structure is 23.9% lower than that of the normal isolation structure under frequent earthquakes. Under fortification earthquakes and rare earthquakes, the repair cost of the improved isolation structure is 1.6% and 0.6% lower than that of the normal isolation structure, respectively. The repair cost of the two isolation structures is not much different. This is due to the fact that the improved isolation bearing is in the first working condition under frequent earthquakes, and the bearing provides less horizontal stiffness, which enhances the seismic isolation effect and reduces the loss of members. Under fortification earthquakes and rare earthquakes, the improved isolation bearing enters the second working condition due to the setting of the limiter, and the horizontal stiffness of the seismic isolation layer is improved, so that the excessive deformation of the seismic isolation layer can be suppressed. Therefore, the repair cost of the building is slightly increased.
Table 11.
Repair costs of buildings.
3.8.2. Analysis of the Assessment Results of Casualties
According to the assessment results obtained through the PACT software, there are no casualties in the normal frame structure under frequent earthquakes. Additionally, no casualties occur in the normal isolation structure and the improved isolation structure under the three earthquake intensities. Therefore, the corresponding assessment results are not listed below. In order to research the casualty index of the two structures, the results of casualties in the normal isolation structure and the improved isolation structure under equal to 1.2 g were obtained through the PACT software. The number of casualties of the three structures under different earthquake intensities is shown in Table 12.
Table 12.
Number of casualties under different earthquake intensities.
The results of casualties of the normal frame structure under fortification earthquakes and rare earthquakes are shown in Figure 22. The results of casualties of the normal isolation structure and the improved isolation structure under equal to 1.2 g are shown in Figure 23 and Figure 24. According to Table 12, the number of casualties of the normal frame structure is the largest, followed by the normal isolation structure, and the number of casualties of the improved isolation structure is the least. The normal isolation structure and the improved isolation structure exhibit better seismic isolation effects under fortification earthquakes and rare earthquakes, which significantly reduce the casualties. When is equal to 1.2 g, the seismic isolation layer of the normal isolation structure has already occurred over-limit failure under some seismic waves, and the seismic isolation layer of the improved isolation structure suppresses the over-limit failure. Namely, the performance of the improved isolation structure is much better than that of the normal isolation structure at the median value (P = 50%) of the performance index of casualties. The number of deaths and injuries in the improved isolation structure decreased by 52.6% and 36.8%, respectively, compared with the normal isolation structure. The reduction ratio of the number of deaths is higher than that of the number of injuries. This is also the evidence that the improved isolation bearing can effectively prevent the seismic isolation layer from over-limit failure. According to the distribution of performance groups, casualties are caused by the damaged suspended lamps, tables and chairs, and computers, which are acceleration-sensitive members. The damaged suspended lamps are the leading cause of casualties.
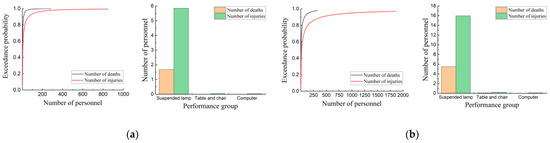
Figure 22.
Assessment results of casualties of the normal frame structure. (a) Fortification earthquakes; (b) Rare earthquakes.
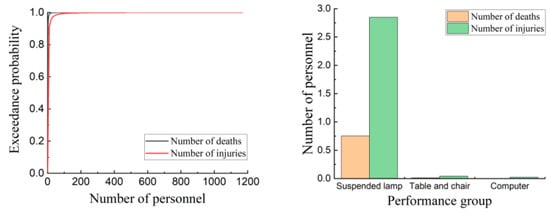
Figure 23.
Assessment results of casualties of the normal isolation structure ( = 1.2 g).
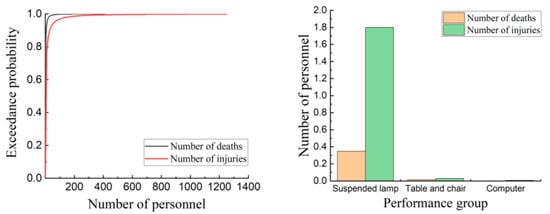
Figure 24.
Assessment results of casualties of the improved isolation structure ( = 1.2 g).
4. Conclusions
In view of the shortcomings of the single rigidity of the traditional rubber vibration isolator, an improved lead-core rubber isolation bearing with variable stiffness is proposed in this paper. The improved isolation bearing can provide a small horizontal stiffness to enhance the seismic isolation effect under small earthquakes. Under large earthquakes, it can provide a large horizontal stiffness to prevent over-limit failure due to excessive displacement. The mechanical properties of the improved isolation bearing were investigated using the finite element method (FEM). The earthquake loss assessment was carried out for normal frame structures, normal isolation structures, and improved isolation structures using PACT performance calculation software. Based on the results and discussion, the following conclusions can be drawn:
- The proposed improved isolation bearing provides a small horizontal stiffness to extend the structural period under frequent earthquakes and fortification earthquakes by using the low shear modulus rubber and the limiting device. Under rare earthquakes, it provides damping and large horizontal stiffness to avoid excessive displacement of the bearing. The numerical analysis results prove that the improved isolation bearing can reasonably and effectively solve the defect of the traditional rubber bearing.
- The limiting device divides the working conditions of the improved isolation bearing into two types. In the first condition, the isolation bearing maintains a small horizontal stiffness, which can give full play to the seismic isolation performance of the isolation bearing, but almost no energy dissipation capacity. In the second working condition, the horizontal stiffness of the isolation bearing is improved, and the lead core gives full play to the energy dissipation characteristics.
- A simplified restoring force model of the improved isolation bearing is proposed. The restoring force model of the isolation bearing is a double-line model in the first working condition, and a three-line model in the second working condition. The theoretical calculation results of stiffness are in good agreement with the numerical analysis results, which proves the reliability of the model.
- The required for the improved isolation structure is maximum at all four performance levels. The probability of serious damage (collapse) for the three structures under the rare earthquake ( = 0.9 g) is 64.84%, 16.34%, and 12.14%, respectively. It is proved that the improved isolation structure has the highest safety reserve and the best collapse resistance.
- Comparing the results of the earthquake loss assessment of the structures, the repair costs and the number of casualties of the normal isolation structure and the improved isolation structure are far lower than that of the normal frame structure. The loss of the normal isolation structure and the improved isolation structure mostly comes from non-structural members, which effectively reduces the damage of structural members. The improved isolation structure requires the least repair cost under frequent earthquakes. The application of the improved isolation bearing has effectively reduced the number of casualties under strong earthquakes. In addition, the casualties in the building are mainly caused by the damage of acceleration-sensitive members, so the acceleration-sensitive members should be reasonably arranged during the design.
Author Contributions
Conceptualization, P.W. and J.H.; methodology, J.H.; validation, P.W. and J.H.; investigation, P.W. and J.H.; writing—original draft preparation, P.W., J.H. and B.W.; writing—review and editing, C.R. and J.H.; supervision, Q.S. All authors have read and agreed to the published version of the manuscript.
Funding
This work was supported by the National Natural Science Foundation of China [grant numbers 52178159; 52178505; 52108171].
Data Availability Statement
Not applicable.
Conflicts of Interest
The authors declare no conflict of interest.
References
- Mostaghel, N.; Tanbakuchi, J. Response of sliding structures to earthquake support motion. Earthq. Eng. Struct. D 1983, 11, 729–748. [Google Scholar] [CrossRef]
- Derham, C.J.; Kelly, J.M.; Thomas, A.G. Nonlinear natural rubber bearings for seismic isolation. Nucl. Eng. Des. 1985, 84, 417–428. [Google Scholar] [CrossRef]
- Lin, T.W.; Hone, C.C. Base isolation by free rolling rods under basement. Earthq. Eng. Struct. D 1993, 22, 261–273. [Google Scholar] [CrossRef]
- Marano, G.C.; Greco, R. Efficiency of base isolation systems in structural seismic protection and energetic assessment. Earthq. Eng. Struct. D 2003, 32, 1505–1531. [Google Scholar] [CrossRef]
- Matsagar, V.A.; Jangid, R.S. Seismic response of base-isolated structures during impact with adjacent structures. Eng. Struct. 2003, 25, 1311–1323. [Google Scholar] [CrossRef]
- Zaragar, H.; Ryan, K.L.; Marshall, J.D. Feasibility study of a gap damper to control seismic isolator displacements in extreme earthquakes. Struct. Control Health 2013, 20, 1159–1175. [Google Scholar] [CrossRef]
- Karayel, V.; Yuksel, E.; Gokce, T.; Sahin, F. Spring tube braces for seismic isolation of buildings. Earthq. Eng. Eng. Vib. 2017, 16, 219–231. [Google Scholar] [CrossRef]
- Wilde, K.; Gardoni, P.; Fujino, Y. Base isolation system with shape memory alloy device for elevated highway bridges. Eng. Struct. 2000, 22, 222–229. [Google Scholar] [CrossRef]
- Xue, S.; Li, X. Control devices incorporated with shape memory alloy. Earthq. Eng. Eng. Vib. 2007, 6, 159–169. [Google Scholar] [CrossRef]
- Hosseini, R.; Rashidi, M.; Bulajić, B.D.; Arani, K.K. Multi-Objective Optimization of Three Different SMA-LRBs for Seismic Protection of a Benchmark Highway Bridge against Real and Synthetic Ground Motions. Appl. Sci. 2020, 10, 4076. [Google Scholar] [CrossRef]
- Behrooz, M.; Wang, X.; Gordaninejad, F. Performance of a new magnetorheological elastomer isolation system. Smart Mater. Struct. 2014, 23, 045014. [Google Scholar] [CrossRef]
- Yang, J.; Christie, M.D.; Sun, S.; Ning, D.H.; Nakano, M.; Li, Z.X.; Du, H.; Li, W.H. Integration of an omnidirectional self-powering component to an MRE isolator towards a smart passive isolation system. Mech. Syst. Signal Process. 2020, 144, 106853. [Google Scholar] [CrossRef]
- Yuan, S.J.; Sun, Y.; Zhao, J.L.; Meng, K.; Wang, M.; Pu, H.Y.; Peng, Y.; Luo, J.; Xie, S.R. A tunable quasi-zero stiffness isolator based on a linear electromagnetic spring. J. Sound Vib. 2020, 482, 115449. [Google Scholar] [CrossRef]
- Rahnavard, R.; Thomas, R.J. Numerical evaluation of steel-rubber isolator with single and multiple rubber cores. Eng. Struct. 2019, 198, 109532. [Google Scholar] [CrossRef]
- Rahnavard, R.; Craveiro, H.D.; Napolitano, R. Static and dynamic stability analysis of a steel-rubber isolator with rubber cores. Structures 2020, 26, 441–455. [Google Scholar] [CrossRef]
- Isakovic, T.; Fischinger, M. Applicability of variable stiffness seismic isolators based on magnetically controlled elastomer. In Improvement of Buildings’ Structural Quality by New Technologies; CRC Press: Boca Raton, FL, USA, 2005; pp. 689–694. [Google Scholar]
- Li, Y.M.; Ma, Y.H.; Zhao, G.F.; Liu, R. Study on the Basic Performance Deterioration Law and the Application of Lead Rubber Bearings under the Alternation of Aging and Seawater Erosion. Buildings 2023, 13, 360. [Google Scholar] [CrossRef]
- Huang, X.; Hu, Z.X.; Liu, Y.L.; Nie, L.Q. Study on Seismic Performance of TID-LRB Hybrid Control System under Multi-Level Earthquakes. Buildings 2022, 12, 1465. [Google Scholar] [CrossRef]
- Gao, J.; Xue, Y.T.; Xiao, C.Z.; Zhou, X.Y.; Han, X. Experimental study on variable stiffness laminated rubber isolation bearing of series connection type. Build. Struct. 2020, 50, 109–113. [Google Scholar]
- Peng, T.; Guan, J.; Wu, Y. Numerical and Experimental Investigation of the Seismic Effect of a Two-Stage Seismic Isolation Method. Sustainability 2023, 15, 4883. [Google Scholar] [CrossRef]
- FEMA. Seismic Performance Assessment of Buildings Volume 1-Methodology; Federal Emergency Management Agency: Washington, DC, USA, 2012.
- Sun, Y.T.; Zhang, J.F.; Li, G.C.; Wang, Y.H.; Sun, J.B.; Jiang, C. Optimized neural network using beetle antennae search for predicting the unconfined compressive strength of jet grouting coalcretes. Int. J. Numer. Anal. Met. 2019, 43, 801–813. [Google Scholar] [CrossRef]
- Sun, J.B.; Wang, Y.F.; Yao, X.P.; Ren, Z.H.; Zhang, G.B.; Zhang, C.; Chen, X.G.; Ma, W.; Wang, X.Y. Machine-learning-aided prediction of flexural strength and ASR expansion for waste glass cementitious composite. Appl. Sci. 2021, 11, 6686. [Google Scholar] [CrossRef]
- Tang, Y.C.; Feng, W.H.; Chen, Z.; Nong, Y.M.; Guan, S.H.; Sun, J.B. Fracture behavior of a sustainable material: Recycled concrete with waste crumb rubber subjected to elevated temperatures. J. Clean. Prod. 2021, 318, 128553. [Google Scholar] [CrossRef]
- Zhang, G.B.; Chen, C.F.; Li, K.F.; Xiao, F.; Sun, J.B.; Wang, Y.F.; Wang, X.Y. Multi-objective optimisation design for GFRP tendon reinforced cemented soil. Constr. Build. Mater. 2022, 320, 126297. [Google Scholar] [CrossRef]
- Sun, J.B.; Tang, Y.C.; Wang, J.Q.; Wang, X.Y.; Wang, J.Q.; Yu, Z.M.; Cheng, Q.; Wang, Y.F. A multi-objective optimisation approach for activity excitation of waste glass mortar. J. Mater. Res. Technol. 2022, 17, 2280–2304. [Google Scholar] [CrossRef]
- Sun, Y.T.; Bi, R.Y.; Sun, J.B.; Zhang, J.F.; Taherdangkoo, R.; Huang, J.D.; Li, G.C. Stability of roadway along hard roof goaf by stress relief technique in deep mines: A theoretical, numerical and field study. Geomech. Geophys. Geo-Energy Geo-Resour. 2022, 8, 45. [Google Scholar] [CrossRef]
- CECS 126:2001; Technical Specification for Seismic-Isolation with Laminated Rubber Bearings Isolators. Standards Press of China: Beijing, China, 2001.
- GB/T 20688.1-2007; Rubber Bearings—Part 1: Seismic-Protection Isolators Test Methods. Standards Press of China: Beijing, China, 2007.
- GB/T 20688.3-2006; Rubber Bearings—Part 3: Elastomeric Seismic-Protection Isolators for Buildings. Standards Press of China: Beijing, China, 2006.
- GB/T 20688.4-2007; Rubber Bearings—Part 4: Normal Rubber Bearings. Standards Press of China: Beijing, China, 2007.
- Kilian, H.G. Equation of state of real networks. Polymers 1981, 22, 209–217. [Google Scholar] [CrossRef]
- Arruda, E.M.; Boyce, M.C. A three-dimensional constitutive model for the large stretch behavior of rubber elastic materials. J. Mech. Phys. Solids. 1993, 41, 389–412. [Google Scholar] [CrossRef]
- Mooney, M. A theory of large elastic deformation. J. Appl. Phys. 1940, 11, 582–592. [Google Scholar] [CrossRef]
- Rovlin, R.S. Large elastic deformations of isotropic materials IV. Further development of general theory. Phil. Trans. R. Soc. A 1948, 241, 379–397. [Google Scholar]
- Yeoh, O.H. Characterization of elastic properties of carbon-black-filled rubber vulcanizates. Rubber Chem. Technol. 1990, 63, 792–805. [Google Scholar] [CrossRef]
- Zheng, M.J.; Wang, W.J.; Chen, Z.N.; Wu, L.J. Determination for mechanical constants of rubber Mooney-Rivlin model. China Rubber Ind. 2003, 8, 462–465. [Google Scholar]
- Huang, J.L.; Xie, G.J.; Liu, Z.W. Finite element analysis of super-elastic rubber materials based on the Mooney-Rivlin and Yeoh model. China Rubber/Plast. Technol. Eq. 2008, 34, 22–26. [Google Scholar]
- Liu, M.; Wang, Q.C.; Wang, G.Q. Determination of material constants in rubber Mooney-Rivlin model. China Rubber Ind. 2011, 58, 241–245. [Google Scholar]
- GB 50011-2010; Code for Seismic Design of Buildings. China Architecture & Building Press: Beijing, China, 2015.
- GB 50016-2014; Code for Fire Protection Design of Building. China Architecture & Building Press: Beijing, China, 2014.
- GB 50010-2010; Code for Design of Concrete Structures. China Architecture & Building Press: Beijing, China, 2015.
- GB 50009-2012; Load Code for the Design of Building Structures. China Architecture & Building Press: Beijing, China, 2012.
- FEMA. Seismic Performance Assessment of Buildings Volume 2-Implementation Guide; Federal Emergency Management Agency: Washington, DC, USA, 2012.
- GB/T 38591-2020; Standard for Seismic Resilience Assessment of Buildings. Standards Press of China: Beijing, China, 2020.


Disclaimer/Publisher’s Note: The statements, opinions and data contained in all publications are solely those of the individual author(s) and contributor(s) and not of MDPI and/or the editor(s). MDPI and/or the editor(s) disclaim responsibility for any injury to people or property resulting from any ideas, methods, instructions or products referred to in the content. |
© 2023 by the authors. Licensee MDPI, Basel, Switzerland. This article is an open access article distributed under the terms and conditions of the Creative Commons Attribution (CC BY) license (https://creativecommons.org/licenses/by/4.0/).