Abstract
Energy performance analysis in buildings is becoming more and more highlighted, due to the increasing trend of energy consumption in the building sector. Many studies have declared the great potential of soft computing for this analysis. A particular methodology in this sense is employing hybrid machine learning that copes with the drawbacks of single methods. In this work, an optimized version of a popular machine learning model, namely feed-forward neural network (FFNN) is used for simultaneously predicting annual thermal energy demand (ATED) and annual weighted average discomfort degree-hours (WADDH) by analyzing eleven input factors that represent the building circumstances. The optimization task is carried out by a multi-tracker optimization algorithm (MTOA) which is a powerful metaheuristic algorithm. Moreover, three benchmark algorithms including the slime mould algorithm (SMA), seeker optimization algorithm (SOA), and vortex search algorithm (VSA) perform the same task for comparison purposes. The accuracy of the models is assessed using error and correlation indicators. Based on the results, the MTOA (with root mean square errors 2.48 and 5.88, along with Pearson correlation coefficients 0.995 and 0.998 for the ATED and WADHH, respectively) outperformed the benchmark techniques in learning the energy behavior of the building. This algorithm could optimize 100 internal variables of the FFNN and acquire the trend of ATED and WADHH with excellent accuracy. Despite different rankings of the four algorithms in the prediction phase, the MTOA (with root mean square errors 9.84 and 95.96, along with Pearson correlation coefficients 0.972 and 0.997 for the ATED and WADHH, respectively) was still among the best, and altogether, the hybrid of FFNN-MTOA is recommended for promising applications of building energy analysis in real-world projects.
1. Introduction
As one of the most important fields of study, many scholars focused on solving complex problems by the use of new scientific developments and providing novel computational tools [1,2,3]. From many engineering systems, new issues have risen motivating scholars to extend previous solutions and increase efficiency. For this reason, different techniques are suggested such as computer-based simulations, laboratory measurements, and numerical and empirical calculation methods, for simulating and solving complex problems [4,5,6].
Building energy consumption is considerably increasing due to the increase in the population and growing economy as well as more demand for life quality [7]. In addition, the excess consumption of energy in buildings is associated with harmful impacts such as air pollutant emissions that affect human health such as respiratory and heart diseases [8]. In many countries, the efficiency of energy has been introduced as an important action path for restraining the trend of global warming and controlling energy demand [9]. The optimization problem related to building efficiency motivated many scholars to design and provide novel approximating methods to optimize building performance parameters of energy consumption. The best approaches introduced in the literature are machine learning tools which are known as precise and low-cost approaches to evaluate the energy behavior in buildings considering different tasks such as estimating required thermal loads [10].
Previous scholars stated that the use of artificial intelligence is very effective to analyze many scientific parameters [11,12,13] such as the behavior of anomalous energy consumption in cases both generated by end-users and potential causes [14]. Programmers are currently working on different machine-learning approaches for prediction tasks. The most important related methods are tree-based, support vector [15], and neuro-fuzzy [16] to train the network and obtain a trustworthy comprehension of the parameters of interest. Artificial neural networks (ANNs) [17] have been highly regarded as well-known algorithms that can be used for machine learning usage. ANN models have also been highly suggested to be used for modeling different energy parameters in cases of numerous applications. One of the applications of ANN-based methods is to analyze thermal loads and the required energies, generally, in terms of building characteristics [18]. In these algorithms, the network of ANN service can obtain the characteristics of buildings such as dimensions, glazing, positions and so on. Then, neural calculations are performed for determining an appropriate relationship among the mentioned parameters.
Hosseinnezhad, et al. [19] stated that a home energy management system has to consider the feasible difficulties because of the uncertainty and technical limits and showed that by the use of ANNs, an optimal operating scenario for real-time regulation can be obtained. Khalil, et al. [20] have been concerned with energy efficiency prediction by using ANN. They provided a new model and validated it and demonstrated that the most important parameters related to heating load and cooling load can be identified and the accuracy of their method was determined to be 99.60%. Jallal, et al. [21] suggested a new predictor based on the ANN for estimating the buildings’ energy consumption. They have demonstrated that the accuracy of the modified ANN method was better than the previous adaptive neuro-fuzzy inference system (ANFIS) approaches.
Metaheuristic methods comprise algorithms (e.g., genetic algorithm (GA) and particle swarm optimization (PSO)) that can be used for optimizing intelligent models in the case of the prediction of energy parameters such as building thermal loads [22,23]. Adedeji, et al. [24] investigated the efficiency of the ANFIS compared to its hybrid with PSO to predict energy consumption from climatic elements. They have demonstrated that the ANFIS-PSO system provided a better prediction precision that was proper for strategic energy planning in the case of higher computational times. Moayedi and Le Van [25] combined Harris hawks optimization with a fuzzy inference system predicting heating in buildings (HHO−ANFIS). Considering a population size of 400, they have shown that the HHO−ANFIS provided the highest value of R2 equal to 0.98709 and 0.98794 in the training and testing dataset. Cao, et al. [26] evaluated the energy performance of buildings by the use of neuro-fuzzy logic considering involved factors and found that the roof has the most considerable effect on heating and cooling loads with an RMSE of 4.3596. Alshudukhi and Yadav [27] introduced a model namely neuro fuzzy-clonal selection optimization (NF-CSO) to optimize energy consumption, determine the optimal position, and improve the network survivability. By the use of this algorithm, energy consumption was reduced around 58%. In addition, the network life cycle was also increased by about 65% in previous research. The NF-CSO algorithm reduced energy consumption and enhanced network survivability. For estimating building energy demand, Alkhazaleh, et al. [28] utilized a machine learning ANFIS. They trained the system by using the slap swarm algorithm (SSA), grey wolf optimizer (GWO), Harris hawks optimization (HHO), and equilibrium optimization (EO) and compared them with each other. Luo, et al. [29] utilized the GA to improve the adaptive deep neural network for the prediction of energy consumption in buildings. They found that the mean absolute percentage error in cases of training and testing was determined to be around 2.87% and 6.12%.
In general, machine learning is recognized as a potential approach for various energy-related analyses, particularly, energy performance analysis in buildings. These methods provide fast, inexpensive, and indirect solutions for the early estimation of energy consumption (e.g., required thermal load) [30]. Hence, utilizing this approach can greatly assist engineers in a more efficient design of buildings in various senses such as geometry, construction material, and energy systems. On the other hand, it has been shown that these models can enjoy higher effectiveness when their performance is optimized by metaheuristic algorithms. It necessitates keeping the metaheuristic-based solutions updated with state-of-the-art developments. Hence, the novelty and significance of this study can be written as follows:
- Employing a novel metaheuristic optimization, namely multi-tracker optimization algorithm (MTOA) [31] to assist a popular predictive model, i.e., feed-forward neural network (FFNN), for energy analysis in residential buildings. The MTOA benefits from both local and global search merits to find the optimal solution to the problem at hand. Scholars such as Zhao, et al. [32] and Liang, et al. [33] have professed the high potential of this algorithm in optimizing ANNs for prediction tasks.
- Developing a predictive model capable of the simultaneous estimation of annual thermal energy demand (ATED) and annual weighted average discomfort degree-hours (WADDH) by analyzing the building circumstances.
- Optimizing the solution via sensitivity analysis on the model configurations.
- Comparative validation of the developed model with three similar benchmarks, namely FFNN-SMA (FFNN optimized via slime mould algorithm [34]), FFNN-SOA (FFNN optimized via seeker optimization algorithm [35]), and FFNN-VSA (FFNN optimized via vortex search algorithm [36]).
- Validating the developed models with respect to the previous literature and underlining the improvements.
- Moreover, by fulfilling the above steps, this study introduces a fast, accurate, and inexpensive way for the early prediction of building energy performance, which can result in a more efficient design of the building itself, as well as energy-related systems (e.g., heating, ventilation, and air conditioning (HVAC)).
2. Materials and Methods
2.1. Data and Statistics
It was noted that the models of this study try to capture the relationship between the energy parameters with building circumstances. To accomplish this, the models must go through two stages. First, exploring previous samples for learning this relationship and acquiring the requested knowledge, and second, be tested to see if the learned knowledge is reliable for further cases. These two stages are, respectively, called training and testing procedures in machine learning simulations.
The energy records used in the present study are taken from the previous literature [8]. Referring to the cited reference, it can be derived that a two-story residential building with an area of 140 m2 has been simulated in the transient system simulation tool (TRNSYS) [37]. The size of the dataset is 35 × 13 indicating 35 rows (number of samples) and 13 columns (parameters). Out of these 13 parameters, two are targets ATED and WADDH, and the remaining 11 parameters are input factors, i.e., building circumstances. Table 1 gives the parameters of the dataset with their abbreviations. The full details of the simulation for data provision (e.g., building plan and geometry, climate, thermal zones, etc.) can be found in the reference paper [8].

Table 1.
Description of the dataset parameters.
Figure 1 shows the pattern of the 13 parameters existing in the used dataset. This figure shows that, except for the Glz, all input parameters follow similar behaviors in the beginning. While the ATED records are well-correlated with most inputs, the WADDH has a different pattern.
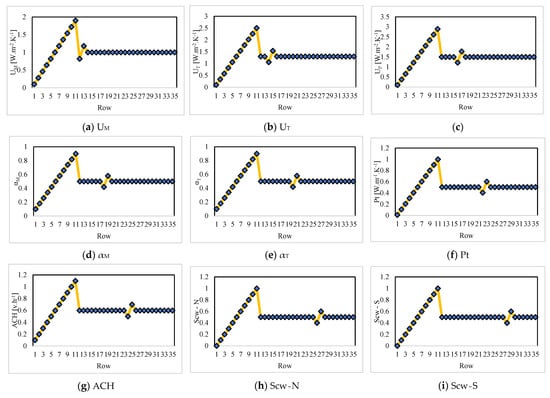
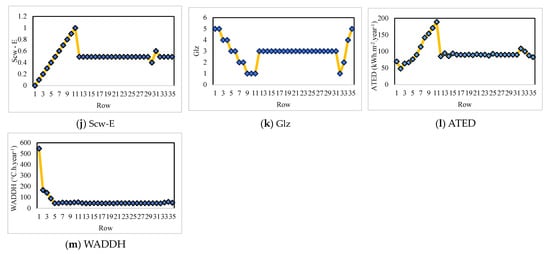
Figure 1.
Illustration of the input and target parameters in the used dataset.
The values of UM, UT, UP, αM, αT, Pt, ACH, Scw-N, Scw-S, and Scw-E, and Glz range in [0.10, 1.90], [0.10, 2.50], [0.10, 2.90], [0.10, 0.90], [0.10, 0.90], [0.01, 1.00], [0.10, 1.10], [0.00, 1.00], [0.00, 1.00], [0.00, 1.00], [1.00, 5.00], [48.19, 188.94], [44.55, 546.98] with average values of 1.00, 1.30, 1.50, 0.50, 0.50, 0.51, 0.60, 0.50, 0.50, 0.50, 2.94, 96.15, and 69.53, respectively.
In order to split the dataset into the training and testing subsets, the well-accepted ratio = 80/20 is considered so that 80% of 35 records (=28 records) constitute the training subset and 20% of 35 records (=7 records) constitute the testing subset.
2.2. Multi-Tracker Optimization Algorithm
The MTOA algorithm has been designed and introduced by Zakeri, Moezi, Bazargan-Lari and Zare [31] with regard to the merits and drawbacks related to other algorithms. Unlike other metaheuristic algorithms, this algorithm is not based on physical phenomena or the lifestyle of creatures. The MTOA consists of many population members, namely global tracker (GT) and local tracker (GT) randomly generated in the problem space. LTs are considered to be spreading around each GT because as convergence speed increases, the algorithm eludes the local solution along with positional searching about this GT. The search radius for each GT is specified according to each GT’s fitness level, as well as the distance from the global optimum point (GOP). Figure 2 shows the flowchart of the MTOA [31].
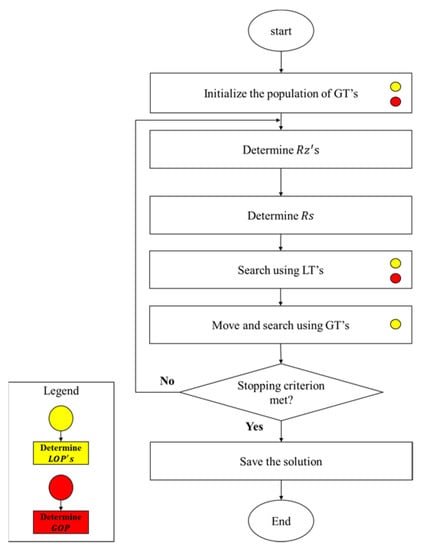
Figure 2.
The flowchart of the MTOA algorithm.
Equation (1) determines the search radius about each GT considering and as minimum and maximum values of radius.
where is the ith rank of GT. Moreover, nop stands for the total number of population members.
A so-called vector LP is used for restoring the better response situation of LTs in the case of each GT. The LP can be replaced with a better one in the next iteration. The movement of GTs starts to examine and obtain the best point when the local search of LTs is finished. A random approach called random walk movement performs this movement. In the mentioned method, two different distance and direction angle variables are considered to perform the movement from one point to another.
In the MTOA algorithm, considering GOP and LP situation, the G point can be specified for GT. Equation (3) shows how G can be determined.
In this relation, stands for a measure of the tenderness of to move toward GOP in comparison with . It can only consist of a number between zero and one. is ignored when equals 1. Then, all GTs change their points and find answers in comparison with GOP and they may be replaced if these answers are better compared to GO. After completing the steps of the MTOA algorithm, the first step is the point of the algorithm starting and then the algorithm iteration moves to other stages if the termination condition is not met [38,39]. For further conceptual details of this algorithm, more programming-oriented articles may be referred to [31,39].
2.3. Comparative Algorithms
It was stated that in addition to the MTOA as the main model, three benchmarks of SMA, SOA, and VSA are used for comparative purposes. The SMA was proposed by Li, et al. [34] based on the foraging behavior of slime mould. The population aims to determine the best path leading to the biggest food source as the optimum solution. The SOA was designed by Dai, Chen, Song and Zhu [35] based on human-seeking strategies. It is among the most efficient optimizers and performs an inter-subpopulation strategy to keep the solution safe from local minima. Doğan and Ölmez [36] developed the VSA inspired by the structure of natural vortices. The VSA optimization is carried out through the circles that search the space. The descriptive details and mathematical relationships of the used algorithms can be found in earlier studies such as [34,40] for SMA, [41,42] for SOA, and [43,44] for VSA.
3. Results and Discussion
3.1. Accuracy Measurement Method
In such studies, the quality of the results is indicated by the accuracy of the training and testing phases. Three popular indicators are used for measuring accuracy. Root mean square error (RMSE) along with mean absolute error (MAE) are employed to measure the error of prediction as per Equations (4) and (5), while the Pearson correlation coefficient (RP) is applied to calculate the correlation as per Equation (6).
In these equations, for K pairs, signifies the estimated output and stands for the real target.
3.2. Integration of MTOA and FFNN
The methodology used in this study is a hybrid tool. The word hybrid here indicates the FFNN as a basic predictive tool and the MTOA metaheuristic algorithm (as well as three benchmarks) as the optimizer for the FFNN. Figure 3 shows the optimization flowchart and a schematic view of the network. For developing such a hybrid model the steps below are taken [45,46]:
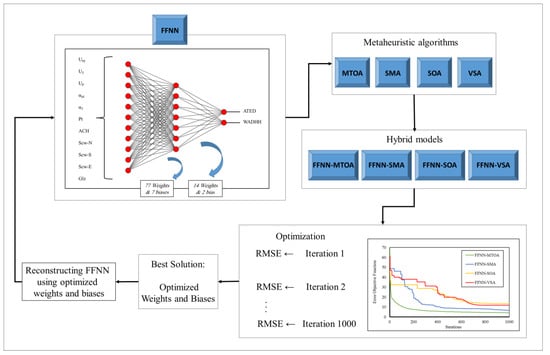
Figure 3.
A schematic view of optimizing FFNN using metaheuristic techniques.
- (i)
- A general FFNN model was deployed associated with the training data. By doing this, the non-linear contribution between the targets and inputs is established.
- (ii)
- The structure of the FFNN was determined based on the authors’ experience supported by a trial-and-error procedure. As the topology of the FFNN is shown in Figure 3, it has eleven input neurons (one for each input of the dataset), seven middle neurons, and two output neurons (that release the ATED and WADDH).
- (iii)
- The internal parameters of this network are 91 weights and nine biases that were extracted and organized using the commands getwb (Network) and separatewb (Network, weights and biases) in MATLAB.
- (iv)
- The FFNN mathematical equations for predicting the ATED and WADDH were created, wherein, the weights and biases are variables.
- (v)
- The MTOA (as well as three benchmarks) was deployed to optimize the created equations. For this purpose, the FFNN equations are yielded to MTOA as the problem function. The outcome was a training error, which in this work is represented by RMSE (Equation (4)) averaged for the ATED and WADDH.
- (vi)
- Hyperparameters of the algorithms such as 1000 iterations were determined. The FFNN-MTOA, FFNN-SMA, FFNN-SOA, and FFNN-VSA were implemented with population sizes of 600, 400, 100, and 300, which were selected after trying various viable values.
- (vii)
- The algorithms were run to predict the ATED and WADDH so that the prediction results best match the expected values. For this purpose, the RMSE was considered as the objective function that is projected to be minimized by MTOA.
- (viii)
- The optimized weights and biases are used to reconstruct the FFNN and predict the ATED and WADDH for the testing dataset.
Figure 4 shows the optimization results. In Figure 4a the optimization charts are depicted for a total of 1000 iterations. All four models show great promise for reducing the error of FFNN training. Each algorithm follows a certain path of optimization. For instance, the MTOA has a smooth curve in comparison to the step-wise paths of the SOA and VSA. As explained, the objective function in this diagram is the average of the WADDH and ATED RMSE. For clarification, Figure 4b depicts the RMSEs separately.
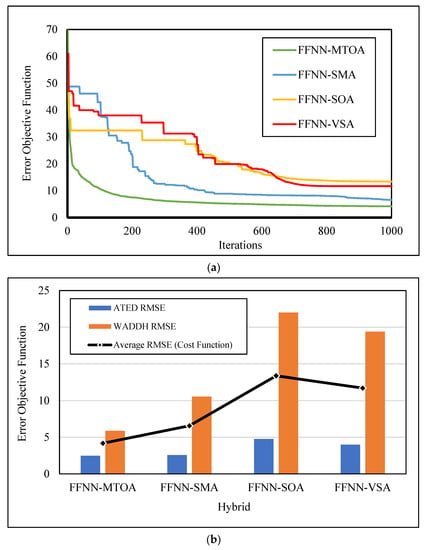
Figure 4.
Optimizing FFNN (a) error minimization and (b) calculated RMSEs.
From both parts of Figure 4, although all four models attained good results, it is evident that the MTOA reached the best training solution for the FFNN. All three RMSEs of this algorithm, i.e., average RMSE, ATED RMSE, and WADDH RMSE, are below the other three algorithms.
3.3. Assessment Using Accuracy Indicators
In this section, the performance of the used four models in both the training and testing stages is quantitatively and figuratively assessed. From here on, all values of the RMSE, MAE, and RP are presented in the respective order for the FFNN-MTOA, FFNN-SMA, FFNN-SOA, and FFNN-VSA.
The training results of the ATED are explained with errors of RMSEs 2.48, 2.58, 4.77, and 4.00 and MAEs 1.87, 2.04, 3.16, and 3.21. As for the WADDH, the RMSEs are 5.88, 10.55, 22.00, and 19.40 and the MAEs are 4.03, 7.45, 11.02, and 12.37. These values show the successful training of all models. Moreover, the goodness of the training can be supported by the RP values for the ATED 0.995, 0.995, 0.986, and 0.988, and for the WADDH 0.998, 0.994, 0.976, and 0.978.
Figure 5 and Figure 6 depict the training results in the form of correlation charts. As is seen, notwithstanding some underestimations and overestimations for the extreme values of ATED and WADDH, the fit lines (composed of the red dots) in all cases are satisfactorily compatible with the ideal line.
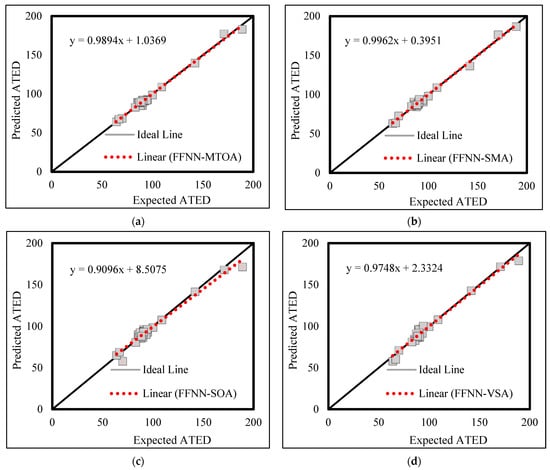
Figure 5.
ATED correlation diagrams-Training outcomes of (a) FFNN-MTOA, (b) FFNN-SMA, (c) FFNN-SOA, and (d) FFNN-VSA.
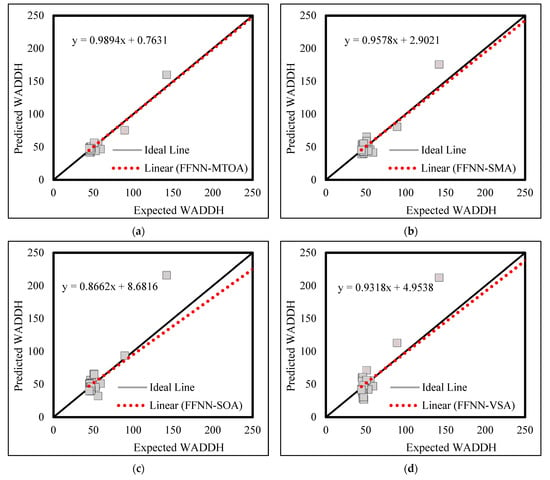
Figure 6.
WADDH correlation diagrams-Training outcomes of (a) FFNN-MTOA, (b) FFNN-SMA, (c) FFNN-SOA, and (d) FFNN-VSA.
By comparison, it can be deduced that while all four metaheuristic algorithms are powerful tools for training the FFNN, there are some distinctions between their accuracy. In this phase, the errors of the FFNN-MTOA and FFNN-SMA are considerably lower than two other hybrids. Besides, the RPs of these two models are higher than the FFNN-SOA and FFNN-VSA. These superiorities clearly indicate the better performance of the MTOA and SMA in training the FFNN. However, a more detailed comparison reveals the outperformance of the MTOA relative to the SMA. All in all, the MTOA emerged as the most powerful trainer algorithm.
The testing results of the ATED are explained with errors of RMSEs 9.84, 9.51, 5.97, and 10.87 and MAEs 6.73, 5.86, 4.36, and 9.86. As for the WADDH, the RMSEs are 95.96, 101.89, 81.80, and 78.53 and the MAEs are 41.11, 48.83, 43.10, and 36.73. These values show a successful prediction for all models. Moreover, the goodness of the training can be supported by the RP values for the ATED 0.972, 0.961, 0.990, and 0.969, and for the WADDH 0.997, 0.993, 0.991, and 0.997.
Figure 7 and Figure 8 depict the testing results in the form of correlation charts. In these charts, the fit lines (composed of the red dots) of the ATED data are satisfactorily compatible with the ideal line which means the testing outputs are in accordance with the targets. However, for the WADDH, the fit line is dragged by an extreme value which has been overestimated by all models. However, other values are well compatible with reality.
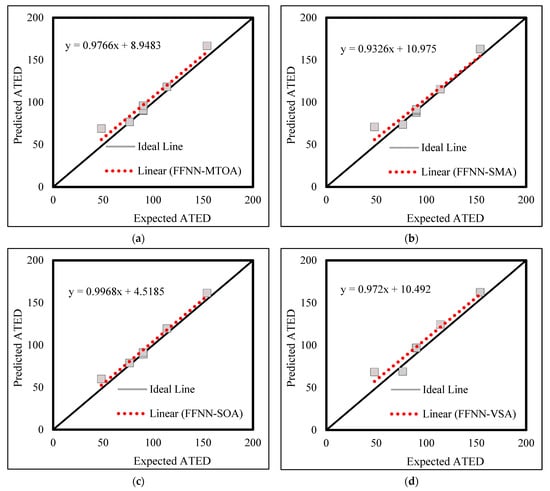
Figure 7.
ATED correlation diagrams—Testing outcomes of (a) FFNN-MTOA, (b) FFNN-SMA, (c) FFNN-SOA, and (d) FFNN-VSA.
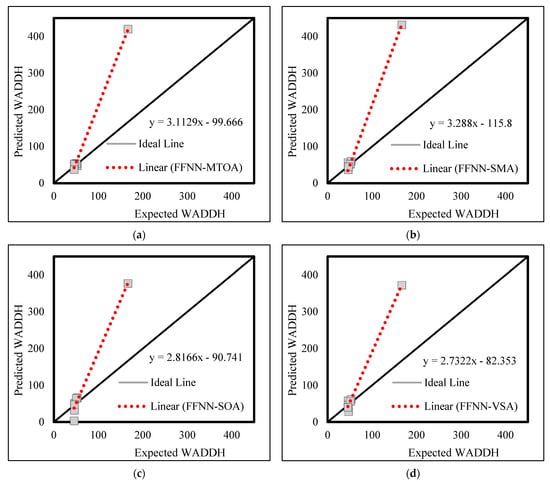
Figure 8.
WADDH correlation diagrams-Testing outcomes of (a) FFNN-MTOA, (b) FFNN-SMA, (c) FFNN-SOA, and (d) FFNN-VSA.
In the testing phase, having a comparative point of view discloses that there are significant disagreements between the testing accuracies, relative to the training stage of the four models. For instance, the smallest ATED RMSE and ATED MAE are obtained by FFNN-SOA, while the smallest WADDH RMSE and WADDH MAE are obtained by FFNN-VSA. The largest ATED RP is obtained by FFNN-SOA, while the largest WADDH RP is jointly obtained by FFNN-MTOA and FFNN-VSA. In the meantime, the FFNN-MTOA and FFNN-SMA have very close competition.
3.4. Discussion
As is known, the research related to the building sector covers a wide range of subjects from construction safety [47,48] and material analysis [49,50] to energy systems. In this work, the focus was on energy performance analysis that was successfully carried out using sophisticated machine learning. From Section 3.3, it was first inferred that all four models are proficient enough for comprehending and reproducing the pattern of both energy parameters. A significant deduction from these satisfactory performances is that the algorithms could simultaneously capture interrelated patterns for the ATED and WADDH by tuning 100 parameters (i.e., 91 weights and 9 biases, see Figure 3).
Since the selected algorithms are among the newest members of the metaheuristic family, there are few studies that have addressed the optimization of FFNN using them. For instance, Hu, et al. [41] employed an ensemble of SOA with ANN for estimating the capacity of concrete-filled steel tube columns by considering the column’s characteristics. Wu, et al. [51] introduced the combination of VSA and ANN as a potential hybrid tool for analyzing the heating load in residential buildings. Additionally, a SMA and ANN were synthesized by Lin and Wang [52] for building energy performance analysis.
As far as the MTOA is concerned, scholars such as Zhao, et al. [53] and Zhao, Hu, Song and Wang [32] have reported successful application of this algorithm along with the ANN for estimating the mechanical characteristics of concrete including slump and compressive strength, respectively. In this study, this algorithm could beat all other algorithms in the training phase; however, it obtained different rankings in the testing phase. The better accuracy of training for this algorithm has been similarly reported by Liang, et al. [33] where its hybrid with ANN was employed for predicting the friction capacity of driven piles. A potential reason for the excellent optimization ability of the MTOA could be the application two types of trackers (i.e., global and local trackers, see Section 2.2). It enables the algorithm to thoroughly cover the search space and seek the optimum solution. In the testing phase of this study, the FFNN-MTOA reached an outstanding accuracy, especially for the WADDH. Therefore, altogether, it can be said that the suggested FFNN-MTOA model can perform as a reliable hybrid model for predicting the ATED and WADHH of residential buildings.
Based on Figure 4, it can be said that all four algorithms could attain a desirable optimization within 1000 iterations. This number was determined by trial and error, as well as referring to some of the previous studies. In this figure, it is evident that the solution does not fall, and it is replaced only if the next solution shows more promise [54,55]. This property is an advantage of using metaheuristic algorithms for approaching the global optimum and avoiding local minima [56].
When the results are compared to previous works with the same dataset and similar methodologies, it can be derived that apart from the novelty of the tested algorithms, the accuracy of prediction for both ATED and WADHH has experienced some improvements. For instance, Fallah, et al. [57] combined ANN with an electrostatic discharge algorithm (ESDA) [58] and compared their results with several benchmarks. Their mode could achieve the training RMSEs of 2.53 and 6.79, respectively, for the ATED and WADHH. The values are larger than the RMSEs of the FFNN-MTOA in this study (2.48 and 5.88). Consequently, our MTOA outperformed their benchmark algorithms (atom search optimization (ASO) [59], future search algorithm (FSA) [60], and satin bowerbird optimization (SBO) [61]), too. Moreover, the prediction of WADHH was enhanced in this study because the FFNN-VSA achieved the testing MAE of 36.73 which is below all the mentioned algorithms of the cited study. Likewise, our FFNN-MTOA algorithm could perform better than ANFIS-400-EO, ANFIS-400-GWO, and ANFIS-400-SSA used by Alkhazaleh, Nahi, Hashemian, Nazem, Shamsi and Nehdi [28] in the training phase of the ATED. Besides, the prediction results of the FFNN-SOA are more accurate than the mentioned models of the cited study. Altogether, this paragraph suggests that this research could achieve significant accuracy improvements for both ATED and WADHH with respect to previous efforts.
From the previous literature, it can be said that intelligent models such as machine learning can serve better than traditional models for the practical estimations of energy performance. From a more practical perspective, when a building is going to be designed, energy performance comes up as a significant matter. For instance, if energy experts could acquire an early estimation of the required thermal load, it would be viable for them to do an efficient design of energy-related systems such as HVAC systems. As far as the architects and civil engineers are concerned, they can benefit from the proposed methodologies to adjust the geometry and construction material of the building. The reason for this claim is that, as observed in this research, energy performance was considered a complex function of building circumstances such as UM and Glz. As the above discussion denotes, the proposed methodologies in this work are optimized versions of machine learning models that can even enhance the contribution of state-of-the-art technology to the mentioned concepts. Thus, sustainable development and energy conservation would be highly respected in a fast and more inexpensive way in comparison to traditional construction strategies.
While this research could present a reliable simultaneous analysis of the ATED and WADHH by considering building circumstances (i.e., UM, UT, UP, αM, αT, Pt, ACH, Scw-N, Scw-S, and Scw-E, and Glz) as input factors, it can be recommended for future studies to perform separate predictions of the ATED and WADHH and compare their results with this study. In this regard, a few drawbacks of this research can be remedied by enriching the dataset to comprise a larger number of samples. Performing cross-validation is also recommended by using external datasets. Another demerit of this study was considering all the input factors of the dataset which created a huge space for the problem. Once reduced, the dimension of the problem can be optimized toward a more efficient simulation.
4. Conclusions
This research effort was dedicated to utilizing state-of-the-art machine learning for efficient energy performance analysis in residential buildings. For this objective, a feed-forward neural network was optimized using a multi-tracker optimization algorithm to simultaneously predict the annual thermal energy demand and annual weighted average discomfort degree hours. Based on the findings, the combination of metaheuristic algorithms and FFNN is a suitable option for understanding the dependency of the ATED and WADHH on the building characteristics. In this phase (i.e., training the FFNN), the MTOA surpassed three similar algorithms including the slime mould algorithm, seeker optimization algorithm, and vortex search algorithm. However, these four models emerged in different positions in the testing phase. However, in a more general view, the Pearson correlation coefficient was greater than 0.96 throughout the results which indicates excellent accuracies for all models in both phases. The proposed models could also outperform some similar methodologies in the earlier literature, and hereupon, this study could improve intelligent energy performance analysis. To sum up, the proposed FFNN-MTOA algorithm could reach the projected target, and therefore, it is recommended to substitute traditional and costly methods for energy performance analysis. However, some ideas were discussed regarding data enrichment and optimization strategies to remedy the shortcomings of this study.
Author Contributions
Conceptualization, Y.G. and E.S.Z.; Methodology, Y.G. and E.S.Z.; Software, Validation, Writing—original draft, Y.G.; Writing—review & editing, Y.G., E.S.Z. and J.G.; Visualization, Y.G., E.S.Z. and J.G. All authors have read and agreed to the published version of the manuscript.
Funding
The publication of this article was supported by the Faculty of Engineering and Information Technology, University of Pécs, Hungary, within the framework of the ‘Call for Grant for Publication’.
Data Availability Statement
The data that support the findings of this study are available upon request from the authors.
Conflicts of Interest
The authors declare no conflict of interest.
References
- Zhou, G.; Bao, X.; Ye, S.; Wang, H.; Yan, H. Selection of optimal building facade texture images from UAV-based multiple oblique image flows. IEEE Trans. Geosci. Remote Sens. 2020, 59, 1534–1552. [Google Scholar] [CrossRef]
- Liu, Z.; Xu, J.; Liu, M.; Yin, Z.; Liu, X.; Yin, L.; Zheng, W. Remote sensing and geostatistics in urban water-resource monitoring: A review. Mar. Freshw. Res. 2023. [Google Scholar] [CrossRef]
- Yang, J.; Fu, L.-Y.; Zhang, Y.; Han, T. Temperature-and pressure-dependent pore microstructures using static and dynamic moduli and their correlation. Rock Mech. Rock Eng. 2022, 55, 4073–4092. [Google Scholar] [CrossRef]
- Guo, Q.; Zhong, J. The effect of urban innovation performance of smart city construction policies: Evaluate by using a multiple period difference-in-differences model. Technol. Forecast. Soc. Change 2022, 184, 122003. [Google Scholar] [CrossRef]
- Shang, Y.; Lian, Y.; Chen, H.; Qian, F. The impacts of energy resource and tourism on green growth: Evidence from Asian economies. Resour. Policy 2023, 81, 103359. [Google Scholar] [CrossRef]
- Yin, X.; Ye, C.; Ding, Y.; Song, Y. Exploiting Internet Data Centers as Energy Prosumers in Integrated Electricity-Heat System. IEEE Trans. Smart Grid 2022, 14, 167–182. [Google Scholar] [CrossRef]
- Fathi, S.; Srinivasan, R.; Fenner, A.; Fathi, S.J.R.; Reviews, S.E. Machine learning applications in urban building energy performance forecasting: A systematic review. Renew. Sustain. Energy Rev. 2020, 133, 110287. [Google Scholar] [CrossRef]
- Chegari, B.; Tabaa, M.; Simeu, E.; Moutaouakkil, F.; Medromi, H. Multi-objective optimization of building energy performance and indoor thermal comfort by combining artificial neural networks and metaheuristic algorithms. Energy Build. 2021, 239, 110839. [Google Scholar] [CrossRef]
- Mokhtara, C.; Negrou, B.; Settou, N.; Settou, B.; Samy, M.M. Design optimization of off-grid Hybrid Renewable Energy Systems considering the effects of building energy performance and climate change: Case study of Algeria. Energy 2021, 219, 119605. [Google Scholar] [CrossRef]
- Zhou, G.; Moayedi, H.; Bahiraei, M.; Lyu, Z. Employing artificial bee colony and particle swarm techniques for optimizing a neural network in prediction of heating and cooling loads of residential buildings. J. Clean. Prod. 2020, 254, 120082. [Google Scholar] [CrossRef]
- Cheng, Y.; Fu, L.-Y. Nonlinear seismic inversion by physics-informed Caianiello convolutional neural networks for overpressure prediction of source rocks in the offshore Xihu depression, East China. J. Pet. Sci. Eng. 2022, 215, 110654. [Google Scholar] [CrossRef]
- Mehrabi, M. Landslide susceptibility zonation using statistical and machine learning approaches in Northern Lecco, Italy. Nat. Hazards 2021, 111, 901–937. [Google Scholar] [CrossRef]
- Seyedashraf, O.; Mehrabi, M.; Akhtari, A.A. Novel approach for dam break flow modeling using computational intelligence. J. Hydrol. 2018, 559, 1028–1038. [Google Scholar] [CrossRef]
- Baduge, S.K.; Thilakarathna, S.; Perera, J.S.; Arashpour, M.; Sharafi, P.; Teodosio, B.; Shringi, A.; Mendis, P. Artificial intelligence and smart vision for building and construction 4.0: Machine and deep learning methods and applications. Autom. Constr. 2022, 141, 104440. [Google Scholar] [CrossRef]
- Zhong, H.; Wang, J.; Jia, H.; Mu, Y.; Lv, S. Vector field-based support vector regression for building energy consumption prediction. Appl. Energy 2019, 242, 403–414. [Google Scholar] [CrossRef]
- Pezeshki, Z.; Mazinani, S.M. Comparison of artificial neural networks, fuzzy logic and neuro fuzzy for predicting optimization of building thermal consumption: A survey. Artif. Intell. Rev. 2019, 52, 495–525. [Google Scholar] [CrossRef]
- Yegnanarayana, B. Artificial Neural Networks; PHI Learning Pvt. Ltd.: New Delhi, India, 2009. [Google Scholar]
- Gao, W.; Alsarraf, J.; Moayedi, H.; Shahsavar, A.; Nguyen, H. Comprehensive preference learning and feature validity for designing energy-efficient residential buildings using machine learning paradigms. Appl. Soft Comput. 2019, 84, 105748. [Google Scholar] [CrossRef]
- Hosseinnezhad, V.; Shafie-Khah, M.; Siano, P.; Catalão, J.P.S. An Optimal Home Energy Management Paradigm With an Adaptive Neuro-Fuzzy Regulation. IEEE Access 2020, 8, 19614–19628. [Google Scholar] [CrossRef]
- Khalil, A.J.; Barhoom, A.M.; Abu-Nasser, B.S.; Musleh, M.M.; Abu-Naser, S.S. Energy Efficiency Prediction using Artificial Neural Network. Int. J. Acad. Pedagog. Res. 2019, 3, 1–7. [Google Scholar]
- Jallal, M.A.; Gonzalez-Vidal, A.; Skarmeta, A.F.; Chabaa, S.; Zeroual, A. A hybrid neuro-fuzzy inference system-based algorithm for time series forecasting applied to energy consumption prediction. Appl. Energy 2020, 268, 114977. [Google Scholar] [CrossRef]
- Le, L.T.; Nguyen, H.; Dou, J.; Zhou, J. A comparative study of PSO-ANN, GA-ANN, ICA-ANN, and ABC-ANN in estimating the heating load of buildings’ energy efficiency for smart city planning. Appl. Sci. 2019, 9, 2630. [Google Scholar] [CrossRef]
- Tien Bui, D.; Moayedi, H.; Anastasios, D.; Kok Foong, L. Predicting heating and cooling loads in energy-efficient buildings using two hybrid intelligent models. Appl. Sci. 2019, 9, 3543. [Google Scholar] [CrossRef]
- Adedeji, P.A.; Akinlabi, S.; Madushele, N.; Olatunji, O.O. Hybrid adaptive neuro-fuzzy inference system (ANFIS) for a multi-campus university energy consumption forecast. Int. J. Ambient Energy 2022, 43, 1685–1694. [Google Scholar] [CrossRef]
- Moayedi, H.; Le Van, B. Feasibility of Harris Hawks Optimization in Combination with Fuzzy Inference System Predicting Heating Load Energy Inside Buildings. Energies 2022, 15, 9187. [Google Scholar] [CrossRef]
- Cao, Y.; Pourrostam, T.; Zandi, Y.; Denić, N.; Ćirković, B.; Agdas, A.S.; Selmi, A.; Vujović, V.; Jermsittiparsert, K.; Milic, M. Analyzing the energy performance of buildings by neuro-fuzzy logic based on different factors. Environ. Dev. Sustain. 2021, 23, 17349–17373. [Google Scholar] [CrossRef]
- Alshudukhi, J.; Yadav, K. Survivability development of wireless sensor networks using neuro fuzzy-clonal selection optimization. Theor. Comput. Sci. 2022, 922, 25–36. [Google Scholar] [CrossRef]
- Alkhazaleh, H.A.; Nahi, N.; Hashemian, M.H.; Nazem, Z.; Shamsi, W.D.; Nehdi, M.L. Prediction of Thermal Energy Demand Using Fuzzy-Based Models Synthesized with Metaheuristic Algorithms. Sustainability 2022, 14, 14385. [Google Scholar] [CrossRef]
- Luo, X.J.; Oyedele, L.O.; Ajayi, A.O.; Akinade, O.O.; Owolabi, H.A.; Ahmed, A. Feature extraction and genetic algorithm enhanced adaptive deep neural network for energy consumption prediction in buildings. Renew. Sustain. Energy Rev. 2020, 131, 109980. [Google Scholar] [CrossRef]
- Hygh, J.S.; DeCarolis, J.F.; Hill, D.B.; Ranjithan, S.R. Multivariate regression as an energy assessment tool in early building design. Build. Environ. 2012, 57, 165–175. [Google Scholar] [CrossRef]
- Zakeri, E.; Moezi, S.A.; Bazargan-Lari, Y.; Zare, A. Multi-tracker optimization algorithm: A general algorithm for solving engineering optimization problems. Iran. J. Sci. Technol. Trans. Mech. Eng. 2017, 41, 315–341. [Google Scholar] [CrossRef]
- Zhao, Y.; Hu, H.; Song, C.; Wang, Z. Predicting compressive strength of manufactured-sand concrete using conventional and metaheuristic-tuned artificial neural network. Measurement 2022, 194, 110993. [Google Scholar] [CrossRef]
- Liang, S.; Foong, L.K.; Lyu, Z. Determination of the friction capacity of driven piles using three sophisticated search schemes. Eng. Comput. 2022, 38, 1515–1527. [Google Scholar] [CrossRef]
- Li, S.; Chen, H.; Wang, M.; Heidari, A.A.; Mirjalili, S. Slime mould algorithm: A new method for stochastic optimization. Future Gener. Comput. Syst. 2020, 111, 300–323. [Google Scholar] [CrossRef]
- Dai, C.; Chen, W.; Song, Y.; Zhu, Y. Seeker optimization algorithm: A novel stochastic search algorithm for global numerical optimization. J. Syst. Eng. Electron. 2010, 21, 300–311. [Google Scholar] [CrossRef]
- Doğan, B.; Ölmez, T. A new metaheuristic for numerical function optimization: Vortex Search algorithm. Inf. Sci. 2015, 293, 125–145. [Google Scholar] [CrossRef]
- Klein, S.; Beckman, W.; Mitchell, J.; Duffie, J.; Duffie, N.; Freeman, T.; Mitchell, J.; Braun, J.; Evans, B.; Kummer, J. TRNSYS 17: A Transient System Simulation Program, Solar Energy Laboratory; University of Wisconsin: Madison, WI, USA, 2010. [Google Scholar]
- Nekooei-Joghdani, A.; Safi-Esfahani, F. Dynamic scheduling of independent tasks in cloud computing applying a new hybrid metaheuristic algorithm including Gabor filter, opposition-based learning, multi-verse optimizer, and multi-tracker optimization algorithms. J. Supercomput. 2022, 78, 1182–1243. [Google Scholar] [CrossRef]
- Khosravi, H.; Zakeri, E.; Xie, W.-F.; Ahmadi, B. Adaptive multi-tracker optimization algorithm for global optimization problems: Emphasis on applications in chemical engineering. Eng. Comput. 2022, 38, 1309–1336. [Google Scholar] [CrossRef]
- Brabazon, A.; McGarraghy, S. Slime mould foraging: An inspiration for algorithmic design. Int. J. Innov. Comput. Appl. 2020, 11, 30–45. [Google Scholar] [CrossRef]
- Hu, P.; Aghajanirefah, H.; Anvari, A.; Nehdi, M.L. Combining Artificial Neural Network and Seeker Optimization Algorithm for Predicting Compression Capacity of Concrete-Filled Steel Tube Columns. Buildings 2023, 13, 391. [Google Scholar] [CrossRef]
- Tuba, M.; Brajevic, I.; Jovanovic, R. Hybrid seeker optimization algorithm for global optimization. Appl. Math. Inf. Sci. 2013, 7, 867. [Google Scholar] [CrossRef]
- Toz, M. Chaos-based Vortex Search algorithm for solving inverse kinematics problem of serial robot manipulators with offset wrist. Appl. Soft Comput. 2020, 89, 106074. [Google Scholar] [CrossRef]
- Altintasi, C.; Aydin, O.; Taplamacioglu, M.C.; Salor, O. Power system harmonic and interharmonic estimation using Vortex Search Algorithm. Electr. Power Syst. Res. 2020, 182, 106187. [Google Scholar] [CrossRef]
- Nguyen, H.; Mehrabi, M.; Kalantar, B.; Moayedi, H.; Abdullahi, M.A.M. Potential of hybrid evolutionary approaches for assessment of geo-hazard landslide susceptibility mapping. Geomat. Nat. Hazards Risk 2019, 10, 1667–1693. [Google Scholar] [CrossRef]
- Mehrabi, M.; Pradhan, B.; Moayedi, H.; Alamri, A. Optimizing an adaptive neuro-fuzzy inference system for spatial prediction of landslide susceptibility using four state-of-the-art metaheuristic techniques. Sensors 2020, 20, 1723. [Google Scholar] [CrossRef] [PubMed]
- Zhang, Z.; Li, W.; Yang, J. Analysis of stochastic process to model safety risk in construction industry. J. Civ. Eng. Manag. 2021, 27, 87–99. [Google Scholar] [CrossRef]
- Xiao, D.; Hu, Y.; Wang, Y.; Deng, H.; Zhang, J.; Tang, B.; Xi, J.; Tang, S.; Li, G. Wellbore cooling and heat energy utilization method for deep shale gas horizontal well drilling. Appl. Therm. Eng. 2022, 213, 118684. [Google Scholar] [CrossRef]
- Yang, Z.; Xu, J.; Feng, Q.; Liu, W.; He, P.; Fu, S. Elastoplastic analytical solution for the stress and deformation of the surrounding rock in cold region tunnels considering the influence of the temperature field. Int. J. Geomech. 2022, 22, 04022118. [Google Scholar] [CrossRef]
- Yang, J.; Fu, L.Y.; Fu, B.Y.; Deng, W.; Han, T. Third-Order Padé Thermoelastic Constants of Solid Rocks. J. Geophys. Res. Solid Earth 2022, 127, e2022JB024517. [Google Scholar] [CrossRef]
- Wu, D.; Foong, L.K.; Lyu, Z. Two neural-metaheuristic techniques based on vortex search and backtracking search algorithms for predicting the heating load of residential buildings. Eng. Comput. 2022, 38, 647–660. [Google Scholar] [CrossRef]
- Lin, C.; Wang, J. Metaheuristic-designed systems for simultaneous simulation of thermal loads of building. Smart Struct. Syst. 2022, 29, 677–691. [Google Scholar]
- Zhao, Y.; Bai, C.; Xu, C.; Foong, L.K. Efficient metaheuristic-retrofitted techniques for concrete slump simulation. Smart Struct. Syst. 2021, 27, 745–759. [Google Scholar]
- Moayedi, H.; Mehrabi, M.; Bui, D.T.; Pradhan, B.; Foong, L.K. Fuzzy-metaheuristic ensembles for spatial assessment of forest fire susceptibility. J. Environ. Manag. 2020, 260, 109867. [Google Scholar] [CrossRef]
- Mehrabi, M.; Moayedi, H. Landslide susceptibility mapping using artificial neural network tuned by metaheuristic algorithms. Environ. Earth Sci. 2021, 80, 1–20. [Google Scholar] [CrossRef]
- Moayedi, H.; Mehrabi, M.; Mosallanezhad, M.; Rashid, A.S.A.; Pradhan, B. Modification of landslide susceptibility mapping using optimized PSO-ANN technique. Eng. Comput. 2018, 35, 967–984. [Google Scholar] [CrossRef]
- Fallah, A.M.; Ghafourian, E.; Shahzamani Sichani, L.; Ghafourian, H.; Arandian, B.; Nehdi, M.L. Novel Neural Network Optimized by Electrostatic Discharge Algorithm for Modification of Buildings Energy Performance. Sustainability 2023, 15, 2884. [Google Scholar] [CrossRef]
- Bouchekara, H.R. Electrostatic discharge algorithm: A novel nature-inspired optimisation algorithm and its application to worst-case tolerance analysis of an EMC filter. IET Sci. Meas. Technol. 2019, 13, 491–499. [Google Scholar] [CrossRef]
- Zhao, W.; Wang, L.; Zhang, Z. Atom search optimization and its application to solve a hydrogeologic parameter estimation problem. Knowl. -Based Syst. 2019, 163, 283–304. [Google Scholar] [CrossRef]
- Elsisi, M. Future search algorithm for optimization. Evol. Intell. 2019, 12, 21–31. [Google Scholar] [CrossRef]
- Moosavi, S.H.S.; Bardsiri, V.K. Satin bowerbird optimizer: A new optimization algorithm to optimize ANFIS for software development effort estimation. Eng. Appl. Artif. Intell. 2017, 60, 1–15. [Google Scholar] [CrossRef]
Disclaimer/Publisher’s Note: The statements, opinions and data contained in all publications are solely those of the individual author(s) and contributor(s) and not of MDPI and/or the editor(s). MDPI and/or the editor(s) disclaim responsibility for any injury to people or property resulting from any ideas, methods, instructions or products referred to in the content. |
© 2023 by the authors. Licensee MDPI, Basel, Switzerland. This article is an open access article distributed under the terms and conditions of the Creative Commons Attribution (CC BY) license (https://creativecommons.org/licenses/by/4.0/).