Article

Modelling and Multi-Objective Optimisation of Finger Joints: Improving Flexural Performance and Minimising Wood Waste

Department of Infrastructure Engineering, The University of Melbourne, Parkville, VIC 3010, Australia
*
Author to whom correspondence should be addressed.
Buildings 2023, 13(5), 1186; https://doi.org/10.3390/buildings13051186
Submission received: 24 March 2023 / Revised: 18 April 2023 / Accepted: 22 April 2023 / Published: 29 April 2023
(This article belongs to the Special Issue Recent Developments in Timber Engineering)

Abstract

:
The wood industry faces the dual requirements of improving the quality of timber products and minimising waste during the manufacturing process. The finger joint, which is an end-to-end joining method for timber boards, is one of the most important aspects of engineering wood products. This study presents a numerical and optimisation investigation of the effects of finger-joint design parameters on the flexural behaviour of finger-jointed timber beams. A numerical model based on advanced three-dimensional finite element analysis was developed to model the behaviour of finger-jointed beams. Using the validated finite element (FE) model and automated parameterisation, a parametric study was conducted to assess the impact of each design parameter of the finger joint, including finger length, tip thickness, and the number of finger joints. The results indicate that the number of fingers and finger length significantly influence the maximum load capacity, while the tip thickness has a marginal effect on performance. This study identifies a design threshold of five fingers and a 14 mm finger length for achieving efficient, high-performance finger-joint designs. In addition, the multi-objective modified firefly algorithm (MOMFA) was proposed to maximise the finger joint resistance while simultaneously minimising the material waste. The optimisation shows that there will be a significant amount of wood waste when using traditional single-objective optimisation that only focuses on structural performance. In contrast, the proposed method achieves comparable load capacity while significantly reducing waste (up to 53.31%) during the joining process. The automated finite element modelling framework and holistic optimisation developed in this study can be used to design and optimise engineering wood products for construction applications.

1. Introduction

Rapid population growth and urbanization in recent decades have significantly increased the pressure on the planet’s limited resources and environment. As one of the oldest materials introduced to humankind, wood has been brought back into the public eye due to its sustainable characteristics and potential benefits. With larger span capabilities and more consistent performance compared to traditional timber structures, engineered wood product (EWP) has been gradually used in the timber industry to replace low-volume and low-performance raw timber over the years. The finger joint, a method for interlocking end-to-end joints of timber boards (i.e., timber beams) in the EWP manufacturing process, has become one of the most important steps in the production of EWP [1]. A finger joint is defined as the interlocking end joint manufactured with the machinery process of cutting a series of similar, tapered, symmetrical shapes from the end of two identical wood pieces and splicing them end-wise using adhesives [2]. This joint has many valuable characteristics such as straightness, dimensional stability, and unlimited length [3]. Moreover, finger joints also enable the ability to join short timber beams to longer ones and to utilise low-grade lumbers. Finger-jointed timber beams can be laminated together to produce common EWPs such as glue-laminated timber (GLT) and cross-laminated timber (CLT).
The primary criterion for finger joint assessment is the load-bearing capacity of structures, which is determined using flexural tests and is frequently used for quality control in EWP manufacturing [4]. Several reports highlight the importance of finger joints in the flexural performance of EWPs [4,5]. For example, according to several experiments on the flexural behaviour of CLT panels conducted by Navaratnam et al. [6], finger joint failure is one of the most common failure modes observed in the tests. As a result, several design factors related to finger joints such as finger length, tip width, pitch, and finger slope should be considered in the production of an EWP to assure its structural performance [6,7,8]. Several studies have been conducted to investigate the effect of finger joint design parameters on structural performance by performing experiments or using the finite element method (FEM). For example, Özçifçi and Yapıcı [9] experimentally investigated the bending strength of various finger joint samples with different finger lengths. The wood types in this study included Oriental beech, oak, Scots pine, poplar, and Turkish fir. The authors found that for all species, as the finger length increases, the bending strength also increases due to a larger bonding area [9]. In the study by Abdul Hamid et al. [10], the impact of finger length and orientation on the bending strength of the finger joint made with Kelat wood (Syzygium spp.), one of the commercial timbers in Malaysia, was determined. The study also concluded that a long finger length will have a higher strength, while the finger orientation has a minimal impact. Even though design parameters are interrelated with one another and can have different effects on the timber beam, very few papers have considered the combined effect of these variables. Tran et al. [11] conducted a numerical optimization study on the flexural behaviour of finger-jointed timber beech beams. Finger length, pitch, and tip thickness were simultaneously optimised using the response surface method (RSM) and kriging interpolation. The obtained numerical results revealed the flexural capacity of the finger joint beam was improved from 10.4 kN to 13.8 kN by optimizing its geometry. Hasanagić et al. [12] optimised the tensile break force of a timber joint. The variables were wood density, the ratio of sample width and thickness, and the ratio of finger length and pitch. Higher values of the fracture tensile force were obtained based on a mathematical model as a function of the maximum tensile force.
In the literature, it has been shown that the structural performance of a finger joint generally can be improved by increasing the bonding area. These studies had a single objective, focusing only on structural performance. However, in a study by Ratnasingam and Scholz [13], the strength of different finger configurations was evaluated. The study concluded that although using longer fingers made the finger-jointed panels stronger, the additional material loss during machining offset the strength gain. Therefore, the enlargement of the bonding area brings inherent adverse effects, such as extra wood waste, by-products (i.e., sawdust), and adhesives. Firstly, it is well-known that preventing wood waste and improving wood utilization can help mitigate environmental impacts while also reducing pressure on global forest resources to meet construction demand [14,15]. Secondly, additional machining and jointing result in increased sawdust. When sawdust is not properly disposed of, it becomes a health and environmental hazard [16]. Thirdly, because of the larger bonding area, more adhesive is required. Even though adhesives are made up of both natural and synthetic ingredients, they may have detrimental environmental consequences and pose serious health risks to humans, depending on the type of adhesive used [15,17]. Thus, more knowledge is required on the ways to improve the structural integrity of finger joints while simultaneously increasing the efficiency of the timber manufacturing process, lowering wood waste, and assisting the timber industry in addressing growing environmental challenges.
The preceding literature review shows that the behaviour of finger-jointed beams has been of great research interest, but the aforementioned research was solely focused on the finger joint strength without considering the associated possible waste. As previously discussed, this dual requirement is mutually contradictory. The major objective of this paper is to improve the mechanical strength of finger joints while simultaneously minimising the wood waste generated when using joining processes. The specific objectives include the development of an advanced 3D FE analysis, an investigation of the effect of finger joint geometry, and finally, an optimisation framework for finger joint design. The nonlinear, anisotropic Hill elasto-plastic model and cohesive modelling techniques were developed to capture the nonlinear, orthotropic behaviours of timber and the failure of the bond lines in the finger joint. To verify the accuracy and reliability of the developed 3D FE model, the obtained numerical results were compared with experimental results. The effect of finger joint parameters, including finger length, tip thickness, orientation, location, and the number of fingers on the flexural performance of finger-jointed timber beams is investigated using an advanced, 3D FE analysis. This paper implements a multi-objective modified firefly algorithm (MOMFA), which has superior performance in complex engineering optimisation [18,19,20,21], to perform the multi-objective optimisation for the geometry of the finger joint to maximise the load capacity and minimise the waste created during the joining process.

2. Numerical Simulation

2.1. Materials’ Laws

Bending tests are typically used to determine the flexural capacity of finger-jointed beams and are a part of quality control in the production of EWP [4]. Figure 1 presents a schematic showing the four-point bending test of a spruce timber beam with a finger joint used in this study. The setup was adopted from the experiment conducted by Khelifa et al. [22]. The spruce timber samples were kept in a typical air-conditioned room at a temperature of 20 °C. The moisture content of the timber samples was similar, averaging around 12%, while the corresponding density was determined to be 460 kg/m3 [22]. To assess the performance of a finger-jointed beam, a finger joint was fabricated at the middle of the beam, as depicted in Figure 1, in accordance with the EN408 standard [23]. Two supporting pins were placed underneath the timber beam specimen with a span of 852 mm. The cross-section of the beam was 80 mm × 42 mm. As shown in Figure 1, two loading forces were applied using on the top of the specimen at an equal distance on both the left and right sides of the centre location until failure occurred. The material behaviours of timber were modelled with the Hill elasto-plastic model, whilst the glue lines at the finger joint location were modelled using cohesive behaviour. The material models and cohesive behaviour used in this study are presented in the following sections.

2.1.1. Hill Elasto-Plastic Model

Due to the orthotropic responses of wood, i.e., wood behaves differently in different directions [3,24], modelling the flexural behaviours of timber structures is challenging. The Hill elasto-plastic model, implemented with the ABAQUS package [25], can be used to describe the orthotropic responses of timber structures. This model is commonly used to describe the behaviour of orthotropic materials, especially wood [11,22,24,25,26,27]. This section briefly presents fundamental formulations of the Hill elasto-plastic model. Readers are encouraged to find a detailed description of the Hill elasto-plastic model in the literature [11,22,24,25,26,27]. The linear, orthotropic behaviour of timber is given as follows:
σ 11 σ 22 σ 33 σ 12 σ 23 σ 13 = C 11 C 12 C 13 0 0 0 C 12 C 22 C 23 0 0 0 C 13 C 23 C 33 0 0 0 0 0 0 2 G 12 0 0 0 0 0 0 2 G 23 0 0 0 0 0 0 2 G 13 ϵ 11 ϵ 22 ϵ 33 ϵ 12 ϵ 23 ϵ 13
Given that:
C 11 = E 1 1 v 23 v 32 Ґ C 22 = E 2 1 v 13 v 31 Ґ C 33 = E 3 1 v 12 v 21 Ґ C 12 = E 1 v 21 + v 31 v 23 Ґ C 23 = E 2 v 32 + v 21 v 31 Ґ C 13 = E 1 v 31 + v 21 v 32 Ґ Ґ = 1 / ( 1 v 12 2 v 23 2 v 31 2 2 v 12 v 23 v 13 )
where σ 11 ,   σ 22 ,   a n d   σ 33 are normal stresses and σ 12 ,   σ 13 ,   a n d   σ 23 are shear stresses; ϵ 11 , ϵ 22 ,   a n d   ϵ 33 , are normal strains and ϵ 12 , ϵ 13 ,   a n d   ϵ 23 are shear strains; E1, E2, and E3 are Young’s moduli in the principal directions (1—L/longitudinal, 2—T/tangential, 3—R/radial); υ ij are Poisson’s ratios; and G12, G13, and G23 are shear moduli in the principal directions. Following the linear, elastic response, Hill’s potential function defines the nonlinear, anisotropic plastic response of timber and is given as follows:
f σ = H σ 11 σ 22 2 + G σ 11 σ 33 2 + F σ 22 σ 33 2 + 2 N σ 12 2 + 2 M σ 13 2 + 2 L σ 23 2
where the Hill’s constants (F, G, H, L, M, and N) are given as follows [25]:
F = σ 0 2 2 1 σ ¯ 22 2 + 1 σ ¯ 33 2 1 σ ¯ 11 2 = 1 2 1 R 22 2 + 1 R 33 2 1 R 11 2 ,
G = σ 0 2 2 1 σ ¯ 33 2 + 1 σ ¯ 11 2 1 σ ¯ 22 2 = 1 2 1 R 33 2 + 1 R 11 2 1 R 22 2 ,
H = σ 0 2 2 1 σ ¯ 11 2 + 1 σ ¯ 22 2 1 σ ¯ 33 2 = 1 2 1 R 11 2 + 1 R 22 2 1 R 33 2 ,
L = 3 2 τ 0 σ ¯ 23 2 = 3 2 R 23 2 ,
M = 3 2 τ 0 σ ¯ 13 2 = 3 2 R 13 2 ,
N = 3 2 τ 0 σ ¯ 12 2 = 3 2 R 12 2 ,
where σ 0 is the reference yield stress and σ ¯ i j is the yield stress value.
It should be mentioned that the difference in compression and tension behaviours of timber, as discussed in the literature [24], is not considered in the anisotropic plasticity material model. As the compression and tensile strength are equal, one can either choose the smaller values or the mean values between both of them. In this paper, the same material properties were used in the present FE model as given in Khelifa et al. [22]. The material inputs of the Hill elasto-plastic model can be found in Khelifa et al. [22].

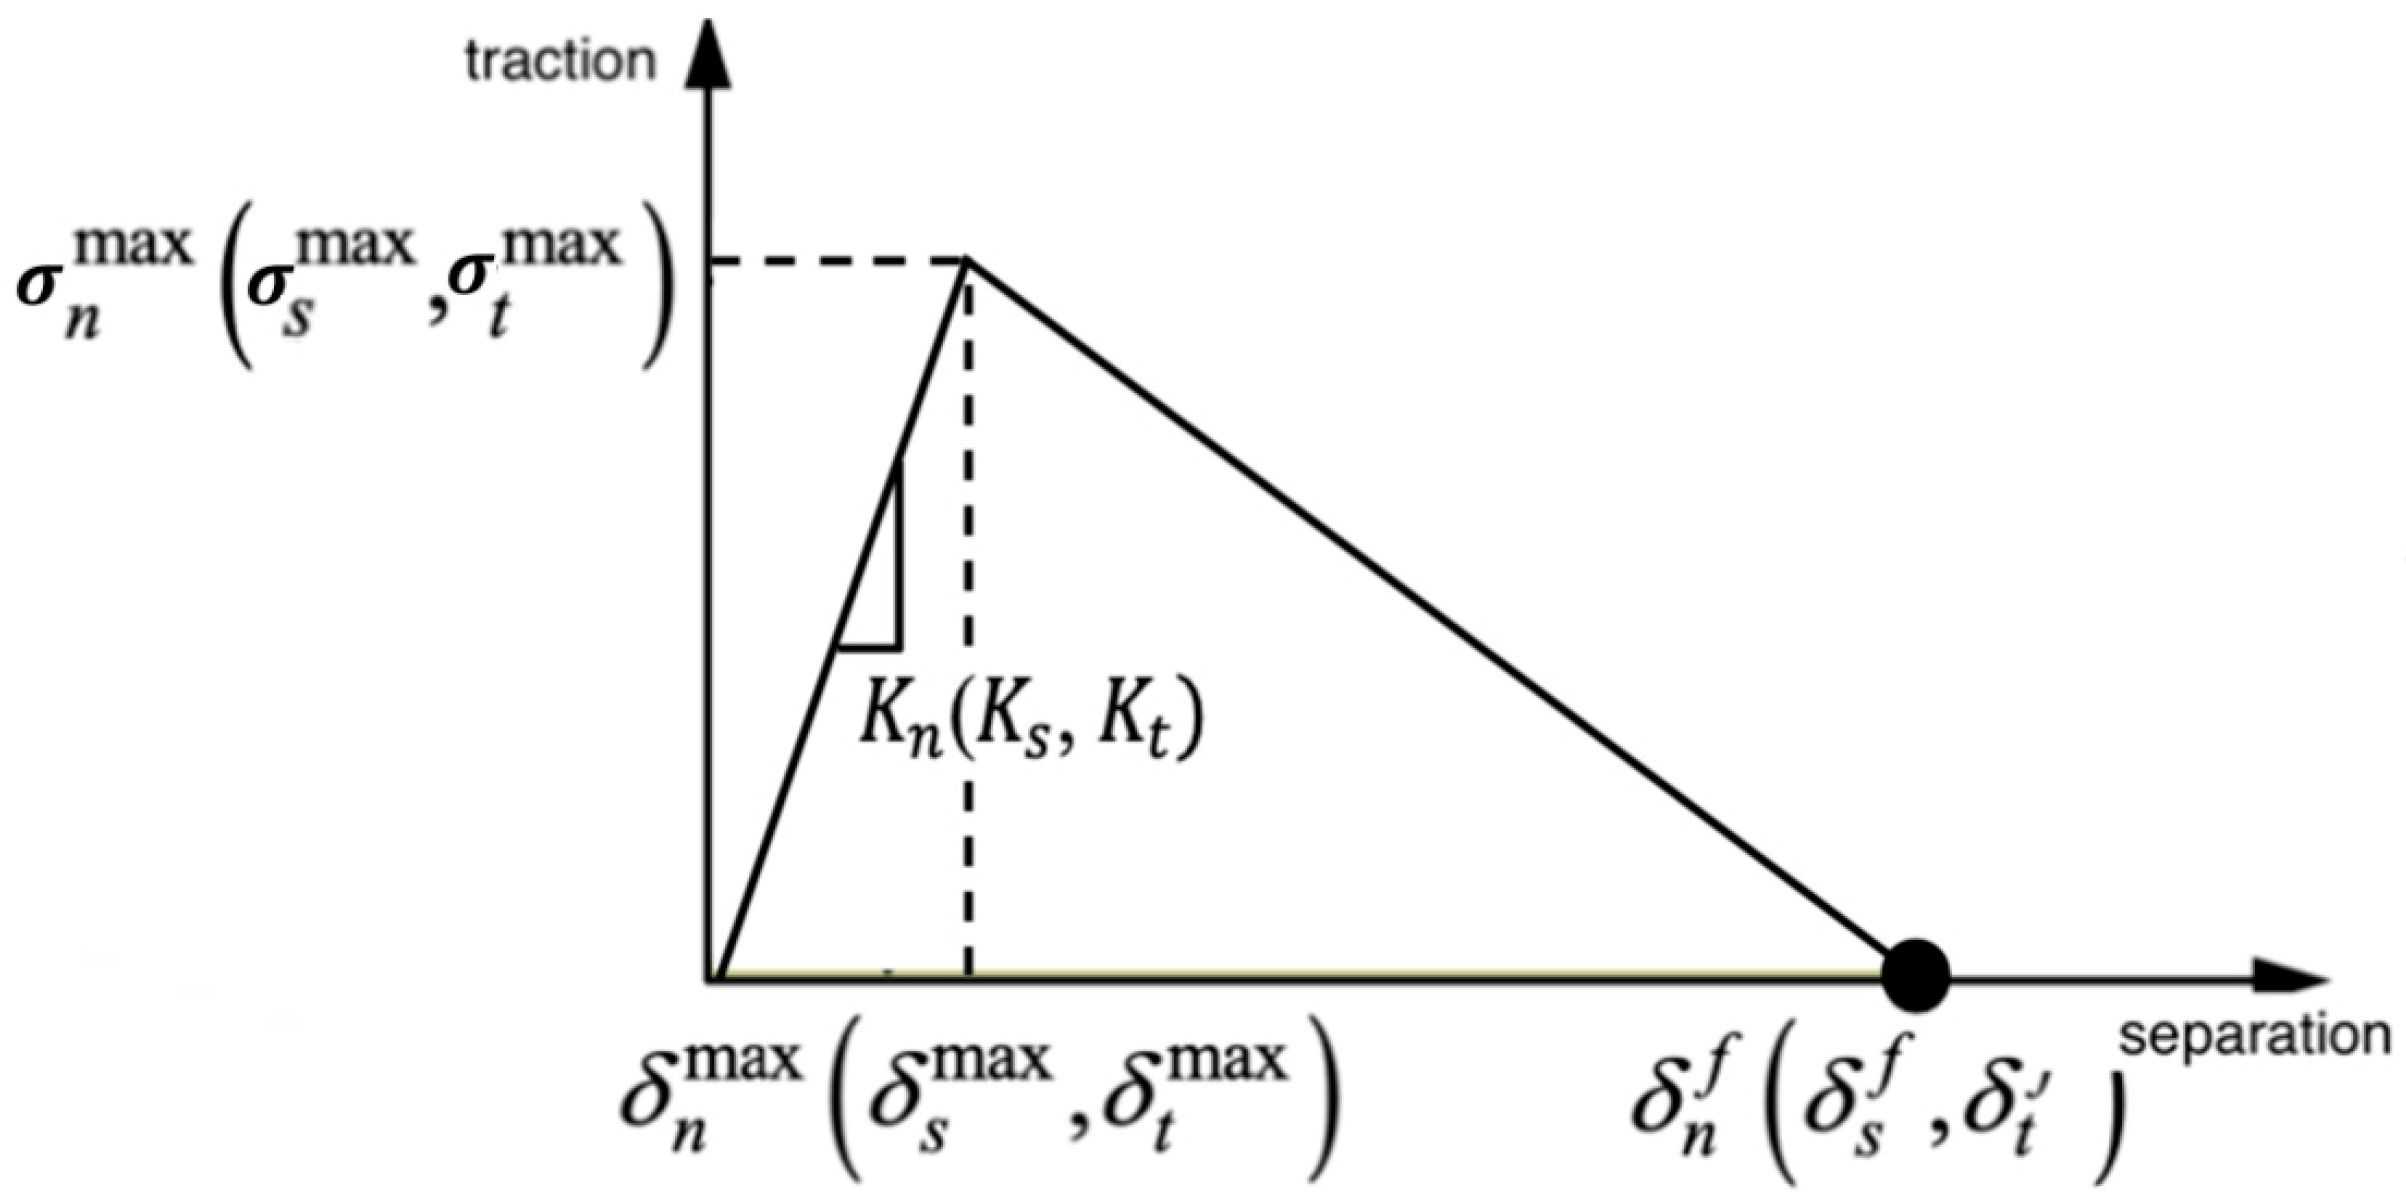
2.1.2. Cohesive Behaviour

For finger-jointed timber beams, failure behaviours are complicated, but failure commonly occurs at the bond lines of the finger joint [3]. Lara-Bocanegra et al. [3] and Fortuna et al. [5] stated that the weakest part of a glued–laminated structure timber is at the finger joint. Moreover, Colling [28] conducted numerous experiments on timber beams and reported that 220 out of 277 timber beams have failure modes related to the finger joint. It is observed from the literature that the adhesive layer (glue) at the finger joint usually fails before the timber itself reaches its ultimate stress. Traditionally, phenol–resorcinol–formaldehyde (PRF) has been widely used for finger jointing, but there has been an upsurge in the use of melamine–urea–formaldehyde (MUF) adhesive [29,30]. The main reason for the decline in the use of PRF is its brown colour, which is perceived as aesthetically undesirable [29,31]. Additionally, under heat treatment conditions, MUF adhesives have demonstrated superior performance compared to PRF adhesives [32]. Thus, the adhesive used for the sample test in this study was a 2-component MUF adhesive. Cohesive behaviour is a significant advancement in fracture mechanics and finite element modelling, and it has been used in several fields of timber engineering, especially in the investigation of the delamination process [24]. Therefore, the cohesive modelling technique was selected to model the glue in the finger joint connection. It should be noted that cohesive and adhesive are not interchangeable terms and have different meanings. Cohesive refers to the ability of materials to resist being pulled apart. Adhesive, on the other hand, refers to a substance used to bond two surfaces together. In this case, adhesive refers to the glue used in the finger joint connection that is being modelled using the cohesive modelling technique. A detailed procedure for evaluating adhesive constants can be found in the previous publication [33]. The cohesive behaviours of the glue consist of the linear elastic traction–separation, damage initiation, and damage evolution behaviours, as illustrated in Figure 2. The linear elastic traction–separation behaviour is given in the following equation:
σ n σ s σ t = K n 0 0 0 K s 0 0 0 K t δ n δ s δ t
where σ n is normal stress; σ s and σ t are shear stresses; δ n is the separation in the normal direction; δ s and δ t are the separation in the transverse direction; and the K n , K s , and K t parameters are the initial stiffness. When the cohesive behaviours of the glue reach the maximum stage, the damage to the glue starts. The damage initiation can be defined using the peak values of the contact stress or the peak values of the separation. In this study, the quadratic stress damage initiation criterion was found to be suitable to model the flexural behaviour of finger-jointed spruce beams. The quadratic stress damage initiation is given as follows:
σ n σ n max 2 + σ s σ s max 2 + σ t σ t max 2 = 1
where σ n m a x , σ s m a x , and σ t m a x are the maximum traction, as depicted in Figure 2. In this study, the elastic and damage initiation material properties of MUF adhesive in the finger-joint interface were obtained from the literature [11,22], as presented in Table 1. According to Tran et al. [11], these cohesive parameters were determined as design variables and identified with a parametric study using a Python script file to achieve the numerical curve that best fitted the experimental data. Readers are encouraged to refer to Refs. [11,22,30,34,35] for further detail on the determination of the cohesive parameters.
After reaching the damage initiation criterion, the stiffness of cohesive behaviours is degraded following the damage evolution law. A scalar damage index, D , is used to represent the overall damage to the glue. The damage index D affects the traction of cohesive behaviours as follows:
σ i = 1 D σ i u n d i = n , s , σ
where σ i u n d is the traction predicted with the elastic traction–separation behaviour (i.e., no damage). For the linear softening of cohesive behaviours, as shown in Figure 2, the evolution of the damage index D is defined as follows:
D = δ m f δ m δ m 0 δ m δ m f δ m 0
where δ m is the effective separation, which is computed as follows:
δ m = δ n 2 + δ s 2 + δ t 2
In Equation (13), δ m 0 and δ m f are the effective separation at damage initiation and complete failure, respectively. It was reported in the study conducted by Khelifa et al. [22] that for finger-jointed spruce beams, the normal and shear separation at complete failure are 0.0021 mm ( δ n f ) and 4.7 × 10⁻⁵ mm ( δ s , t f ), respectively. The effective separation δ m f at complete failure can be computed from δ n f and δ s , t f using Equation (14).

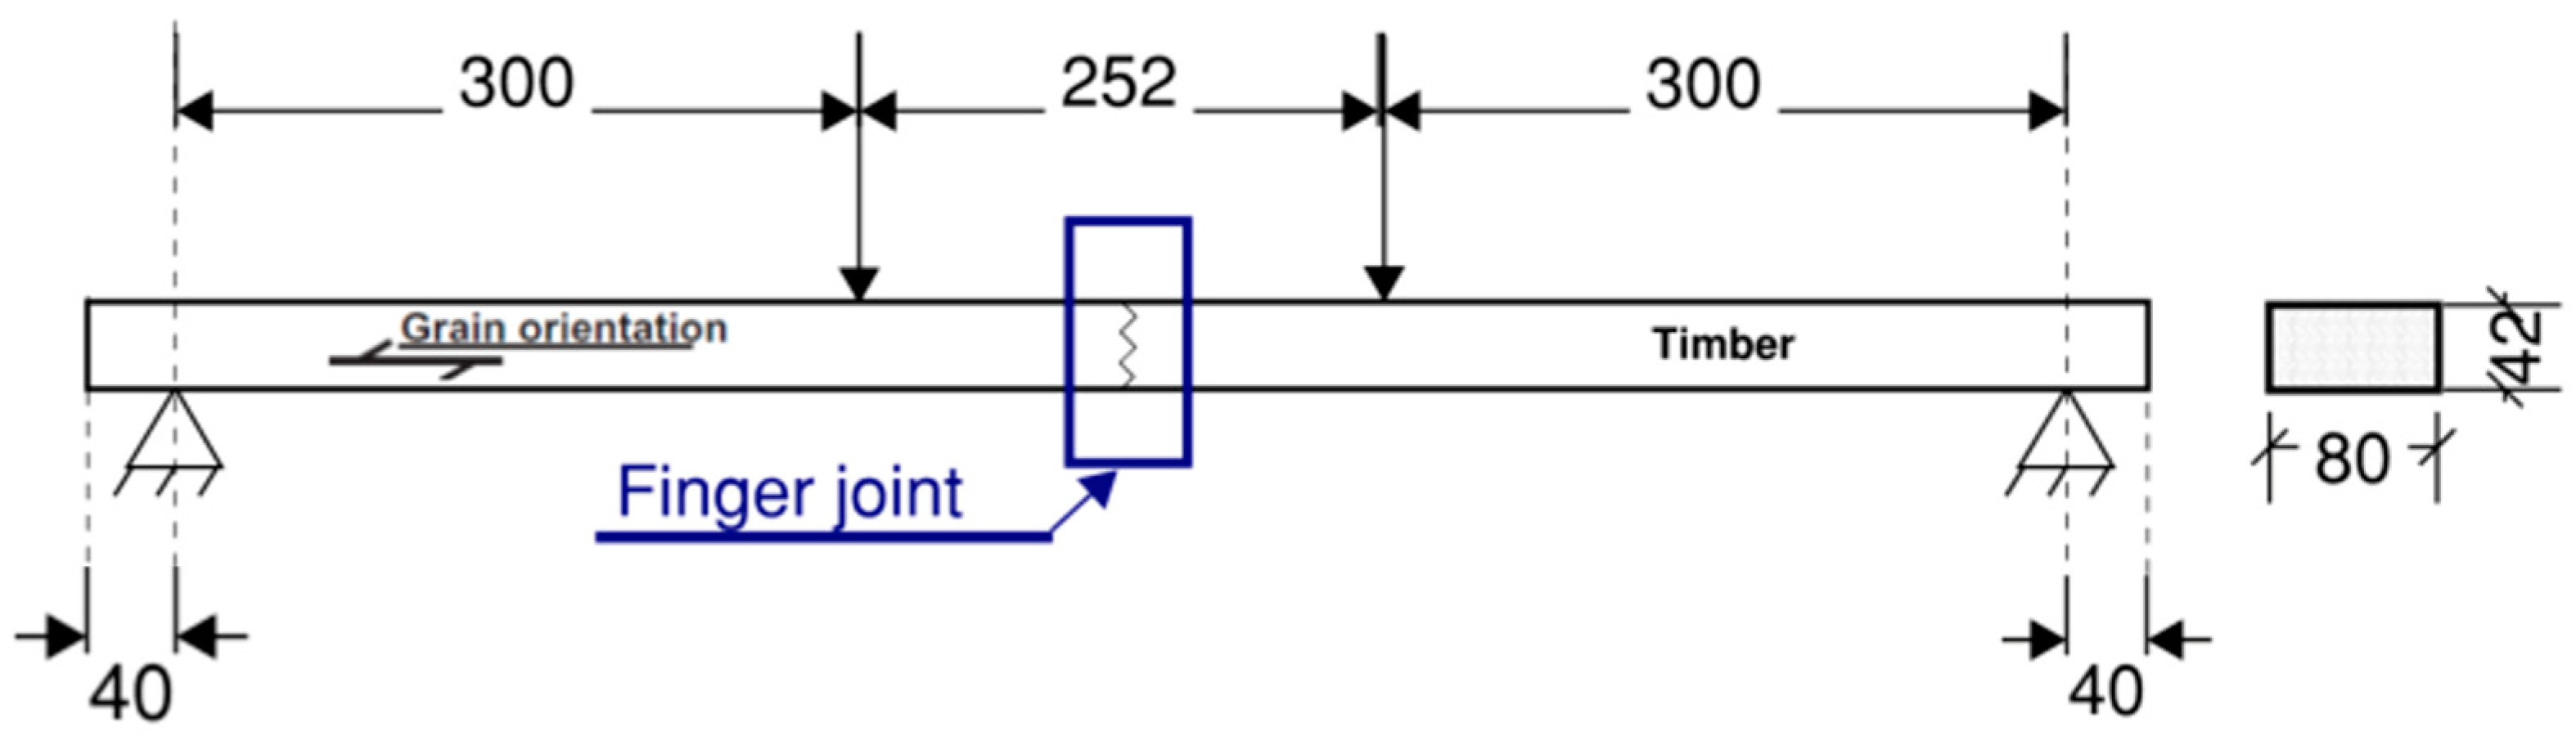
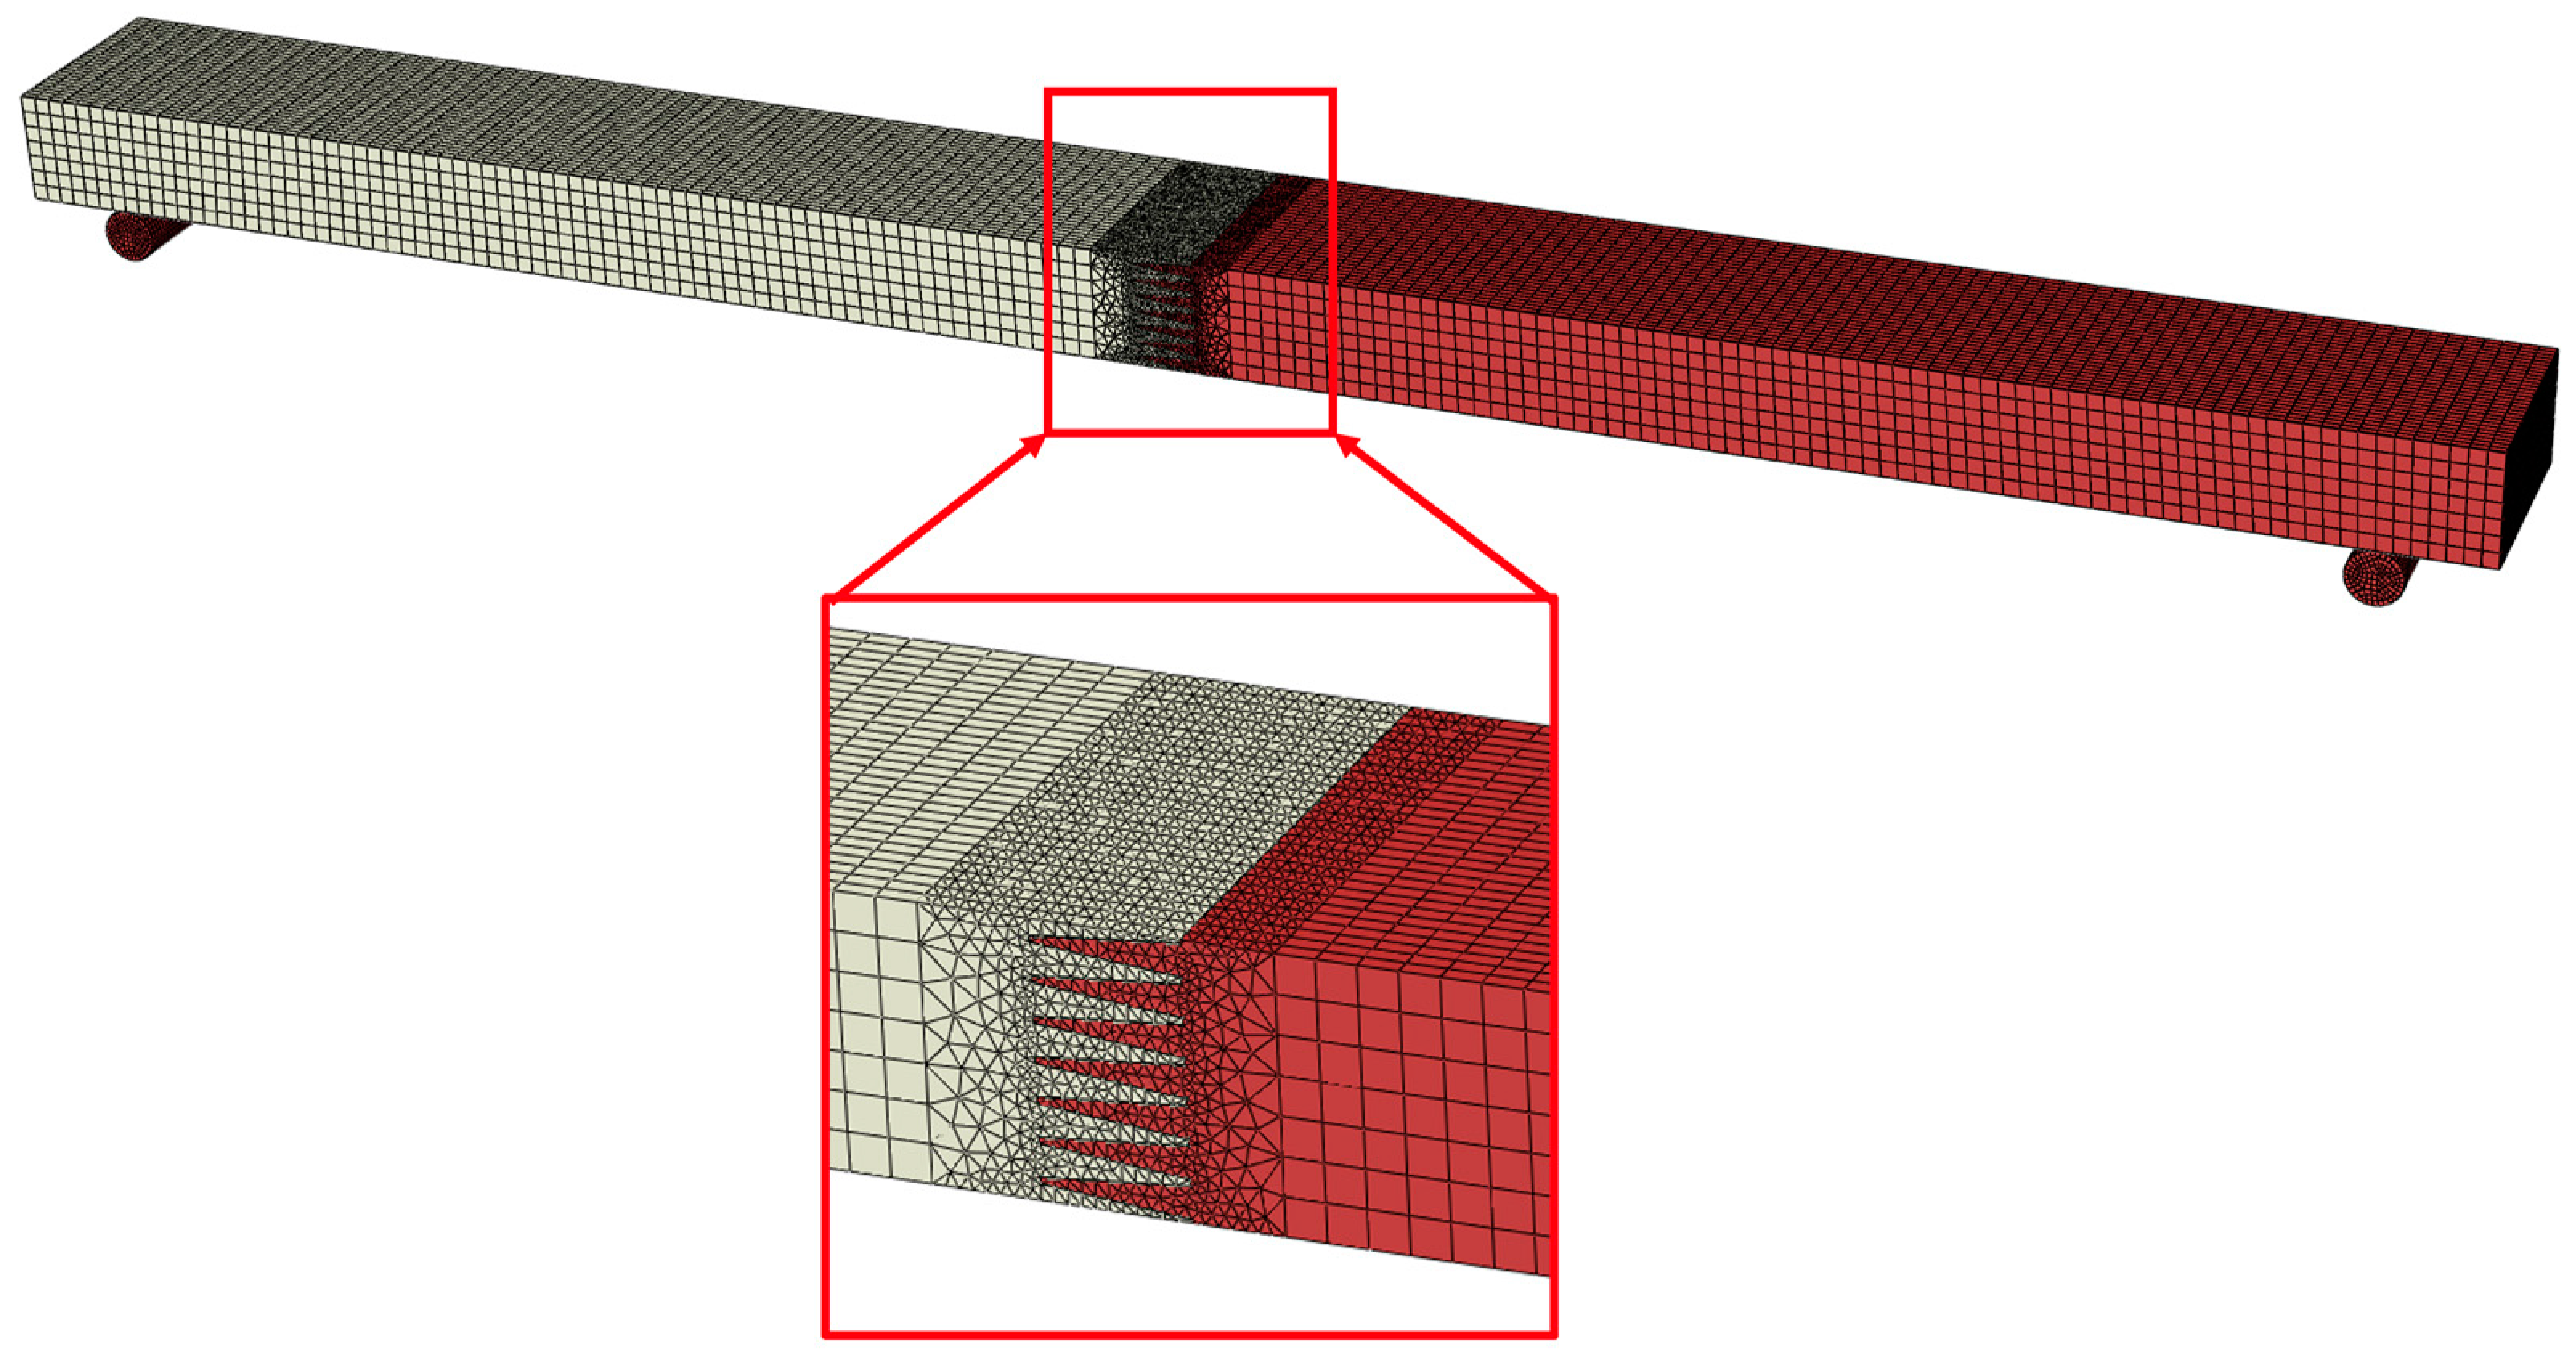
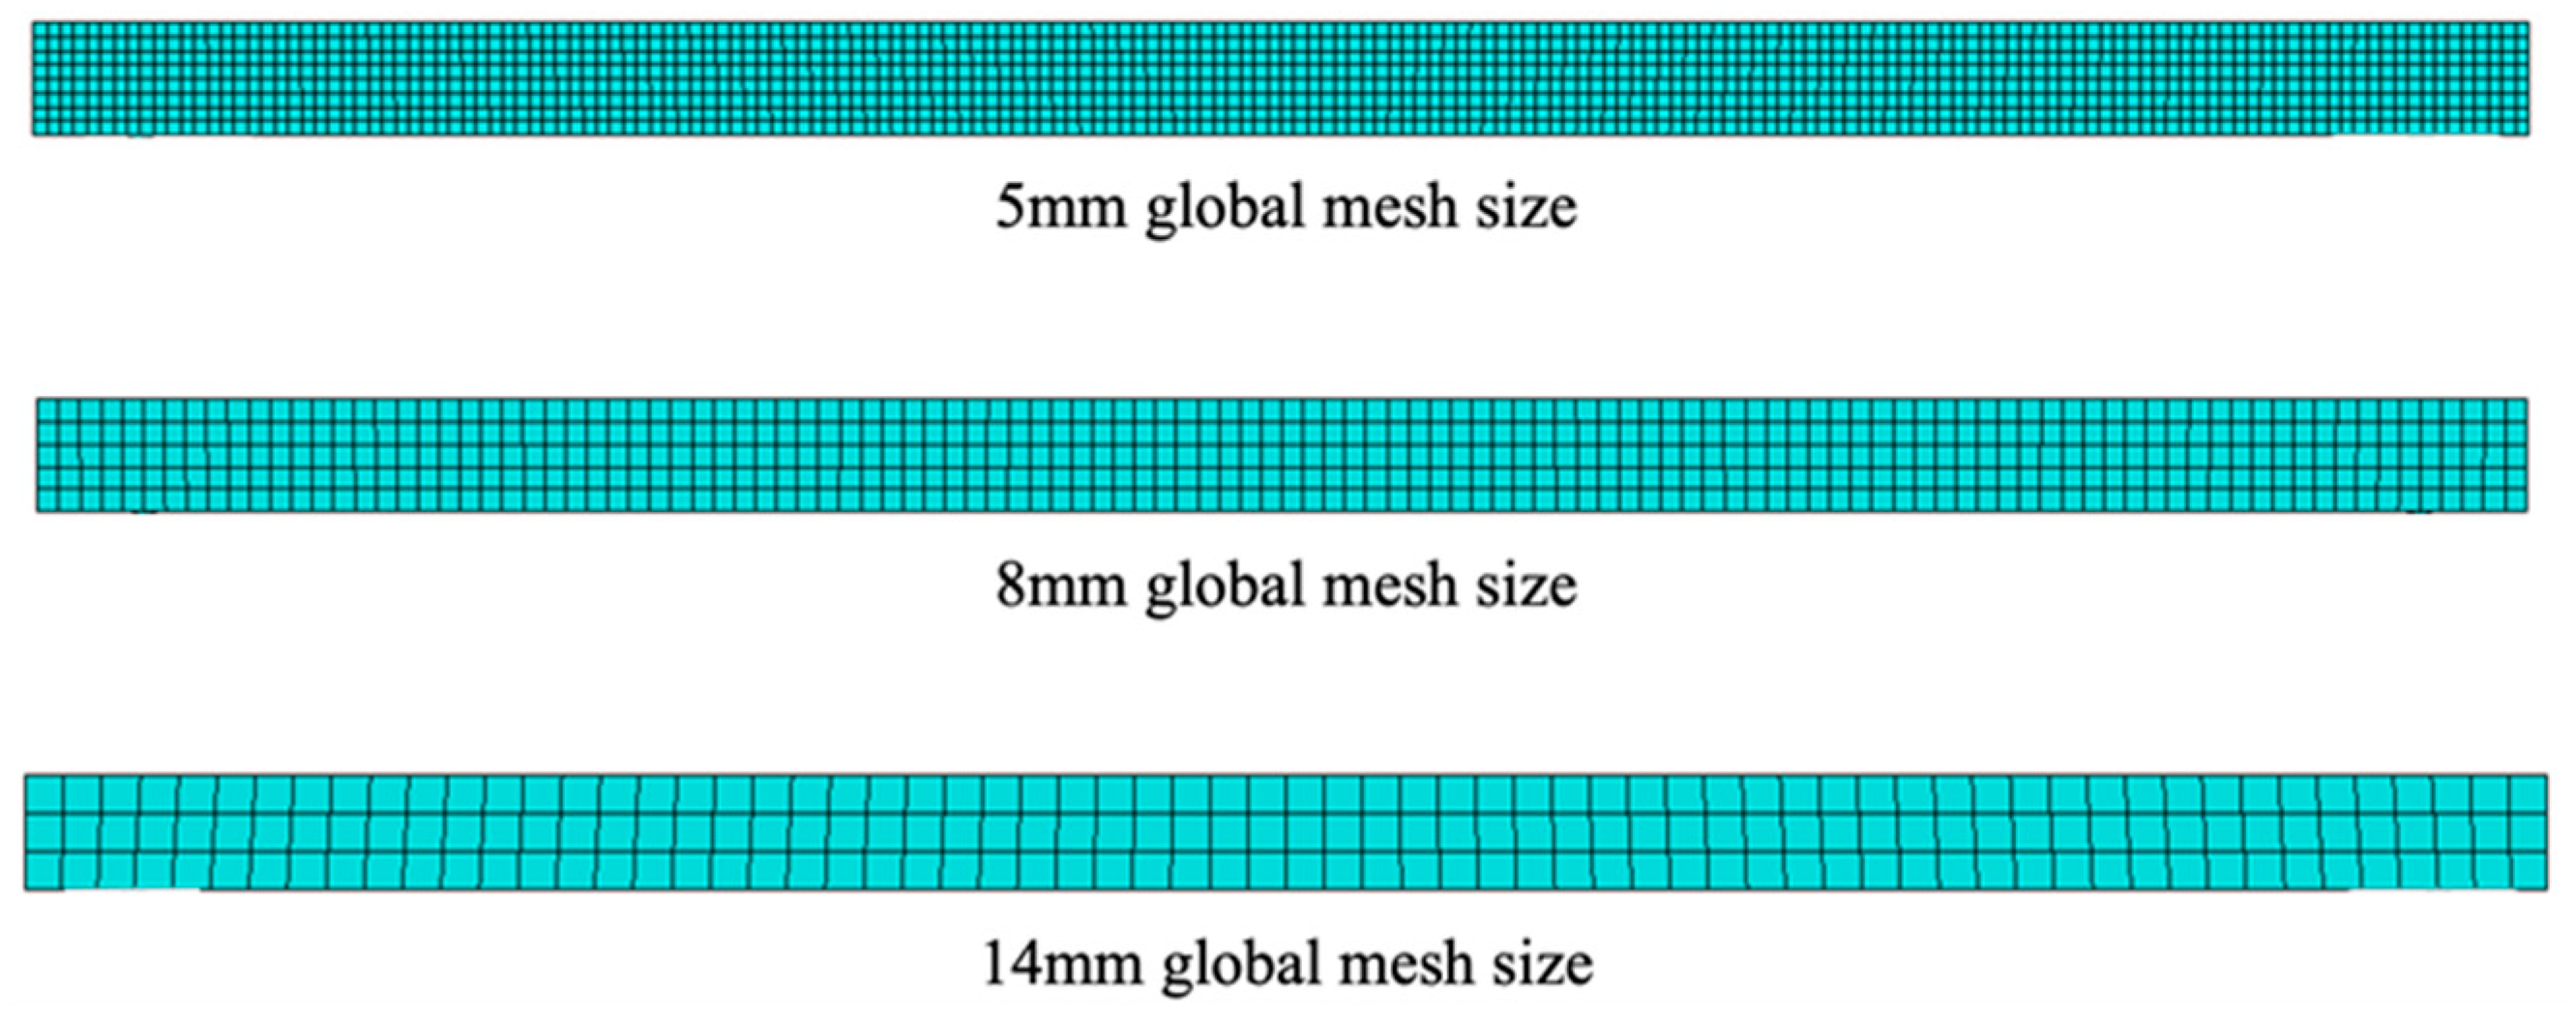
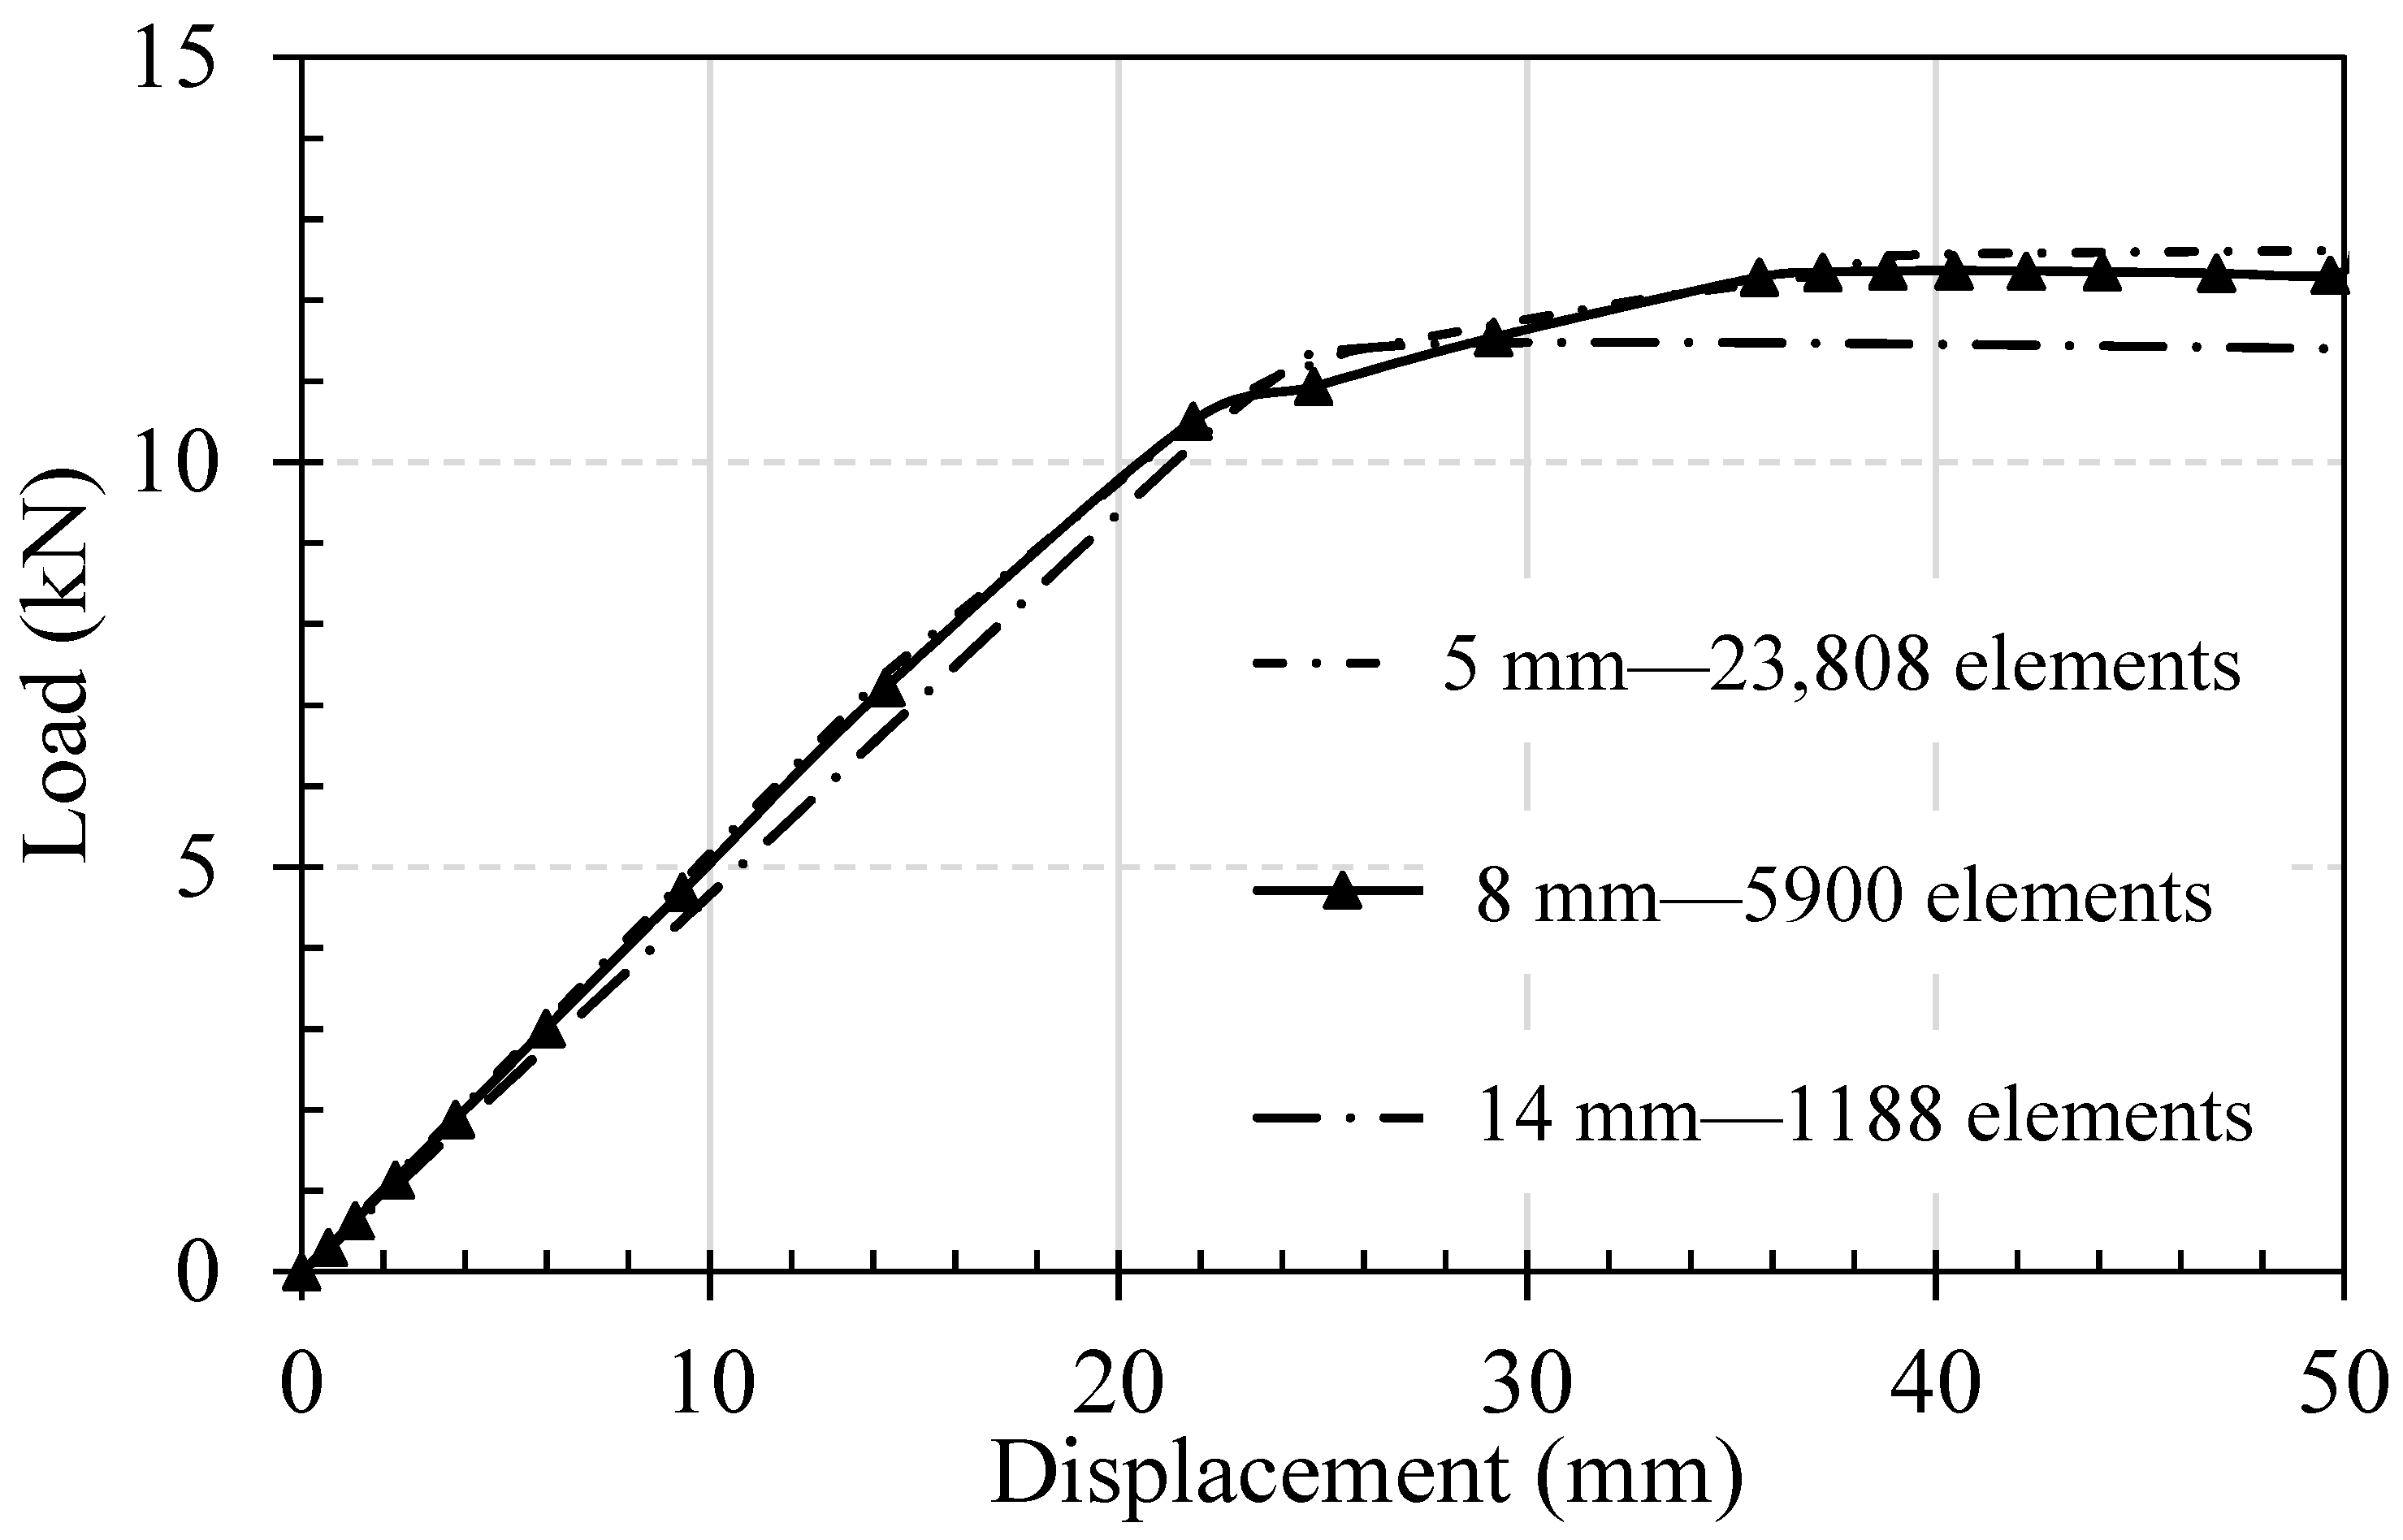
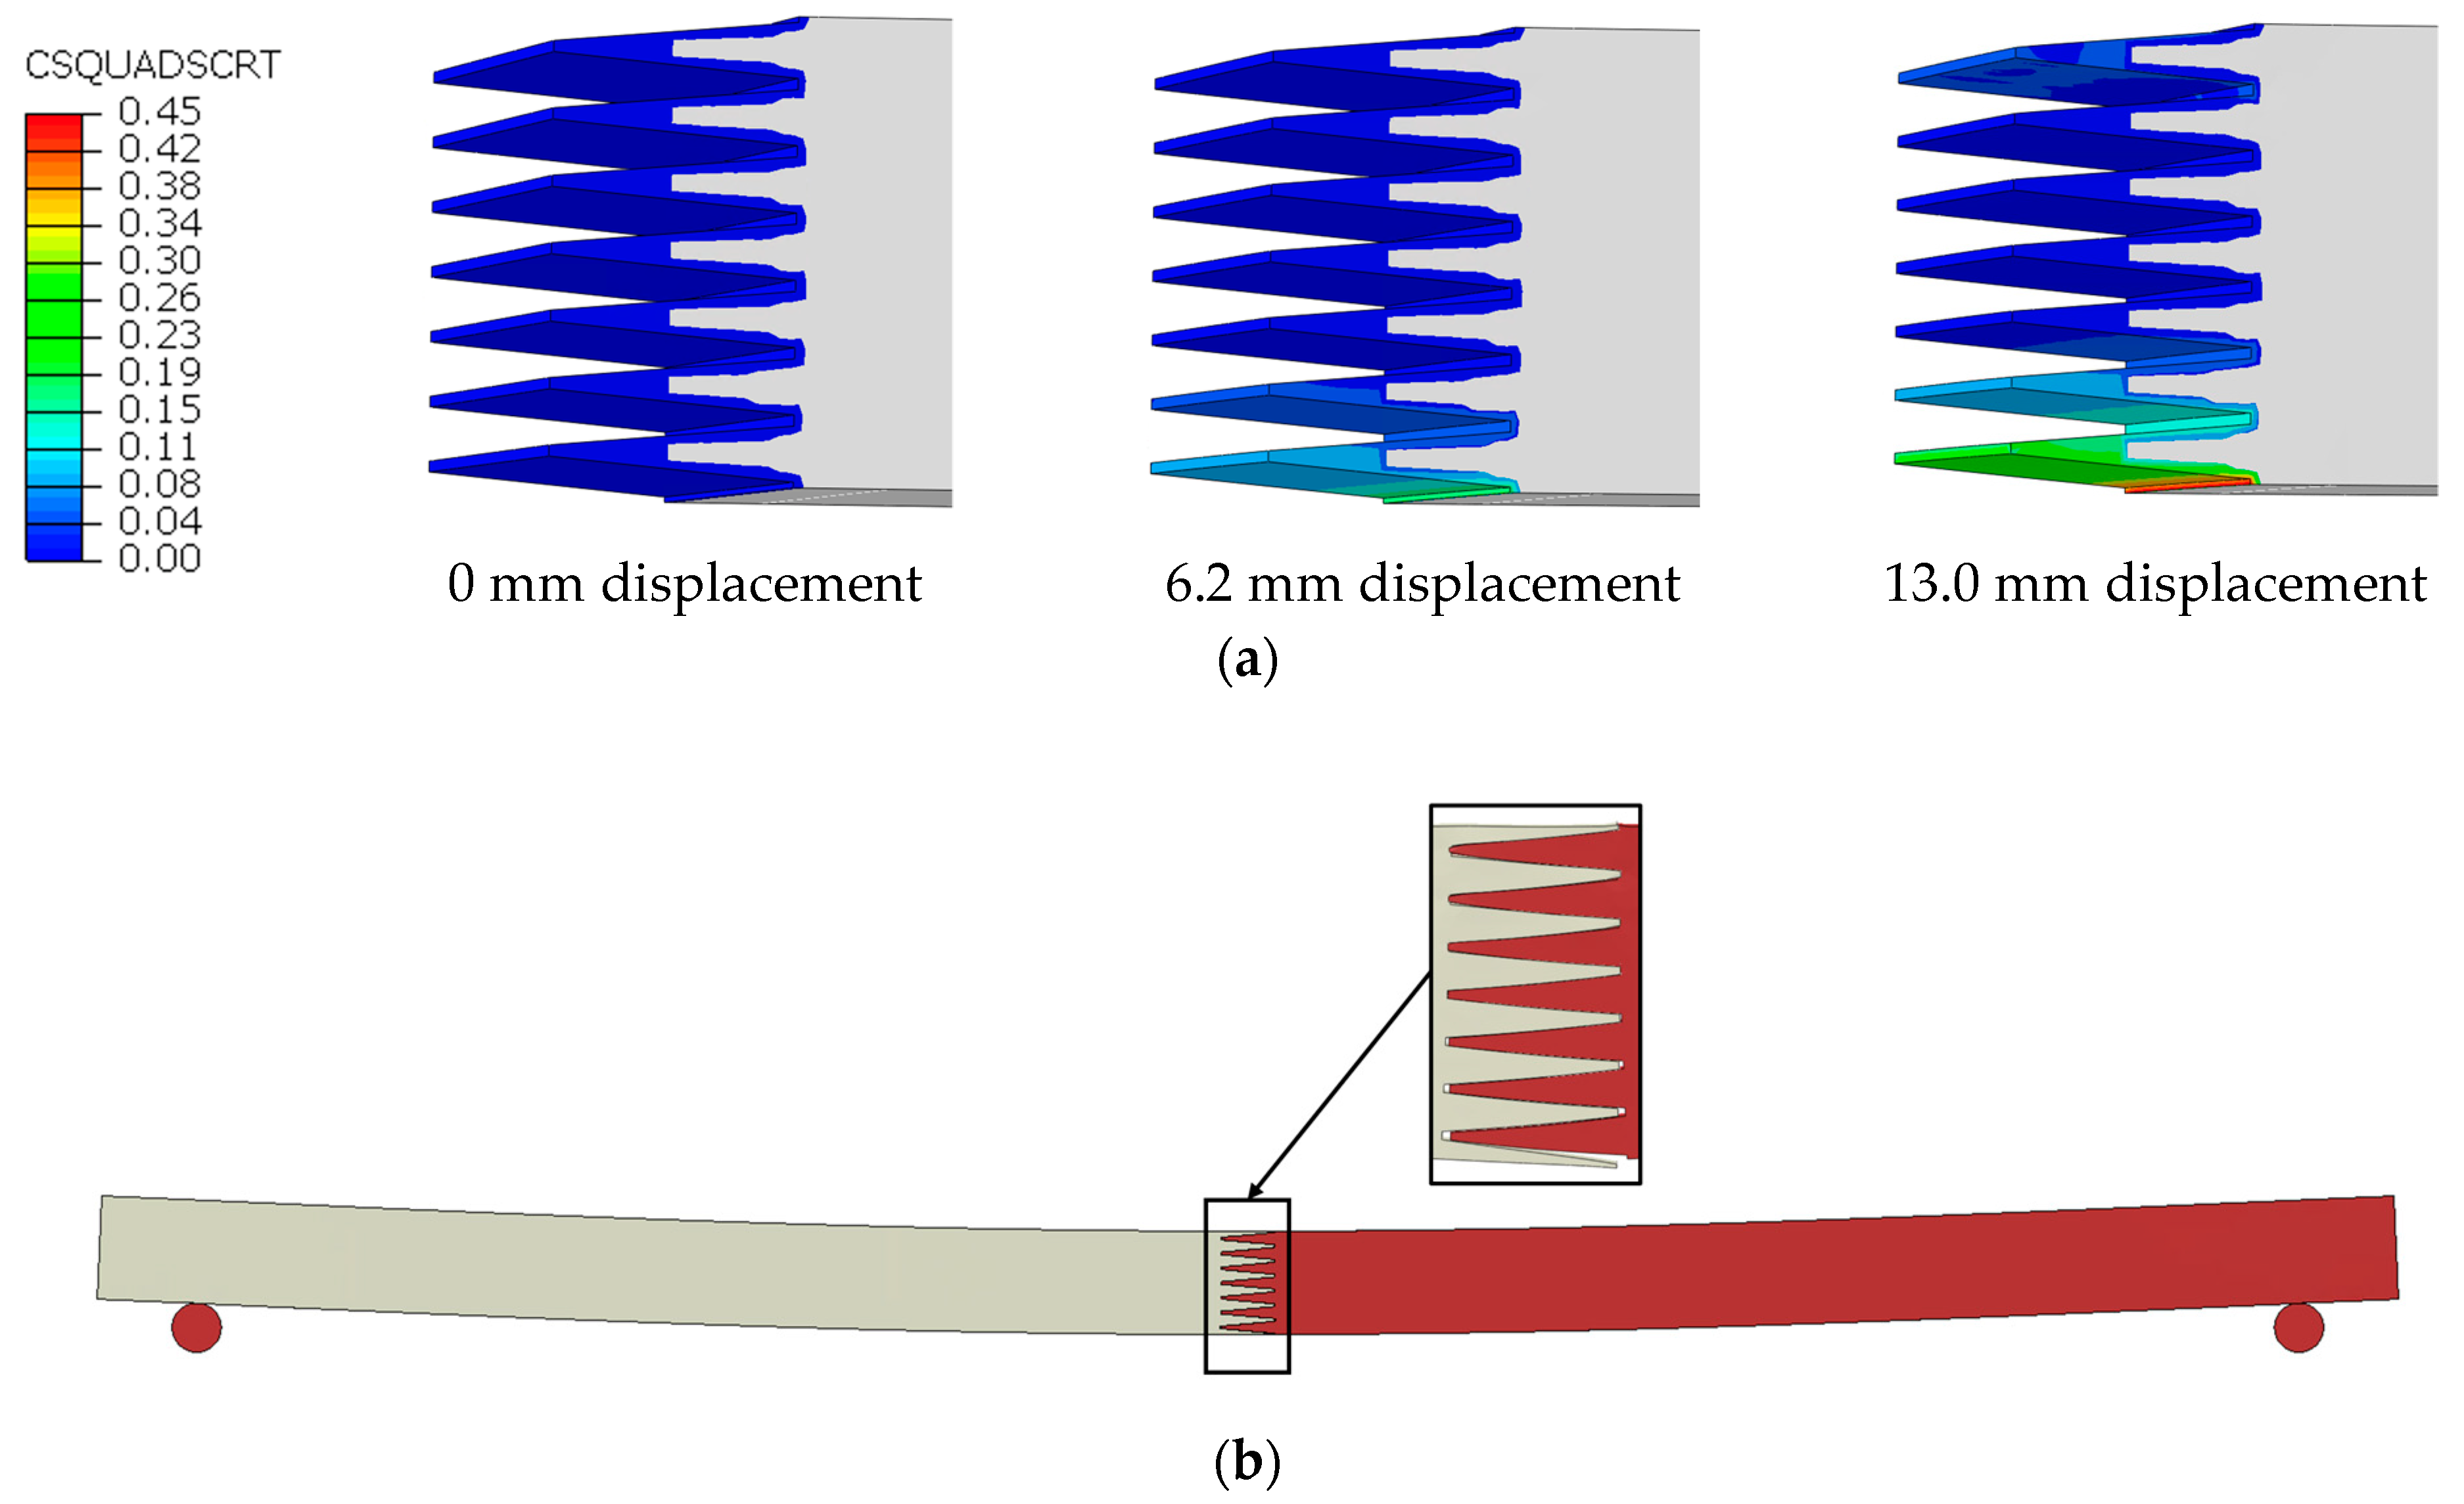
2.2. Finite Element Model

In this study, the four-point bending test of the finger-jointed spruce timber beam (Figure 1) was modelled using the Abaqus FEM package. The 3D model of the beam with a finger joint is presented in Figure 3.
The 3D FE model for the finger-jointed timber beam consists of three parts: a left beam, a right beam, and supporting steel bars. The left and right beam parts were modelled with the anisotropic elastic–plastic constitutive law presented in the previous section. The left and right beams were connected at the finger joint using cohesive contact behaviour, as presented in Section 2.1. The majority of the beam was meshed using hexahedral elements (C3D8R), as presented in Figure 3. At the finger-joint region, an adaptive meshing technique with tetrahedral elements (C4D4) was used to achieve the good quality meshing of complex finger-joint geometry, as shown in Figure 3. A mesh convergence study was performed to examine the effect of mesh size on the numerical results. The steel bars with a diameter of 20 mm and a length of 42 mm were modelled with C3D8R elements (mesh size of 2 mm). The steel bars were assumed to behave elastically (E = 200 GPa and v = 0.29) in the numerical simulation.
In the numerical simulation, fixed boundary conditions (BCs) were applied at the bottom of the supporting bars. The displacement BCs were applied at the two loading locations. A surface-to-surface contact was used to simulate the interaction between the beam and supporting bars. In this study, the numerical simulations were performed using the Abaqus/Standard solver. The convergence of simulations due to material and geometrical nonlinearity, as well as the failure of the glue, was an important issue that required thorough investigation. In this study, a small-time increment and a large number of allowable increments were used to overcome the convergence issue and achieve the converged solutions from the simulations.

3. Optimization Method and Implementation

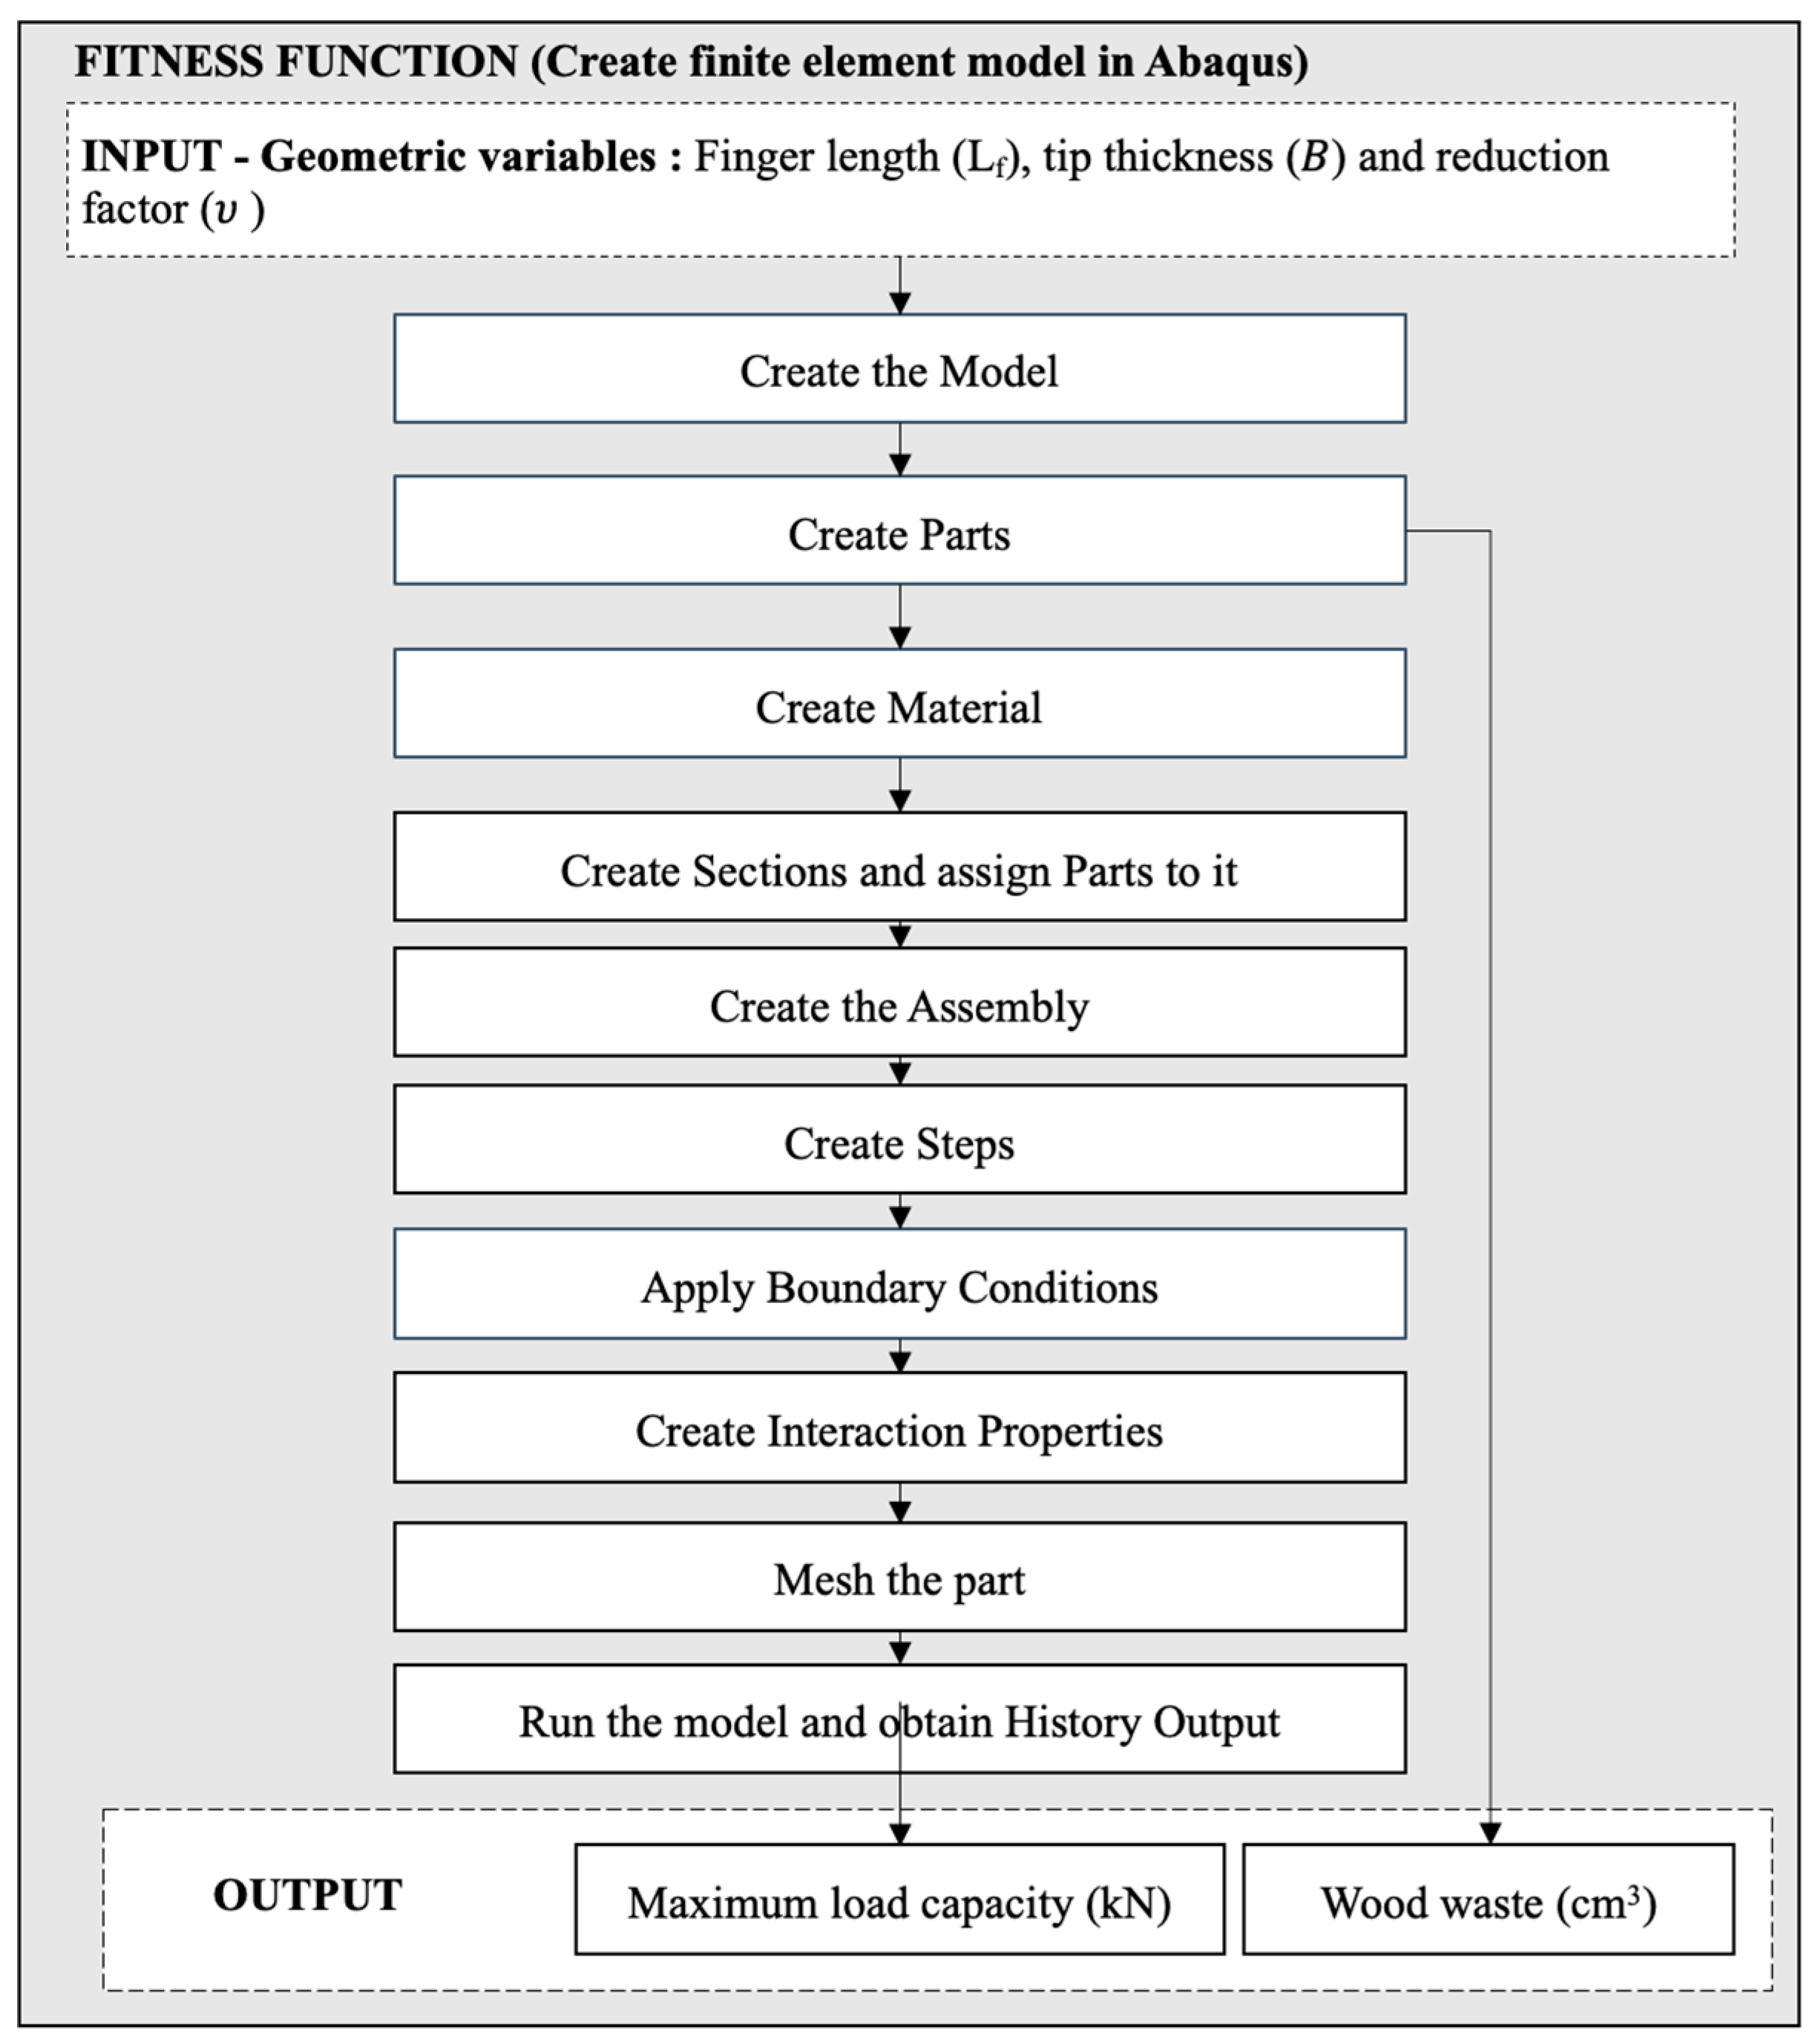
3.1. Automated Simulation Framework for Parametric Study

In order to investigate the effect of the finger joint design parameters on the flexural performance of finger-jointed timber beams, the 3D FE model presented in the previous section is further developed in this section. Firstly, the FE model was fully automated and parameterised using Abaqus/Python scripting to independently investigate the effect of the finger length ( L f ), tip thickness ( B ), and the number of finger joints ( n ) in parametric studies. This investigation provided a preliminary understanding, and the results were verified against observations from the literature to ensure the robustness and versatility of the FE model.
The rational selection of the parameters ( L f , B ,   a n d   n ) for the parametric study is explained as follows. Rao et al. [36] recommended that the tip thickness ( B ) should be from 0.4 mm to 0.8 mm to maximise the structural performance. Moreover, in an experimental study reported by Khelifa et al. [22], the tip thickness ( B ) was 1 mm. As a result, the tip thickness ( B ) was chosen to vary from 0.4 mm to 1.2 mm in this study. For the finger length ( L f ), Rao et al. [36] examined the performance of finger joints with the finger length varying from 12.7 mm to 28.27 mm. In another study, Tran et al. [11] used finger lengths ranging from 15 mm to 30 mm. Therefore, the finger length ( L f ) was varied from 10 mm to 34 mm in this parametric study. On the other hand, the number of fingers is influenced by the reduction factor υ , which is a ratio of the tip thickness ( B ) to the pitch ( h ) . As the total depth of the beam ( H ) is constant, the number of fingers ( n ) is calculated as follows:
n = H h
According to the EN 15497 [37] standard, the reduction factor υ must be less than or equal to 0.2. Therefore, the number of fingers ( n ) varied from two to nine in this parametric study. Using the automated simulation framework, an FE model for each combination of ( L f , B ,   a n d   n ) was generated, meshed, and analysed automatically. The numerical results were also extracted and analysed automatically for this parametric study.
Apart from the maximum load capacity, the total volume of the wood waste is also considered in this study. As shown in Figure 4, the wood waste is the total loss of volume due to the fabrication of the finger joint. This waste volume can be obtained from the timber beam geometry.
A flowchart showing the Python scripts (so-called fitness function used in the later section) is presented in Figure 5.

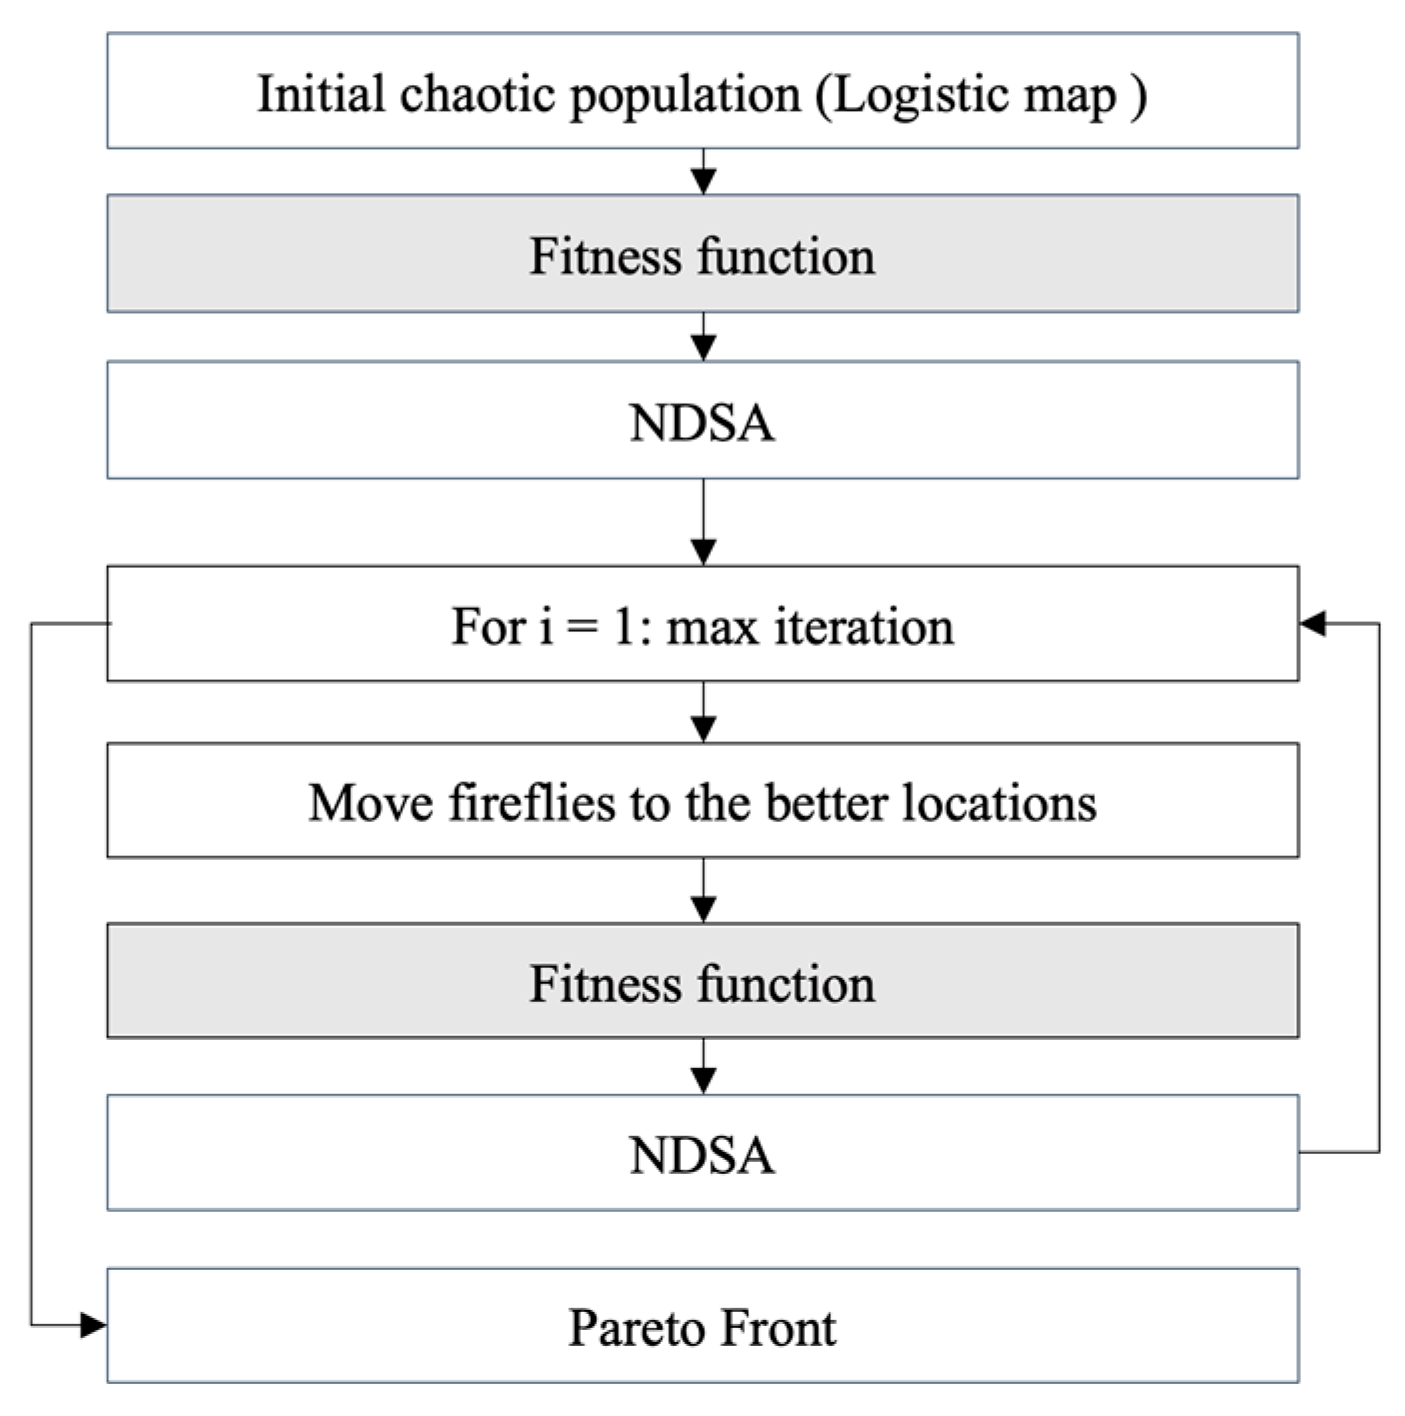
3.2. Optimisation Algorithm

The proposed multi-objective modified firefly algorithm (MOMFA), which is based on our previous work [18,19,20,21], was used to determine the finger joint variables. The conventional FA introduced by Yang [38] is based on three idealized rules:
  • The attractiveness of each firefly attracts other fireflies.
  • The attractiveness of a firefly is proportional to its brightness and decreases as the distance increases.
  • The objective function determines the brightness of a firefly.
Chou and Ngo [39] and Bui et al. [18] developed a modified firefly algorithm (MFA), which incorporates auxiliary elements, such as chaotic maps, AIW, and Lévy flight, to enhance the performance of the traditional FA. The initial population is initially generated using a logistic map [39,40]:
X n + 1 = η X n 1 X n , 0 X 0 1
The attractiveness of each firefly is determined as:
β = β c h a o s t β 0 e γ r i j 2 + β 0
β c h a o s t = 0 β c h a o s t 1 = 0 1 / β c h a o s t 1 m o d 1 otherwise
r i j = x i x j
where β is the firefly attractiveness at each iteration; β 0 is the firefly attractiveness at r = 0; and r is the distance between any two fireflies i and j computed using Equation (19). The chaotic parameter η is set to 4 and the absorption coefficient γ is set to 1 based on sensitivity analyses. Equation (20) depicts the movement of firefly i when it is attracted to another, more attractive firefly j :
x i t + 1 = x i t + β x i t x j t + α t s i g n [ r a n d 0.5 ] L é v y
The last term in Equation (20) is a randomisation term with α t that is modified with adaptive inertia weight and is calculated as:
α t = α 0 θ t
where α 0 = 1 is the initial randomisation parameter; θ = 0.9 is the randomness reduction constant based on sensitivity analyses and the literature; rand [ 0 , 1 ] is a random number generated with a uniform distribution in 0 , 1 ; and is entry-wise multiplication. Lévy flights are determined as follows:
L é v y ~ s = u υ 1 / τ
where u and v are determined with a normal distribution:
v ~ N ( 0,1 )
u ~ N ( 0 , Γ 1 + τ sin π τ 2 Γ 1 + τ 2 τ 2 τ 1 2 2 / τ )
where is τ = 3 / 2 and Γ is the Gamma function, as determined using Equation (25):
Γ z = 0 t z 1 e t d t
A Pareto-optimal was used in the multi-objective optimisation in this study. To locate solutions in the Pareto optimum set, MOMFA was performed to determine the collection of non-dominated solutions:
P F = s S | s S : s s
where S is the solution set and is the non-dominance relationship. Based on Pareto dominance, solutions in a population P are separated into disjoint subsets and ranked based on a non-dominated sorting algorithm (NDSA). Readers are encouraged to refer to [41] for a detailed NDSA.
Figure 6 depicts an entire flowchart showing the MMOFA. It is worth mentioning that the fitness function can be found in Figure 5. The number of samples and the maximum number of iterations in this study were 30 and 50, respectively.

4. Results and Discussion

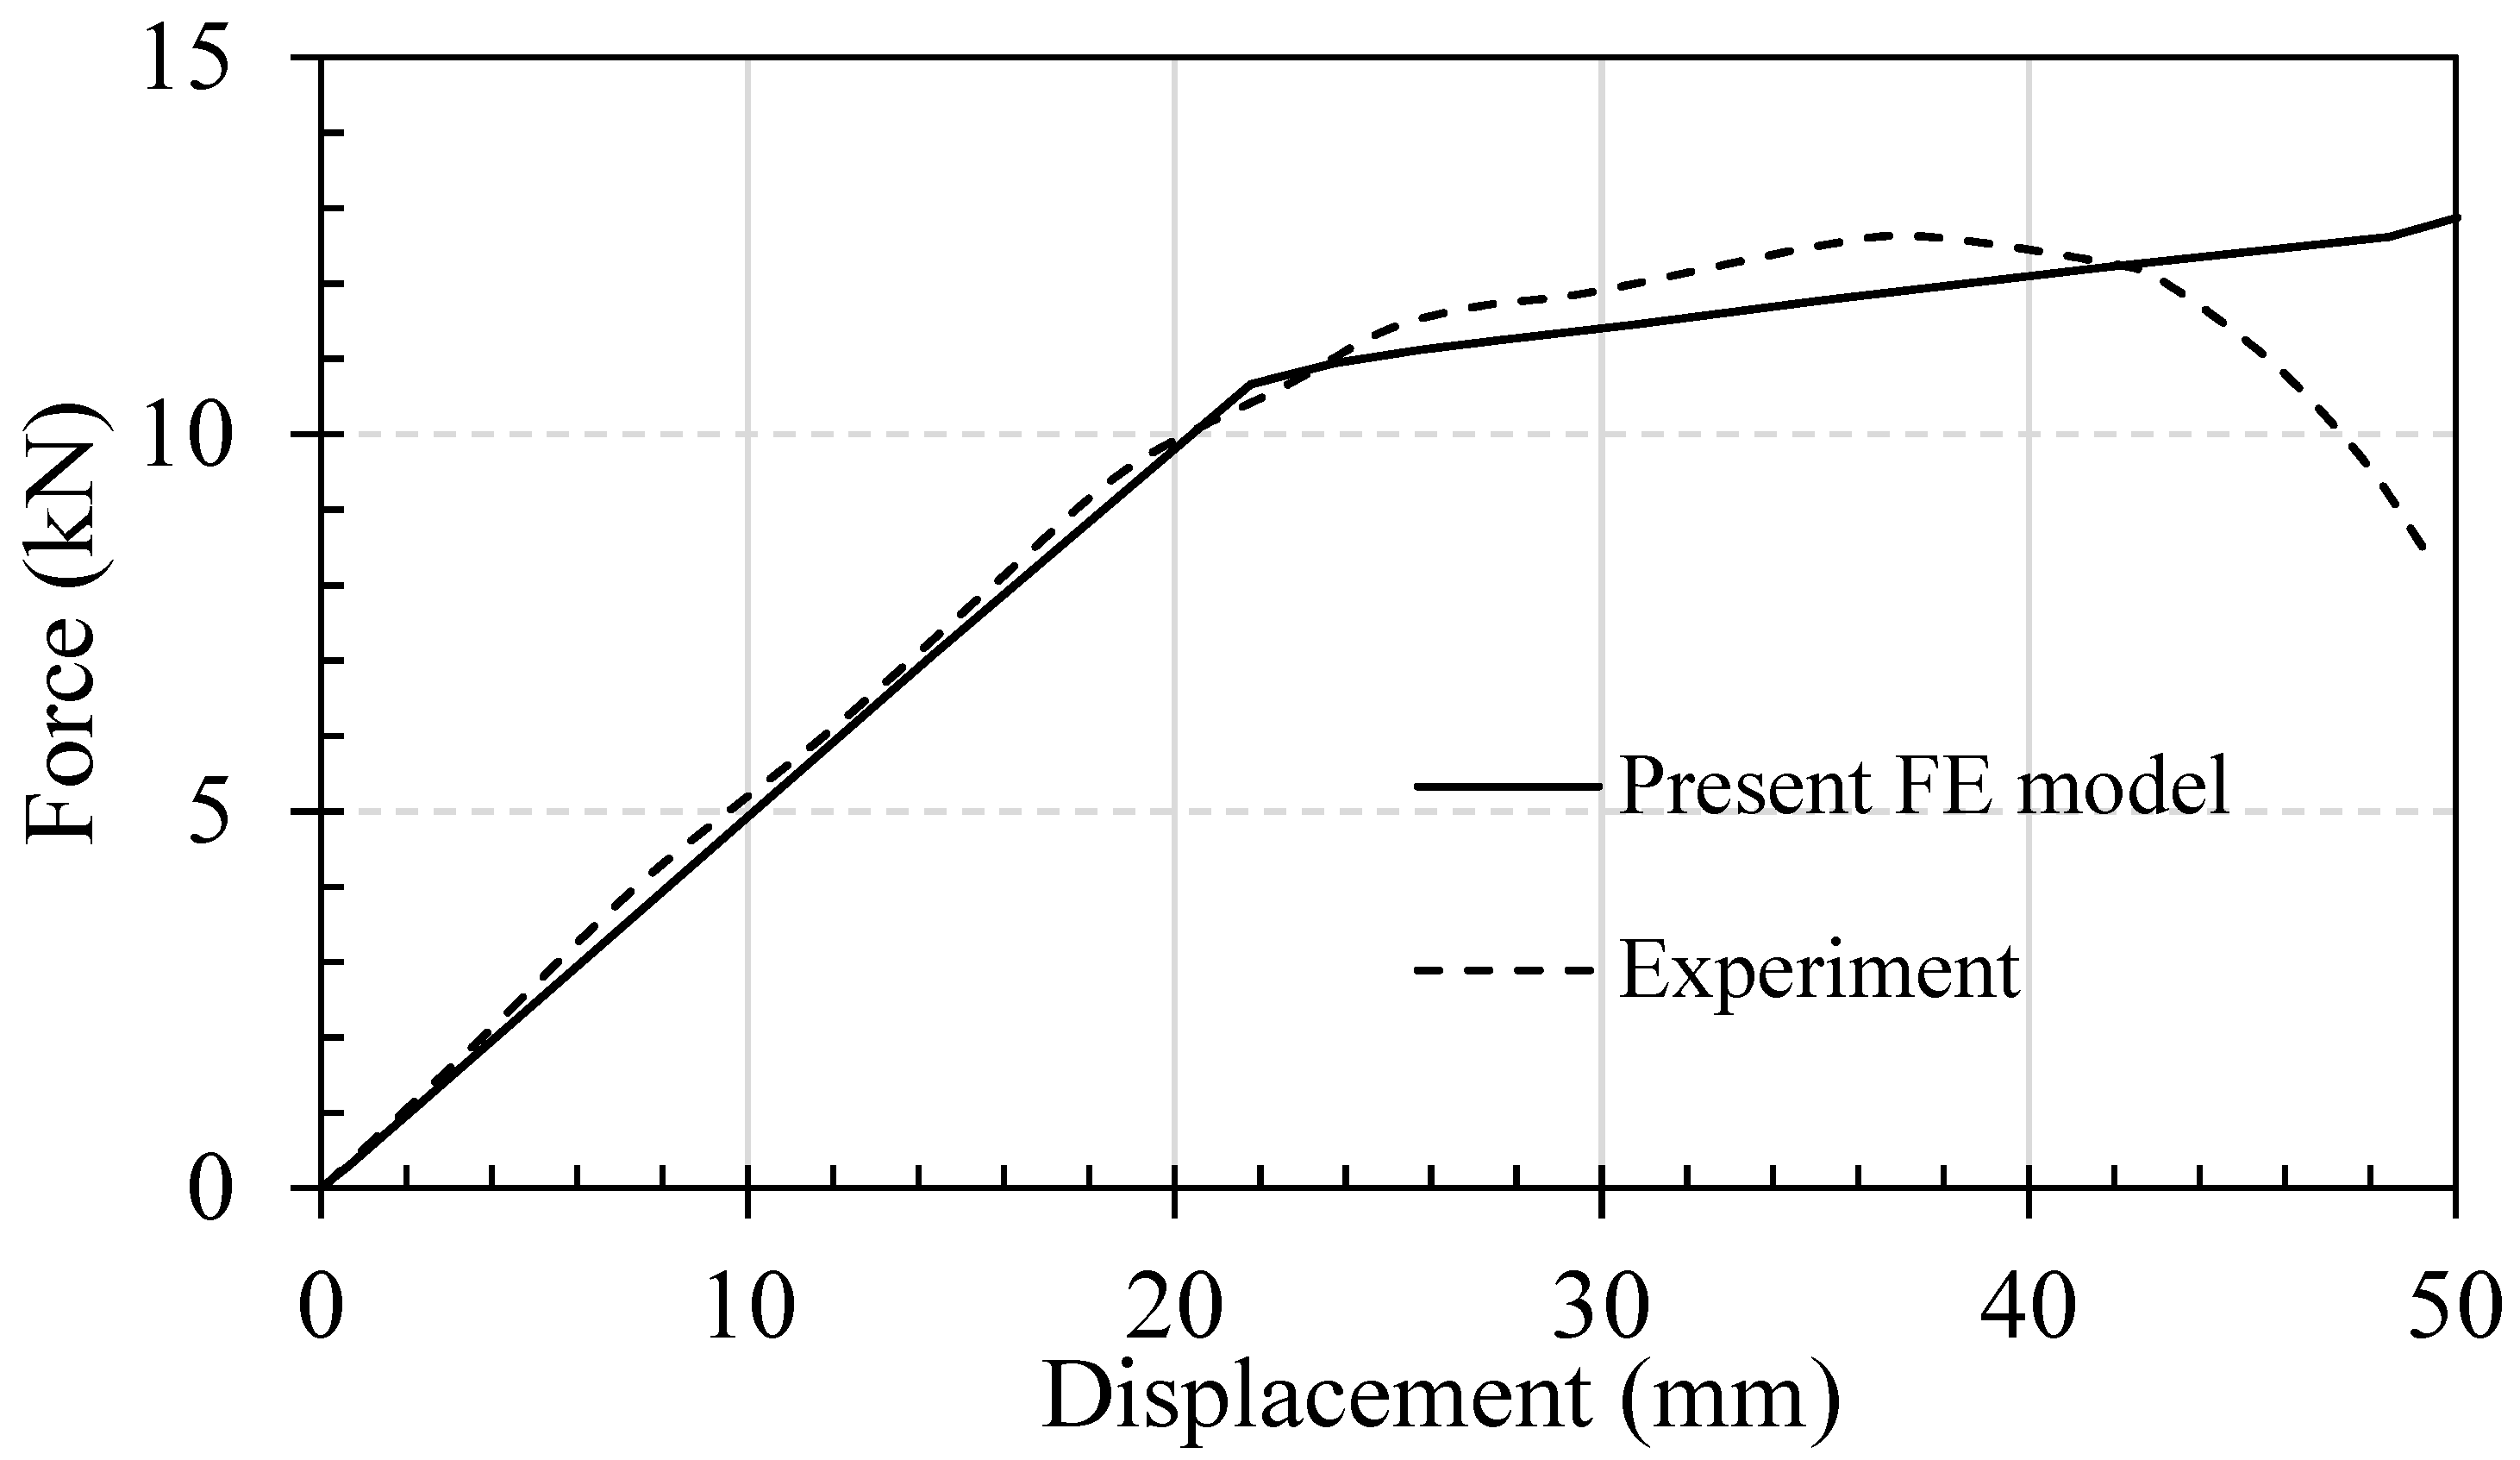
4.1. Model Validation

In order to validate and assure the accuracy of the developed FE model, the numerical results were compared with the experimental results reported by Khelifa et al. [22]. First, the behaviour of the control beam (i.e., no finger joint) was used in the validation process. The experimental setup for the control beam was identical to that for the finger-jointed beam presented in Figure 1. Three mesh sizes (14, 8, and 5 mm) were investigated for mesh convergence, as shown in Figure 7. Figure 8 presents the effect of mesh size on the load-displacement results for the control beam. It can be seen that with the mesh size of 14 mm (1188 C3D8R elements), the mesh is coarse, as shown in Figure 7, and the numerical result has not converged yet. The models with mesh sizes of 8 mm (5900 elements) and 5 mm (23,808 elements) produce very similar results. As a result, the mesh size of 8 mm was used in the following numerical results.
Figure 9 presents the comparison between the present numerical result and the experimental result reported by Khelifa et al. [22]. Figure 9 shows that the developed FE model accurately captures the flexural behaviour of the control beam. It is also observed that the maximum load from the experiment is about 6% higher than that from the numerical simulation. This difference can be attributed to the effect of boundary conditions. In the numerical simulation, the surface-to-surface contact was assumed between the beam and supporting bars, which is a simplified representation of the actual boundary conditions in the experiment.
Next, a comparison between the FE modelling and the experiment on timber spruce beams with a finger joint was performed to validate the cohesive behaviours of glue lines at the finger joint. Figure 10 presents a comparison of the numerical and experimental load–displacement results of finger-jointed beams. Similar to the control beam, the experimental results were obtained from Khelifa et al. [22]. The numerical simulation was carried out for the vertical finger joint with a finger length L f of 22 mm, a tip thickness B of 1 mm, and the number of fingers n of 7. It can be observed from Figure 10 that the developed FE model can capture very accurately the flexural behaviours of the finger-jointed beam obtained from the experiments. The maximum load capacity obtained from the present FE model is 6.01 kN, whereas the average maximum load capacity obtained from the experimental tests is 6.58 kN (8.5% difference). The accuracy in the numerical results can be attributed to the careful investigation into the applicability of the Hill model presented above and the accuracy in cohesive modelling. Moreover, it can be seen that the behaviour of the finger-jointed beam is brittle, i.e., the finger-jointed beam behaves linearly up to the failure point. On the other hand, the control beam, as shown in Figure 9, behaves in a ductile manner. Khelifa et al. [22] reported that the failure of a finger-jointed timber beam occurs due to the failure of the glue lines at the finger joint. In particular, delamination takes place at the glue bond lines near the bottom of the beam and propagates towards the top of the beam. In the simulation, the CSQUADSCR index, which represents the quadratic stress damage criterion, as discussed in Section 2.1, Equation (13), was used to quantify the failure of the glue lines. If the CSQUADSCR index is equal to 0, there is no damage. Whilst a CSQUADSCR index of 1 indicates the completely damaged stage of the glue lines. Figure 11a presents the evolution of the CSQUADSCR index in the simulation at the beginning, at 6.2 mm mid-span displacement, and at 13.0 mm mid-span displacement. Figure 11a shows that the failure first occurs near the bottom of the finger joint and continues propagating towards the top. This results in the opening of the finger joint, as shown in Figure 11b. The observation from the numerical simulation is well-correlated with the experimental observation in Khelifa et al. [22]. The validation results (Figure 9, Figure 10 and Figure 11) demonstrate the accuracy and reliability of the developed FE model. It should be acknowledged that the density or specific gravity of timber, depending on the type of wood (hardwood or softwood), influences its mechanical properties, with higher values resulting in better performance. Additionally, the adhesive used affects the bending strength of the beam and can contribute to shear strength failure. While both adhesive and wood types are crucial for finger joint strength, investigating their effects was beyond the scope of this study, which focused on improving finger-jointed timber beam strength by modifying the finger joint geometry. The subsequent section presents a parametric study on different finger joint geometries, including finger length, tip thickness, and number of finger joints.

4.2. The Effect of Finger Joint Design Parameters

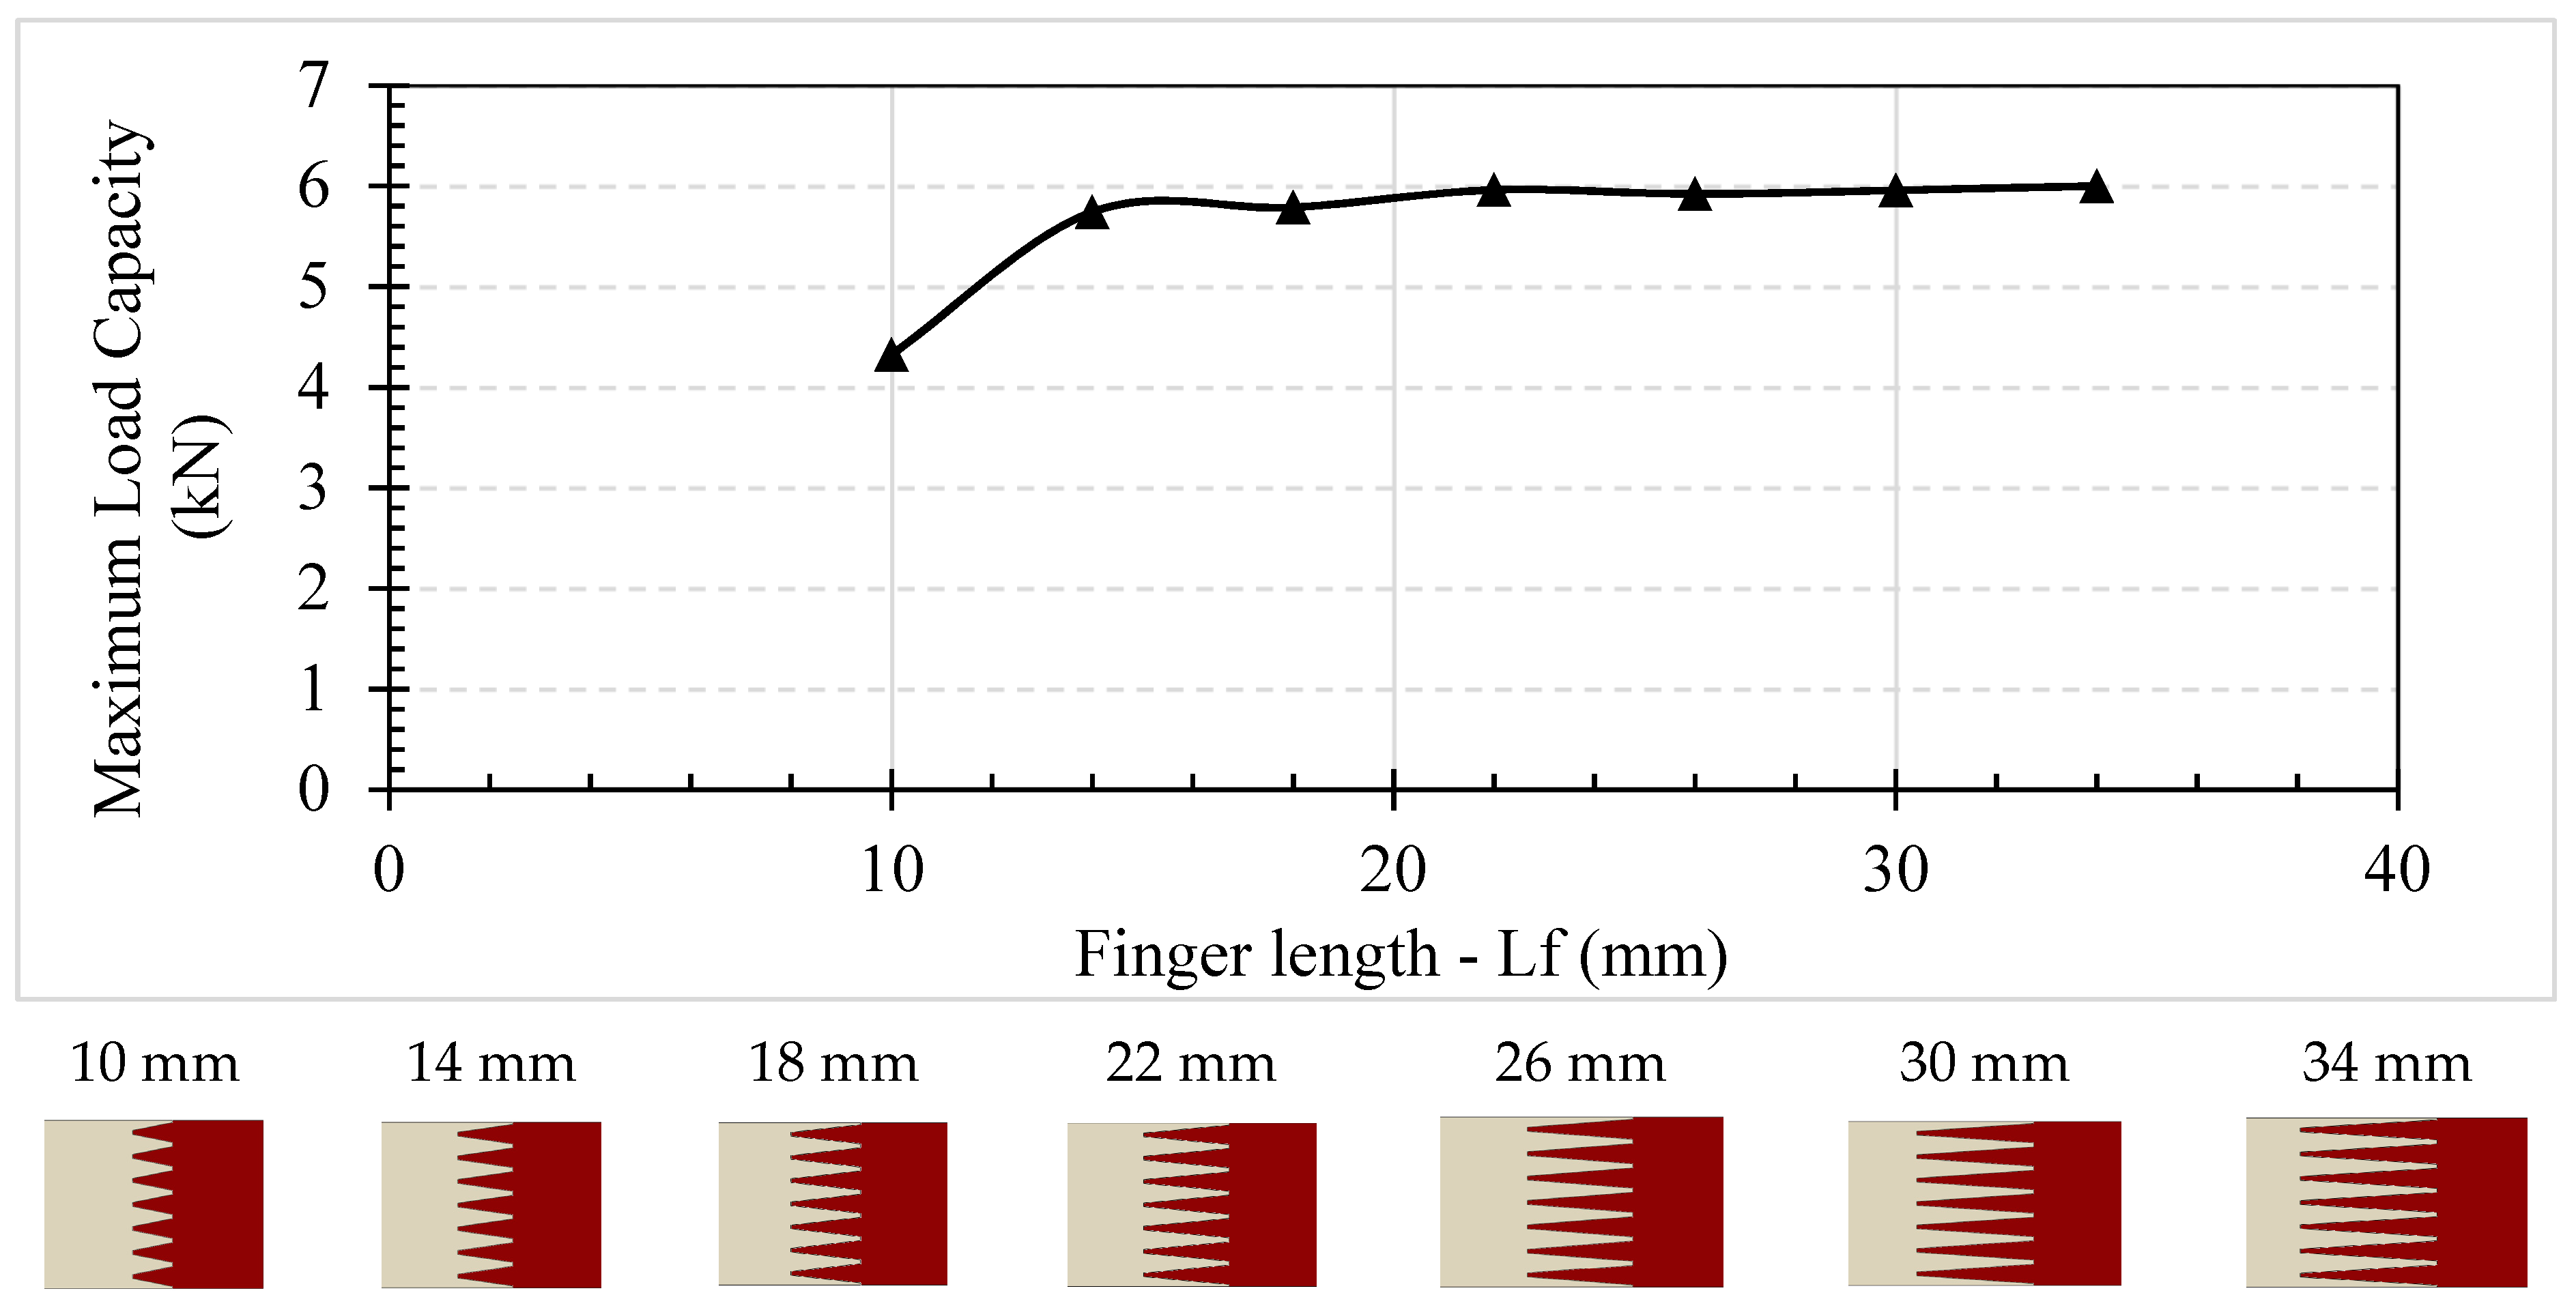
4.2.1. Impact of Individual Design Parameter

Using the validated FE model, this section presents the results for the effect of finger joint parameters on the flexural performance of finger-jointed timber beams using a series of parametric modelling. To assess the effect of the number of fingers, Figure 12 shows the normalised performance for a different number of fingers (n = 2–9), whilst the finger length L and tip thickness B were kept constant as 22 mm and 1 mm, respectively. Figure 12 clearly shows that increasing the number of fingers increases the flexural performance of the finger-jointed beam. This can be explained by the fact that more fingers result in a larger surface area of glue, hence improving the maximum load capacity [3]. The performance increase from 1.75 kN to 5.81 kN between two fingers and five fingers. However, Figure 12 also shows that the performance reaches a convergence point at five fingers. This thereby suggests that a threshold number of fingers (five fingers in this study) exists to maintain the optimal performance of a finger joint. When increasing the number of fingers above the threshold, the maximum load capacity does not increase significantly. According to Rao et al. [36], the pitch has a minimal effect on the timber joint strength. Since the pitch is related to the number of fingers, this further explains the flexural performance of the finger-jointed beam with respect to the number of fingers observed in Figure 12. In addition, the number of fingers is also governed by the reduction factor υ, as presented in Section 3. According to the EN 15497 [37] standard, the reduction factor υ is required to be less than or equal to 0.2. Using Equation (15), this means that the number of fingers should be less than 8 (with the given beam depth and tip thickness in this study) for an efficient design. The information from Rao et al. [36] and EN 15497 [37] standard is well-aligned with the numerical results presented in Figure 12.
Similarly, Figure 13 presents the effect of the finger length (Lf) on the flexural performance of the finger-jointed timber beam. As discussed in Section 3, the finger length L f varies 10 mm to 34 mm in this investigation. The number of fingers n and tip thickness B were kept constant at seven fingers and 1 mm, respectively. The result shows that the vertical bending strength of timber samples generally increases with the increase in the finger length. Figure 13 shows that the performance increases significantly as the finger length L f increases from 10 mm to 14 mm. Then, the increasing trend becomes flattened. According to the experiments conducted by Hu et al. [42], for the finger length of 13, 20, 25, and 35 mm, the influence of finger length (13–35 mm) on the flexural performance of finger-jointed beam is minimal. The experimental observation in Hu et al. [42] is confirmed with the numerical results presented in Figure 13. The results show that the performance of 14–34 mm finger length is very similar. Nonetheless, the present numerical result also shows that there is a dramatic drop in the performance (approximately 25%) when the finger length decreases from 14 mm to 10 mm. It is worth mentioning that the finger length less than 13 mm was not tested in the study of Hu et al. [42]. The result from Figure 13 also aligns with the common practice in the Canadian EWP industry, where the finger length typically ranges from 22 to 29 mm [43].
Figure 14 shows the normalised performance of the finger-jointed timber beam with respect to the variation in tip thickness ( B from 0.2 mm to 1.2 mm) while the number of finger joints n and finger length L f were kept constant at seven finger joints and 22 mm, respectively. In general, there are two clear patterns in the relationship between the tip thickness and the flexural performance of finger-jointed timber beams. From 0.2 mm to 0.7 mm, the relationship is fluctuating, whereas the performance increases when the tip thickness B increases from 0.7 mm to 1.2 mm. Nonetheless, it is worth mentioning that the impact of the tip thickness B (Figure 14) on the flexural performance of a finger-jointed timber is marginal, compared to that of the number of finger joint n (Figure 12) and finger length L f (Figure 14). The difference between the best and worst performance is only 0.15 kN, as presented in Figure 14.

4.2.2. Combined Impact of Design Parameters

Finger joint design parameters, such as finger length, tip width, pitch, and finger slope, are interrelated with one another and can have different effects on the timber beam, as discussed in other studies [7,22]. Therefore, this section examines the combined effect of the finger length ( L f ), tip thickness ( B ), and number ( n ) of fingers at the same time to find the best combination of design parameters. It is worth mentioning that this investigation requires a considerable number of simulations and would not be possible with a traditional brute-force search. Therefore, in this investigation, the MOMFA proposed in Section 3 is used to simultaneously maximise the load capacity and minimise the generated wood waste. As mentioned in Section 3, in this optimisation, the reduction factor ( υ ) varied from 0.1 to 0.2, the finger length ( L f ) varied from 15 mm to 30 mm, and the tip thickness ( B ) varied from 0.4 mm to 1.2 mm.
The two objectives of this study are mutually contradictory. Therefore, the MOMFA was used for the multi-objective design. There are two main methods for multi-objective design: the first is to combine all the separate objective functions into a single function using weighting criteria, and the second is to identify the entire Pareto optimum solution set. The second approach was used in this study. If a solution is dominant among other solutions in the solution space, it is said to be Pareto optimum. The performance of each solution is assessed primarily using the placement of its location closer to a preferred region with a higher maximum load capacity and a lower waste volume—the closer the solution is to the bottom right of Figure 15, the better performance. A convergence study was conducted to ensure the result from the MOMFA converged, and it can be observed that 50 iterations are sufficient for this study.
Figure 15 presents the optimisation results for the finger-joint beam. The white circles represent the baseline design. The maximum load capacity and the waste volume of the baseline design are 6.01 kN and 37 cm3, respectively. Each triangle represents an optimal solution obtained from the multi-objective optimisation using the MOMFA. In the traditional approach with only the load capacity objective being considered, the optimal solution with the highest load capacity on the top is chosen without considering the waste volume. This solution increases the finger joint resistance to 6.22 kN but incurs a waste volume of 53 cm3. However, the Pareto front indicates that the optimal solution for the bottom achieves a maximum load capacity of 6.18 kN while generating only 25 cm3 of wood waste. Compared to the previous option, the load capacity is only 0.64% smaller, but the waste volume is 53.31% lower. Therefore, it is necessary to have a holistic approach during the optimisation processes before choosing the best combination, which is the bottom optimal solution in this case. The baseline and best combinations are summarized in Table 2. The best combination of geometric finger joints not only increases the load capacity but also significantly reduces the waste generated during the joining process. Comparing the baseline and best combination in Table 2, it is observed that the number of finger joints increases while the finger length decreases. In this combination, fingers are closely packed together, which creates a higher tension between the joint as well as better bond-line areas between the fingers. This alleviates the need to make deeper cuts to fabricate the finger joint and reduces waste generation.

5. Conclusions

This study aimed to investigate the flexural performance of finger-jointed timber beams with respect to different finger joint parameters, including finger length, tip thickness, and number of finger joints. To this end, the advanced, three-dimensional (3D) finite element (FE) model was developed based on the Hill elasto-plastic constitutive law for the orthotropic material responses of timber and the cohesive modelling technique for the behaviours of glue lines at the finger joint. The developed FE model was validated with a comparison of the numerical and experimental results. The comparison shows that the numerical simulation can accurately capture the flexural behaviours (the maximum load capacity and failure) of timber beams with and without a finger joint. The discrepancies between the numerical and experimental are 6% (without a finger joint) and 8.5% (with a finger joint), respectively, for the maximum load capacity.
Using the validated FE model, a series of parametric modelling was conducted to investigate the effect of a finger joint, including the finger length ( L f ), tip thickness ( B ), and number ( n ) of fingers, on the flexural behaviour of a finger-jointed timber beam. From this comprehensive parametric study, it is concluded that the number of fingers ( n ) and finger length ( L f ) significantly influence the maximum load capacity, whilst the tip thickness ( B ) has a marginal effect on the performance. Furthermore, the results indicate that there exists a design threshold for the number of fingers and finger length to achieve an efficient, high-performance design of finger joints ( n = 5 and L f = 14 m m in this study).
In addition, the multi-objective modified firefly algorithm (MOMFA) was used to maximise the finger joint resistance while simultaneously reducing the generated waste material. These findings demonstrate that if waste reduction is not addressed, there will be a substantial amount of wood waste. The best combinations of design parameters ( n , L f ,   a n d   B ) can not only increase load capacity but also reduce the waste generated during the joining process. Therefore, it is necessary to consider the manufacturing process holistically. The holistic framework presented in this study can support researchers and engineers in effectively designing and optimizing the performance of finger-jointed timber.

Author Contributions

Conceptualization, S.T.L., T.N.N. and T.D.N.; Methodology, S.T.L. and T.N.N.; Software, D.-K.B.; Validation, T.N.N.; Formal analysis, S.T.L. and T.N.N.; Investigation, D.-K.B.; Data curation, S.T.L. and Q.P.H.; Writing—original draft, S.T.L. and Q.P.H.; Writing—review & editing, T.N.N., D.-K.B. and T.D.N.; Visualization, S.T.L. and Q.P.H.; Supervision, T.N.N. and T.D.N. All authors have read and agreed to the published version of the manuscript.

Funding

This research was supported by the ARC Discovery Project (ARC DP210102499).

Data Availability Statement

Data will be made available on request.

Acknowledgments

The first author, Tay Son Le, would like to thank the University of Melbourne for offering the Melbourne Research Scholarship.

Conflicts of Interest

The authors declare that they have no known competing financial interests or personal relationships that could have appeared to influence the work reported in this paper.

References

  1. Tang, Z.; Shan, B.; Li, W.; Peng, Q.; Xiao, Y. Structural behavior of glubam I-joists. Constr. Build. Mater. 2019, 224, 292–305. [Google Scholar] [CrossRef]
  2. Jokerst, R. The effect of geometry on the performance of structural finger-joints. In Production, Marketing and Use of Finger-Jointed Sawnwood; Springer: Berlin/Heidelberg, Germany, 1982; pp. 169–180. [Google Scholar]
  3. Lara-Bocanegra, A.J.; Majano-Majano, A.; Crespo, J.; Guaita, M. Finger-joint performance in engineered laminated products made of Eucalyptus globulus. In Proceedings of the World Conference on Timber Engineering, Vienna, Austria, 22–25 August 2016. [Google Scholar]
  4. Vega, A.; Baño, V.; Cardoso, A.; Moya, L. Experimental and numerical evaluation of the structural performance of Uruguayan Eucalyptus grandis finger-joint. Eur. J. Wood Wood Prod. 2020, 78, 923–932. [Google Scholar] [CrossRef]
  5. Fortuna, B.; Azinović, B.; Plos, M.; Šuligoj, T.; Turk, G. Tension strength capacity of finger joined beech lamellas. Eur. J. Wood Wood Prod. 2020, 78, 985–994. [Google Scholar] [CrossRef]
  6. Navaratnam, S.; Christopher, P.; Ngo, T.; Le, T. Bending and shear performance of Australian Radiata pine cross-laminated timber. Constr. Build. Mater. 2020, 232, 117215. [Google Scholar] [CrossRef]
  7. Bustos, C.; Beauregard, R.; Mohammad, M.; Hernández, R.E. Structural performance of finger-jointed black spruce lumber with different joint configurations. For. Prod. J. 2003, 53, 72–76. [Google Scholar]
  8. Olsson, A.; Briggert, A.; Oscarsson, J. Increased yield of finger jointed structural timber by accounting for grain orientation utilizing the tracheid effect. Eur. J. Wood Wood Prod. 2019, 77, 1063–1077. [Google Scholar] [CrossRef]
  9. Özçifçi, A.; Yapıcı, F. Structural performance of the finger-jointed strength of some wood species with different joint configurations. Constr. Build. Mater. 2008, 22, 1543–1550. [Google Scholar] [CrossRef]
  10. Abdul Hamid, N.H.; Ahmad, M.; Suratman, M.N.; Abu, F. Bending strength of finger jointed kelat wood (Syzygium spp.) as affected by finger length and orientation. Adv. Mater. Res. 2015, 1134, 138–142. [Google Scholar] [CrossRef]
  11. Tran, V.-D.; Oudjene, M.; Méausoone, P.-J. FE analysis and geometrical optimization of timber beech finger-joint under bending test. Int. J. Adhes. Adhes. 2014, 52, 40–47. [Google Scholar] [CrossRef]
  12. Hasanagić, R.; Hodžić, A.; Jurković, M. Modelling and optimization of tensile break force of solid wood elements lengthened by finger joint. J. Adhes. Sci. Technol. 2020, 34, 1013–1027. [Google Scholar] [CrossRef]
  13. Ratnasingam, J.; Scholz, F. Optimization of finger-jointing in rubberwood processing. Eur. J. Wood Wood Prod. 2009, 67, 241–242. [Google Scholar] [CrossRef]
  14. Eshun, J.F.; Potting, J.; Leemans, R. Wood waste minimization in the timber sector of Ghana: A systems approach to reduce environmental impact. J. Clean. Prod. 2012, 26, 67–78. [Google Scholar] [CrossRef]
  15. Adhikari, S.; Ozarska, B. Minimizing environmental impacts of timber products through the production process “From Sawmill to Final Products”. Environ. Syst. Res. 2018, 7, 6. [Google Scholar] [CrossRef]
  16. Elinwa, A.U.; Mahmood, Y.A. Ash from timber waste as cement replacement material. Cem. Concr. Compos. 2002, 24, 219–222. [Google Scholar] [CrossRef]
  17. Yang, M.; Rosentrater, K. Environmental effects and economic analysis of adhesives: A review of life cycle assessment (LCA) and techno-economic analysis (TEA). In Proceedings of the 2015 ASABE Annual International Meeting, New Orleans, LA, USA, 26–29 July 2015; p. 1. [Google Scholar]
  18. Bui, D.-K.; Nguyen, T.; Chou, J.-S.; Nguyen-Xuan, H.; Ngo, T.D. A modified firefly algorithm-artificial neural network expert system for predicting compressive and tensile strength of high-performance concrete. Constr. Build. Mater. 2018, 180, 320–333. [Google Scholar] [CrossRef]
  19. Bui, D.-K.; Nguyen, T.N.; Ghazlan, A.; Ngo, N.-T.; Ngo, T.D. Enhancing building energy efficiency by adaptive façade: A computational optimization approach. Appl. Energy 2020, 265, 114797. [Google Scholar] [CrossRef]
  20. Bui, D.-K.; Nguyen, T.N.; Ngo, T.D.; Nguyen-Xuan, H. An artificial neural network (ANN) expert system enhanced with the electromagnetism-based firefly algorithm (EFA) for predicting the energy consumption in buildings. Energy 2020, 190, 116370. [Google Scholar] [CrossRef]
  21. Le, T.S.; Nguyen, T.N.; Bui, D.-K.; Ngo, T.D. Optimal sizing of renewable energy storage: A techno-economic analysis of hydrogen, battery and hybrid systems considering degradation and seasonal storage. Appl. Energy 2023, 336, 120817. [Google Scholar] [CrossRef]
  22. Khelifa, M.; Lahouar, M.A.; Celzard, A. Flexural strengthening of finger-jointed Spruce timber beams with CFRP. J. Adhes. Sci. Technol. 2015, 29, 2104–2116. [Google Scholar] [CrossRef]
  23. EN408; Timber Structures–Structural Timber and Glued-Laminated Timber–Determination of Some Physical and Mechanical Properties. European Committee for Standardization: Brussels, Belgium, 2010.
  24. Avez, C.; Descamps, T.; Serrano, E.; Léoskool, L. Finite element modelling of inclined screwed timber to timber connections with a large gap between the elements. Eur. J. Wood Wood Prod. 2016, 74, 467–471. [Google Scholar] [CrossRef]
  25. Dassault Systemes. ABAQUS User’s Manual; Dassault Systemes Inc.: Waltham, MA, USA, 2019. [Google Scholar]
  26. Khelifa, M.; Celzard, A. Numerical analysis of flexural strengthening of timber beams reinforced with CFRP strips. Compos. Struct. 2014, 111, 393–400. [Google Scholar] [CrossRef]
  27. Khelifa, M.; Vila Loperena, N.; Bleron, L.; Khennane, A. Analysis of CFRP-strengthened timber beams. J. Adhes. Sci. Technol. 2014, 28, 1–14. [Google Scholar] [CrossRef]
  28. Colling, F. Tragfähigkeit von Biegeträgern aus Brettschichtholz in Abhängigkeit von den Festigkeitsrelevanten Einflussgrößen; Versuchsanst. für Stahl, Holz und Steine: Karlsruhe, Germany, 1990. [Google Scholar]
  29. Martins, C.; Dias, A.M.; Cruz, H. Bonding performance of Portuguese Maritime pine glued laminated timber. Constr. Build. Mater. 2019, 223, 520–529. [Google Scholar] [CrossRef]
  30. Khelifa, M.; Celzard, A.; Oudjene, M.; Ruelle, J. Experimental and numerical analysis of CFRP-strengthened finger-jointed timber beams. Int. J. Adhes. Adhes. 2016, 68, 283–297. [Google Scholar] [CrossRef]
  31. Jiang, Y.; Schaffrath, J.; Knorz, M.; Winter, S. Bonding of various wood species–studies about their applicability in glued laminated timber. In Materials and Joints in Timber Structures: Recent Developments of Technology; Springer: Dordrecht, The Netherlands, 2014. [Google Scholar]
  32. Sernek, M.; Boonstra, M.; Pizzi, A.; Despres, A.; Gérardin, P. Bonding performance of heat treated wood with structural adhesives. Holz Als Roh-Und Werkst. 2008, 66, 173–180. [Google Scholar] [CrossRef]
  33. Nadir, Y.; Nagarajan, P. The behavior of horizontally glued laminated beams using rubber wood. Constr. Build. Mater. 2014, 55, 398–405. [Google Scholar] [CrossRef]
  34. Lee, M.J.; Cho, T.M.; Kim, W.S.; Lee, B.C.; Lee, J.J. Determination of cohesive parameters for a mixed-mode cohesive zone model. Int. J. Adhes. Adhes. 2010, 30, 322–328. [Google Scholar]
  35. Fortino, S.; Zagari, G.; Mendicino, A.L.; Dill-Langer, G. A simple approach for FEM simulation of Mode I cohesive crack growth in glued laminated timber under short-term loading. J. Struct. Mech. 2012, 45, 1–20. [Google Scholar]
  36. Rao, S.; Gong, M.; Chui, Y.; Mohammad, M. Effect of geometric parameters of finger joint profile on ultimate tensile strength of single finger-joined boards. Wood Fiber Sci. 2012, 44, 263–270. [Google Scholar]
  37. EN 15497:2014; Structural Finger Jointed Solid Timber-Performance Requirements and Minimum Production Requirements. British Standards Institution: Brussels, Belgium, 2014; p. 7.
  38. Yang, X.-S. Firefly algorithms for multimodal optimization. In International Symposium on Stochastic Algorithms; Springer: Berlin/Heidelberg, Germany, 2009. [Google Scholar]
  39. Chou, J.-S.; Ngo, N.-T. Modified firefly algorithm for multidimensional optimization in structural design problems. Struct. Multidiscip. Optim. 2017, 55, 2013–2028. [Google Scholar] [CrossRef]
  40. May, R.M. Simple mathematical models with very complicated dynamics. In The Theory of Chaotic Attractors; Springer: New York, NY, USA, 2004; pp. 85–93. [Google Scholar]
  41. Deb, K.; Pratap, A.; Agarwal, S.; Meyarivan, T. A fast and elitist multiobjective genetic algorithm: NSGA-II. IEEE Trans. Evol. Comput. 2002, 6, 182–197. [Google Scholar] [CrossRef]
  42. Hu, N.; Li, X.; Wu, Y.; Zhou, X. Effects of finger length on finger joint process of glued laminated timber. In Proceedings of the 2012 International Conference on Biobase Material Science and Engineering, Changsha, China, 21–23 October 2012; pp. 288–291. [Google Scholar]
  43. Rao, S.; Gong, M.; Chui, Y.; Mohammad, M. Effect of end pressure on performance of structural finger-joined lumber fabricated using a short joint profile. Eur. J. Wood Wood Prod. 2014, 72, 143–145. [Google Scholar] [CrossRef]
Figure 1. A schematic showing the four-point bending test of a spruce timber beam with finger joint from Khelifa et al. [22] (not to scale; dimensions in millimetres).
Buildings 13 01186 g001
Figure 2. Traction–separation response of cohesive behaviour.
Buildings 13 01186 g002
Figure 3. The overall mesh of a finger-jointed beam and a zoom-in at the finger-jointed location.
Buildings 13 01186 g003
Figure 4. Total waste volume due to the fabrication of the finger joint.
Buildings 13 01186 g004
Figure 5. A flowchart showing the creation of the FE model.
Buildings 13 01186 g005
Figure 6. Flow chart showing the MMOFA.
Buildings 13 01186 g006
Figure 7. Three different mesh sizes for the control beam model in the mesh convergence study.
Buildings 13 01186 g007
Figure 8. Mesh convergence study using the control beam model.
Buildings 13 01186 g008
Figure 9. A comparison between the numerical and experimental load–midspan deflection results for the control beam.
Buildings 13 01186 g009
Figure 10. A comparison between the numerical and experimental load–midspan deflection results for the finger-jointed beam.
Buildings 13 01186 g010
Figure 11. (a) The failure of the glue lines at the finger-joint using the CSQUADSCR index, (b) The deformed shape of the beam at the failure point with the opening of the finger joint.
Buildings 13 01186 g011
Figure 12. The impact of the number of fingers on the flexural performance of timber beams.
Buildings 13 01186 g012
Figure 13. The impact of finger length on the flexural performance of a timber beam.
Buildings 13 01186 g013
Figure 14. The impact of tip thickness on the flexural performance of a timber beam.
Buildings 13 01186 g014
Figure 15. Optimisation result for the finger-joint beam.
Buildings 13 01186 g015
Table 1. Material inputs for the cohesive behaviours of glue lines at a finger joint.
Initial StiffnessDamage Initiation
K n = 4.9   N / m m 3 σ n m a x = 1.9   M P a
K s = K t = 4.9   N / m m 3 σ s m a x = σ t m a x = 9.8   M P a
Table 2. The best and worst combination of the finger joint design parameters.
ParameterBaselineBest
Buildings 13 01186 i001Buildings 13 01186 i002
n720
B (mm)10.4
Lf (mm)2215
Maximum load capacity (kN)6.016.18
Waste Volume (cm3)3725
Disclaimer/Publisher’s Note: The statements, opinions and data contained in all publications are solely those of the individual author(s) and contributor(s) and not of MDPI and/or the editor(s). MDPI and/or the editor(s) disclaim responsibility for any injury to people or property resulting from any ideas, methods, instructions or products referred to in the content.

