Review

Review of Bond-Slip Behavior between Rebar and UHPC: Analysis of the Proposed Models

1
Hunan Provincial Key Laboratory on Damage Diagnosis for Engineering Structures, Hunan University, Changsha 410082, China
2
College of Civil Engineering, Hunan University, Changsha 410082, China
*
Author to whom correspondence should be addressed.
Buildings 2023, 13(5), 1270; https://doi.org/10.3390/buildings13051270
Submission received: 29 March 2023 / Revised: 24 April 2023 / Accepted: 8 May 2023 / Published: 12 May 2023
(This article belongs to the Special Issue Reinforced Concrete Buildings)

Abstract

:
With superior mechanical properties and workability, ultra-high-performance concrete (UHPC) has been utilized extensively in engineering projects. To gain a comprehensive understanding of the bond behavior of UHPC or ultra-high-performance fiber-reinforced concrete (UHPFRC), researchers studied the factors influencing the bond-slip between rebar and UHPC or UHPFRC over the past few years. The literature-proposed ultimate bond strength formulas and the bond-slip constitutive model between rebar and UHPFRC are analyzed and compared. Based on the bond test database of UHPFRC, the results indicate that UHPFRC strength, relative concrete cover thickness, relative bond length, and steel fiber volume content are the primary parameters influencing the ultimate bond strength between rebar and UHPFRC. In the bond-slip constitutive model, the nonlinear ascending and linear descending model is more accurate than other models. This paper concludes by discussing the shortcomings in UHPC or UHPFRC bond research and predicting the future research trend.

Graphical Abstract

1. Introduction

Ultra-high-performance concrete (UHPC) is a new material that has experienced rapid development over the past thirty years and boasts excellent mechanical and work performance [1,2,3]. UHPC has a low water-cement ratio and high particle packing density, which ensures no large voids between the aggregates, forming a high-density, high-strength matrix and providing strong bonding between rebar and UHPC [4,5]. Ultra-high-performance fiber-reinforced concrete (UHPFRC) has strain-hardening behavior, bridges the crack and provides post-crack ductility because of steel fibers, ensuring the bond behavior between rebar and UHPFRC [6,7,8]. The steel fibers in UHPFRC have a confining effect, enabling UHPFRC to exhibit substantially higher compression ductility, strength retention, resistance to spalling, and energy-absorption capacity, compared with normal-strength concrete [9].
The research on the bond behavior between UHPC or UHPFRC and rebar has been carried out from multiple perspectives for decades. Bae [10] and Sturm [11] validated that the prediction model for normal-strength concrete ultimate bond strength cannot be applied to UHPC. The thickness of the concrete cover and the bond length are considered to be the primary factors affecting the bond behavior. Many researchers [12,13,14,15,16] had investigated the variations in bond stress with the thickness of the concrete cover and the bond length through pull-out tests and beam-type tests, and the results showed that the ultimate bond strength increased with the relative concrete cover thickness and decreased with the increase in the relative bond length. Deng [17] further studied that the effect of concrete cover thickness weakened if the cover thickness was larger than three times the rebar diameter. Ultra-High-Performance Fiber-Reinforced Concrete (UHPFRC) is a fiber-added ultra-high-performance material. Some researchers studied the variations in bond stress by changing the fiber type [18,19] and fiber content [20,21], and found that the fiber type did not have a significant impact on bond stress. The bond stress increased with the increase in fiber content, but the enhancement effect would be weakened at higher fiber content, and even negative effects may occur [20,21]. Holschemacher [22] and Shao [23] used a different loading mode, respectivelyloading rate and cyclic loading, and they found that the bond stress increased with the increase in loading rate. Some researchers used steel bar strength [24,25,26] and coating [27,28] as variables for pull-out tests, and indicated that the bond stress increased with the increase in steel reinforcement strength, but the coating on the surface of steel bar had a negative impact on bond stress. Alkaysi [27], Roy [29] and Shao [23] focused on the concrete pouring direction during specimen preparation, and indicated that the bond strength perpendicular to the direction of force application was stronger than that in the parallel direction. Compared with the normal strength concrete of residual strength in high-temperature environments [30], Tang [31] studied the local bond-slip changes in UHPC exposed to high-temperature environments from 300 °C to 500 °C. The ultimate bond strength would experience a relatively minimal decrease with increasing ambient temperature. Fang [32] and Ma [33] also studied the bond behavior of lap splices. With the research progress of UHPC bond behavior, some researchers [20,21,34,35] proposed the theoretical formulas for bond stress based on the thick-walled cylinder model, and Qi [36] proposed a comprehensive bond model that considers fiber distribution and orientation, offering a new perspective on the rebar-UHPFRC bond mechanism. Similarly, some researchers have conducted experimental studies on bond performance of similar materials based on bond-slip research on UHPC or UHPFRC, such as UHPC with silicon dioxide nanoparticles [37,38], geopolymer based ultra-high-performance concrete (G-UHPC) [39], ultra-high performance concrete with coarse aggregate (UHPC-CA) [40], UHPC and glass-fiber-reinforced polymer (GFRP) [41].
This paper summarizes the literature on the factors affecting the bond behavior between rebar and UHPFRC, briefly introduces the bond mechanism and test methods between rebar and UHPFRC, focuses on the main factors affecting the bond behavior of UHPFRC, compares and analyzes the calculation formulas for the ultimate bond strength and the existing bond-slip constitutive relationship proposed by different researchers. Finally, the paper highlights the limitations of current research on the bond-slip between rebar and UHPFRC and explores the future direction of research in this field.

2. Composition of Bond Behavior

The bond between rebar and concrete comprises three parts: chemical bonding strength, friction resistance, and mechanical interlocking force, as shown in Figure 1. For deformed steel bars, the bond strength mainly comes from the mechanical interlocking between the rib on the surface of rebar and concrete.
Chemical bonding force, acting on the contact surface between rebar and concrete, is generated by chemical adsorption produced by the penetration of cement slurry into the oxide layer on the surface of the steel bar and the hardening of the hydration product. The chemical bonding force only contributes slightly when there is no relative slip between concrete and steel bars, and the chemical bonding force disappears when a relative slip occurs.
Friction resistance refers to the friction generated by concrete wrapping rebars during shrinkage. Concrete shrinks in volume during solidification, causing the compressive stress perpendicular to the surface of the steel bars. When there is a relative slip trend between rebar and concrete, friction resistance will be generated to resist external forces. The frictional resistance size depends on the concrete components and the rebar type. The larger the coefficient of friction, the greater the frictional resistance. For steel bars without surface rust, the coefficient of friction is taken as 0.3. As the degree of rust on the surface of the steel bars increases, the friction coefficient should be appropriately increased [42].
Mechanical interlocking force, for the composition of deformed rebars bond strength, mainly comes from the mechanical interlocking between the ribs on the surface of rebar and concrete, which significantly improves the bond strength, and is the main contribution part of the bond behavior. As the crack occurs in concrete under load, the bond length decreases, and the mechanical interlocking force causes secondary crack generation around the primary crack, reducing the contribution of mechanical interlocking force in bond behavior [43,44].
The bond strength is achieved by creating shear stress along the interface between rebar and concrete, resulting in bond stress. However, the steel bar will slip under load and cause cracking along the surface ribs. When external loads are applied to the steel-concrete structure, stress is generated at the interface between rebar and concrete. When they exceed the load-carrying limit, cracks will form along the ribbed surface of the rebar, reducing its ability to transmit bond stress. These cracks will spread to the surrounding concrete, causing the interface’s stress-transmitting ability to deteriorate and resulting in relative slippage.
UHPC’s superior bond behavior comes from its special composition compared to normal-strength concrete. With the lower water-cement ratio and coarse aggregates, UHPC has a more homogeneous and denser particle size distribution inside [22,45], increasing the contact surface area between the cement matrix and rebar, thereby enhancing the chemical bond [46]. Including steel fibers in UHPFRC further increases its compressive strength and elastic modulus [47]. The high compressive strength ensures the concrete can withstand mechanical interlocking without crushing, and the high elastic modulus reduces the relative slippage between rebar and concrete, limiting crack development and increasing the contribution of mechanical interlocking to the bond behavior [48,49]. Adding steel fibers to the matrix limits crack development and demonstrates strain-hardening characteristics [50,51,52,53].

3. Bond Test Types

There are currently two experimental methods: pull-out and beam-type tests to measure the bond strength between rebar and UHPC or UHPFRC. Both methods have advantages and disadvantages, and researchers need to analyze the specific situation and choose the appropriate test method [54].

3.1. Pull-Out Test

As the classic test method, pull-out test is appropriate for bond behavior between concrete and steel studies [55]. As shown in Figure 2, there are two types of pull-out tests: the central pull-out test and the eccentric pull-out test. The central pull-out test generally requires the larger concrete cover thickness to demonstrate the bond behavior of the concrete material effectively; the eccentric pull-out test offers flexibility in adjusting the position of embedded rebars, allowing researchers to study the impact of different concrete cover thicknesses on bond strength and to determine the minimum required concrete cover thickness.

3.2. Beam-Type Test

The beam-type test better simulates the bond condition of rebars at the end positions, which is closer to the actual situation. As shown in Figure 3, there are full-beam tests and half-beam tests. Full-beam tests satisfy the varying requirements of tension tests and consider parameters such as stirrup ratios, splice lengths, and anchorage lengths. The disadvantage is that the size of the full-beam test specimen is larger, and the production is more complicated, making it difficult to mass produce. He et al., improved the beam-type test specimen and designed a small-sized half-beam component to overcome the limitations of the full-beam component [56,57].

4. Factors Affecting Bond Strength

The factors affecting the bond behavior between UHPFRC and rebar are divided into three main aspects: rebar, concrete, and test design. Regarding rebar, factors include strength, type, diameter, surface coating, and rib shape. In terms of concrete, factors include strength, volume, and size of steel fiber, curing period, and concrete method. Regarding test design, factors include bond length, concrete cover thickness, size and shape of test specimens, stirrup ratio, test form, arrangement of steel fibers, the direction of specimen casting, location of bond segments, and loading conditions. Overall, the factors are divided into two categories based on the extent of their impact on the ultimate bond strength: primary factors and secondary factors. This section will discuss some of the primary factors.

4.1. Concrete Compressive Strength

Due to the characteristics of low water-cement ratio components, the strength of UHPC is far higher than that of normal-strength concrete, which greatly affects the bond behavior. Alkaysi et al., conducted pull-out tests on specimens with different concrete compressive strengths under other constant parameters [27], and Choi et al., selected UHPC materials with compressive strengths of C100, C150, and C200 for bond tests [18]. The results are shown in Figure 4a. When the concrete compressive strength is relatively low, increasing the concrete compressive strength can effectively improve the ultimate bond strength. As the concrete compressive strength increases, the increment of the ultimate bond strength gradually decreases. Jia and Liang et al., derived the same law based on the pull-out test results. Because the high strength of UHPFRC comes from optimizing particle gradation and adding steel fibers when rebars tend to be pulled out, the concrete around the rebars bears a larger expansion stress to limit the development of cracks. The high compressive strength of UHPC or UHPFRC makes the concrete on the steel rib hard to be crushed, limiting the relative sliding.
In the research of normal-strength concrete, most researchers usually use f c to represent the influence of concrete on bond strength, which is also used for UHPC or UHPFRC. However, Darwin et al. [58] believe that using f c to represent the strength of high-strength concrete would overestimate the influence of concrete, and using f c 1 / 4 is more reasonable.

4.2. Steel Fiber Volume Content

With adding steel fibers to the concrete matrix, a three-dimensional support system is formed [59,60,61]. Compared to fiber-reinforced concrete (FRC), due to the absence of coarse aggregates, UHPFRC exhibits a more uniform distribution of steel fibers within the matrix, which creates a dense network of reinforcement throughout the material and prevents the expansion of microcracks and the formation of connected cracks [62,63,64]. As cracks encounter fibers during the expansion process, they are forced to change their direction of development, reducing the stress concentration at the crack tip and dissipating the energy of crack expansion [59]. The pin effect is particularly important in fiber-reinforced materials and can improve their mechanical properties. Since the effect is influenced by multiple factors, researchers typically consider it a variable when studying bond behavior, such as fiber type and size [11,18,19], fiber volume content [13,17,18,19,20,21,27,33,34], and fiber orientation and distribution in the material [23,27,29]. However, in studies of bond behavior, most researchers only take the fiber volume content into account as a variable affecting the effect.
For normal-strength concrete, when rebar slips, concrete forms internal cracks and develops towards the surface of the specimen under stress caused by the rib on the surface of the steel, resulting in splitting failure. Adding steel fibers restrains the formation and spread of cracks, improving the failure type [45,65]. Based on experimental results, Yu et al., concluded that the average crack surface area significantly decreased with the increase in the steel fiber content [66]. Sturm et al., compared the ultimate bond strength between six components of UHPFRC and rebar. The results indicated that adding steel fibers helps to increase the bond strength, with the bond strength test value of UHPFRC with the fine fiber group increased by 32.7% [11]. As shown in Figure 4b, Liang et al., studied the influence of 0 to 3% steel fiber volume content on the ultimate bond strength. When the steel fiber volume content increased from 1% to 3%, the bond strength increased by 23% [67]. Yoo et al., studied the influence of 1% to 4% steel fiber volume content on bond strength. When the steel fiber volume content increased from 1% to 3%, the bond strength increased by 14%; when the steel fiber volume content increased from 3% to 4%, the bond strength value decreased to 68.28 MPa [48]. Some researchers concluded that the contribution of steel fibers to bond strength was not due to the difference in UHPFRC compressive strength caused by different steel fiber volume contents but depends on the number of fibers participating in the bridging at the crack [27,67]. With the increase in steel fiber volume content, steel fibers will exhibit aggregation, causing uneven distribution and reducing the effective fiber number [45,68]. Thus, there exists an optimal steel fiber content, beyond which the ultimate bond stress does not significantly increase with the increase in fiber content and may have a negative impact.

4.3. Relative Concrete Cover Thickness

Increasing concrete cover thickness brings the bond behavior into full play between the rebar and the concrete. Deng, Shi, and Liang et al., studied the effect of relative concrete cover thickness on the ultimate bond strength through an eccentric pull-out test [17,67,69]. The test results are shown in Figure 4c. Deng, Shi and Liang studied the influence of the relative concrete cover thickness in the range of 1.38~4.19, 0.50~3.25, and 1.00~5.75 on the ultimate bond strength. When the relative concrete cover thickness is less than or equal to 2, the bond strength value is greatly affected by the relative concrete cover thickness. Then, the amplification of the bond strength decreases with the increase in the thickness of the relative concrete cover, indicating that the improvement of the ultimate bond strength caused by the rise in the relative concrete cover thickness is weakened. Marchand et al., concluded that when the relative concrete cover thickness is more than or equal to 4, the increase in the ultimate bond strength caused can be ignored [70].

4.4. Relative Bond Length

Most researchers adopt the average bond strength assumption because of the complex bond-slip mechanism between rebar and concrete and suppose that the bond stress does not change at any bond position within the bond length, as shown in Figure 5. As shown in Figure 4d, Ma found that increasing the relative bond length from 3.0 to 7.0 resulted in a 35% decrease in ultimate bond strength, from 33.6 MPa to 21.7 MPa [33]. Sun found that when the relative bond length increases from 3.0 to 6.0, the bond strength decreases from 45.9 MPa to 28.8 MPa, which is 37% lower. As the bond length of the rebar increases, the distribution of bond stress becomes progressively uneven, and assuming average bond stress will result in calculation errors [24]. Moreover, Zhang and Vidya et al. [35,71] have obtained the distribution law of bond stress when the bond length is considerable by pasting strain gauges inside the rebar.
τ = F π d l a
where τ is the average bond stress, F is the pull-out load, d is the rebar diameter, and l a is the bond length.

5. Ultimate Bond Strength Formula

Similar to the ultimate bond strength calculation model of normal-strength concrete, most researchers have used regression analysis of test data, theoretical model analysis, database-based statistical analysis, and other methods to obtain different forms of ultimate bond strength calculation formulas. All researchers realize that the bond strength is closely related to the concrete cover thickness. The main influencing parameters are the bond length of rebar, concrete strength, rebar diameter, and steel fiber volume content. There is a minority of researchers who hold divergent perspectives that the ultimate bond strength is related to rebar strength and fiber shape. This section will summarize the calculation formula of bond strength proposed by different researchers.
Drawing on the extensive research in recent years on the bond behavior of rebar and UHPFRC, it is possible to rigorously evaluate the accuracy of ultimate bond strength calculation formulae by constructing a database of bond strength values. Establishing the ultimatbond strength database not only grasps the current experimental research status of UHPFRC bond behavior by researchers but also comprehensively evaluates the ultimate bond strength expression summarized in Table 1 based on the comprehensiveness of the data provided by researchers from different countries. Constructing a database of bond strength values validates the bond strength calculation formulae outlined in Table 1.
The establishment of the database is divided into three steps: identifying sources of relevant data and extracting information from the literature, defining criteria for selecting data, and aggregating the data chosen while presenting the overview of its distribution.
Considering the variability of experimental approaches and the various factors that impact bond behavior, this paper gathers 204 relevant data points from 10 distinct sources that meet the established selection criteria to construct the database. Considering the range of UHPFRC compressive strength, the range of concrete compressive strength is determined as f c 80   MPa . As some calculation formulae of partial ultimate bond strength are based on the assumption of average bond strength, the range of relative bond length is determined as l a / d 8.0 . Yoo and Ma found that when the volume content of steel fiber increased from 3% to 4%, the steel fiber would accumulate into clusters, distribute unevenly in the matrix, and reduce the bond strength. Therefore, the range was determined as 0 V f 3.0 % . For the relative concrete cover thickness c / d , the selection is based on the parameter range in the formula of ultimate bond strength.
The data distribution is shown in Figure 6, where f c [ 88.0 ,   207.2 ] , l a / d [ 1.0 ,   8.0 ] , V f [ 0 ,   3.0 ] , c / d [ 0.5 ,   8 . 9 ] . The data samples obtained by pull-out test and beam-type test in the database account for 89% and 11%, respectively, because compared with pull-out test, beam-type test pieces are complex to produce in batches. In total, 51% and 43% of UHPFRC compressive strength data are distributed in 120~160MPa and 160~200 MPa, respectively; the data source literature mainly studies the relative bond length in the range of 2–4, accounting for 47%; the research on the volume content of steel fiber is concentrated on 2%. On the one hand, some studies indicated that the cohesive force between the fibers and matrix became much more substantial as the total surface area of fibers was increased and thereby magnified the effective viscous force of UHPFRC [74,75]. Due to the increased plastic viscosity, the high viscosity with V f = 2 % alleviated the blocking effect of steel bars, which uniformed the fiber distribution in the UHPFRC [66]. On the other hand, the high-volume content of steel fiber will lead to an aggravated interaction of fibers, which adversely affect the workability of fiber reinforced concrete [67]; the research on the relative concrete cover thickness is mainly distributed at 0~2 and 4~6. The main reason is that the 0~2 range belongs to the thickness of the component concrete cover in the actual engineering structure. Some researchers have adopted the size of 150 mm × 150 mm × 150 mm central pull-out test piece, so 32% data amount is distributed in the range of 4~6; based on the actual engineering situation, the research is mainly carried out on 16 mm diameter reinforcement, accounting for 48%.
Selecting some calculation models in Table 1 and the calculation formula proposed by Zuo et al. [76] based on the bond behavior test between rebar and normal-strength concrete is shown in Equation (2). Substitute the data in the ultimate bond strength database, and show in Table 2 for the summary of test parameters. In Figure 7, although Khaksefidi’s model exhibits favorable predictive performance, it generates negative values in cases where the relative bond length is large, indicating that its predictive capacity is somewhat limited in such scenarios [26]. The models proposed by Yang and Chen have shown promising results in predicting the ultimate bond stress. Yang’s model is based on fitting bond behavior test results between rebar and G-UHPC. It has been verified through database validation and found suitable for calculating the ultimate bond strength [39]. The predictions derived from Ma’s model exhibit a relatively large deviation, while the distribution of data points is rather clustered [33]. In Sturm’s model, which incorporates only two parameters: concrete cover thickness and compressive strength, some experimental data produced excessively large or small predicted results, resulting in a scattered distribution of predictions [11]. Liang’s model tends to overestimate the predicted results and is characterized by the relatively dispersed distribution of values. Only a small portion of the predicted results match well with the experimental data, owing to the selection of parameters from the literature and the experimental results that fall beyond the applicable range of the model [19]. Pishro’s model was proposed based on UHPC materials containing nano-silica and did not apply to traditional UHPC materials [38]. In addition, the calculation formula proposed by Zuo is different from the UHPC or UHPFRC ultimate bond strength calculation formula summarized in Table 1, which f c 1 / 4 is used to represent the impact of concrete strength. The bond strength formula proposed by Zuo based on the bond test results of normal-strength concrete can be used for UHPFRC, as shown in Figure 7h. It is more reasonable to use f c 1 / 4 to reflect the contribution of high-strength concrete strength in the calculation formula, which is the same as Darwin’s standpoint.
τ u = f c 1 / 4 ( 0.23 + 0.46 c min / d + 14.05 d / l a ) ( 0.1 c max / c min + 0.9 )
where f c is the compressive strength of concrete, c min , c max is the maximum and minimum concrete cover, d is the diameter of bar, and l a is the bond length.
The main parameters affecting the ultimate bond strength are UHPFRC strength, rebar strength, relative concrete cover thickness, relative bond length, and steel fiber content from the prediction results of different models. Therefore, in the experimental design of UHPFRC bond behavior, it is necessary to analyze these main influencing parameters in detail.

6. Bond-Slip Constitutive Model

The design of actual engineering structures and establishing a bond-slip numerical analysis model using finite element software require an accurate local bond-slip constitutive curve of rebar and UHPC or UHPFRC. The research into the constitutive theory of bond-slip remains incomplete. As shown in Table 3, many researchers have proposed constitutive relationships for the bond-slip under varying parameter conditions based on experimental findings, which are classified into two types: segmented linear and segmented nonlinear. This section will provide a brief introduction to the current bond-slip constitutive models.
The bond-slip constitutive models proposed by Marchand, Zhou, Sturm, Yang, Liang, Shao, and Zhang are selected for analysis. A total of 63 test curves in literature [22,33,50] were used for analysis, and the test curves in literature [22] Second batch-4, literature [50] UH-S and literature [33] D16-C2-L3-2 were selected for comparison, as shown in Figure 8 and Figure 9. The dotted lines 1 and 2 in Figure 9 represent 85% and 50% of the ultimate bond strength values, respectively. The parameters on constitutive models are shown in Table 4. The following two parts will be discussed: the ascending curve and the descending curve.

6.1. Ascending Curve

The ascending curve has two types: linear form and nonlinear form, and the curve types are shown in Figure 9. The nonlinear ascending branch follows the fitting parameter values in the original literature. As shown in Figure 8 and Figure 9, the linear ascending segment formulation proposed by Yang is simple. Still, it may underestimate the bond behavior, which weakens the strengthening characteristics. Strum and Zhou also have the same problem with the nonlinear ascending branch. The linear ascending branch proposed by Shao is not suitable for predicting the test curve that reaches the ultimate bond strength early. The model proposed by Marchand entered the strengthening stage earlier, overestimating the bond behavior, which is dangerous in engineering structures. Figure 8 and Figure 9 indicate that the constitutive models proposed by Zhang and Liang exhibit lower errors, demonstrating a strong predictive capability for the bond behavior. When predicting the constitutive relationship for the ascending branch of the bond-slip curve, using the nonlinear ascending branch accurately reflects the changes in bond behavior at this stage, resulting in smaller errors than using the linear ascending branch.

6.2. Descending Curve

Marchand, Strum, and Shao considered the strain-hardening characteristics of UHPFRC and added the stress plateau section into the bond-slip constitutive equation. The descending section also has two types: bi-linear and nonlinear forms. As shown in Figure 10a,c and Table 5, the expressions proposed by Strum and Zhou follow the parameter values proposed in the original literature, which are quite different from the test curve, and most of the nonlinear descending branches underestimate the bond behavior in slowly descending section. Liang’s model indicates that after fitting the parameters of the descending section based on some bond behavior tests, the nonlinear descending branch accurately predicts the constitutive relationship of the slowly descending section, as shown in Figure 10b and Table 5. Therefore, the parameters are fitted based on several pull-out pretests before using the nonlinear descending segment function relationship. Shao’s relationship demonstrates excellent predictive capability, while the constitutive relationships proposed by Zhang and Marchand are less accurate. This is due to the empirical formula used to calculate the residual bond stress, which has a limited range of applicability. Within this range, a more accurate constitutive relationship curve can be obtained. Figure 10 shows that when the nonlinear descending branch parameters cannot be obtained by fitting the test results to determine the residual bond stress value, the bi-linear descending segment better predicts the bond-slip constitutive curve. The bond-slip constitutive model proposed by Yang based on G-UHPC material applies to the UHPFRC with high residual bond stress.
Compared with normal-strength concrete, the bond-slip constitutive curve between UHPFRC and rebar has a gradual descending stage and a higher residual bond strength due to addition of steel fibers [13]. Similar to the primary factors of ultimate bond stress, the residual bond stress of UHPFRC is mainly affected by relative concrete cover thickness, relative bond length, and steel fiber volume content. The experimental laws of residual bond stress variation with the relative concrete cover thickness and relative bond length have indicated different results among different researchers [17,21,23,26,67]. However, the residual bond stress shows a relatively consistent trend with the increase in steel fiber volume content. As shown in Figure 11, there is a slight decrease in residual bond strength when the steel fiber volume content is 2% or 3%, and the overall trend of residual bond strength increases with the increase in steel fiber volume fraction.

6.3. Comparison between Linear and Non-linear Forms

The bond toughness, which measures the amount of energy dissipated during bond slip. As shown in Figure 12, the energy dissipation during bond is represented by the area enclosed by the bond-slip curve and the coordinate axes, and the symbols in the figure are defined as follows: (1) A p e a k —the area under the bond-slip curve up to the point of ultimate bond stress; (2) A p o s t —the area under the bond-slip curve up to a point in the post-peak range at which the bond stress has reached the peak and then dropped to 80% of the ultimate bond stress [81,82].
For the ascending curve, the linear form shows that the bond stiffness remains constant as the bond stress develops from zero to the ultimate bond stress. The initial bond stiffness of the linear expression is smaller than that of the nonlinear form, and the bond stiffness remains constant with the increase in slip, without reflecting the enhanced mechanical properties of the corresponding fiber volume content. The A p e a k for each constitutive curve are shown in Figure 9. The linear form underestimates the bond energy dissipation capacity of UHPFRC. Therefore, the linear form is suitable for the bond-slip constitutive relationship without steel fibers or with a lower fiber content. The nonlinear form better reflect the trend of the bond stiffness changing with the increase in slip. With appropriate fitting parameters, its bond energy dissipation capacity is close to the experimental results and is suitable for higher fiber content.
For the descending curve, compared with normal concrete, the descending branch is gentler. The A p o s t for each constitutive curve are shown in Figure 10. Comparing A p o s t , the nonlinear form exhibits a rapid decrease in bond stress with increasing slip when appropriate fitting parameters are not available, which cannot accurately reflect the post-peak bond stress variation, resulting in an underestimation of the bond performance of UHPFRC. As shown in Figure 10b, the fitting parameters of the Liang equation are consistent with the experiment [67], but it only better reflect the descending branch, and the residual bond stress still decreases rapidly with the increase in slip. As shown in Table 5 and Figure 10c, the bi-linear form is suitable for higher fiber content, while the nonlinear expression underestimates the bond energy dissipation capacity and residual bond stress.

6.4. Simulation of Bond Behavior in Finite Element Analysis (FEA)

Many researchers use FEA software for numerical simulations in order to verify the results of bond tests or investigate detailed stress-strain changes inside specimens. Based on the analysis of the bond-slip constitutive model in this section, the following will be introduced: the simulation of bond behavior in FEA in combination with simulation cases of researchers.
Liang [83] conducted three-dimensional FEA on lap-spliced UHPC beams for bond-slip behavior using Abaqus software. The beams established spring constraints between the concrete and steel bars, taking into account the nonlinearity of bond-slip between the steel bars and UHPC. The schematic diagram of the spring constraint is shown in the Figure 13a. The rebar node was used to build a spring constraint relationship with nine surrounding concrete nodes. The spring direction was three-dimensional, the spring stiffness in the Y and Z directions was infinite, and the stiffness in the X direction was calculated according to the selected bond–slip constitutive relationship.
Dey [84] conducted FEA on bond pull-out specimens. Similar to Liang, Dey chose to create spring constraints with appropriate stiffness on a two-dimensional plane to simulate the bond behavior between concrete and steel bars. The schematic diagram of the spring constraint is shown in the Figure 13b.
Li [85] measured the bond-slip behavior between coated steel bars and concrete by designing a full-beam test and conducted FEA using Ansys. When establishing the model, it was assumed that there was no slip between the coating and rebar, and only nonlinear spring elements were set at the interface between the coated steel bar and concrete to simulate the bond-slip behavior between steel bar and concrete.
Kytinou [86] conducted FEA on beam-column joints using Abaqus cohesive approach. Unlike the node-to-node form of spring constraints, Kytinou used surface cohesive behavior to simulate the bond behavior between steel bars and concrete. Compared to other simulation methods, the surface-to-surface contact simulation widely considers the behavior of both the master node and its surrounding slave nodes.
Rolland conducted FEA on pull-out tests using Abaqus. A model was used with four nodes and continuous axisymmetric quadrangular elements (CAX4 [87]) to discretize the concrete and steel bar areas, and it incorporated a layer of four nodes with cohesive axisymmetric quadrangular elements (COHAX4 [87]) to simulate the bond behavior [88].

7. Conclusions and Prospects

7.1. Conclusions

This paper summarizes the ultimate bond strength formula and the bond-slip constitutive relationship proposed by different researchers and establishes a test database to evaluate these models. The following conclusions can be drawn as follows:
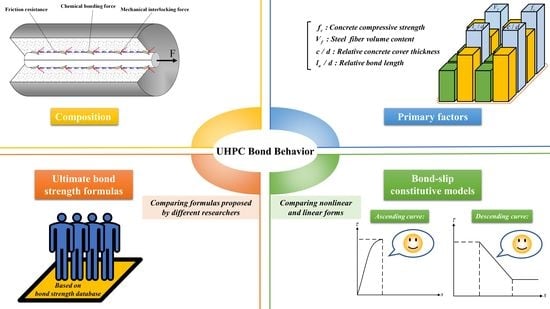
  • The factors influencing the bond behavior between rebar and UHPFRC are categorized into three aspects: rebar, concrete, and test design. Among these factors, UHPFRC strength, rebar strength, steel fiber content, relative concrete cover thickness, and relative bond length are the primary factors that impact the bond behavior of UHPFRC.
  • There are various expressions for the ultimate bond strength, most of which are empirical formulas derived from test results, while others are theoretical formulas involving numerous influencing factors. By referencing the test results of other researchers, it is observed that incorporating the primary effects of rebar, concrete, and test conditions leads to universal and accurate calculation models.
  • The bond-slip constitutive relationship between rebar and UHPC has various forms. Using the nonlinear constitutive relation for the ascending branch reflects the bond behavior. Assuming that the residual bond stress is determined in the descending branch, the bi-linear form is superior to the nonlinear form. However, after fitting the parameters of the nonlinear descending segment based on the test results, the predictive ability of the nonlinear descending segment will be better than that of the bi-linear form.

7.2. Prospects

Based on the above review, some future research opportunities have been identified as follows:
  • UHPC or UHPFRC is used to construct bridges, buildings, and other structures. Considering the construction environment of the project, it is essential to account for the independent or coupled effects of high temperature, impact, freeze-thaw cycles, vibration, erosion, and other factors on the bond behavior. Additionally, the corresponding calculation model should be proposed according to the local environmental characteristics.
  • Owing to the complex bond mechanism, the heterogeneous development of UHPC-related standards across different countries, and the variations in material selection and test conditions, there exist discrepancies among the results of different calculation models. While most models are applicable only within the range of the test parameters, only a few researchers have proposed theoretical calculation models based on the principles of elastic mechanics theory. Developing a universal calculation model based on the energy principle may be possible in future research.
  • The prediction of bond behavior involves multiple parameters and nonlinear constitutive relationships. Pull-out test specimens are easily prepared in batches and demand simple experimental requirements. Therefore, collecting experimental parameters and results from various literature and compiling a database, the subsequent research on the bond behavior is conducted based on deep learning technology.

Author Contributions

Conceptualization, Y.H.; methodology, Y.H.; software, Y.L.; validation, Y.H.; formal analysis, Y.L.; investigation, Y.H.; data curation, Y.L.; writing—original draft preparation, Y.L.; writing—review and editing, Y.H.; visualization, Y.L.; supervision, Y.H. All authors have read and agreed to the published version of the manuscript.

Funding

This research was funded by the National Natural Science Foundation of China (No. 51890901) and Natural Science Foundation of Hunan Province, China (No. 2020RC5005).

Data Availability Statement

The data presented in this study are available upon reasonable request from the corresponding author.

Acknowledgments

Support from the National Natural Science Foundation of China (No. 51890901) and Natural Science Foundation of Hunan Province, China (No. 2020RC5005) are gratefully acknowledged.

Conflicts of Interest

The authors declare no conflict of interest.

References

  1. Azmee, N.M.; Shafiq, N. Ultra-high performance concrete: From fundamental to applications. Case Stud. Constr. Mater. 2018, 9, e00197. [Google Scholar] [CrossRef]
  2. Shafieifar, M.; Farzad, M.; Azizinamini, A. Experimental and numerical study on mechanical properties of Ultra High Performance Concrete (UHPC). Constr. Build. Mater. 2017, 156, 402–411. [Google Scholar] [CrossRef]
  3. Amran, M.; Huang, S.-S.; Onaizi, A.M.; Makul, N.; Abdelgader, H.S.; Ozbakkaloglu, T. Recent trends in ultra-high performance concrete (UHPC): Current status, challenges, and future prospects. Constr. Build. Mater. 2022, 352, 129029. [Google Scholar] [CrossRef]
  4. Syed, A. Development of Ultra High Performance Fiber Reinforced Concrete; Aalto University: Espoo, Finland, 2018. [Google Scholar]
  5. Akhnoukh, A.K.; Buckhalter, C. Ultra-high-performance concrete: Constituents, mechanical properties, applications and current challenges. Case Stud. Constr. Mater. 2021, 15, e00559. [Google Scholar] [CrossRef]
  6. Graybeal, B.A. Flexural behavior of an ultra high-performance concrete I-girder. J. Bridge Eng. 2008, 13, 602–610. [Google Scholar] [CrossRef]
  7. Meng, W.; Khayat, K.H. Improving flexural performance of ultra-high-performance concrete by rheology control of suspending mortar. Compos. Part B Eng. 2017, 117, 26–34. [Google Scholar] [CrossRef]
  8. El-Din, H.K.S.; Mohamed, H.A.; Khater, M.A.E.-H.; Ahmed, S. Effect of steel fibers on behavior of ultra high performance concrete. Int. Interact. Symp. Ultra-High Perform. Concr. 2016, 1, 1–10. [Google Scholar] [CrossRef]
  9. Hung, C.; El-Tawil, S.; Chao, S. A review of developments and challenges for UHPC in structural engineering: Behavior, analysis, and design. J. Struct. Eng. 2021, 147, 03121001. [Google Scholar] [CrossRef]
  10. Bae, B.I.; Choi, H.K.; Choi, C.S. Evaluation of Bond Strength between Steel Fiber Reinforced Ultra-High Strength Concrete and Rebar. Key Eng. Mater. 2016, 665, 41–44. [Google Scholar] [CrossRef]
  11. Sturm, A.B.; Visintin, P. Local bond slip behavior of steel reinforcing bars embedded in ultra high performance fibre reinforced concrete. Struct. Concr. 2019, 20, 108–122. [Google Scholar] [CrossRef]
  12. An, M.; Zhang, M. Experimental Research of Bond Capability between Deformed Bars and Reactive Powder Concrete. China Railw. Sci. 2007, 28, 50–54. [Google Scholar]
  13. Jia, F. Experimental Study on Bond Properties between Steel Bar and Reactive Powder Concrete. Ph.D. Thesis, Beijing Jiaotong University, Beijing, China, 2013. [Google Scholar]
  14. Liu, X. Experimental Research on Bonding Properties between 150MPa High Performance Concrete and Deformed Bars. Master’s Thesis, Chongqing University, Chongqing, China, 2015. [Google Scholar]
  15. Zhang, Z.; Li, S.; Zhu, P.; Shao, X.; Bu, G. Test on Interface Bonding Behavior between Steel Rebar and Ultra-High Performance Concrete. J. Hunan Univ. 2022, 49, 105–115. [Google Scholar]
  16. Li, S. Bonding Behavior of the Interface between Steel Rebar and Ultra-High Performance Concrete. Master’s Thesis, Hunan University of Technology, Zhuzhou, China, 2022. [Google Scholar]
  17. Deng, Z.; Yuan, C. Experimental Study on Bond Capability between High Strength Rebar and Reactive Powder Concrete. China Civ. Eng. J. 2014, 47, 69–78. [Google Scholar] [CrossRef]
  18. Choi, H.K.; Bae, B.I.; Choi, C.S. Bond Characteristics and Splitting Bond Stress on Steel Fiber Reinforced Reactive Powder Concrete. J. Korea Concr. Inst. 2014, 26, 651–660. [Google Scholar] [CrossRef]
  19. Liang, R.; Huang, Y.; Xu, Z. Experimental and Analytical Investigation of Bond Behavior of Deformed Steel Bar and Ultra-High Performance Concrete. Buildings 2022, 12, 460. [Google Scholar] [CrossRef]
  20. Hu, A.; Liang, X.; Shi, Q.; Chen, Y.; Chen, B.; Wang, Q.; Li, R. Bond Characteristics between High Strength Bars and Ultra-High Performance Concrete. J. Xi’an Univ. Archit. Technol. 2021, 53, 534–544. [Google Scholar] [CrossRef]
  21. Hu, A.; Liang, X.; Shi, Q. Bond characteristics between high-strength bars and ultrahigh-performance concrete. J. Mater. Civ. Eng. 2020, 32, 04019323. [Google Scholar] [CrossRef]
  22. Holschemacher, K.; Weiße, D.; Klotz, S. Bond of reinforcement in ultra high strength concrete. In Proceedings of the International Symposium on UHPC, Kassel, Germany, 13–15 September 2004; pp. 375–387. [Google Scholar]
  23. Shao, Y.; Tich, K.L.; Boaro, S.B.; Billington, S.L. Impact of fiber distribution and cyclic loading on the bond behavior of steel-reinforced UHPC. Cem. Concr. Compos. 2022, 126, 104338. [Google Scholar] [CrossRef]
  24. Sun, M.; Gao, R.; Chen, Y.; Gao, M. Experimental Study of Bond behavior between High-Strength Rebar and Reactive Powder Concrete. Bridge Constr. 2016, 46, 18–23. [Google Scholar]
  25. Khaksefidi, S.; Ghalehnovi, M. Effect of reinforcement type on the tension stiffening model of Ultra-High Performance Concrete (UHPC). J. Rehabil. Civ. Eng. 2020, 8, 72–86. [Google Scholar] [CrossRef]
  26. Khaksefidi, S.; Ghalehnovi, M.; De Brito, J. Bond behaviour of high-strength steel rebars in normal (NSC) and ultra-high performance concrete (UHPC). J. Build. Eng. 2021, 33, 101592. [Google Scholar] [CrossRef]
  27. Alkaysi, M.; El-Tawil, S. Factors affecting bond development between Ultra High Performance Concrete (UHPC) and steel bar reinforcement. Constr. Build. Mater. 2017, 144, 412–422. [Google Scholar] [CrossRef]
  28. Zhou, Z.; Qiao, P. Bond behavior of epoxy-coated rebar in ultra-high performance concrete. Constr. Build. Mater. 2018, 182, 406–417. [Google Scholar] [CrossRef]
  29. Roy, M.; Hollmann, C.; Wille, K. Influence of volume fraction and orientation of fibers on the pullout behavior of reinforcement bar embedded in ultra high performance concrete. Constr. Build. Mater. 2017, 146, 582–593. [Google Scholar] [CrossRef]
  30. Frappa, G.; Pauletta, M.; Di Marco, C.; Russo, G. Experimental tests for the assessment of residual strength of r.c. structures after fire–Case Study. Eng. Struct. 2022, 252, 113681. [Google Scholar] [CrossRef]
  31. Tang, C.W. Effect of high temperatures on local bond–slip behavior between rebars and UHPC. Struct. Eng. Mech. 2022, 81, 163–178. [Google Scholar] [CrossRef]
  32. Fang, Z.; Chen, X.; Zhang, M.; Shan, R. Experimental Study on Performance of Lap-Spliced Ribbed Steel Bars in Reactive Powder Concrete. China Civ. Eng. J. 2019, 52, 20–28. [Google Scholar] [CrossRef]
  33. Ma, F.; Deng, M.; Sun, H.; Ye, W. Bond Behavior of Deformed Steel Bars Lap-Splice in Ultra High Performance Concrete. Acta Mater. Compos. Sin. 2021, 38, 3912–3924. [Google Scholar] [CrossRef]
  34. Chen, Y. Experimental and Analytical Study of Bond Behavior of High-Strength Reinforcing Steel in Ultra-High Performance Concrete. Master’s Thesis, Southeast University, Nanjing, China, 2020. [Google Scholar]
  35. Zhang, X.; Wu, X.; Zhang, X.; Wang, L.; Tang, Y.; Qiu, F. Bond behaviors of pre-and post-yield deformed rebar embedded in ultra-high performance concrete. Constr. Build. Mater. 2022, 341, 127839. [Google Scholar] [CrossRef]
  36. Qi, J.; Cheng, Z.; Ma, Z.J.; Wang, J.; Liu, J. Bond strength of reinforcing bars in ultra-high performance concrete: Experimental study and fiber–matrix discrete model. Eng. Struct. 2021, 248, 113290. [Google Scholar] [CrossRef]
  37. Pishro, A.A.; Feng, X. Experimental Study on Bond Stress between Ultra High Performance Concrete and Steel Reinforcement. Civ. Eng. J. 2017, 3, 1235–1246. [Google Scholar] [CrossRef]
  38. Pishro, A.A.; Feng, X.; Ping, Y.; Dengshi, H.; Shirazinejad, R.S. Comprehensive equation of local bond stress between UHPC and reinforcing steel bars. Constr. Build. Mater. 2020, 262, 119942. [Google Scholar] [CrossRef]
  39. Yang, T.; Xu, S.; Liu, Z.; Li, J.; Wu, P.; Yang, Y.; Wu, C. Experimental and numerical investigation of bond behavior between geopolymer based ultra-high-performance concrete and steel bars. Constr. Build. Mater. 2022, 345, 128220. [Google Scholar] [CrossRef]
  40. Xu, G.; Chen, B.; Zeng, J.; Gao, D.; Bao, H. Research on critical anchorage length of UHPC-CA and HTRB600E high-strength steel bars. Structures 2022, 41, 235–241. [Google Scholar] [CrossRef]
  41. Pan, R.; Liao, P.; Zou, J.; Zhou, X.; Li, C. Experimental investigation on bond performance of helically ribbed GFRP rebar embedded in Ultra-high performance concrete. Constr. Build. Mater. 2022, 357, 129295. [Google Scholar] [CrossRef]
  42. Xu, Y.; Shen, W.; Wang, H. Experimental Study on Bond and Anchorage Performance of Reinforced Concrete. J. Build. Struct. 1994, 26–37. [Google Scholar] [CrossRef]
  43. Goto, Y. Cracks formed in concrete around deformed tension bars. ACI J. 1971, 68, 244–251. [Google Scholar] [CrossRef]
  44. Somma, G.; Vit, M.; Frappa, G.; Pauletta, M.; Pitacco, I.; Russo, G. A new cracking model for concrete ties reinforced with bars having different diameters and bond laws. Eng. Struct. 2021, 235, 112026. [Google Scholar] [CrossRef]
  45. Akeed, M.H.; Qaidi, S.; Ahmed, H.U.; Emad, W.; Faraj, R.H.; Mohammed, A.S.; Tayeh, B.A.; Azevedo, A.R. Ultra-high-performance fiber-reinforced concrete. Part III: Fresh and hardened properties. Case Stud. Constr. Mater. 2022, 17, e01265. [Google Scholar] [CrossRef]
  46. Bahmani, H.; Mostofinejad, D. Microstructure of ultra-high-performance concrete (UHPC)–A review study. J. Build. Eng. 2022, 50, 104118. [Google Scholar] [CrossRef]
  47. Yang, J.; Chen, B.; Su, J.; Xu, G.; Zhang, D.; Zhou, J. Effects of fibers on the mechanical properties of UHPC: A review. J. Traffic Transp. Eng. 2022, 9, 363–387. [Google Scholar] [CrossRef]
  48. Yoo, D.-Y.; Shin, H.-O.; Yang, J.-M.; Yoon, Y.-S. Material and bond properties of ultra high performance fiber reinforced concrete with micro steel fibers. Compos. Part B Eng. 2014, 58, 122–133. [Google Scholar] [CrossRef]
  49. Gesoglu, M.; Güneyisi, E.; Muhyaddin, G.F.; Asaad, D.S. Strain hardening ultra-high performance fiber reinforced cementitious composites: Effect of fiber type and concentration. Compos. Part B Eng. 2016, 103, 74–83. [Google Scholar] [CrossRef]
  50. Wille, K.; Kim, D.J.; Naaman, A.E. Strain-hardening UHP-FRC with low fiber contents. Mater. Struct. 2011, 44, 583–598. [Google Scholar] [CrossRef]
  51. Liu, C.; Zhang, Y.; Yao, Y.; Huang, Y. Calculation method for flexural capacity of high strain-hardening ultra-high performance concrete T-beams. Struct. Concr. 2019, 20, 405–419. [Google Scholar] [CrossRef]
  52. Ragalwar, K. Systematic Development of Strain-Hardening Ultra-High Performance Concrete; State University of New York at Buffalo: Buffalo, NY, USA, 2019. [Google Scholar]
  53. Yoo, D.Y.; Yoon, Y.S. A review on structural behavior, design, and application of ultra-high-performance fiber-reinforced concrete. Int. J. Concr. Struct. Mater. 2016, 10, 125–142. [Google Scholar] [CrossRef]
  54. Guo, Z. Principles of Reinforced Concrete; Tsinghua University Press: Beijing, China, 1999; pp. 145–150. [Google Scholar]
  55. Reis, E.; de Azevedo, R.; Christoforo, A.; Poggiali, F.; Bezerra, A. Bonding of steel bars in concrete: A systematic review of the literature. Structures 2023, 49, 508–519. [Google Scholar] [CrossRef]
  56. He, S. Experimental Studies on Durability of Reinforced Concrete Members in Chloride Environment; Dalian University of Technology: Dalian, China, 2004. [Google Scholar]
  57. Wang, H.; He, S.; Gong, J. Experimental Studies on the Bond Character between Corroded Reinforcement and Concrete Subjected to Freeze-Thaw Cycles. Concrete 2007, 8, 1–3+10. [Google Scholar]
  58. Darwin, D.; Zuo, J.; Tholen, M.L.; Idun, E.K. Development Length Criteria for Conventional and High Relative Rib Area Reinforcing Bars; University of Kansas Center for Research, Inc.: Lawrence, KS, USA, 1995. [Google Scholar]
  59. Cheng, X. Study of the Strengthening Mechanism and Fracture Toughness of Steel Fiber Reinforced Concrete; Hohai University: Nanjing, China, 2005. [Google Scholar]
  60. Yang, M. Strengthening and Toughening Mechanism of Steel Fiber Reinforced High-Strength Concrete and Design Method Based on Toughness; Dalian University of Technology: Liaoning, China, 2006. [Google Scholar]
  61. Gao, D. Design and Application of Steel Fiber Reinforced Concrete; China Architecture & Building Press: Beijing, China, 2002; pp. 18–21. [Google Scholar]
  62. Wu, Z.; Shi, C.; He, W.; Wu, L. Effects of steel fiber content and shape on mechanical properties of ultra high performance concrete. Constr. Build. Mater. 2016, 103, 8–14. [Google Scholar] [CrossRef]
  63. Sahmaran, M.; Yaman, I. Hybrid fiber reinforced self-compacting concrete with a high-volume coarse fly ash. Constr. Build. Mater. 2007, 21, 150–156. [Google Scholar] [CrossRef]
  64. Yao, W.; Li, J.; Wu, K. Mechanical properties of hybrid fiber-reinforced concrete at low fiber volume fraction. Cem. Concr. Res. 2003, 33, 27–30. [Google Scholar] [CrossRef]
  65. Kusumawardaningsih, Y.; Fehling, E.; Ismail, M.; Aboubakr, A.A.M. Tensile strength behavior of UHPC and UHPFRC. Procedia Eng. 2015, 125, 1081–1086. [Google Scholar] [CrossRef]
  66. Yu, R.; Zhang, J.; Liu, K.; Liao, M.; Shui, Z.; Zeng, M.; Hu, F.; Hou, D.; Wang, X. Evaluation and regulation of Ultra-High Performance Concrete (UHPC) crack resistance based on physicochemical multi-factor coupling approach. Constr. Build. Mater. 2021, 301, 124100. [Google Scholar] [CrossRef]
  67. Liang, R.; Huang, Y. Experimental Study on Bond behavior between High Strength Steel Rebar and Ultra-High Performance Concrete. J. Build. Struct. 2022, 43, 294–302. [Google Scholar] [CrossRef]
  68. Le Hoang, A.; Fehling, E. Influence of steel fiber content and aspect ratio on the uniaxial tensile and compressive behavior of ultra high performance concrete. Constr. Build. Mater. 2017, 153, 790–806. [Google Scholar] [CrossRef]
  69. Shi, G.; Shao, X.; Gao, L.; Cao, J.; Chen, L. Experimental Research on Bond behavior between HRB400 Rebar and Ultra-High Performance Concrete. Bridge Constr. 2021, 51, 61–67. [Google Scholar]
  70. Marchand, P.; Baby, F.; Khadour, A.; Battesti, T.; Rivillon, P.; Quiertant, M.; Nguyen, H.-H.; Généreux, G.; Deveaud, J.-P.; Simon, A.; et al. Bond behaviour of reinforcing bars in UHPFRC. Mater. Struct. 2016, 49, 1979–1995. [Google Scholar] [CrossRef]
  71. Ronanki, V.S.; Aaleti, S.; Valentim, D.B. Experimental investigation of bond behavior of mild steel reinforcement in UHPC. Eng. Struct. 2018, 176, 707–718. [Google Scholar] [CrossRef]
  72. Li, Y.; Li, S.; Qiao, J.; Pan, J. Experimental research on bond behaviour between high-strength steel bars and ultra-high-performance fibre-reinforced concrete. Structures 2023, 50, 859–869. [Google Scholar] [CrossRef]
  73. Liu, H.; Liu, Y.; Li, A.; Lei, H. Experimental study on the bond performance of deformed steel bar in ultrahigh performance concrete. Case Stud. Constr. Mater. 2023, 18, e01874. [Google Scholar] [CrossRef]
  74. Hung, C.; Chen, Y.; Yen, C. Workability, fiber distribution, and mechanical properties of UHPC with hooked end steel macro-fibers. Constr. Build. Mater. 2020, 260, 119944. [Google Scholar] [CrossRef]
  75. Dupont, D.; Vandewalle, L. Distribution of steel fibres in rectangular sections. Cem. Concr. Compos. 2005, 27, 391–398. [Google Scholar] [CrossRef]
  76. Zuo, J.; Darwin, D. Bond Slip of High Relative Rib Area Bars Under Cyclic Loading. ACI Struct. J. 2000, 97, 331–334. [Google Scholar]
  77. Zhang, Y. Study on Bond Behavior between HRB500 Steel Bars and Reactive Powder Concrete. New Build. Mater. 2017, 44, 63–66. [Google Scholar]
  78. Kook, K.-H.; Shin, H.-O.; Kwahk, I.-J.; Yoon, Y.-S. Bond Characteristics of Ultra High Performance Concrete. J. Korea Concr. Inst. 2010, 22, 753–760. [Google Scholar] [CrossRef]
  79. Shao, Y.; Ostertag, C.P. Bond-slip behavior of steel reinforced UHPC under flexure: Experiment and prediction. Cem. Concr. Compos. 2022, 133, 104724. [Google Scholar] [CrossRef]
  80. Cheng, D.; Fan, Y.; Wang, Y. Bond-slip Constitutive Model of Steel Bars and Reactive Powder Concrete under Standard Curing. J. Jilin Univ. 2021, 51, 1317–1330. [Google Scholar] [CrossRef]
  81. Chu, S.; Kwan, A. A new bond model for reinforcing bars in steel fibre reinforced concrete. Cem. Concr. Compos. 2019, 104, 103405. [Google Scholar] [CrossRef]
  82. Kim, B.; Doh, J.-H.; Yi, C.-K.; Lee, J.-Y. Effects of structural fibers on bonding mechanism changes in interface between GFRP bar and concrete. Compos. Part B 2013, 45, 768–779. [Google Scholar] [CrossRef]
  83. Liang, R.; Huang, Y.; Xu, Z. Numerical Simulation of Lap-Spliced Ultra-High-Performance Concrete Beam Based on Bond–Slip. Buildings 2022, 12, 1257. [Google Scholar] [CrossRef]
  84. Dey, A.; Valiukas, D.; Jakubovskis, R.; Sokolov, A.; Kaklauskas, G. Experimental and Numerical Investigation of Bond-Slip Behavior of High-Strength Reinforced Concrete at Service Load. Materials 2022, 15, 293. [Google Scholar] [CrossRef] [PubMed]
  85. Li, M.; Liu, Z.; Yang, Z.; Wang, Z.; Yuan, H. Bond-slip behaviors between reinforced concrete and coated rebar via a new strain monitoring method and FEA simulation. Constr. Build. Mater. 2020, 262, 120402. [Google Scholar] [CrossRef]
  86. Kytinou, V.; Kosmidou, P.; Chalioris, C. Numerical Analysis Exterior RC Beam-Column Joints with CFRP Bars as Beam’s Tensional Reinforcement under Cyclic Reversal Deformations. Appl. Sci. 2022, 12, 7419. [Google Scholar] [CrossRef]
  87. Abaqus. Abaqus 6.1 Analysis User’s Manual; Simulia: Johnston, RI, USA, 2011. [Google Scholar]
  88. Rolland, A.; Argoul, P.; Benzarti, K.; Quiertant, M.; Chataigner, S.; Khadour, A. Analytical and numerical modeling of the bond behavior between FRP reinforcing bars and concrete. Constr. Build. Mater. 2020, 231, 117160. [Google Scholar] [CrossRef]
Figure 1. Bond composition of deformed rebar.
Buildings 13 01270 g001
Figure 2. Types of pull-out test: (a) central pull-out test; (b) eccentric pull-out test.
Buildings 13 01270 g002
Figure 3. Types of beam-type test: (a) full-beam test; (b) half-beam test.
Buildings 13 01270 g003aBuildings 13 01270 g003b
Figure 4. Factors affecting ultimate bond strength: (a) concrete compressive strength; (b) steel fiber volume content; (c) relative concrete cover thickness; (d) relative bond length.
Buildings 13 01270 g004
Figure 5. Average bond stress assumption.
Buildings 13 01270 g005
Figure 6. Data distribution: (a) test types; (b) UHPC compressive strength (MPa); (c) relative bond length; (d) steel fiber volume content (%); (e) relative concrete cover thickness; (f) rebar diameter (mm).
Buildings 13 01270 g006
Figure 7. Comparison of the model predictions with the measured results: (a) Sturm [13,17,21,23,27,36,48,77,78,79]; (b) Khaksefidi [13,17,21,23,27,36,77,78,79]; (c) Pishro [13,17,21,23,27,36,48,77,78,79]; (d) Chen [13,17,21,23,27,36,48,77,78,79]; (e) Ma [13,17,21,23,27,36,48,77,78,79]; (f) Yang [13,17,21,23,27,36,48,78]; (g) Liang [13,17,21,23,27,36,48,77,78,79]; (h) Zuo [13,17,21,23,27,36,48,77,78,79].
Buildings 13 01270 g007aBuildings 13 01270 g007b
Figure 8. Error percentage of secant stiffness corresponding to 70% peak load and test value.
Buildings 13 01270 g008
Figure 9. Comparison of the model predictions with the tested bond-slip ascending curves: (a) second batch-4 [11,19,23,28,35,39,71]; (b) UH-S [11,19,23,28,35,39,71]; (c) D16-C2-L3-2 [11,19,23,28,35,39,71].
Buildings 13 01270 g009
Figure 10. Comparison of the model predictions with the tested bond-slip curves: (a) second batch-4 [11,19,23,28,35,39,71]; (b) UH-S [11,19,23,28,35,39,71]; (c) D16-C2-L3-2 [11,19,23,28,35,39,71].
Buildings 13 01270 g010
Figure 11. Steel fiber volume content affects residual bond stress [15,21,67].
Buildings 13 01270 g011
Figure 12. Bond-slip curve explaining relevant parameters.
Buildings 13 01270 g012
Figure 13. Schematic diagram of spring constraint: (a) Liang et al. [83]; (b) Dey et al. [84].
Buildings 13 01270 g013
Table 1. Summary of ultimate bond strength equations.
ReferencesEquations
An and Zhang [12] τ u = 6.53 c d 0.74 l a d + 8.09 ; c / d [ 3.5 ,   5.0 ] ,   l a / d [ 2.0 ,   8.0 ]
Jia [13] τ u = ( 2.675 + 0.711 c d ) ( 0.65 + 1.257 d l a ) ( 0.815 + 0.1 V f ) f c
Deng and Yuan [17] τ u f t , s = 0.385 l a d + 3.742
τ u f t , s = 0.049 ( c d ) 2 + 0.584 ( c d ) + 1.146
Liu [14] τ u = ( 0.30885 + 2.42609 d l a ) ( 3.4812 + 0.07818 c d ) f t
Sun et al. [24] τ u f c = 0.45 + 0.53 c d + 4.83 d l a ; c / d [ 1.0 ,   2.2 ]
Roy et al. [29] τ u = ( 0.45 c d + 38.5 l a + 0.23 V f ) f t
Sturm and Visintin [11] τ u = ( 0.0018 c + 0.186 ) f c
Khaksefidi et al. [26] τ u f c = 3.80155 1.09203 ( l a d ) + 0.07389 ( c d ) + 0.00641 ( f y )
Fang et al. [32] τ u l = α ( 1 + 0.55 d l a ) ( 1 + 0.22 c d + 0.22 ρ v ) f c ; α [ 0.9 ,   1.0 ]
Pishro et al. [38] τ u = 26.8276 c d c d + 7.7136 + 0.5 f c
Hu et al. [21] τ u = f t c + r 1.664 d + 1.279 × 10⁵ × ε 0 d l a [ 1 exp ( μ ) ]
Chen [34] τ u = ( 1.5486 + 4.0437 d l a ) ( 0.6474 + 0.1303 c d ) f c ; c / d 5.0
Ma et al. [33]Anchorage: τ u = ( 0.53 + 2.31 d l a ) ( 3.633 + 0.217 c d ) ( 0.604 + 1.839 V f ) f c
Lap: τ u l = ( 0.36 + 2.02 d l a ) ( 0.86 + 0.57 c d ) ( 0.83 + 2 ρ s v + 11.65 V f ) f c
c / d 5.0 , when c / d is greater than 5, c / d takes 5.
Yang et al. [39] τ u = f c ( 0.69 + 0.08 c d ) ( 0.18 + 3.3 d l a ) ( 0.73 + 0.31 f u 100 ) ( 0.1 + 11.9 d )
Liang et al. [19] τ u = f c ( 0.13 c d + 0.47 λ f + 3.91 ) ; λ f = V f l f d f
Li [16]Formula for 16 mm diameter rebar:
τ u f c = 0.3143 + 3.35 c d + 0.08673 l a d 0.482 ( c d ) 2 0.3388 c d × l a d
Formula for 12 mm diameter rebar:
τ u f c = 2.459 c d 0.4854 l a d + 1.135
Formula for 8 mm diameter rebar:
τ u f c = 1.774 c d 0.4763 l a d + 1.717
Li et al. [72] τ u = ( 0.512 + 1.384 d l a ) ( 2.998 + 0.482 c d + 145.217 ρ s v ) ( 0.755 + 2.681 V f ) f c
Liu et al. [73]Linear regression model:
τ u = [ 0.8105 ( l a d ) + 0.1422 ( c d ) + 0.9423 f t ] f c
Nonlinear regression model:
τ u = [ 0.4123 ( l d ) 2 0.0655 ( c d ) 2 + 0.2104 f t 2 0.0296 ( l d ) ( c d ) 0.5129 ( l d ) f t + 0.1204 ( c d ) f t ] f c
Note: τ u , τ u l : ultimate bond strength of reinforcement anchorage form and reinforcement overlap form; c : concrete cover thickness; r , d : rebar radius and diameter; l a : bond length; V f : steel fiber volume content; f c , f t , s , f t : compressive strength, splitting strength and tensile strength of concrete; f y , f u : yield strength and tensile strength of rebar; α : rebar overlap coefficient; ρ v : stirrup ratio; ε 0 : concrete shrinkage; μ : friction coefficient between reinforcement and UHPC; l f : steel fiber length; d f : steel fiber diameter.
Table 2. Summary of bond test parameters from references.
ReferencesNumber f c
(MPa)
l a
(mm)
V f
(%)
c
(mm)
d
(mm)
f y
(MPa)
f u
(MPa)
l f / d f
Hu et al. [21]19100.2–159.820–560–3.016–718–25442.3–618.0581.1–791.97/0.18
Alkaysi and El-Tawil [27]2588.0–191.050–1001.0–2.065.5–68.513–19415.5–497.9586.4–707.719/0.2
Qi et al. [36]32150.432–1602.08–4016–20428.4–437.2573.4–586.313/0.2
Deng and Yuan [17]27135.3–170.724–721.5–3.066–718–18566.7–589.4682.0–738.913/0.2
Zhang [77]27132.2–166.318–1201.0–2.025–7010–20454.8–573.612/0.22
Yoo et al. [48]12184.9–207.216–321.0–4.06716607.0–766.013/0.2
Kyung et al. [78]40183.39.5–66.62.09.5–9010–22400.0–700.013/0.2
Jia [13]1188.7–141.250–800–2.015–2516378.0550.013~15/0.22
Shao and Ostertag [79]5124.8–189.630–401.025–5116–25713.0–721.013/0.2
Shao et al. [23]6172.7–174.0481.0–2.02416470.0674.013/0.2
Table 3. Summary of bond-slip constitutive model between rebar and UHPC or UHPFRC.
ReferencesConstitutive Model
Yoo et al. [48] τ = τ u ( 1 e s / s r ) α ; s r = 0.07 , α = 0.8
Liu [14] τ τ u = ( s s 1 ) ( 0.57304 0.01327 d / l a + 0.00728 c / d )
Marchand et al. [70] τ = { τ u [ 1 ( s 1 s s 1 ) α ]   0 s s 1 τ u s 1 s s 2 τ u ( τ u τ r ) ( s s 2 ) ( s 3 s 2 ) s 2 s s 3 τ r s 3 s ;
τ r = 0.4   τ u , s 1 = 0.1   mm , s 2 = 0.6     mm , s 3 is distance between rebar ribs, α = 3
Zhou and Qiao [28]Ascending: τ τ u = ( s s 1 ) α
Descending: τ τ u = s / s 1 β ( s / s 1 1 ) 3 + s / s 1
α [ 0.1 ,   0.4 ] , β [ 0.01 , 3.15 ]
Sturm and Visintin [11]Splitting failure:
τ = { τ u ( s s 1 ) α s 1 < s τ 2 ( 1 s s 1 s 3 s 1 ) ( l i n e a r ) s 1 < s < s 3 o r τ u e β ( s s 1 ) ( n o n l i n e a r ) s > s 1
Pull-out failure:
τ = { τ u ( s s 1 ) α s 1 < s τ u s 1 < s < s 2 τ u ( 1 s s 1 s 3 s 1 ) ( l i n e a r ) s 2 < s < s 3 o r τ u e β ( s s 2 ) ( n o n l i n e a r ) s > s 2 ;
α [ 0.352 , 2.497 ] , β [ 0.645 , 1.491 ]
Cheng et al. [80] τ = { k 1 s + τ 0 0 < s < s 0   k 2 + k 3 s + k 4 s 2 s 0 s < s 1 k 5 + k 6 s s 1 s < s 3 τ r s s 3 ;
τ 0 = ( 0.49 l a / d + 4.71 ) ( 0.65 d / l a + 0.41 ) ( 17.88 + f c )
τ r = ( 0.06 l a / d + 0.98 ) ( 3.07 d / l a + 1.83 ) ( 0.02 V f + 0.04 ) ( 230.77 + f c )
s 0 = ( 0.07 l a / d + 0.33 ) [ 1.19 7.58 d / l a + 14.87 ( d / l a ) 2 ]
s 1 = ( 0.003 l a / d 0.01 ) ( 0.07 d / l a + 159.79 ) ( 0.18 f c 0.86 )
s 3 = ( 1.09 l a / d + 21.79 ) [ 0.62 + 0.07 V f 0.23 V f 2 + 0.09 V f 3 ]
Yang et al. [39] τ = { k 1 s 0 < s s 1 k 2 s 2 k 3 s + k 4 s 1 < s < s 3 τ r s 3 < s ;
k 1 = τ u s 1 , k 2 = τ r τ u ( s 3 s 1 ) 2 , k 3 = 2 s 1 ( τ r τ u ) ( s 3 s 1 ) 2 , k 4 = τ r ( s 3 s 1 ) 2 + ( τ r τ u ) ( 2 s 1 s 3 s 3 2 ) ( s 3 s 1 ) 2
Liang et al. [19]Ascending: τ = τ u ( 1 e s / s r ) α s s 1
Descending: τ = τ u e β ( s s 1 ) s > s 1
s r = 0.112 , α = 0.805 , β = 0.157
Shao et al. [23] τ = { s s 1 · τ u 0 s s 1 τ u s 1 s s 2 τ u τ u τ r s 3 s 2 · ( s s 2 ) s 2 s s 3 τ r s 3 s ;
s 1 = 0.2   mm , s 2 = 0.5   mm
Zhang et al. [35] τ = { τ c r + ( τ u τ c r ) ( s s 1 ) α 0 s s 1 τ r + ( s s 3 ) ( τ u τ r ) ( s 1 s 3 ) s 1 < s s 3 τ r s 3 < s ;
Before rebar yields:
τ c r = 0.40   τ u ; s 1 = 0.20   mm ; τ r = 0.15   τ u ; s 3 is distance between rebar ribs; α = 0.40
After rebar yields:
τ c r = 0.15   τ u ; s 1 = 2.0   mm ; τ r = 0.25   τ u ; s 3 = 1.05   d ; α = 0.13
Note: τ : bond stress; s : slip; s r , α , β : fitting parameters of the test results; τ u : ultimate bond strength; d : rebar diameter; l a : bond length; c : concrete cover thickness; f c : concrete compressive strength; V f : steel fiber volume content; s 0 , s 1 , s 2 , s 3 : slip corresponding to the endpoint of the ascending linear section, slip corresponding to ultimate bond strength, slip corresponding to the endpoint of the stress platform section, and slip corresponding to residual bond strength.
Table 4. Parameters of selected bond-slip constitutive models.
References α β
Marchand3.000
Zhou0.2500.010
Sturm0.5000.645
Yang
Liang0.8050.157
Shao
Zhang0.400
Table 5. Error percentage of slip corresponding to 85% and 50% τ u and test value.
ReferencesNumber τ MarchandZhouSturmYangLiangShaoZhang
Hu et al. [21]2085% τ u 34.0%47.9%61.6%100.0%33.1%66.1%55.8%
1550% τ u 30.8%81.2%84.7%19.9%48.0%16.9%29.8%
Liang and Huang [67]2285% τ u 84.6%50.4%58.8%119.5%30.9%40.4%129.0%
2150% τ u 95.4%74.8%73.1%59.8%21.6%42.8%99.2%
Zhang et al. [15]2185% τ u 30.9%44.3%56.8%41.0%33.1%26.2%66.5%
1350% τ u 44.8%66.7%73.5%28.3%19.6%27.3%48.0%
Note: residual bond stress value of some data is relatively high, which is not included in the slip error analysis at 50% τ u .
Disclaimer/Publisher’s Note: The statements, opinions and data contained in all publications are solely those of the individual author(s) and contributor(s) and not of MDPI and/or the editor(s). MDPI and/or the editor(s) disclaim responsibility for any injury to people or property resulting from any ideas, methods, instructions or products referred to in the content.

