

Lessons Learned from the COVID-19 Pandemic: A Multigroup Structural Equation Modelling of Underground Space Environment and Users’ Health

Abstract
:1. Introduction
- Identify multidimensional underground environment factors;
- Investigate the impacts of the underground environment factors on underground space users’ health before and after the pandemic.
- The study expands the theoretical built environment–quality of life (QoL) model by developing an empirical, integrated underground environment–health model for user’s physical and psychological health, before and after the pandemic.
- Underground spaces, building services, and supporting elements significantly affecting users’ health before and after the pandemic are unveiled and compared.
- It provides practical recommendations for fostering a health-centric underground environment for the post-pandemic era.
2. Theoretical Framework
2.1. Underground Space Management
2.2. Underground Building Services
2.3. Underground Supporting Elements
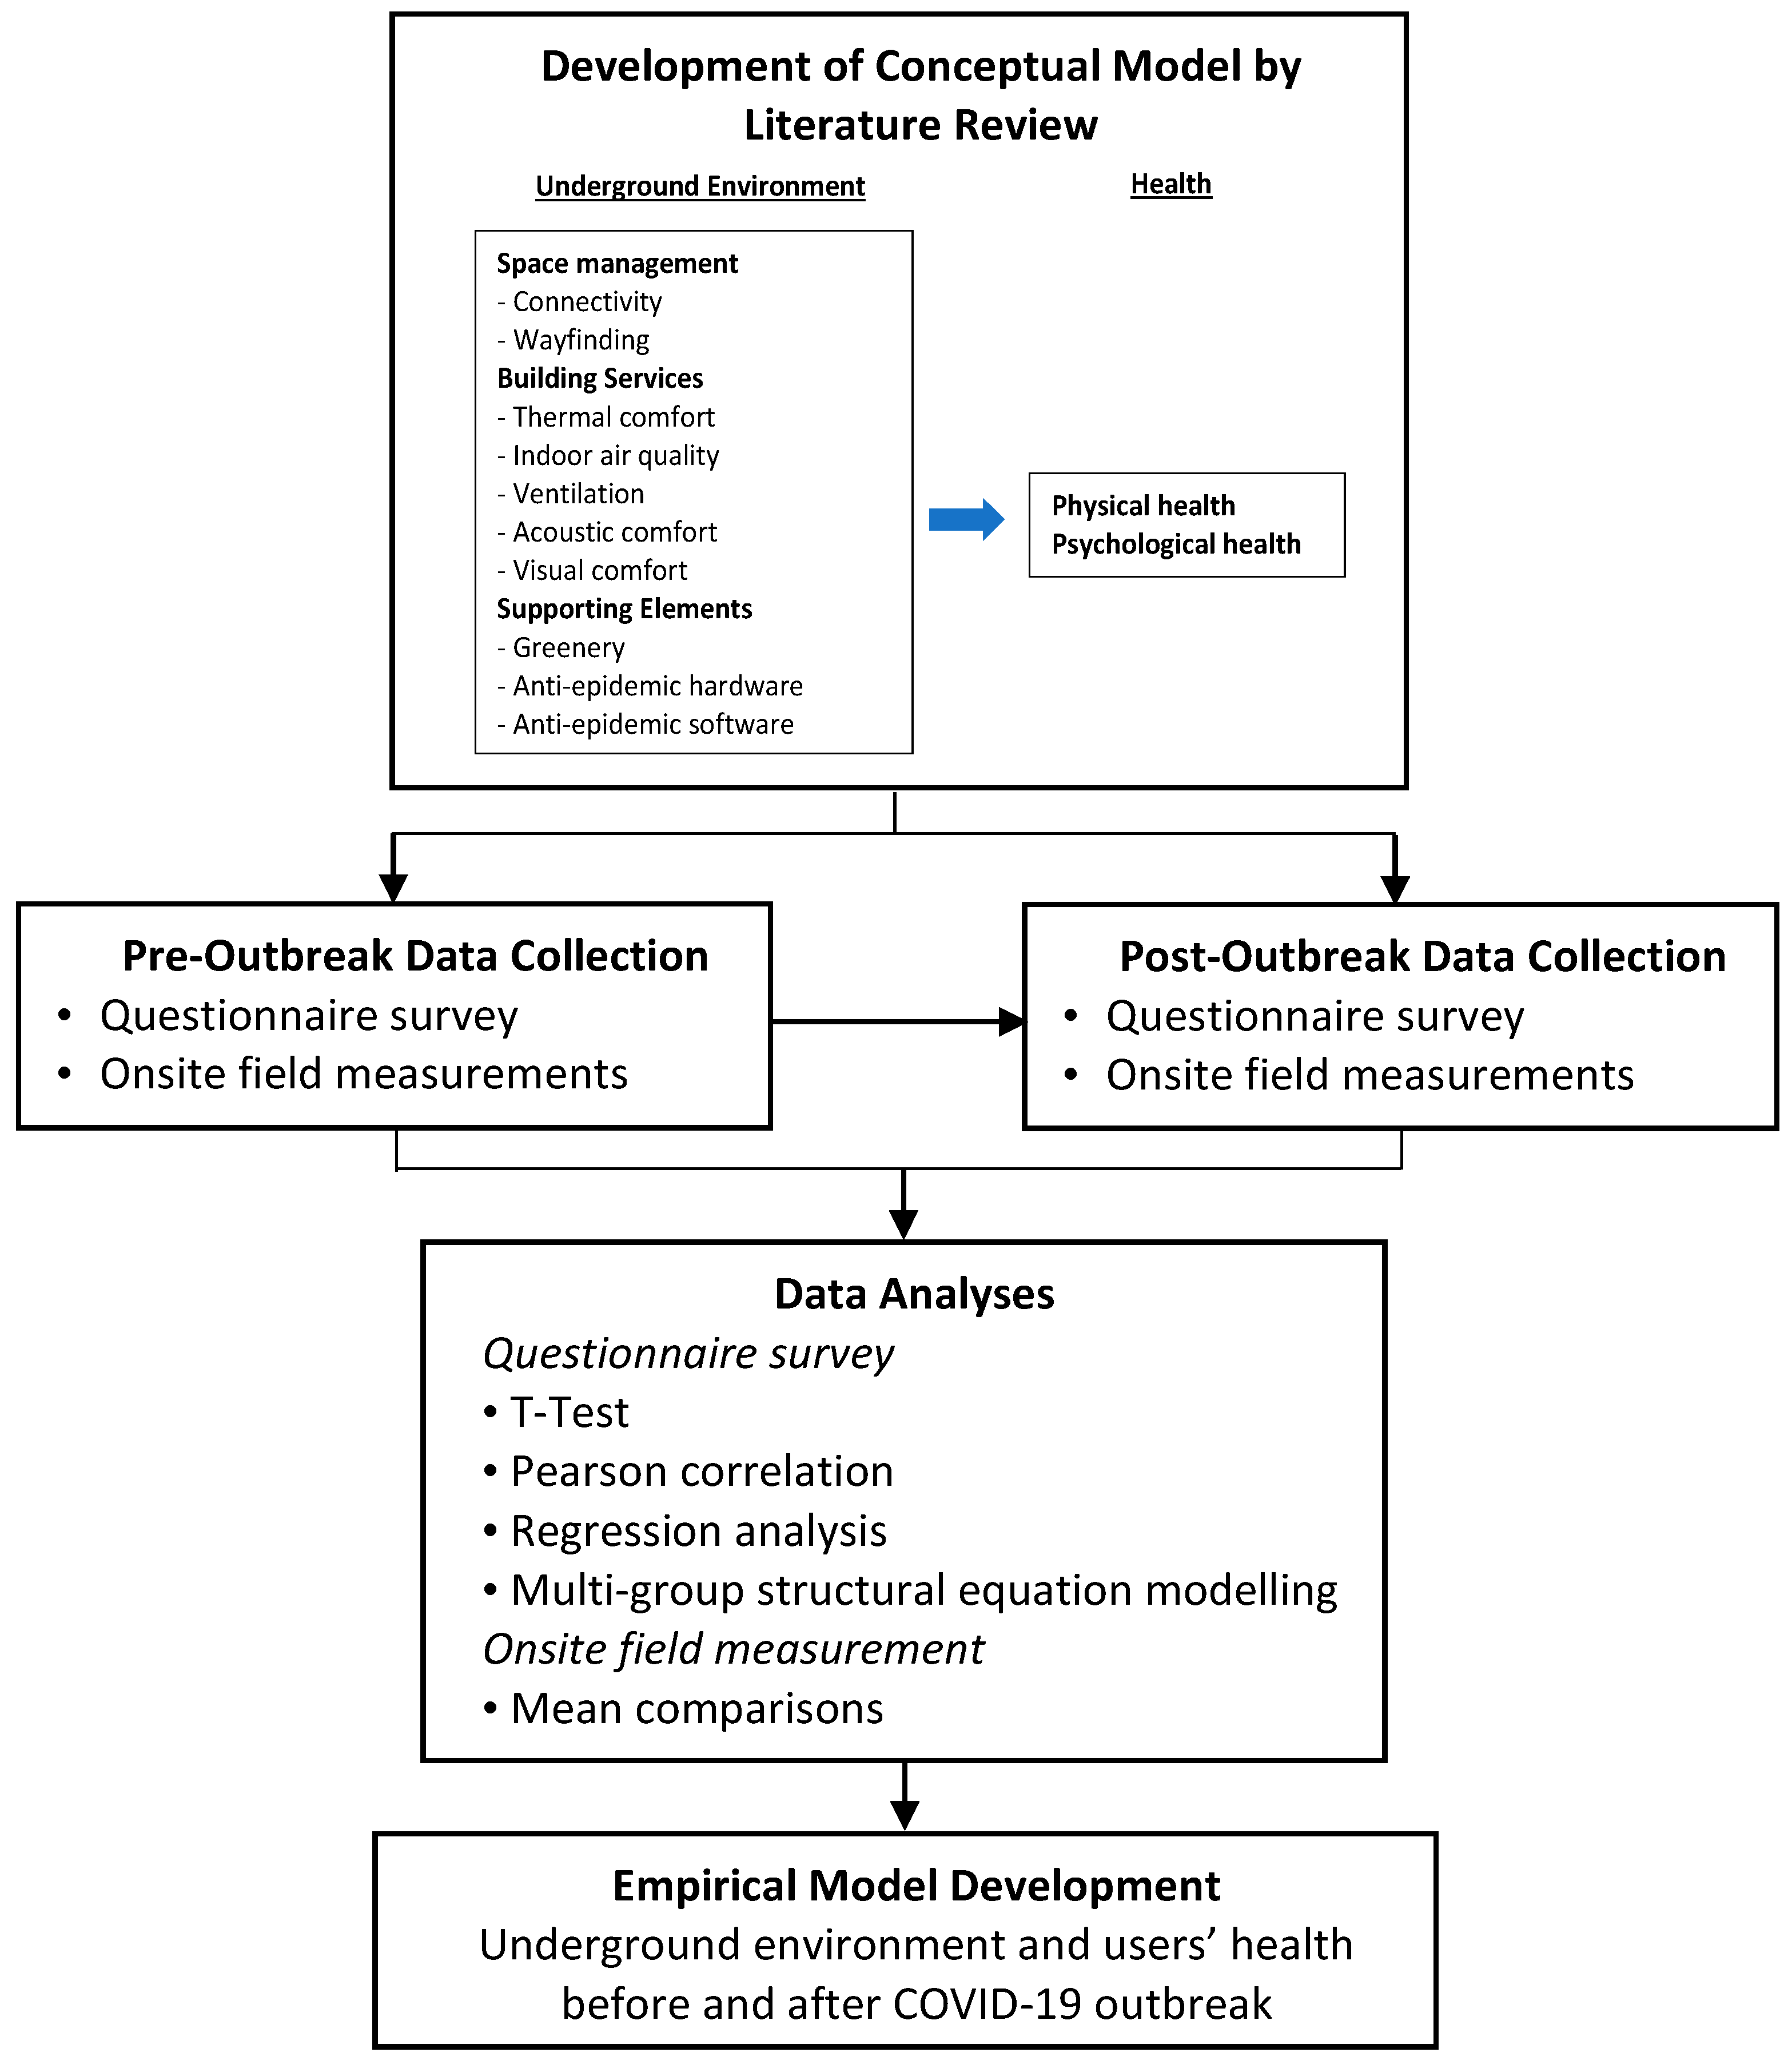
3. Conceptual Underground Environment–Health Model
4. Research Methods
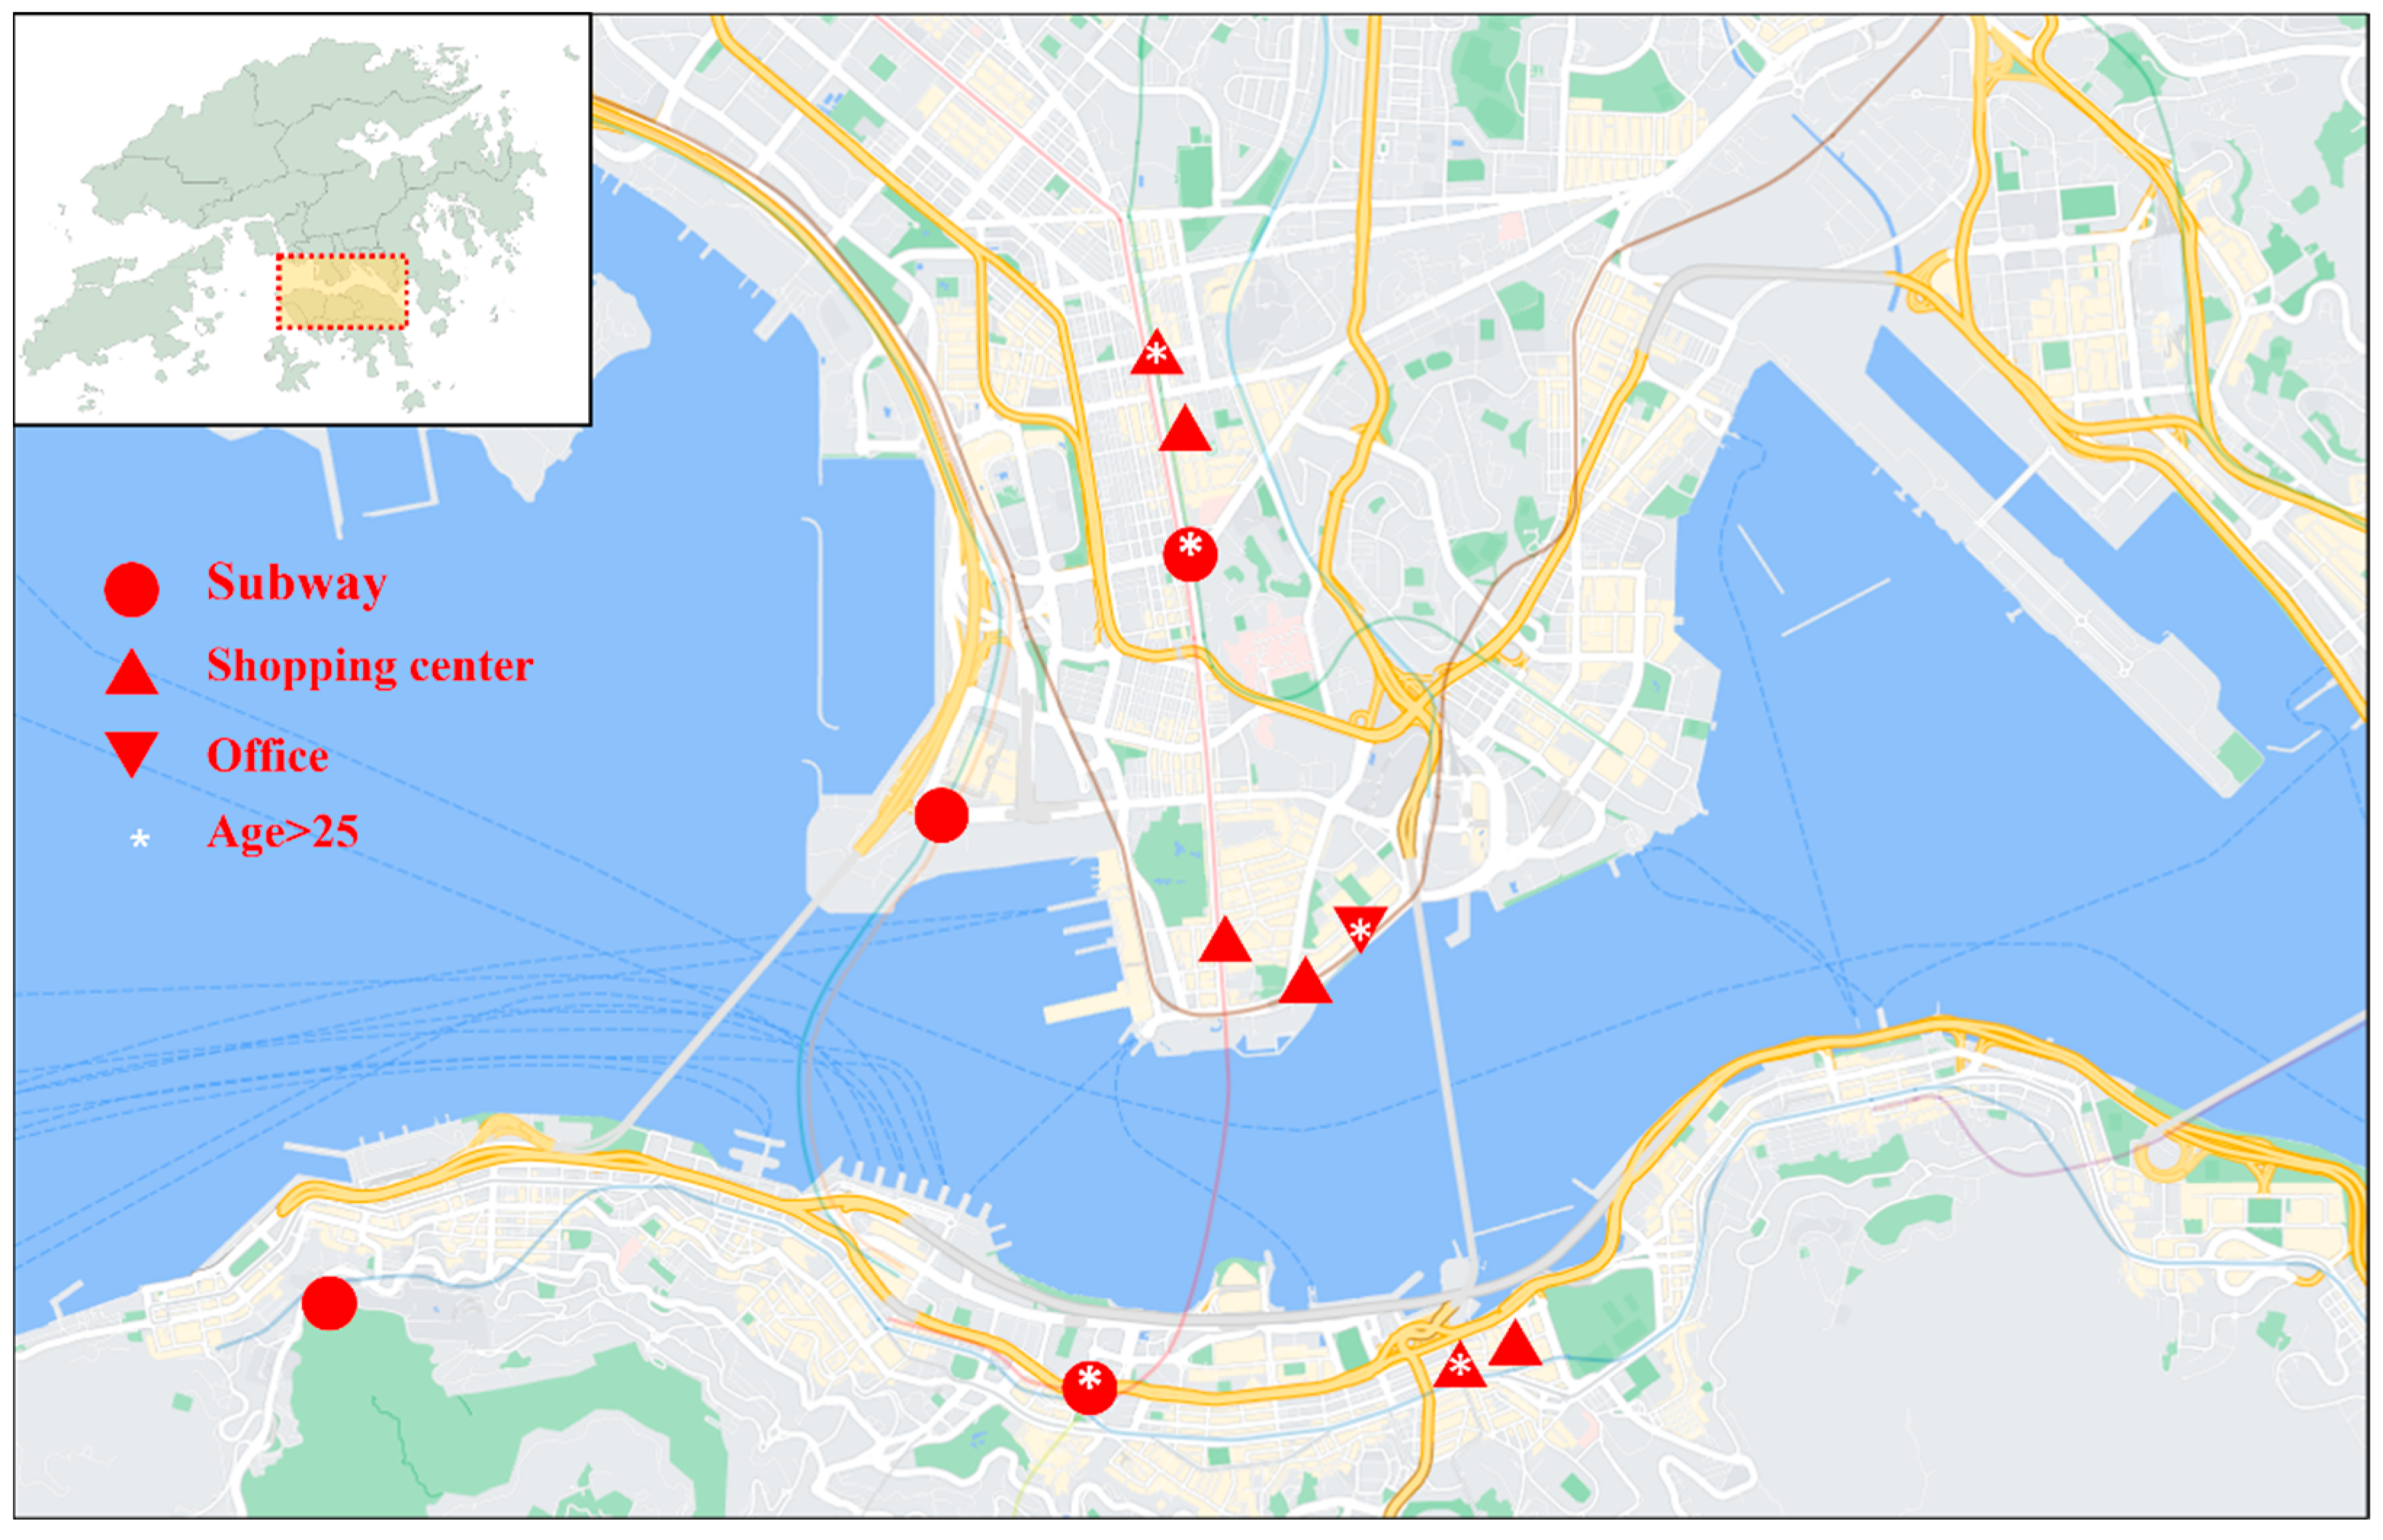
4.1. Survey Sites
4.2. Survey Data Collection and Analyses
4.3. Survey Measurements
4.4. Onsite Field Measurement Methods
5. Analyses and Findings
5.1. Demographics of Survey Respondents
5.2. Reliability Test
5.3. Independent t-Test and Factor Comparisons
- (1)
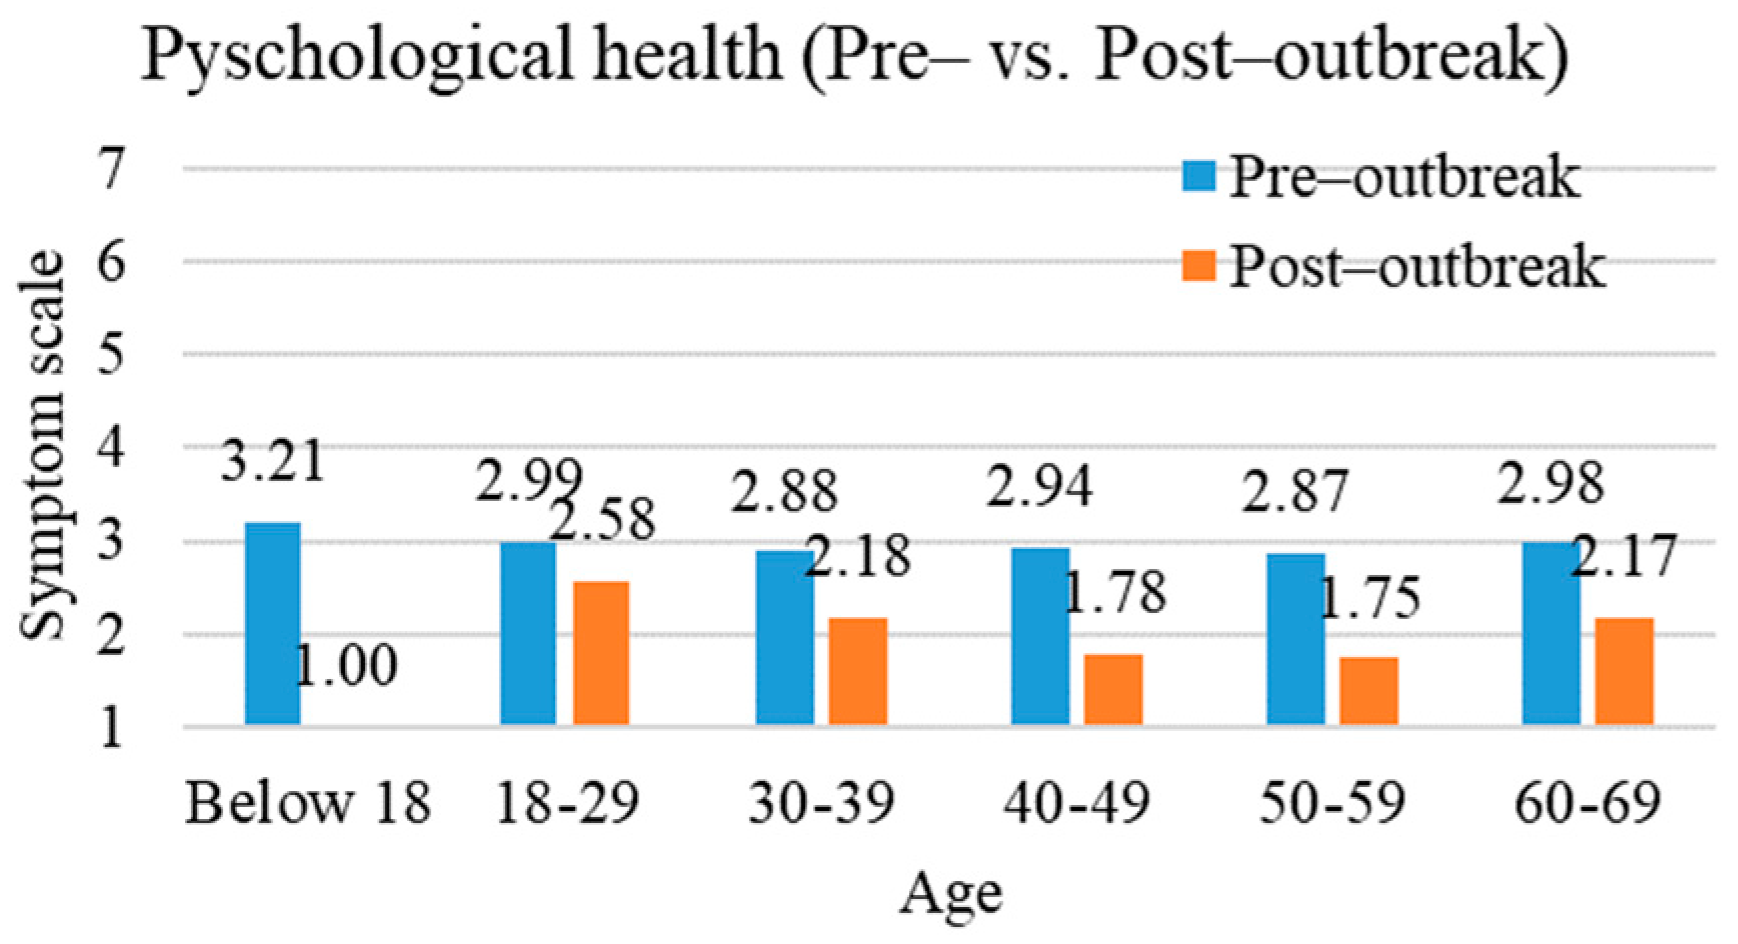
- Pre- and Post-Outbreak Comparisons:
- (2)
- Comparisons between different types of underground spaces:
5.4. Pearson Correlation Analysis
5.5. Regression Analyses
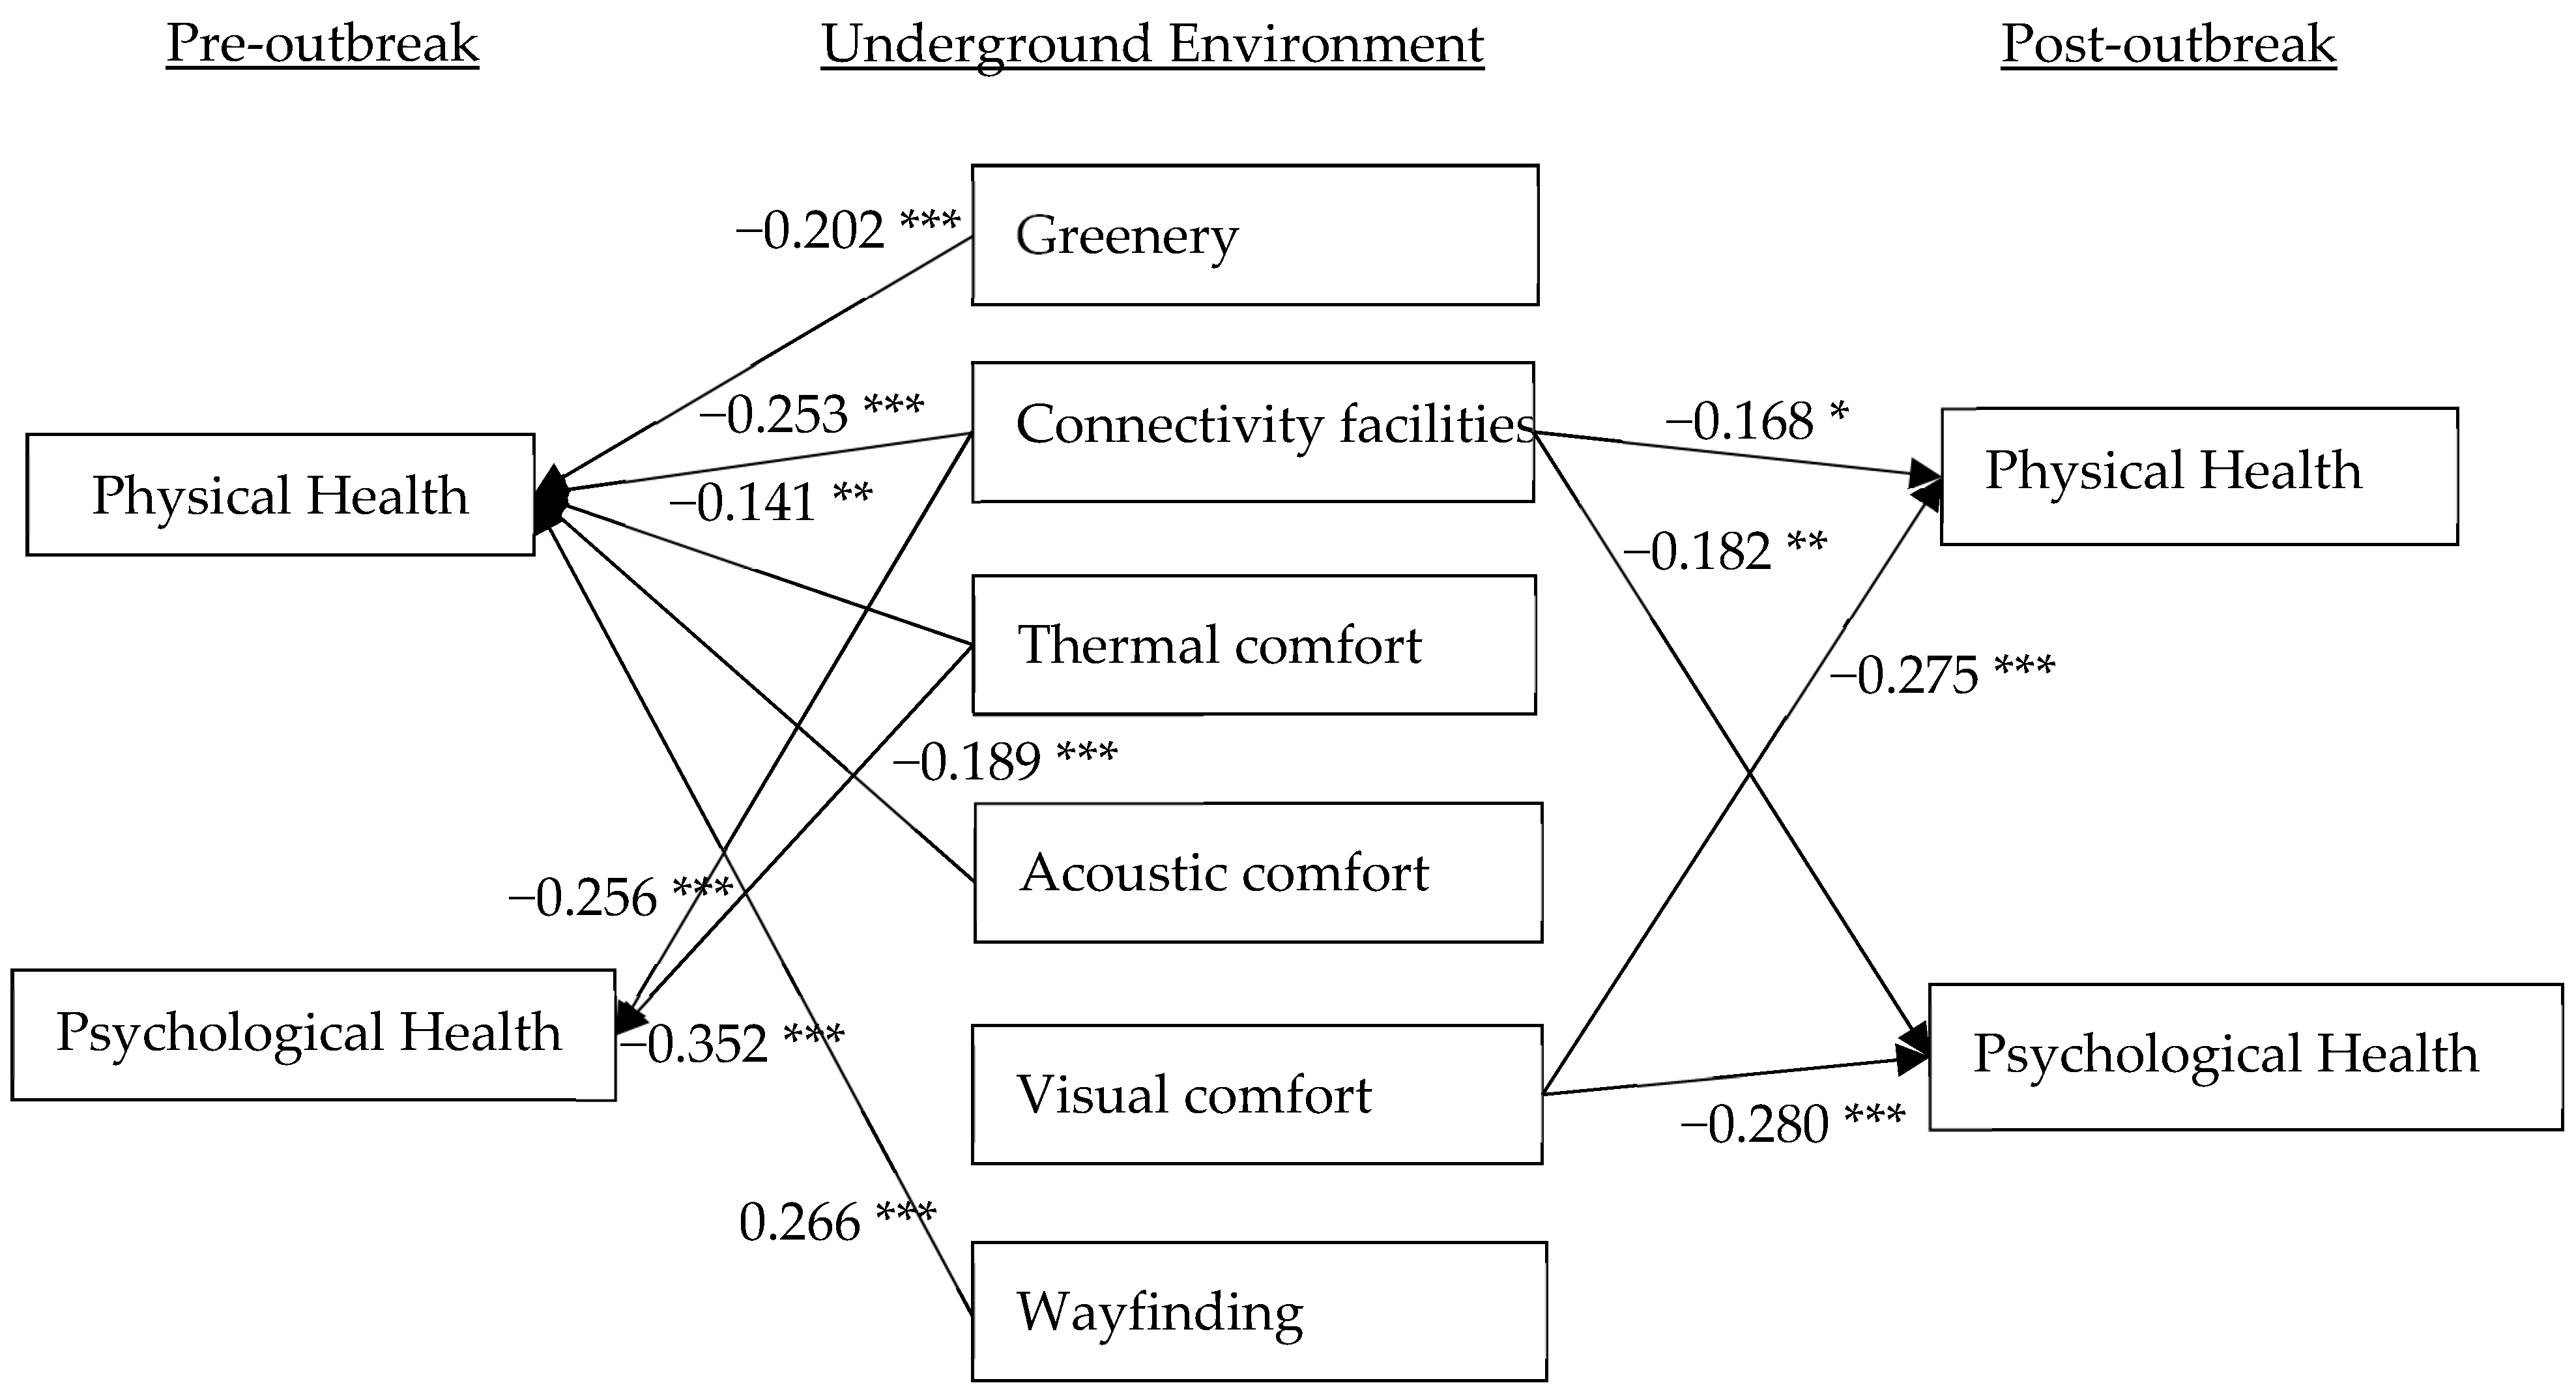
5.6. Multi-Group Structural Equation Modelling
5.7. Objective Field Measurement Results
5.8. Other Important Health-Centric Underground Environment Elements in the Post-Outbreak Era
6. Discussion
6.1. Changes in Levels of Underground Environment and Health after COVID-19 Outbreak
6.2. Underground Environment Factors Influencing Users’ Health after COVID-19 Outbreak
6.2.1. Visual Comfort and Users’ Health after COVID-19 Outbreak
6.2.2. Connectivity Facilities and Users’ Health after COVID-19 Outbreak
6.3. Changes in Underground Environment Factors Influencing Users’ Health after COVID-19 Outbreak
6.4. Evidence-Based Recommendations for Health-Centric Underground Environment Elements in the Post-Outbreak Era
7. Research Implications
8. Conclusions
Author Contributions
Funding
Data Availability Statement
Conflicts of Interest
Appendix A

| Measurement Items for Health (Pre- and Post-Outbreak) | References | |
|---|---|---|
| Physical health | ||
| 1. | Dry eye | [33,70] |
| 2. | Itchy or watery eyes | |
| 3. | Blocked or stuffy nose | |
| 4. | Runny nose | |
| 5. | Dry throat | |
| 6. | Lethargy or tiredness | |
| 7. | Headaches | |
| 8. | Dry, itching or irritated skin | |
| 9. | Sneezing | |
| 10. | Breathing Difficulties | |
| 11. | Insomnia | |
| Psychological health | ||
| 1. | I feel emotionally drained by my work | [69,135] |
| 2. | I feel used up at the end of the workday | |
| 3. | I feel fatigued when I have to get up in the morning to face another day on the job | |
| 4. | I feel “burned out” from my work | |
| 5. | I worry that this job is hardening me emotionally | |
| 6. | I feel frustrated by my job | |
| 7. | I feel I’m working too hard on my job | |
| 8. | I feel like I’m at the end of my rope | |
| Measurement Items for Underground Environment (Pre- and Post-Outbreak) | References | |
|---|---|---|
| 1. | How satisfied are you with the number of natural landscape elements in this underground work environment? eg. plants, wood, stone, water, images of outdoor etc. | [107,136,137] |
| 2. | What do you think about the easiness of the immediate access to aboveground? | |
| 3. | How satisfied are you with the wayfinding support in this underground work environment? | |
| 4. | How satisfied are you with the thermal comfort in this underground work environment? | |
| 5. | How satisfied are you with the ventilation in the underground work environment? | |
| 6. | How satisfied are you with the air quality in the underground work environment (i.e., stuffy/stale air, cleanliness, odours)? | |
| 7. | How satisfied are you with the noise level in the underground work environment? | |
| 8. | How satisfied are you with the visual comfort of the light in the underground work environment? | |
| Measurement Items for Anti-Epidemic Hardware and Software (Post-Outbreak) | References | |
|---|---|---|
| 1. | How satisfied with the overall hygiene and cleanliness in the underground environment? | [138,139] |
| 2. | How satisfied are you with the temperature checking at entrance of the underground environment? | |
| 3. | How satisfied are you with the temperature checking in common areas of the underground environment? | |
| 4. | How satisfied are you with the temperature checking in office/shop in the underground environment? | |
| 5. | How satisfied are you with the hand sanitizer at entrance in the underground environment? | |
| 6. | How satisfied are you with the hand sanitizer in common areas in the underground environment? | |
| 7. | How satisfied are you with the hand sanitizer in office/shop in the underground environment? | |
| 8. | How satisfied are you with the public education or promotion on hygienic practices in the underground environment (e.g., signage, posters)? | |
| 9. | How satisfied with the overall disinfection products in the underground environment (e.g., handrail sterilizer on escalator, touchless button in lift, touchless mask disposal bin, automatic-entrance door)? | |
| 10. | How satisfied are you with the crowd control in the underground environment? | |
- Open question
References
- WHO. WHO Coronavirus (COVID-19) Dashboard. Available online: https://covid19.who.int/ (accessed on 15 May 2022).
- Ding, S.; Teo, Z.W.; Wan, M.P.; Ng, B.F. Aerosols from speaking can linger in the air for up to nine hours. Build. Environ. 2021, 205, 108239. [Google Scholar] [CrossRef]
- Zivelonghi, A.; Lai, M. Mitigating aerosol infection risk in school buildings: The role of natural ventilation, volume, occupancy and CO2 monitoring. Build. Environ. 2021, 204, 108139. [Google Scholar] [CrossRef]
- Stabile, L.; Pacitto, A.; Mikszewski, A.; Morawska, L.; Buonanno, G. Ventilation procedures to minimize the airborne transmission of viruses in classrooms. Build. Environ. 2021, 202, 108042. [Google Scholar] [CrossRef]
- Rencken, G.K.; Rutherford, E.K.; Ghanta, N.; Kongoletos, J.; Glicksman, L. Patterns of SARS-CoV-2 aerosol spread in typical classrooms. Build. Environ. 2021, 204, 108167. [Google Scholar] [CrossRef]
- PATH Your Guide to the World’s Largest Underground Shopping Complex. Available online: http://torontopath.com/ (accessed on 20 May 2022).
- Zhang, P. Japanese Ways of Developing Urban Underground Recreation Space. World J. Eng. Technol. 2018, 6, 14. [Google Scholar] [CrossRef]
- Ting, W.P. Deepest Tunnels in S’pore to Start Carrying Electricity from End-2018. Available online: https://www.todayonline.com/singapore/deepest-tunnels-spore-start-carrying-electricity-end-2018 (accessed on 20 May 2022).
- CEDD. Territory-Wide Study on Underground Space Development in the Urban Areas of Hong Kong. Available online: https://www.cedd.gov.hk/eng/about-us/organisation/geo/projects/territory-wide-study-on-underground-space-developm/index.html (accessed on 20 May 2022).
- Halberthal, M.; Berger, G.; Hussein, K.; Reisner, S.; Mekel, M.; Horowitz, N.A.; Shachor-Meyouhas, Y.; Geffen, Y.; Hyams, G.; Beyar, R. Israeli underground hospital conversion for treating COVID-19 patients. Am. J. Disaster Med. 2020, 15, 9. [Google Scholar] [CrossRef]
- Yip, T.L.; Huang, Y.; Liang, C. Built environment and the metropolitan pandemic: Analysis of the COVID-19 spread in Hong Kong. Build. Environ. 2021, 188, 107471. [Google Scholar] [CrossRef]
- Chan, I.; Soh, C.K.; Chen, H. Enhancing underground development users’ health through facilities management: A study of the underground metro system in Hong Kong. IOP Conf. Ser. Earth Environ. Sci. 2021, 703, 012043. [Google Scholar] [CrossRef]
- Baron, Y.M. Elevated levels of PM2.5 in crowded Subways of Cities with High COVID-19 related Mortality. medRxiv 2020. medRxiv: 2020.06.24.20138735. [Google Scholar]
- Dunleavy, G.; Bajpai, R.; Tonon, A.C.; Cheung, K.L.; Thach, T.-Q.; Rykov, Y.; Soh, C.-K.; de Vries, H.; Car, J.; Christopoulos, G. Prevalence of psychological distress and its association with perceived indoor environmental quality and workplace factors in under and aboveground workplaces. Build. Environ. 2020, 175, 106799. [Google Scholar] [CrossRef]
- Hoisington, A.J.; Stearns-Yoder, K.A.; Schuldt, S.J.; Beemer, C.J.; Maestre, J.P.; Kinney, K.A.; Postolache, T.T.; Lowry, C.A.; Brenner, L.A. Ten questions concerning the built environment and mental health. Build. Environ. 2019, 155, 58–69. [Google Scholar] [CrossRef]
- Zhang, Y.; Tzortzopoulos, P.; Kagioglou, M. Healing built-environment effects on health outcomes: Environment–occupant–health framework. Build. Res. Inf. 2019, 47, 747–766. [Google Scholar] [CrossRef]
- Pavón, R.M.; Arcos Alvarez, A.A.; Alberti, M.G. Possibilities of BIM-FM for the Management of COVID in Public Buildings. Sustainability 2020, 12, 9974. [Google Scholar] [CrossRef]
- Akbari, P.; Yazdanfar, S.-A.; Hosseini, S.-B.; Norouzian-Maleki, S. Housing and mental health during outbreak of COVID-19. J. Build. Eng. 2021, 43, 102919. [Google Scholar] [CrossRef]
- Awada, M.; Becerik-Gerber, B.; Hoque, S.; O’Neill, Z.; Pedrielli, G.; Wen, J.; Wu, T. Ten questions concerning occupant health in buildings during normal operations and extreme events including the COVID-19 pandemic. Build. Environ. 2021, 188, 107480. [Google Scholar] [CrossRef]
- Dzhambov, A.M.; Lercher, P.; Browning, M.H.E.M.; Stoyanov, D.; Petrova, N.; Novakov, S.; Dimitrova, D.D. Does greenery experienced indoors and outdoors provide an escape and support mental health during the COVID-19 quarantine? Environ. Res. 2021, 196, 110420. [Google Scholar]
- Zarrabi, M.; Yazdanfar, S.-A.; Hosseini, S.-B. COVID-19 and healthy home preferences: The case of apartment residents in Tehran. J. Build. Eng. 2021, 35, 102021. [Google Scholar] [CrossRef]
- Yi, Y.K. Building facade multi-objective optimization for daylight and aesthetical perception. Build. Environ. 2019, 156, 178–190. [Google Scholar] [CrossRef]
- Leung, M.-Y.; Famakin, I.O.; Wang, C. Developing an integrated indoor built environment–quality of life model for the elderly in public and subsidized housing. Eng. Constr. Archit. Manag. 2019, 26, 1498–1517. [Google Scholar] [CrossRef]
- Leung, M.-Y.; Wang, C.; Famakin, I.O. Integrated model for indoor built environment and cognitive functional ability of older residents with dementia in care and attention homes. Build. Environ. 2021, 195, 107734. [Google Scholar] [CrossRef]
- Leung, M.-Y.; Wang, C.; Wei, X. Structural model for the relationships between indoor built environment and behaviors of residents with dementia in care and attention homes. Build. Environ. 2020, 169, 106532. [Google Scholar] [CrossRef]
- Chan, I.Y.S.; Chen, H. Towards an integrative analysis of underground environment and human health: A survey and field measurement approach. Eng. Constr. Archit. Manag. 2023, ahead-of-print. [CrossRef]
- Lee, E.H.; Christopoulos, G.I.; Kwok, K.W.; Roberts, A.C.; Soh, C.-K. A psychosocial approach to understanding underground spaces. Front. Psychol. 2017, 8, 452. [Google Scholar] [CrossRef]
- Dong, X.; Wu, Y.; Chen, X.; Li, H.; Cao, B.; Zhang, X.; Yan, X.; Li, Z.; Long, Y.; Li, X. Effect of thermal, acoustic, and lighting environment in underground space on human comfort and work efficiency: A review. Sci. Total Environ. 2021, 786, 147537. [Google Scholar] [CrossRef]
- Soh, C.-K.; Christopoulos, G.; Roberts, A.; Lee, E.-H. Human-centered Development of Underground work Spaces. Procedia Eng. 2016, 165, 242–250. [Google Scholar] [CrossRef]
- Hao, G.; Xiang, J.; Shuai, T. Underground Space Landscape Design of Business Zone B of Shanghai World Expo. J. Landsc. Res. 2020, 12, 47–50. [Google Scholar]
- Calcagno, P.; Consilvio, A.; Febbraro, A.D.; Sacco, N. Reshaping metro station spaces to improve social distancing during COVID-19 pandemic. In Proceedings of the 2021 7th International Conference on Models and Technologies for Intelligent Transportation Systems (MT-ITS), Heraklion, Greece, 16–17 June 2021; pp. 1–6. [Google Scholar]
- Barati, N.; Hahsemi Zadegan, S.A.; Kasravi, R. The role of survey details for wayfinding problem in complex pedestrian underground interchange with poor architectural configuration. Tunn. Undergr. Space Technol. 2021, 108, 103718. [Google Scholar] [CrossRef]
- Roberts, A.C.; Christopoulos, G.I.; Car, J.; Soh, C.-K.; Lu, M. Psycho-biological factors associated with underground spaces: What can the new era of cognitive neuroscience offer to their study? Tunn. Undergr. Space Technol. 2016, 55, 118–134. [Google Scholar] [CrossRef]
- Beck, A.T.; Emery, G.; Greenberg, R.L. Anxiety Disorders and Phobias: A Cognitive Perspective; Basic Books: New York, NY, USA, 2005. [Google Scholar]
- Khotbehsara, E.M.; Askarizad, R.; Mehrinejad, M.; Nasab, S.N.; Somasundaraswaran, K. The impact of COVID-19 on visitors’ wayfinding within healthcare centers. Ain Shams Eng. J. 2023, 14, 101957. [Google Scholar] [CrossRef]
- Abdul Nasir, N.A.B.; Hassan, A.S.; Khozaei, F.; Abdul Nasir, M.H.B. Investigation of spatial configuration management on social distancing of recreational clubhouse for COVID-19 in Penang, Malaysia. Int. J. Build. Pathol. Adapt. 2021, 39, 782–810. [Google Scholar] [CrossRef]
- Bhagat, R.K.; Davies Wykes, M.S.; Dalziel, S.B.; Linden, P.F.; Baron, Y.M. Effects of ventilation on the indoor spread of COVID-19. J. Fluid Mech. 2020, 903, F1. [Google Scholar] [CrossRef]
- Chen, Y.; Wang, Y.; Wang, H.; Hu, Z.; Hua, L. Controlling urban traffic-one of the useful methods to ensure safety in Wuhan based on COVID-19 outbreak. Saf. Sci. 2020, 131, 104938. [Google Scholar] [CrossRef]
- Zoran, M.A.; Savastru, R.S.; Savastru, D.M.; Tautan, M.N. Assessing the relationship between surface levels of PM2.5 and PM10 particulate matter impact on COVID-19 in Milan, Italy. Sci. Total Environ. 2020, 738, 139825. [Google Scholar] [CrossRef]
- Kim, C.; Choi, D.; Lee, Y.G.; Kim, K. Diagnosis of indoor air contaminants in a daycare center using a long-term monitoring. Build. Environ. 2021, 204, 108124. [Google Scholar] [CrossRef]
- Wu, X.; Nethery, R.C.; Sabath, M.B.; Braun, D.; Dominici, F. Exposure to air pollution and COVID-19 mortality in the United States: A nationwide cross-sectional study. medRxiv 2020. medRxiv: 2020.04.05.20054502. [Google Scholar]
- Mecenas, P.; Bastos, R.T.d.R.M.; Vallinoto, A.C.R.; Normando, D. Effects of temperature and humidity on the spread of COVID-19: A systematic review. PLoS ONE 2020, 15, e0238339. [Google Scholar] [CrossRef]
- Guo, M.; Xu, P.; Xiao, T.; He, R.; Dai, M.; Miller, S.L. Review and comparison of HVAC operation guidelines in different countries during the COVID-19 pandemic. Build. Environ. 2021, 187, 107368. [Google Scholar] [CrossRef]
- El-Salamony, M.; Moharam, A.; Guaily, A.; Boraey, M.A. Air change rate effects on the airborne diseases spreading in Underground Metro wagons. Environ. Sci. Pollut. Res. 2021, 28, 31895–31907. [Google Scholar] [CrossRef]
- Díaz, J.; Antonio-López-Bueno, J.; Culqui, D.; Asensio, C.; Sánchez-Martínez, G.; Linares, C. Does exposure to noise pollution influence the incidence and severity of COVID-19? Environ. Res. 2021, 195, 110766. [Google Scholar] [CrossRef]
- Recio, A.; Linares, C.; Banegas, J.R.; Díaz, J. Road traffic noise effects on cardiovascular, respiratory, and metabolic health: An integrative model of biological mechanisms. Environ. Res. 2016, 146, 359–370. [Google Scholar] [CrossRef]
- Majde, J.A.; Krueger, J.M. Links between the innate immune system and sleep. J. Allergy Clin. Immunol. 2005, 116, 1188–1198. [Google Scholar] [CrossRef]
- Van Kempen, E.; Casas, M.; Pershagen, G.; Foraster, M. WHO Environmental Noise Guidelines for the European Region: A Systematic Review on Environmental Noise and Cardiovascular and Metabolic Effects: A Summary. Int. J. Environ. Res. Public Health 2018, 15, 379. [Google Scholar] [CrossRef]
- Molenaar, N.; Hu, J. Light and the perception of cleanliness in public spaces. J. Man Mach. Technol. 2013, 2, 63–70. [Google Scholar]
- Bringslimark, T.; Hartig, T.; Grindal Patil, G. Adaptation to Windowlessness: Do Office Workers Compensate for a Lack of Visual Access to the Outdoors? Environ. Behav. 2011, 43, 469–487. [Google Scholar] [CrossRef]
- Liu, F.; Yan, L.; Meng, X.; Zhang, C. A review on indoor green plants employed to improve indoor environment. J. Build. Eng. 2022, 53, 104542. [Google Scholar] [CrossRef]
- Asim, F.; Chani, P.S.; Shree, V. Impact of COVID-19 containment zone built-environments on students’ mental health and their coping mechanisms. Build. Environ. 2021, 203, 108107. [Google Scholar] [CrossRef]
- Spano, G.; D’Este, M.; Giannico, V.; Elia, M.; Cassibba, R.; Lafortezza, R.; Sanesi, G. Association between indoor-outdoor green features and psychological health during the COVID-19 lockdown in Italy: A cross-sectional nationwide study. Urban For. Urban Green. 2021, 62, 127156. [Google Scholar] [CrossRef]
- Wang, J.; Wu, X.; Wang, R.; He, D.; Li, D.; Yang, L.; Yang, Y.; Lu, Y. Review of Associations between Built Environment Characteristics and Severe Acute Respiratory Syndrome Coronavirus 2 Infection Risk. Int. J. Environ. Res. Public Health 2021, 18, 7561. [Google Scholar] [CrossRef]
- Yeom, S.; Kim, H.; Hong, T. Psychological and physiological effects of a green wall on occupants: A cross-over study in virtual reality. Build. Environ. 2021, 204, 108134. [Google Scholar] [CrossRef]
- Amos, D.; Au-Yong, C.P.; Musa, Z.N. Enhancing the role of facilities management in the fight against the COVID-19 (SARS-CoV-2) pandemic in developing countries’ public hospitals. J. Facil. Manag. 2021, 19, 22–31. [Google Scholar] [CrossRef]
- HKCEC. Preventive Measures in Response to COVID-19. Available online: https://www.hkcec.com/en/preventive-measures-response-covid-19 (accessed on 20 May 2022).
- MTR. COVID-19 Precaution Report. Available online: http://www.mtr.com.hk/en/customer/main/COVID-19-precaution-report.html (accessed on 20 May 2022).
- Pan, Y.; Du, C.; Fu, Z.; Fu, M. Re-thinking of engineering operation solutions to HVAC systems under the emerging COVID-19 pandemic. J. Build. Eng. 2021, 43, 102889. [Google Scholar] [CrossRef]
- Alkhamees, A.A.; Alrashed, S.A.; Alzunaydi, A.A.; Almohimeed, A.S.; Aljohani, M.S. The psychological impact of COVID-19 pandemic on the general population of Saudi Arabia. Compr. Psychiatry 2020, 102, 152192. [Google Scholar] [CrossRef]
- Kishii, T. Utilization of underground space in Japan. Tunn. Undergr. Space Technol. 2016, 55, 320–323. [Google Scholar] [CrossRef]
- Gao, J.-M.; Zhang, K.; Pu, Q.-P.; Zhang, Y. Subjective evaluation of indoor environmental quality of underground shopping malls in central district of Chongqing, China. J. Cent. South Univ. 2009, S1, 12–16. [Google Scholar]
- Fan, Y.; Chen, J.; Shirkey, G.; John, R.; Wu, S.R.; Park, H.; Shao, C. Applications of structural equation modeling (SEM) in ecological studies: An updated review. Ecol. Process. 2016, 5, 19. [Google Scholar] [CrossRef]
- Newsom Multigroup Analysis and Moderation with SEM. Available online: https://web.pdx.edu/~newsomj/semclass/ho_moderation.pdf (accessed on 20 May 2022).
- Nunnally, J.; Bernstein, I. Psychometric Theory; McGraw-Hili: New York, NY, USA, 1994. [Google Scholar]
- Gorsuch, R.L. Factor Analysis; Erlbaum Associates: Hillsdale, NJ, USA, 1983. [Google Scholar]
- Kyriazos, T.A. Applied Psychometrics: Sample Size and Sample Power Considerations in Factor Analysis (EFA, CFA) and SEM in General. Psychology 2018, 9, 25. [Google Scholar] [CrossRef]
- Hair, J.F.; Black, W.C.; Babin, B.J.; Anderson, R.E.; Black, W.; Anderson, R. Multivariate Data Analysis, 8th ed.; Cengage Learning, EMEA; Springer International Publishing: Cham, Switzerland, 2019. [Google Scholar]
- Maslach, C.; Jackson, S.E.; Leiter, M.P. Maslach Burnout Inventory: Third edition. In Evaluating Stress: A Book of Resources; Scarecrow Education: Lanham, MD, USA, 1997; pp. 191–218. [Google Scholar]
- Hedge, A.; Erickson, W.A. A study of indoor environment and sick building syndrome complaints in air conditioned offices: Benchmarks for facility performance. Int. J. Facil. Manag. 1997, 1, 185–192. [Google Scholar]
- Raw, G.; Whitehead, C.; Robertson, A.; Burge, S.; Kely, C.; Leinster, P. A Questionnaire for Studies of Sick Building Syndrome: A Report to the Royal Society of Health Advisory Group on Sick Building Syndrome; Building Research Establishment: Watford, UK, 1995.
- Geng, Y.; Zhang, Z.; Yu, J.; Chen, H.; Zhou, H.; Lin, B.; Zhuang, W. An Intelligent IEQ Monitoring and Feedback System: Development and Applications. Engineering 2022, 18, 218–231. [Google Scholar] [CrossRef]
- Cheng, Y.-H.; Lin, Y.-L.; Liu, C.-C. Levels of PM10 and PM2.5 in Taipei Rapid Transit System. Atmos. Environ. 2008, 42, 7242–7249. [Google Scholar] [CrossRef]
- de Vries, S.; van Dillen, S.M.E.; Groenewegen, P.P.; Spreeuwenberg, P. Streetscape greenery and health: Stress, social cohesion and physical activity as mediators. Soc. Sci. Med. 2013, 94, 26–33. [Google Scholar] [CrossRef]
- Leung, M.-Y.; Wang, C.; Chan, I.Y.S. A qualitative and quantitative investigation of effects of indoor built environment for people with dementia in care and attention homes. Build. Environ. 2019, 157, 89–100. [Google Scholar] [CrossRef]
- Fuchs, C.; Diamantopoulos, A. Using single-item measures for construct measurement in management research: Conceptual issues and application guidelines. Die Betr. 2009, 69, 195. [Google Scholar]
- Liang, H.-H.; Chen, C.-P.; Hwang, R.-L.; Shih, W.-M.; Lo, S.-C.; Liao, H.-Y. Satisfaction of occupants toward indoor environment quality of certified green office buildings in Taiwan. Build. Environ. 2014, 72, 232–242. [Google Scholar] [CrossRef]
- El-Salamouny, H.E.-S.; Abdou, A.; Ghoneem, M. Effects of Indoor Environmental Quality on Occupant’s Satisfaction, Health and Productivity. Port-Said Eng. Res. J. 2019, 23, 10–18. [Google Scholar] [CrossRef]
- Byrne, B.M. Structural Equation Modeling with AMOS: Basic Concepts, Applications, and Programming; Routledge: New York, NY, USA, 2016. [Google Scholar]
- Munawar, H.S.; Khan, S.I.; Qadir, Z.; Kiani, Y.S.; Kouzani, A.Z.; Mahmud, M.A.P. Insights into the Mobility Pattern of Australians during COVID-19. Sustainability 2021, 13, 9611. [Google Scholar] [CrossRef]
- Leung, M.-Y.; Liang, Q. Developing structural facilities management–quality of life models for the elderly in the common areas of public and subsidized housings. Habitat Int. 2019, 94, 102067. [Google Scholar] [CrossRef]
- IBM. IBM® SPSS® Amos™ 28 User’s Guide. Available online: https://www.ibm.com/docs/en/SSLVMB_28.0.0/pdf/amos/IBM_SPSS_Amos_User_Guide.pdf (accessed on 20 May 2022).
- Li, L.; Zhang, Y. An extended theory of planned behavior to explain the intention to use carsharing: A multi-group analysis of different sociodemographic characteristics. Transportation 2023, 50, 143–181. [Google Scholar] [CrossRef]
- Jang, M.; Kim, J. A structural model for stress, coping, and psychosocial adjustment: A multi-group analysis by stages of survivorship in Korean women with breast cancer. Eur. J. Oncol. Nurs. 2018, 33, 41–48. [Google Scholar] [CrossRef]
- Mishra, A.K.; Ramgopal, M. Field studies on human thermal comfort—An overview. Build. Environ. 2013, 64, 94–106. [Google Scholar] [CrossRef]
- Deuble, M.P.; de Dear, R.J. Green occupants for green buildings: The missing link? Build. Environ. 2012, 56, 21–27. [Google Scholar] [CrossRef]
- Luo, L.-Z.; Mao, C.; Shen, L.-Y.; Li, Z.-D. Risk factors affecting practitioners’ attitudes toward the implementation of an industrialized building system. Eng. Constr. Archit. Manag. 2015, 22, 622–643. [Google Scholar] [CrossRef]
- Moon, S.; Ham, N.; Kim, S.; Hou, L.; Kim, J.-H.; Kim, J.-J. Fourth industrialization-oriented offsite construction: Case study of an application to an irregular commercial building. Eng. Constr. Archit. Manag. 2020, 27, 2271–2286. [Google Scholar] [CrossRef]
- Group, I. A Guide on Indoor Air Quality Certification Scheme for Offices and Public Places; Indoor Air Quality Management Group: Hong Kong, China, 2019.
- Labour Department. A Simple Guide to Health Risk Assessment Office Environment Series OE 2/2003. Available online: https://www.labour.gov.hk/eng/public/oh/OHB50.pdf (accessed on 20 May 2022).
- Ramiz, L.; Contrand, B.; Rojas Castro, M.Y.; Dupuy, M.; Lu, L.; Sztal-Kutas, C.; Lagarde, E. A longitudinal study of mental health before and during COVID-19 lockdown in the French population. Glob. Health 2021, 17, 29. [Google Scholar] [CrossRef]
- Dwyer, M.J.; Pasini, M.; De Dominicis, S.; Righi, E. Physical activity: Benefits and challenges during the COVID-19 pandemic. Scand. J. Med. Sci. Sport. 2020, 30, 1291. [Google Scholar] [CrossRef]
- Brand, R.; Timme, S.; Nosrat, S. When pandemic hits: Exercise frequency and subjective well-being during COVID-19 pandemic. Front. Psychol. 2020, 11, 2391. [Google Scholar] [CrossRef]
- Violant-Holz, V.; Gallego-Jiménez, M.G.; González-González, C.S.; Muñoz-Violant, S.; Rodríguez, M.J.; Sansano-Nadal, O.; Guerra-Balic, M. Psychological Health and Physical Activity Levels during the COVID-19 Pandemic: A Systematic Review. Int. J. Environ. Res. Public Health 2020, 17, 9419. [Google Scholar] [CrossRef] [PubMed]
- Dawson, D.L.; Golijani-Moghaddam, N. COVID-19: Psychological flexibility, coping, mental health, and wellbeing in the UK during the pandemic. J. Context. Behav. Sci. 2020, 17, 126–134. [Google Scholar] [CrossRef]
- Zhou, S.-J.; Zhang, L.-G.; Wang, L.-L.; Guo, Z.-C.; Wang, J.-Q.; Chen, J.-C.; Liu, M.; Chen, X.; Chen, J.-X. Prevalence and socio-demographic correlates of psychological health problems in Chinese adolescents during the outbreak of COVID-19. Eur. Child Adolesc. Psychiatry 2020, 29, 749–758. [Google Scholar] [CrossRef]
- Ahmed, M.Z.; Ahmed, O.; Aibao, Z.; Hanbin, S.; Siyu, L.; Ahmad, A. Epidemic of COVID-19 in China and associated Psychological Problems. Asian J. Psychiatry 2020, 51, 102092. [Google Scholar] [CrossRef]
- FEHD. A Guide on Compliance with the Requirement on Air Change/Air Purifiers in Seating Areas of Dine-in Catering Premises under Cap. 599F; HKSAR: Hong Kong, China, 2021.
- Ibrahim, A.M.; Hassanain, M.A. Assessment of COVID-19 precautionary measures in sports facilities: A case study on a health club in Saudi Arabia. J. Build. Eng. 2022, 46, 103662. [Google Scholar] [CrossRef]
- Lee, E.H.; Christopoulos, G.I.; Lu, M.; Heo, M.Q.; Soh, C.-K. Social aspects of working in underground spaces. Tunn. Undergr. Space Technol. 2016, 55, 135–145. [Google Scholar] [CrossRef]
- Fernandez Velasco, P.; Gurchani, U.; Perroy, B.; Pelletreau-Duris, T.; Casati, R. Development and validation of a quantitative instrument for measuring temporal and social disorientation in the COVID-19 crisis. PLoS ONE 2022, 17, e0264604. [Google Scholar] [CrossRef]
- Kim, J.Y.; Choi, J.K.; Han, W.H.; Kim, J.H. The Influence of Users’ Spatial Familiarity on Their Emotional Perception of Space and Wayfinding Movement Patterns. Sensors 2021, 21, 2583. [Google Scholar] [CrossRef] [PubMed]
- Realyvásquez-Vargas, A.; Maldonado-Macías, A.A.; Arredondo-Soto, K.C.; Baez-Lopez, Y.; Carrillo-Gutiérrez, T.; Hernández-Escobedo, G. The Impact of Environmental Factors on Academic Performance of University Students Taking Online Classes during the COVID-19 Pandemic in Mexico. Sustainability 2020, 12, 9194. [Google Scholar] [CrossRef]
- Nang, E.E.K.; Abuduxike, G.; Posadzki, P.; Divakar, U.; Visvalingam, N.; Nazeha, N.; Dunleavy, G.; Christopoulos, G.I.; Soh, C.-K.; Jarbrink, K.; et al. Review of the potential health effects of light and environmental exposures in underground workplaces. Tunn. Undergr. Space Technol. 2019, 84, 201–209. [Google Scholar] [CrossRef]
- Hanim, F.; Aziz, A.A.; Yuhaniz, M.; Ahmad, S.S. COVID-19 Pandemic: Strategies to Improve Daylighting and Visual Comfort for Building Occupants. In Advances in Civil Engineering Materials; Awang, M., Ling, L., Emamian, S.S., Eds.; Springer Nature Singapore: Singapore, 2022; pp. 203–214. [Google Scholar]
- Khan, Z.A.; Yumnamcha, T.; Mondal, G.; Devi, S.D.; Rajiv, C.; Labala, R.K.; Sanjita Devi, H.; Chattoraj, A. Artificial light at night (ALAN): A potential anthropogenic component for the COVID-19 and HCoVs outbreak. Front. Endocrinol. 2020, 11, 622. [Google Scholar] [CrossRef]
- Carmody, J.C.; Sterling, R.L. Design strategies to alleviate negative psychological and physiological effects in underground space. Tunn. Undergr. Space Technol. 1987, 2, 59–67. [Google Scholar] [CrossRef]
- Wang, J.; Huang, J.; Feng, Z.; Cao, S.-J.; Haghighat, F. Occupant-density-detection based energy efficient ventilation system: Prevention of infection transmission. Energy Build. 2021, 240, 110883. [Google Scholar] [CrossRef] [PubMed]
- Tekler, Z.D.; Lei, Y.; Peng, Y.; Miller, C.; Chong, A. A hybrid active learning framework for personal thermal comfort models. Build. Environ. 2023, 234, 110148. [Google Scholar] [CrossRef]
- Oner, E.; Seçkin, A.Ç.; Egeli, D.; Seçkin, M. Investigation of the Thermal Comfort Properties of Masks Used during the COVID-19 Pandemic. Int. J. Environ. Res. Public Health 2022, 19, 11275. [Google Scholar] [CrossRef]
- Wang, J.; Yan, X.; Yang, W.; Ye, D.; Fan, L.; Liao, Y.; Zhang, Y.; Yang, Y.; Li, X.; Yao, X.; et al. Association between indoor environment and common cold among children aged 7–9 years in five typical cities in China. Environ. Sustain. Indic. 2020, 6, 100033. [Google Scholar] [CrossRef]
- Sal Moslehian, A.; Roös, P.B.; Gaekwad, J.S.; Van Galen, L. Potential risks and beneficial impacts of using indoor plants in the biophilic design of healthcare facilities: A scoping review. Build. Environ. 2023, 233, 110057. [Google Scholar] [CrossRef]
- Sime, J.D. An occupant response shelter escape time (ORSET) model. Saf. Sci. 2001, 38, 109–125. [Google Scholar] [CrossRef]
- Norbäck, D.; Nordström, K. An experimental study on effects of increased ventilation flow on students’ perception of indoor environment in computer classrooms. Indoor Air 2008, 18, 293–300. [Google Scholar] [CrossRef] [PubMed]
- Jeon, J.Y.; Jo, H.I. Effects of audio-visual interactions on soundscape and landscape perception and their influence on satisfaction with the urban environment. Build. Environ. 2020, 169, 106544. [Google Scholar] [CrossRef]
- Aumond, P.; Can, A.; Lagrange, M.; Gontier, F.; Lavandier, C. Multidimensional analyses of the noise impacts of COVID-19 lockdown. J. Acoust. Soc. Am. 2022, 151, 911–923. [Google Scholar] [CrossRef]
- Sun, S.; Han, J. Open defecation and squat toilets, an overlooked risk of fecal transmission of COVID-19 and other pathogens in developing communities. Environ. Chem. Lett. 2021, 19, 787–795. [Google Scholar] [CrossRef]
- Akaishi, T.; Morino, K.; Maruyama, Y.; Ishibashi, S.; Takayama, S.; Abe, M.; Kanno, T.; Tadano, Y.; Ishii, T. Restoration of clean water supply and toilet hygiene reduces infectious diseases in post-disaster evacuation shelters: A multicenter observational study. Heliyon 2021, 7, e07044. [Google Scholar] [CrossRef]
- Devrim, İ.; Çatıkoğlu, A.; Bayram, N. An UV Disinfection Robot Combined Cleaning and Housekeeping Strategy for the Hospital during COVID-19 Pandemic: How We Protect the Hospital Cleaning Staff? 2021. Available online: https://assets.researchsquare.com/files/rs-156015/v1/f52ef6c9-9885-440f-94af-22d66da98bec.pdf?c=1631878149 (accessed on 25 May 2022).
- Megahed, N.A.; Ghoneim, E.M. Indoor Air Quality: Rethinking rules of building design strategies in post-pandemic architecture. Environ. Res. 2021, 193, 110471. [Google Scholar] [CrossRef]
- Zhu, Y.; Xie, J.; Huang, F.; Cao, L. Association between short-term exposure to air pollution and COVID-19 infection: Evidence from China. Sci. Total Environ. 2020, 727, 138704. [Google Scholar] [CrossRef]
- Durán-Polanco, L.; Siller, M. Crowd management COVID-19. Annu. Rev. Control 2021, 52, 465–478. [Google Scholar] [CrossRef]
- Zou, H.; Zhou, Y.; Yang, J.; Spanos, C.J. Device-free occupancy detection and crowd counting in smart buildings with WiFi-enabled IoT. Energy Build. 2018, 174, 309–322. [Google Scholar] [CrossRef]
- Tekler, Z.D.; Low, R.; Gunay, B.; Andersen, R.K.; Blessing, L. A scalable Bluetooth Low Energy approach to identify occupancy patterns and profiles in office spaces. Build. Environ. 2020, 171, 106681. [Google Scholar] [CrossRef]
- Li, S.; Li, N.; Becerik-Gerber, B.; Calis, G. Rfid-based occupancy detection solution for optimizing hvac energy consumption. In Proceedings of the 28th International Association for Automation and Robotics in Construction Conference, Seoul, Republic of Korea, 29 June–2 July 2011; pp. 587–592. [Google Scholar]
- Chen, H.; Cha, S.H.; Kim, T.W. A framework for group activity detection and recognition using smartphone sensors and beacons. Build. Environ. 2019, 158, 205–216. [Google Scholar] [CrossRef]
- Tekler, Z.D.; Chong, A. Occupancy prediction using deep learning approaches across multiple space types: A minimum sensing strategy. Build. Environ. 2022, 226, 109689. [Google Scholar] [CrossRef]
- Labour Department. Guidelines for Good Occupational Hygiene Practice in a Workplace—Lighting; HKSAR: Hong Kong, China, 2017.
- Yu, D. Enjoy shopping in city landscape: Planning and design of Xilaile international life plaza. J. Landsc. Res. 2014, 6, 3. [Google Scholar]
- Hami, A.; Moula, F.F.; Maulan, S.B. Public preferences toward shopping mall interior landscape design in Kuala Lumpur, Malaysia. Urban For. Urban Green. 2018, 30, 1–7. [Google Scholar] [CrossRef]
- Lander, J. Within-subject designs. Adv. Des. Nurs. Res. 1998, 105–123. [Google Scholar] [CrossRef]
- Tan, Z.; Roberts, A.C.; Christopoulos, G.I.; Kwok, K.-W.; Car, J.; Li, X.; Soh, C.-K. Working in underground spaces: Architectural parameters, perceptions and thermal comfort measurements. Tunn. Undergr. Space Technol. 2018, 71, 428–439. [Google Scholar] [CrossRef]
- Yap, H.S.; Roberts, A.C.; Luo, C.; Tan, Z.; Lee, E.H.; Thach, T.-Q.; Kwok, K.W.; Car, J.; Soh, C.-K.; Christopoulos, G. The importance of air quality for underground spaces: An international survey of public attitudes. Indoor Air 2021, 31, 2239–2251. [Google Scholar] [CrossRef] [PubMed]
- Montgomery, D.C.; Peck, E.A.; Vining, G.G. Introduction to Linear Regression Analysis; John Wiley & Sons: Chichester, UK, 2021. [Google Scholar]
- Sabbah, I.; Sabbah, H.; Sabbah, S.; Akoum, H.; Droubi, N. Burnout among Lebanese nurses: Psychometric properties of the Maslach Burnout Inventory-Human Services Survey (MBI-HSS). Health 2012, 4, 644–652. [Google Scholar] [CrossRef]
- Tan, Z.S. Textual construction of comparative space: How analyst corporate governance reports redefine and create “best practice”. Account. Audit. Account. J. 2018, 31, 1794–1827. [Google Scholar] [CrossRef]
- CBE. CBE Occupant Satisfaction Survey Demo. Available online: http://209.61.210.46/survey/demos2010 (accessed on 7 June 2022).
- Sarvari, H.; Chen, Z.; Chan, D.W.; Lester, E.A.; Yahaya, N.; Nassereddine, H.; Lotfata, A. A global survey of infection control and mitigation measures for combating the transmission of COVID-19 pandemic in buildings under facilities management services. Front. Built Environ. 2022, 7, 191. [Google Scholar] [CrossRef]
- Phenxtoolkit. COVID-19 Community Response Survey Guidance. Available online: https://www.phenxtoolkit.org/toolkit_content/PDF/JHU_C4WARD_Social_Distancing.pdf (accessed on 7 June 2022).


| Factors | Measurement Items | Cronbach’s Alpha Values | |
|---|---|---|---|
| Pre-Outbreak | Post-Outbreak | ||
| Physical health | Dry eyes | 0.787 | 0.845 |
| Itchy or watery eyes | |||
| Blocked or stuffy nose | |||
| Runny nose | |||
| Dry throat | |||
| Lethargy or tiredness | |||
| Headache | |||
| Dry, itchy, or irritated skin | |||
| Sneezing | |||
| Breathing difficulties | |||
| Insomnia | |||
| Psychological health | Feel emotionally drained | 0.629 | 0.794 |
| Feel fatigued | |||
| Feel burned out | |||
| Job is hardening me emotionally | |||
| Feel frustrated | |||
| Feel working too hard | |||
| Feel I am at the end of my rope | |||
| Anti-epidemic software | Hygiene facilities satisfaction | - | 0.780 |
| Temperature checking in entrance | |||
| Temperature checking in common area | |||
| Temperature checking in office/shop | |||
| Hygiene education satisfaction | |||
| Crowd control satisfaction | |||
| Anti-epidemic hardware | Hand sanitizer in entrance | - | 0.817 |
| Hand sanitizer in common area | |||
| Hand sanitizer in office/shop | |||
| Disinfection products satisfaction | |||
| Pre-Outbreak | Post-Outbreak | t | Sig. | Eta-Squared | ||||
|---|---|---|---|---|---|---|---|---|
| Mean | Std | Mean | Std | |||||
| Underground environment | Greenery | 2.277 | 1.575 | 3.026 | 1.517 | −5.342 | 0.000 | 0.052 |
| Connectivity facilities | 4.076 | 1.576 | 4.689 | 1.867 | −3.849 | 0.000 | 0.030 | |
| Wayfinding | 4.185 | 1.318 | 3.612 | 1.843 | 3.811 | 0.000 | 0.032 | |
| Thermal comfort | 3.456 | 1.237 | 4.342 | 1.519 | −6.913 | 0.000 | 0.092 | |
| Ventilation | 3.407 | 1.106 | 4.061 | 1.538 | −5.204 | 0.000 | 0.057 | |
| IAQ | 3.176 | 1.520 | 4.301 | 1.528 | −8.185 | 0.000 | 0.114 | |
| Acoustic comfort | 3.274 | 1.035 | 4.056 | 1.903 | −5.308 | 0.000 | 0.066 | |
| Visual comfort | 3.210 | 1.046 | 5.128 | 1.410 | −16.525 | 0.000 | 0.377 | |
| Health | Physical health | 3.651 | 0.797 | 2.397 | 0.925 | 16.402 | 0.000 | 0.340 |
| Psychological health | 2.926 | 0.637 | 2.243 | 1.003 | 8.553 | 0.000 | 0.148 | |
| Working hours in the underground space | 1.635 | 1.262 | 2.765 | 1.622 | −8.361 | 0.000 | 0.132 | |
| Factors | One-Way between-Groups ANOVA | Post Hoc Test for Factors with Significant Diff. Satisfaction. | ||||||||
|---|---|---|---|---|---|---|---|---|---|---|
| Type | Mean | SD | F (ANOVA) | Sig. (ANOVA) | Sig. (Levene) | Type Group | Mean diff. | SE | Sig. | |
| 1. Physical health | Subway | 3.219 | 0.997 | 1.349 | 0.260 | 0.060 | ||||
| Shopping mall | 3.136 | 1.083 | ||||||||
| Office | 3.423 | 0.849 | ||||||||
| Total | 3.183 | 1.041 | ||||||||
| 2. Psychological health | Subway | 2.615 | 0.877 | 2.470 | 0.086 | 0.404 | ||||
| Shopping mall | 2.669 | 0.858 | ||||||||
| Office | 2.967 | 0.718 | ||||||||
| Total | 2.671 | 0.859 | ||||||||
| 3. Greenery | Subway | 1.966 | 1.356 | 33.296 | 0.000 | 0.000 | Shopping mall | −1.025 * | 0.142 | 0.000 |
| Shopping mall | 2.990 | 1.620 | Office | 1.362 * | 0.268 | 0.000 | ||||
| Office | 1.629 | 1.060 | ||||||||
| Total | 2.556 | 1.594 | ||||||||
| 4. IMA | Subway | 4.239 | 1.653 | 0.239 | 0.787 | 0.001 | ||||
| Shopping mall | 4.347 | 1.797 | ||||||||
| Office | 4.257 | 1.221 | ||||||||
| Total | 4.305 | 1.715 | ||||||||
| 5. Wayfinding | Subway | 4.040 | 1.412 | 0.305 | 0.737 | 0.055 | ||||
| Shopping mall | 3.946 | 1.654 | ||||||||
| Office | 3.857 | 1.396 | ||||||||
| Total | 3.971 | 1.558 | ||||||||
| 6. Thermal comfort | Subway | 3.403 | 1.399 | 15.188 | 0.000 | 0.182 | Shopping mall | −0.654 * | 0.130 | 0.000 |
| Shopping mall | 4.057 | 1.388 | Office | 0.772 * | 0.245 | 0.005 | ||||
| Office | 3.286 | 1.152 | ||||||||
| Total | 3.787 | 1.414 | ||||||||
| 7. IAQ | Subway | 3.386 | 1.430 | 2.596 | 0.076 | 0.000 | ||||
| Shopping mall | 3.726 | 1.621 | ||||||||
| Office | 3.486 | 2.267 | ||||||||
| Total | 3.596 | 1.616 | ||||||||
| 8. Ventilation | Subway | 3.307 | 1.299 | 9.293 | 0.000 | 0.963 | Shopping mall | −0.521 * | 0.123 | 0.000 |
| Shopping mall | 3.828 | 1.297 | ||||||||
| Office | 3.800 | 1.346 | ||||||||
| Total | 3.651 | 1.322 | ||||||||
| 9. Noise | Subway | 3.557 | 1.321 | 0.593 | 0.553 | 0.035 | ||||
| Shopping mall | 3.599 | 1.541 | ||||||||
| Office | 3.314 | 1.549 | ||||||||
| Total | 3.566 | 1.470 | ||||||||
| 10. Visual comfort | Subway | 4.091 | 1.370 | 2.215 | 0.110 | 0.000 | ||||
| Shopping mall | 3.873 | 1.627 | ||||||||
| Office | 3.571 | 0.948 | ||||||||
| Total | 3.926 | 1.512 | ||||||||
| Greenery | Connectivity Facilities | Wayfinding | Thermal Comfort | Ventilation | IAQ | Acoustic Comfort | Visual Comfort | AE Hardware | AE Software | Physical Health | Psycho. Health | |
|---|---|---|---|---|---|---|---|---|---|---|---|---|
| Greenery | 1.000 | 0.073 | 0.086 | 0.110 | 0.176 * | 0.078 | 0.049 | 0.214 ** | 0.117 | 0.181 * | −0.072 | −0.188 ** |
| Connectivity facilities | 0.376 ** | 1.000 | 0.419 ** | 0.191 ** | 0.119 | 0.132 | 0.143 * | −0.018 | 0.043 | 0.054 | −0.161 * | −0.185 ** |
| Wayfinding | −0.339 ** | −0.572 ** | 1.000 | 0.198 ** | 0.098 | 0.133 | 0.000 | 0.011 | −0.056 | 0.059 | −0.036 | −0.142 * |
| Thermal comfort | 0.362 ** | 0.134 * | −0.196 ** | 1.000 | 0.596 ** | 0.636 ** | 0.206 ** | 0.181 * | 0.203 ** | 0.317 ** | −0.153 * | −0.124 |
| Ventilation | 0.353 ** | 0.316 ** | −0.376 ** | 0.447 ** | 1.000 | 0.636 ** | 0.216 ** | 0.308 ** | 0.055 | 0.253 ** | −0.223 ** | −0.197 ** |
| IAQ | 0.182 ** | 0.216 ** | −0.223 ** | 0.430 ** | 0.445 ** | 1.000 | 0.214 ** | 0.188 ** | 0.175 * | 0.350 ** | −0.191 ** | −0.110 |
| Acoustic comfort | 0.137 * | 0.094 | −0.250 ** | 0.305 ** | 0.529 ** | 0.265 ** | 1.000 | 0.100 | 0.285 ** | 0.287 ** | −0.175 * | −0.092 |
| Visual comfort | −0.241 ** | −0.076 | 0.054 | −0.093 | −0.008 | −0.085 | 0.150 ** | 1.000 | 0.316 ** | 0.332 ** | −0.285 ** | −0.284 ** |
| Anti-epidemic (AE) hardware | - | - | - | - | - | - | - | - | 1.000 | 0.719 ** | −0.221 ** | −0.094 |
| Anti-epidemic (AE) software | - | - | - | - | - | - | - | - | - | 1.000 | −0.233 ** | −0.106 |
| Physical health | −0.475 ** | −0.516 ** | 0.562 ** | −0.358 ** | −0.474 ** | −0.300 ** | −0.356 ** | 0.087 | - | - | 1.000 | 0.384 ** |
| Psychological health | −0.292 ** | −0.306 ** | 0.288 ** | −0.390 ** | −0.238 ** | −0.268 ** | −0.207 ** | 0.092 | - | - | 0.419 ** | 1.000 |
| Model | Beta | Std | Standard Beta | t | Sig. | R | R2 | ANOVA (Sig.) | |
|---|---|---|---|---|---|---|---|---|---|
| 1 | Physical health ← underground environment factors | ||||||||
| (Constant) | 4.500 | 0.272 | - | 16.521 | 0.000 | 0.733 | 0.537 | 0.000 | |
| Greenery | −0.102 | 0.023 | −0.201 | −4.507 | 0.000 | ||||
| Connectivity facilities | −0.125 | 0.025 | −0.247 | −5.079 | 0.000 | ||||
| Wayfinding | 0.157 | 0.029 | 0.259 | 5.326 | 0.000 | ||||
| Thermal comfort | −0.075 | 0.029 | −0.116 | −2.621 | 0.009 | ||||
| Acoustic comfort | −0.109 | 0.035 | −0.141 | −3.091 | 0.002 | ||||
| 2 | Psychological health ← underground environment factors | ||||||||
| (Constant) | 3.882 | 0.124 | - | 31.233 | 0.000 | 0.478 | 0.229 | 0.000 | |
| Connectivity facilities | −0.106 | 0.020 | −0.263 | −5.352 | 0.000 | ||||
| Thermal comfort | −0.181 | 0.025 | −0.351 | −7.134 | 0.000 | ||||
| Model | Beta | Std | Standard Beta | t | Sig | R | R2 | ANOVA (Sig) | |
|---|---|---|---|---|---|---|---|---|---|
| 1 | Physical health ← underground environment factors | ||||||||
| (Constant) | 1.617 | 0.563 | - | 2.872 | 0.005 | 0.435 | 0.189 | 0.000 | |
| Connectivity facilities | −0.089 | 0.032 | −0.179 | −2.745 | 0.007 | ||||
| Visual comfort | −0.169 | 0.044 | −0.259 | −3.891 | 0.000 | ||||
| 2 | Psychological health ← underground environment factors | ||||||||
| (Constant) | 3.143 | 0.581 | - | 5.406 | 0.000 | 0.453 | 0.205 | 0.000 | |
| Connectivity facilities | −0.101 | 0.035 | −0.189 | −2.925 | 0.004 | ||||
| Visual comfort | −0.183 | 0.047 | −0.258 | −3.929 | 0.000 | ||||
| Endogenous Variables | Exogenous Variables | Pre-Outbreak (n = 329) | Post-Outbreak (n = 196) | CDR | ||||
|---|---|---|---|---|---|---|---|---|
| Standard Estimate | C.R. | p | Standard Estimate | C.R. | p | |||
| Physical health | Greenery | −0.202 | −4.415 | 0.000 | 0.041 | 0.621 | 0.535 | 2.747 * |
| Connectivity | −0.253 | −5.141 | 0.000 | −0.168 | −2.263 | 0.024 | 0.986 | |
| Wayfinding | 0.266 | 5.423 | 0.000 | 0.065 | 0.916 | 0.360 | −2.757 * | |
| Thermal | −0.141 | −3.211 | 0.001 | −0.067 | −0.951 | 0.342 | 0.955 | |
| Acoustic | −0.189 | −4.449 | 0.000 | −0.102 | −1.546 | 0.122 | 2.088 * | |
| Visual | 0.021 | 0.502 | 0.616 | −0.275 | −3.953 | 0.000 | −3.543 * | |
| Psychological health | Connectivity | −0.256 | −5.184 | 0.000 | −0.182 | −2.657 | 0.008 | 0.130 |
| Thermal | −0.352 | −7.126 | 0.000 | −0.039 | −0.555 | 0.579 | 2.961 * | |
| Visual | 0.039 | 0.799 | 0.424 | −0.280 | −4.09 | 0.000 | −3.903 * | |
| Sites | Underground Type | Age | Enclosure | Area Size (sq ft) | Physical Health | Psychological Health |
|---|---|---|---|---|---|---|
| S1 | Subway station | 39 | Fully | >20,000 | 3.953 | 3.319 |
| S2 | Shopping center | 25 | Fully | >20,000 | 3.767 | 3.190 |
| S3 | Subway station | 21 | Partially | >20,000 | 3.623 | 2.957 |
| S4 | Subway station | 40 | Fully | >20,000 | 3.377 | 2.867 |
| S5 | Shopping center | 24 | Partially | >20,000 | 2.433 | 2.629 |
| Underground Environment Elements | Freq. |
|---|---|
1. Toilet management:
| 27 |
2. Hygiene facilities:
| 18 |
3. HVAC system:
| 17 |
4. Personal hygiene monitoring:
| 8 |
5. Crowd management:
| 6 |
6. Hygiene education:
| 4 |
7. Others:
| 5 |
| Total: | 85 |
| Recommended Underground Environment Management Approaches | Evidence | |
|---|---|---|
| Space management | Connectivity facilities
| Quantitative survey (Table 7) |
| Building services | Light management in main business and waste management areas:
| |
Ventilation and IAQ management in:
| Qualitative open-ended question (Table 9) | |
| Supporting element | Anti-epidemic hardware: | |
| ||
| Anti-epidemic software: | ||
| ||
| ||
| ||
Disclaimer/Publisher’s Note: The statements, opinions and data contained in all publications are solely those of the individual author(s) and contributor(s) and not of MDPI and/or the editor(s). MDPI and/or the editor(s) disclaim responsibility for any injury to people or property resulting from any ideas, methods, instructions or products referred to in the content. |
© 2023 by the authors. Licensee MDPI, Basel, Switzerland. This article is an open access article distributed under the terms and conditions of the Creative Commons Attribution (CC BY) license (https://creativecommons.org/licenses/by/4.0/).
Share and Cite
Chan, I.Y.S.; Chen, H. Lessons Learned from the COVID-19 Pandemic: A Multigroup Structural Equation Modelling of Underground Space Environment and Users’ Health. Buildings 2023, 13, 1321. https://doi.org/10.3390/buildings13051321
Chan IYS, Chen H. Lessons Learned from the COVID-19 Pandemic: A Multigroup Structural Equation Modelling of Underground Space Environment and Users’ Health. Buildings. 2023; 13(5):1321. https://doi.org/10.3390/buildings13051321
Chicago/Turabian StyleChan, Isabelle Y. S., and Hao Chen. 2023. "Lessons Learned from the COVID-19 Pandemic: A Multigroup Structural Equation Modelling of Underground Space Environment and Users’ Health" Buildings 13, no. 5: 1321. https://doi.org/10.3390/buildings13051321