Article

Prediction of Nonlinear Flexural Behavior of Continuous RC Beams Pre-Damaged by Corrosion

by
Youssef Elmezayen
1,
Nouman Khattak
2 and
Tamer El-Maaddawy
1,*
1
Department of Civil and Environmental Engineering, College of Engineering, Al Ain Campus, United Arab Emirates University, Al Ain 15551, United Arab Emirates
2
School of Civil and Environmental Engineering, Faculty of Engineering, Gardens Point Campus, Queensland University of Technology, Brisbane 4000, Australia
*
Author to whom correspondence should be addressed.
Buildings 2023, 13(6), 1398; https://doi.org/10.3390/buildings13061398
Submission received: 22 April 2023 / Revised: 14 May 2023 / Accepted: 26 May 2023 / Published: 29 May 2023
(This article belongs to the Section Building Materials, and Repair & Renovation)

Abstract

:
Numerical simulation models capable of predicting the nonlinear flexural behavior of continuous reinforced concrete (RC) beams with corroded reinforcement were developed. Laboratory tests were conducted to validate predictions of the numerical models. A parametric study was carried out to examine the effect of varying the location and severity of corrosion on the nonlinear flexural behavior of continuous RC beams. The load capacity of continuous RC beams decreased linearly with an increase in the severity of corrosion, regardless of its location. The corrosion of reinforcement in the sagging region was, however, more detrimental to the load capacity than hogging corrosion. The rate of the strength reduction for the beam models with sagging corrosion was approximately 70% higher than that of the models with hogging corrosion. The beam models with sagging and hogging corrosion concurrently exhibited the poorest performance. The rate of the strength reduction of the beam models with corrosion in both sagging and hogging regions was approximately 2.7 times that of the models with hogging corrosion only. The moment redistribution ratio at the ultimate load for the beam models with sagging corrosion only ranged from 2–22%. The beam models with corrosion in the hogging region only exhibited the highest moment redistribution ratio of 22–50% at the ultimate load. The beam models with sagging and hogging corrosion simultaneously exhibited a constant moment redistribution ratio of 18% at the ultimate load.

1. Introduction

The corrosion of steel reinforcing bars in reinforced concrete (RC) beams results in rust stains, concrete cracks, loss of the reinforcement cross-sectional area, and deterioration of the bond between the reinforcing steel bars and surrounding concrete [1,2,3]. Surface cracking of concrete due to corrosion affects the serviceability of RC structures and weakens the compressive and tensile properties of the surrounding concrete [3,4,5,6]. Concrete structures with corroded reinforcement may reach their serviceability limit state at a low level of corrosion mass loss [4,5,6]. The presence of closely spaced stirrups controls the propagation of corrosion cracks and restrains the rate of increase of their width at the concrete surface [5]. The degradation of the load-carrying capacity of simply supported RC beams with corroded reinforcement is highly dependent on the location of corrosion [6]. The corrosion of the compression steel reinforcing bars damages the compression zone of the concrete, which expedites crushing of the concrete, thus reducing the load-carrying capacity and ductility of the beam [6]. The corrosion of the tensile steel reinforcing bars weakens the tension stiffening effect provided by the concrete and reduces the yielding load, thus reducing the load-carrying capacity [6]. Corrosion damage in both compression and tension zones of simply supported beams has a more detrimental effect on the load-carrying capacity than that induced by corrosion either in the compression zone or the tension zone solely [6]. The behavior of continuous RC beams with corroded reinforcement differs from that of simply supported RC beams. The reduction in the load-carrying capacity caused by the corrosion of the tensile steel reinforcement in simply supported beams with well-anchored reinforcement is almost the same as the reduction in the moment strength of the midspan section. This behavior has been supported by experimental evidence in the literature [3,6]. Furthermore, it is well-known that failure of simply supported RC beams occurs when the section at the midspan reaches its maximum moment.
Dissimilar to the behavior of simply supported RC beams, the flexural load-carrying capacity of RC beams with multiple spans is controlled by the moment and rotational capacities of the critical sections at both sagging and hogging regions [7,8,9,10,11,12]. Due to their redundancy, continuous RC beams have the capacity to redistribute the moments between damaged and undamaged critical sections so that formation of a plastic hinge at one section does not necessarily lead to a structural collapse [13,14]. When the moment capacity is reached in one of the critical sections of two-span RC beams, further loads and additional deformations can be sustained prior to failure [15]. The rotational capacity of the section that exhibited the first yielding and the moment strength of the other section control the load-carrying capacity and deformability of two-span RC beams [16,17]. As such, the load capacity of continuous RC beams is a function of the moment strength of both sagging and hogging sections, and, therefore, a reduction in the moment strength in one location due to corrosion does not necessarily produce a similar reduction in the load-carrying capacity of the beam. It has been observed that reinforcement corrosion contributes to the redistribution of moments from corroded sections to uncorroded ones, relieving the most damaged regions [18,19]. Therefore, the capacity to redistribute the moments between the sagging and hogging regions inherent to statically indeterminate beams could provide an additional safety margin regarding the consequences of the corrosion phenomena. The capacity for redistributing the moments between critical sections and the higher stiffness associated with statically indeterminate structures would delay the failure of flexure-deficient RC beams and reduce the consequences of corrosion on the load-carrying capacity compared to simply supported beams [19,20]. As such, continuous RC beams can withstand higher levels of corrosion damage than simply supported beams can, and, therefore, more time between the first corrosion symptoms and the eventual collapse may elapse. Thus, data reported in the literature on the flexural behavior of deficient simply supported RC beams are invalid for continuous structures.
Prediction of the nonlinear flexural behavior of RC beams with multiple spans pre-damaged by corrosion in the sagging and/or hogging regions represents a challenge to the engineering community. Providing data on the performance of corroded continuous RC beams is crucial for design engineers and researchers because practical applications would typically require condition assessment of continuous RC structural elements. This study aims to fill this gap through numerical modeling and laboratory testing of two-span RC beams. It is noteworthy that this research is not intended to study the cracking phenomenon of the concrete cover surrounding a corroded steel reinforcing bar. The aim of this research is to examine the overall nonlinear flexural behavior of continuous RC beams with corrosion in the tensile steel reinforcement. As such, simulation models for performance prediction of two-span RC beams were developed. An experimental campaign was carried out to verify predictions of the numerical models. A parametric study was then conducted to examine the effect of varying the level of corrosion damage and the location of corrosion on the nonlinear flexural response. The outcomes of this study could aid practitioners and researchers in condition assessment of continuous RC beams pre-damaged by corrosion.

2. Methods and Materials

This study comprises numerical modeling and experimental testing. The numerical modeling included the development of three-dimensional (3D) finite element (FE) models using ATENA 3D software [21] version 5.6.1r to simulate the behavior of two-span continuous RC beams pre-damaged by corrosion in either the sagging or hogging region. The experimental testing involved the construction of eight large-scale continuous RC beam specimens and subjecting the beam specimens to accelerated corrosion exposure to induce different levels of corrosion damage in either the sagging or hogging region. Following corrosion exposure, the beam specimens were tested to failure to examine their flexural performance. Laboratory test results were used to validate predictions of the 3D simulation models.

2.1. Model Development

Eight 3D simulation models were initially developed. One beam model did not have a deficiency to act as a benchmark, whereas the other seven models had a deficiency of 10–40% corrosion cross-sectional loss in either the sagging or hogging region.

2.1.1. Configuration of the Continuous Beam Model

Figure 1 and Figure 2 show details regarding the continuous beam models pre-damaged by corrosion in the sagging and hogging regions, respectively. The models had a total length of 5200 mm and two equal spans of 2400 mm each. The cross-section of the beam models had a width of b = 150 mm, depth of h = 250 mm, and an effective depth of tension steel of d = 225 mm. The beams were designed according to the ACI 318-19 [22] to fail in flexure. The tensile steel in both the sagging and hogging regions consisted of three 12 mm diameter steel bars (3 No. 12), while the compressive steel included two 6 mm diameter bars (2 No. 6). Steel stirrups with a diameter of 8 mm (No. 8) were used at a spacing of 75 mm along the beam length. The corroded zone was located in the middle third of the sagging regions (i.e., middle 800 mm) or middle 800 mm of the hogging region. The cube (fcu) and cylinder (fc) compressive strengths of the concrete were 40 and 29, respectively, whereas the splitting tensile strength of the concrete (fsp) was 2.4 MPa. The yield and ultimate strengths of the tensile steel were 561 and 649 MPa, respectively, whereas the yield strength of the stirrups and the compressive steel was 525 MPa.

2.1.2. Material Constitutive Laws

Material constitutive laws that account for the nonlinear performance of the materials used and the bonding conditions between the steel and surrounding concrete were adopted. The CC3DNonLinCementitious2 material model built-in in ATENA software [21] was used to simulate the concrete. The compressive hardening–softening model adopted in the analysis is based on the Menétrey–Willam failure surface. It uses a return mapping algorithm for the integration of the governing equations. The nonlinear behavior of the concrete in compression starts at a compressive stress value of fco = 2ft, where ft = uniaxial tensile strength, assumed as ⅔fsp [23]. The compressive stress (σc) during the hardening phase is linked to the plastic strain (εp) through a nonlinear function [21] until the cylinder compressive strength (fc) is reached (Figure 3a). The value of the plastic strain at peak (εcp) is generated automatically by the software based on the concrete cube strength. The compressive stress decreases linearly in the post-peak phase as a function of the compressive displacement (wc) through the length scale Lc (Figure 3b). The compressive displacement at a complete release of stress (wd) is equal to 0.5 mm [21]. The tensile stress (σt) softening law exhibits an exponential function based on the crack opening displacement (wt) through the length scale Lt (Figure 3c). The conventional orthotropic fixed smeared-crack fracture model was adopted in the analysis. It adopts the Rankine’s theory for the failure criterion and an exponential softening based on crack opening. The software determines the crack opening at zero stress (wtc) based on ft and the fracture energy (Gf) of the material. The constitutive law of the tensile steel bars was assumed as linear elastic with a post-yield strain hardening (Esp) of 1% of Es (pre-yield modulus), as shown in Figure 4a [24]. An elastic–perfectly plastic behavior was assumed for the stirrups and compressions steel.
The corrosion of reinforcement in concrete reduces the area of the steel reinforcing bars, impairs the properties of the surrounding concrete, and diminishes the bond between the steel and the surrounding concrete. The impacts of corrosion of the tensile steel reinforcement in RC beam models can be considered through a reduction in the cross-sectional area of the deficient steel reinforcing bars and a change in bond-slip law at the steel–concrete interface. The bond-slip constitutive laws defined by the CEB-FIP Model code [25] for good and poor bonding conditions were adopted in the analysis for the uncorroded and corroded tensile steel reinforcing bars, respectively (Figure 4b). It is noteworthy that for RC structural elements with corrosion in the compression zone, it would be essential to adopt modified concrete constitutive laws to account for the effects of corrosion-induced cracks on the properties of the surrounding concrete.

2.1.3. Element Types and Boundary Conditions

Solid macro-elements with a maximum mesh size of 25 mm were adopted to simulate the concrete beam and the steel plates. The steel reinforcing bars were simulated by one-dimensional discrete elements that were embedded into the macro-elements of the concrete. Half of the beam was modeled to benefit from the symmetry at the central support. The end and central support plates were restricted from movement in the vertical and transverse directions. Surface supports were used to prevent movement in the longitudinal direction at the plane of symmetry. A displacement-controlled loading regime was adopted in the analysis. As such, prescribed displacements were induced at the midpoint of the top surface of the loading plate at a rate of 0.1 mm/step. Monitoring points were included in the model to record the displacement-induced loads at the top of the loading plate, the central support reactions, the sagging steel strains and the bottom surface deflections under the load point, and the hogging steel strains at the central support. Figure 5 shows the elements and boundary conditions of a typical half-numerical model along with the locations of the monitoring points. The software adopts the Newton–Raphson iterative solution. In each time step, the software iterates until a prescribed convergence criterion pertaining to displacement compatibility, force equilibrium, and balance of energy are satisfied. The line search option of the Newton–Raphson iterative solution was activated to help in stabilizing the convergence process.

2.2. Experimental Testing

An experimental campaign was carried out to validate predictions of the simulation models. The test matrix accelerated corrosion technique and setup of the structural test to failure are presented in this section.

2.2.1. Test Matrix

The test matrix is provided in Table 1. A total of eight two-span continuous beams were constructed. Test variables included the cross-sectional loss caused by corrosion in the tensile steel reinforcement (10–40%) and the location of corrosion damage (sagging or hogging region). One of the tested beams remained uncorroded to act as a control, while seven beams were subjected to accelerated corrosion. Four beams were corroded in the sagging regions, whereas three beams were corroded in the hogging region. The specimens were labeled as X–Y, where X denotes the corrosion location, (S) for sagging and (H) for hogging, and Y denotes the steel rebar cross-sectional loss due to corrosion.

2.2.2. Accelerated Corrosion

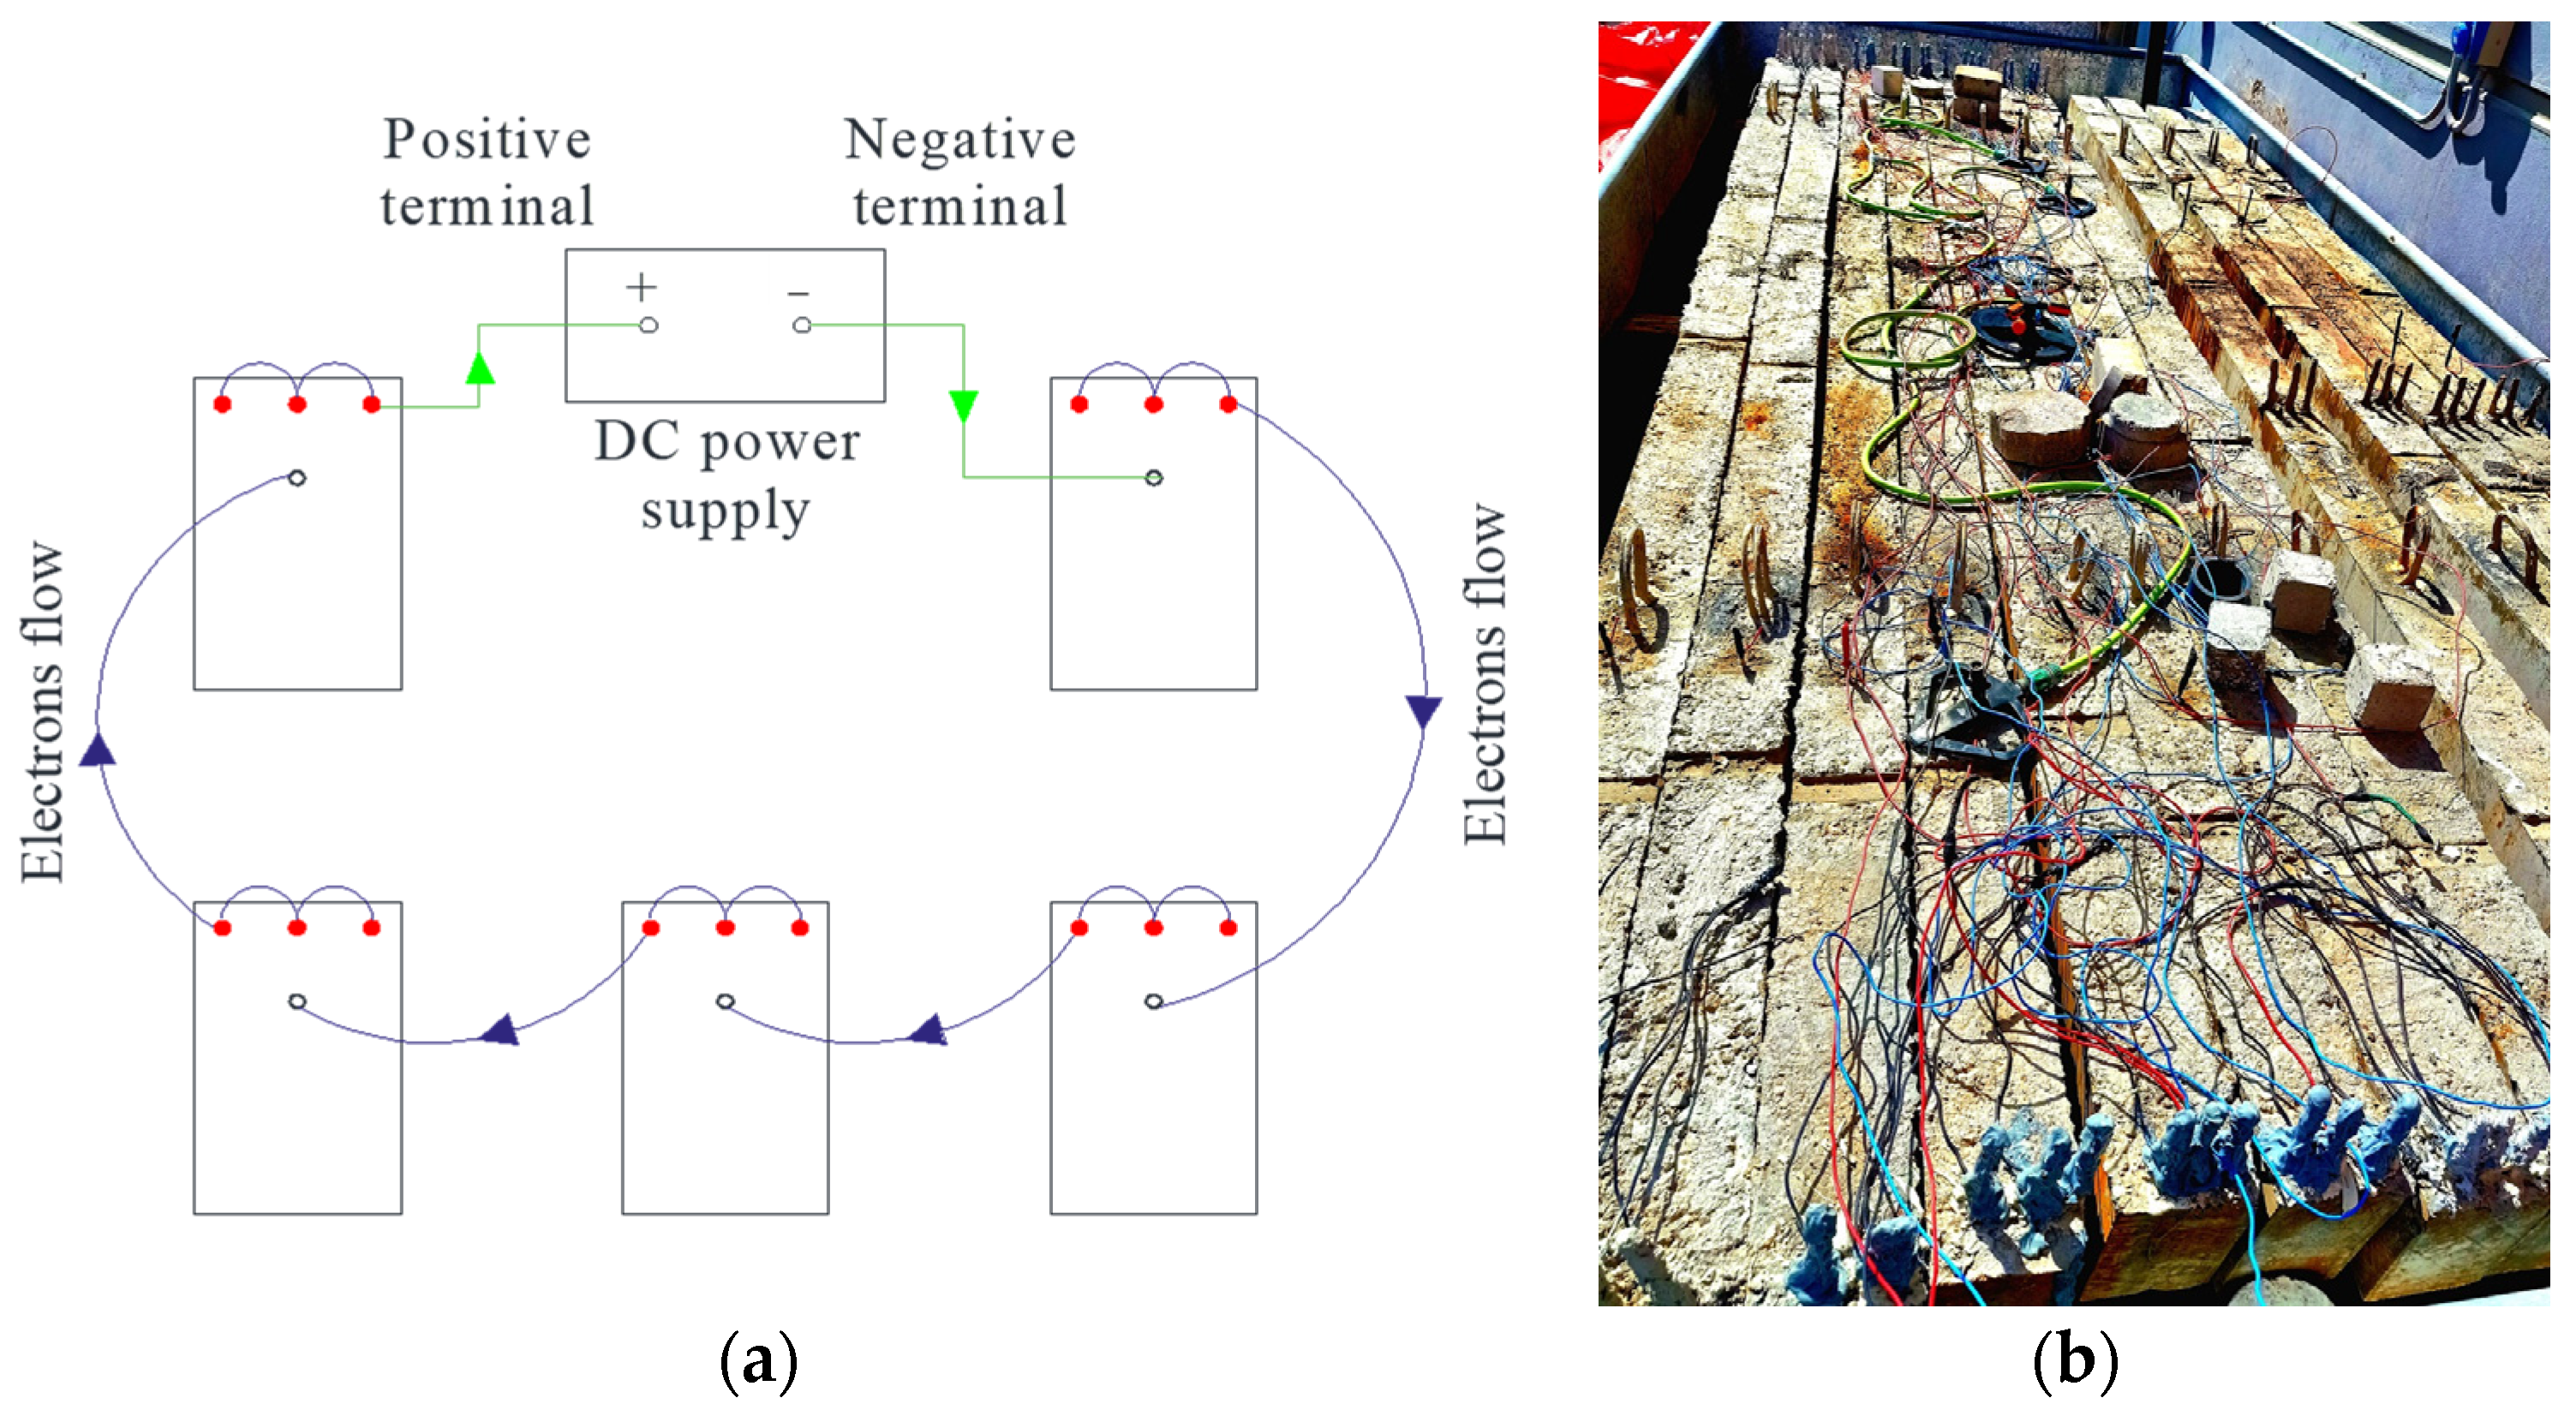
The concrete mixture used to cast the desired corroded region included 5% NaCl (salt) by weight of cement to depassivate the steel bars and promote corrosion. An internal stainless steel tube was placed longitudinally along the corroded region in either the sagging or hogging regions to act as a cathode during the accelerated corrosion process. The accelerated corrosion included impressing a constant current density of 165 μA/cm2 on the tensile steel reinforcing bars by means of external power supplies for 60, 120, 180, and 240 days, which corresponded to theoretical cross-sectional losses of 10, 20, 30, and 40%, respectively, based on Faraday’s law. The corroded steel bars were connected to the positive terminal of the power supply to act as an anode, whereas the internal stainless steel tube was connected to the negative terminal. The beams were subjected to wet–dry cycles (half-day as wet and one day as dry). During the wet phase, water mist was sprayed on the beams using fogging compressed air mist nozzles. The specimens were encased in a polyethylene cover sheet during accelerated corrosion to control the interior humidity. Figure 6a,b shows a typical electrical circuit and a photograph of the beams inside the corrosion tank, respectively.

2.2.3. Structural Test Setup

A displacement-controlled load was applied at the midpoint of each beam at a rate of 1.5 mm/min using an MTS actuator. A rigid steel beam was utilized to spread the load equally on two points located at a distance that corresponded to 40% of the beam span measured from the central support (Figure 7). The total applied load was measured by means of a load cell located between the actuator and the top surface of the spreader beam. The central support reaction was measured using another load cell placed between the beam bottom surface and the top surface of the central support. Strain gauges (SGs) were bonded to the tensile steel reinforcing bars to record steel strains during testing. The beam deflection at the bottom surface below the load points was measured using linear variant displacement transducers (LVDTs).

2.2.4. Cross-Sectional Loss Due to Corrosion

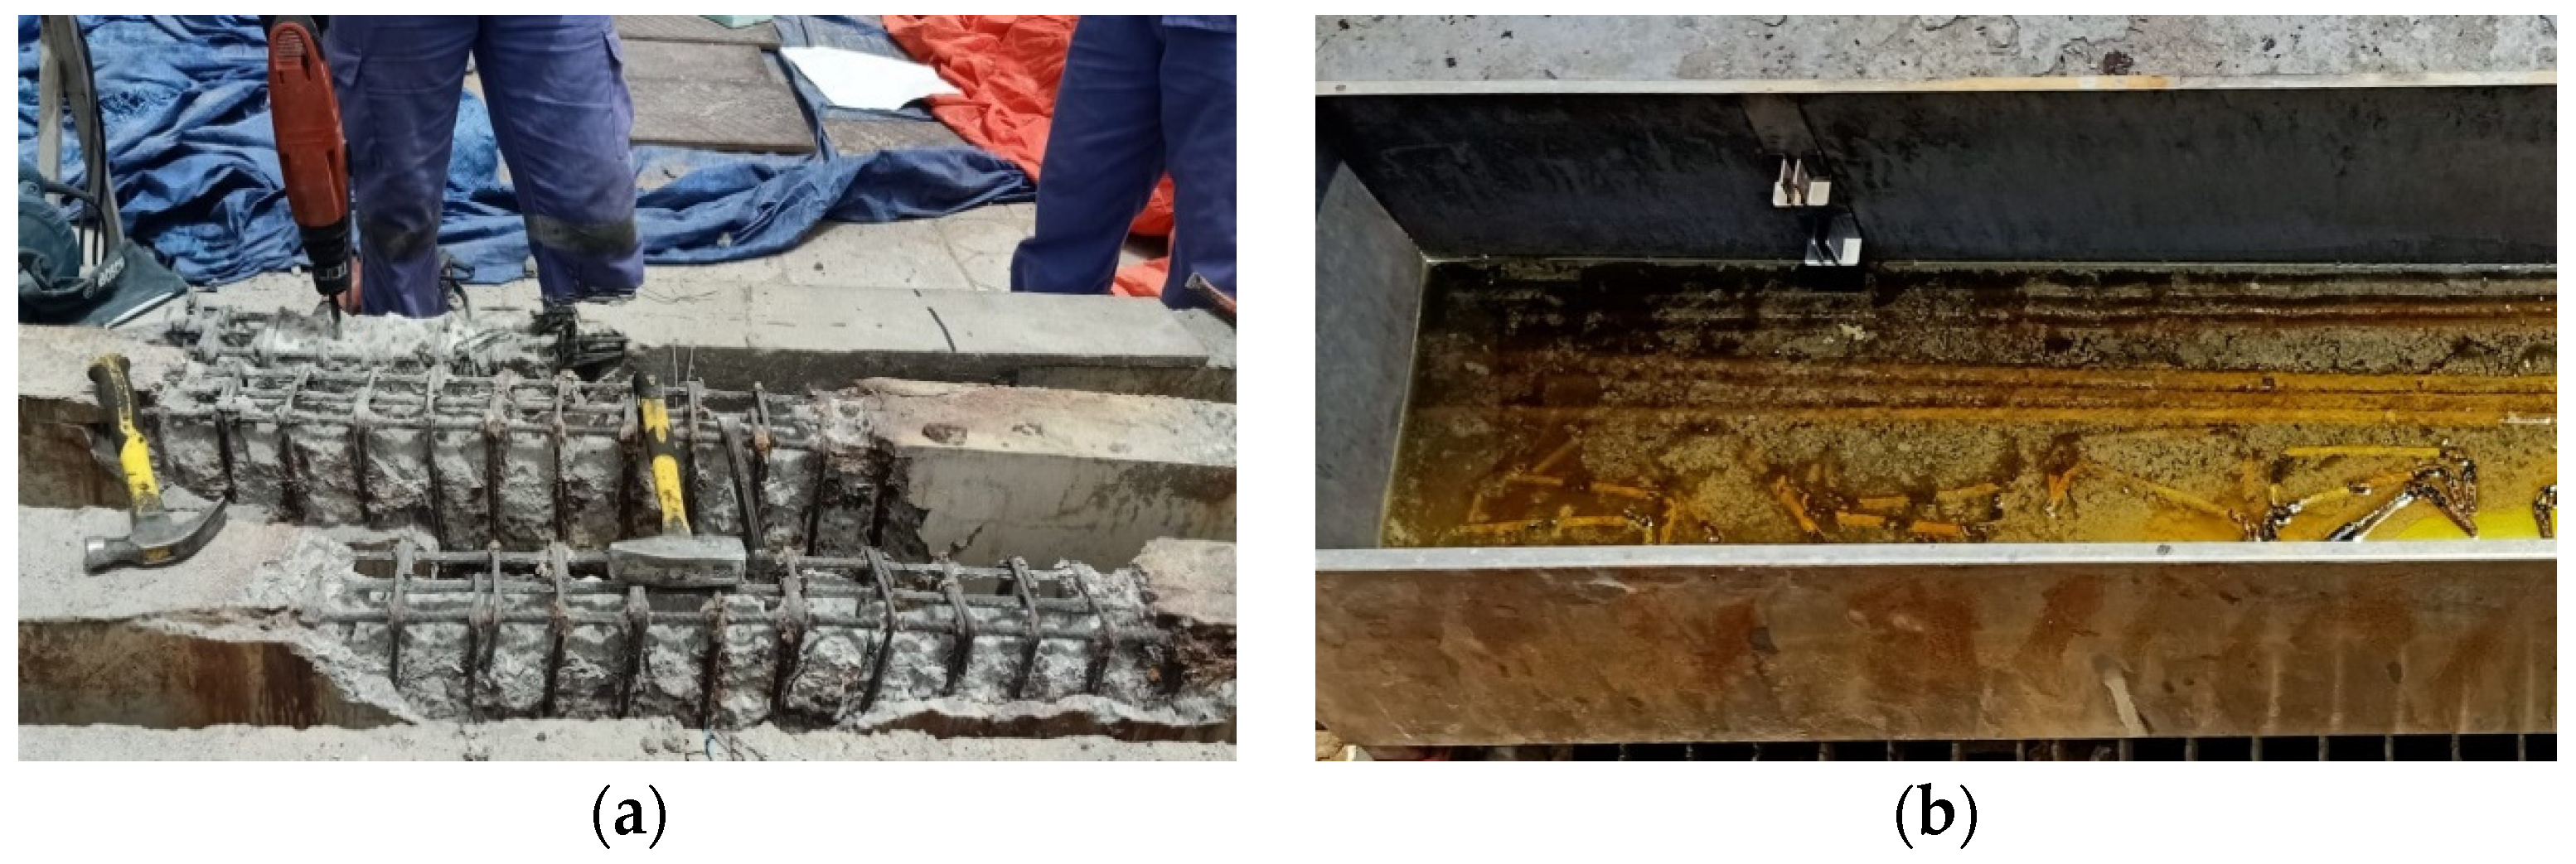
After the structural test to failure, steel coupons were extracted from corroded longitudinal steel reinforcing bars and then cleaned of rust according to the ASTM G1-03 [26] (Figure 8). The diameters of the corroded coupons were then measured using a caliper. Measurements of the corroded bar diameters verified the cross-sectional losses estimated based on Faraday’s law. Figure 9 shows typical corroded steel bars after rust removal.

3. Model Validation

A comparative analysis between the numerical and experimental test results was conducted. The load-deflection responses, crack patterns, steel strains, and failure modes obtained from the numerical analysis were compared to those obtained from the laboratory tests.

3.1. Load-Deflection Response

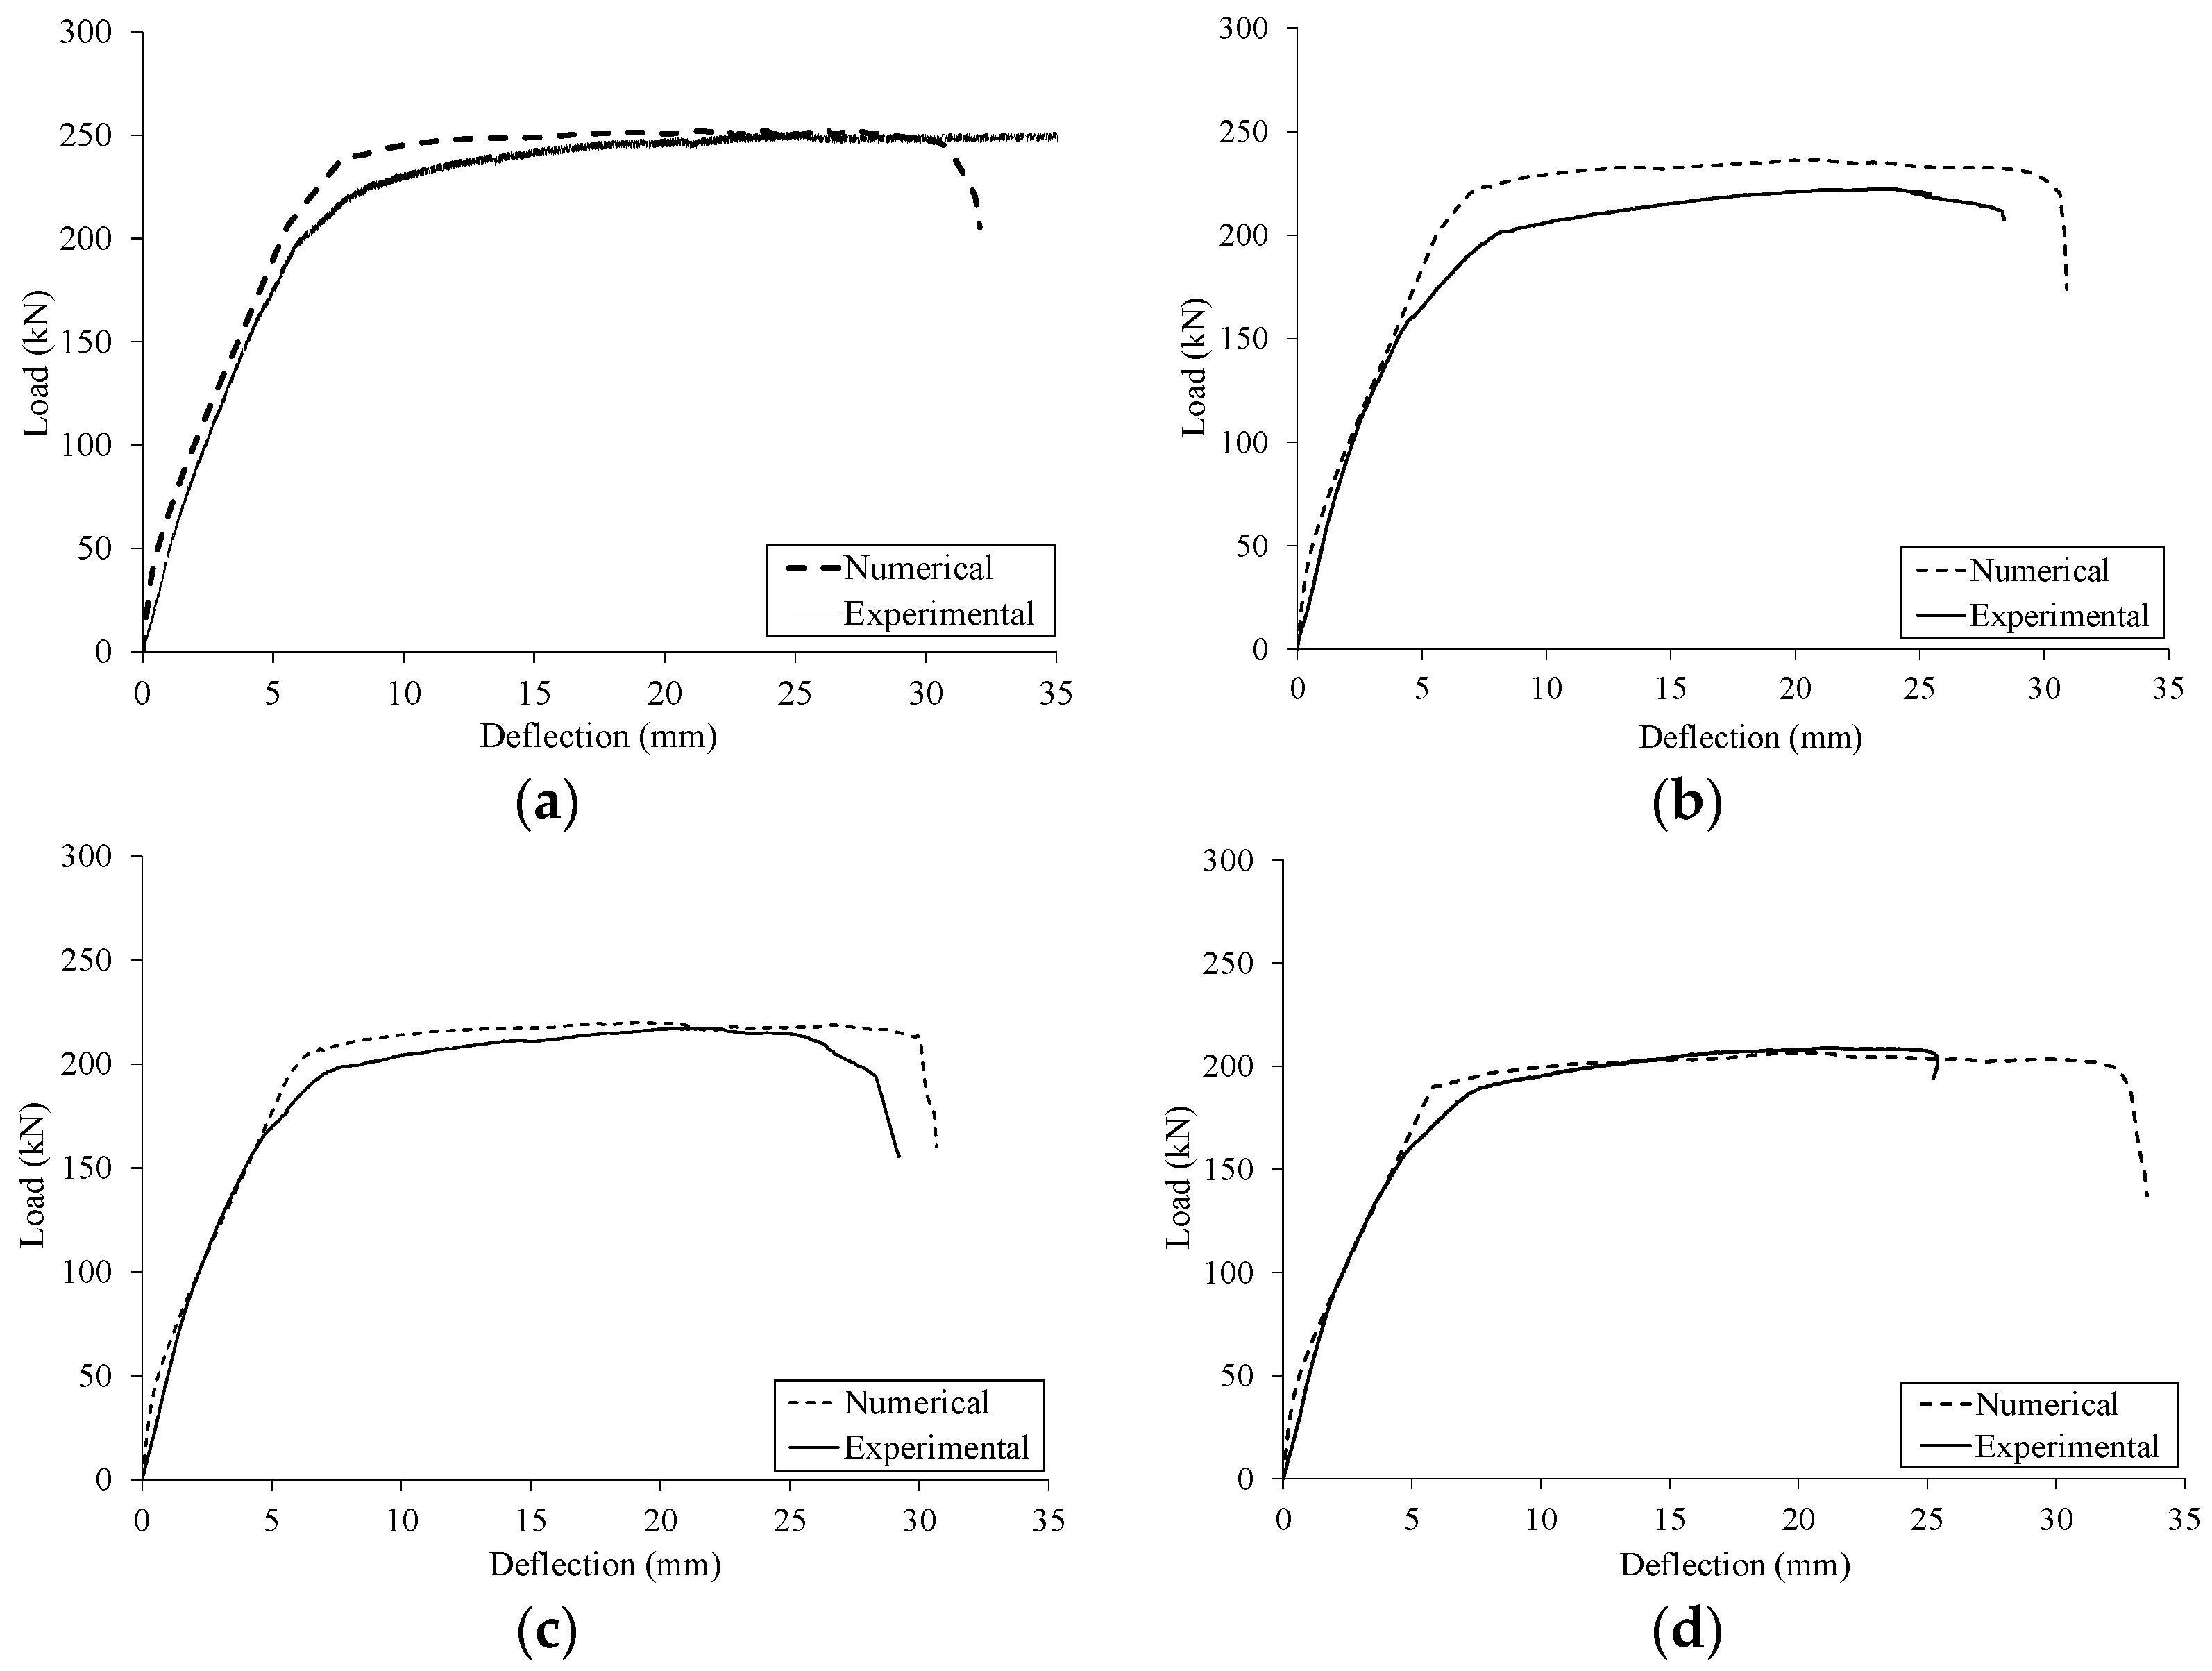
The load-deflection responses of the beams corroded in the sagging and hogging regions predicted numerically are compared to those obtained from the experiments in Figure 10 and Figure 11, respectively. It is evident that the numerical models simulated the flexural behavior of the tested beams with good accuracy. The deflection response can be idealized into four stages. In the first stage, the load increased linearly up to the cracking load. Following cracking, the deflection continued to increase, but at a higher rate, until the first yielding occurred either in the sagging or the hogging region. The first yielding insignificantly increased the rate of increase of the beam deflection. Next, the deflection increased almost linearly until the second yielding occurred in the other section. Following the second yielding, the deflection response almost plateaued. This behavior was predicted numerically and verified experimentally. A comparison between the predicted and measured results is provided in Table 2. The difference between the predicted and measured load capacities did not exceed 9%. The predicted deflections at ultimate load were within a 26% error band.

3.2. Crack Pattern

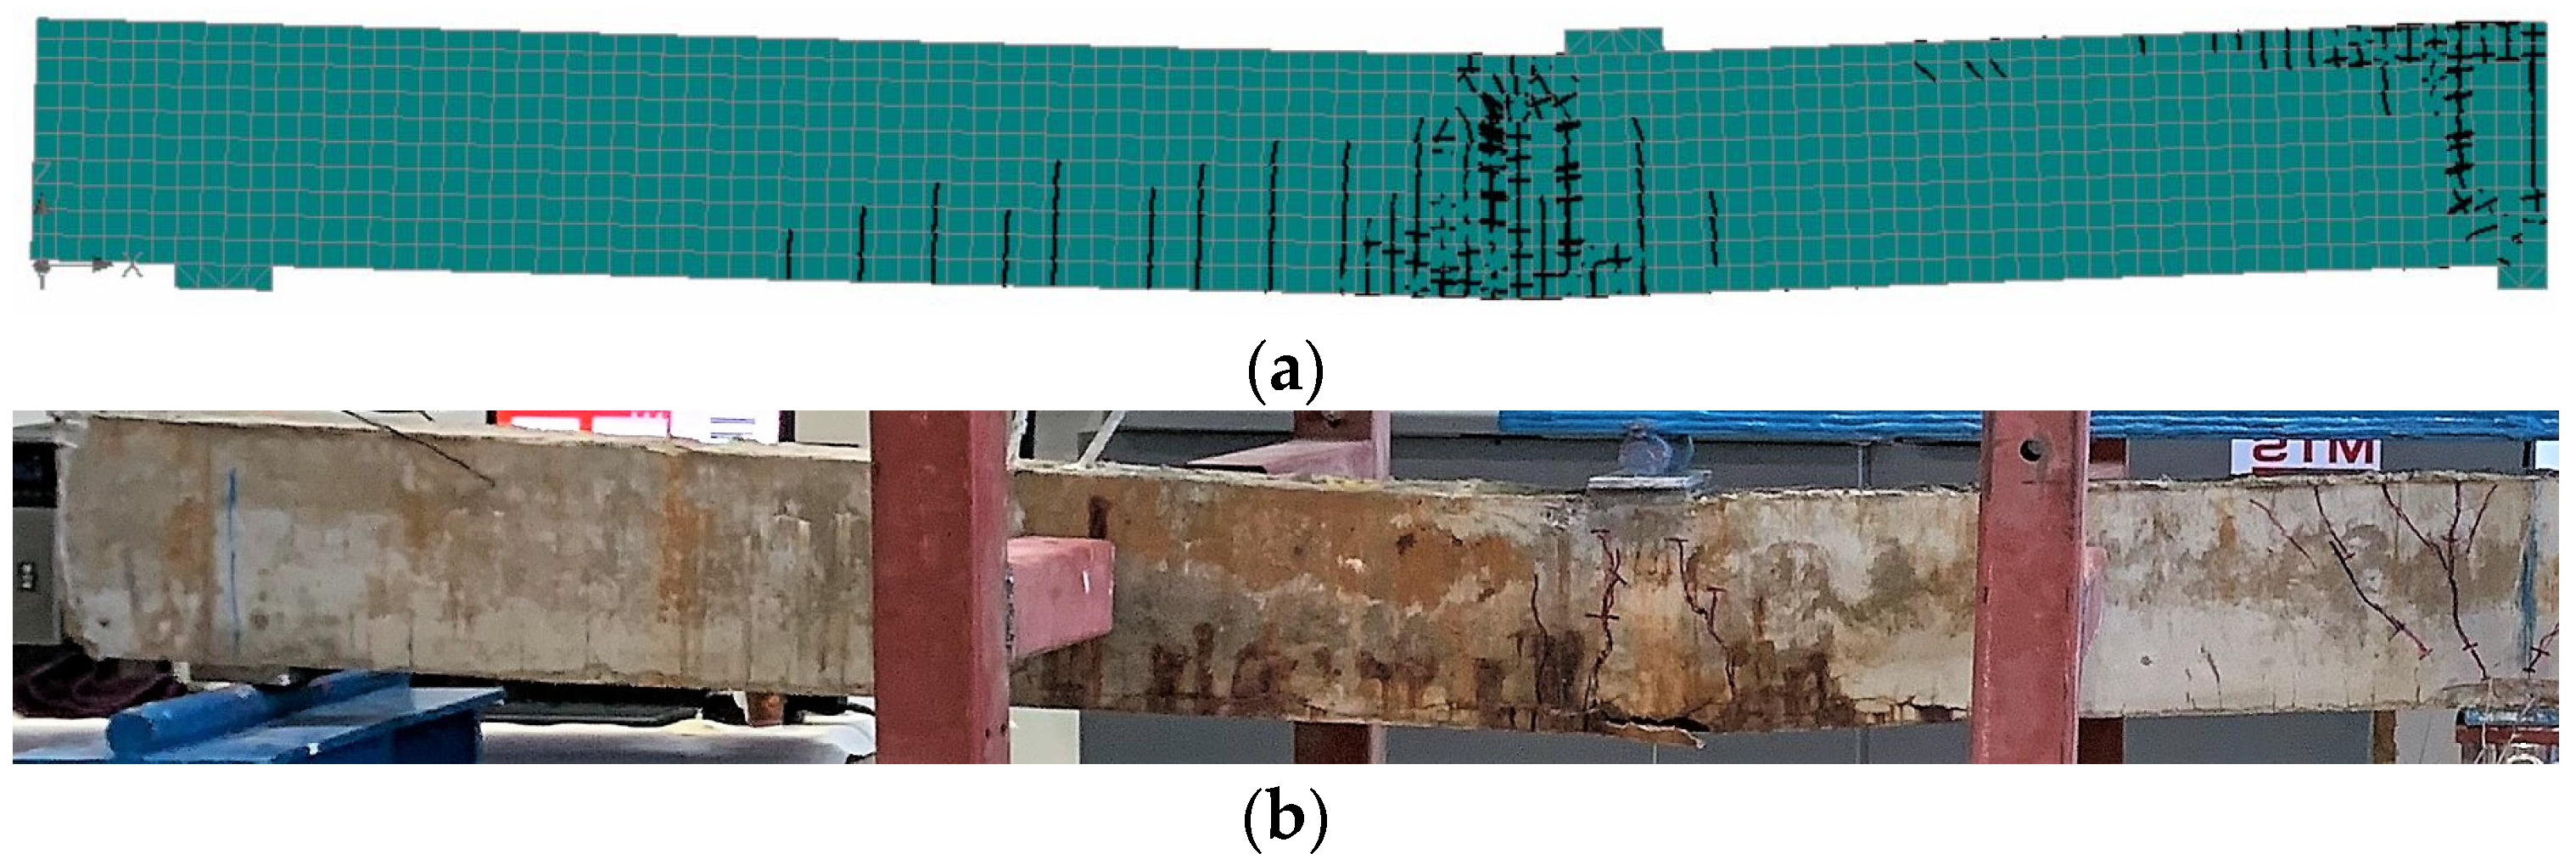
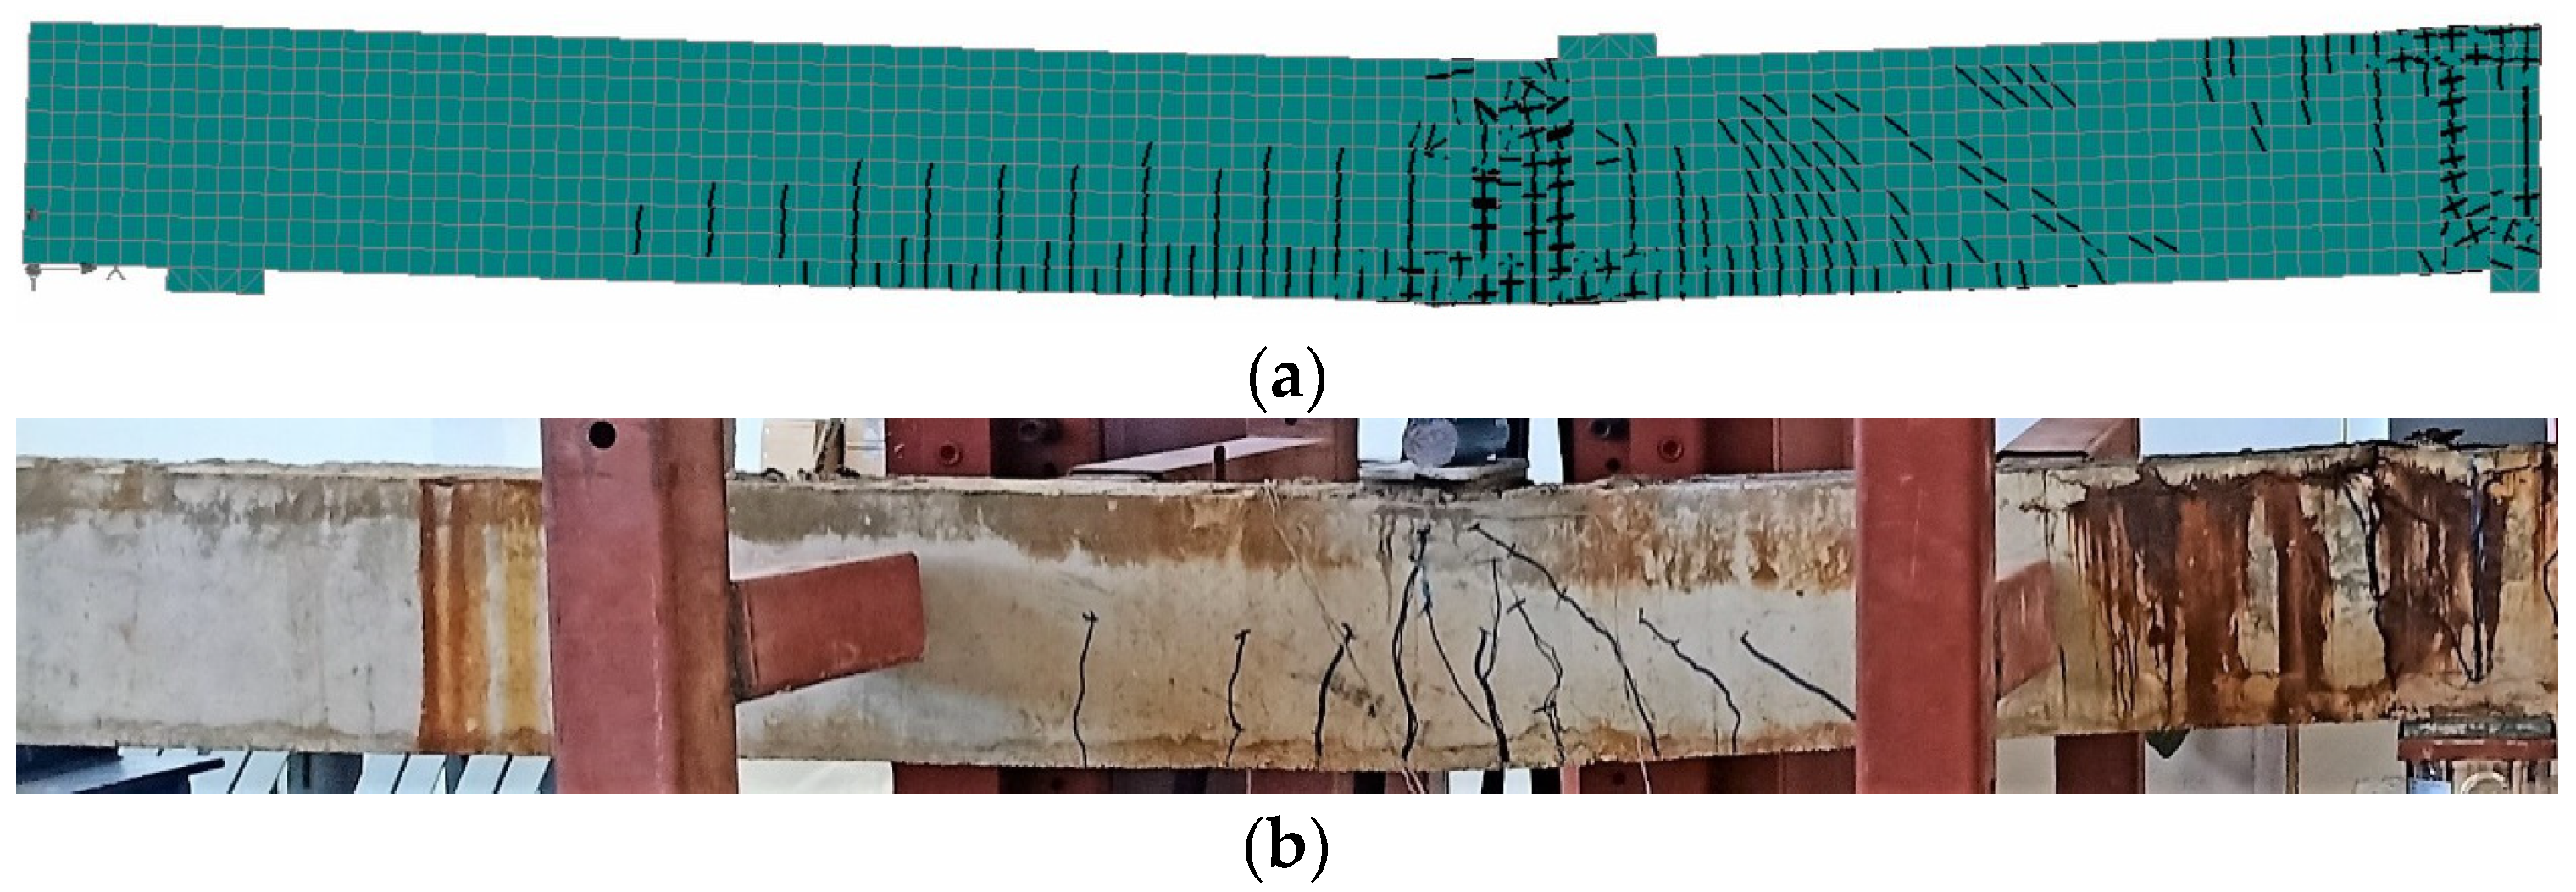
The predicted crack patterns were compared to those obtained from the experiments in Figure 12, Figure 13, Figure 14, Figure 15, Figure 16, Figure 17, Figure 18 and Figure 19. In alignment with the experimental observations, the beams showed extensive flexural cracks in the sagging and hogging regions and few flexure-shear cracks prior to failure. The failure of the specimens was initiated by the yielding of the steel reinforcement in both sagging and hogging regions followed by concrete crushing at the compression sides of both regions. The agreement between the predicted and experimental crack patterns verifies the capability of the numerical models to simulate the nonlinear behavior of two-span corroded RC continuous beams with good accuracy.

3.3. Steel Strains

Typical load–steel strain relationships obtained from the numerical analysis are plotted against those from the experiments in Figure 20, Figure 21 and Figure 22. In alignment with the experimental findings, numerical predictions of the steel strains for the control specimen indicated that the steel yielded first in the hogging region and then in the sagging region (Figure 20). Hogging and sagging steel strain responses predicted numerically were in agreement with those measured experimentally, as shown in Figure 21 and Figure 22, respectively. The steel strains exhibited a trilinear response. Initially, the steel strains increased linearly up to the initiation of flexural cracking. In the second stage, the steel strains increased at a higher rate until yielding occurred. Following yielding, a plastic response was observed.
The agreement between the outputs of the simulation models and the experimental results validated the ability of the models to predict the nonlinear behavior of corroded two-span RC beams. The developed simulation models can be considered a reliable alternative to laboratory tests, which are expensive, time-demanding, and labor-intensive.

4. Parametric Study

A parametric study was carried out to investigate the interaction between the level of corrosion damage (10–60% cross-sectional loss), the location of corrosion (sagging only, hogging only, and sagging and hogging simultaneously), and the nonlinear behavior of the beam models.

4.1. Effect of Corrosion on Load-Deflection Response

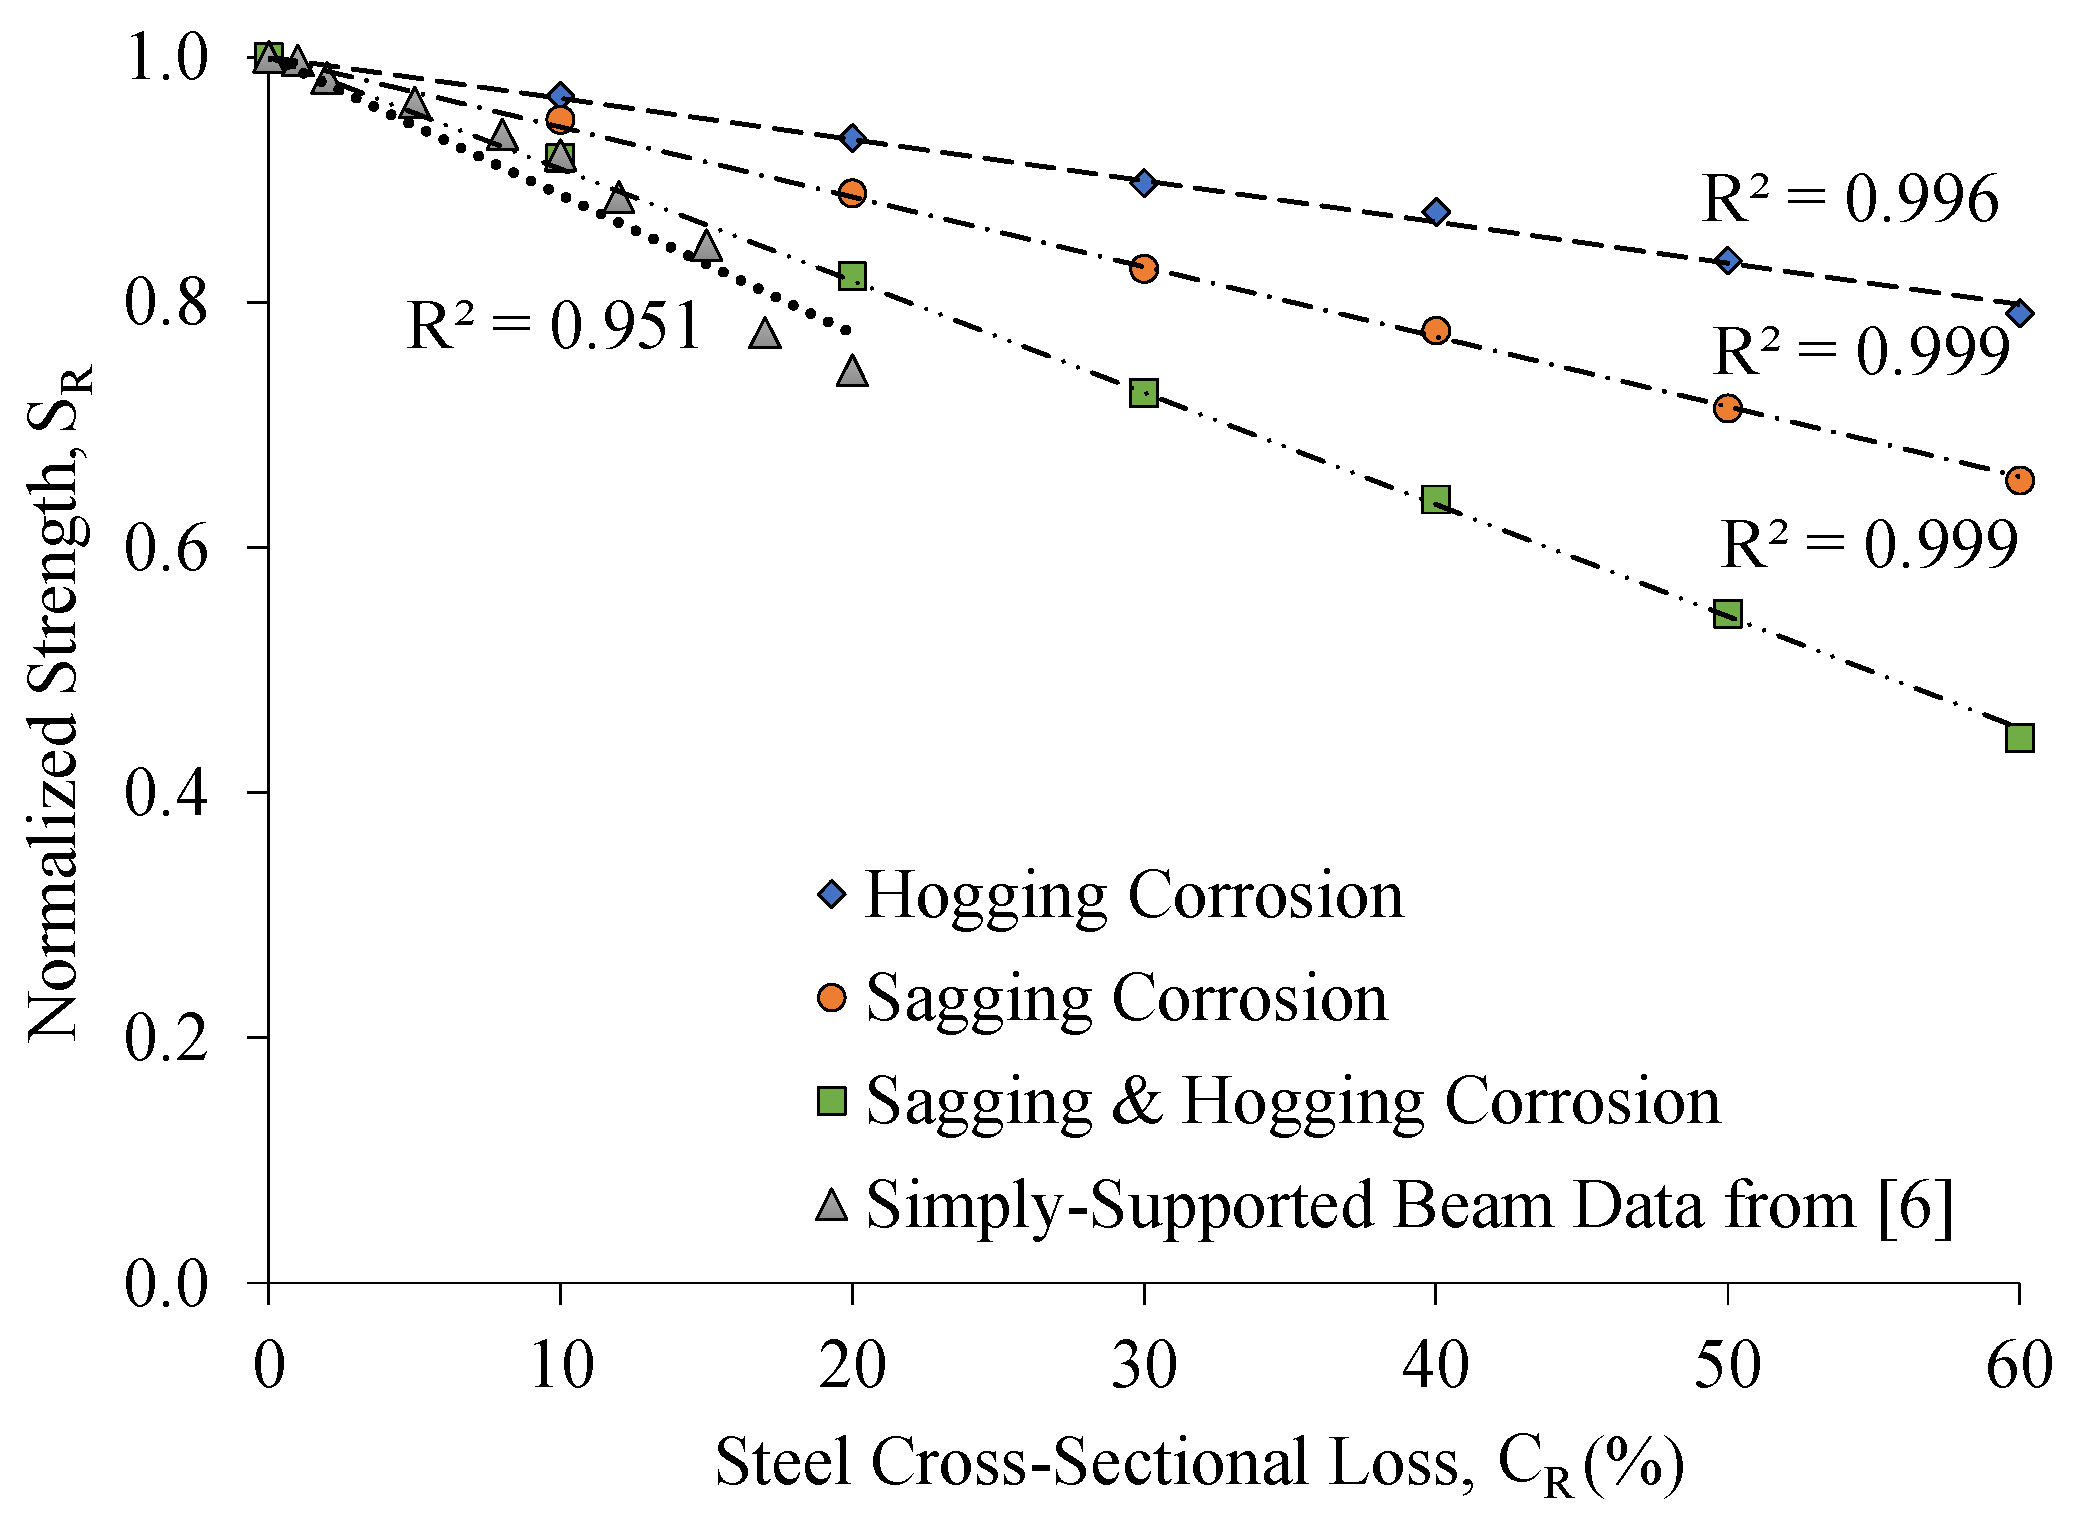
The load-deflection responses of the beam models considered in the parametric study are provided in Figure 23. It is evident that corrosion of the tensile steel reinforcement compromised the beam load capacity and flexural stiffness. The reduction in the load capacity was more pronounced for the beam models with sagging corrosion than that of their counterparts with hogging corrosion. In contrast, hogging corrosion was more detrimental to the beam’s flexural stiffness than sagging corrosion. The beam models experiencing sagging and hogging corrosion concurrently exhibited the poorest performance in terms of flexural stiffness and load capacity. Figure 24 depicts the normalized load capacity of the corroded beam models (SR) relative to that of the control beam model versus the percent reduction in the cross-sectional area of the steel bars caused by corrosion (CR). Published data of a simply supported beam from [6] with corrosion in the tensile steel reinforcement are included in the figure for the purpose of comparison. The load capacity decreased linearly with an increase in the cross-sectional loss caused by corrosion. The rate of the strength reduction caused by corrosion in continuous RC beams of the present study was dependent on the location of the corrosion damage. It is evident that the strength of the beam models with sagging corrosion reduced at a higher rate than that of the beam models with hogging corrosion. The rate of the strength reduction was aggravated further when corrosion occurred in both sagging and hogging regions concurrently. Equation 1 presents the relationship between the normalized strength of the corroded beam models and the degree of corrosion. The rate of the strength reduction of the beam models with corrosion in the sagging region was approximately 70% higher than that of their counterparts with hogging corrosion. When corrosion occurred in both sagging and hogging regions concurrently, the rate of the strength reduction increased by 2.7 folds relative to that of the beam models with corrosion in the hogging region only. It is noteworthy that published data from [6] indicated that the strength of the simply supported RC beam with corrosion in the tensile steel reinforcing bars degraded at a rate even higher than that of the continuous beam of the current study, with corrosion in both sagging and hogging regions (for the simply supported beam data, SR = 1 − 0.011CR). This finding confirms that the corrosion of the tensile steel is anticipated to have a less pronounced effect on continuous RC beams relative to that of simply supported beams.
S R = { 1 0.0034 C R Hogging   Corrosion 1 0.0057 C R Sagging   Corrosion 1 0.0091 C R Sagging   and   Hogging   Corrosion

4.2. Effect of Corrosion on Moment Redistribution

The difference in the flexural rigidity between the sagging and hogging regions in continuous RC beams results in a moment redistribution. The load versus moment relationships of the beam models obtained from the nonlinear numerical analysis are depicted in Figure 25. The elastic moment is included in the figure for the purpose of comparison. The moment redistribution ratios (β) calculated at the ultimate load for the beam models using Equation 2 are presented in Table 3. It is noteworthy that a positive sign of β indicates a moment gain, whereas a negative sign indicates a loss of moment.
β = 100 × M FE M e M e
Figure 25 shows that the behavior of the control beam model that was not corroded was nearly elastic until yielding of the hogging steel took place. Next, the sagging moment increased and the hogging moment decreased accordingly until failure occurred. The moment redistribution ratio recorded at the ultimate load for the control beam model was 18%, as provided in Table 3. The nonlinear behavior of the beam models with sagging corrosion was dependent on the level of corrosion damage (Figure 25a). The beam models with sagging corrosion of 10–30% exhibited yielding of the steel in the sagging regions shortly after it happened in the hogging region. As such, these beam models exhibited reduced values of β in the range of 2–14% only. A further increase in the sagging corrosion weakened the sagging region significantly; hence, yielding of the steel occurred first in the sagging region of the beam models with 40–60% sagging corrosion. Following yielding of the steel in the sagging regions, the sagging moments decreased and the hogging moments increased accordingly. As a result, the value of β tended to increase again with further corrosion until it reached 22% at a sagging corrosion of 60%. The beam models with hogging corrosion exhibited first steel yielding in the hogging section followed by a second steel yielding in the sagging section (Figure 25b). As a result, the moment redistribution ratio β of the beam models with hogging corrosion increased with an increase in the level of corrosion damage in the hogging region. The beam models with hogging corrosion exhibited a significant moment redistribution ratio at the ultimate load in the range of 22–50% (Table 3). Similar to the behavior of the control beam model, the beam models with corrosion in both the sagging and hogging regions exhibited the first steel yielding in the hogging section and the second one in the sagging section (Figure 25c). Following the yielding of steel in the hogging region, the hogging moment decreased and the sagging moment increased. Because the occurrence of corrosion in both sagging and hogging regions weakened both regions, the moment redistribution ratio at the ultimate load remained unaltered at a value of 18% (Table 3).

5. Conclusions

Simulation models that can predict the nonlinear flexural performance of two-span RC beams pre-damaged by corrosion were developed and verified. The conclusions of this study are summarized below:
  • The load-carrying capacity of two-span RC beams decreased linearly with an increase in the level of corrosion, irrespective of its location. The rate of the strength reduction was, however, dependent on the location of the corrosion.
  • The rate of the strength reduction of the beam models with corrosion in the sagging region only was approximately 70% higher than that of their counterparts with hogging corrosion only.
  • The rate of the strength reduction of the beam models with corrosion in both sagging and hogging regions was approximately 2.7 times that of their counterparts with hogging corrosion only.
  • Although sagging corrosion was more detrimental to the load capacity than hogging corrosion, the flexural stiffness of the beam models with hogging corrosion was lower than that of their counterparts with sagging corrosion. The beam models experiencing sagging and hogging corrosion concurrently exhibited the poorest performance in terms of flexural stiffness and load capacity.
  • The value of the moment redistribution ratio at the ultimate load was dependent on the location of corrosion and the order of steel yielding. The control uncorroded beam model exhibited a first steel yielding in the hogging section followed by a second steel yielding in the sagging section, which resulted in a moment redistribution ratio of 18% at the ultimate load.
  • The moment redistribution ratio at the ultimate load of the beam models with corrosion in the sagging region only decreased with an increase in the level of damage up to 30% corrosion. Further corrosion in the sagging region increased the moment redistribution ratio at ultimate load. The beam model with 60% corrosion in the sagging region exhibited a moment redistribution ratio of 22% at the ultimate load.
  • The moment redistribution ratio at ultimate load of the beam models with corrosion in the hogging region only increased consistently with an increase in the level of corrosion damage. The beam models with corrosion in the hogging region only exhibited a moment redistribution ratio of 22–50% at the ultimate load.
  • The corrosion of steel in both the sagging and hogging regions concurrently did not change the order of the steel yielding. The moment redistribution ratio at ultimate load for the beam models with sagging and hogging corrosion remained constant at 18%.

Author Contributions

Conceptualization, T.E.-M., Y.E. and N.K.; methodology, T.E.-M., Y.E. and N.K.; software, Y.E. and T.E.-M.; validation, Y.E. and T.E.-M.; formal analysis, Y.E. and T.E.-M.; investigation, Y.E., N.K. and T.E.-M.; resources, T.E.-M.; data curation, Y.E. and N.K.; writing—original draft preparation, Y.E.; writing—review and editing, T.E.-M. and Y.E.; visualization, Y.E. and N.K.; supervision, T.E.-M.; project administration, T.E.-M.; funding acquisition, T.E.-M. All authors have read and agreed to the published version of the manuscript.

Funding

This project is funded by the United Arab Emirates University (UAEU) (grant number 12N004).

Institutional Review Board Statement

Not applicable.

Informed Consent Statement

Not applicable.

Data Availability Statement

The data presented in this study are available upon request from the corresponding author. The data are not publicly available due to privacy issues.

Conflicts of Interest

The authors declare no conflict of interest.

References

  1. Bossio, A.; Imperatore, S.; Kioumarsi, M. Ultimate Flexural Capacity of Reinforced Concrete Elements Damaged by Corrosion. Buildings 2019, 9, 160. [Google Scholar] [CrossRef]
  2. Yalciner, H.; Kumbasaroglu, A.; El-Sayed, A.K.; Balkis, A.P.; Dogru, E.; Turan, A.I.; Karimi, A.; Kohistani, R.; Mermit, M.F.; Bicer, K. Flexural Strength of Corroded Reinforced Concrete Beams. ACI Struct. J. 2020, 117, 29–41. [Google Scholar] [CrossRef]
  3. El Maaddawy, T.; Soudki, K.; Topper, T. Long-Term Performance of Corrosion-Damaged Reinforced Concrete Beams. ACI Struct. J. 2005, 102, 649–656. [Google Scholar]
  4. El Maaddawy, T.; Soudki, K. A model for prediction of time from corrosion initiation to corrosion cracking. Cem. Concr. Compos. 2007, 29, 168–175. [Google Scholar] [CrossRef]
  5. Wang, Y.; Zhao, Y.; Gong, F.; Dong, J.; Maekawa, K. Developing a Three-Dimensional Finite Element Analysis Approach to Simulate Corrosion-Induced Concrete Cracking in Reinforced Concrete Beams. Eng. Struct. 2022, 257, 114072. [Google Scholar] [CrossRef]
  6. Zeng, B.; Yang, Y.; Gong, F.; Maekawa, K. Corrosion Crack Morphology and Creep Analysis of Members Based on Meso-Scale Corrosion Penetration. Materials 2022, 15, 7338. [Google Scholar] [CrossRef] [PubMed]
  7. El-Refaie, S.A.; Ashour, A.F.; Garrity, S.W. Sagging and Hogging Strengthening of Continuous Reinforced Concrete Beams Using Carbon Fiber-Reinforced Polymer Sheets. ACI Struct. J. 2003, 100, 446–453. [Google Scholar]
  8. El-Maaddawy, T.; Alshawa, J.; El-Ariss, B. Strengthening of Continuous Concrete Slab Strips Containing Cutouts. ACI Struct. J. 2016, 113, 1243–1252. [Google Scholar] [CrossRef]
  9. Alkhalil, J.; El-Maaddawy, T. Nonlinear Flexural Response of Continuous Concrete Slab Strips Strengthened with Near Surface–Mounted Composites. J. Compos. Constr. 2017, 21, 04016071. [Google Scholar] [CrossRef]
  10. Alkhalil, J.; El-Maaddawy, T. Finite Element Modelling and Testing of Two-Span Concrete Slab Strips Strengthened by Externally-Bonded Composites and Mechanical Anchors. Eng. Struct. 2017, 147, 45–61. [Google Scholar] [CrossRef]
  11. Su, M.; Zeng, C.; Li, W.; Zhu, J.H.; Lin, W.; Ueda, T.; Xing, F. Flexural Performance of Corroded Continuous RC Beams Rehabilitated by ICCP-SS. Compos. Struct. 2020, 232, 111556. [Google Scholar] [CrossRef]
  12. Feng, R.; Liu, Y.; Zhu, J.H.; Xing, F. Flexural Behaviour of C-FRCM Strengthened Corroded RC Continuous Beams. Compos. Struct. 2020, 245, 112200. [Google Scholar] [CrossRef]
  13. Fernandez, I.; Herrador, M.F.; Marí, A.R.; Bairán, J.M. Structural Effects of Steel Reinforcement Corrosion on Statically Indeterminate Reinforced Concrete Members. Mater. Struct. Mater. Constr. 2016, 49, 4959–4973. [Google Scholar] [CrossRef]
  14. Fernandez, I.; Herrador, M.F.; Marí, A.R.; Bairán, J.M. Ultimate Capacity of Corroded Statically Indeterminate Reinforced Concrete Members. Int. J. Concr. Struct. Mater. 2018, 12, 1–23. [Google Scholar] [CrossRef]
  15. Khattak, N.; Mansour, M.; El-Maaddawy, T.; Ismail, N. Continuous Reinforced Concrete Beams Strengthened with Fabric-Reinforced Cementitious Matrix: Experimental Investigation and Numerical Simulation. Buildings 2022, 12, 27. [Google Scholar] [CrossRef]
  16. Cairns, J.; Coakley, E. Deformation of Continuous Reinforced Concrete Beams during Patch Repair. Struct. Concr. 2010, 11, 149–160. [Google Scholar] [CrossRef]
  17. Ashour, A.F.; El-Refaie, S.A.; Garrity, S.W. Flexural Strengthening of RC Continuous Beams Using CFRP Laminates. Cem. Concr. Compos. 2004, 26, 765–775. [Google Scholar] [CrossRef]
  18. Fernandez, I.; Bairán, J.M.; Marí, A.R. Corrosion Effects on the Mechanical Properties of Reinforcing Steel Bars. Fatigue and σ-ε Behavior. Constr. Build. Mater. 2015, 101, 772–783. [Google Scholar] [CrossRef]
  19. Insua, A.G. Effects of Reinforcement Corrosion on Ductility and Stress Redistribution Capacity in Continuous Reinforced Concrete Beams; Tabajo Final de Máster: Barcelona, Spain, 2021. [Google Scholar]
  20. Marí, A.R.; Valdés, M. Long-Term Behavior of Continuous Precast Concrete Girder Bridge Model. J. Bridge Eng. 2000, 5, 22–30. [Google Scholar] [CrossRef]
  21. ATENA Computer Software. Cervenka Consulting s.r.o.: Prague, Czech Republic. Available online: https://www.cervenka.cz/products/atena/ (accessed on 23 November 2022).
  22. ACI 318-19; Building Code Requirements for Structural Concrete—Commentary on Building Code Requirements for Structural Concrete (ACI 318R-19). American Concrete Institute (ACI): Farmington Hills, MI, USA, 2019.
  23. Ashour, S.A.; Hasanain, G.S.; Wafa, F.F. Shear Behavior of High-Strength Fiber Reinforced Concrete Beams. Struct. J. 1992, 89, 176–184. [Google Scholar]
  24. El-Tawil, S.; Ogunc, C.; Okeil, A.M.; Shahawy, M. Static and Fatigue Analyses of RC Beams Strengthened with CFRP Laminates. J. Compos. Constr. 2001, 5, 58–267. [Google Scholar] [CrossRef]
  25. Comité Euro-International du Béton (CEB). CEB-FIP Model Code-Design Code; Thomas Telford: London, UK, 1991. [Google Scholar]
  26. ASTM G1-90; Standard Practice for Preparing, Cleaning, and Evaluating Corrosion Test Specimens. ASTM International: West Conshohocken, PA, USA, 1999.
Figure 1. Geometry and details regarding reinforcement of beam models with sagging corrosion (dimensions are in mm).
Buildings 13 01398 g001
Figure 2. Geometry and details regarding reinforcement of beam models with hogging corrosion (dimensions are in mm).
Buildings 13 01398 g002
Figure 3. Hardening and softening concrete laws: (a) compressive hardening; (b) compressive softening; (c) tensile softening.
Buildings 13 01398 g003
Figure 4. Constitutive laws of tension steel: (a) stress−strain response; (b) bond-slip law.
Buildings 13 01398 g004
Figure 5. Typical numerical half-model for the two-span continuous beam.
Buildings 13 01398 g005
Figure 6. Accelerated corrosion: (a) a typical electric circuit; (b) beams inside the corrosion tank.
Buildings 13 01398 g006
Figure 7. Structural test setup.
Buildings 13 01398 g007
Figure 8. Extraction of corroded bars and rust removal: (a) extraction of steel coupons; (b) corroded bars during chemical cleaning.
Buildings 13 01398 g008
Figure 9. Corroded steel bars after rust removal: (a) cross-sectional loss = 10%; (b) cross-sectional loss = 20%; (c) cross-sectional loss = 30%; (d) cross-sectional loss = 40%.
Buildings 13 01398 g009
Figure 10. Numerical vs. experimental load-deflection response of the beams with sagging corrosion: (a) S-10; (b) S-20; (c) S-30; (d) S-40.
Buildings 13 01398 g010
Figure 11. Numerical vs. experimental load-deflection response of beams with hogging corrosion: (a) H-20; (b) H-30; (c) H-40.
Buildings 13 01398 g011
Figure 12. Crack pattern of the control specimen: (a) numerical; (b) experimental.
Buildings 13 01398 g012
Figure 13. Crack pattern of specimen S-10: (a) numerical; (b) experimental.
Buildings 13 01398 g013
Figure 14. Crack pattern of specimen S-20: (a) numerical; (b) experimental.
Buildings 13 01398 g014
Figure 15. Crack pattern of specimen S-30: (a) numerical; (b) experimental.
Buildings 13 01398 g015
Figure 16. Crack pattern of specimen S-40: (a) numerical; (b) experimental.
Buildings 13 01398 g016
Figure 17. Crack pattern of specimen H-20: (a) numerical; (b) experimental.
Buildings 13 01398 g017
Figure 18. Crack pattern of specimen H-30: (a) numerical; (b) experimental.
Buildings 13 01398 g018
Figure 19. Crack pattern of specimen H-40: (a) numerical; (b) experimental.
Buildings 13 01398 g019
Figure 20. Numerical vs. experimental steel strains for the control specimen: (a) sagging region; (b) hogging region.
Buildings 13 01398 g020
Figure 21. Numerical vs. experimental hogging steel strains: (a) S-10; (b) S-30; (c) S-40.
Buildings 13 01398 g021
Figure 22. Numerical vs. experimental sagging steel strains: (a) H-20; (b) H-30; (c) H-40.
Buildings 13 01398 g022
Figure 23. Effect of corrosion on load–deflection relationship: (a) sagging corrosion; (b) hogging corrosion; (c) sagging and hogging corrosion.
Buildings 13 01398 g023
Figure 24. Normalized strength vs. steel cross-sectional loss caused by corrosion [6].
Buildings 13 01398 g024
Figure 25. Effect of corrosion on moment redistribution: (a) sagging corrosion; (b) hogging corrosion; (c) sagging and hogging corrosion.
Buildings 13 01398 g025
Table 1. Test matrix.
SpecimenCorrosion LocationCorrosion Duration (Days)Corrosion Damage (%) *
Control---
S-10Sagging Region6010
S-20Sagging Region12020
S-30Sagging Region18030
S-40Sagging Region24040
H-20Hogging Region12020
H-30Hogging Region18030
H-40Hogging Region24040
* Cross-sectional loss in the tensile steel reinforcing bars caused by corrosion based on Faraday’s law.
Table 2. Comparison between numerical and experimental results.
SpecimenUltimate Load (kN)Error (%) *Deflection at Ultimate Load (mm)Error (%) *
Numerical
(PFE)
Experimental
(PExp)
Numerical
FE)
Experimental
Exp)
Control266.0244.7+8.721.617.1+26.3
S-10252.4251.7+0.326.225.0+4.8
S-20236.4222.3+6.320.923.8−12.2
S-30220.0217.3+1.219.222.0−12.7
S-40206.6208.7−1.020.821.6−3.7
H-20248.4247.4+0.424.022.0+9.1
H-30238.6231.4+3.124.623.5+4.7
H-40232.4223.0+4.223.123.6−2.1
* Error   ( % ) = Numerical     Experimental Experimental   ×   100 .
Table 3. Moment redistribution ratio at ultimate load.
Corrosion
Location
Corrosion
Damage
(%)
Moment at Ultimate, MFE
(kN.m)
Elastic Moment, ME
(kN.m)
Moment Redistribution Ratio, β (%)
SaggingHoggingSaggingHoggingSaggingHogging
Control-46.950.239.861.318−18
Sagging1043.250.037.858.214−14
2038.549.935.454.59−8
3033.849.633.050.72−2
4030.049.431.047.6−34
5025.449.128.443.7−1112
6020.948.926.140.1−2022
Hogging 1047.046.338.659.422−22
2047.241.837.257.227−27
3047.137.335.755.032−32
4047.033.934.853.535−37
5046.829.133.251.141−43
6046.824.231.548.549−50
Sagging and Hogging 1043.246.236.656.318−18
2038.641.632.750.318−17
3034.0836.628.944.518−18
4029.832.125.539.217−18
5025.527.521.833.517−18
6020.822.317.727.318−18
Disclaimer/Publisher’s Note: The statements, opinions and data contained in all publications are solely those of the individual author(s) and contributor(s) and not of MDPI and/or the editor(s). MDPI and/or the editor(s) disclaim responsibility for any injury to people or property resulting from any ideas, methods, instructions or products referred to in the content.