Article

Numerical Simulation of Airflow in the Main Cable of Suspension Bridge with FPM Model

1
School of Environmental Engineering, Wuhan Textile University, Wuhan 430200, China
2
Zhejiang Zhoushan Cross-Sea Bridge Co., Ltd., Ningbo 316034, China
3
CCCC Highway Consultants Co., Ltd., Beijing 100026, China
*
Author to whom correspondence should be addressed.
Buildings 2023, 13(6), 1422; https://doi.org/10.3390/buildings13061422
Submission received: 6 May 2023 / Revised: 20 May 2023 / Accepted: 25 May 2023 / Published: 31 May 2023
(This article belongs to the Special Issue AI and Data Analytics for Energy-Efficient and Healthy Buildings)

Abstract

:
The main cable of suspension bridges is subject to corrosion and requires advanced anti-corrosion technology. Consequently, the internal airflow of the main cable has become a significant research focus. This study employs image processing and machine learning to analyze the cross-sectional images of the main cable and reveals the distribution characteristics of pores and fractures within the main cable cross-section. The numerical simulation model of the main cable is divided into inner and outer parts based on porosity, with porosity levels of 18.16% and 32.11%, respectively. Fractures randomly occurred in the inner part, with a probability of 31.37%. A simulation model based on fractured porous media (FPM) is developed, which innovatively incorporates the fracture flow model into the numerical simulation of the internal airflow of the main cable. The numerical simulation clearly explores the intricate details of the internal flow field of the main cable, revealing that the existence of fractures has a great impact on the internal flow field of the main cable. Additionally, the relative deviation of specific frictional head loss between the field experiment and numerical simulation is about 6.83%, indicating that the numerical simulation results are relatively reliable.

1. Introduction

Bridges are critical infrastructure in the process of economic development. Suspension bridges have become essential structures for spanning rivers and seas enabled by continuous advancements in bridge design and construction technology. The main cable is the principal load-bearing structure of the suspension bridge, and the quality of its anti-corrosion is closely linked to the service lifetime of the bridge [1]. During transportation and construction, rainwater may wet the main cable, which cannot drain naturally after completion due to its structural limitations, leading to the retention of water between the wires of the main cable [2]. Additionally, the protective layer of the main cable may be cracked, allowing external rainwater and humid air to enter the main cable, leading to corrosion of the wires. Relevant studies [3] demonstrate that the different presence of moisture causes varying degrees of corrosion on the wires of the main cable, which subsequently affects the bearing capacity of the main cable.
In recent years, research on bridge cable anti-corrosion technology has also been continuously developing. A popular technology for corrosion resistance of the main cable is to deliver dry air into the pores of the main cable [4]. This technology operates by transporting dehumidified air into the interior of the main cable, which removes moisture and maintains low humidity inside the main cable to achieve its objectives. The anti-corrosion efficiency is determined by the flow field in the main cable.
Currently, there are various studies investigating the internal flow field of the main cable through field experiments. Wei et al. [5] constructed an experimental platform to measure the pressure at various positions of the main cable and developed a semi-empirical formula for air resistance in the main cable. Chen et al. [6] developed a novel air supply method for the main cable and determined the required air supply pressure for dehumidification through experiments and theoretical calculations. While these studies have successfully obtained some internal parameters of the main cable, they are based on field experiments, which can be time-consuming and expensive. Numerical simulation is a reliable and faster method for studying the internal environment of the main cable. Wei et al. [7] used this method to determine the amount of water evaporation and the mass transfer coefficient inside the main cable under ventilation conditions. Yao et al. [8] used a porous medium model to study the airflow inside the main cable. Ju et al. [9] studied the temperature and humidity inside the main cable based on the porous media model. These studies employed a simplified porous medium model of the main cable to reduce the complexity of modeling, thus improving the efficiency of the research. However, they overlook the details of airflow inside the main cable.
The main cable is mainly erected by the precast parallel wire strand method [10], which squeezes many prefabricated hexagonal strands composed of wires into a main cable. The main cable erected by this method mainly presents three forms: the outer wires, the inner hexagonal strands, and the fractures between the hexagonal strands. In the previous numerical simulation, the wires and the pores inside the main cable were replaced by a porous medium model, and the fractures inside the main cable were ignored. The situation of coexistence of porous media and fractures inside the main cable is very similar to the fracture flow in groundwater seepage. In the case of groundwater seepage, the geotechnical medium is generally regarded as a medium with both porous media and fractures. There are many studies on fracture flow development so far, which provide ideas for studying air flow in fractures inside the main cable. Patrick Zulian et al. [11] explored the advantages of applying non-standard network models to study fluid flow in porous media and fractures. Tianran Ma et al. [12] used the discontinuous Galerkin method and the continuous Galerkin method to predict unidirectional flow in fractured porous media. Jungin Lee et al. [13] discussed the latest progress in linking roughness effects with various fluid flow phenomena.
Among studies on the internal physical field of the main cable, introducing the porous media model based on Darcy’s law and its changed form has gradually become the focus of research. However, limited studies calculated the porosity and permeability of the main cable and considered the influence of fractures on the internal physical field of the main cable. To address these gaps, this study analyzed the distribution characteristics of the internal pores of the main cable using image processing technology; combined the porous media model with fracture seepage theory; developed a fractured porous media model for numerical simulation of the flow field inside the main cable; and the reliability of the simulation was verified through field experiments. This study provides a novel approach for subsequent engineering practice and theoretical research.

2. Development of the FPM Model

Air primarily flows through pores between the wires and fractures between the hexagonal strands of the main cable. This study used porosity and fracture networks to depict the distribution of pores and fractures within the main cable and developed an FPM model for numerical simulation. The porosity and fracture networks were extracted from the picture of the main cable cross-section.

2.1. Obtaining Porosity of the Model

Image processing technology has experienced rapid development since its inception and is now widely used in various fields, including medicine, biology, and building materials [14,15,16]. Digital image processing transforms picture information into digital data, which can be manipulated by computers.
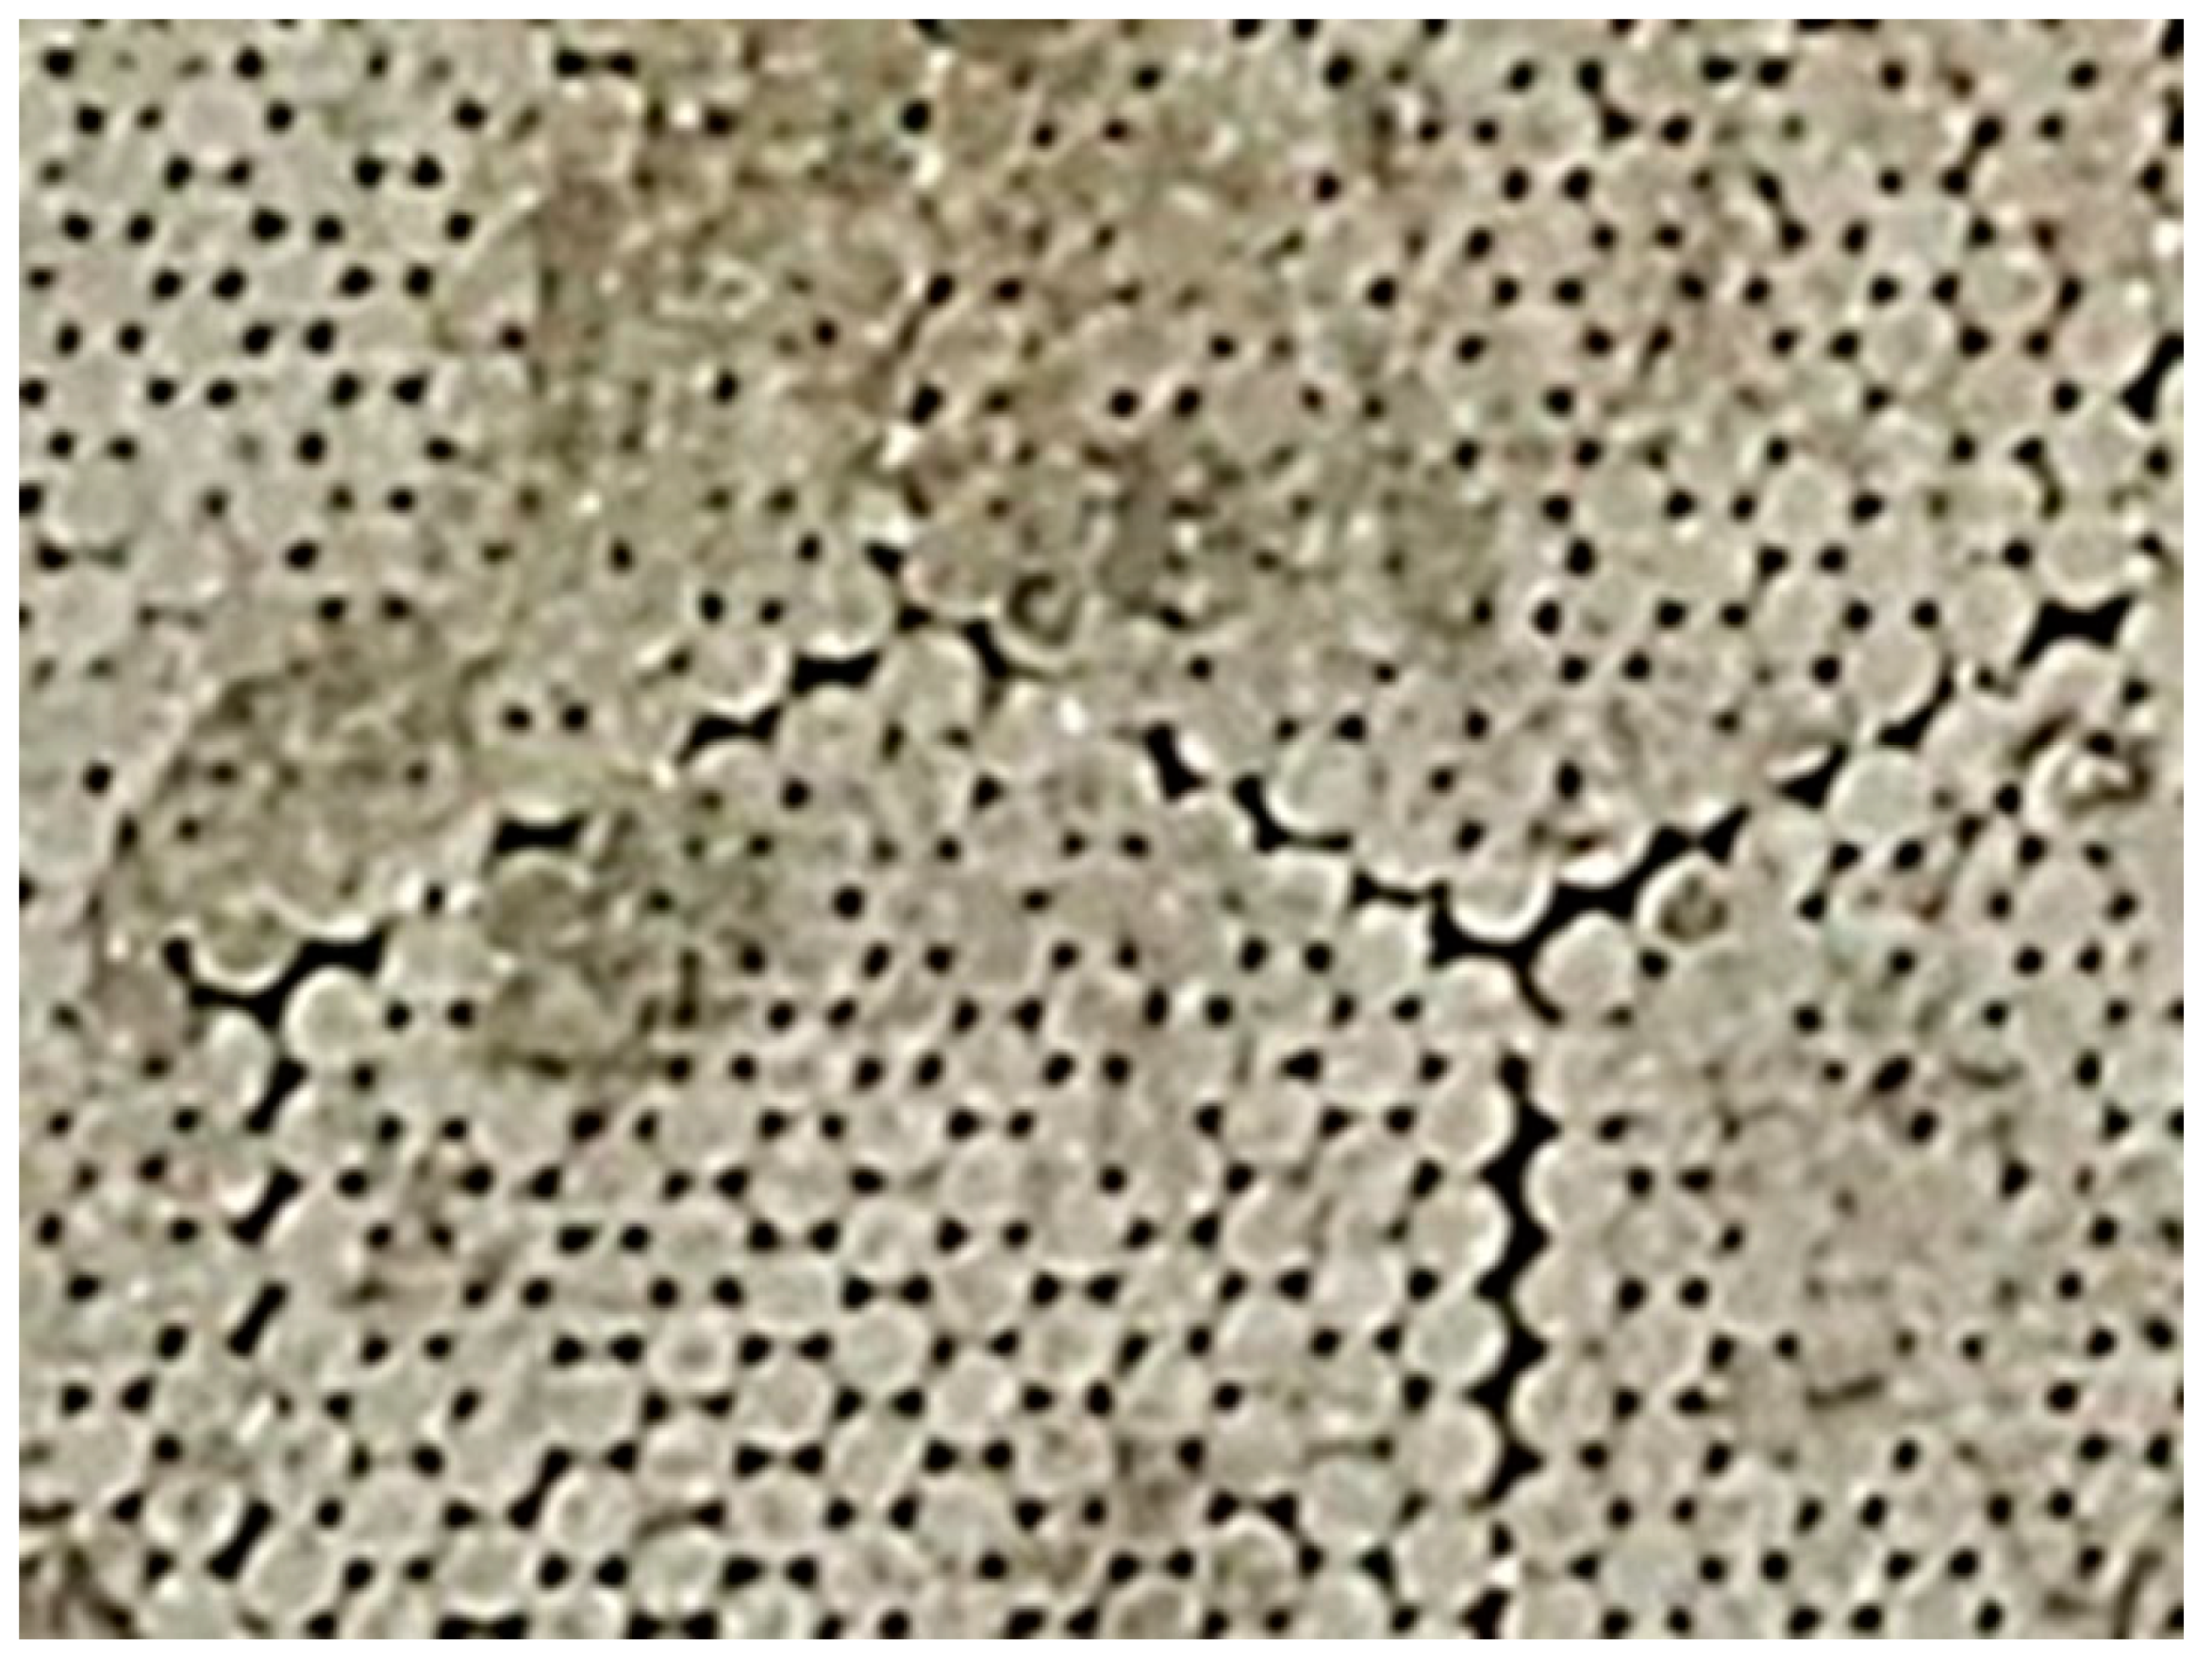
Therefore, preprocessing operations were first executed on the picture for subsequent image processing, as shown in Figure 1. Image segmentation algorithms were used to extract the porosity. An intricate part of the main cable cross-section served as the sample image to test image segmentation algorithms, as shown in Figure 2. Two image segmentation algorithms were assessed, and the most efficient algorithm was selected for further analysis.
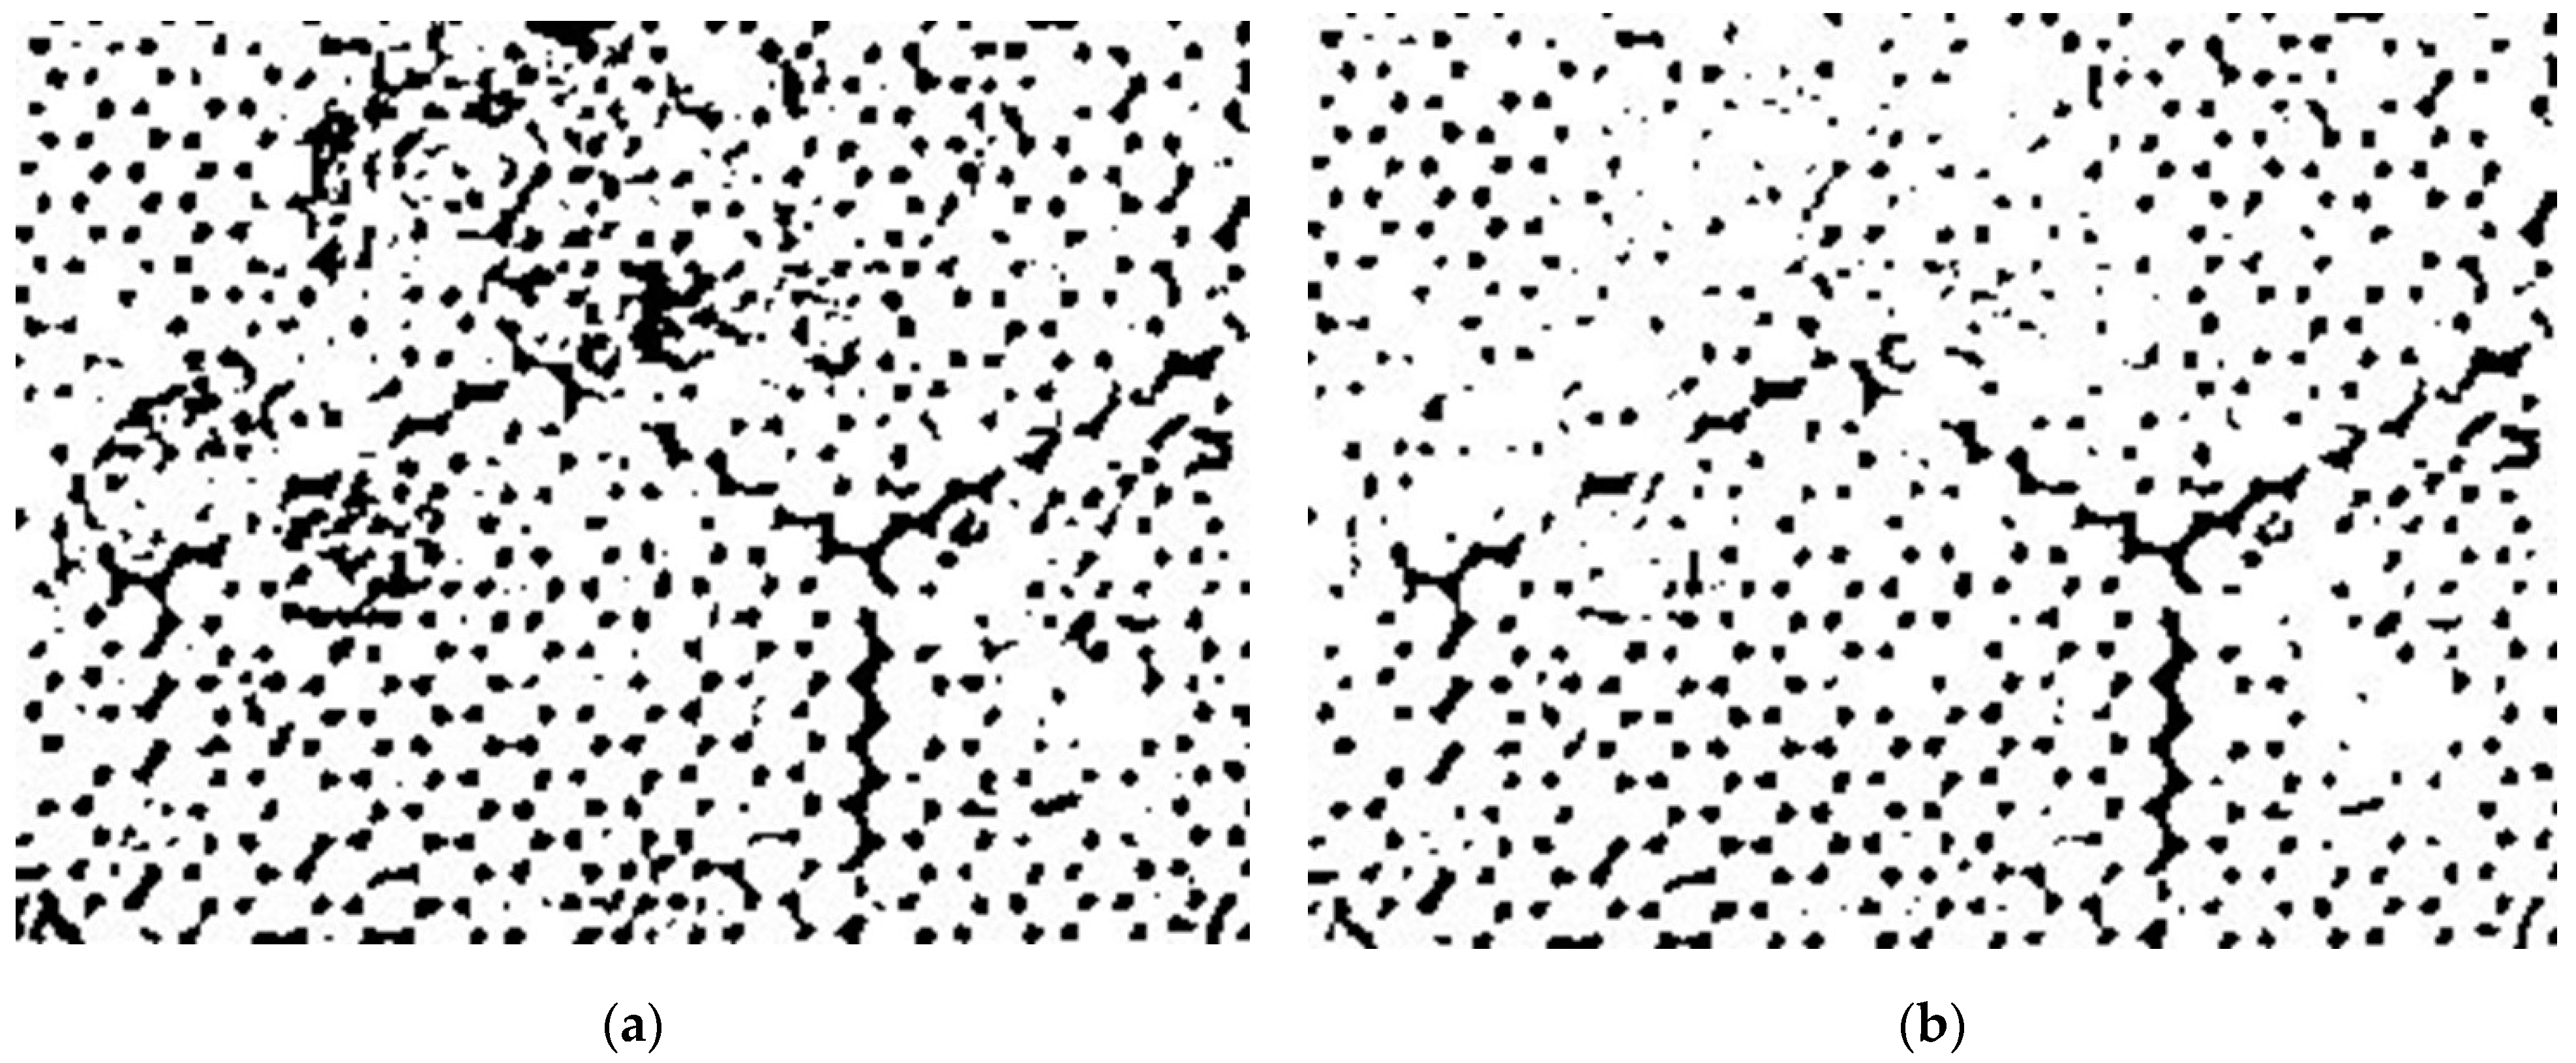
Researchers frequently employ the Otus algorithm and Sauvola algorithm [17] for image segmentation. Figure 3a illustrates the pores segmented by the Otus algorithm. The results show that the segmentation performance was satisfactory in areas where wire colors were well-defined. However, the Otus algorithm was susceptible to noise and non-target colors, leading to the misclassification of some noise areas as pores, resulting in errors in porosity calculation; this was due to the Otus algorithm utilizing a global threshold that was sensitive to image noise and target characteristics. When the contrast between the background and the target was indistinct, the segmentation performance might have been inadequate. As the image lacked a clear distinction between pores and wires, the segmentation effect of this algorithm was inferior.
In contrast, the Sauvola algorithm overcomes the limitations of the Otus algorithm by utilizing an adaptive threshold that considers the local image characteristics. Figure 3b illustrates the pores that were segmented by the Sauvola algorithm. The results show significant improvement in the segmentation accuracy of pores, particularly in areas with weak wire contrast. The Sauvola algorithm reduced the misclassification, resulting in a more accurate porosity calculation. Therefore, the Sauvola algorithm was a reliable method for segmenting pores in the main cable cross-section image.
After selecting the image segmentation algorithm, several assumptions were made to obtain the porosity:
  • This research used a 200 × 1120 pixels image to study the porosity of the main cable;
  • The pixels with grayscale 0 were considered as pores for subsequent calculations;
  • The influence of wrapping tape and other materials on the porosity was ignored;
  • The porosity of the main cable was about 20% [18], which was used as a standard for judging the correctness of porosity in this study.
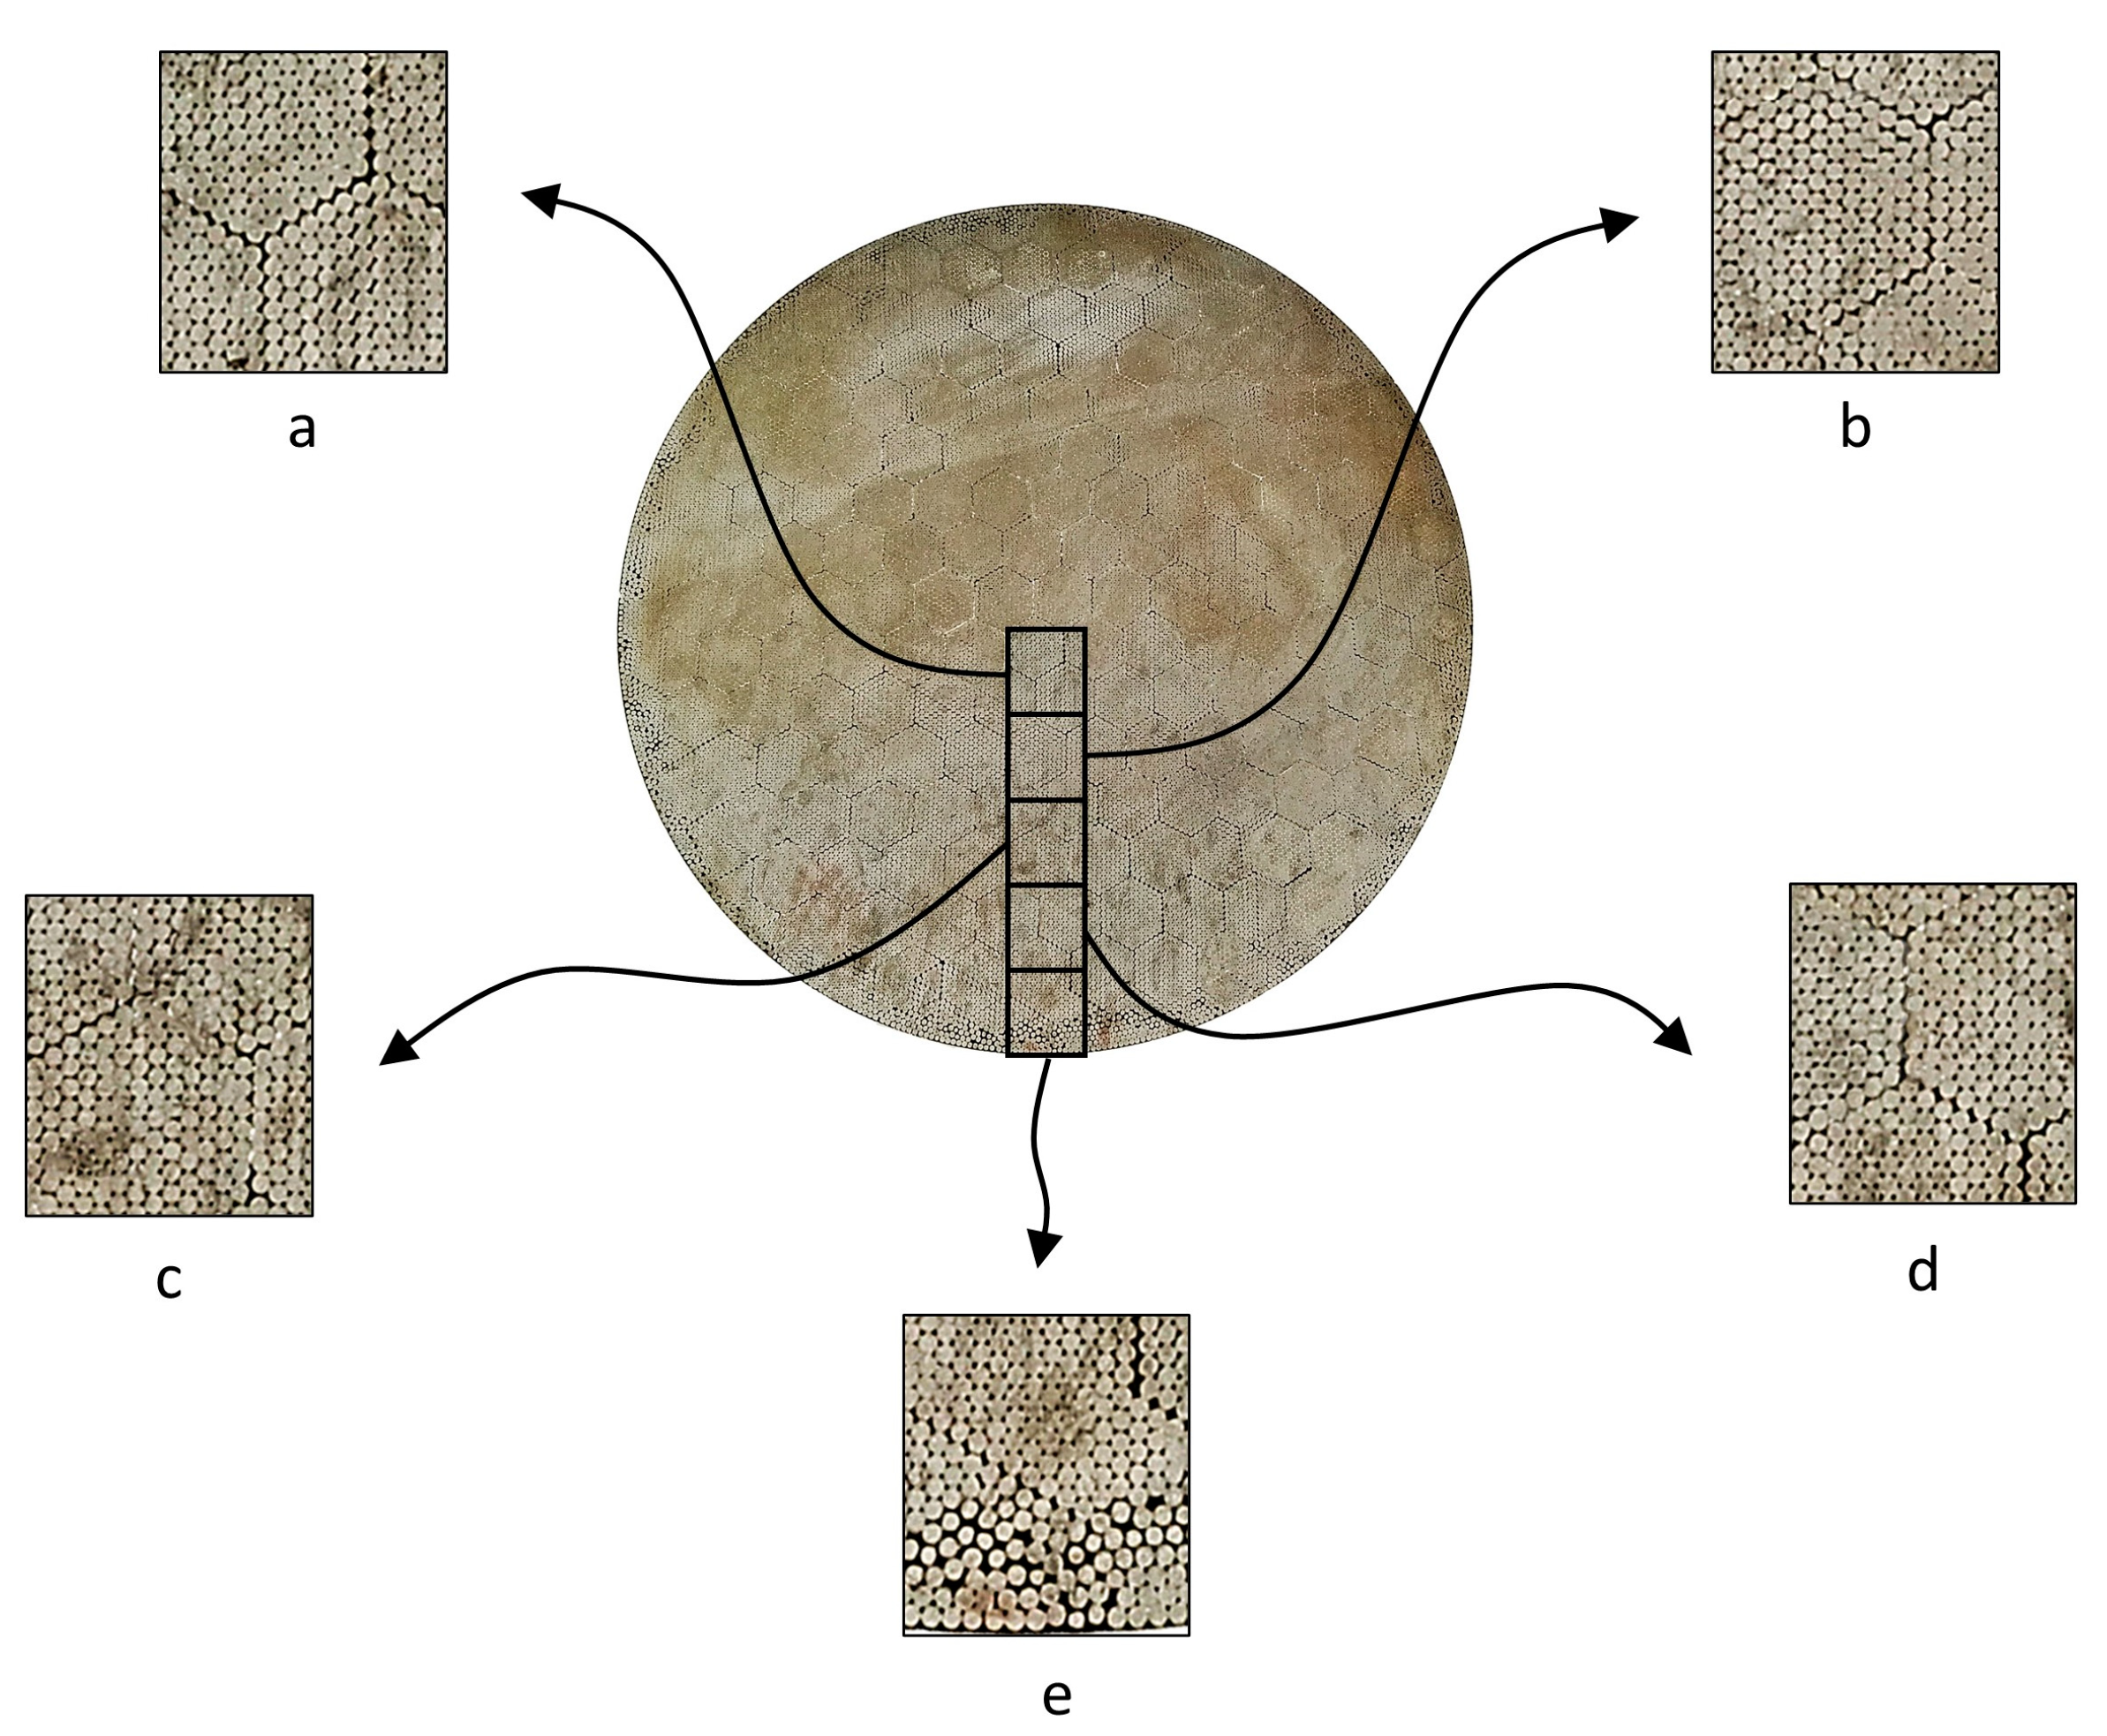
Following the aforementioned assumptions, a representative part of the main cable cross-section was divided into five parts, labeled as a, b, c, d, and e, as shown in Figure 4. Subsequently, image segmentation and porosity calculation were conducted on each part to determine the porosity of the main cable. The formula for calculating the porosity was as follows:
ε = S p o r o s S t o t a l
where ε is the porosity; S p o r o s is the area of pores; S t o t a l is the area of the image.
The porosity for each part is displayed in Figure 5. The average porosity of the selected area was 19.38%, which was close to 20%; however, the porosity abruptly increased in Part e. Using the average porosity to describe Part e would be inaccurate. Therefore, it was essential to consider the discrepancy in porosity to enhance the accuracy of the numerical simulation.
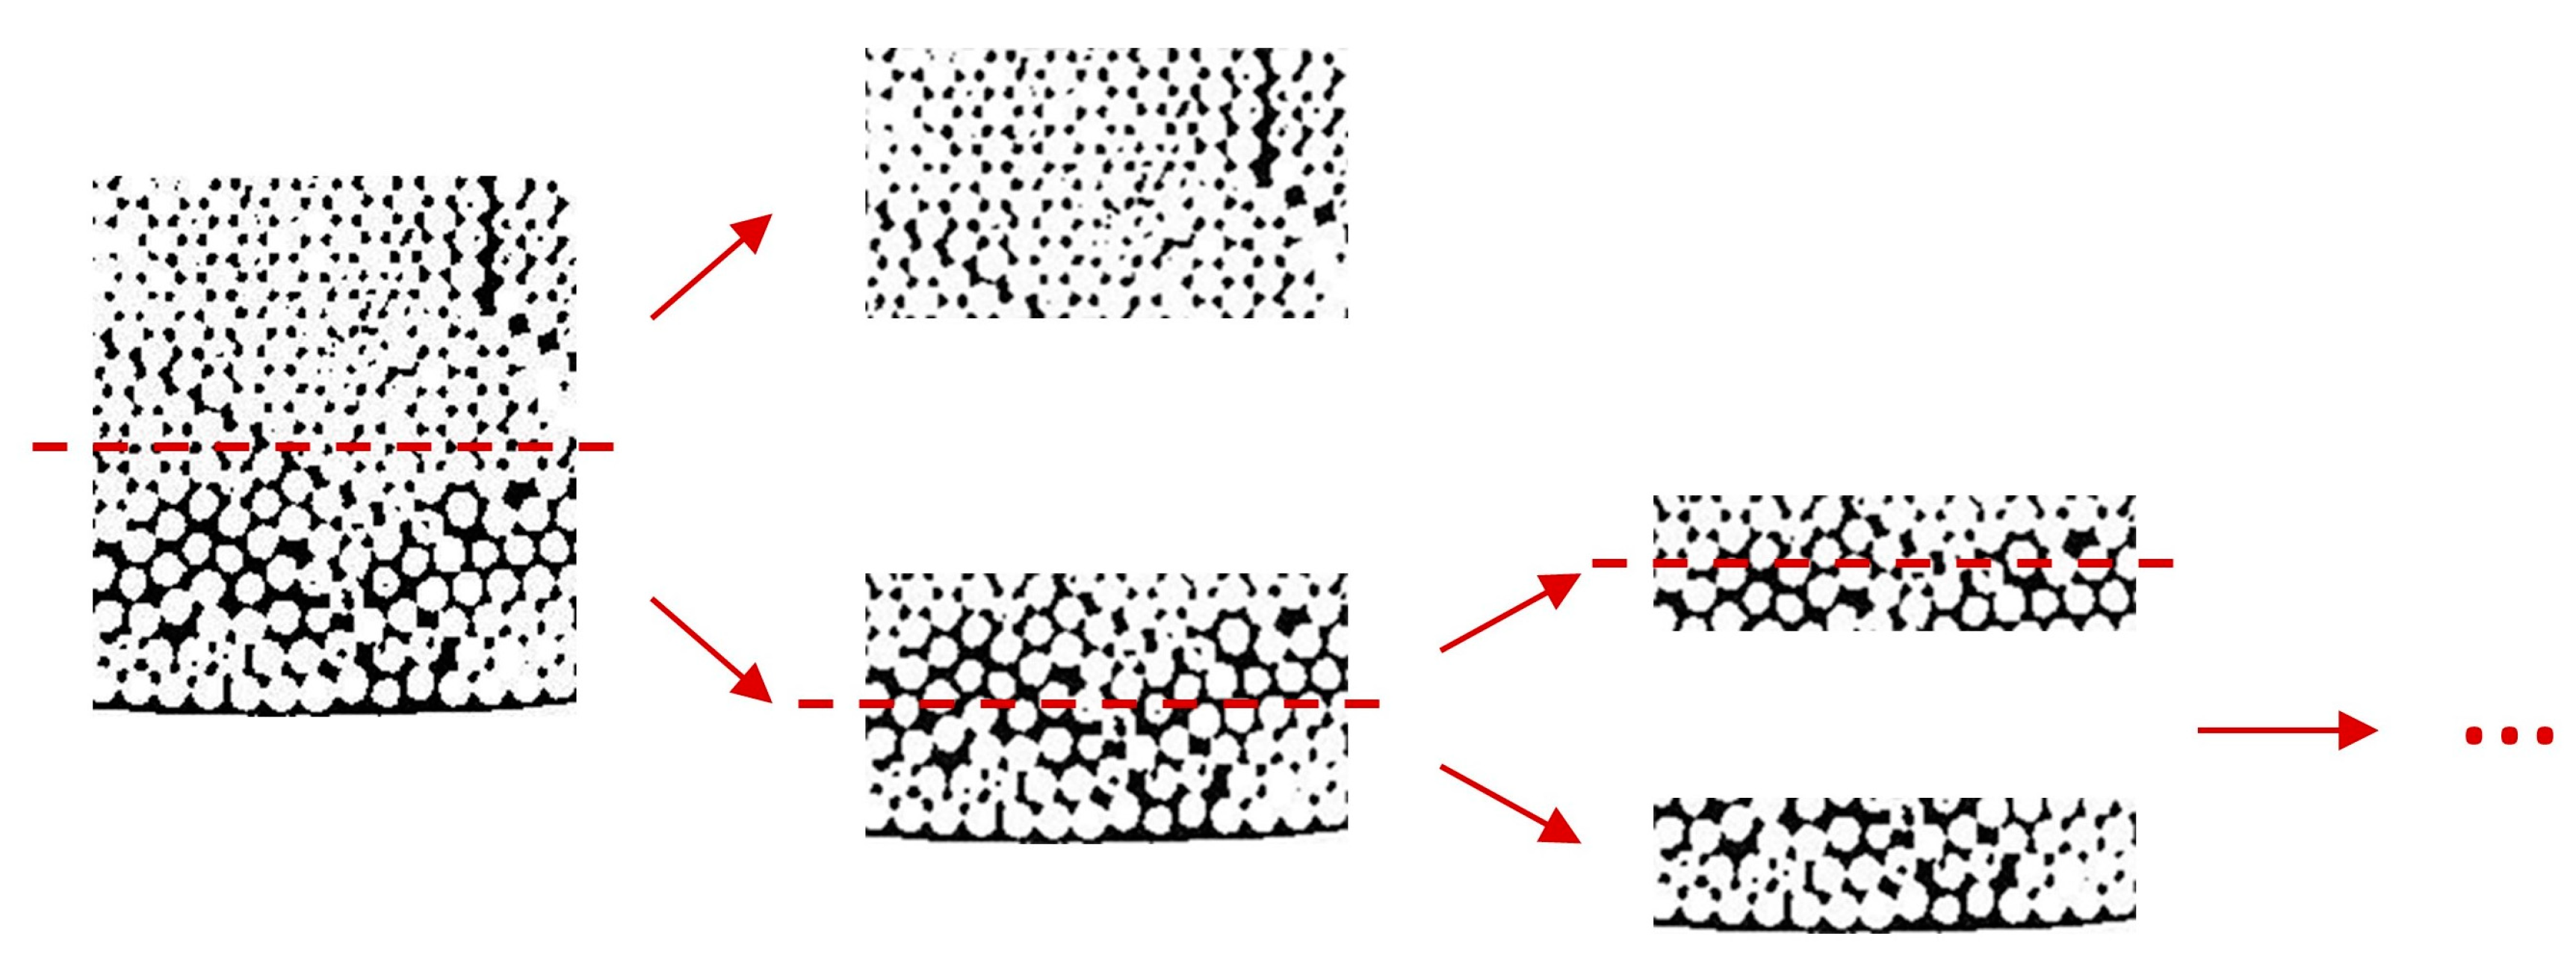
As shown in Figure 6, Part e was divided into two regions based on porosity. Following partitioning, the thickness of the high porosity region was found to be 97 pixels, while the radius of the cross-section was 1120 pixels. The high porosity region had a thickness proportion of 8.66% with a porosity of 32.11%. The remaining portion had a porosity of 18.16%. Through the above processing, the porosity of the FPM model was obtained. As shown in Figure 7, the model was mainly divided into two parts, the inner part with a porosity of 18.16%, and the outer part with a porosity of 32.11%.

2.2. Establishment of Fracture Network

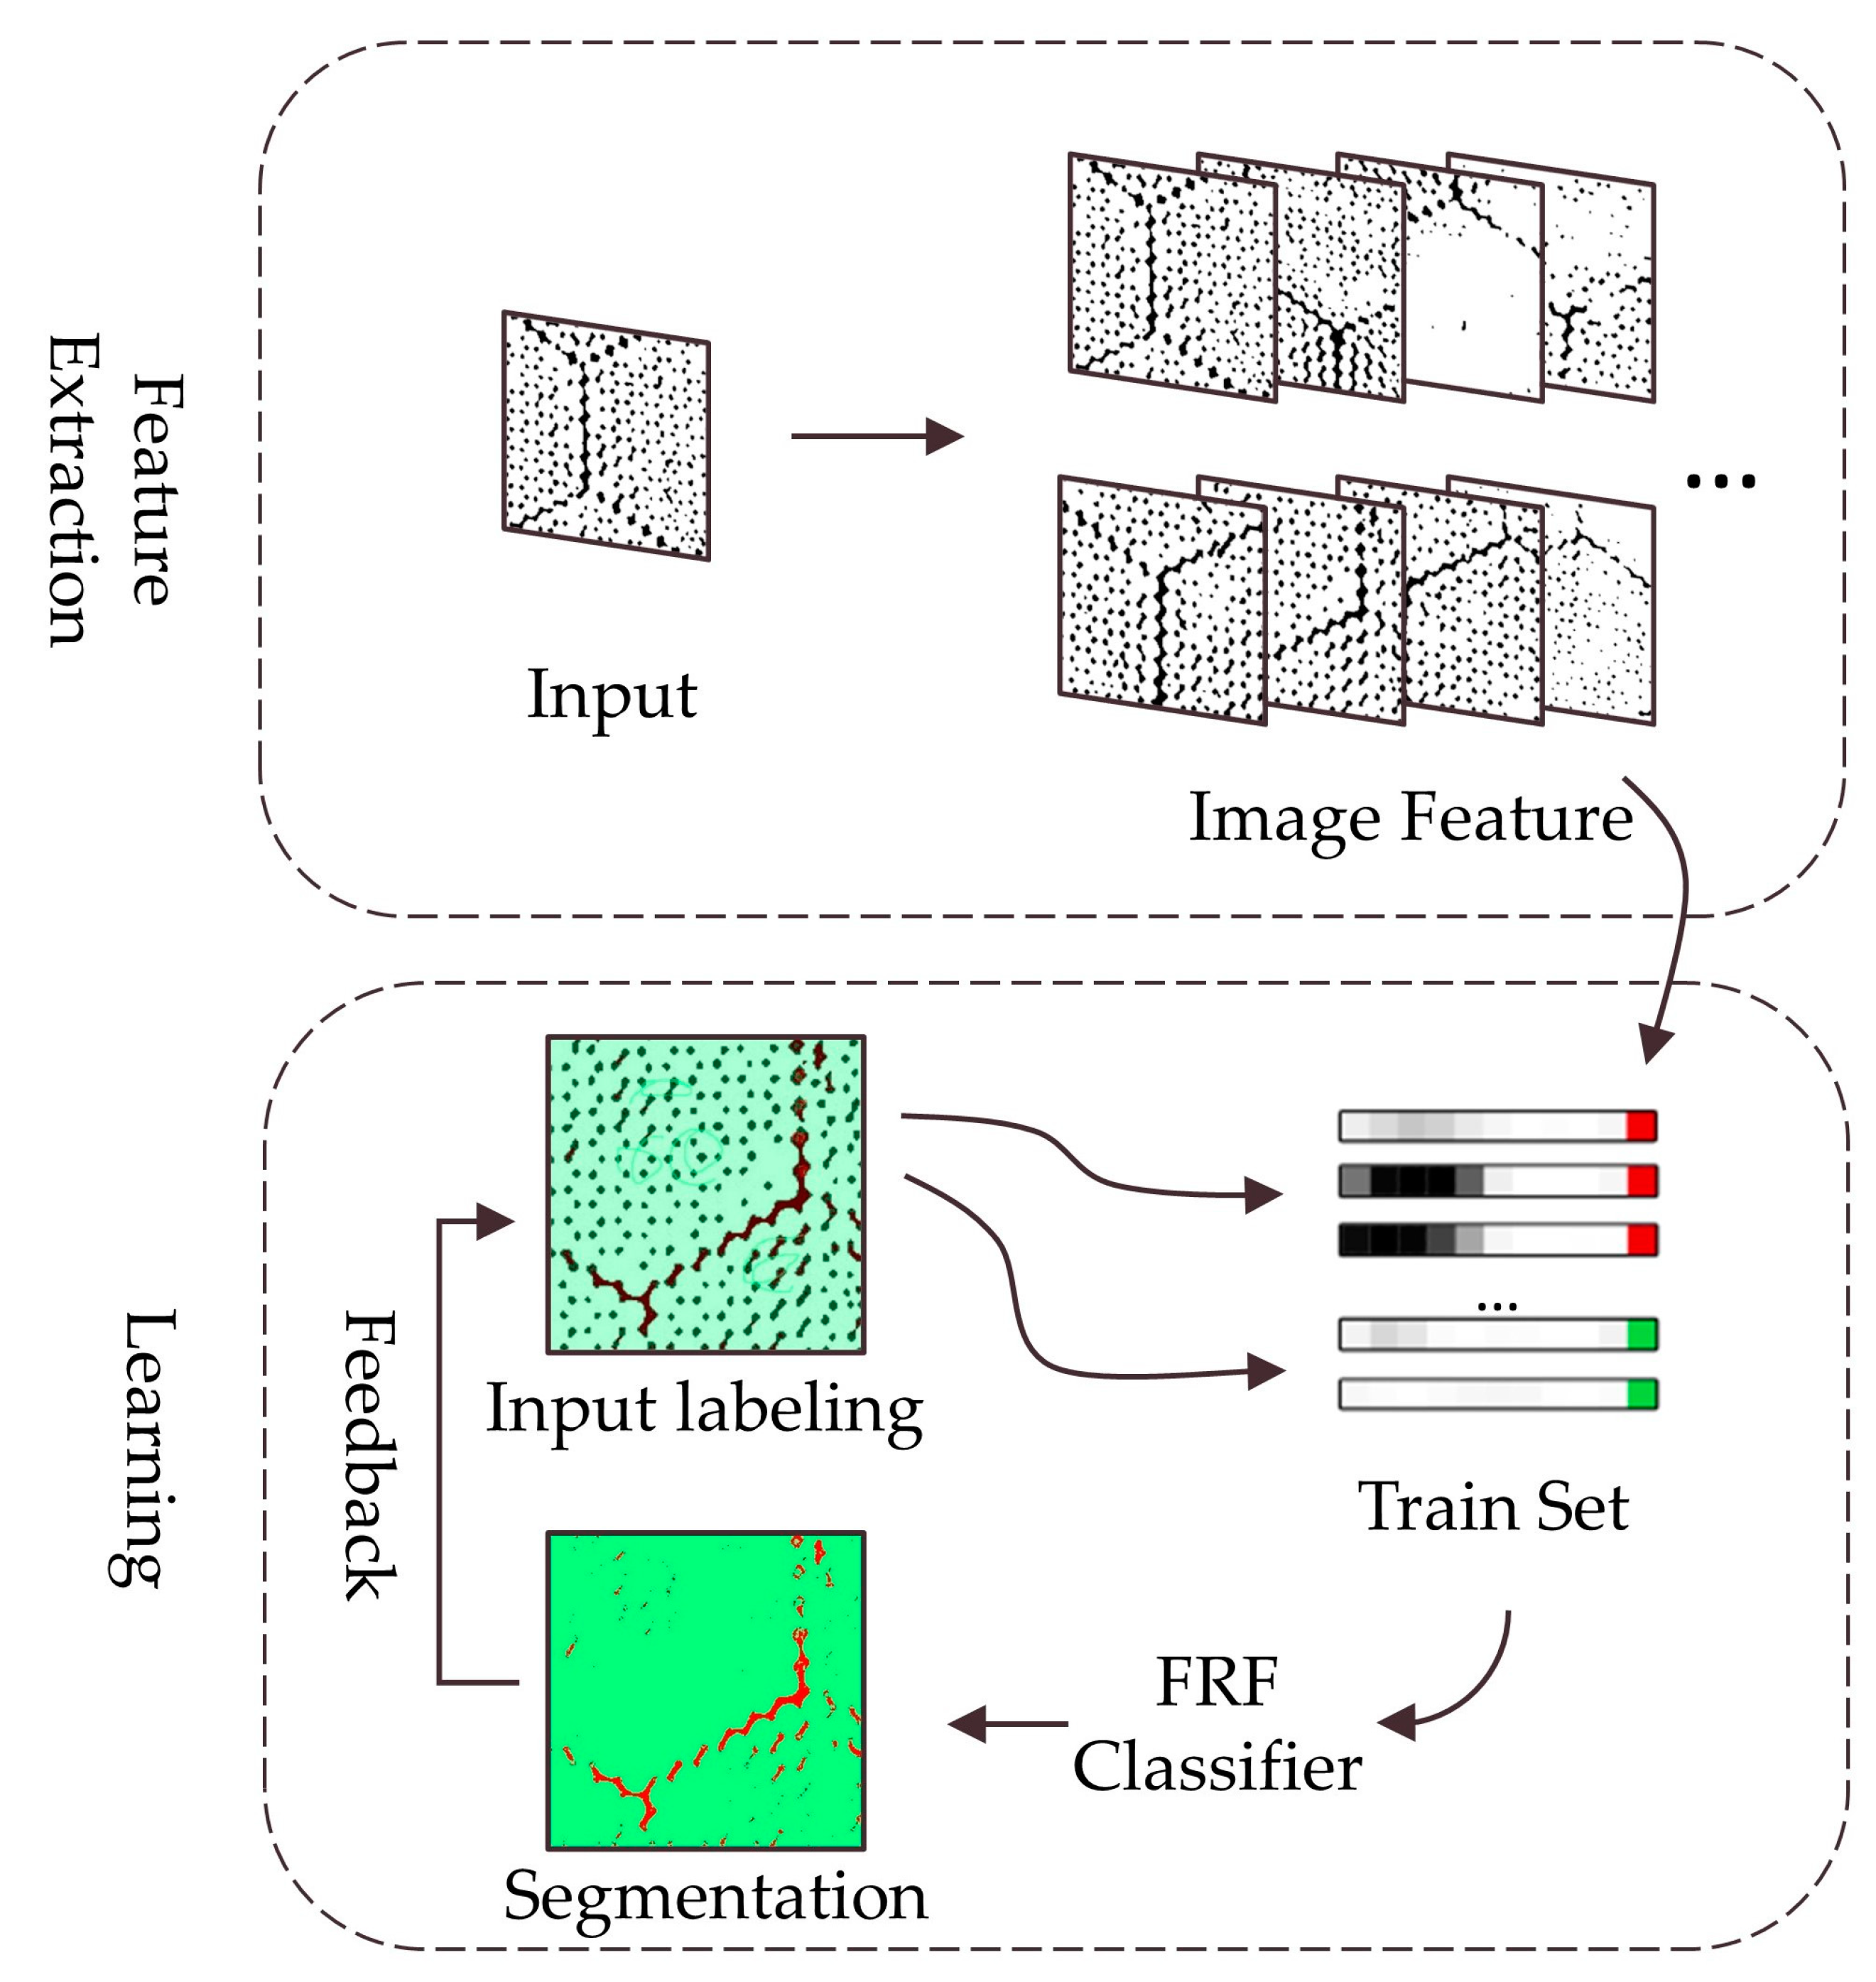
Besides the extraction of porosity, another crucial part of the FPM model is the establishment of the fracture network. Employing machine learning techniques [19] could enhance the efficiency of this creation process. In this study, Fast Random Forest (FRF) was used to identify fractures, an improved algorithm of Random Forest [20], which has the advantages of a fast running speed and no overfitting. FRF classified each pixel and assigned it to a corresponding segment or class. After labeling the image with specified features, it became a training set for the classifier, which could then recognize and segment other image inputs. The training and recognition process is depicted in Figure 8.
Several assumptions were made to simplify the establishment of the fracture network:
  • For the convenience of the statistics, the internal fractures of the hexagonal strands were not considered;
  • The outer layer of the main cable cross-section had a larger porosity. The establishment of the fracture network did not involve this part;
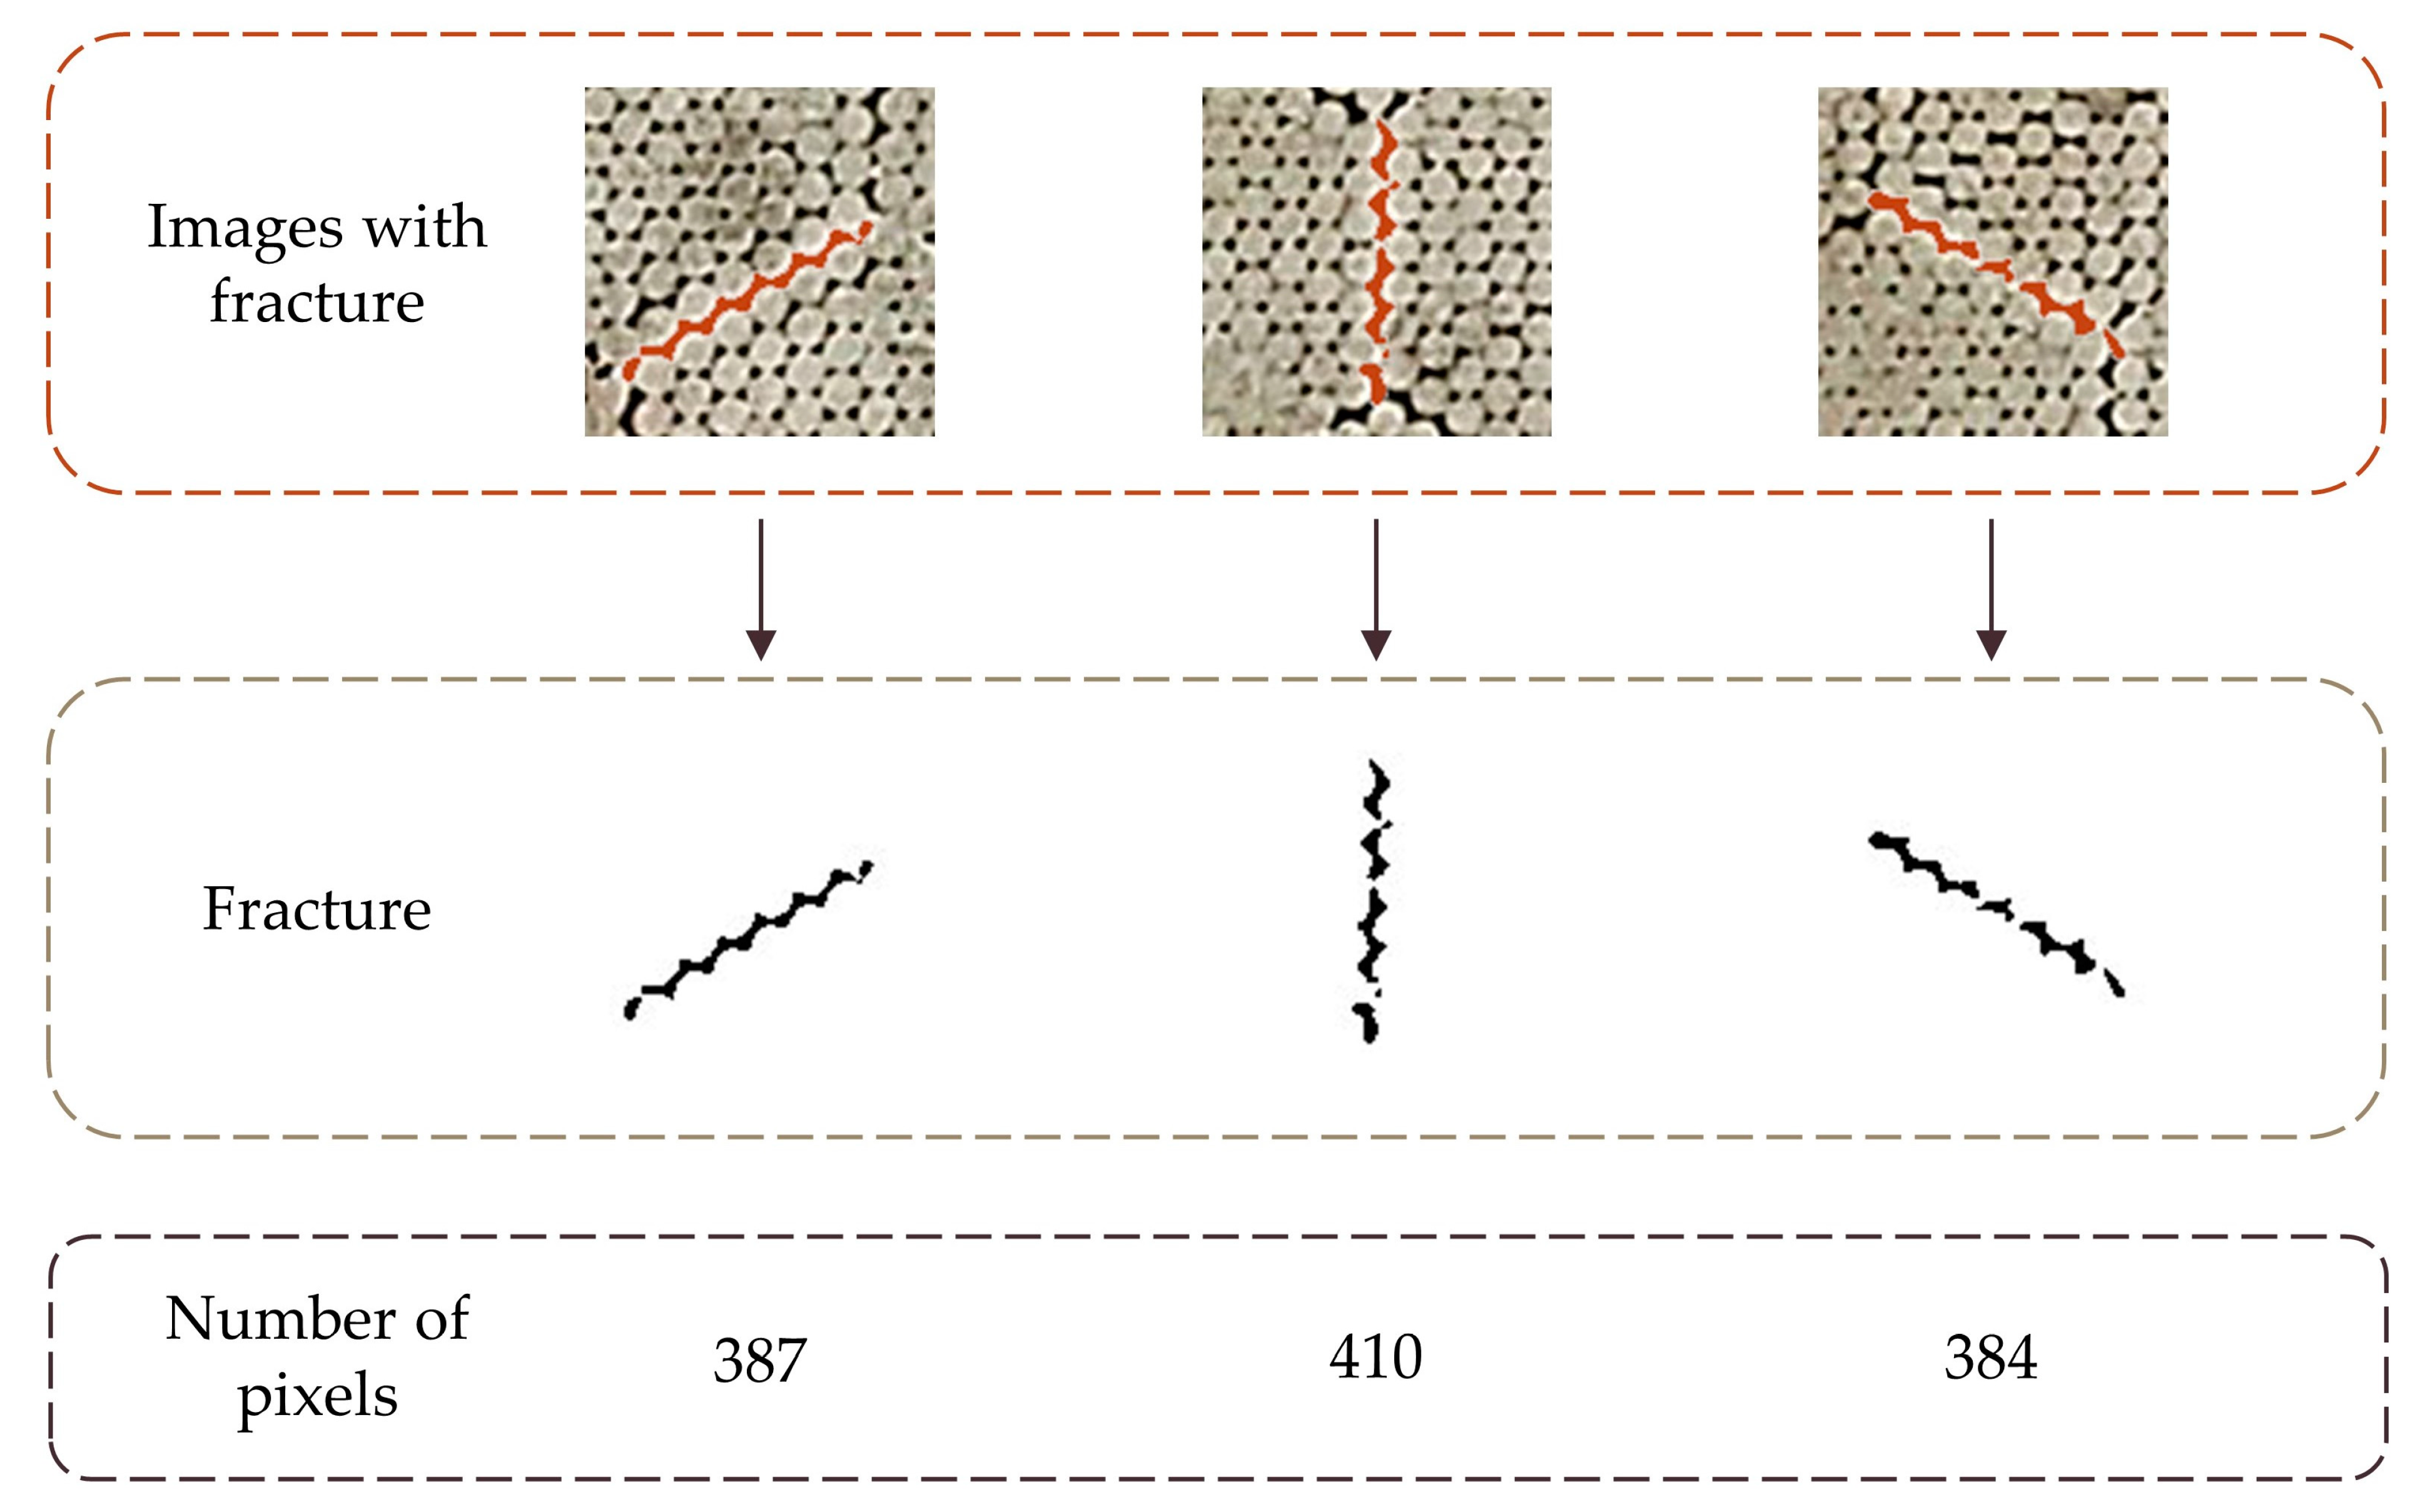
  • The fractures had different lengths. Therefore, when counting the number of fractures, it was necessary to integrate the fractures. This study took a typical fracture as a standard fracture, counted the number of pixels of the standard fracture, and then calculated the number of fractures;
  • This study used 1/4 of the main cable cross-section for analysis, found the probability of fracture, and extended the results to the entire main cable.
As illustrated in Figure 9, based on the assumptions, three fractures were selected as fracture samples to calculate the pixel number of a standard fracture. The number of pixels for the three fractures was 387, 410, and 384, so the number of pixels for a standard fracture was 393.7.
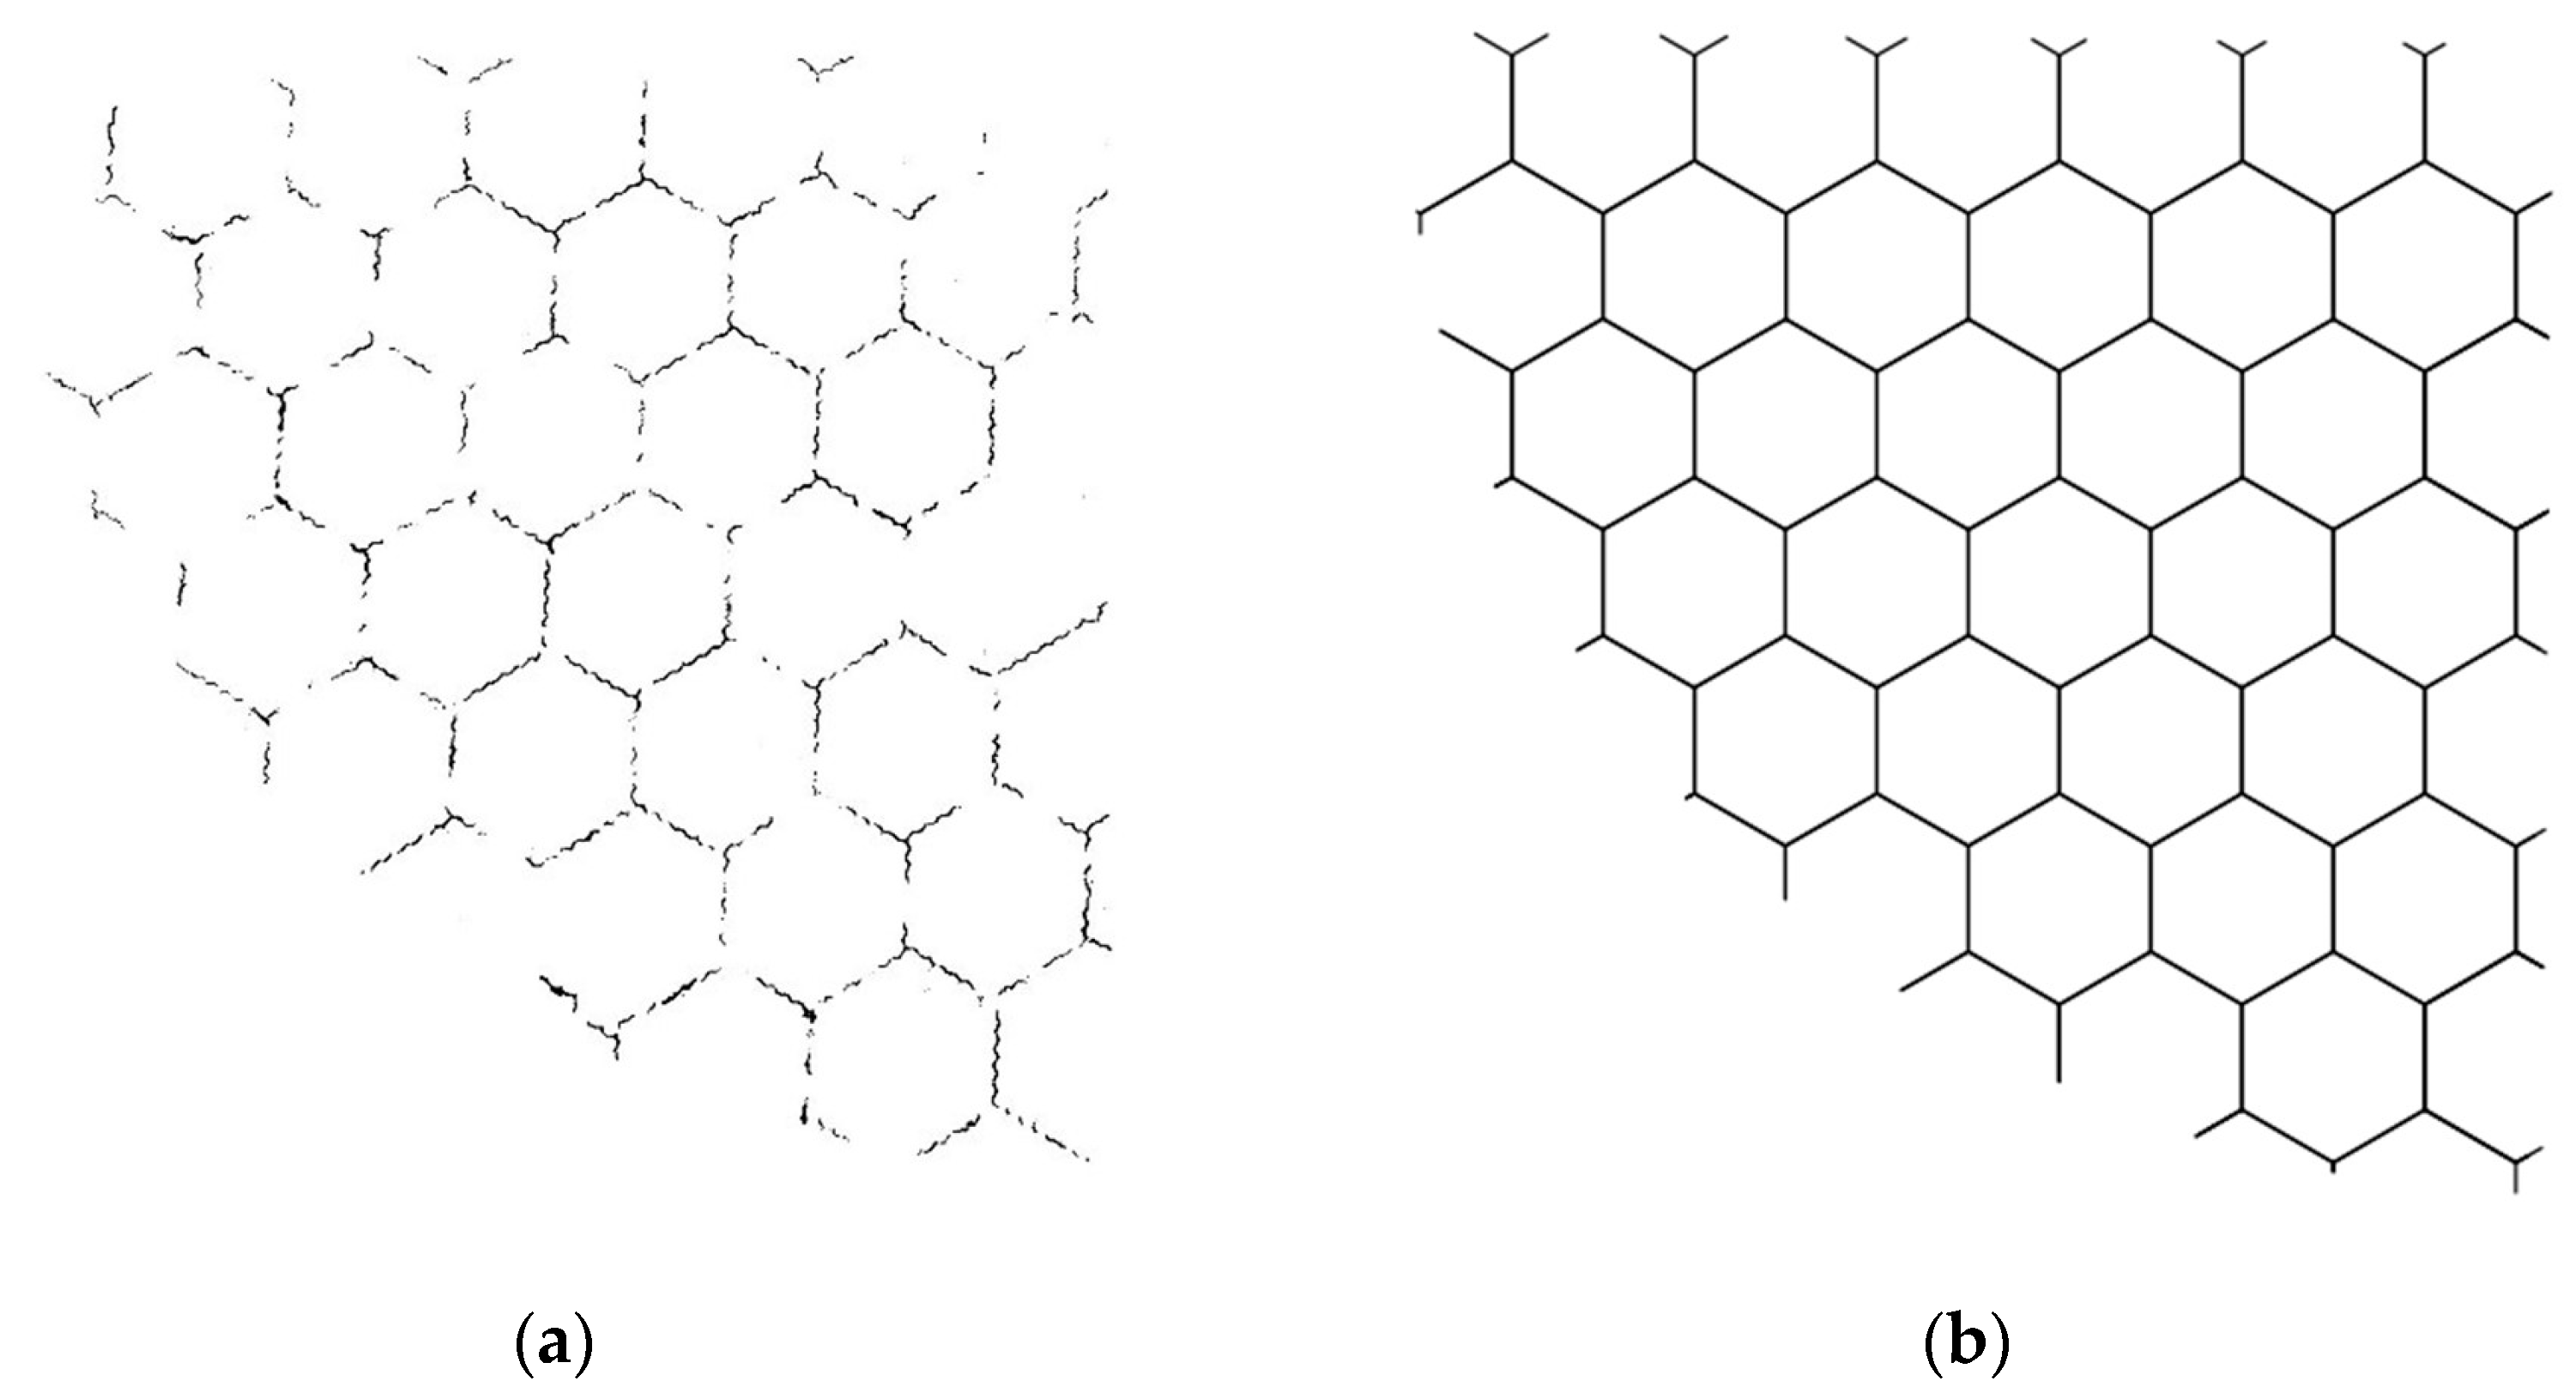
The results of identifying fractures in 1/4 of the main cable cross-section using FRF are presented in Figure 10a. The number of pixels representing fractures in this range was 13,339, and the number of fractures was calculated to be 33.9 by the following formula:
N f r a c t u r e = n i d e n t i f y n s t a n d a r d
where the N f r a c t u r e is the number of fractures in 1/4 of the main cable cross-section; n i d e n t i f y is the number of pixels identified as fractures in 1/4 of the main cable cross-section; n s t a n d a r d is the number of pixels of a standard fracture.
Assuming that when fractures exist between all hexagonal strands in 1/4 of the main cable cross-section, as shown in Figure 10b, the total number of fractures would be 107.91. The probability of fracture occurrence was found to be 31.37%. Extrapolating to the entire fracture network, the number of fractures was 155.8. For the convenience of modeling, the number of fractures was rounded to 156.
After obtaining the number of fractures, the fracture network could be established. The process is shown in Figure 11. The diameter of the main cable in this study was 855 mm, and the diameter of the wires was 5.25 mm. Each hexagonal strand comprised 127 wires, and based on the arrangement rule of the wires, the side length of the smallest circumscribed hexagon of the strand could be calculated as 34.53 mm. The fractures were drawn by calculating the position of the hexagon center, adhering to the rule that fractures exist between hexagonal strands. Finally, the fractures were randomly deleted, leaving only 156 as the final fracture network.
After obtaining the porosity and fracture network, the numerical simulation model can be constructed. Since the longitudinal variation in the main cable is small and can be ignored, the model can be obtained by stretching, as shown in Figure 12.

3. Numerical Method

3.1. Judgment of Flow Regime

Understanding the flow regime inside the main cable was crucial in selecting the appropriate physical laws for numerical simulation. The energy loss laws vary under different flow regimes. Typically, the determination of the flow regime depends on the Reynolds number ( R e ), which can be calculated using the following formula:
R e = v d ν
where R e is the Reynolds number; v is the seepage velocity; d is the characteristic diameter of the porous medium; ν is the kinematic viscosity.
Fluid flow in porous media was influenced by both the porosity and solid skeleton, resulting in complex flow conditions. In porous media, the flow regimes could be divided into four categories based on the R e . For R e values less than 1, the flow resistance was primarily dominated by viscous forces. As R e increased within the range of 1 to 10, boundary layers emerged near solid surfaces. As the R e further increased, the effect of the boundary layers on the overall flow also became more significant. When R e surpassed 150, the flow became unsteady. When the R e exceeded 300, the flow could be regarded as turbulent.
As the study of flow regime inside porous media deepens, Macdonald et al. [21] introduced a revised formula for R e :
R e * = v d ν ε 1 ε
where R e * is the modified Reynolds number; ε is the porosity of the porous medium.
In this study, the flow regime inside the main cable under different flow rates was determined using the formula proposed by Macdonald, with the porosity of the main cable being 19.38%. The results are presented in Table 1, showing that the Reynolds number did not exceed 6 when the flow rate was within 0–100 m3/h. Although boundary layers were present, their impact on the overall flow was insignificant, and the flow regime could be considered laminar. Thus, subsequent analysis of the airflow within the main cable was conducted based on the laminar.

3.2. Governing Equations

3.2.1. Porous Media Model

In 1856, Darcy, a French scientist [22], conducted experiments on water passing through saturated sand and summarized Darcy’s law. When water flows through soil or sand, it loses some energy because of infiltration. Darcy’s law defines the corresponding relationship between energy loss and flow velocity. According to Darcy’s law, the velocity field is determined by the pressure gradient, fluid viscosity, and the structure of the porous medium.
u = κ μ p
where u is the velocity vector; κ is the permeability of porous media; μ is the dynamic viscosity of the fluid; p is pressure.

3.2.2. Fracture Flow Equations

In fracture flow, the two sides of the fracture are typically assumed to be parallel. The flow regime in such fractures is laminar. The cubic law is used to describe the fracture flow model, where the flow velocity is proportional to the cube of the fracture width after calculating the average flow velocity of the fluid in the fracture and obtaining the fracture width. This law assumes that the fluid is viscous and incompressible, and its permeability is proportional to the square of the fracture width.
κ s = ρ g d F 2 12 μ f
T s = d F κ s
where κ s is the permeability; ρ is the fluid density; g is the acceleration of gravity; d F is the width of the fracture; μ is the fluid dynamic viscosity; f is the roughness coefficient; T s is the coefficient of transmissivity.
After obtaining the cubic law, the governing equation for fracture flow can be obtained:
Q F = d F 3 12 μ f ( T p + ρ g T D )
d F t ε ρ + T · ( ρ Q F ) = d F · S
where Q F is the volumetric flow rate per unit length of fracture; T is the gradient operator; D are the coordinates; S is the mass source.

3.3. Calculation of Permeability

3.3.1. Permeability Based on Kozeny–Carman Equation

The Kozeny–Carman equation [23] (KC equation) is a well-known semi-empirical formula. It is widely used to calculate the permeability of porous media in fields such as seepage, oil and gas extraction, chemical engineering, and bioelectrochemistry.
κ = d p 2 180 ( 1 ε ) 2 ε 3
where κ is the permeability of porous media; d p is the particle size; ε is the porosity of porous media.

3.3.2. Permeability Based on Numerical Simulation

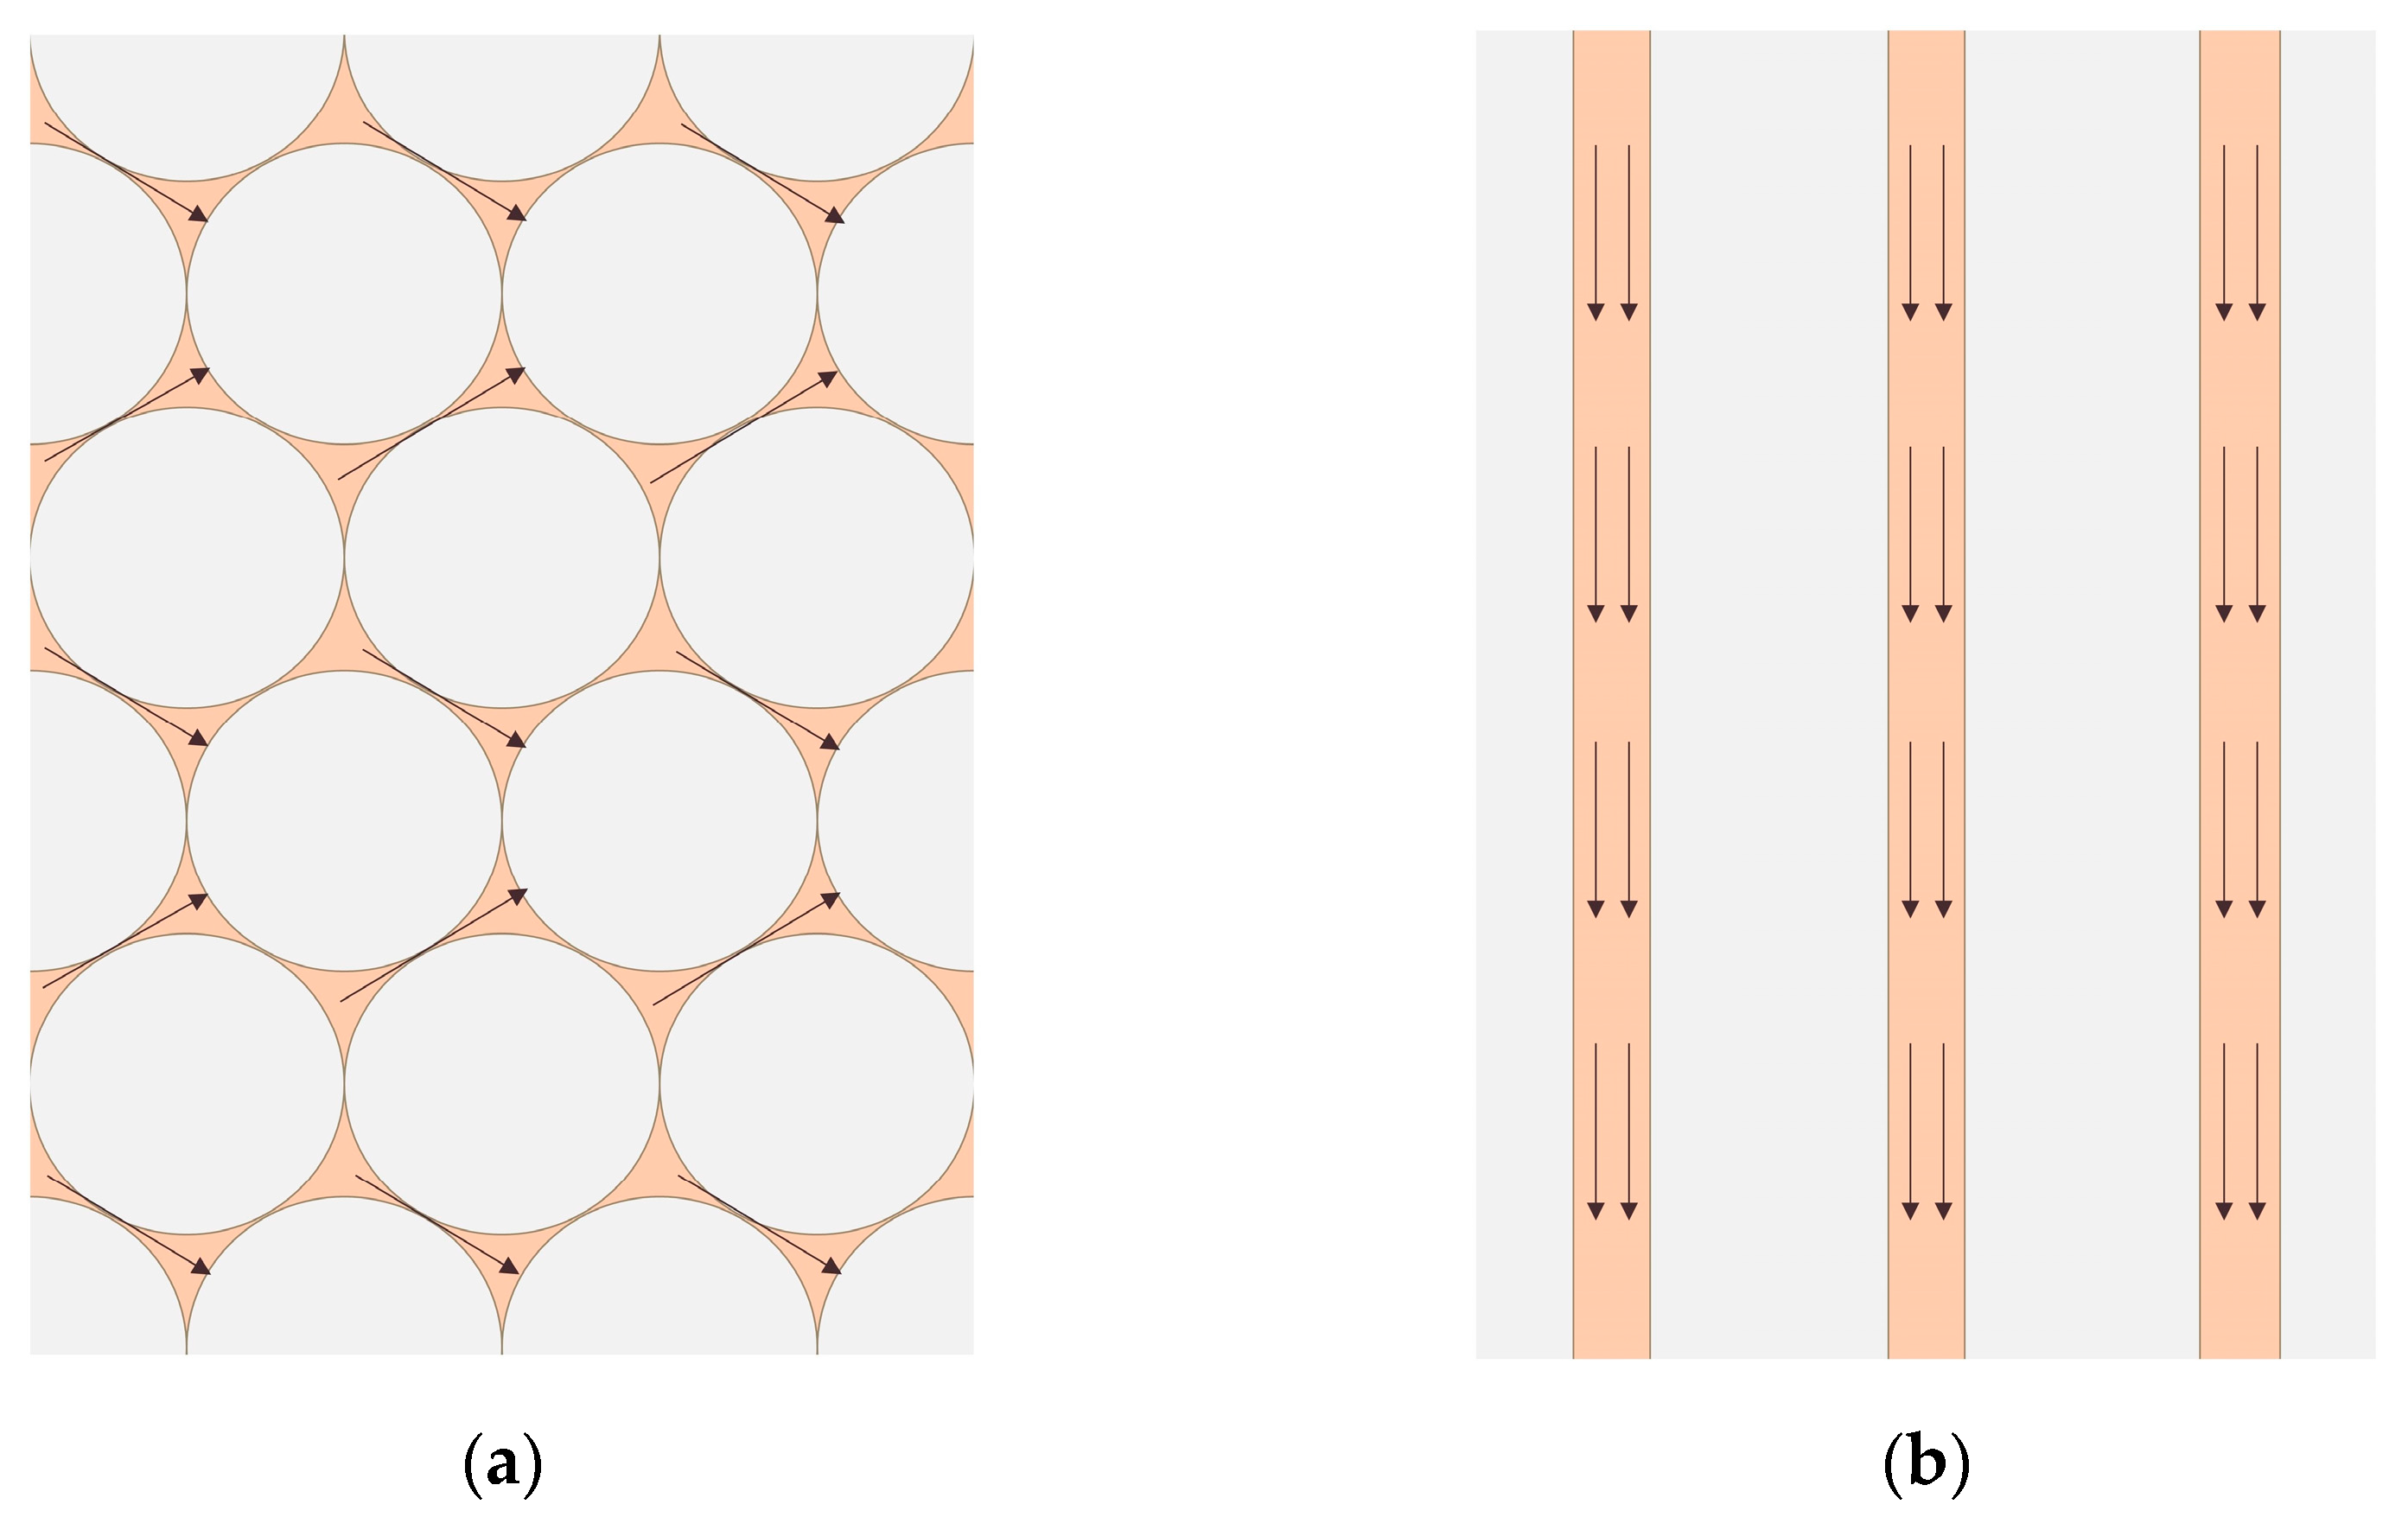
The fluid flow inside the main cable is shown in Figure 13. When the air flowed radially through the irregular holes, it experienced significant resistance, while the resistance was low when the air flowed longitudinally through the narrow regions; therefore, the permeability of the main cable could be different depending on the direction of the air flow.
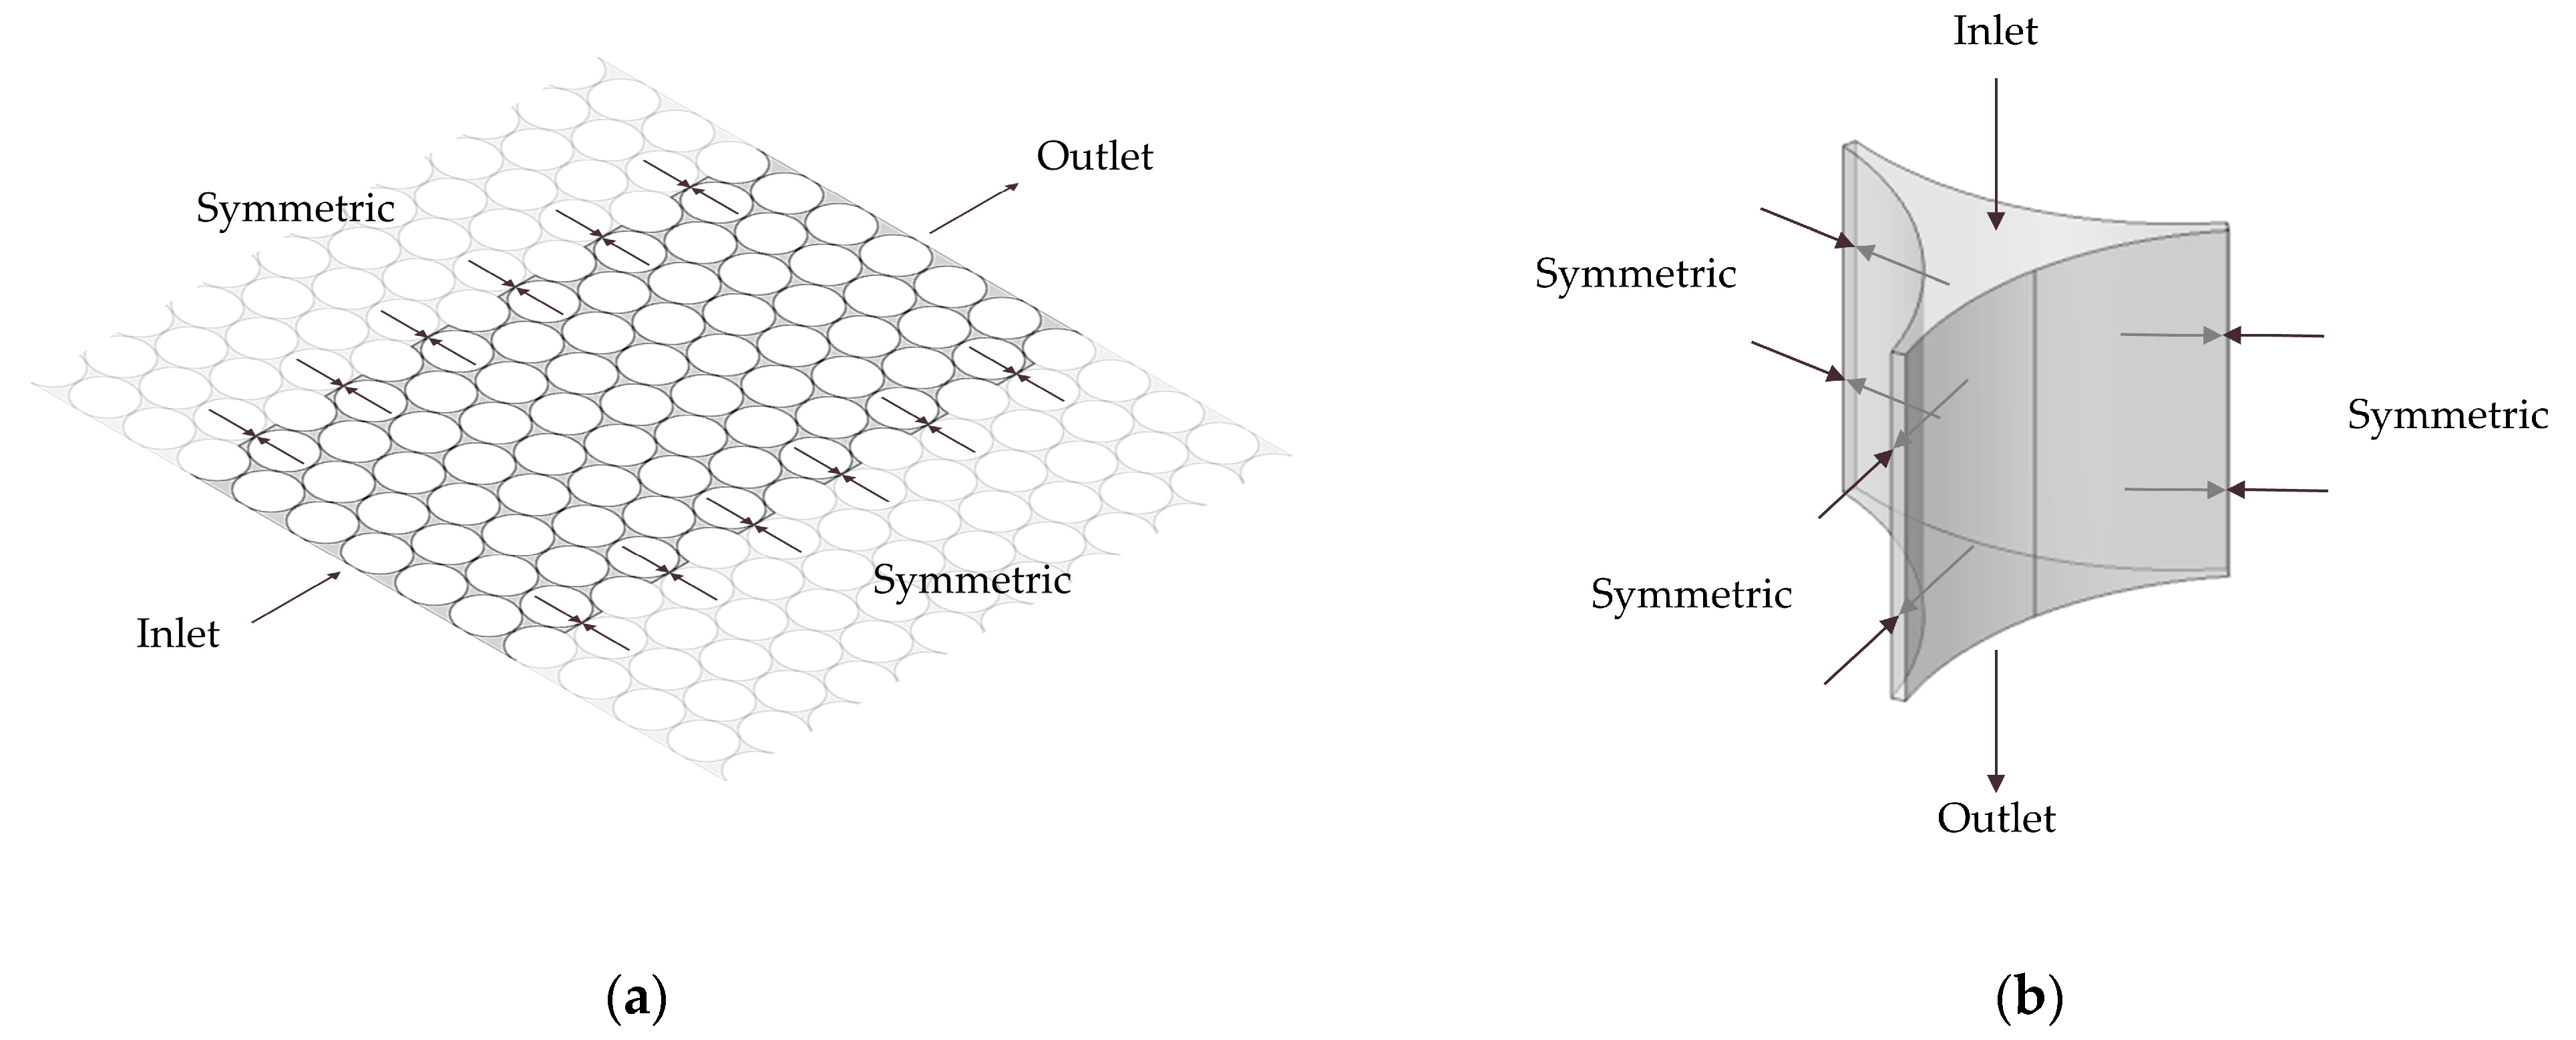
Due to the lack of research on the multidirectional permeability of the main cable and the complexity of measuring the permeability through field experiments, numerical simulation was employed to obtain the permeability in different directions. Figure 14 shows the model used to calculate the radial and longitudinal permeability of the main cable. The radial model, as shown in Figure 14a, represents the arrangement of the wires inside the main cable in the radial. The longitudinal model, conversely, adopted a unit length of the longitudinal pore as a unit pore, as represented in Figure 14b. The calculation formula for permeability is presented below:
κ = Q μ L Δ P A
where the κ is the permeability; Q is the flow rate of fluid through porous media per unit time; μ is the viscosity of the fluid; L is the length of fluid flowing through porous media; Δ P is the pressure difference before and after the liquid flows through the porous medium; A is the cross-sectional area of the porous medium.

3.3.3. Comparison and Optimization of Two Methods for Obtaining Permeability

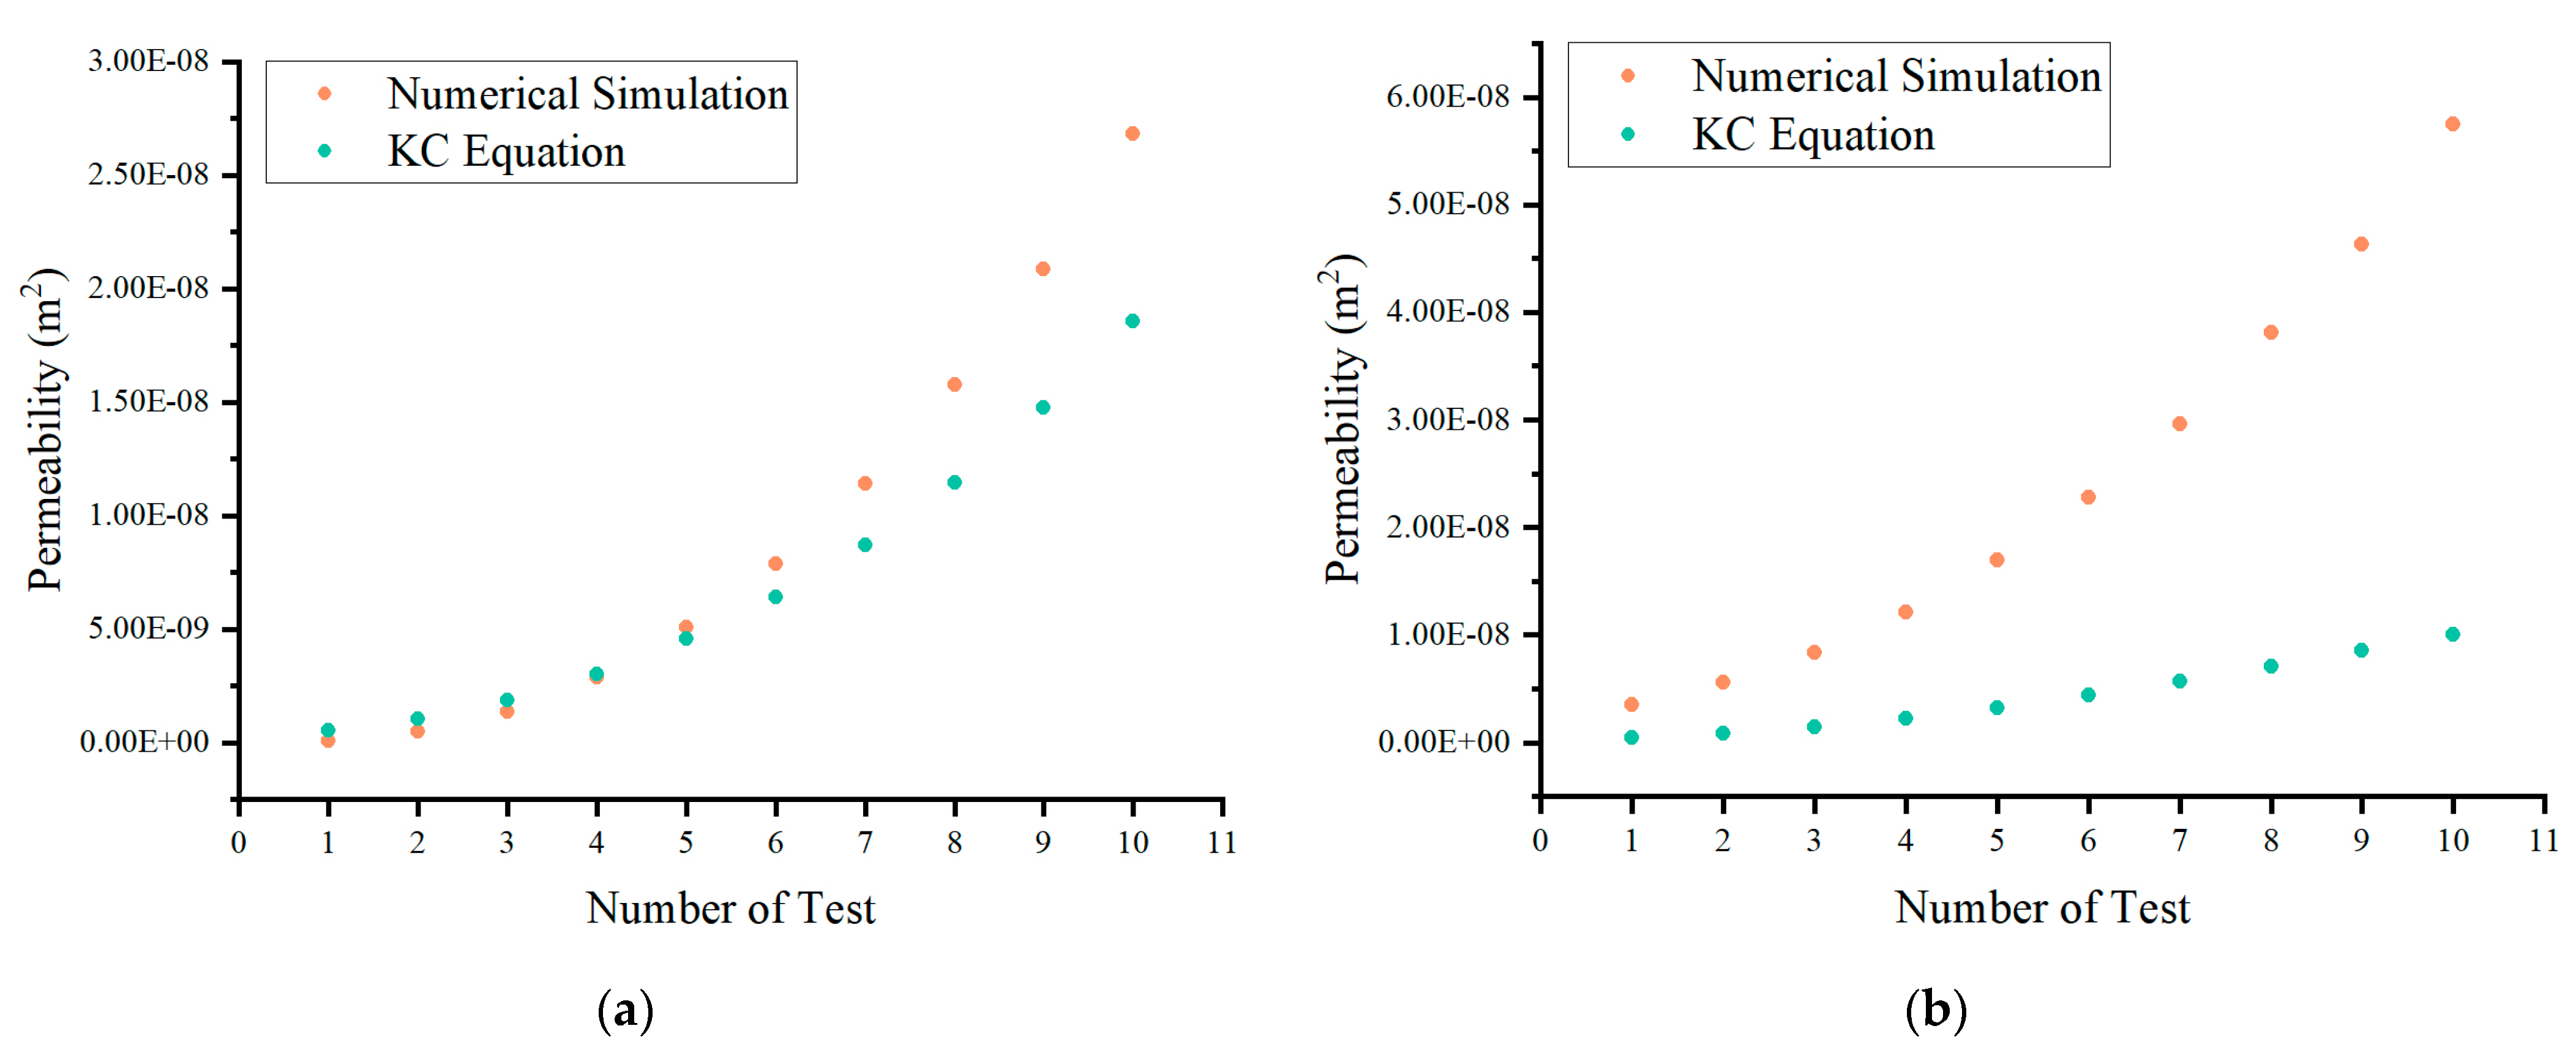
In the radial direction, a discrepancy was observed between the permeability values obtained from the KC equation and numerical simulation, as shown in Figure 15a. In the longitudinal direction, a significant difference was observed between the permeability values calculated by the KC equation and those obtained by numerical simulation, as shown in Figure 15b. The investigation revealed that permeability was incorrectly calculated by the KC equation, so the numerical simulation should be employed to obtain permeability.
To simplify the acquisition of permeability, this study performed a fitting of permeability with porosity. The results are presented in Figure 16, showing satisfactory fitting results for both radial and longitudinal directions, with R2 values of 0.99915 and 0.99971. The permeability demonstrated an exponential relationship with porosity. Radial and longitudinal permeability differed by about one order of magnitude under the same porosity.

3.4. Simulation Models and Boundary Conditions

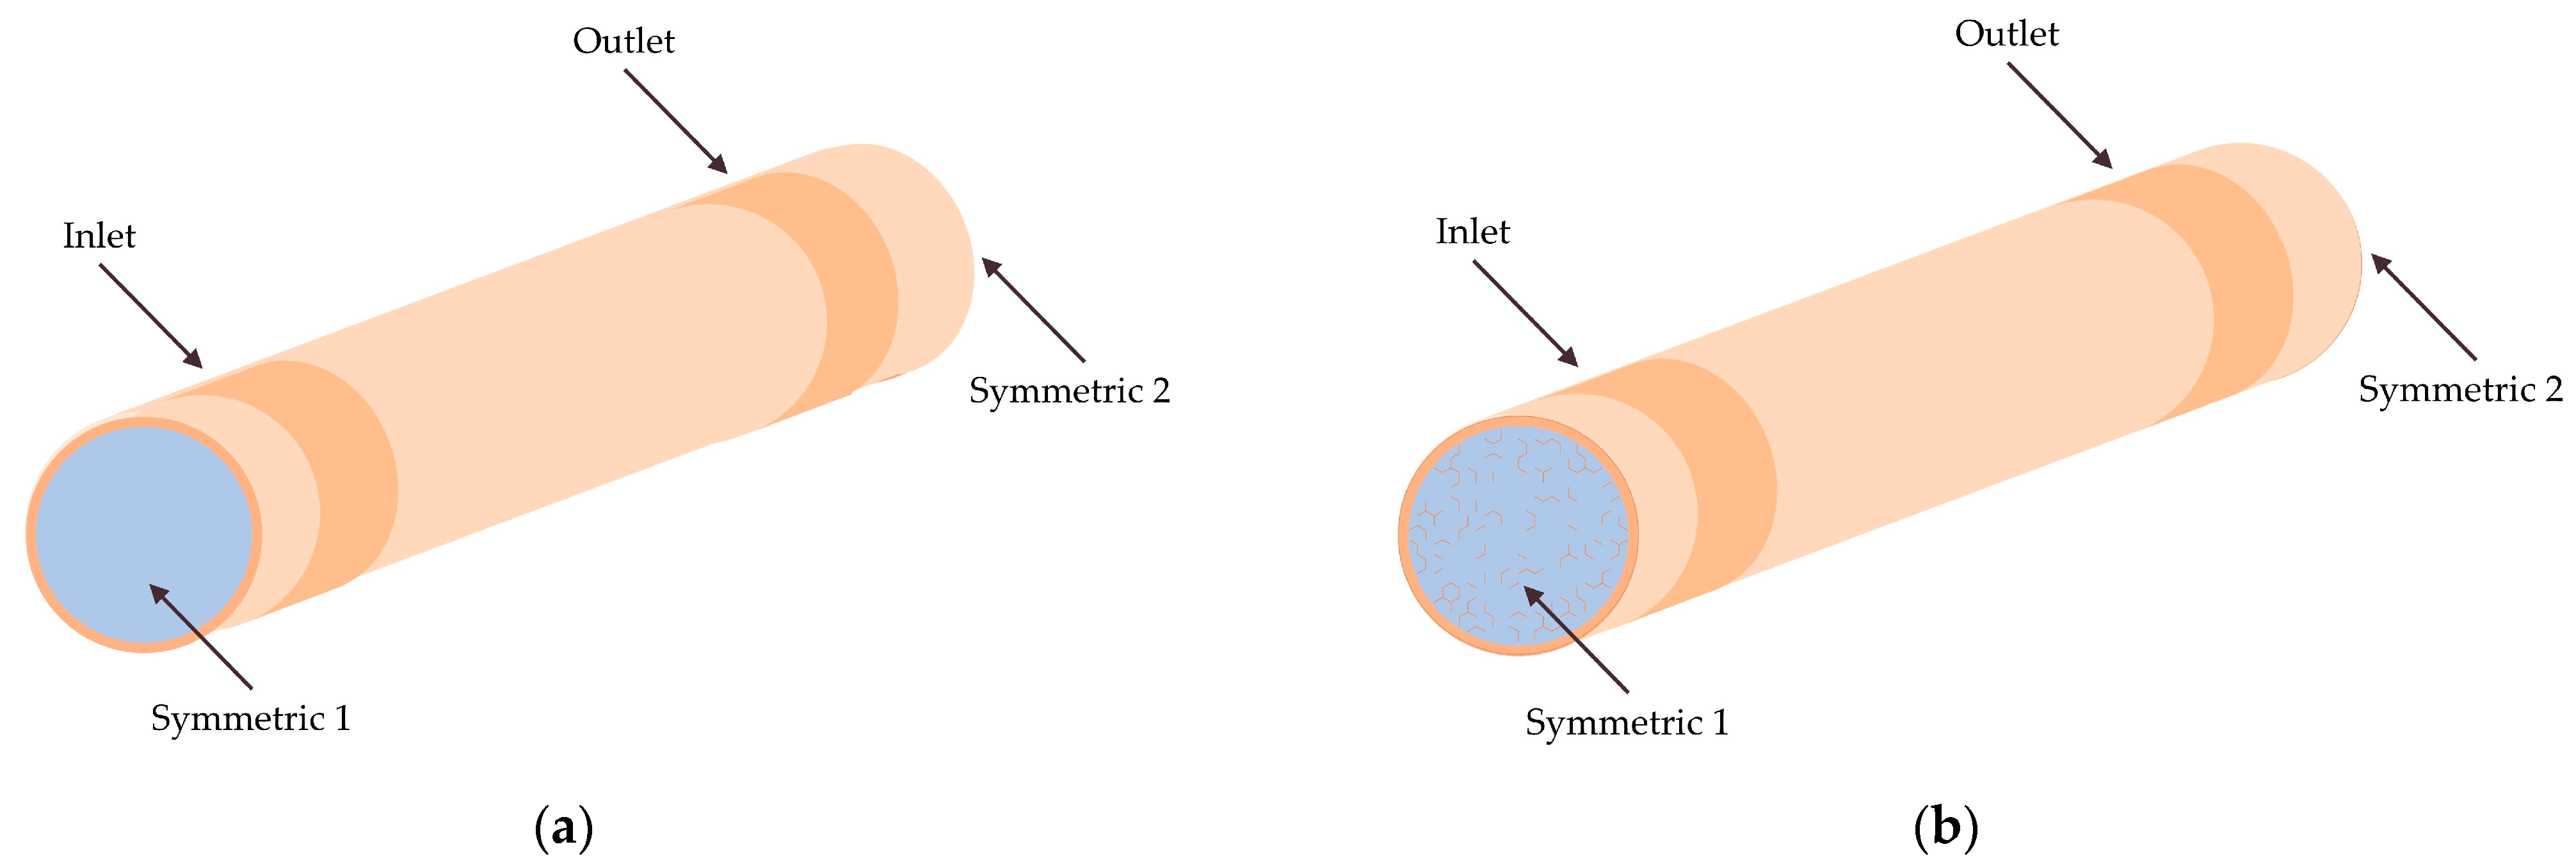
Previous studies have commonly made two key assumptions. Firstly, they hypothesized that the interior of the main cable was a porous medium without fractures. Secondly, they assumed that the porosity and permeability along the main cable would not change. To compare the differences in the internal flow field between the commonly used PM model and the FPM model developed in this study, two numerical simulation models were created, as shown in Figure 17.
Both models have the same length and boundary conditions, which were established based on the actual air supply scenario of a suspension bridge main cable. The inlet and outlet were annular with a width of 1 m, the two ends of the models were set as Symmetrical Boundary 1 and Symmetrical Boundary 2. The specific data of the simulation model are listed in Table 2. By comparing the discrepancies between the two models, significant conclusions were drawn.

4. Results and Discussion

4.1. Model Verification

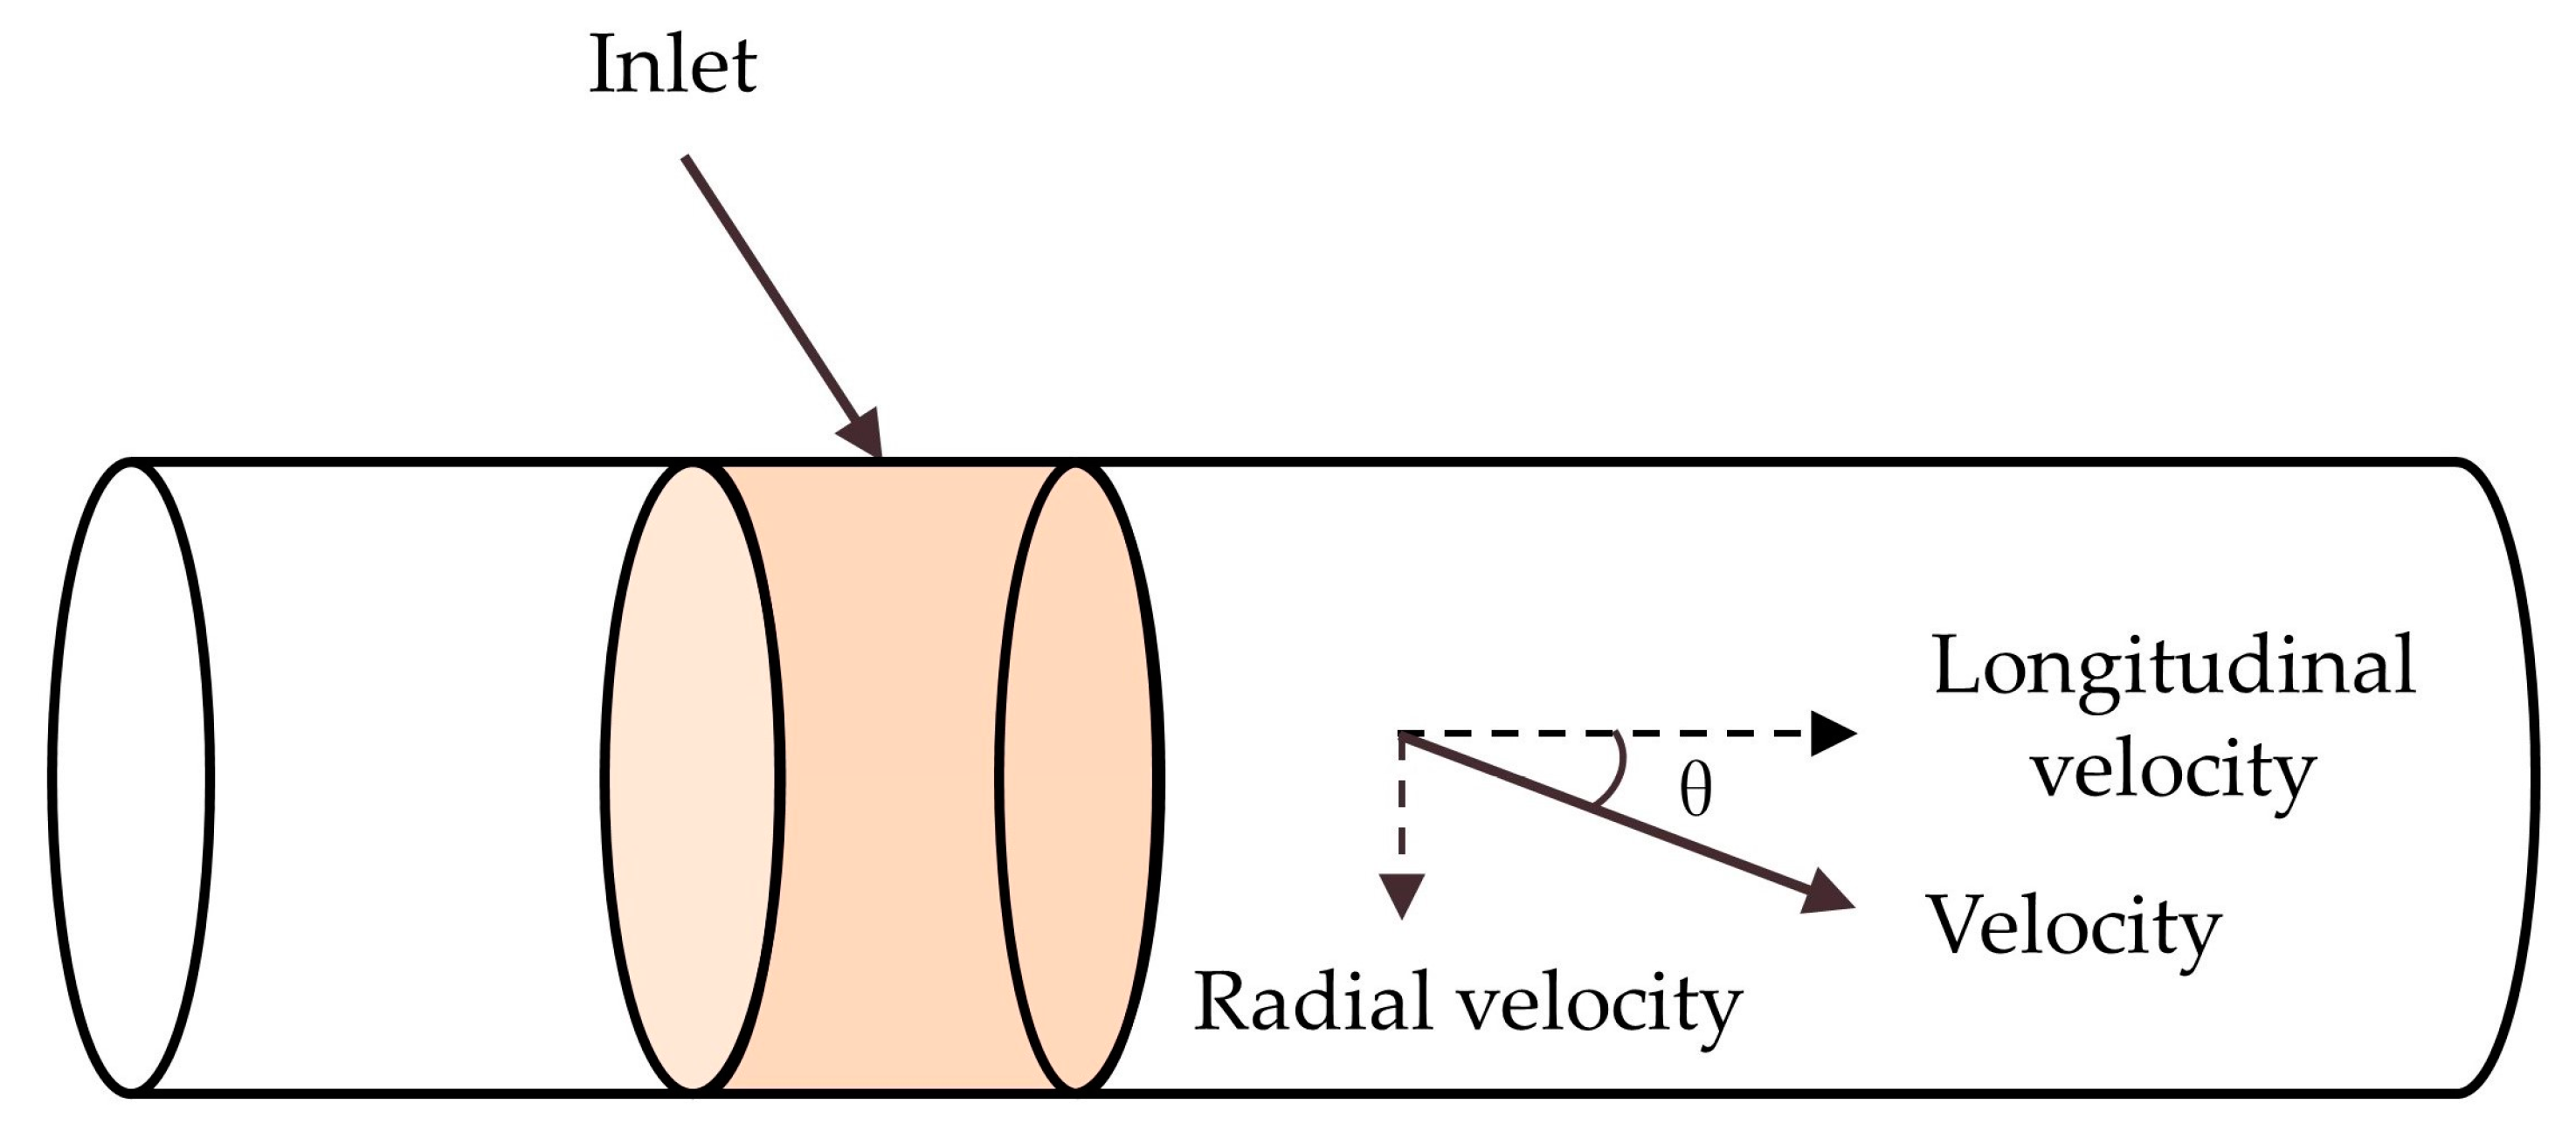
The pressure distribution of the main cable cross-section could not be measured in field experiments. Hence, obtaining the resistance loss along the main cable and calculating the specific frictional head loss were often used to judge the reliability of numerical simulations. This study considered the pressure drop near the inlet and outlet of the main cable as the local resistance loss, while the pressure drop along the main cable was considered as the resistance loss along the main cable. As depicted in Figure 18, since the inlet and outlet of the model were circular, the air velocity flowing into the main cable could be separated into radial and longitudinal velocities. The angle θ between the velocity and longitudinal velocity remained constant despite changes in the inlet pressure. When θ was less than 0.01°, the energy loss could be perceived as only relating to the distance along the main cable.
In this study, pressure and velocity components were obtained at 0.1 m intervals from the inlet to the outlet, and the angle between the velocity components was calculated (see Figure 19). The orange-shaded area in the figure represented the resistance loss along the main cable, while the inlet and the outlet affected the remaining area. Upon calculation, the local resistance losses at the inlet and outlet were determined to be 42.90 Pa and 42.91 Pa, respectively. The specific frictional head loss of the main cable could be calculated using the following formula:
R f = P T P I n P O u t L l I n l O u t
where R f is the specific frictional head loss; P T is the total pressure drop; P I n is the local resistance loss of the inlet; P O u t is the local resistance loss of the outlet; L is the length between the inlet and outlet of the main cable; l I n is the length affected by local resistance loss of the inlet; l O u t is the length affected by local resistance loss of the outlet.
After calculation, at an inlet pressure of 200 Pa (inlet flow rate of 33.13 m3/h), the specific frictional head loss of the main cable was found to be 19.56 Pa/m.
The reliability of numerical simulations was verified by conducting field experiments on the main cable of the Xihoumen Bridge. Table 3 presents the results of the experiments, which include the resistance loss and specific frictional head loss of the main cable.
The specific frictional head loss obtained from numerical simulation, converted under the same inlet conditions, was 37.75 Pa/m. The relative deviation between the field experiment and the numerical simulation was 6.83%, indicating that the numerical simulation was accurate.

4.2. Pressure Field

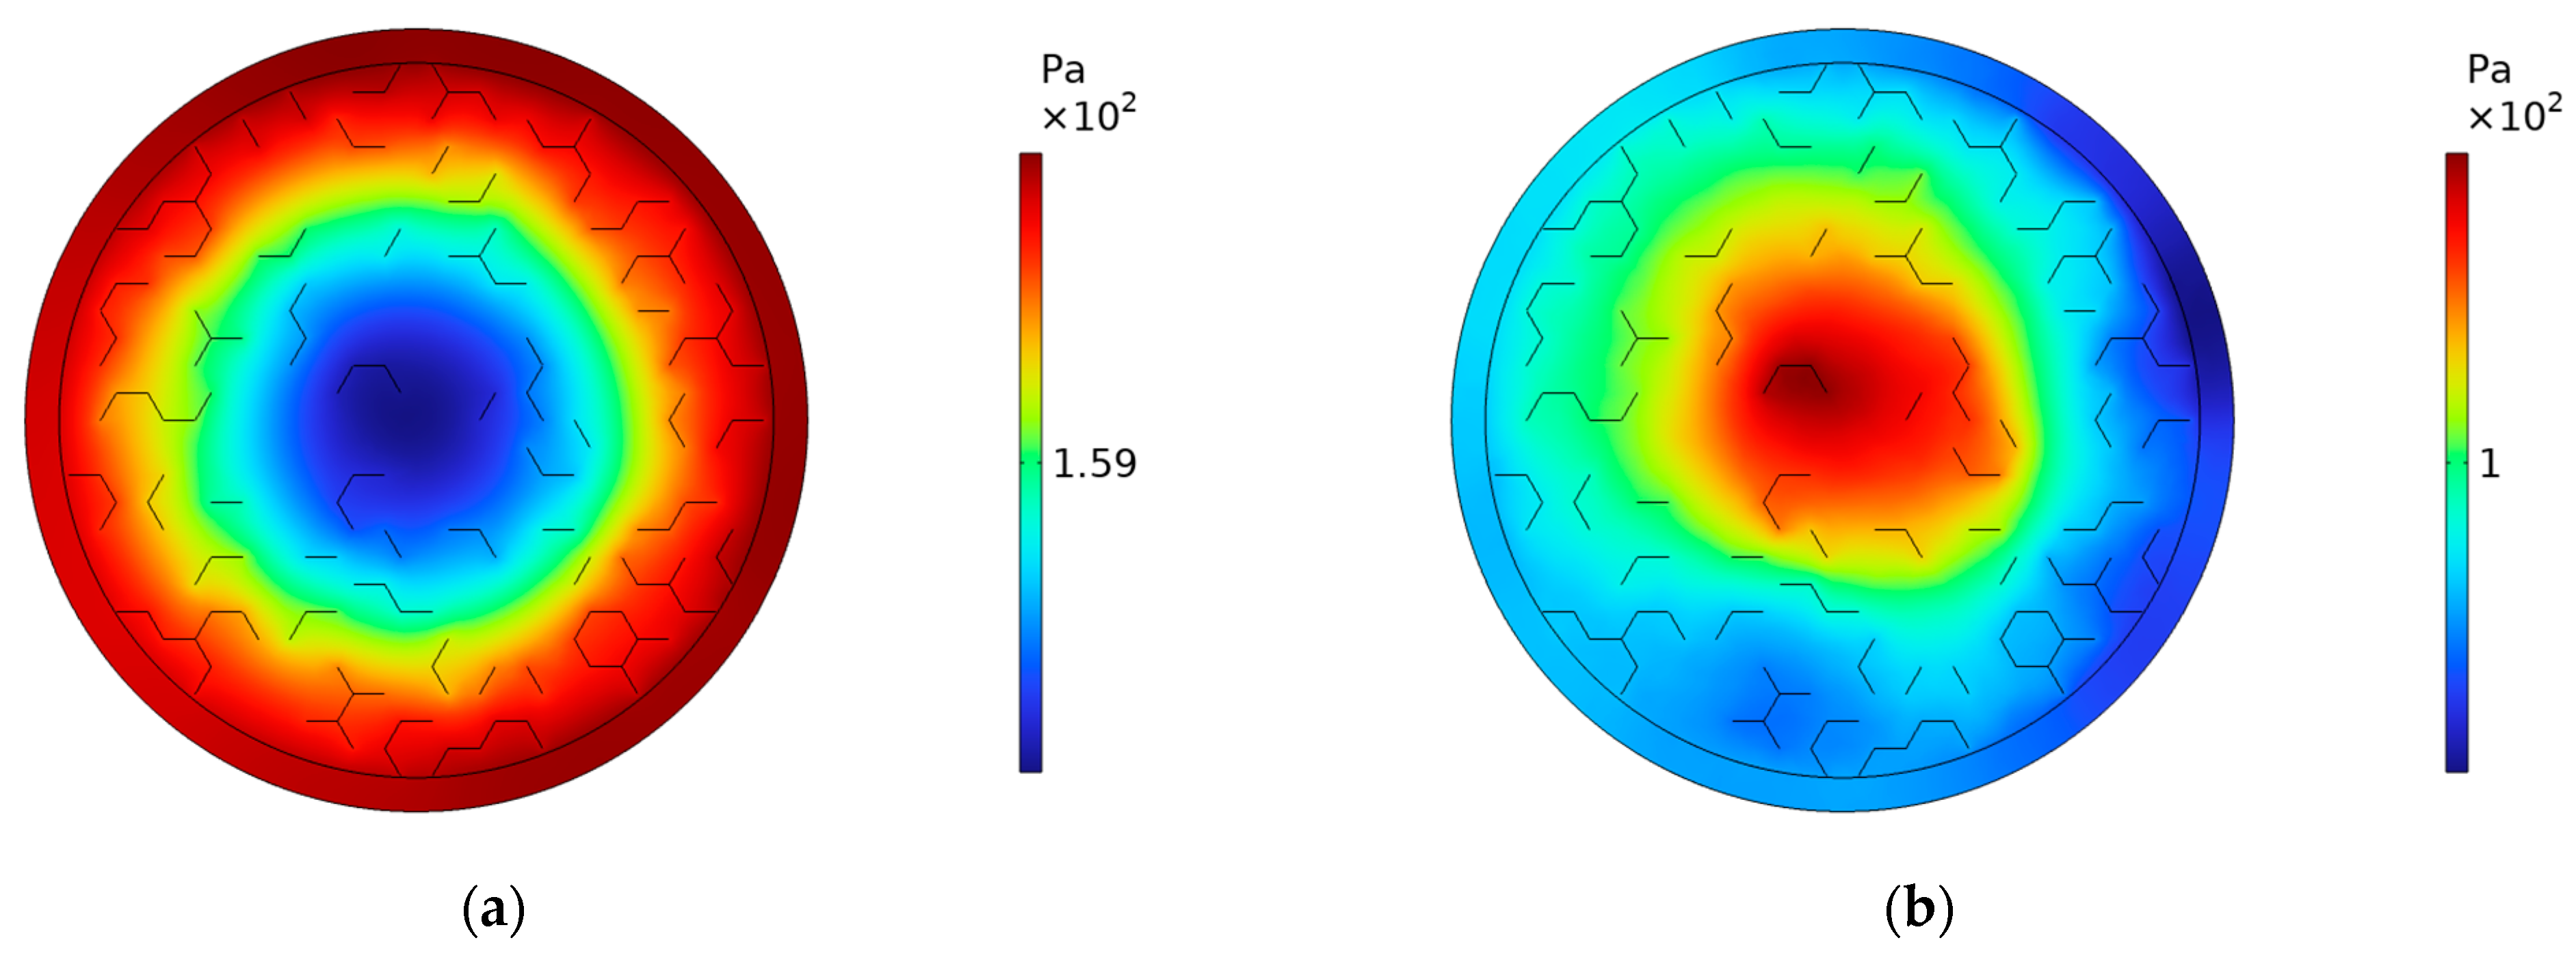
After conducting numerical simulations, the pressure distribution of different models was analyzed. Pressure is crucial for air transportation inside the main cable, and a positive pressure inside the cable was necessary to prevent the intrusion of external high-humidity air or liquid water. Figure 20 shows the pressure distribution of the main cable section located 1.5 m from Symmetric Boundary 1.
Figure 20a shows the pressure distribution in the section of the PM model, displaying a characteristic of high outer pressure and low inner pressure. Figure 20b shows the pressure distribution in the section of the FPM model, also exhibiting high outer pressure and low inner pressure. However, the pressure has a significant difference near the fractures. When fractures appeared in an area where the outer pressure was high, the pressure around the fractures would decrease; when fractures appeared in an area where the inner pressure was low, the pressure around the fractures would increase. The existence of fractures caused the pressure on the main cable section to fluctuate. The findings from previous studies align with the pressure distribution pattern observed in the PM model, characterized by high outer pressure and low inner pressure. However, the FPM model presented the impact of fractures on the pressure distribution, an aspect that previous research failed to recognize.
Different stacking configurations of wires exist within the main cable of a suspension bridge. When air enters the main cable, it first permeates through the outer part with high porosity, resulting in a high external pressure distribution within the main cable section. In the FPM model, the addition of fractures shows more details of the internal flow field of the main cable.
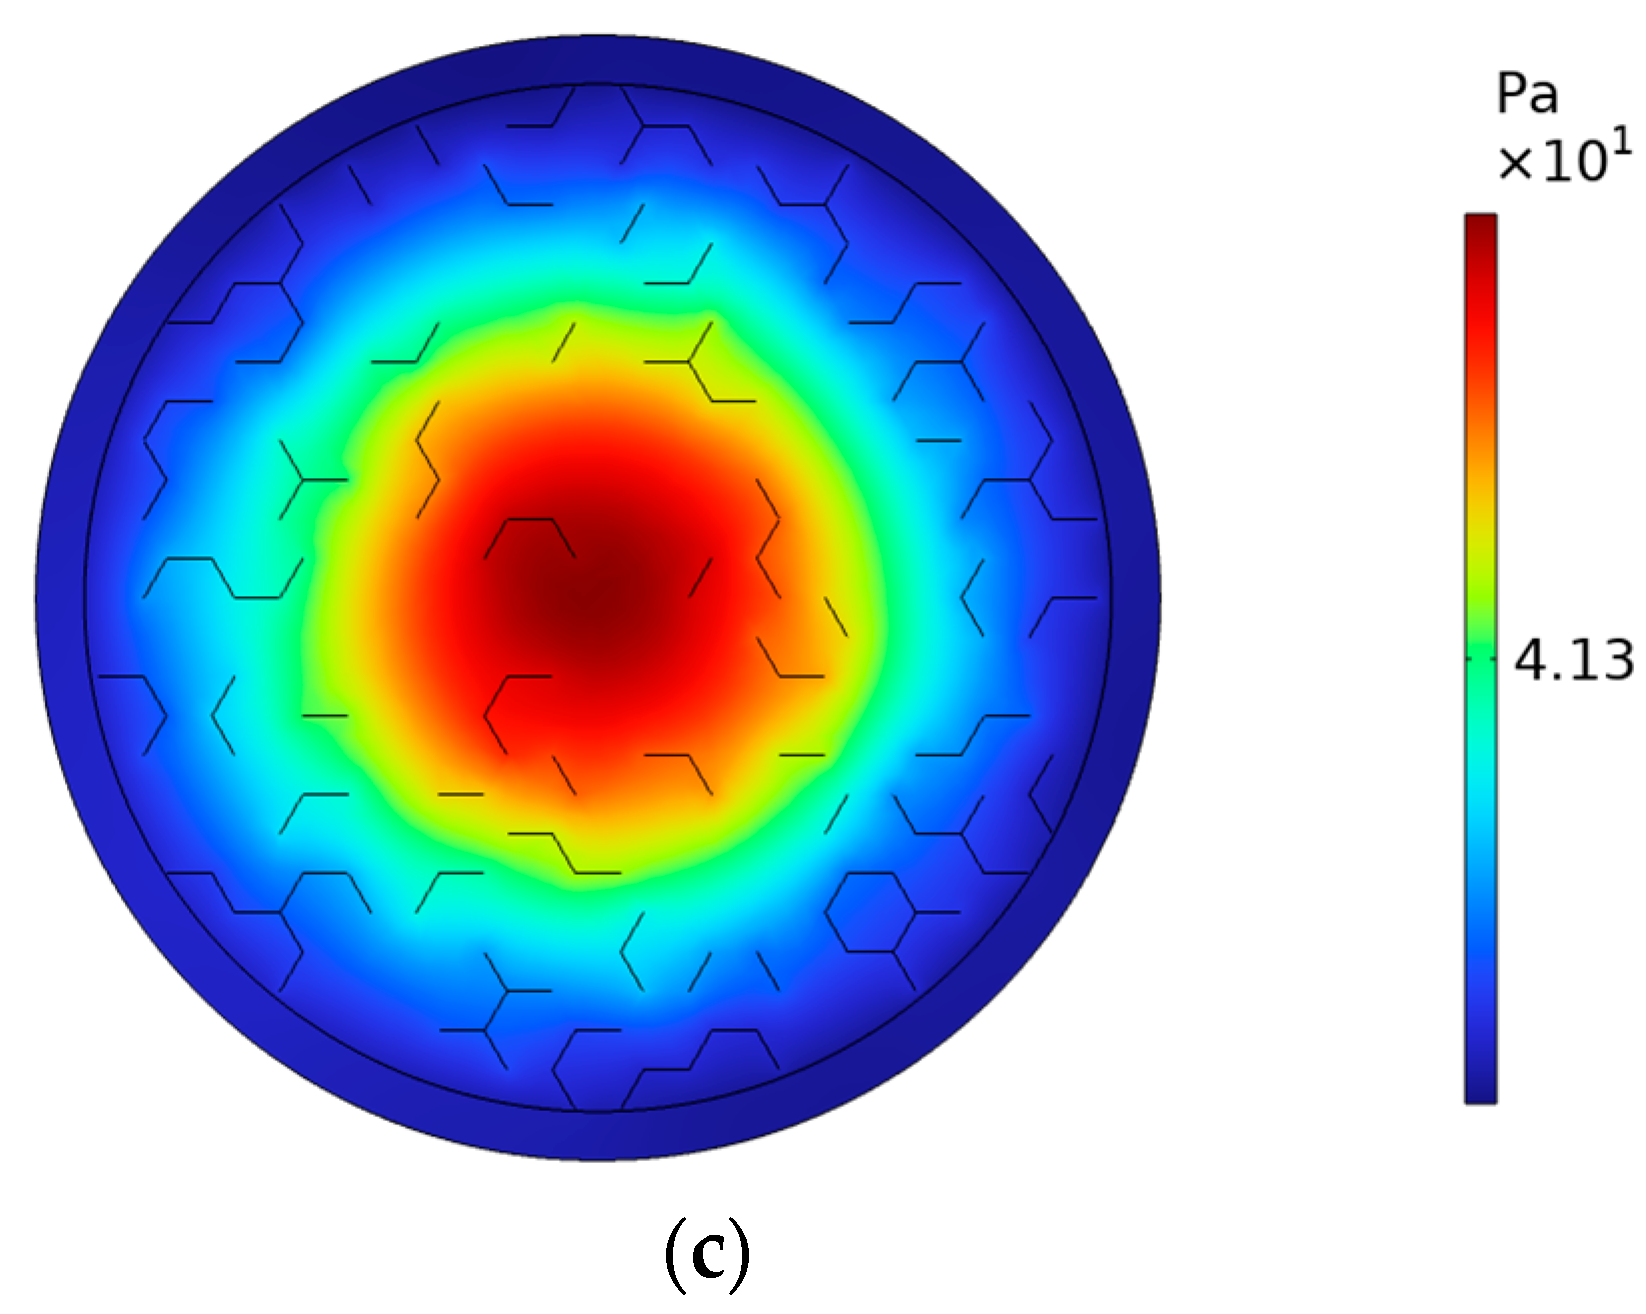
The FPM model was used to analyze the longitudinal pressure distribution of the main cable. Three cross-sections positioned at 3 m, 6 m, and 9 m from Symmetric Boundary 1 were selected for the analysis. The pressure distributions are presented in Figure 21. The figure illustrates that there are noticeable variations in the pressure distribution across different cross-sections in the FPM model.
Table 4 shows the results, indicating that the initial entry of air into the main cable was met with substantial resistance. However, as the air advanced toward the outlet, there was a noticeable shift in the pressure distribution. The resistance of the main cable near the outlet limited air flow, causing a rise in internal pressure.

4.3. Velocity Field

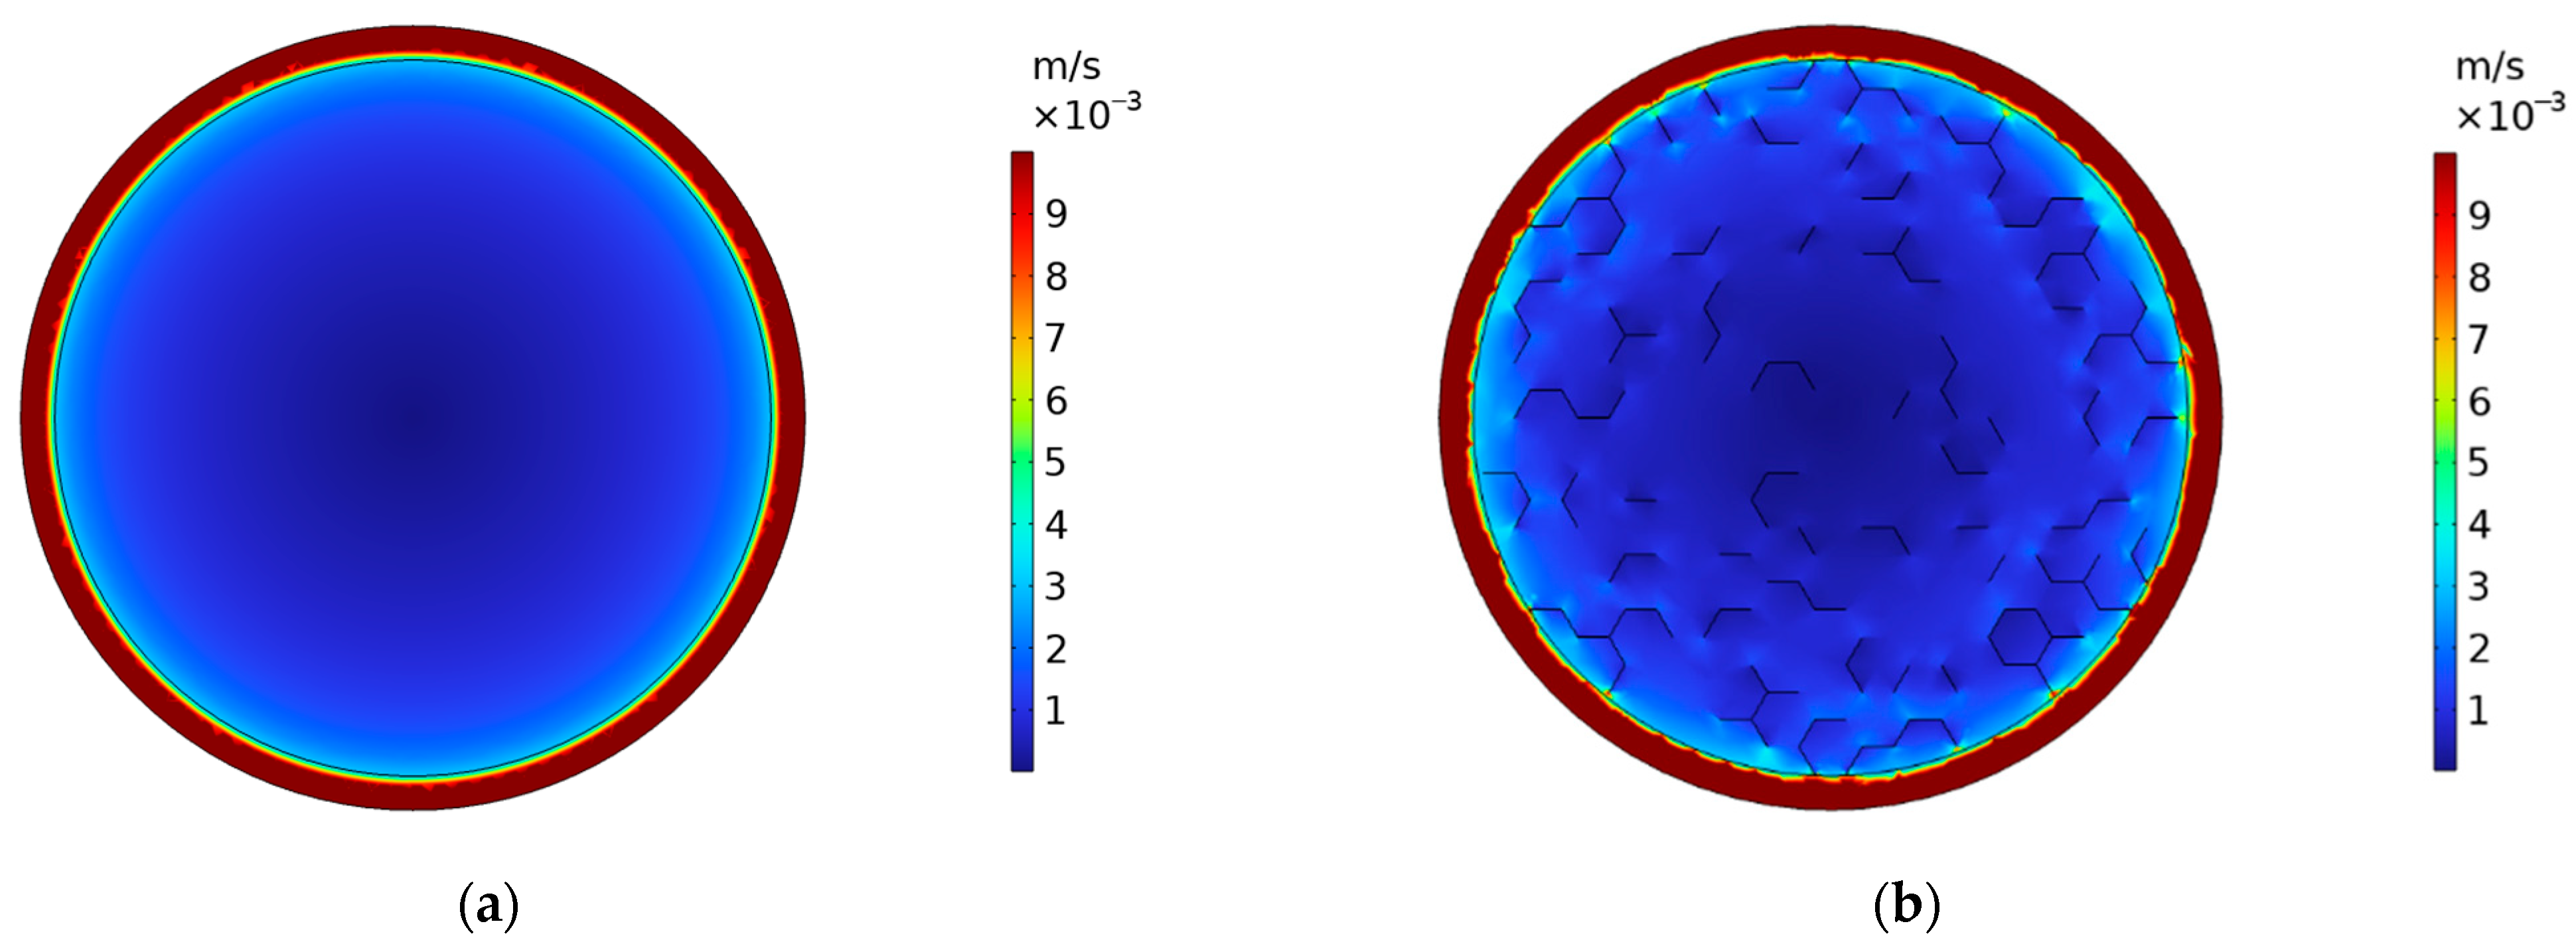
Figure 22 shows the velocity distributions for two models at a distance of 1.5 m from Symmetric Boundary 1. In the PM model and the FPM model, the velocity was higher in the region with high porosity, which was consistent with previous studies. However, there were some differences in the FPM model, as depicted in Figure 22b. The area where the velocity inside the main cable fluctuated was near the fractures. This finding was different from results reported in the relevant literature, where the internal velocity was low and devoid of fluctuations. The presence of fractures raised the average flow velocity in the cross-section, implying that the same pressure could transport the air further and the energy for air delivery could be saved for the same flow rate. The existence of fractures increased the airflow velocity at the same pressure, improving the flow conditions.
Based on the aforementioned research, it can be inferred that by optimizing the distribution of fractures within the main cable, particularly by concentrating the fractures in the areas where residual water is present inside the main cable, the flow velocity in high-humidity areas can be improved. This optimization can accelerate the removal of water and solve the problem of high humidity in some areas of the main cable.

5. Conclusions

This study employs image processing and FRF to obtain the porosity and fracture network of the main cable, developing the FPM model for numerical simulation. Additionally, the flow regime in the main cable is analyzed, and the permeability of the main cable is also calculated. Finally, numerical simulations are performed with the PM model and the FPM model, the results are obtained and validated through field experiments. Based on this study, the following conclusions can be drawn:
  • The FPM model for numerical simulation of the main cable mainly comprises two parts: an outer part with a porosity of 32.11% and an inner part with a porosity of 18.16%. The fractures are randomly distributed within the inner part with a probability of 31.37%;
  • For airflow rates between 10 m3/h and 100 m3/h, the Reynolds number ranges from 0.506 to 5.060, indicating that the flow regime inside the main cable is laminar;
  • The KC equation yielded different results than numerical simulations for the permeability of the porous medium. The permeability calculated through numerical simulation is more consistent with the actual situation;
  • The permeability demonstrates an exponential relationship with porosity, when comparing the radial permeability and the longitudinal permeability under the same porosity, a difference of approximately one order of magnitude is observed;
  • The pressure distribution along the main cable is not constant. Specifically, the pressure near the inlet exhibited a high external pressure and low internal pressure trend, while the opposite is observed near the outlet. This phenomenon can be attributed to the radial permeability of the main cable being lower than the longitudinal permeability, which may make it difficult for air to flow in the radial direction of the main cable;
  • The fractures have an impact on the distribution of airflow inside the main cable, causing fluctuations in pressure and flow velocity near the fractures, and the impact varied at different positions. The presence of fractures inside the main cable facilitated the entrance of air, increasing the airflow velocity, and promoting smoother flow conditions. Optimizing the distribution of fractures can solve the problem of high humidity in some areas.

Author Contributions

Writing—original draft preparation, W.S.; writing—review and editing, X.C. and P.P.; validation, Z.G. and P.P.; methodology, W.S. and X.C.; software, W.S. and Q.L.; data curation, Z.G. and H.G.; resources, H.G. and X.Z.; project administration, H.G. and X.Z. All authors have read and agreed to the published version of the manuscript.

Funding

This research received no external funding.

Data Availability Statement

Some or all data, models, or code that support the findings of this study are available from the corresponding author upon reasonable request.

Acknowledgments

We appreciate the contributions of Jianzhong Shi to this study.

Conflicts of Interest

The authors declare no conflict of interest.

References

  1. Wang, D.; Ye, J.; Wang, B.; Wahab, M.A. Review on the service safety assessment of main cable of long span multi-tower suspension bridge. Appl. Sci. 2021, 11, 5920. [Google Scholar] [CrossRef]
  2. Jensen, J.L.; Lambertsen, J.; Zinck, M.; Stefansson, E. Challenges of water ingress into bridge cable systems. Steel Constr. 2017, 10, 200–206. [Google Scholar] [CrossRef]
  3. Karanci, E.; Betti, R. Modeling corrosion in suspension bridge main cables. II: Long-term corrosion and remaining strength. J. Bridge Eng. 2018, 23, 04018026. [Google Scholar] [CrossRef]
  4. Furuya, K.; Kitagawa, M.; Nakamura, S.-i.; Suzumura, K. Corrosion mechanism and protection methods for suspension bridge cables. Struct. Eng. Int. 2000, 10, 189–193. [Google Scholar] [CrossRef]
  5. Wei, Z.J.; Miao, X.P.; Sui, L.Y. Experimental study on flow resistance of dry air dehumidification for main cable of suspension bridge. J. China Foreign Highw. 2015, 35, 198–203. [Google Scholar]
  6. Chen, W.; Shen, R.; Que, M.; Gong, M.; Miao, R. New dehumidification system design and dehumidification test for the main cable of suspension bridge. J. Civ. Struct. Health 2021, 11, 1321–1335. [Google Scholar] [CrossRef]
  7. Wei, Z.; Peng, F.; Miao, X.; Jia, D.; Zang, Z.; Wei, H. Numerical calculation and experiment on the dehumidification system for main cable of suspension bridge. J. Eng. Thermophys 2016, 37, 2495–2501. [Google Scholar]
  8. Yao, Z.A.; Kang, Z.S.; Ni, Y.; Zuo, X.L. Research on the Air Flow Characteristics of the Suspension Bridge Main Cable by Steel Wire Stacking States. Sci. Technol. Eng. 2021, 21, 3807–3813. [Google Scholar]
  9. Ju, X.L.; Cao, S.G.; Cheng, J.X.; Cui, C.J.; Ma, R.J. Analysis of Temperature and Humidity Change inside Main Cables for a Suspension Bridge Considering Initial Water Accumulation. Highway 2019, 8, 72–78. [Google Scholar]
  10. Konishi, I. Latest Developments on Prefabricated Parallel Wire Strand in Japan. Ann. N. Y. Acad. Sci. 1980, 352, 55–70. [Google Scholar] [CrossRef]
  11. Zulian, P.; Schädle, P.; Karagyaur, L.; Nestola, M.G. Comparison and application of non-conforming mesh models for flow in fractured porous media using dual Lagrange multipliers. J. Comput. Phys. 2022, 449, 110773. [Google Scholar] [CrossRef]
  12. Ma, T.; Zhang, K.; Shen, W.; Guo, C.; Xu, H. Discontinuous and continuous Galerkin methods for compressible single-phase and two-phase flow in fractured porous media. Adv. Water Resour. 2021, 156, 104039. [Google Scholar] [CrossRef]
  13. Lee, J.; Babadagli, T. Effect of roughness on fluid flow and solute transport in a single fracture: A review of recent developments, current trends, and future research. J. Nat. Gas Sci. Eng. 2021, 91, 103971. [Google Scholar] [CrossRef]
  14. Sukanya, A.; Krishnamurthy, K.; Balakrishnan, T. Comparison of Preprocessing Techniques for Dental Image Analysis. Curr. Med. Imaging 2020, 16, 776–780. [Google Scholar] [CrossRef]
  15. Khalilabad, N.D.; Hassanpour, H. Employing image processing techniques for cancer detection using microarray images. Comput. Biol. Med. 2017, 81, 139–147. [Google Scholar] [CrossRef]
  16. Hoang, N.-D. Detection of surface crack in building structures using image processing technique with an improved Otsu method for image thresholding. Adv. Civ. Eng. 2018, 2018, 3924120. [Google Scholar] [CrossRef]
  17. Garg, N.; Garg, N. Binarization techniques used for grey scale images. Int. J. Comput. Appl. 2013, 71, 8–11. [Google Scholar]
  18. Guanzhong, P.; Xiaoping, M.; Daiyong, J.; Liangkai, F.; Chunyu, Z.; Luyan, S. Design research on dehumidification system for main cable of suspension bridge. J. Shenzhen Univ. Sci. Eng. 2013, 30, 111–220. [Google Scholar]
  19. Lipeng, S.; Baolong, L.; Yanfang, F. Image Recognition Algorithm Based on Artificial Intelligence and Machine Learning. Mob. Inf. Syst. 2022, 2022, 8125969. [Google Scholar] [CrossRef]
  20. Breiman, L. Random forests. Mach. Learn. 2001, 45, 5–32. [Google Scholar] [CrossRef]
  21. Macdonald, I.; El-Sayed, M.; Mow, K.; Dullien, F. Flow through porous media-the Ergun equation revisited. Ind. Eng. Chem. Fundam. 1979, 18, 199–208. [Google Scholar] [CrossRef]
  22. Ngameni, K.L.; Bandyopadhyay, S.; Miskimins, J.L. Statistical analysis of experimental studies of non-Darcy flow in proppant packs. J. Pet. Sci. Eng. 2022, 217, 110727. [Google Scholar] [CrossRef]
  23. Emmanouil, S.; Christos, G.; Georgios, A. Kozeny-Carman Equation and Hydraulic Conductivity of Compacted Clayey Soils. Geomaterials 2012, 2, 37–41. [Google Scholar]
Figure 1. Pretreatment: (a) Raw; (b) After preprocessing.
Buildings 13 01422 g001
Figure 2. Sample image.
Buildings 13 01422 g002
Figure 3. Sample image processed with different algorithms: (a) Otus algorithm; (b) Sauvola algorithm.
Buildings 13 01422 g003
Figure 4. Division of the main cable cross-section.
Buildings 13 01422 g004
Figure 5. Porosity of each part.
Buildings 13 01422 g005
Figure 6. Division of Part e by dichotomization.
Buildings 13 01422 g006
Figure 7. Structure of main cable model with two kinds of porosity.
Buildings 13 01422 g007
Figure 8. Training process of FRF. First, the input image undergoes feature extraction to obtain its characteristics. Next, a collection of pixel samples is established and transformed into feature vectors. A learning algorithm is then trained on these vectors to classify the rest of the image data. Finally, the accuracy of identification can be improved by correcting or adding labels.
Buildings 13 01422 g008
Figure 9. Fracture samples.
Buildings 13 01422 g009
Figure 10. Fractures in 1/4 main cable cross-section: (a) Fractures identified by FRF; (b) Fractures between all the hexagonal strands.
Buildings 13 01422 g010
Figure 11. Creation process of fracture network.
Buildings 13 01422 g011
Figure 12. Creation process of numerical simulation model.
Buildings 13 01422 g012
Figure 13. Schematic diagram of fluid flow: (a) Radial; (b) Longitudinal.
Buildings 13 01422 g013
Figure 14. Numerical simulation model for obtaining permeability: (a) Radial; (b) Longitudinal.
Buildings 13 01422 g014
Figure 15. Permeability obtained through different methods: (a) Radial; (b) Longitudinal.
Buildings 13 01422 g015
Figure 16. Fitting results: (a) Radial; (b) Longitudinal.
Buildings 13 01422 g016
Figure 17. Boundary conditions of the models: (a) PM model; (b) FPM model.
Buildings 13 01422 g017
Figure 18. Air velocity components in the main cable.
Buildings 13 01422 g018
Figure 19. Pressure and angle between the velocity and longitudinal velocity.
Buildings 13 01422 g019
Figure 20. Distribution of pressure with two models: (a) PM model; (b) FPM model.
Buildings 13 01422 g020
Figure 21. Distribution of pressure at different positions: (a) 3 m; (b) 6 m; (c) 9 m.
Buildings 13 01422 g021aBuildings 13 01422 g021b
Figure 22. Distribution of velocity with two models: (a) PM model; (b) FPM model.
Buildings 13 01422 g022
Table 1. Reynolds number with different flow rates.
Flow Rate (m3/h)Re*
100.506
201.012
301.518
402.024
502.530
603.036
703.542
804.048
904.554
1005.060
Table 2. Specific data of the simulation model.
Name of Specific DataValueUnit
Inlet pressure200Pa
Outlet pressure0Pa
Radial permeability of inner part9.28239 × 10−10m2
Radial permeability of outer part1.47342 × 10−8m2
Longitudinal permeability of inner part7.98215 × 10−9m2
Longitudinal permeability of outer part6.38173 × 10−8m2
Length of the model13m
Table 3. Results of the field experiments.
Resistance Loss along the Main Cable (Pa)Length (m)Specific Frictional Head Loss (Pa/m)
98227.94 135.17
1 The length of the main cable after removing the influence of local resistance at the inlet and outlet.
Table 4. Results of the cross-sections.
Position
of the Cross-Section
High-Pressure Position
of the Cross-Section
Airflow Direction
of the Cross-Section
Max Differential Pressure of the Cross-Section (Pa)
3 mOuterOuter to inner0.19
6 mOuterOuter to inner0.003
9 mInnerInner to outer0.04
Disclaimer/Publisher’s Note: The statements, opinions and data contained in all publications are solely those of the individual author(s) and contributor(s) and not of MDPI and/or the editor(s). MDPI and/or the editor(s) disclaim responsibility for any injury to people or property resulting from any ideas, methods, instructions or products referred to in the content.