

Mechanical Properties of Concrete Containing Ferronickel Slag as Fine Aggregate Substitute Using Digital Image Correlation Analysis


Abstract
:1. Introduction
2. Materials and Experimental Program
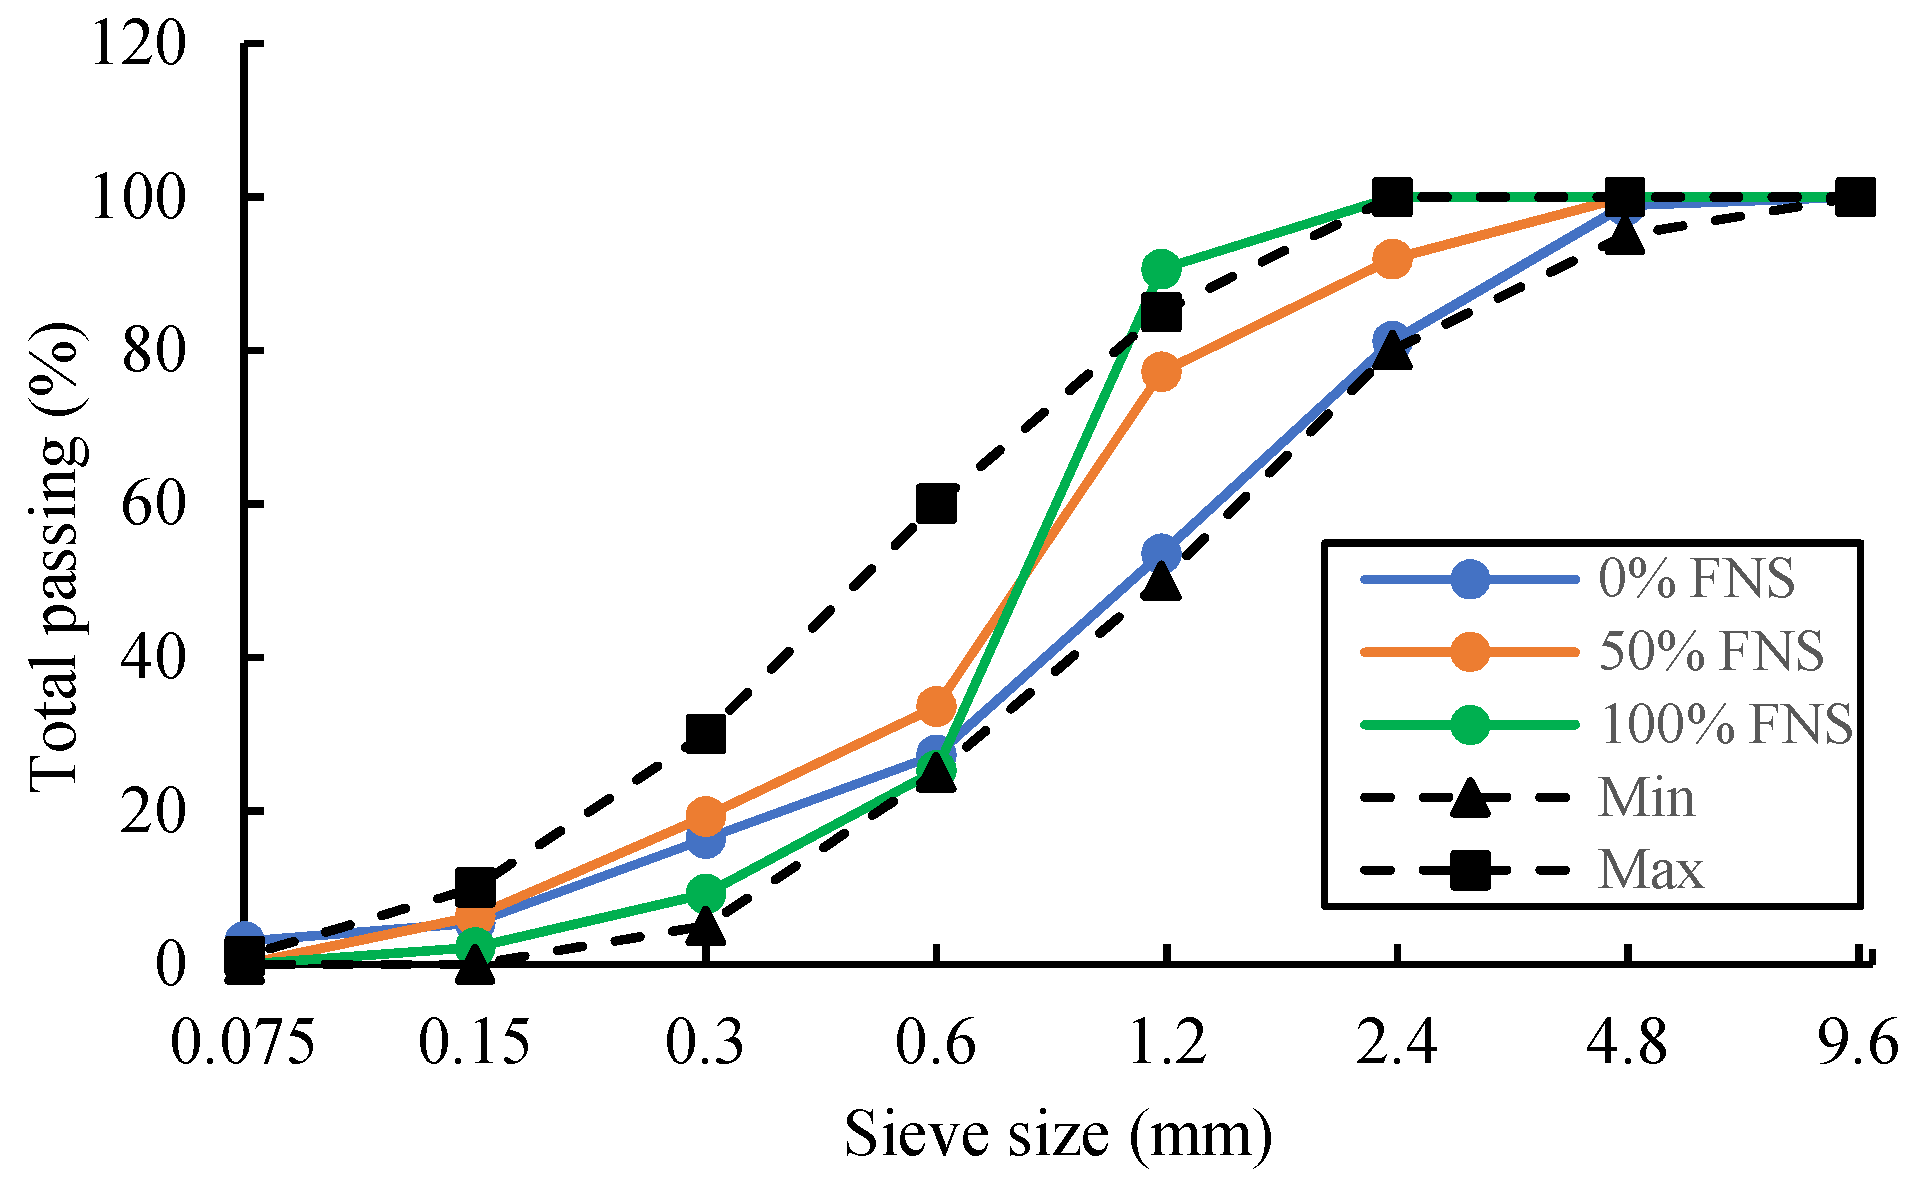
2.1. Materials and Mix Proportions
2.2. Specimen Preparations
2.2.1. Casting and Curing
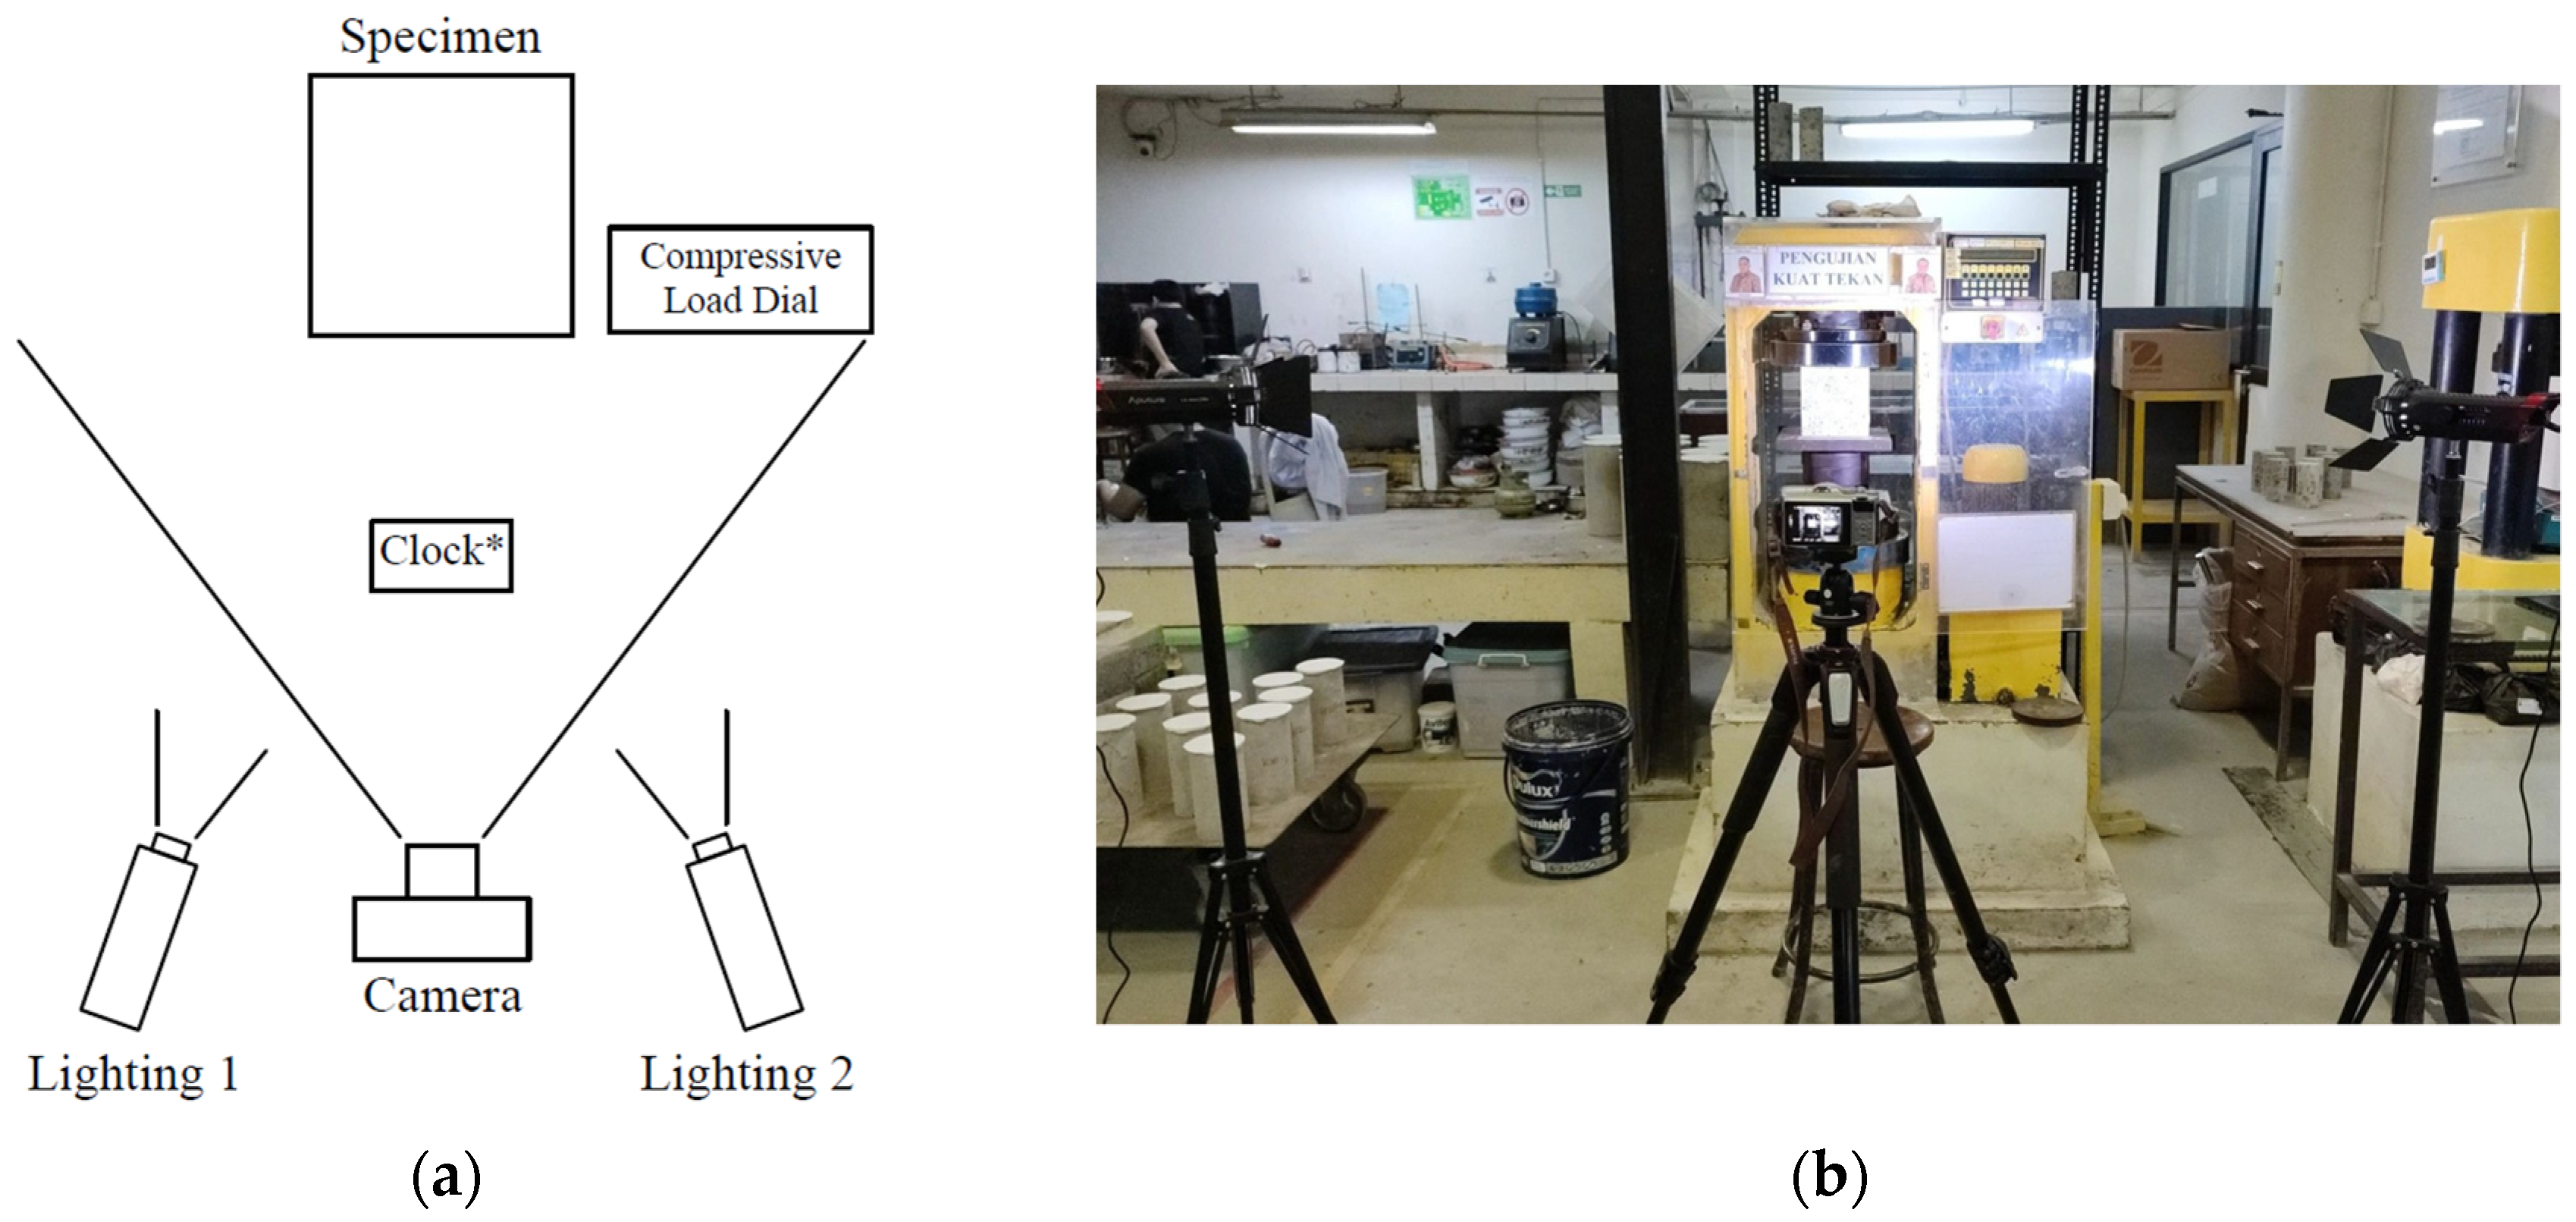
2.2.2. Digital Image Correlation Test Preparations
2.3. Testing Methods
2.3.1. Ultrasonic Pulse Velocity (UPV) Test
2.3.2. Compressive Strength and DIC Test
3. Results and Discussion
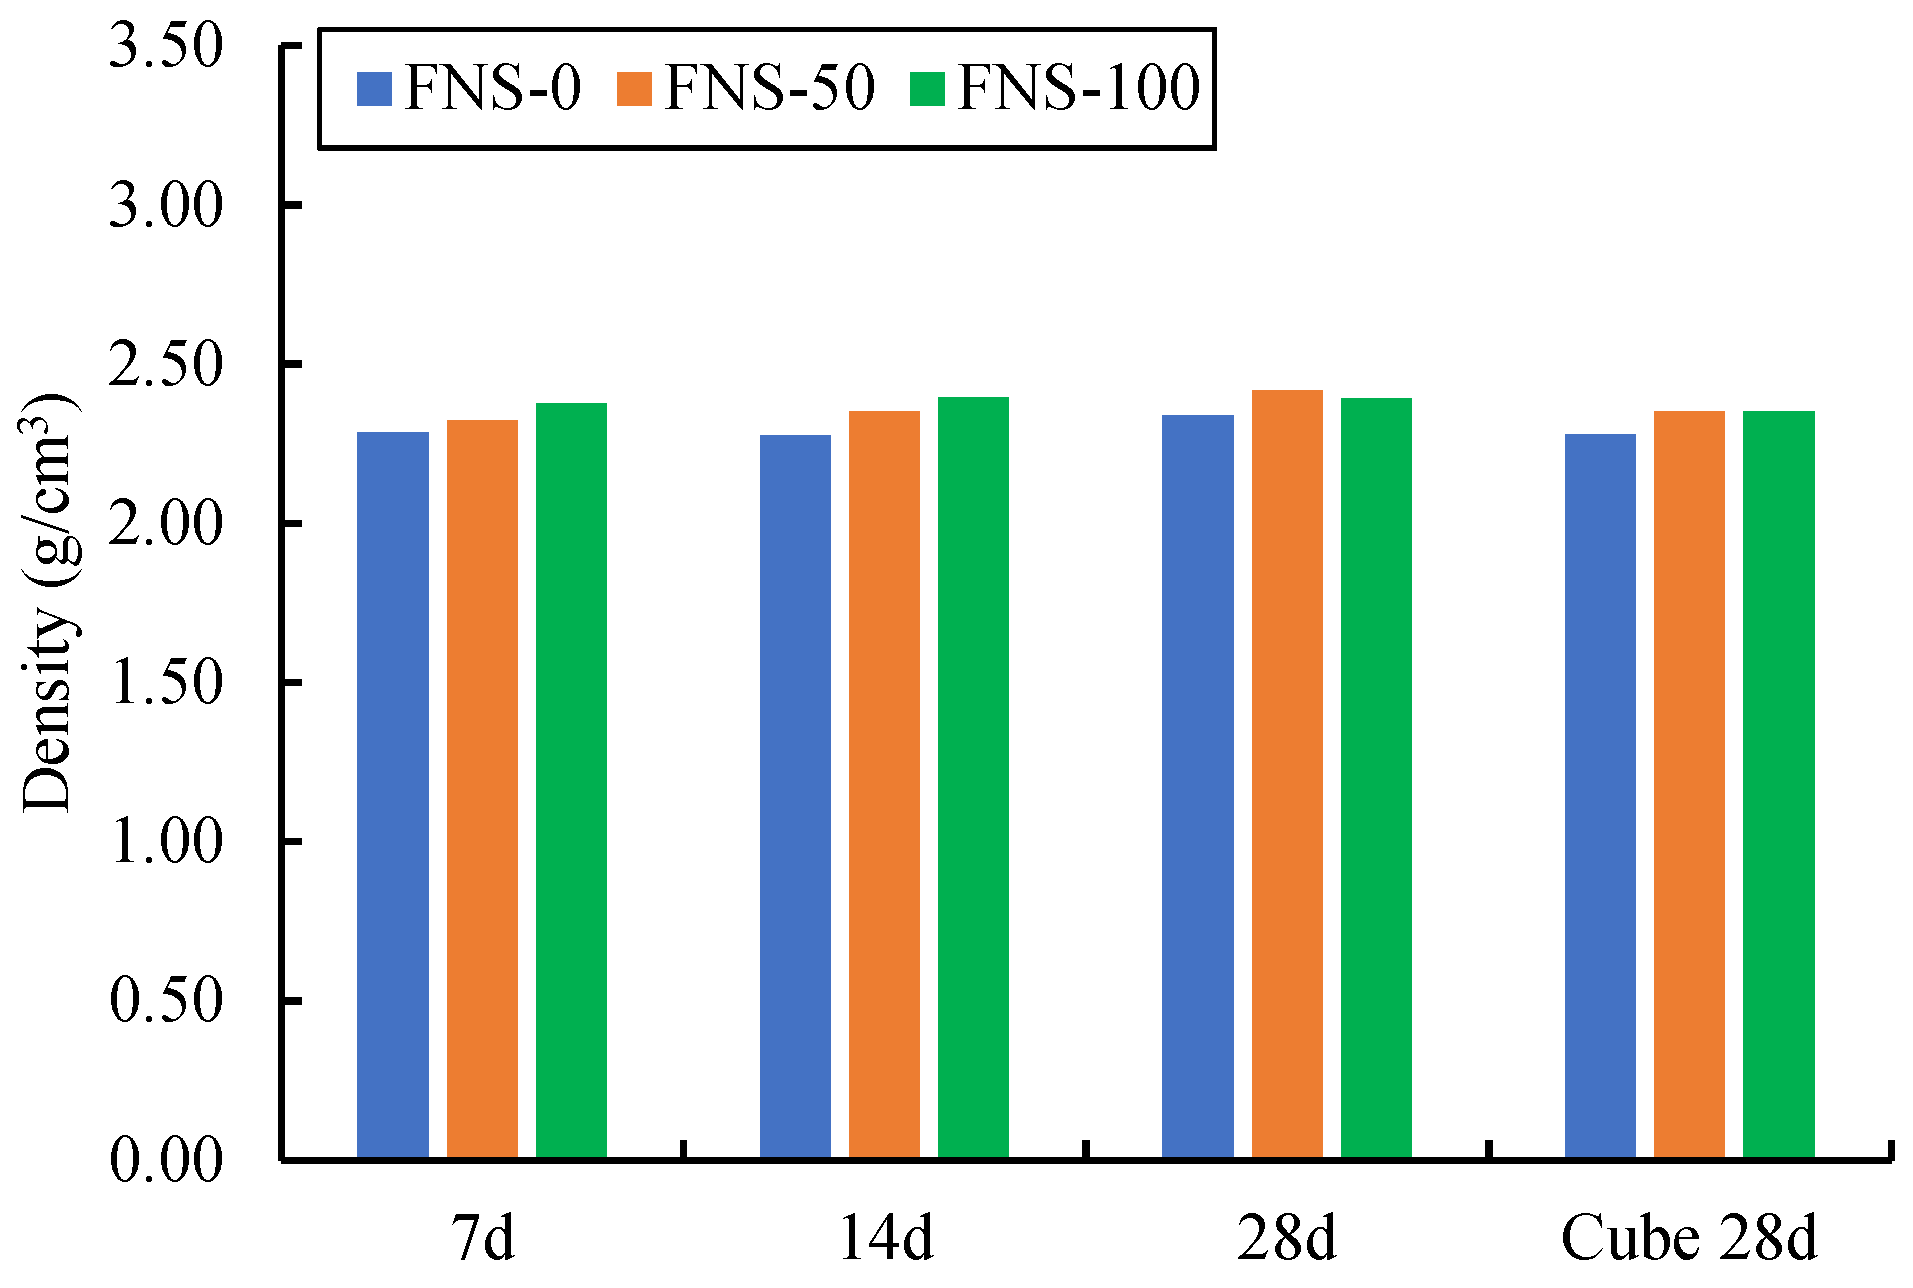
3.1. Density
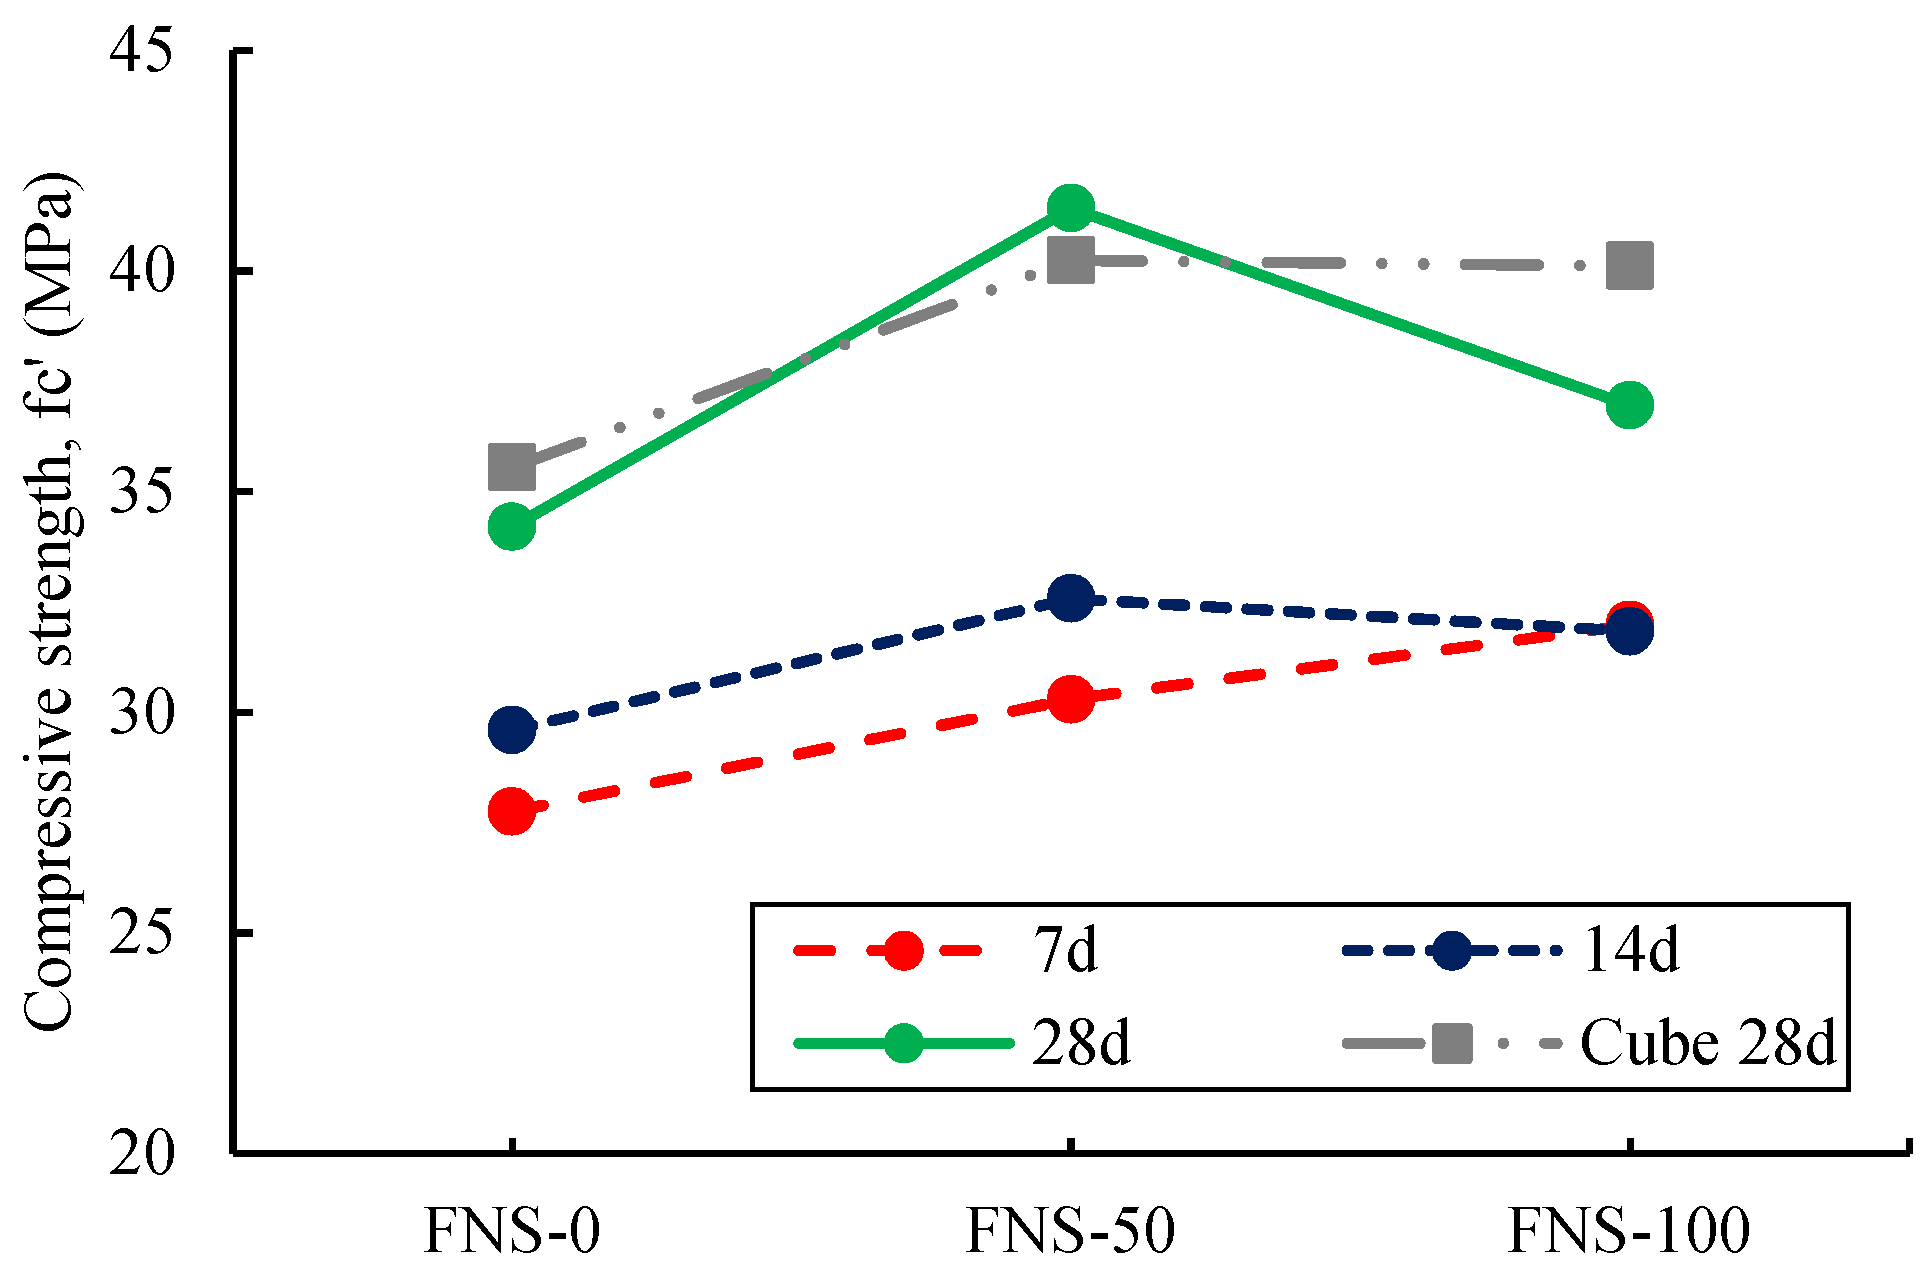
3.2. Compressive Strength
3.3. Ultrasonic Pulse Velocity
3.4. Load–Displacement Relationship
3.5. Strain Behavior
3.6. Stiffness
3.7. Poisson’s Ratio
4. Conclusions
- The usage of FNS as fine aggregate slightly increases the density of concrete. The density increases scales with the increase in FNS replacement. The 50% and 100% FNS replacements increase the density up to 3.4% and 5.2%, respectively;
- The overall compressive strength of specimens with 50% FNS substitution (FNS-50) has the highest values, followed by 100% FNS substitution (FNS-100) and the control (FNS-0). The 50% and 100% FNS substitutions improve compressive strength up to 21% and 15%, respectively, compared to that obtained for the control specimen (FNS-0). These results show that FNS substitution positively impacts the concrete’s compressive strength;
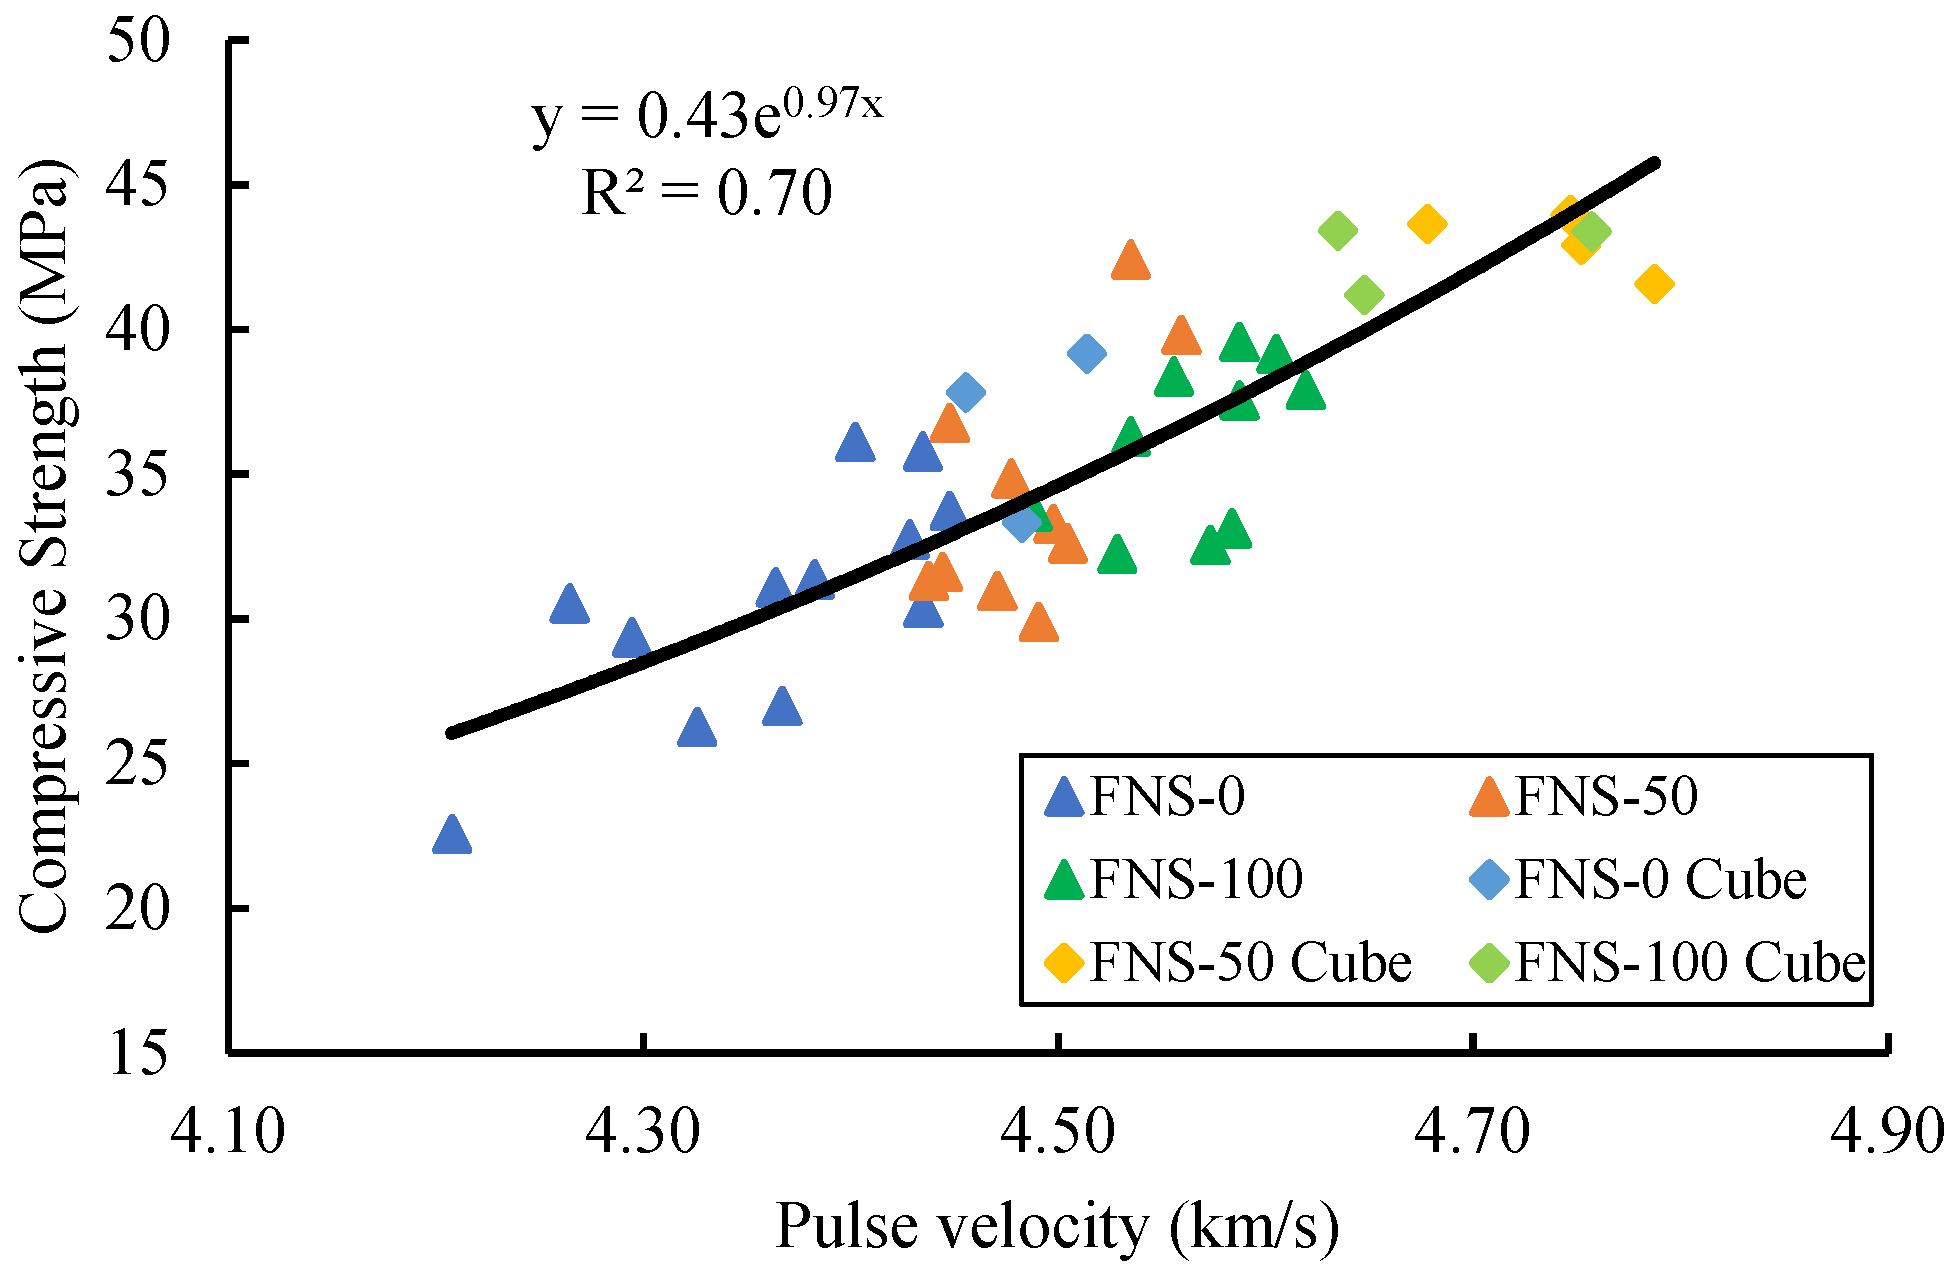
- Ultrasonic Pulse Velocity (UPV) test results show an increase in pulse velocity with an increase in FNS substitution. The UPV data distribution in cylinder specimens shows a tighter range than the cube specimens. The highest velocity achieved by FNS-100 differs from other studies, where it shows a lower compressive strength than FNS-50. Generally, higher pulse velocity leads to a higher strength. These findings may be influenced by magnesium and iron oxides in FNS, which increase the pulse velocity obtained;
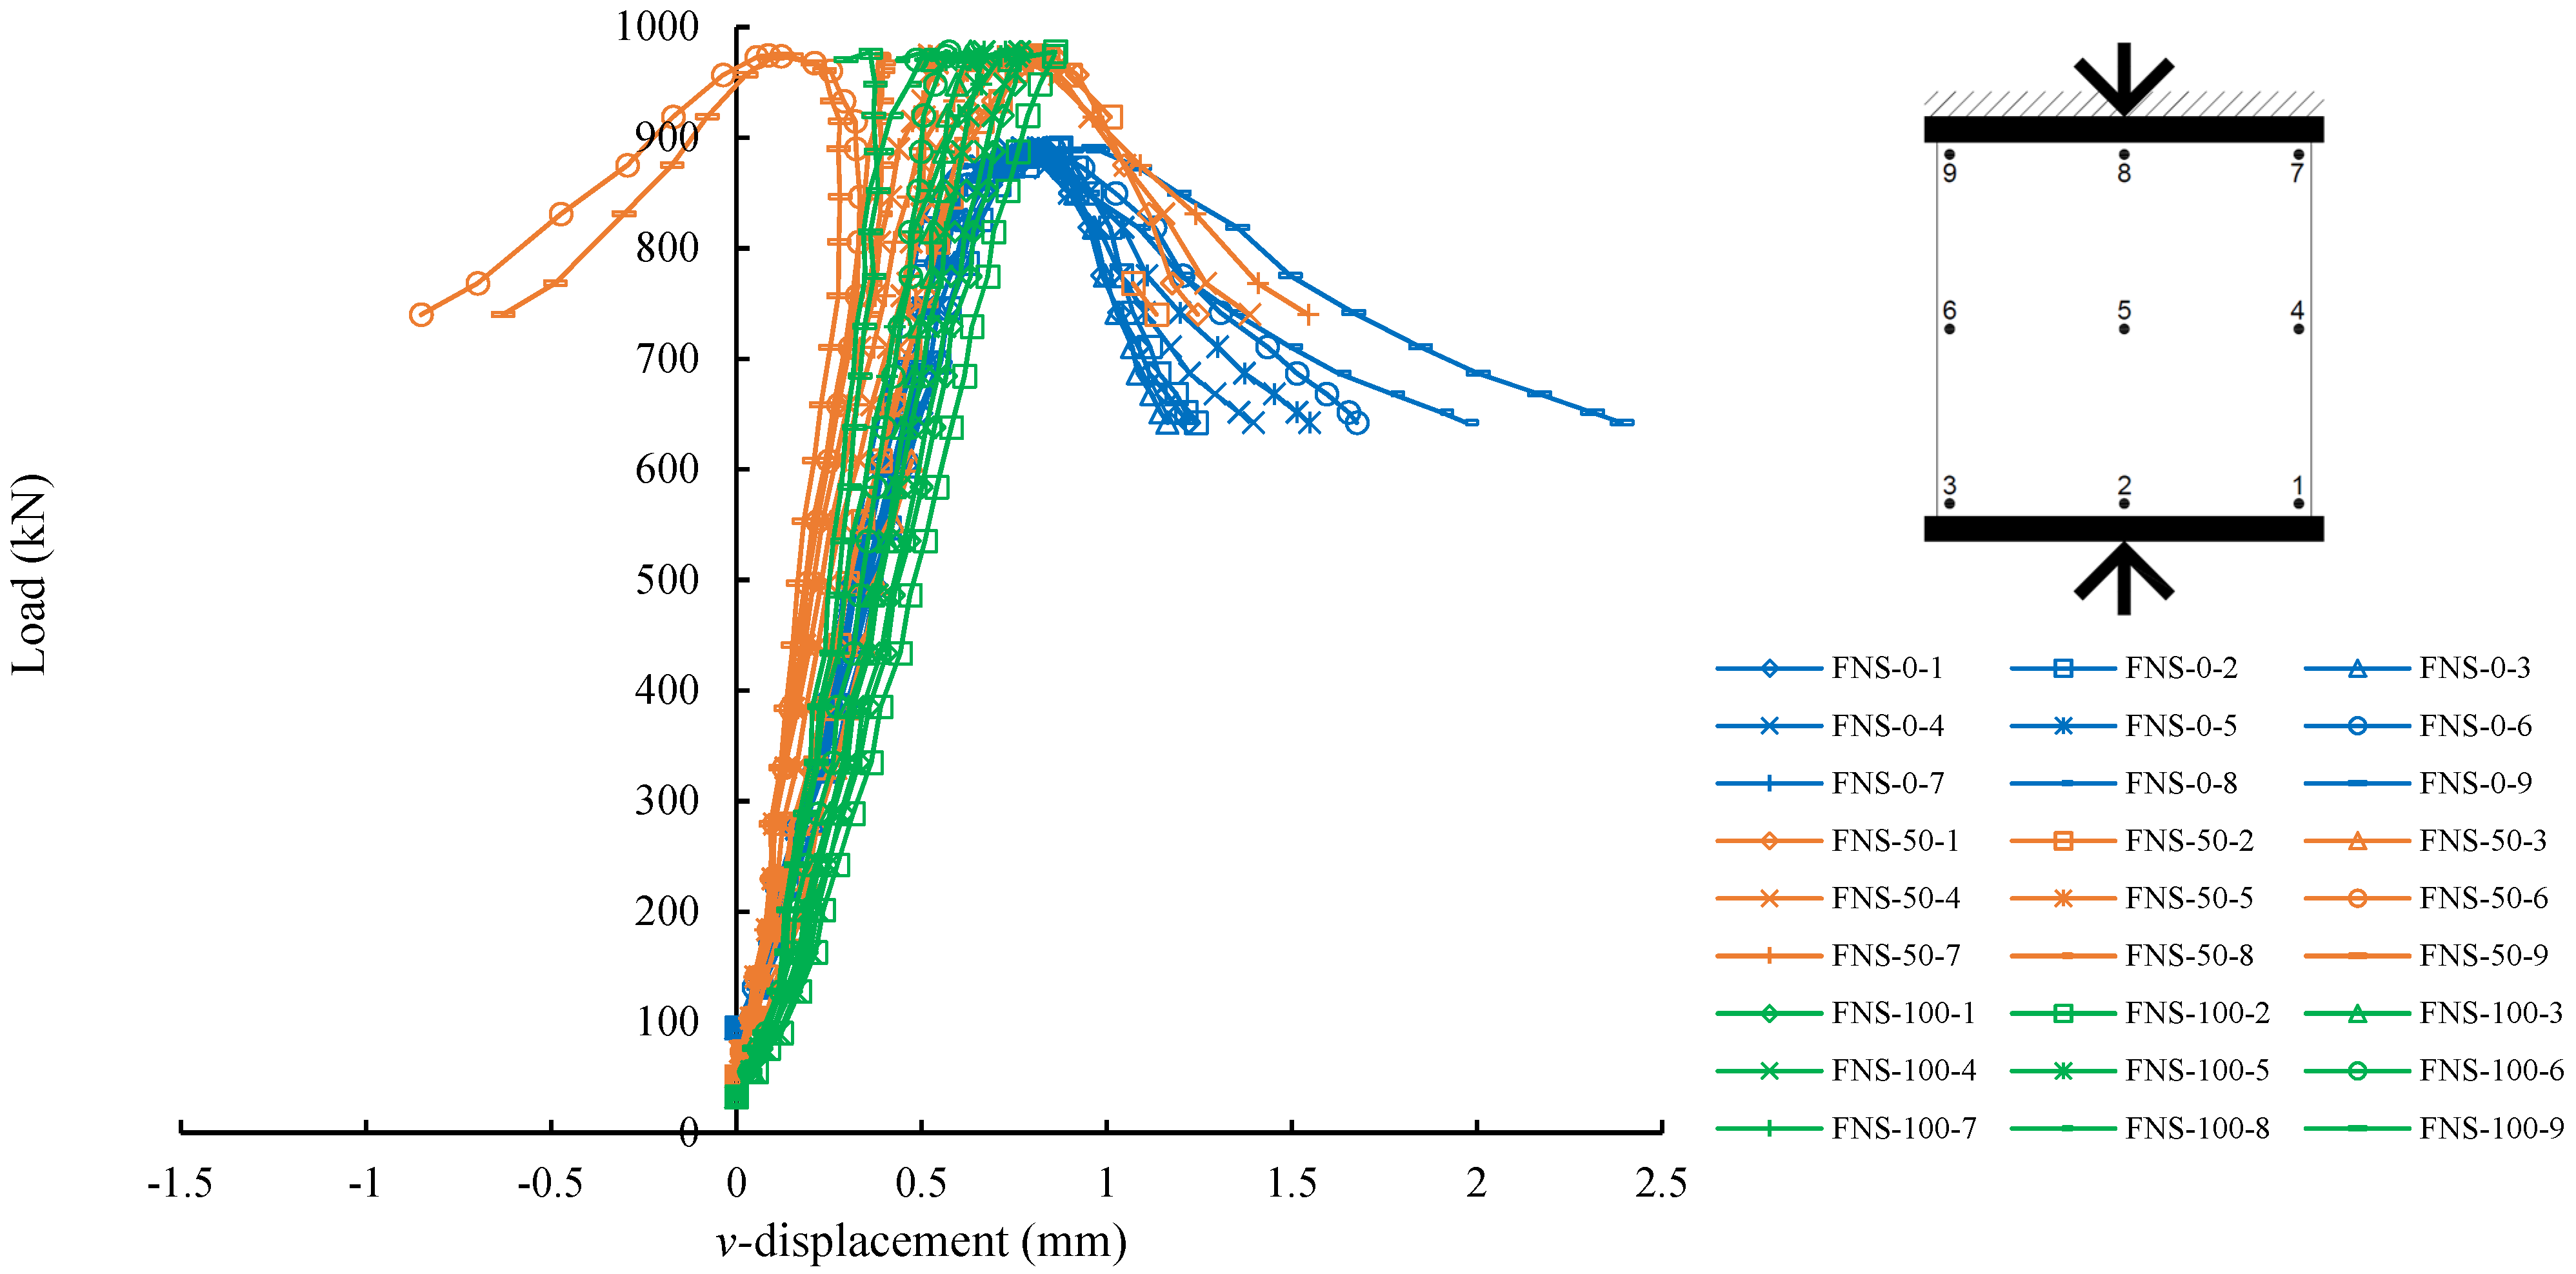
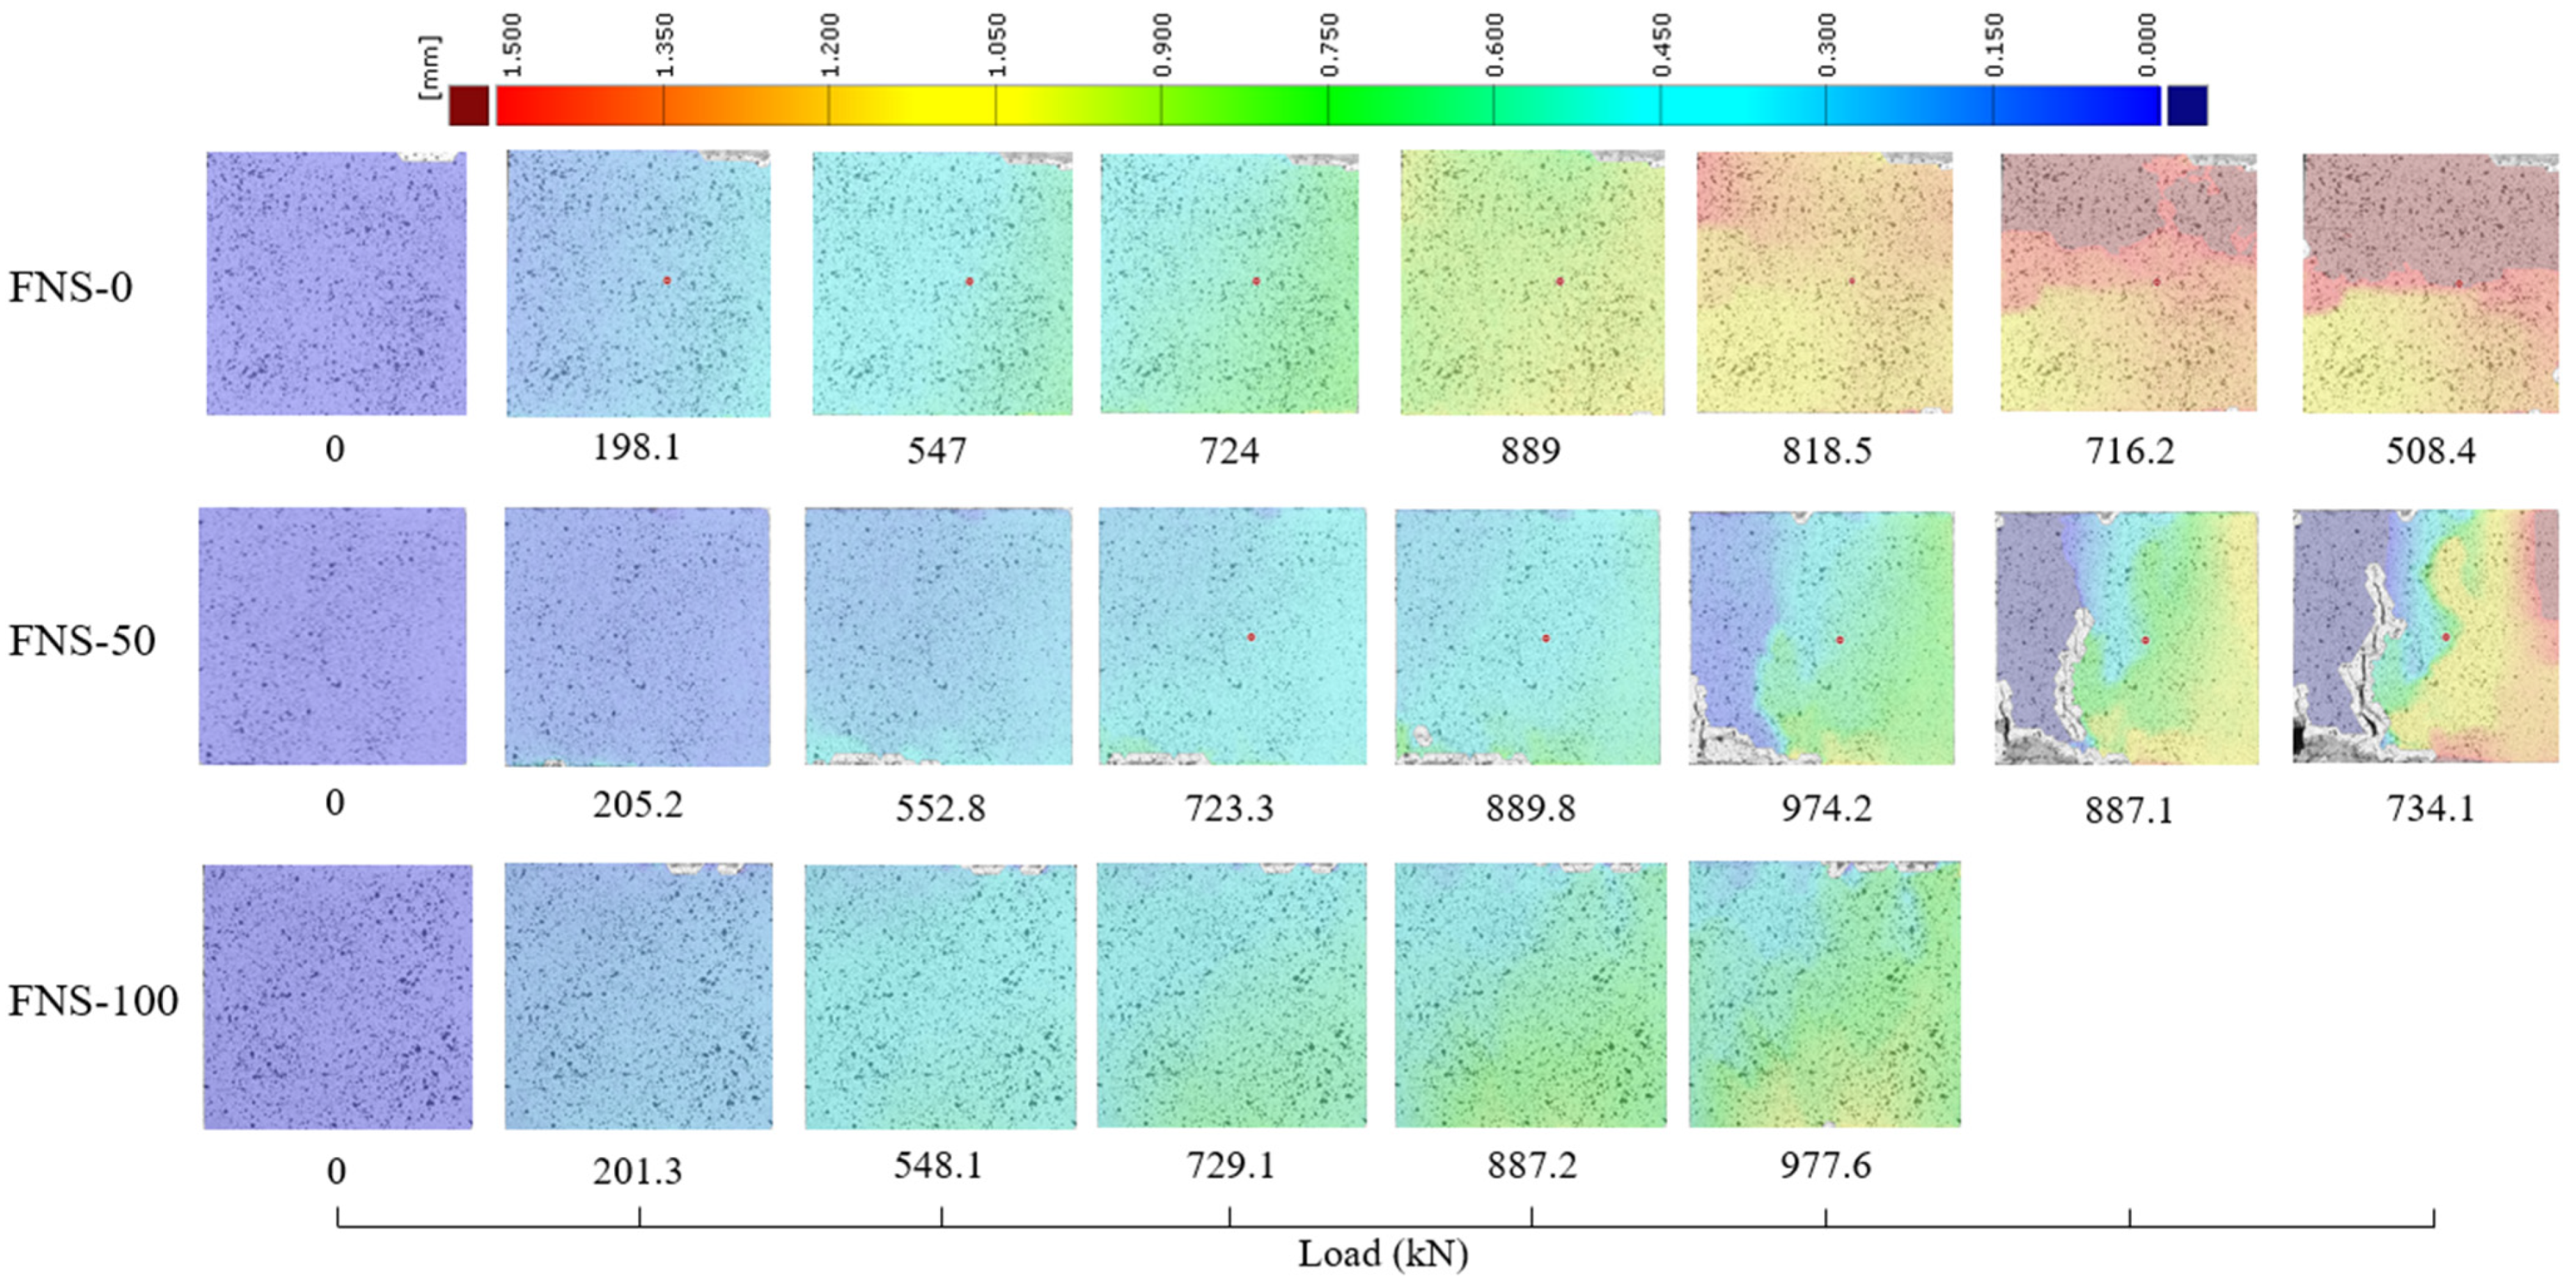
- The load–displacement relationship shows the vertical displacement behavior of the specimen behavior under compressive load. The specimen with FNS substitution shows less displacement under the same load compared to the control, where FNS-50 has the steeper response, followed by FNS-100 and FNS-0;
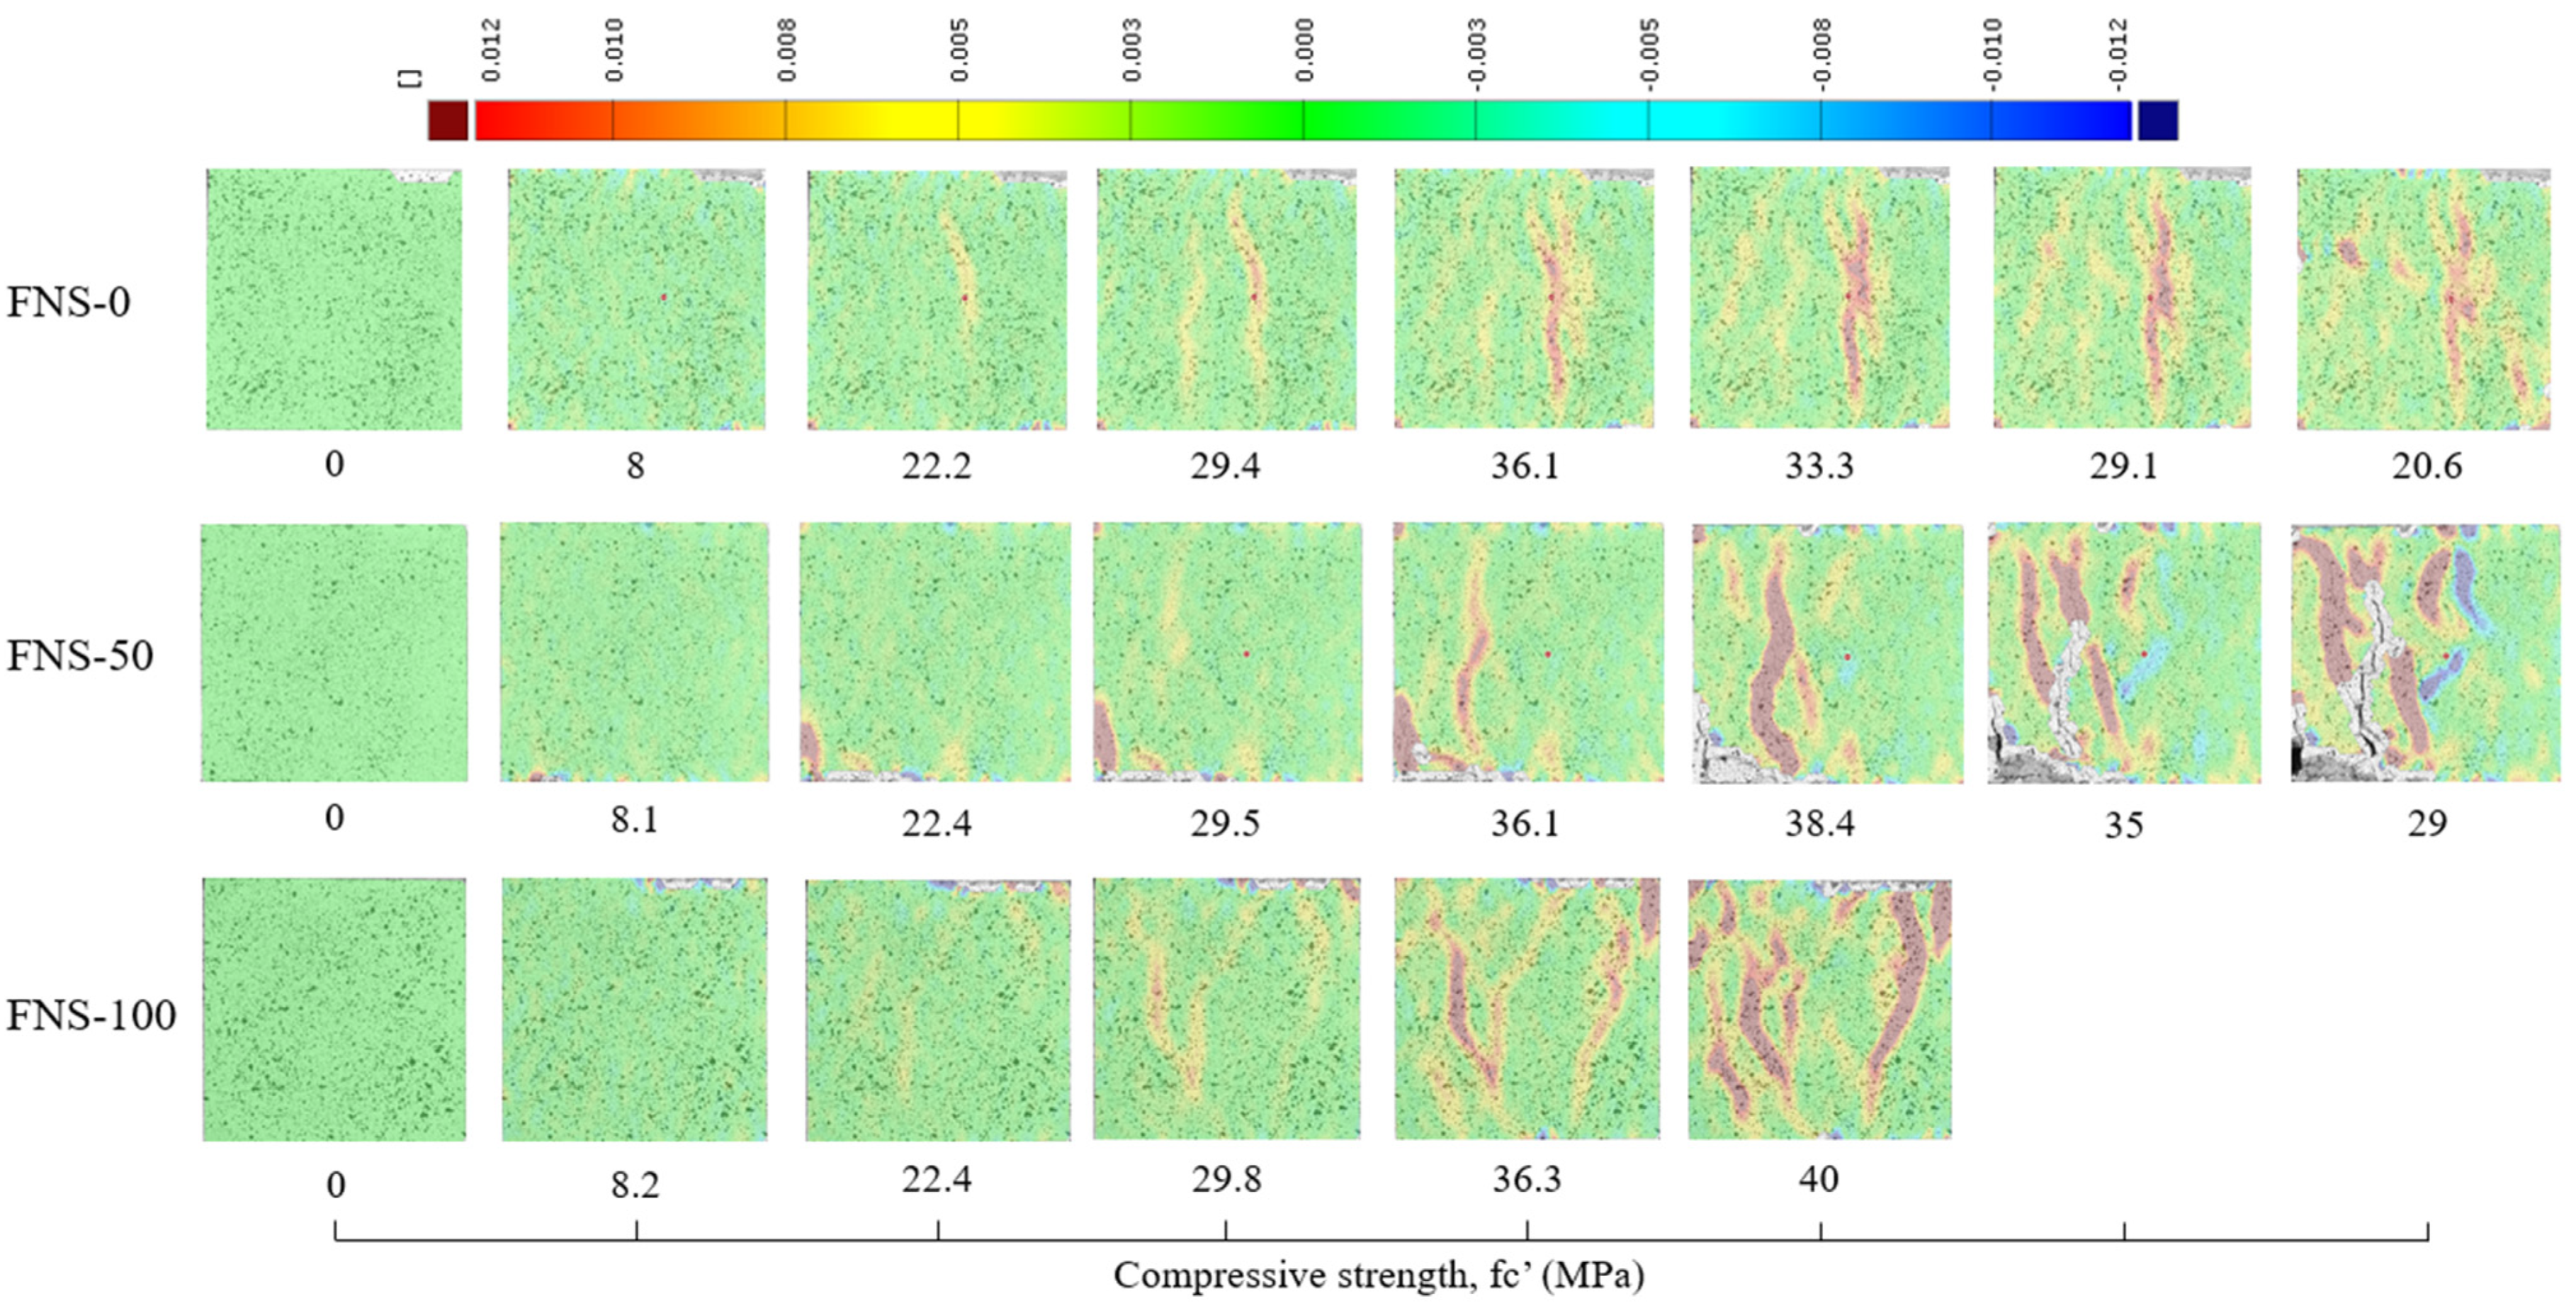
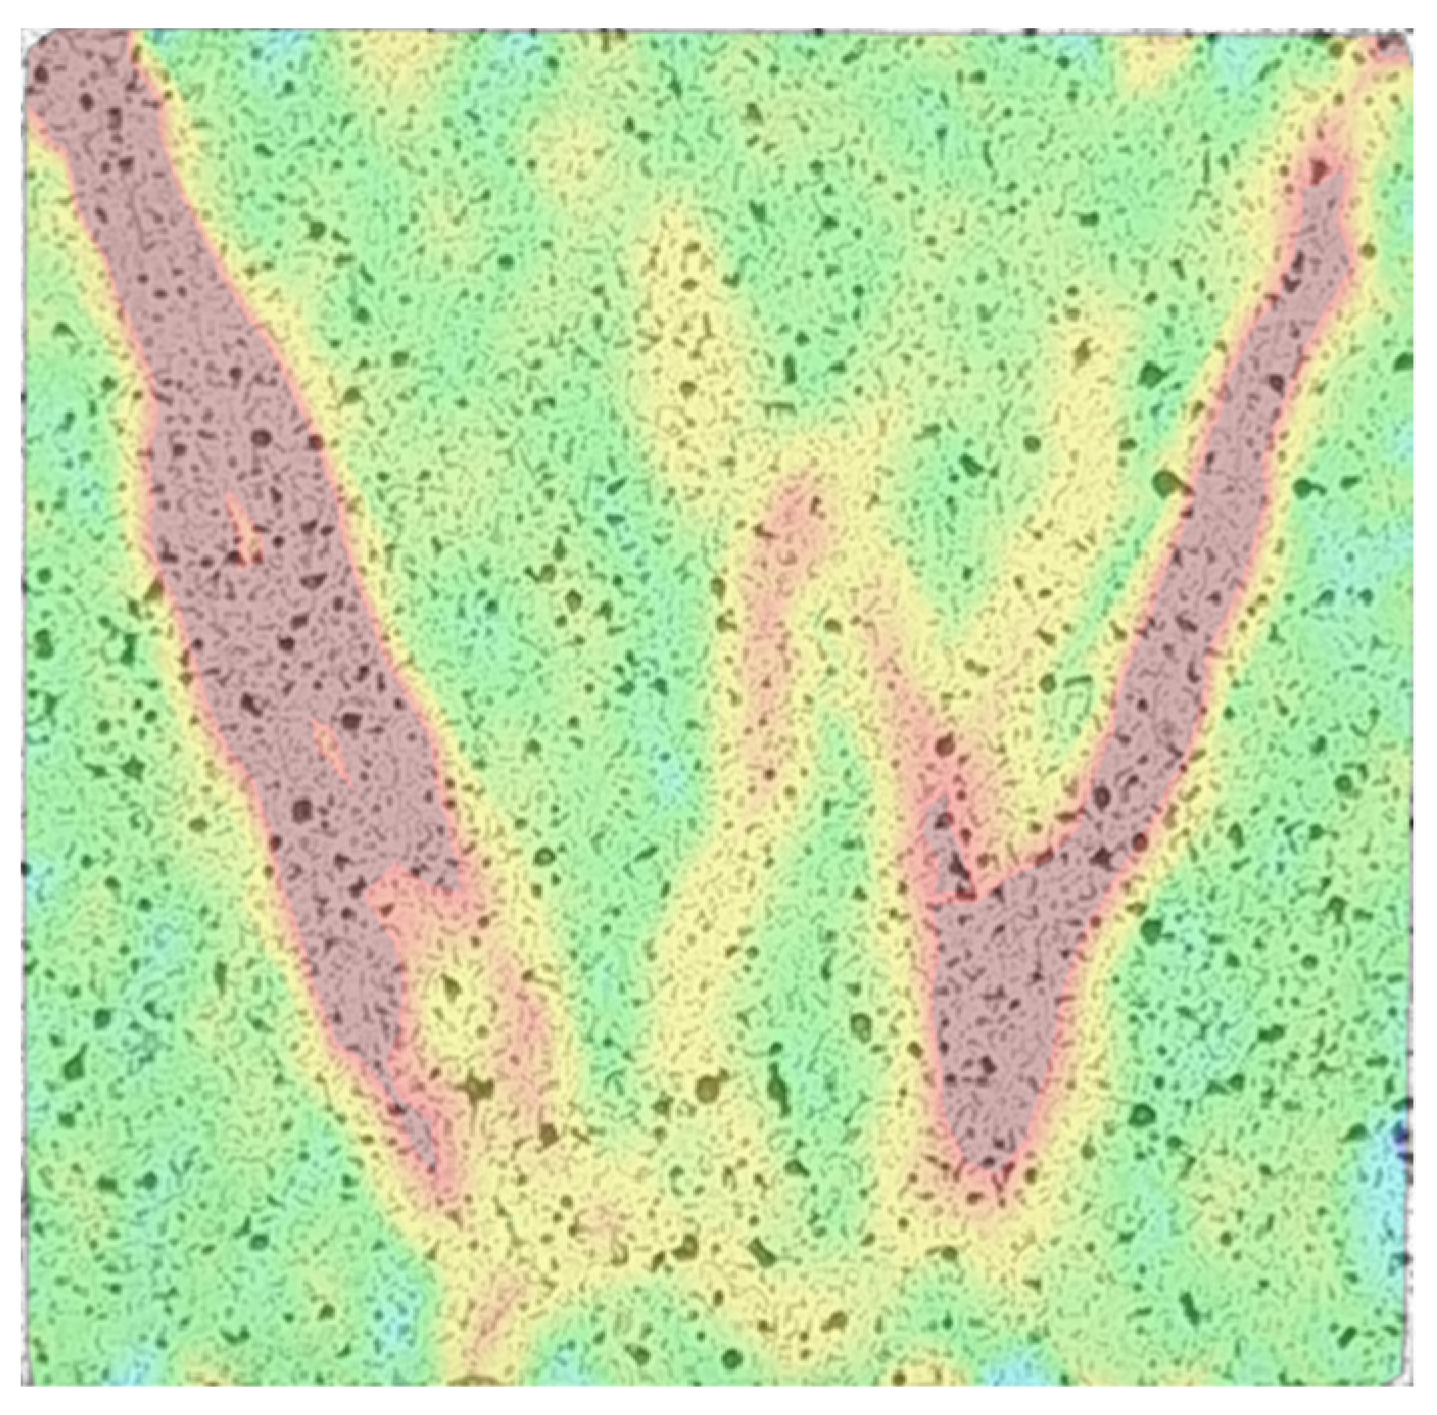
- The stress–strain diagram exhibits the crack patterns of cubic specimens. The FNS-100 specimen has the most interesting crack propagation in which it has a significant influence on the working shear stress, with the result of inclined cracks on the specimen’s surface. In some ways, full FNS substitution produces larger shear-stress-induced cracks than the others. On the contrary, the 50% FNS substitution did not show any major damage on the surface. Additionally, sufficient vertical cracks occurred in the FNS-0 specimen;
- The stiffness of FNS substituted specimens leads to higher values than that for the control specimen. The results show that the 50% and 100% FNS substitution increases the stiffness up to 19% and 5%, respectively. It shows that concrete with FNS has a higher load resistance;
- Poisson’s ratio values obtained herein show a decrease with an increase in FNS replacement. The results show consistent values between the two methods of measurements, DIC and strain gauge, where full FNS concrete produces the lowest Poisson’s ratio, followed by 50% substitution and the control specimen (0% substitution);
- The utilization of Ferronickel Slag fine aggregate in concrete can be an alternative to concrete’s fine aggregate since it shows relatively better mechanical properties than that of usual concrete;
- Further study may be carried out to analyze the effect of FNS against early compressive strength and Ultrasonic Pulse Velocity, as well as the effect of the particle size distribution of FNS against compressive strength.
Author Contributions
Funding
Data Availability Statement
Acknowledgments
Conflicts of Interest
References
- Scrivener, K.L. Options for the Future of Cement. Indian Concr. J. 2014, 88, 11–21. [Google Scholar]
- Sankh, A.C.; Biradar, P.M.; Naghathan, S.J. Recent Trends in Replacement of Natural Sand with Different Alternatives. IOSR J. Mech. Civ. Eng. 2014, ICAET 1, 59–66. [Google Scholar]
- Patra, R.K.; Mukharjee, B.B. Influence of Incorporation of Granulated Blast Furnace Slag as Replacement of Fine Aggregate on Properties of Concrete. J. Clean. Prod. 2017, 165, 468–476. [Google Scholar] [CrossRef]
- Dong, Q.; Wang, G.; Chen, X.; Tan, J.; Gu, X. Recycling of Steel Slag Aggregate in Portland Cement Concrete: An Overview. J. Clean. Prod. 2021, 282, 124447. [Google Scholar] [CrossRef]
- Prithiviraj, C.; Swaminathan, P.; Kumar, D.R.; Murali, G.; Vatin, N.I. Fresh and Hardened Properties of Self-Compacting Concrete Comprising a Copper Slag. Buildings 2022, 12, 965. [Google Scholar] [CrossRef]
- Rohini, I.; Padmapriya, R. Properties of Bacterial Copper Slag Concrete. Buildings 2023, 13, 290. [Google Scholar] [CrossRef]
- Wijaya, R.; Astutiningsih, S. Studi Literatur Potensi Pemanfaatan Terak Nikel (Slag Nikel) sebagai Agregat pada Mortar dan Beton. Bentang 2021, 9, 93–100. [Google Scholar] [CrossRef]
- Johnson, J.; Reck, B.K.; Wang, T.; Graedel, T.E. The Energy Benefit of Stainless Steel Recycling. Energy Policy 2008, 36, 181–192. [Google Scholar] [CrossRef]
- Wijaya, R. Karakteristik Dan Kuat Tekan Mortar Dengan Subtitusi Terak Nikel Sebagai Agregat Halus. Master’s Thesis, Universitas Indonesia, Depok, Indonesia, 2021. [Google Scholar]
- U.S. Geological Survey. Mineral Commodity Summaries 2023; USGS: Washington, DC, USA, 2023. [CrossRef]
- Saha, A.K.; Sarker, P.K. Expansion Due to Alkali-Silica Reaction of Ferronickel Slag Fine Aggregate in OPC and Blended Cement Mortars. Constr. Build. Mater. 2016, 123, 135–142. [Google Scholar] [CrossRef] [Green Version]
- Kemenperin Angkat Potensi Slag Nikel Jadi Bahan Baku Industri. 2020. Available online: https://kemenperin.go.id/artikel/21806/Kemenperin-Angkat-Potensi-Slag-Nikel-Jadi-Bahan-Baku-Industri (accessed on 15 May 2021).
- Saha, A.K.; Sarker, P.K. Sustainable Use of Ferronickel Slag Fine Aggregate and Fly Ash in Structural Concrete: Mechanical Properties and Leaching Study. J. Clean. Prod. 2017, 162, 438–448. [Google Scholar] [CrossRef]
- Saha, A.K.; Sarker, P.K. Compressive Strength of Mortar Containing Ferronickel Slag as Replacement of Natural Sand. Procedia Eng. 2017, 171, 689–694. [Google Scholar] [CrossRef]
- Mustika, W.; Salain, I.M.A.K.; Sudarsana, I.K. Penggunaan Terak Nikel Sebagai Agregat Dalam Campuran Beton. Spektran 2016, 4, 36–45. [Google Scholar] [CrossRef] [Green Version]
- Edwin, R.S.; Ngii, E.; Talanipa, R.; Masud, F.; Sriyani, R. Effect of Nickel Slag as a Sand Replacement in Strength and Workability of Concrete. IOP Conf. Ser. Mater. Sci. Eng. 2019, 615, 012014. [Google Scholar] [CrossRef]
- Ahmad, S.B.; Irmawaty, R.; Aly, S.H.; Amiruddin, A. Performance of Fly Ash Concrete with Nickel Slag Fine Aggregate in the Marine Environment. Civ. Eng. J. 2022, 8, 2803–3814. [Google Scholar] [CrossRef]
- Sun, J.; Feng, J.; Chen, Z. Effect of Ferronickel Slag as Fine Aggregate on Properties of Concrete. Constr. Build. Mater. 2019, 206, 201–209. [Google Scholar] [CrossRef]
- Saha, A.K.; Majhi, S.; Sarker, P.K.; Mukherjee, A.; Siddika, A.; Aslani, F.; Zhuge, Y. Non-Destructive Prediction of Strength of Concrete Made by Lightweight Recycled Aggregates and Nickel Slag. J. Build. Eng. 2021, 33, 101614. [Google Scholar] [CrossRef]
- Szewczyk, P.; Kudyba, P. Effectiveness of Selected Strain and Displacement Measurement Techniques in Civil Engineering. Buildings 2022, 12, 172. [Google Scholar] [CrossRef]
- Bhoopathy, V.; Subramanian, S.S. The Way Forward to Sustain Environmental Quality through Sustainable Sand Mining and the Use of Manufactured Sand as an Alternative to Natural Sand. Environ. Sci. Pollut. Res. 2022, 29, 30793–30801. [Google Scholar] [CrossRef]
- Elavenil, D.S.; Bhoopathy, V. Manufactured Sand, a Solution and An Alternative to River Sand in Concrete Manufacturing. Int. J. Civ. Eng. Res. Dev. (IJCERD) 2013, 3, 7. [Google Scholar]
- ASTM C 192/C 192M; Standard Practice for Making and Curing Concrete Test Specimens in the Laboratory. ASTM International: West Conshohocken, PA, USA, 2002.
- Pan, B.; Qian, K.; Xie, H.; Asundi, A. Two-Dimensional Digital Image Correlation for in-Plane Displacement and Strain Measurement: A Review. Meas. Sci. Technol. 2009, 20, 062001. [Google Scholar] [CrossRef]
- SNI 1974; Cara Uji Kuat Tekan Beton dengan Benda Uji Silinder. Badan Standardisasi Nasional: Jakarta, Indonesia, 2011.
- ASTM C 39; Test Method for Compressive Strength of Cylindrical Concrete Specimens. ASTM International: West Conshohocken, PA, USA, 1999.
- Li, Z.-Q.; Chen, H.; Dong, J.; Yan, X.; Zhao, S.-R.; Zheng, Y.-H.; Liu, Y. Study of the Failure Mechanism of Mortar Rubble Using Digital Image Correlation, Acoustic Emission and Scanning Electron Microscopy. Buildings 2022, 12, 1313. [Google Scholar] [CrossRef]
- Deltanto, A.D.; Handika, N.; Sentosa, B.O.B. Response of Load-Displacement on Cubical Sample of Oil-Palm Shell with Fly Ash Concrete Using Digital Image Correlation System; AIP Publishing LLC: Depok, Indonesia, 2021; p. 040007. [Google Scholar]
- Handika, N. Multi-Cracking of Reinforced Concrete Structures: Image Correlation Analysis and Modelling. Ph.D. Thesis, INSA de Toulouse, Toulouse, France, 2017. [Google Scholar]
- Hongsen, K.; Melhan, M.; Handika, N.; Sentosa, B.O.B. Parameterization of Oil Palm Shell Concrete on Numerical Damage Model Based on Laboratory Experiment Using Digital Image Correlation. J. Phys. Conf. Ser. 2021, 1858, 012029. [Google Scholar] [CrossRef]
- Handika, N.; Norita, B.F.; Tjahjono, E.; Arijoeni, E. Experimental Studies on the Homogeneity and Compressive Strength Prediction of Recycled Aggregate Concrete (RAC) Using Ultrasonic Pulse Velocity (UPV). CSID-JID 2020, 3, 117. [Google Scholar] [CrossRef]
- Jahami, A.; Khatib, J.; Raydan, R. Production of Low-Cost, High-Strength Concrete with Waste Glass as Fine Aggregates Replacement. Buildings 2022, 12, 2168. [Google Scholar] [CrossRef]
- Saha, A.K.; Sarker, P.K.; Majhi, S. Effect of Elevated Temperatures on Concrete Incorporating Ferronickel Slag as Fine Aggregate. Fire Mater. 2019, 43, 8–21. [Google Scholar] [CrossRef] [Green Version]
- Sevim, O.; Alakara, E.H.; Guzelkucuk, S. Fresh and Hardened Properties of Cementitious Composites Incorporating Firebrick Powder from Construction and Demolition Waste. Buildings 2022, 13, 45. [Google Scholar] [CrossRef]
- Neville, A.M.; Brooks, J.J. Concrete Technology, 2nd ed.; Prentice Hall: Harlow, UK, 2010; ISBN 978-0-273-73219-8. [Google Scholar]
- Park, R.; Paulay, T. Reinforced Concrete Structures; J. Wiley & Sons: New York, NY, USA, 1975; ISBN 978-0-471-65917-4. [Google Scholar]
- Belyadi, H.; Fathi, E.; Belyadi, F. Rock Mechanical Properties and in Situ Stresses. In Hydraulic Fracturing in Unconventional Reservoirs; Elsevier: Amsterdam, The Netherlands, 2019; pp. 215–231. ISBN 978-0-12-817665-8. [Google Scholar]


| Properties | 0% FNS | 50% FNS | 100% FNS |
|---|---|---|---|
| Fineness Modulus | 3.17 | 2.72 | 2.73 |
| SSD Specific Gravity | 2.54 | 2.76 | 2.91 |
| Absorption (%) | 1.83 | 1.42 | 0.70 |
| Unit Weight | 1.47 | 1.66 | 1.55 |
| Void (%) | 41.10 | 38.83 | 46.29 |
| Finer Than No. 200 Sieve (%) | 5.80 | 2.80 | 0.90 |
| Properties | Split Stone |
|---|---|
| SSD Specific Gravity | 2.58 |
| Absorption (%) | 1.60 |
| Unit Weight | 1.55 |
| Void (%) | 38.84 |
| Abrasion Loss (%) | 22.23 |
| Component | Percentage (%) | ||
|---|---|---|---|
| Sample 1 | Sample 2 | Average | |
| SiO2 | 46.98 | 46.84 | 46.91 |
| Fe2O3 | 14.88 | 15.31 | 15.10 |
| CaO | 1.39 | 1.45 | 1.42 |
| Cr2O3 | 1.48 | 1.50 | 1.49 |
| Al2O3 | 4.13 | 3.94 | 4.04 |
| MnO | 0.51 | 0.52 | 0.52 |
| P2O5 | 0.46 | 0.49 | 0.48 |
| NiO | 0.08 | 0.09 | 0.09 |
| MgO | 29.39 | 29.17 | 29.28 |
| SO3 | 0.23 | 0.24 | 0.24 |
| Na2O | 0.00 | 0.00 | 0.00 |
| TiO2 | 0.10 | 0.10 | 0.10 |
| K2O | 0.00 | 0.00 | 0.00 |
| Batch | w/c | Water (kg/m3) | OPC (kg/m3) | FNS (kg/m3) | M-Sand (kg/m3) | Split Stone (kg/m3) |
|---|---|---|---|---|---|---|
| FNS-0 | 0.412 | 206 | 501 | 0 | 694 | 992 |
| FNS-50 | 0.412 | 206 | 501 | 347 | 347 | 992 |
| FNS-100 | 0.412 | 206 | 501 | 694 | 0 | 992 |
| Batch | Specimen | Density (g/cm3) | ||
|---|---|---|---|---|
| 7 d | 14 d | 28 d | ||
| FNS-0 | Cylinder | 2.28 (-) * | 2.28 (-) | 2.34 (-) |
| Cube | - | - | 2.28 (-) | |
| FNS-50 | Cylinder | 2.32 (+1.7%) | 2.35 (+3.3%) | 2.42 (+3.4%) |
| Cube | - | - | 2.35 (+3.2%) | |
| FNS-100 | Cylinder | 2.38 (+4.0%) | 2.40 (+5.2%) | 2.39 (+2.3%) |
| Cube | - | - | 2.35 (+3.2%) | |
| Batch | Specimen | Density (g/cm3) | ||
|---|---|---|---|---|
| 7 d | 14 d | 28 d | ||
| FNS-0 | Cylinder | 27.8 (-) * | 29.6 (-) | 34.2 (-) |
| Cube | - | - | 35.5 (-) | |
| FNS-50 | Cylinder | 30.3 (+9.1%) | 32.6 (+10.1%) | 41.4 (+21.1%) |
| Cube | - | - | 40.2 (+13.2%) | |
| FNS-100 | Cylinder | 32.0 (+15.2%) | 31.8 (+7.6%) | 37.0 (+8.0%) |
| Cube | - | - | 40.1 (+12.8%) | |
| Batch | Poisson’s Ratio | |
|---|---|---|
| DIC | Strain Gauge | |
| FNS-0 | 0.24 | 0.27 |
| FNS-50 | 0.22 | 0.22 |
| FNS-100 | 0.22 | 0.20 |
Disclaimer/Publisher’s Note: The statements, opinions and data contained in all publications are solely those of the individual author(s) and contributor(s) and not of MDPI and/or the editor(s). MDPI and/or the editor(s) disclaim responsibility for any injury to people or property resulting from any ideas, methods, instructions or products referred to in the content. |
© 2023 by the authors. Licensee MDPI, Basel, Switzerland. This article is an open access article distributed under the terms and conditions of the Creative Commons Attribution (CC BY) license (https://creativecommons.org/licenses/by/4.0/).
Share and Cite
Ernawan, E.; Sjah, J.; Handika, N.; Astutiningsih, S.; Vincens, E. Mechanical Properties of Concrete Containing Ferronickel Slag as Fine Aggregate Substitute Using Digital Image Correlation Analysis. Buildings 2023, 13, 1463. https://doi.org/10.3390/buildings13061463
Ernawan E, Sjah J, Handika N, Astutiningsih S, Vincens E. Mechanical Properties of Concrete Containing Ferronickel Slag as Fine Aggregate Substitute Using Digital Image Correlation Analysis. Buildings. 2023; 13(6):1463. https://doi.org/10.3390/buildings13061463
Chicago/Turabian StyleErnawan, Eristra, Jessica Sjah, Nuraziz Handika, Sotya Astutiningsih, and Eric Vincens. 2023. "Mechanical Properties of Concrete Containing Ferronickel Slag as Fine Aggregate Substitute Using Digital Image Correlation Analysis" Buildings 13, no. 6: 1463. https://doi.org/10.3390/buildings13061463