Abstract
At present, traditional seismic design methods often ignore the structural damage caused by aftershocks in the evaluation of structural stability. In this paper, seven main aftershock sequences were constructed by using the attenuation method. The incremental dynamic analysis method (IDA) was used to analyze the nonlinear dynamic time history of the aqueduct structure. The main aftershock vulnerability curve of the aqueduct structure was obtained by taking the seismic intensity IM and the maximum ratio of the plastic strain energy to the total strain energy as the structural performance parameter. The analysis results show that the residual displacement of the aqueduct increases by 33%, 66%, 44%, 37%, 0.01%, 60%, and 59%, respectively, under the seven main aftershock sequences. The incremental damage percentages of the aftershock at the end of the period were 9.85%, 15.00%, 26.53%, 2.10%, 0.9%, 35.97%, and 9.85%, respectively. The main aftershock made the damage at the bottom of the arch and the aqueduct more extensive. When the earthquake intensity is 0.3 g, the exceedance probabilities of moderate damage and severe damage are 62.68% and 14.39%, respectively, under the action of the main aftershock sequence. The exceedance probabilities under the action of the main aftershock sequence are 38.52% and 12.08% higher than that of the single main earthquake, respectively.
1. Introduction
Statistics show that strong aftershocks often occur after a main earthquake (strong earthquake) [1,2]. In particular, with the Wenchuan earthquake in 2008, there were 1316 aftershocks, with the largest magnitude of 6.4. After the main earthquake, aftershocks will cause secondary damage to the structure and then lead to serious damage to hydraulic building structures and even dam break. The current research focuses on the vulnerability analysis of aqueducts caused by a single main earthquake [3,4] or strong earthquake, while there are few studies on the vulnerability analysis of aqueducts under the action of the main aftershock sequence. The seismic performance of the aqueduct will be evaluated incorrectly if the aftershock ground motion is ignored. Therefore, it is urgent to study the damage of hydraulic structures under the main aftershock sequence.
For the main aftershock sequence, Japanese scholar Omori [5] was the first to conduct relevant research on the relationship between aftershock attenuation changes over time in Japan’s Nobi earthquake sequence and put forward the famous Omori Law. Subsequently, Gutenberg and Richte [6] proposed Gutenberg–Crit’s law according to the relationship between the occurrence frequency of aftershocks and the magnitude of main shocks, while Bath [7] proposed Barthes’s law according to the attenuation relationship between the magnitude of main shocks and aftershocks. The above laws are the three famous laws in the study of the main aftershock sequence, which have laid a foundation for scholars in the field of seismology to study the relationship between the main shock and aftershock. Subsequently, a large number of scholars have proposed a parameter modification of these three laws [8,9,10,11]. Zhang et al. [12] analyzed the dynamic response of the concrete gravity dam under the action of main aftershocks, and the results showed that the seismic action of aftershocks increased the plastic deformation of the dam body, and the overall damage of the dam body increased by more than 70%. Pan et al. [13] analyzed the seismic performance of a face rockfill dam with a height of 200 m under the action of the main aftershock sequence, and the study showed that aftershocks increased the cumulative damage of the face rockfill dam, and the effect of aftershocks should be considered in the seismic design of the dam. Kong Xianjing et al. [14] studied the law of the aftershock response of the Zipingpu faced rockpile dam that experienced aftershock disasters by combining a numerical simulation with measured aftershock damage record data. Zheng et al. [15] found that after the main aftershock sequence was applied to the nuclear power plant containment, the strong aftershock aggravated the earthquake damage and destruction of the containment structure. Yang Fujian et al. [16] evaluated the cumulative damage impact of the main aftershocks on the concrete frame by taking the damage energy dissipation of the dam body as the index. In a long period of time, according to the seismic fortification standards of dam area sites, scholars mostly adopted the seismic design codes based on bearing capacity [17]. However, with the deepening of earthquake cognition, the traditional seismic design codes could no longer meet the people’s requirements for property safety. Therefore, the performance-based seismic design concept gradually came into the view of scholars [18]. When most scholars analyze the vulnerability of the frame structure [19], water intake tower [20], and gravity dam [21], they often use the interstory displacement angle, displacement ductility, and displacement as structural performance indicators to reflect the damage state of the building. When the structure aside from the dam is subjected to seismic waves with a long duration and large ground motion intensity, the above traditional structural performance parameters cannot reflect the damage state of the dam well, so it is very important to select a reasonable structural performance index to reflect the damage of the dam quantitatively during the earthquake. If the energy angle is used as the structural performance index, the deficiency in this aspect will be supplemented. Hao Jianguo et al. [22] analyzed the vulnerability of gravity dams based on incremental dynamic analysis (IDA) and proposed that the ratio of the structural performance parameter plastic energy dissipation to total deformation energy and the normal service limit state corresponding to the maximum relative displacement are close to each other, and when the peak acceleration is large, If the maximum relative displacement is taken as the structural performance index, the peak ground acceleration corresponding to the maximum relative displacement is much larger than the ratio of the plastic energy dissipation to the total deformation energy as the structural performance index. If the maximum relative displacement is taken as the performance index, the safety of the dam body cannot be guaranteed. Therefore, the ratio of the plastic energy dissipation to the total deformation energy is used as the structural performance index, and the seismic performance safety factor of the gravity dam is higher. Based on the incremental dynamic analysis of an earthquake, Alembagheri M. et al. [23,24] introduced the uncertainty of the material and seismic load to evaluate the seismic performance of gravity dams. Liu Ping et al. [25] studied the structural vulnerability of high-strength concrete frame structures under the combined action of main shocks and aftershocks by taking the interstory displacement angle as the structural performance requirement parameter of the incremental dynamic analysis (IDA) curve, and the results showed that aftershocks had a great impact on structural damage and could not be ignored. Most of the above scholars focus on the study of structural seismic performance under the action of traditional structural performance indexes and a single main earthquake, often ignoring the limitations of traditional structural performance indexes and the impact of aftershocks on the safety and stability of structures in the real earthquake process, resulting in the conservative evaluation of structural seismic performance. Therefore, it is necessary to use the ratio of the plastic energy dissipation to the total deformation energy as a new structural performance index to study the seismic performance of aqueducts under the main aftershock sequence.
In view of the shortcomings of traditional structural performance indexes and the single main earthquake in structural seismic performance evaluation, and based on incremental dynamic analysis (IDA), the influence of main aftershocks on the dynamic incremental response behavior of aqueducts is fully studied from the structural dynamic response angles of damage, relative displacement, and the damage energy dissipation of the dam body, as well as from the vulnerability angle of the structural performance parameter of ground motion intensity IM and the maximum ratio of plastic strain energy to total strain energy . This provides a scientific basis and reliable performance parameters for the aqueduct structure for related research.
2. Incremental Dynamic Analysis (IDA)
2.1. IDA Method and Vulnerability Probability Model
The incremental dynamic analysis (IDA) method consists of applying multiple ground motions of different intensities to the structure as loads to avoid the randomness brought by ground motions while forcing the failure probability of the structure to reach or exceed the specific limit state. It is usually necessary to conduct a series of amplitude modulations for ground motion, forcing the structure to go through the whole process from the elastic stage, plastic stage, and post-peak failure stage and correctly reflecting the nonlinear behavior of the structure to reflect the relationship curve of the ground motion intensity parameter (IM) and the structure performance parameter (DM), namely the IDA curve. Its vulnerability probability model is shown as follows:
where is the probability of structure failure; D is the structural dynamic response; C is the structural resistance that reaches a specific failure level of the structure; IM is the ground motion intensity parameter; DM represents the structural performance parameters; and x is the specific ground motion intensity.
Assuming that the ground motion intensity index IM and structural damage index DM obey a lognormal distribution, the relationship between the structural response D and ground motion intensity I is as follows:
Then, the logarithm of both sides of the above equation can be taken at the same time to obtain the probability demand formula, as shown below:
In the formula, a and b are regression coefficients, which can be obtained by linear regression fitting according to the analysis results.
The structural performance parameter DM selected in this paper is the maximum ratio between the plastic strain energy and total strain energy, so the damage probability function can be expressed as:
where is the logarithmic standard deviation of the resistance capability of the engineering structure; is the logarithmic standard deviation of the seismic demand of the engineering structure. When IM is PGA, is preferable [26].
2.2. Selection of Structural Performance Indicators
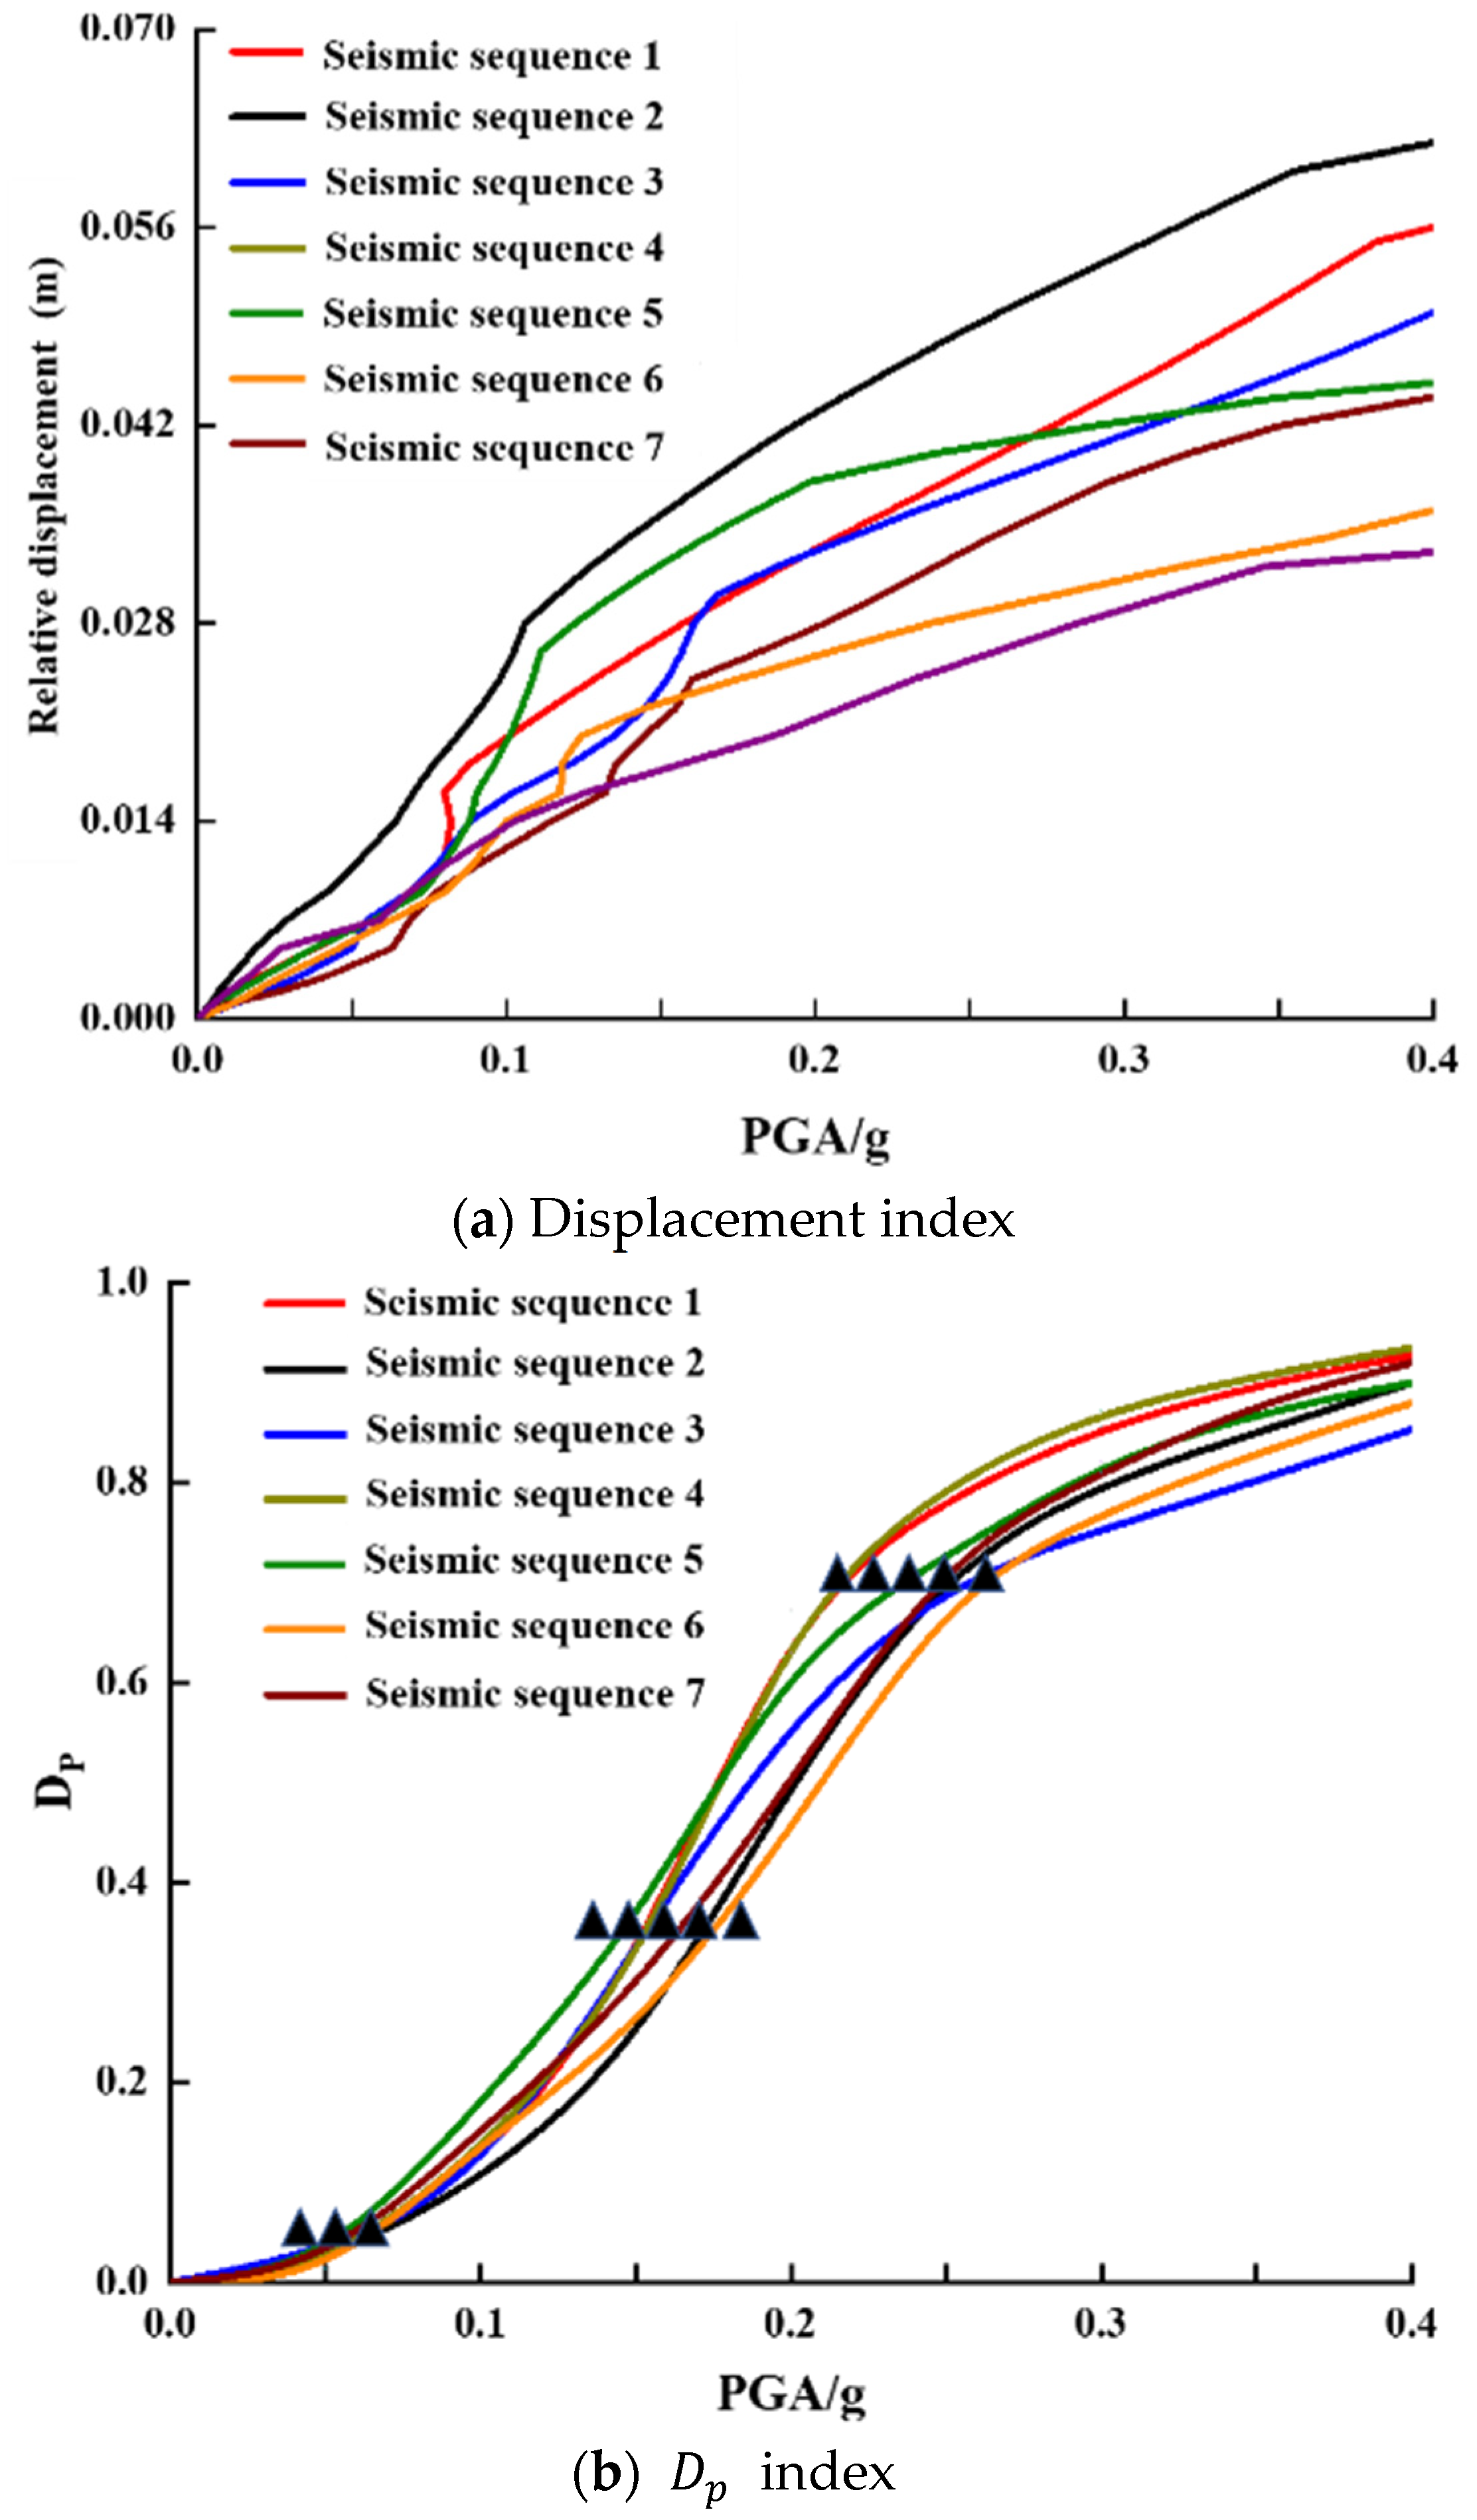
Due to the strong discreteness and randomness of the ground motion of the main aftershock sequence, the results of the curve obtained by incremental dynamic analysis (IDA) have a strong divergence. In order to obtain the structural performance parameter DM with higher reliability, the maximum relative displacement and the maximum ratio of the plastic strain energy to total strain energy were compared and analyzed as the discrete degrees of different results of structural performance parameters, and IDA curves that fit the incremental dynamic analysis were selected. The formula is as follows.
The dynamic balance equation in the earthquake process is as follows:
where is the kinetic energy; is the damping dissipated energy; is the total deformation energy of the system; is the earthquake input energy; and is the static work done before the seismic load.
where is the damage at time T; is the recovery stress; is the elastic strain energy; is the damage energy dissipation; and is the plastic energy dissipation of the dam body.
, which is the maximum value of the ratio between the plastic energy dissipation and the total deformation energy of the dam body in the seismic process, is selected as DM in this paper.
is the maximum energy dissipation ratio between plastic deformation and the total deformation of the dam body during the earthquake; is the energy dissipation of the plastic deformation of the dam body; and is the total deformation energy.
As can be seen from Figure 1a, the IDA curve cluster with the maximum relative displacement as the index presents a large discreteness. Under the action of high-intensity earthquakes, due to the characteristics of ground motion waves, especially for the main aftershock sequence, the difference of ground motion characteristics gradually becomes prominent, which leads to the continuous amplification of the dynamic response effect of the structure, and thus the dispersion degree of the IDA curve becomes stronger.
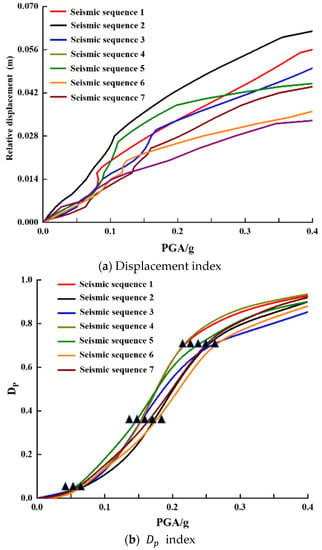
Figure 1.
IDA curve clusters of different DMs based on incremental dynamic analysis.
However, in Figure 1b, the IDA curve with as the performance indicator has a low degree of variation and does not show strong illinearity within the entire range of seismic intensity. Therefore, the performance requirement parameters of the aqueduct structure are selected as the indicators for calculation in this paper.
2.3. Determination and Division of Failure Grade Index
In Figure 1b, there are three obvious inflection points in the incremental dynamic analysis (IDA) curve with as the performance parameter. The peak acceleration corresponding to the inflection point is 0.05 g, 0.15 g, and 0.25 g, respectively. The corresponding interval is roughly between [0.7, 0.9], [0.4, 0.6], and [0, 0.05]. Especially when 0.3 g < PGA < 0.7 g, the decline rate of the curve section drops exponentially, indicating that the damage degree of the aqueduct body increases sharply within this acceleration range. In addition, the value decreases with the increase of peak ground acceleration, indicating that the contribution of elastic strain energy inside the aqueduct decreases gradually, indicating that the aqueduct has an increasing ability to produce unrecoverable deformation, that is, the aqueduct has a large residual deformation. In this paper, it is suggested that 0.025, 0.5, and 0.8 of the structural performance parameters should be taken as the three failure performance grades of the aqueduct, namely slight failure, moderate failure, and severe failure. The level of three-level performance division is shown in Table 1.

Table 1.
Failure performance classification.
3. Finite Element Model and Calculation Parameters
3.1. Finite Element Model Information of Aqueduct
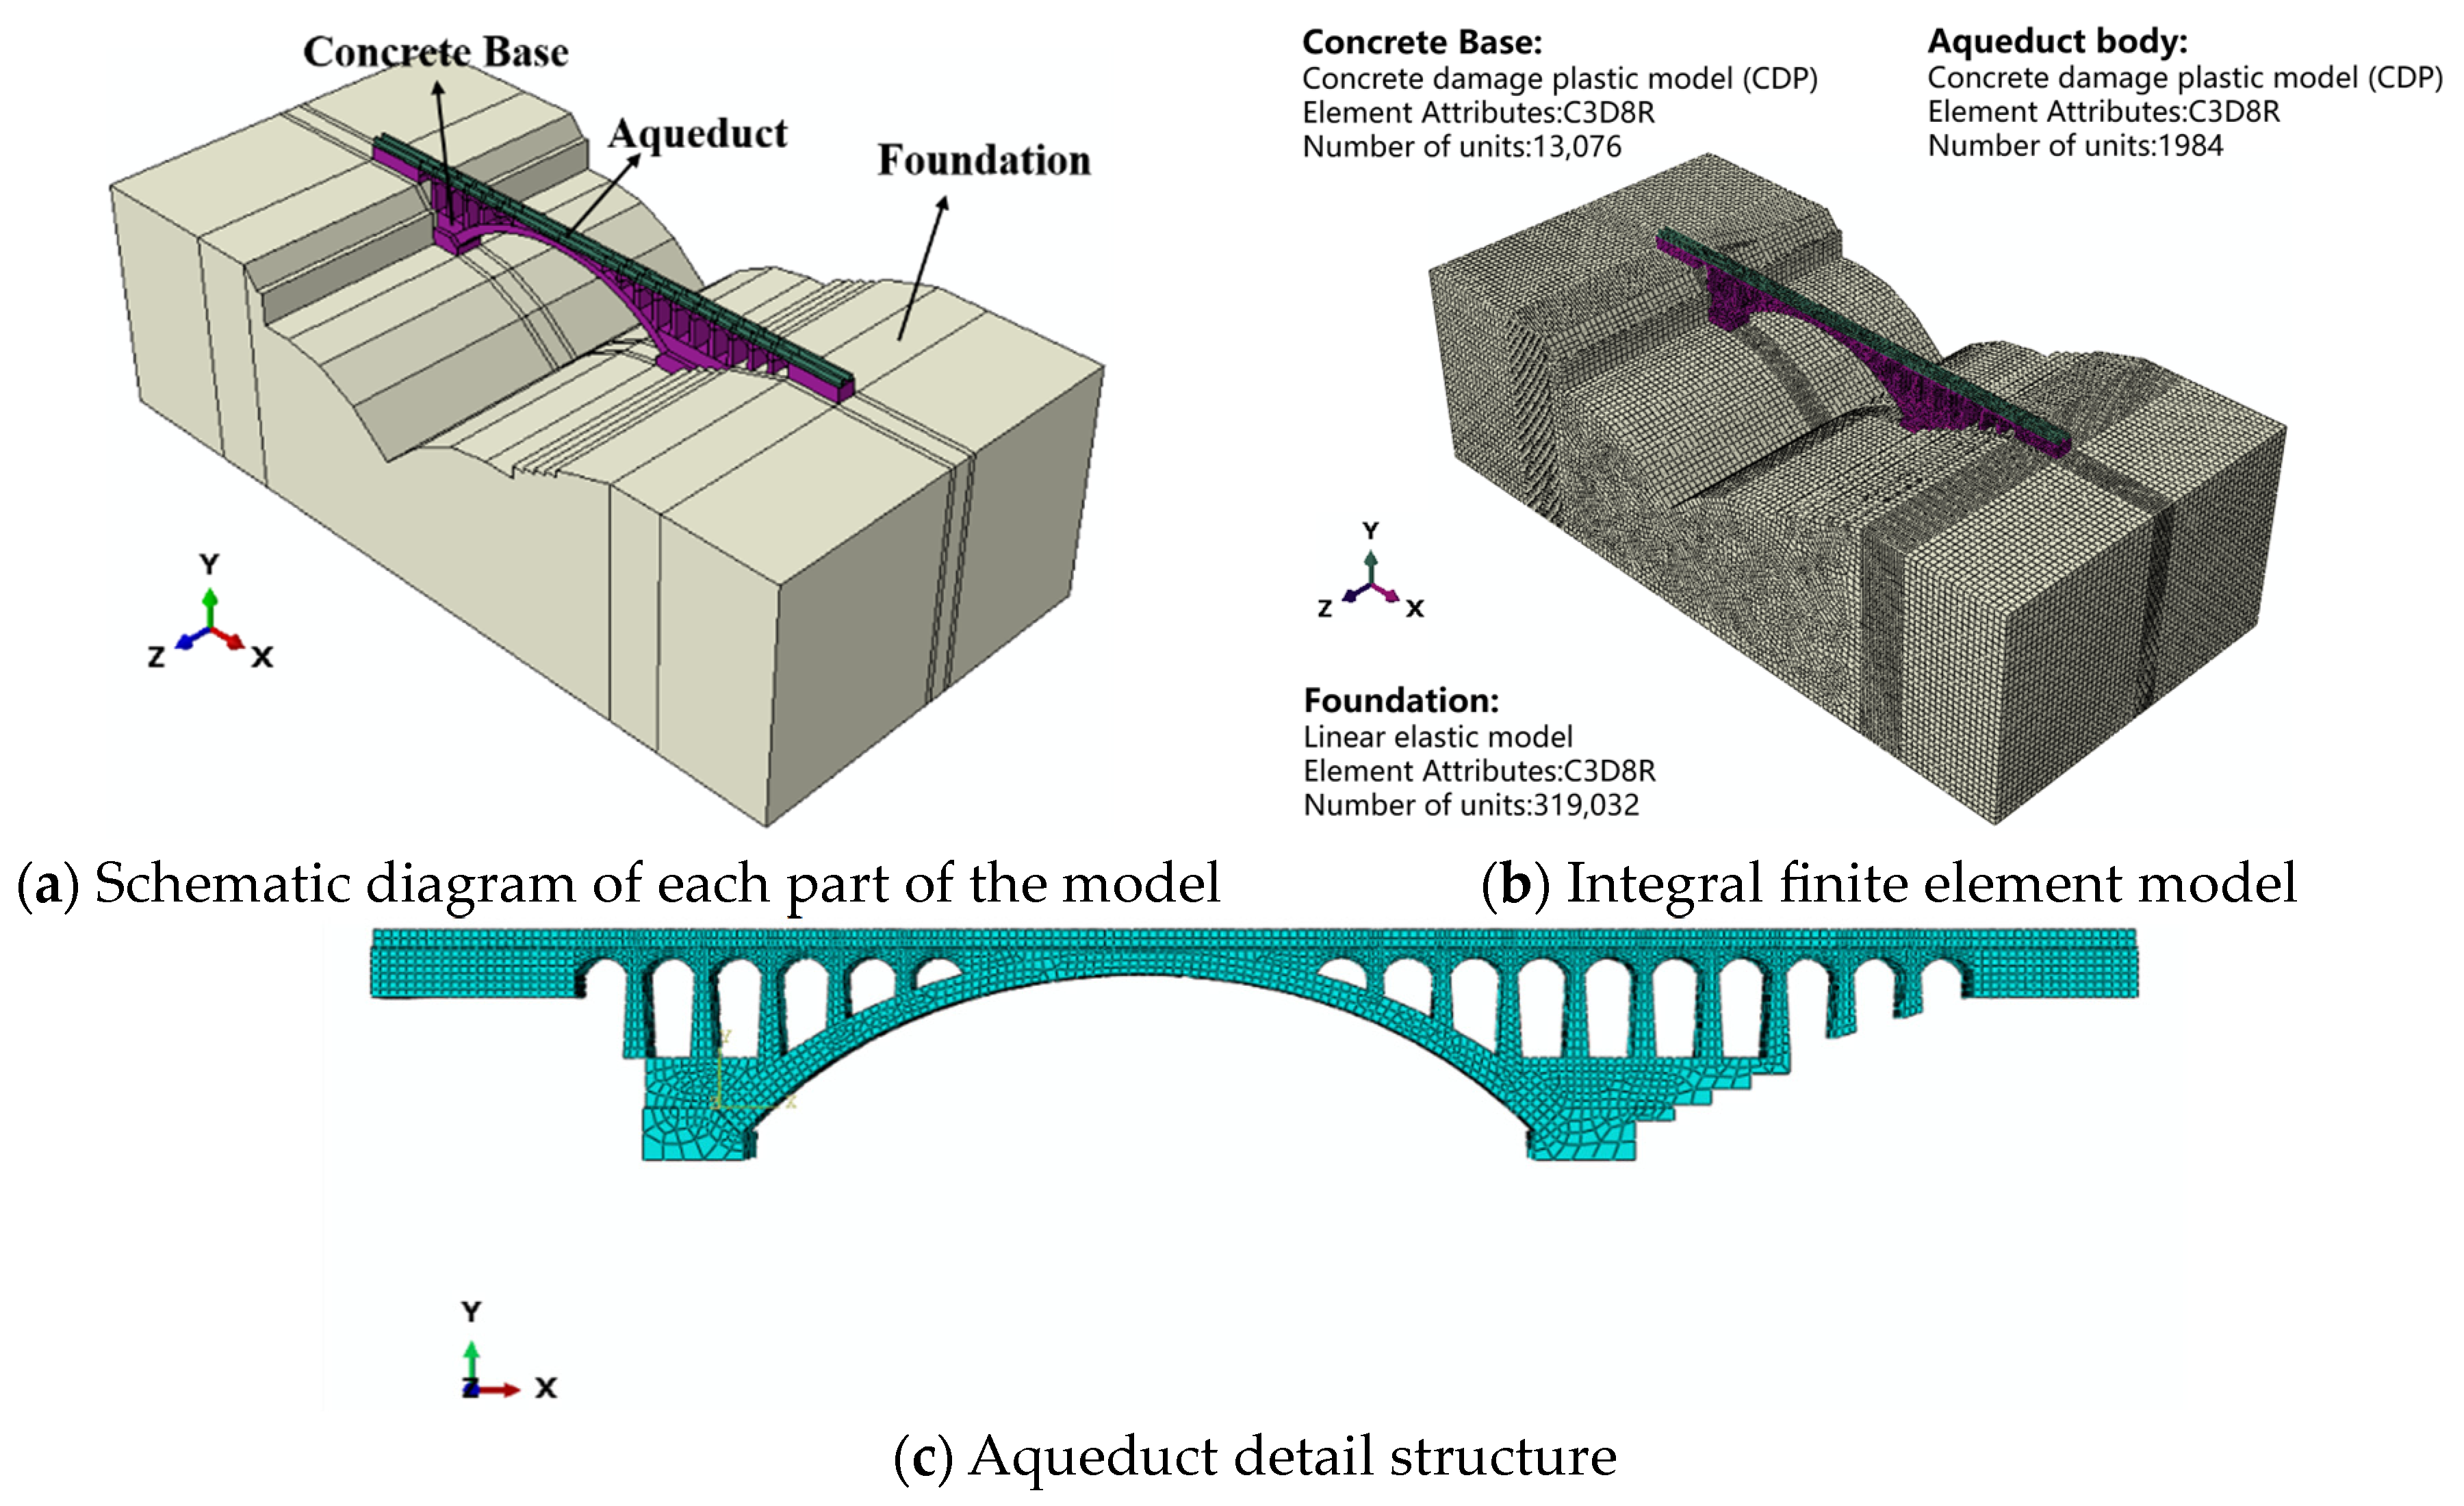
In this paper, the Taihang Aqueduct in Xingtai City, Hebei Province, is selected to establish a three-dimensional finite element model of the aqueduct by ABAQUS, as shown in Figure 2. The X-axis of the coordinate system is the vertical flow direction, the Y-axis is the downstream flow direction, and the Z-axis is the vertical upward direction. The aqueduct extends around the foundation about 1.5 times the height, with a span of 101 m, a total length of 200 m, and a height of 53 m. The main arch is a hollow variable section catchain hingeless arch with 16 holes and 6 m of single hole and span. The channel wall is 2.3 m high, 1 m thick, 2 m deep, and 2.2 m wide. The whole model is simulated by a three-dimensional reduction integral C3D8R unit, with a total of 357,330 nodes and 334,092 units. Since the aqueduct mainly takes the bearing water as its working attribute, the coupling effect between the water body and structure cannot be ignored. Therefore, Westergaard’s additional mass method is adopted in this paper to simulate the hydrodynamic pressure in the aqueduct. The concrete damage plastic (CDP) constitutive model is adopted for the aqueduct body and its supporting structure. The specific material properties are shown in Table 2. After the material enters the plastic damage, the elastic model becomes smaller with the increase in the damage factor due to the damage caused by the material. The calculation formula is as follows.
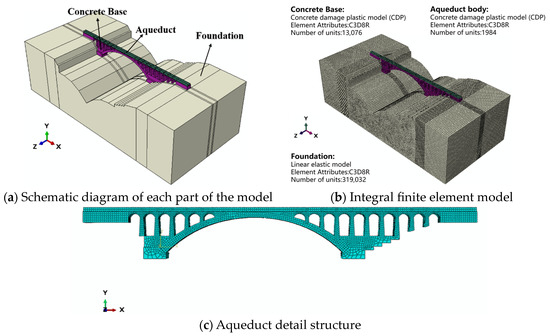
Figure 2.
Finite element model and detailed structure diagram.

Table 2.
Values of structural material parameters of each part of the aqueduct.
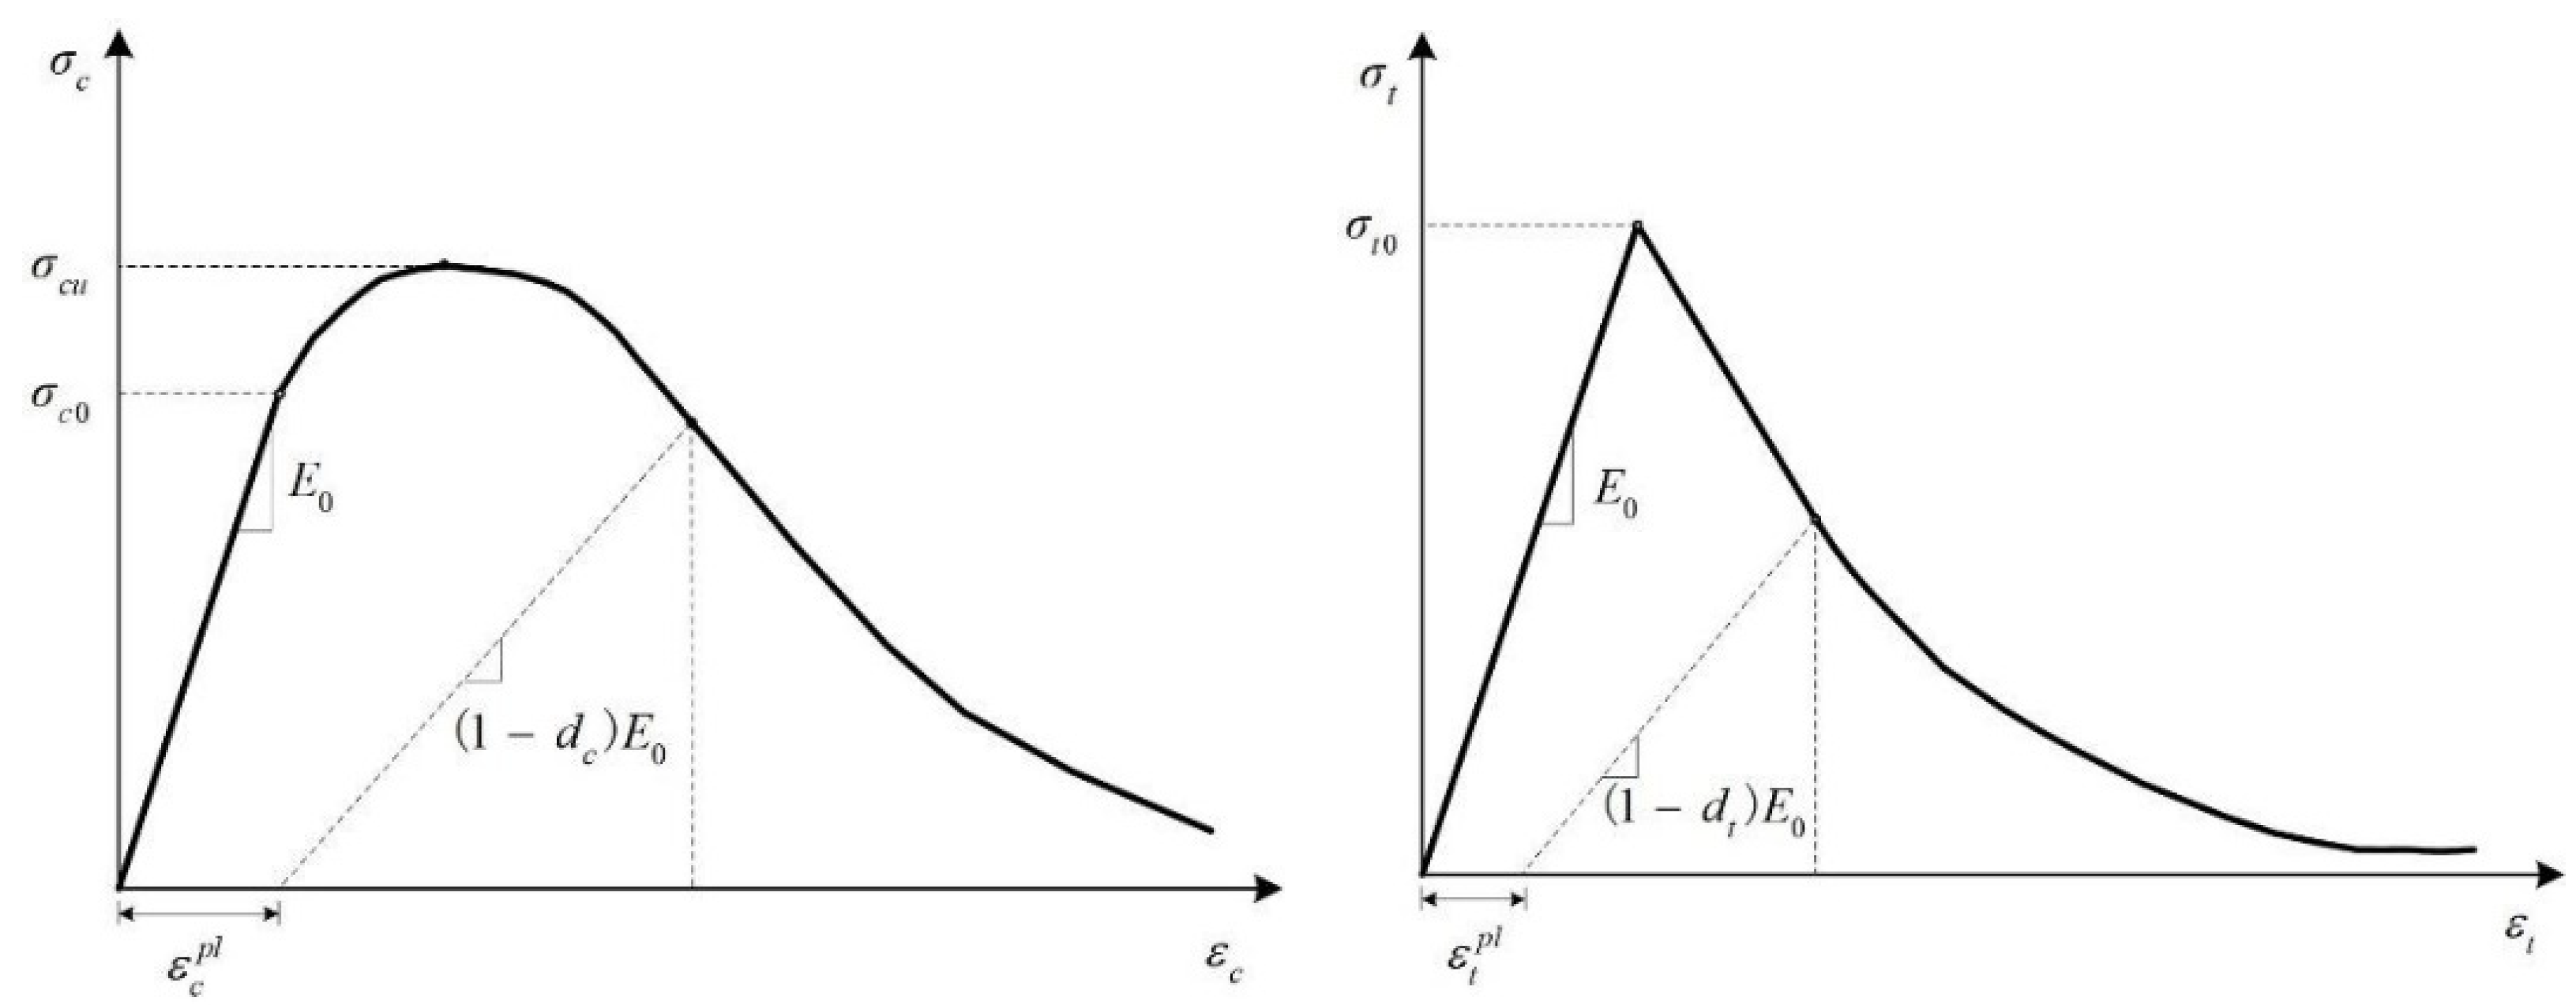
In the formula, represents the initial elastic modulus, and d represents the compressive or tensile damage factor, and its value is between 0 and 1. A value of 0 represents no damage, and 1 represents complete damage. The uniaxial compressive and tensile stress–strain curves of concrete damage plasticity calculated in ABAQUS are shown in Figure 3, and the specific calculation process can be referred to the Code for Design of concrete structures (GB50010-2010).
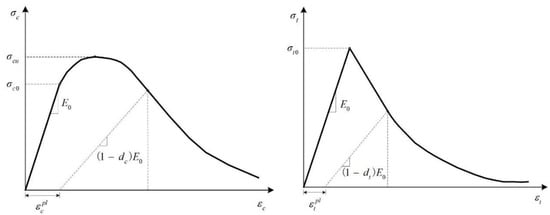
Figure 3.
Plastic compressive and tensile stress–strain curves of concrete damage (compressive curve on the left and tensile curve on the right).
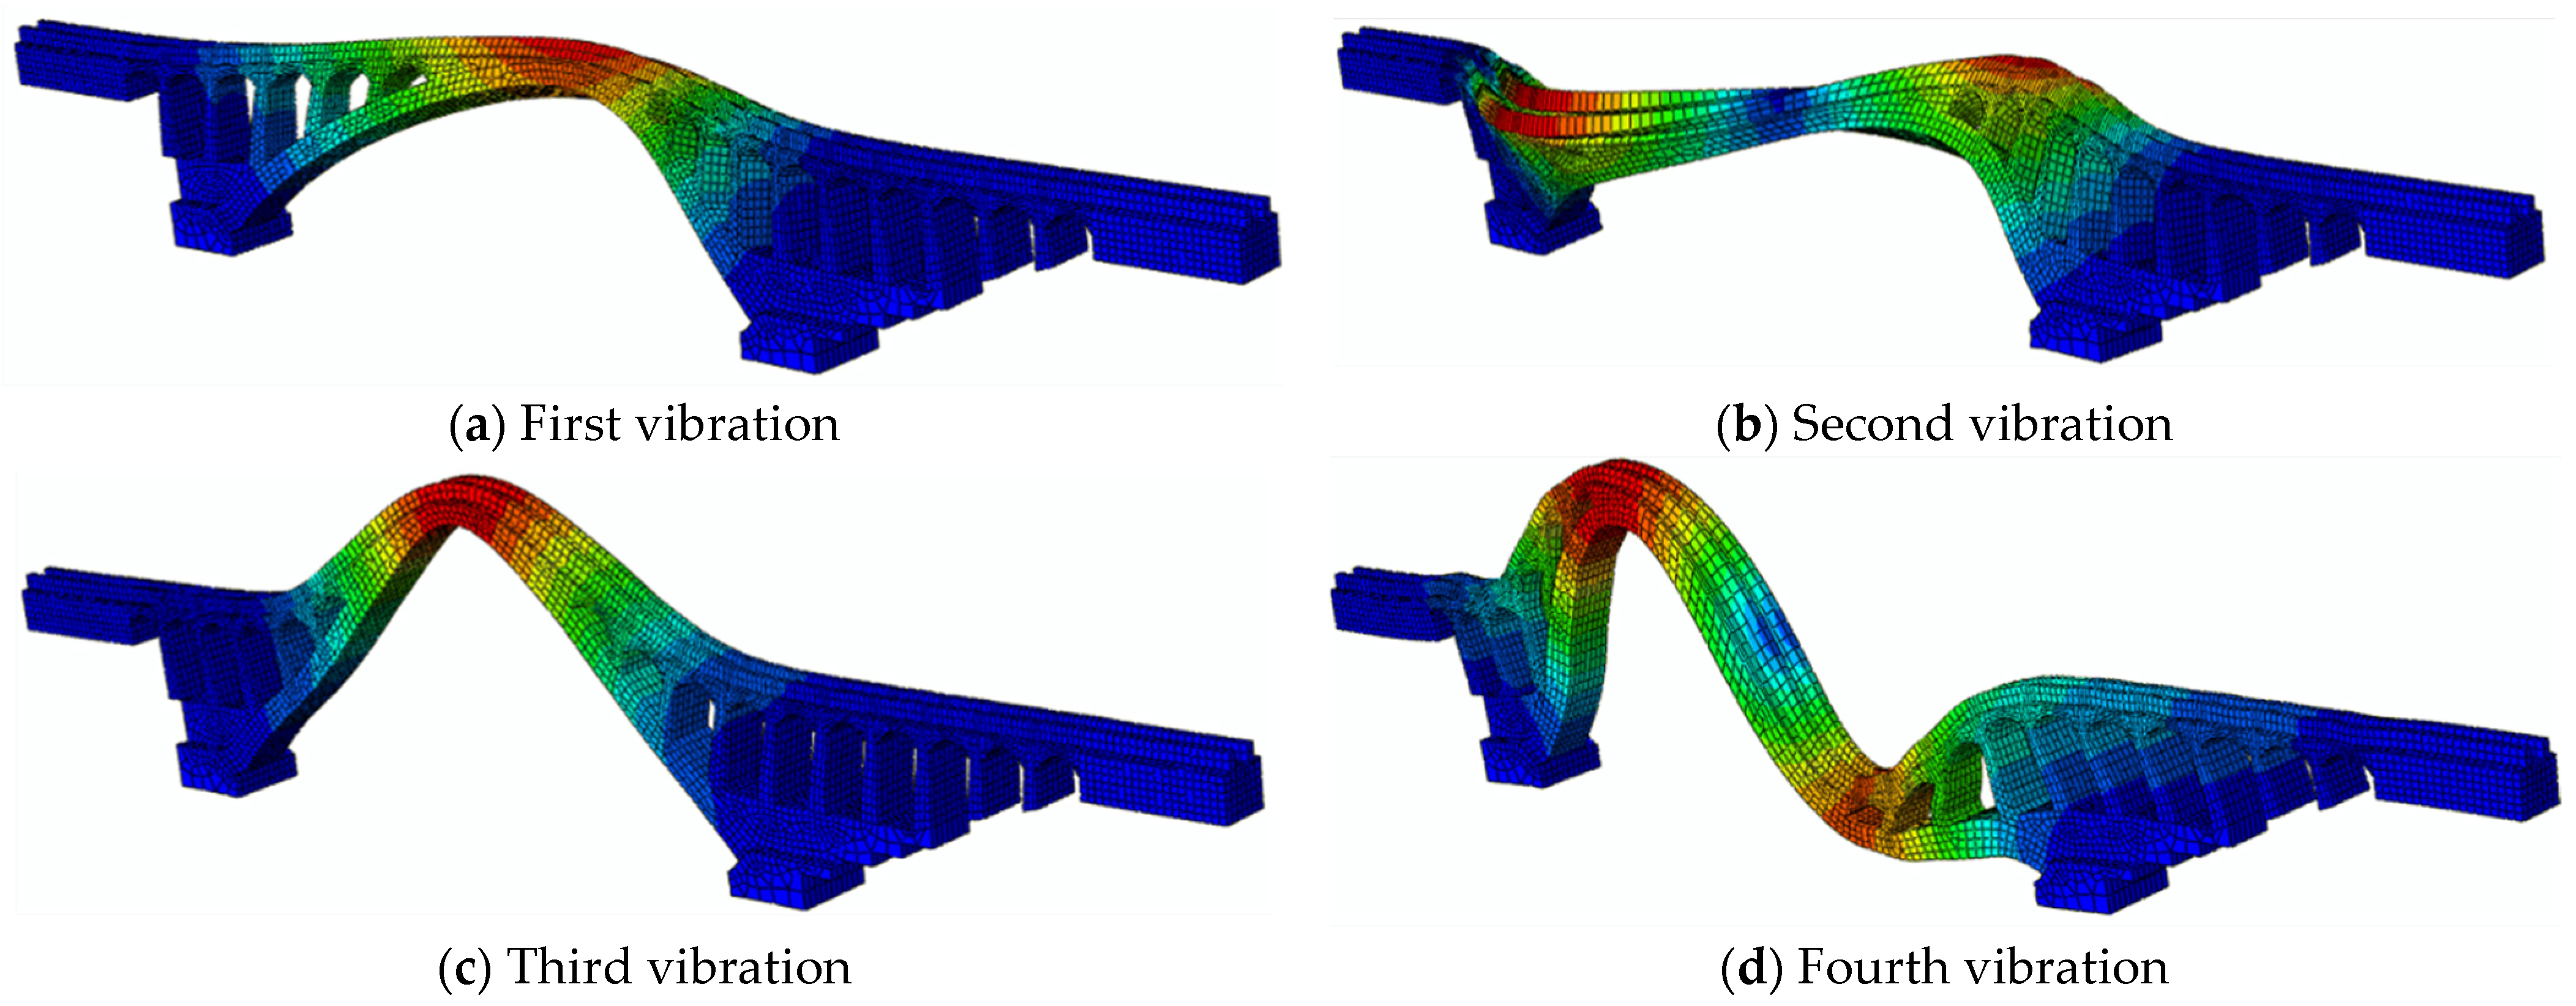
In order to verify the accuracy of the model, the foundation was set as a mass-free foundation model during the frequency spontaneous vibration analysis. A total of 10 modes were calculated, and the frequencies of each order were 0.929, 2.041, 2.920, 3.082, 3.202, 4.075, 4.383, 4.544, 4.810, and 4.833. The first four mode shapes were taken as the simulation results for law analysis. As shown in Figure 4, it can be seen from the figure that the mode shape results of odd orders of the first and third orders are symmetrical modes along the axis of symmetry along the bottom of the valley, while the mode shape results of even orders of the second and fourth orders are antisymmetric modes. This result is consistent with the mode shape effect of arch dams in hydraulic structures and conforms to the law of dynamic motion.
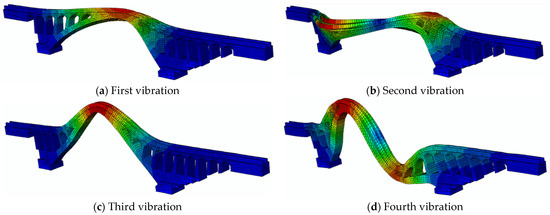
Figure 4.
Natural frequency model of aqueduct.
3.2. Selection and Structure of Main Aftershock Sequence Ground Motion
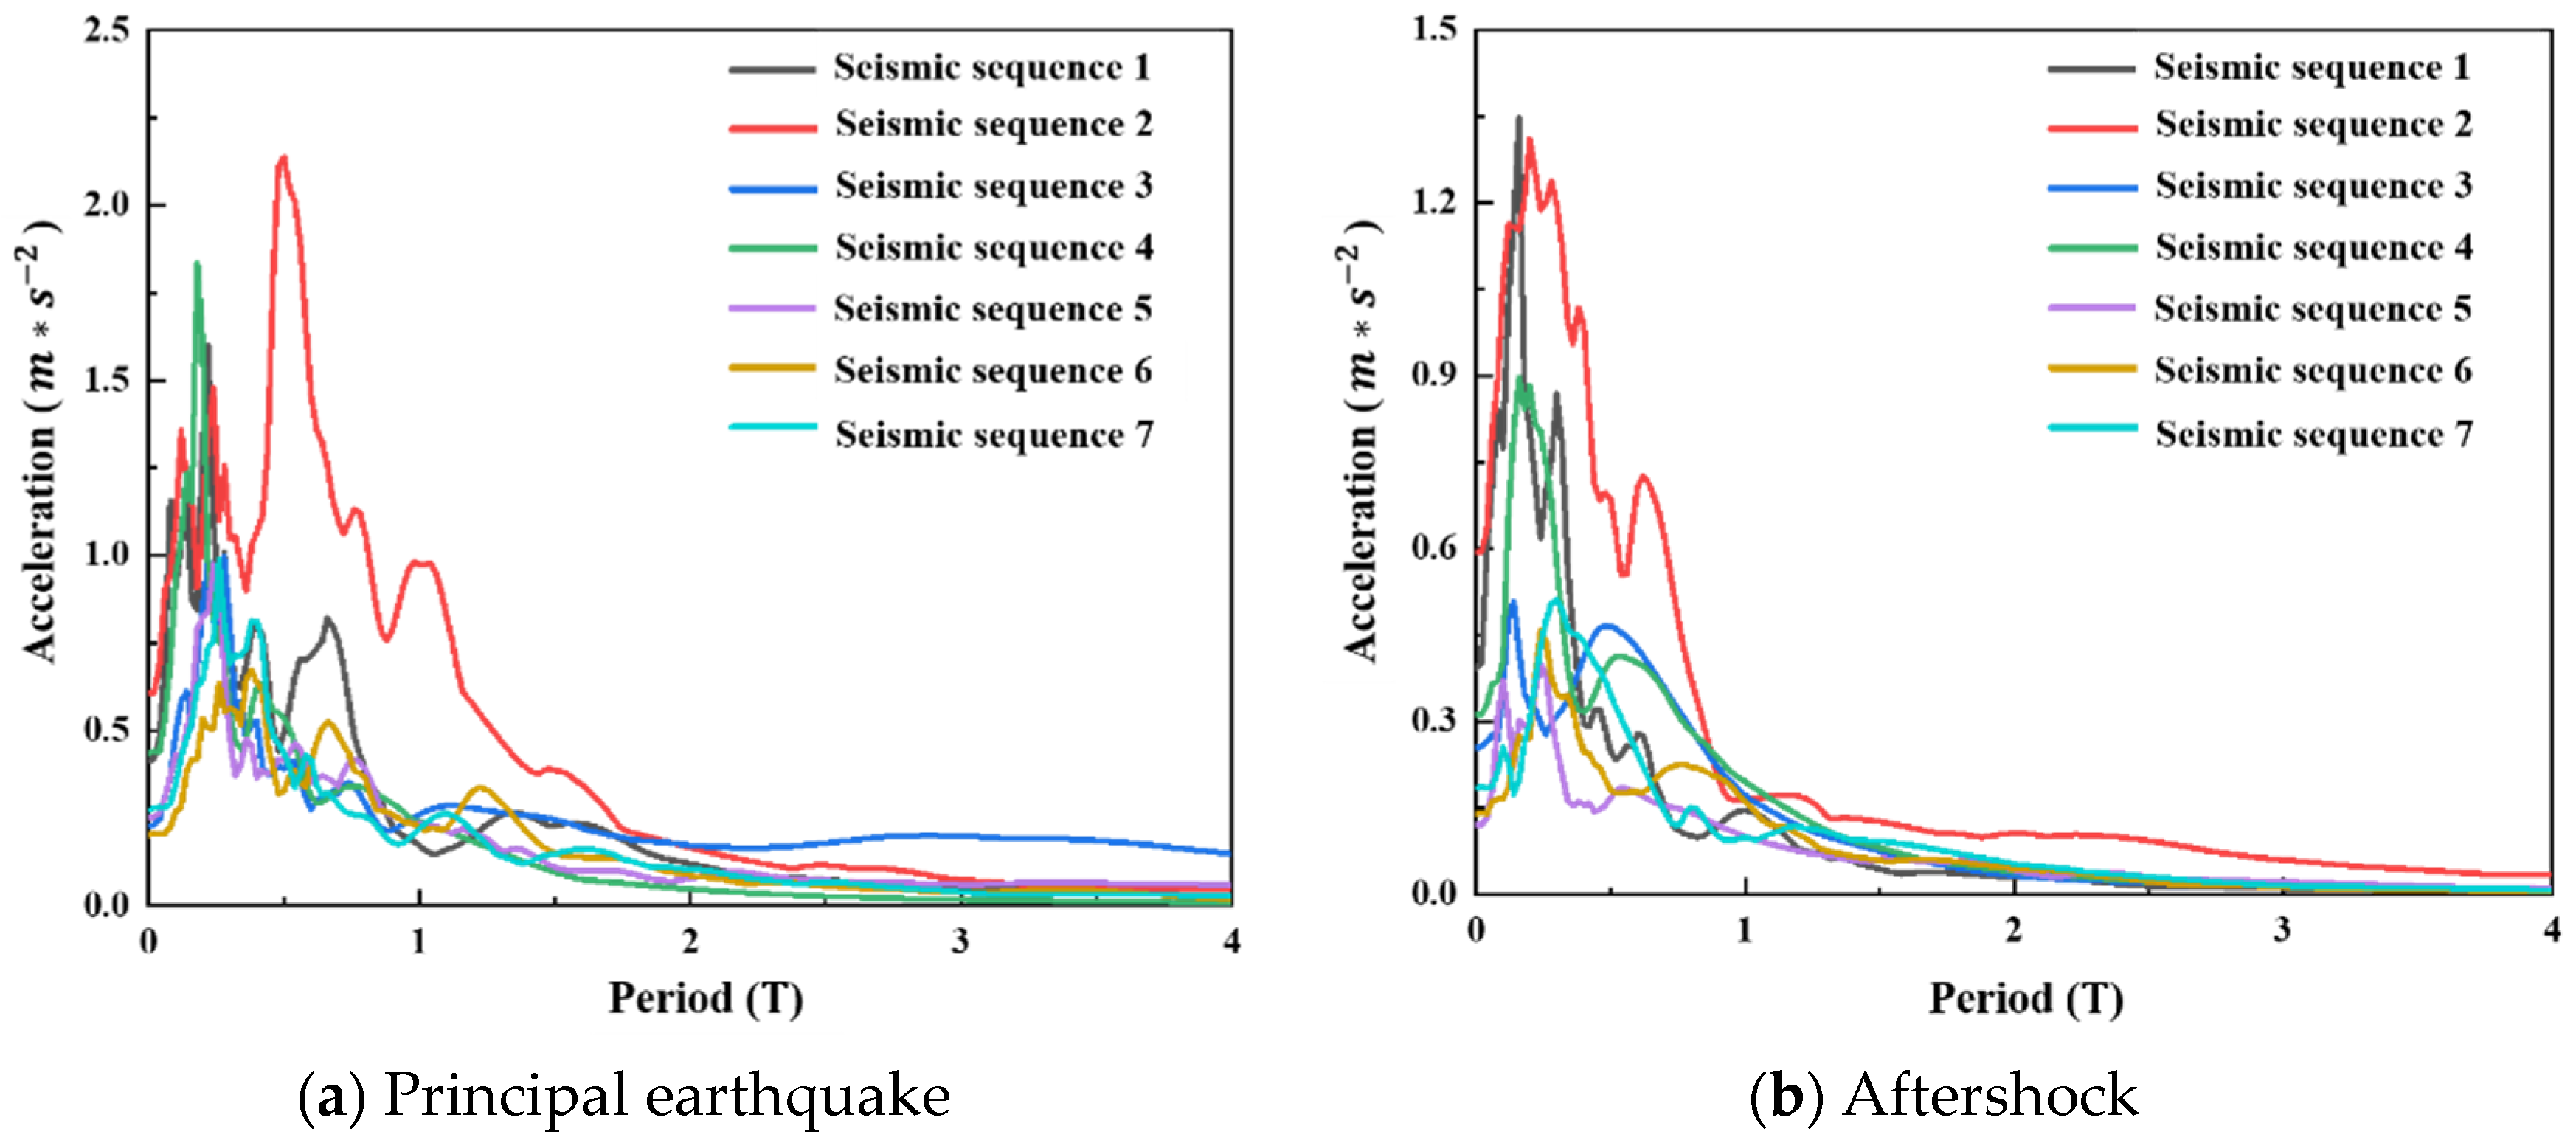
In order to analyze the dynamic damage response of the aqueduct, this paper selects seven major aftershock ground motion records from the database of the Pacific Earthquake Research Center and uses the multi-factor structure method in the major aftershock sequence of the seismic attenuation method [27,28,29] to construct the seismic sequence by considering the comprehensive factors, such as earthquake magnitude, site conditions, and epicenter distance. The magnitude of the main shock and the aftershock is not less than five; each major aftershock sequence came from the same station. The detailed information of the ground motion is shown in Table 3, and the response spectrum of the main shock and aftershock calculated by the SeismoSignal 2018 software with a damping ratio of 5% is shown in Figure 5.

Table 3.
Main aftershock sequence information table.
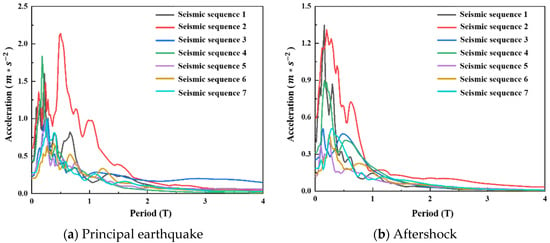
Figure 5.
Main aftershock response spectrum ((a) is main shock response spectrum, (b) is aftershock response spectrum).
Before the nonlinear dynamic time history analysis, a safe transition period of 10 s should be set between the main shock and the aftershock in order to keep the structure in a balanced static position after the main shock. In this paper, seven major aftershock seismic waves were still selected for incremental dynamic analysis of the aqueduct structure. The amplitude modulation range of the ground motion is 0.05–0.4 g step by step loading, and the increase of the dynamic time history analysis of each stage is 0.05 g. A total of 56 nonlinear time history analyses were carried out.
4. Results and Analysis
4.1. Dynamic Response of Aqueduct under Main Aftershock Sequence
4.1.1. Displacement Analysis
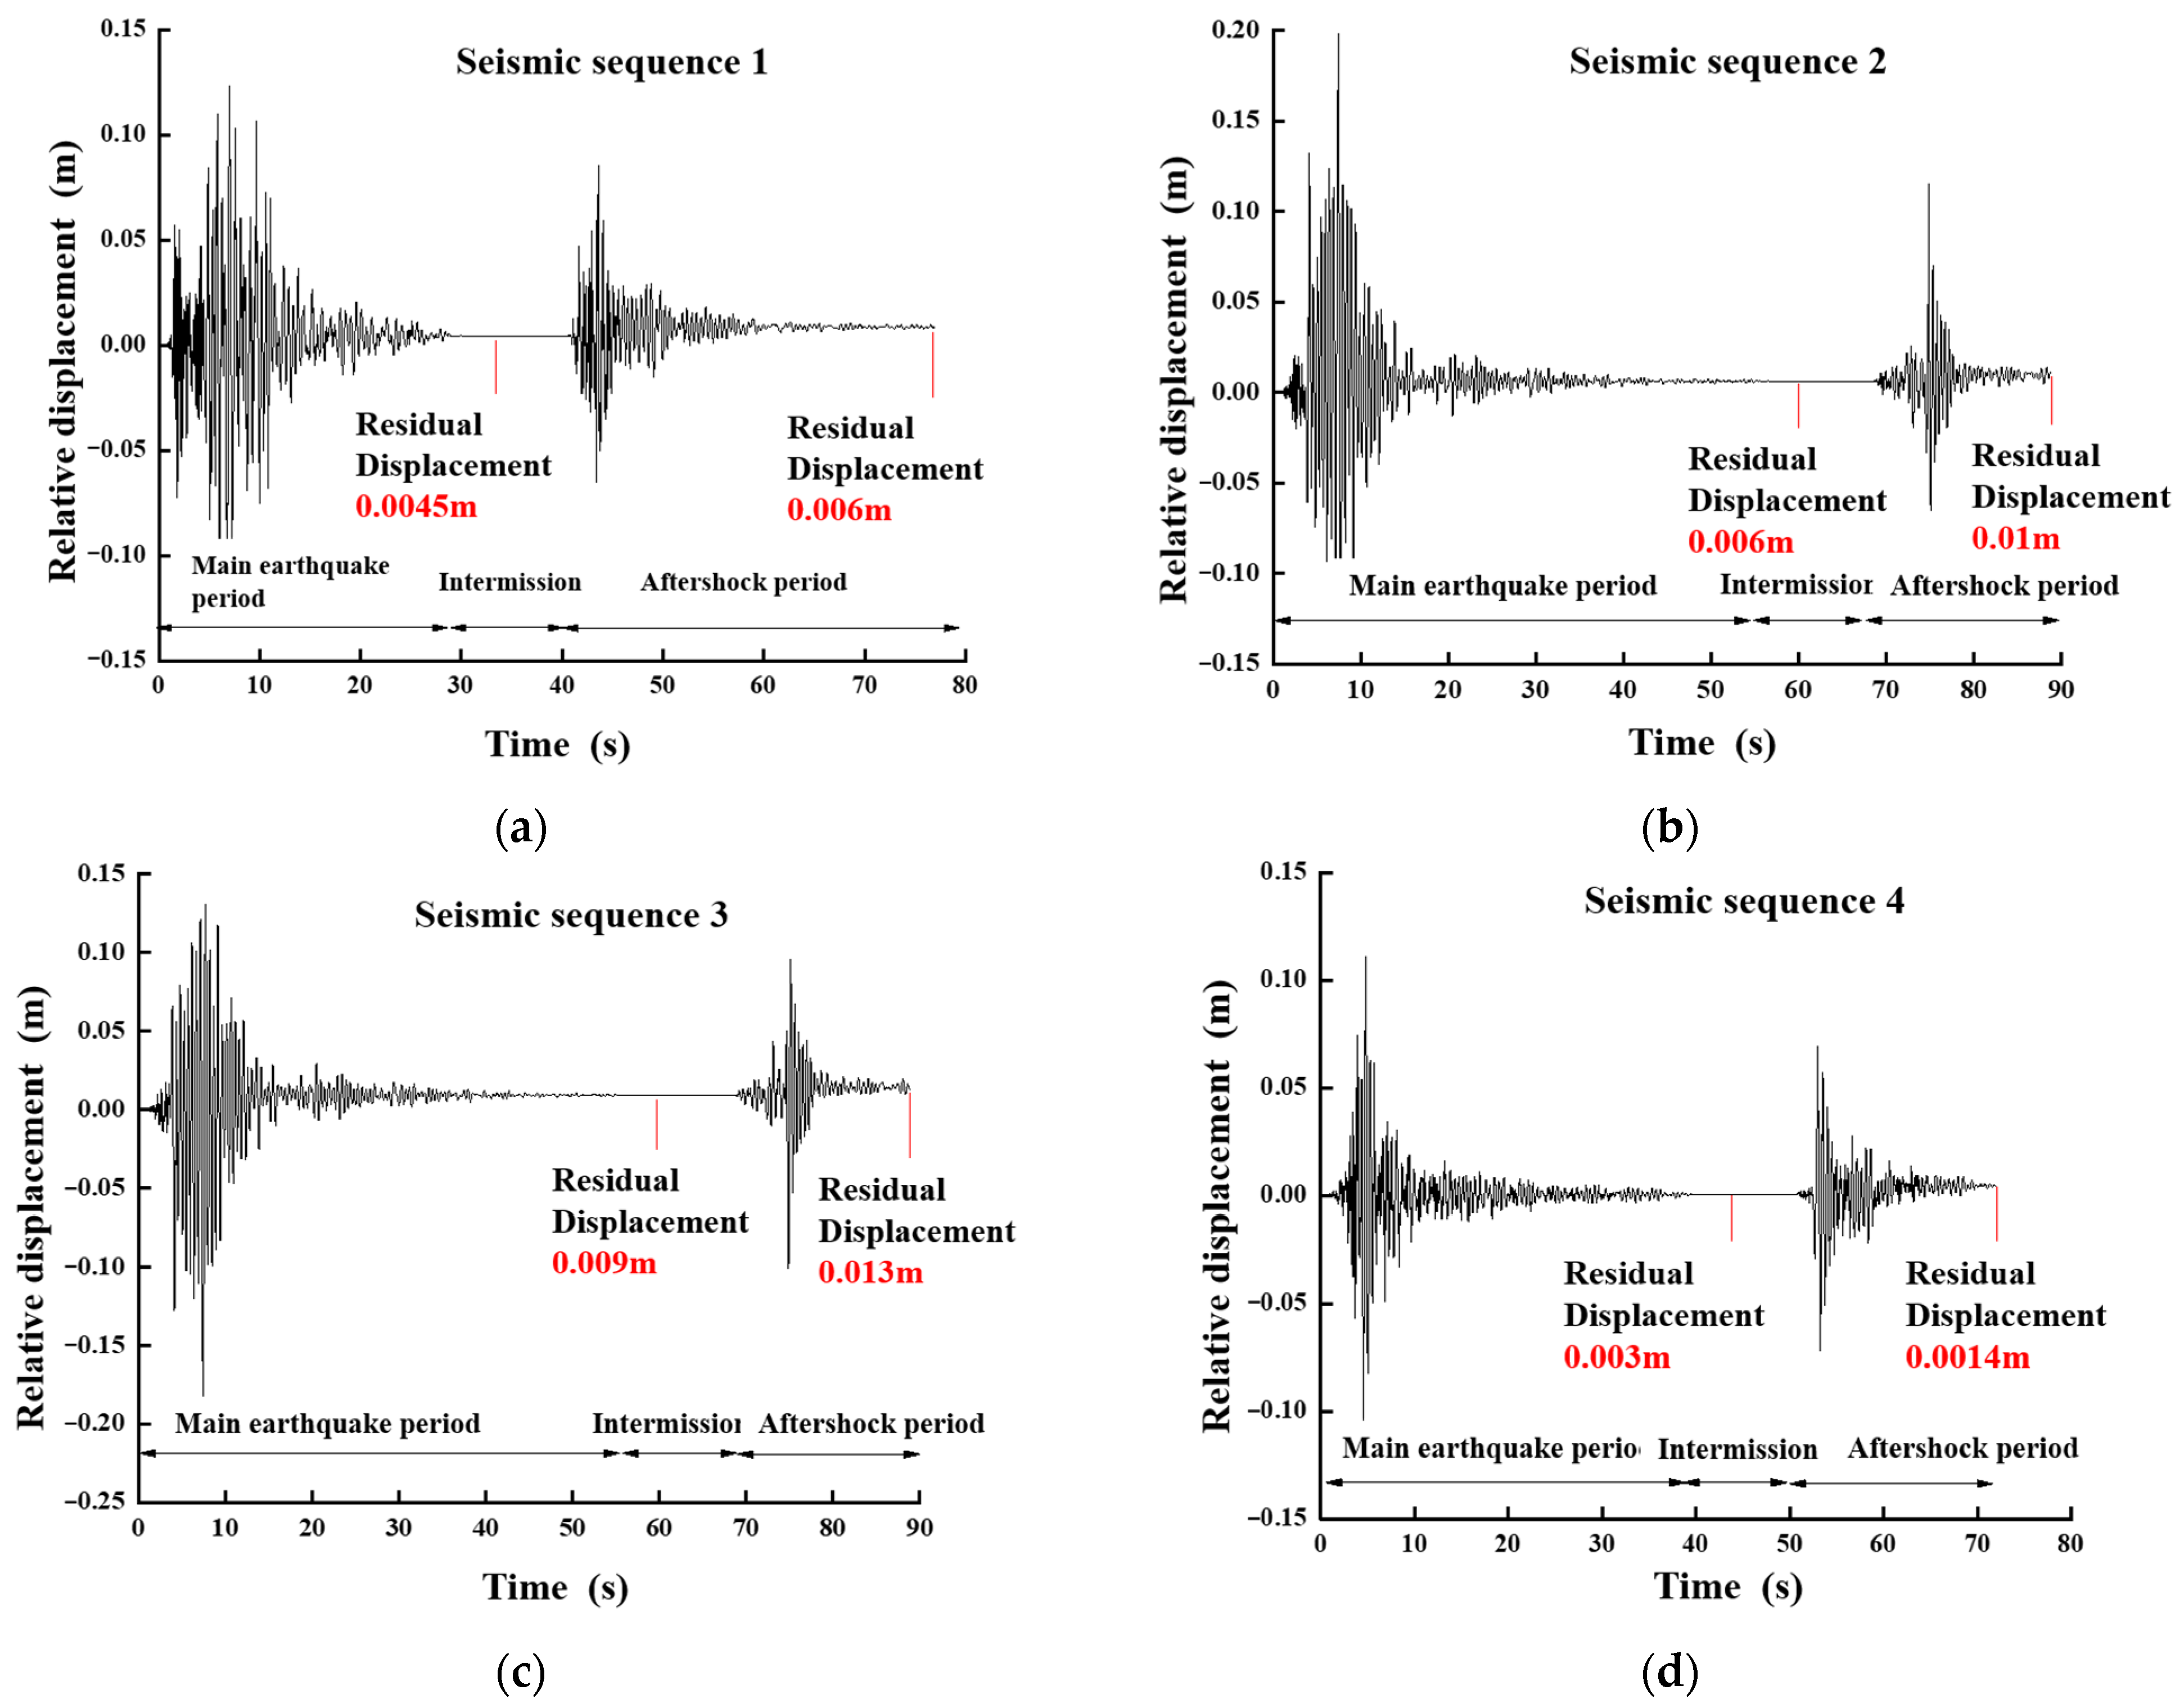
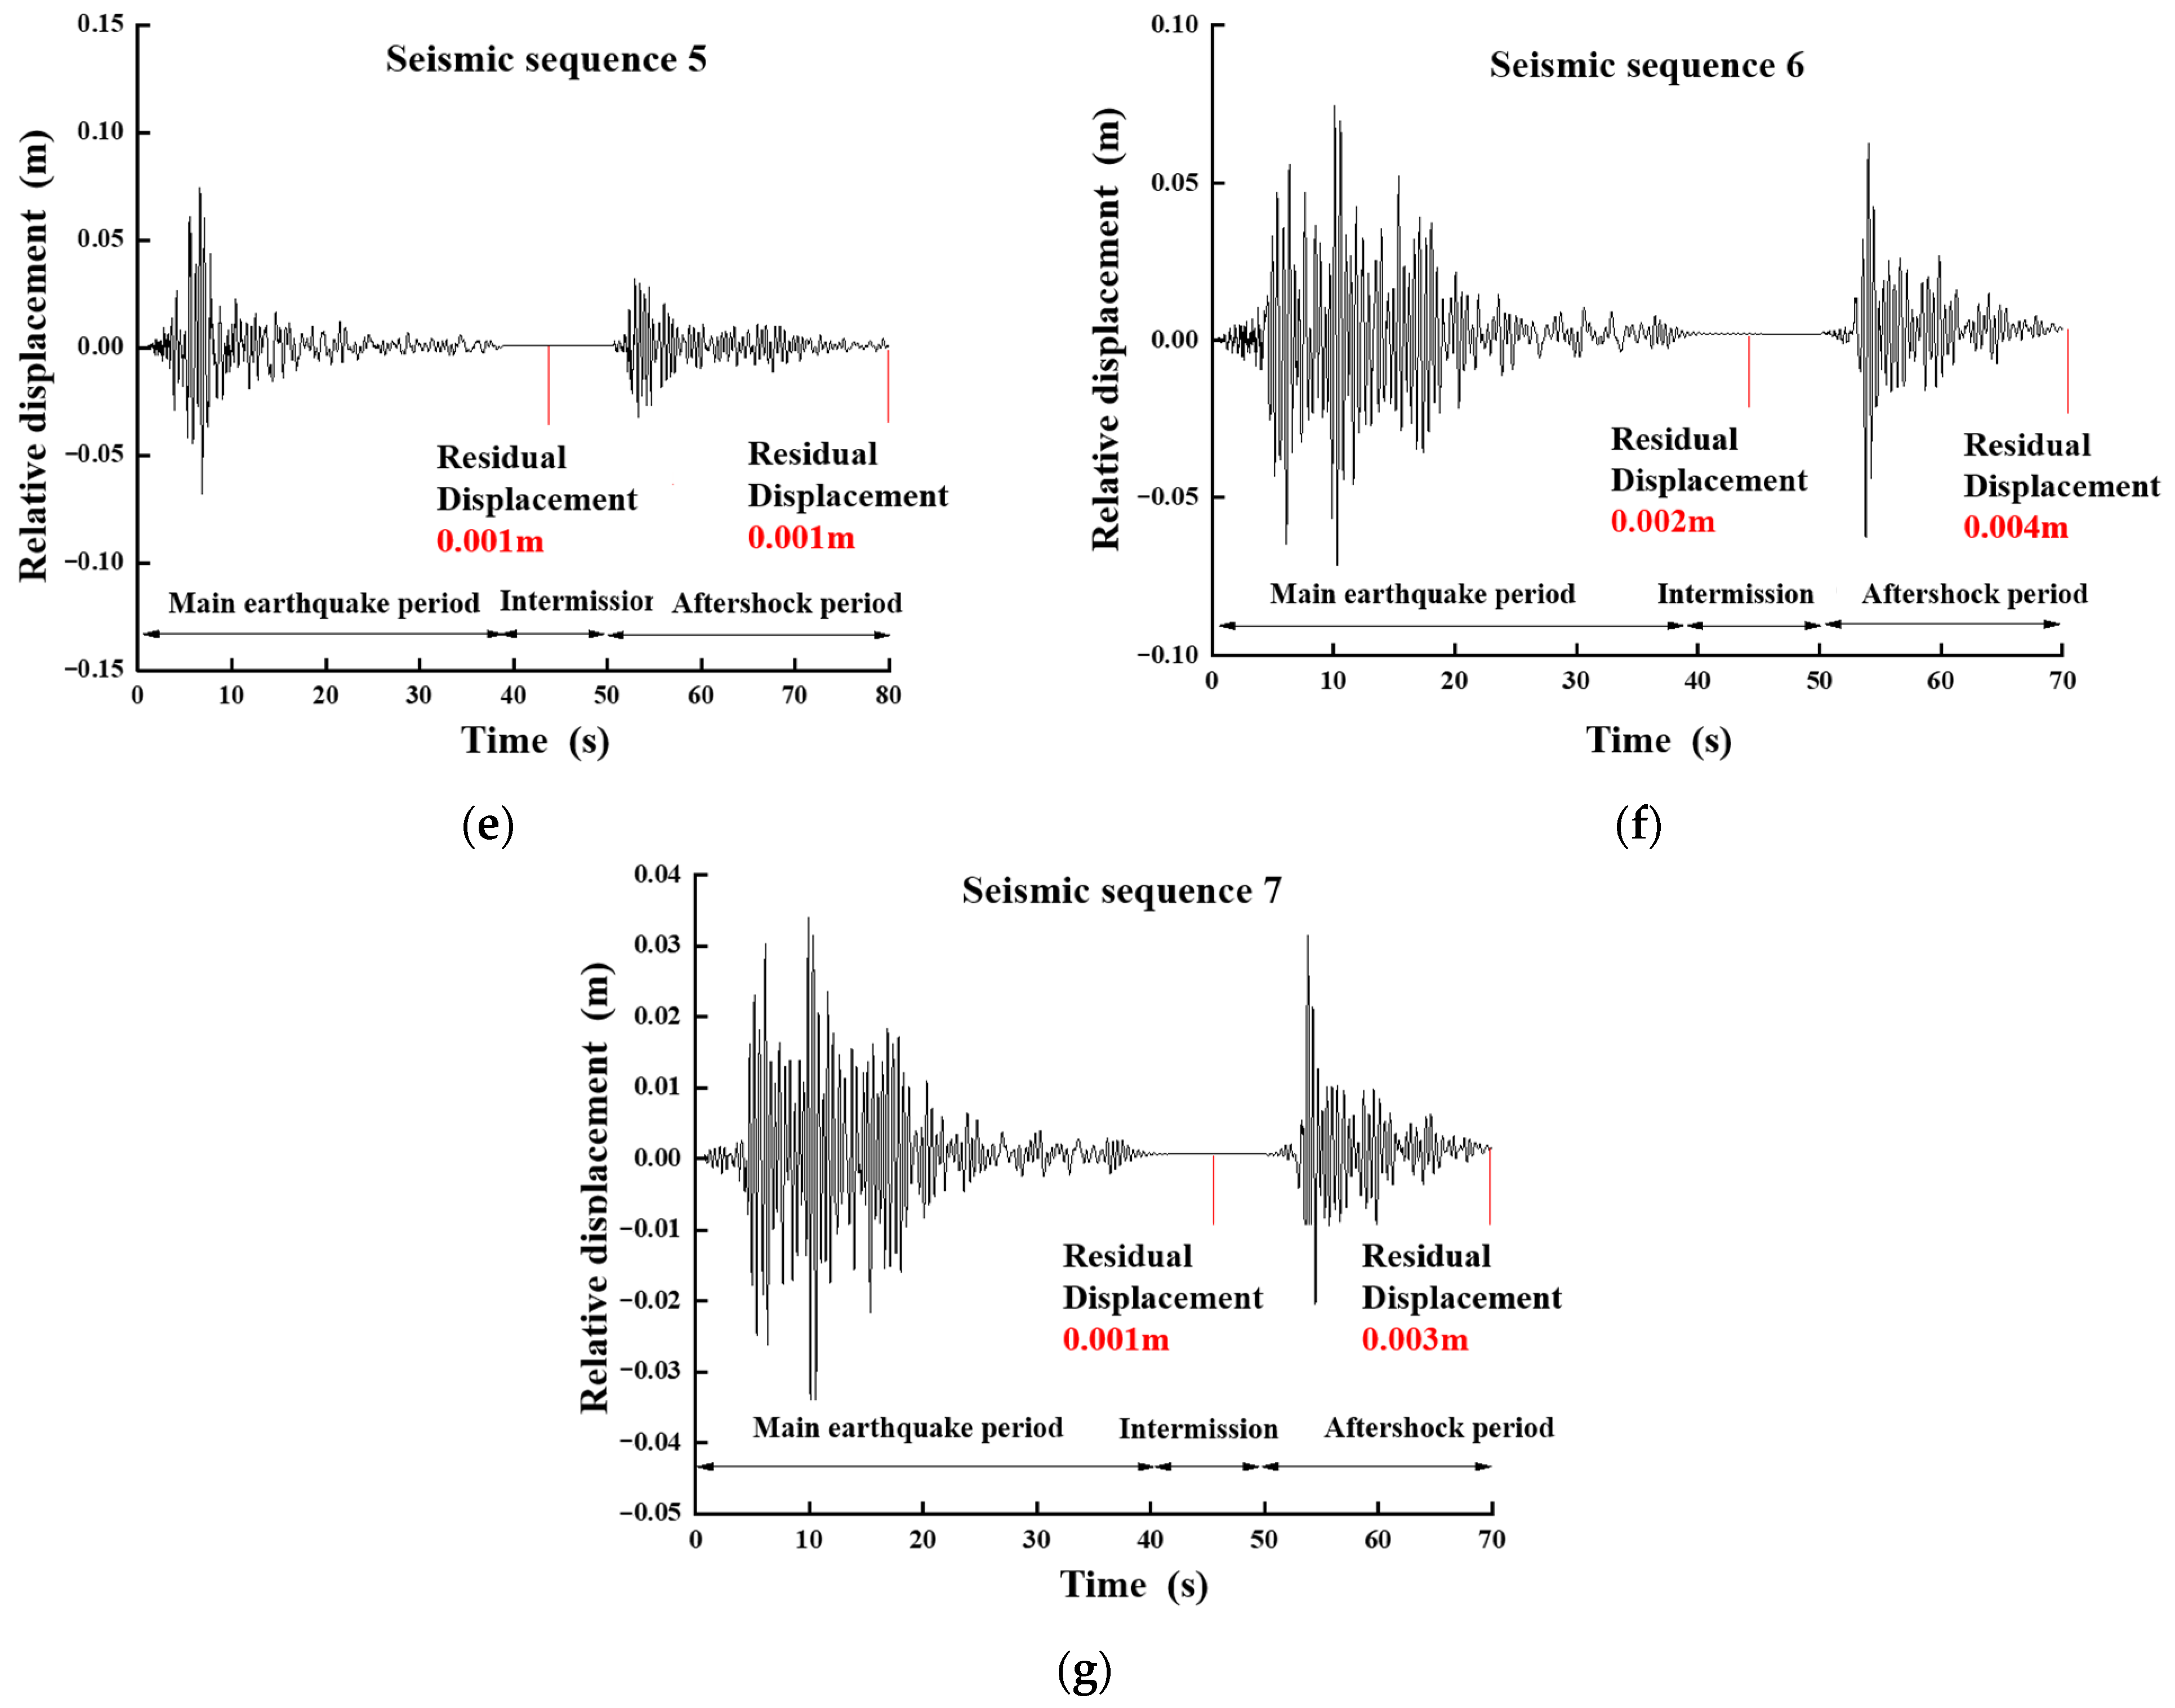
As shown in Figure 6, when the main earthquake intensity is 0.4 g, the maximum relative displacement values of the aqueduct all appear in the main earthquake period, and the residual displacement values of the aqueduct structure in the main earthquake action period under the seven tectonic earthquake sequences are 0.0045 m, 0.006 m, 0.009 m, 0.003 m, 0.001 m, 0.002 m, and 0.001 m, respectively. The residual displacements of the aqueduct at the end of the aftershock period were 0.006 m, 0.01 m, 0.013 m, 0.041 m, 0.001 m, 0.003 m, and 0.003 m, respectively. The residual displacement of the aqueduct increases by 33%, 66%, 44%, 37%, 0.01%, 60%, and 59%, respectively. It can be seen that the aftershock increases the residual displacement value of the aqueduct structure and increases the risk of the relative slip of the aqueduct. This is because the aqueduct structure enters the material nonlinear plastic stage after the main earthquake, and even if the aftershock intensity is less than that of the main earthquake, the deformation capacity of the structure in the plastic stage can be intensified.
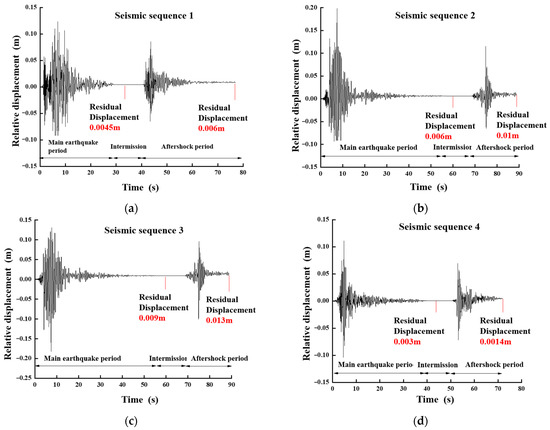
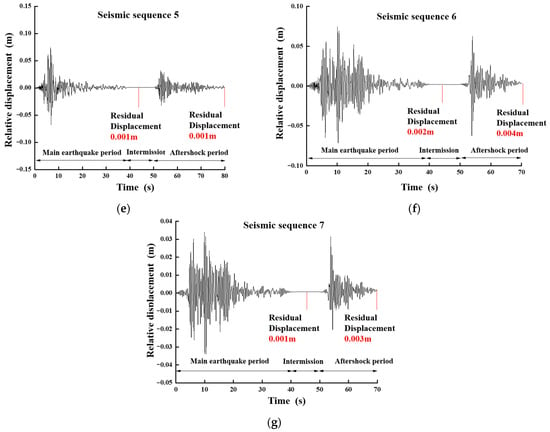
Figure 6.
Relative displacement of aqueduct under main aftershock.
4.1.2. Damage Energy Dissipation Analysis
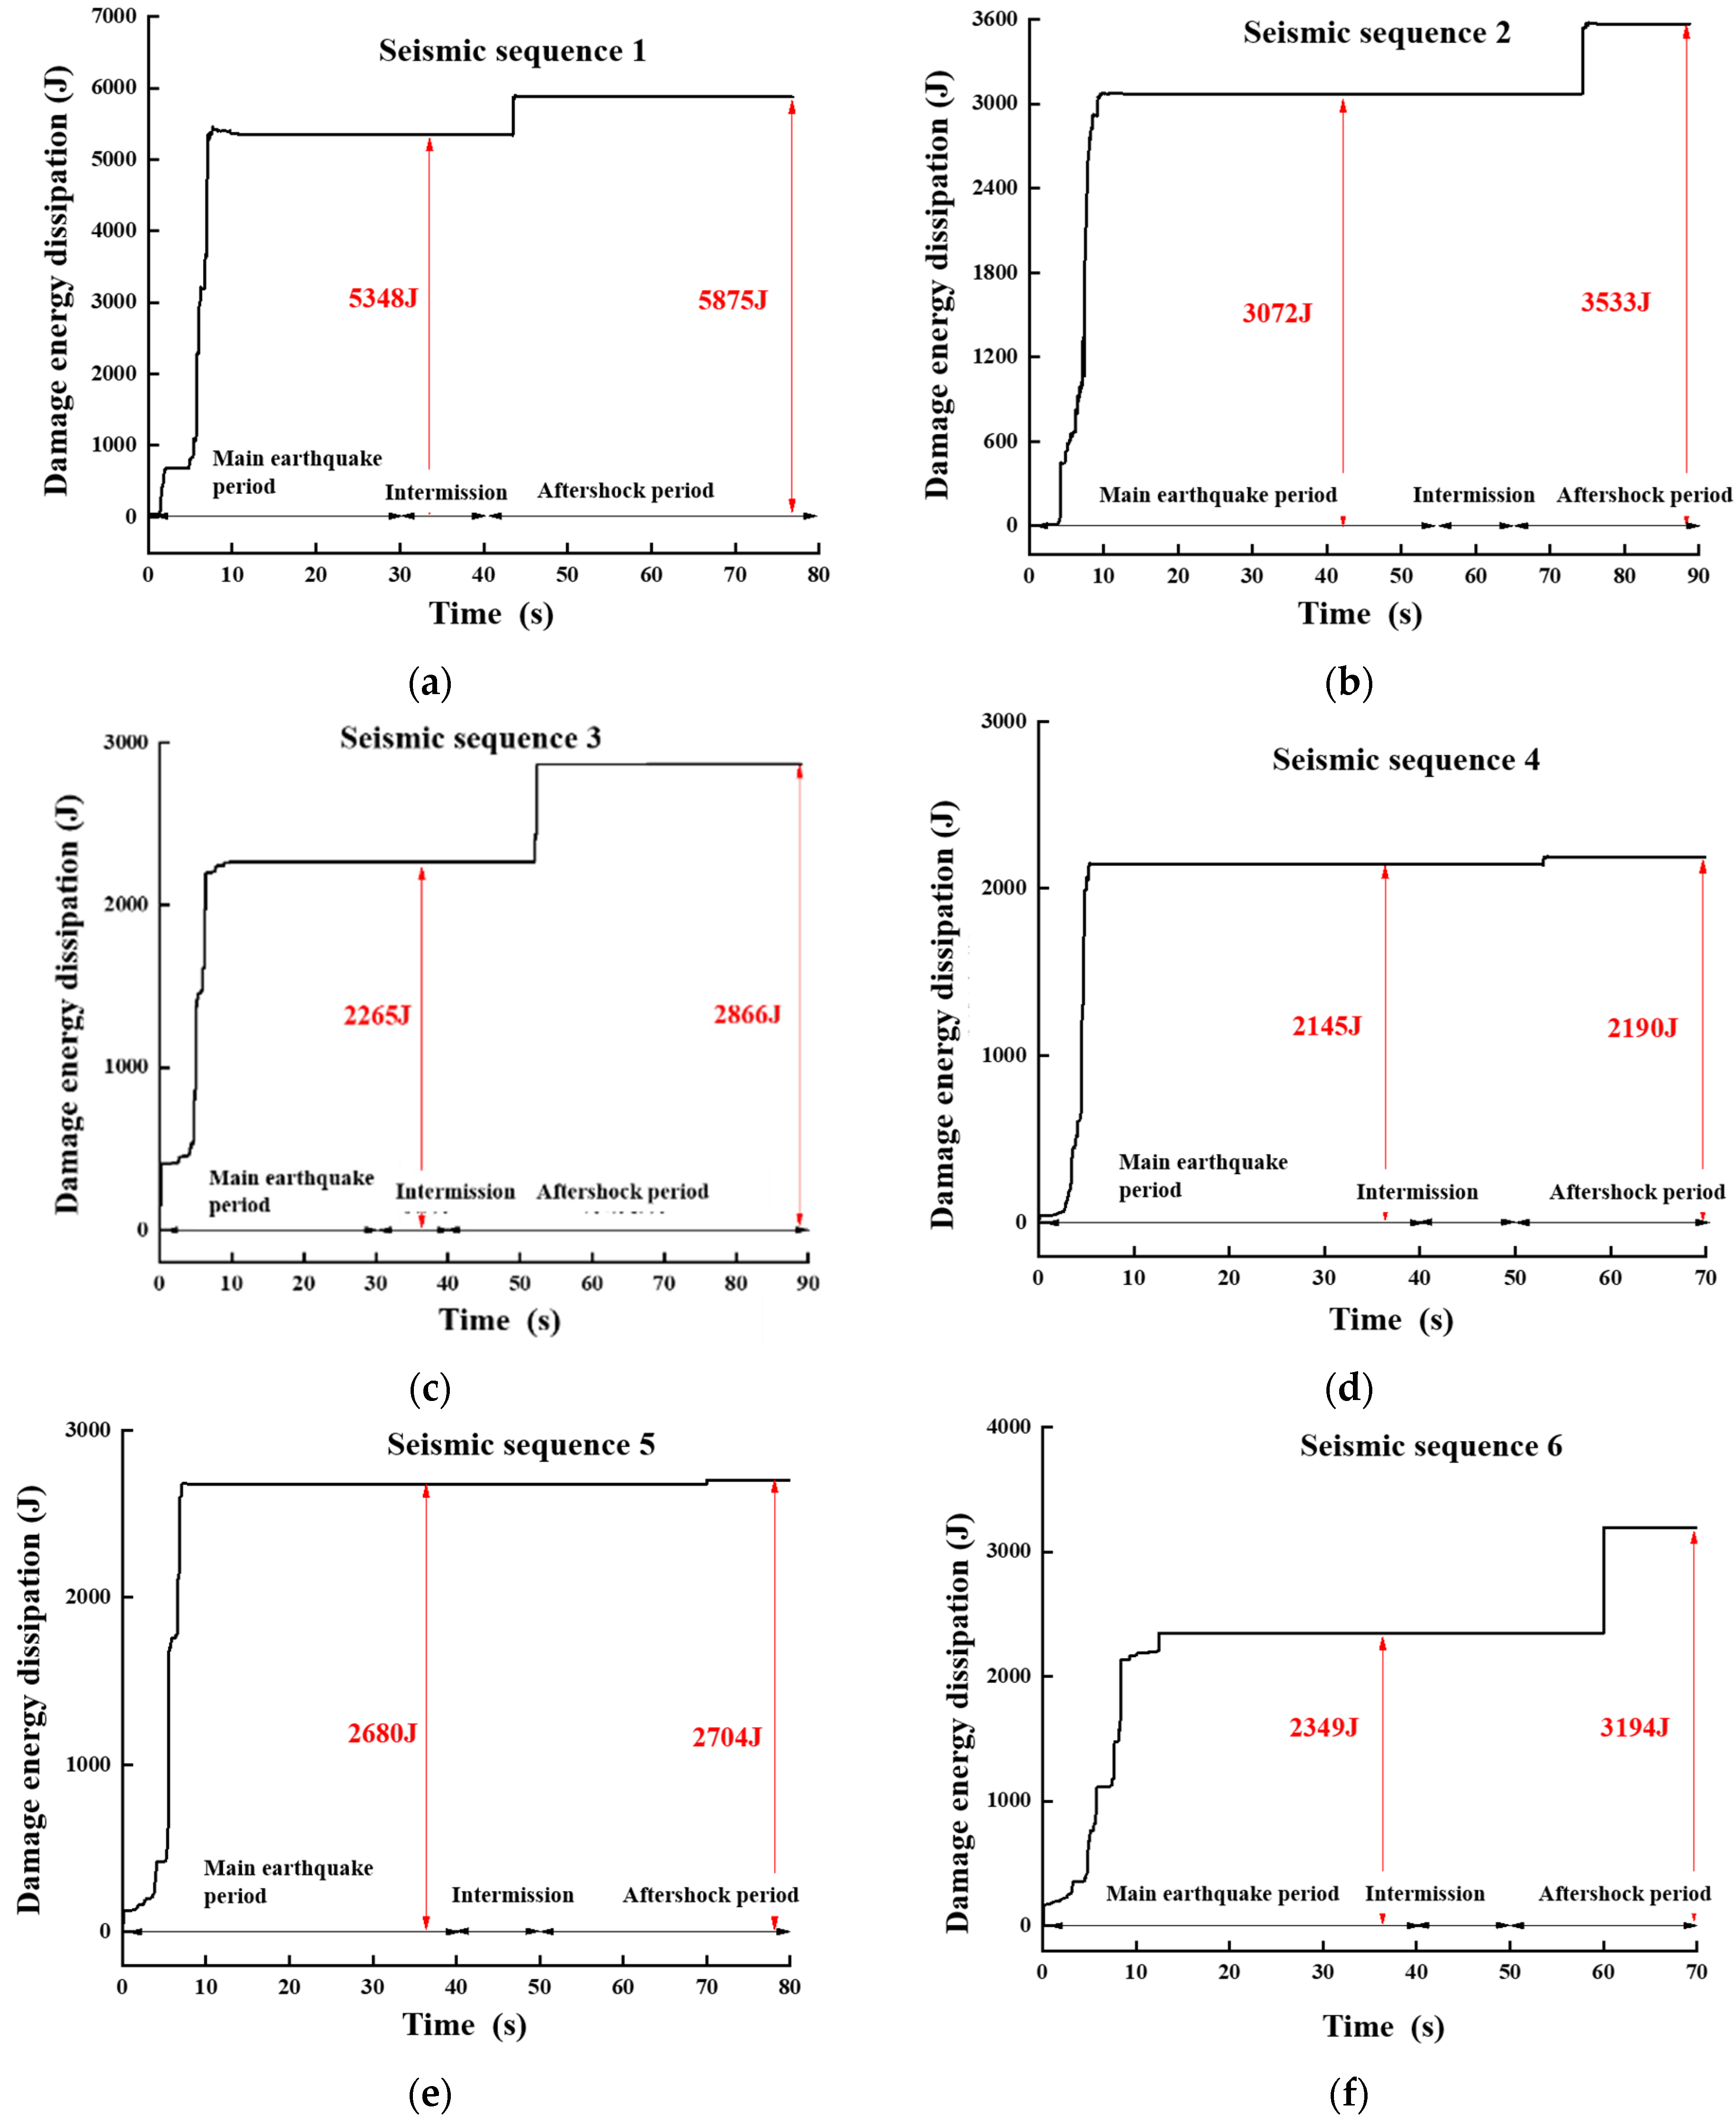
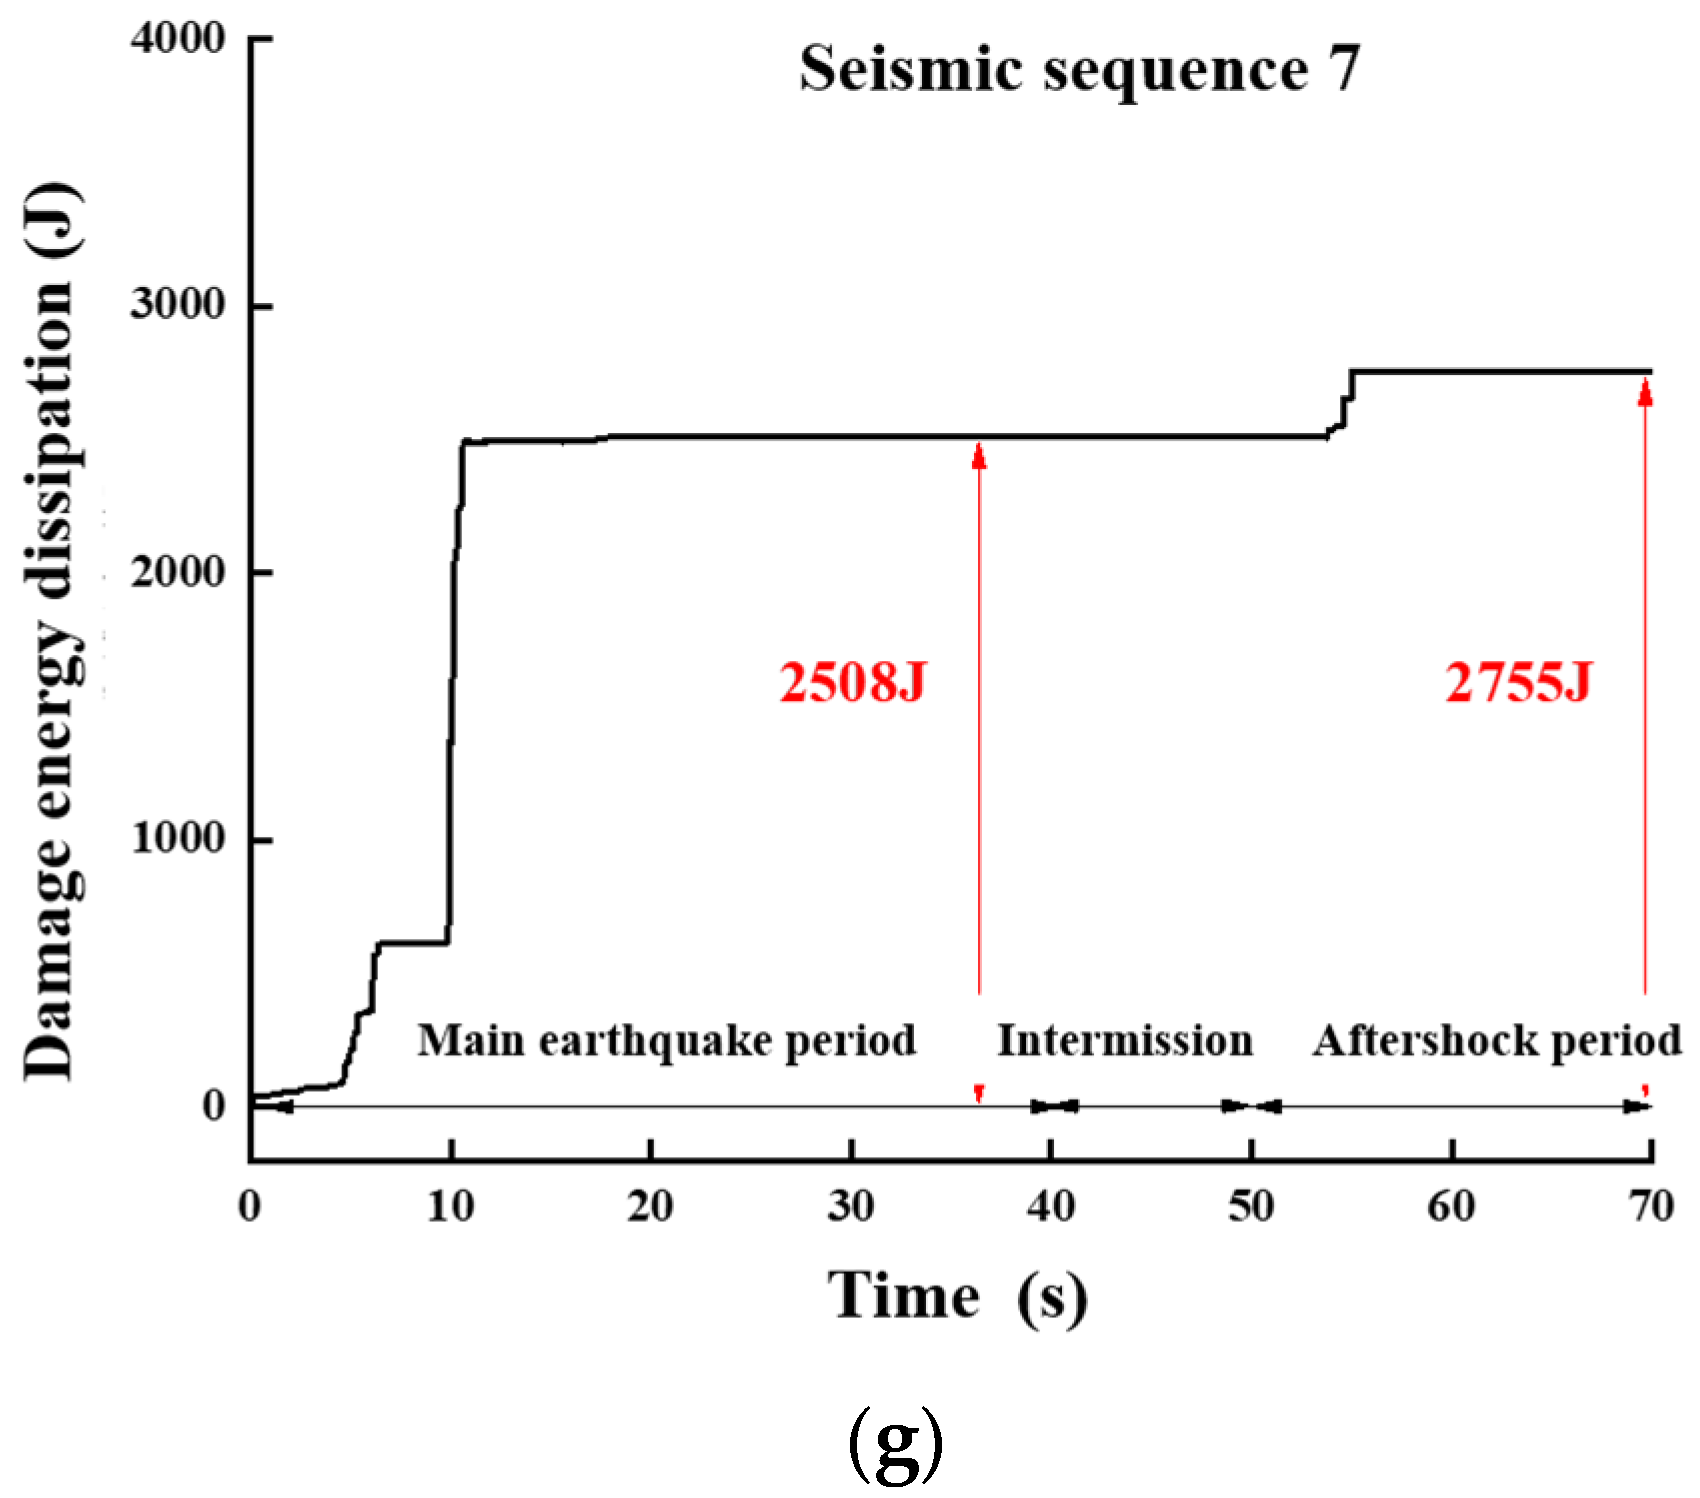
As can be seen from Figure 7, due to the aftershock ground motion, the aqueduct will cause secondary incremental damage to the structure under the action of the main aftershock sequence. The damage energy dissipation values caused by the seven different earthquakes at the end of the main earthquake are 5348 J, 3072 J, 2265 J, 2145 J, 2680 J, 2349 J, 2680 J, 2349 J, and 2508 J, respectively. At the end of the aftershocks, the damage energy consumption values were 5875 J, 3533 J, 2866 J, 2190 J, 2704 J, 3194 J, and 2755 J, respectively. The incremental damage percentages at the end of the aftershock compared with the end of the main shock were 9.85%, 15.00%, 26.53%, 2.10%, 0.9%, 35.97%, and 9.85%, respectively, indicating that the aftershock increased the risk of secondary damage and destruction of the aqueduct and had an important impact on the performance state of the aqueduct.
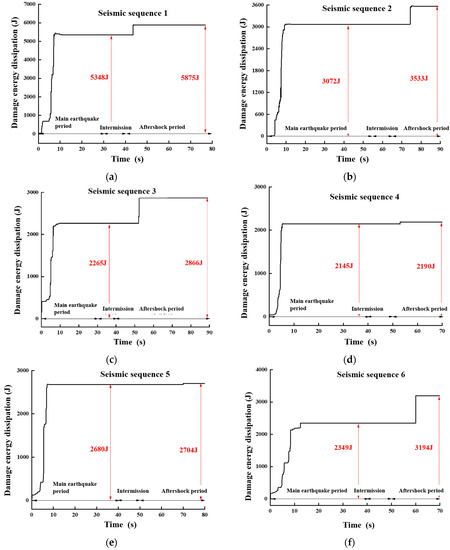
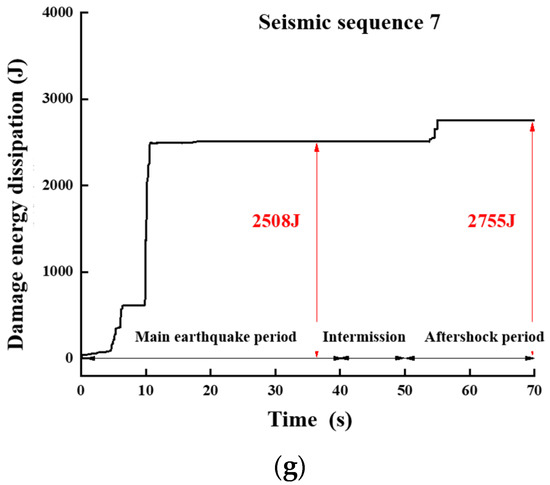
Figure 7.
Energy dissipation diagram of aqueduct damage under main aftershock sequence.
4.1.3. Damage Characteristic Analysis
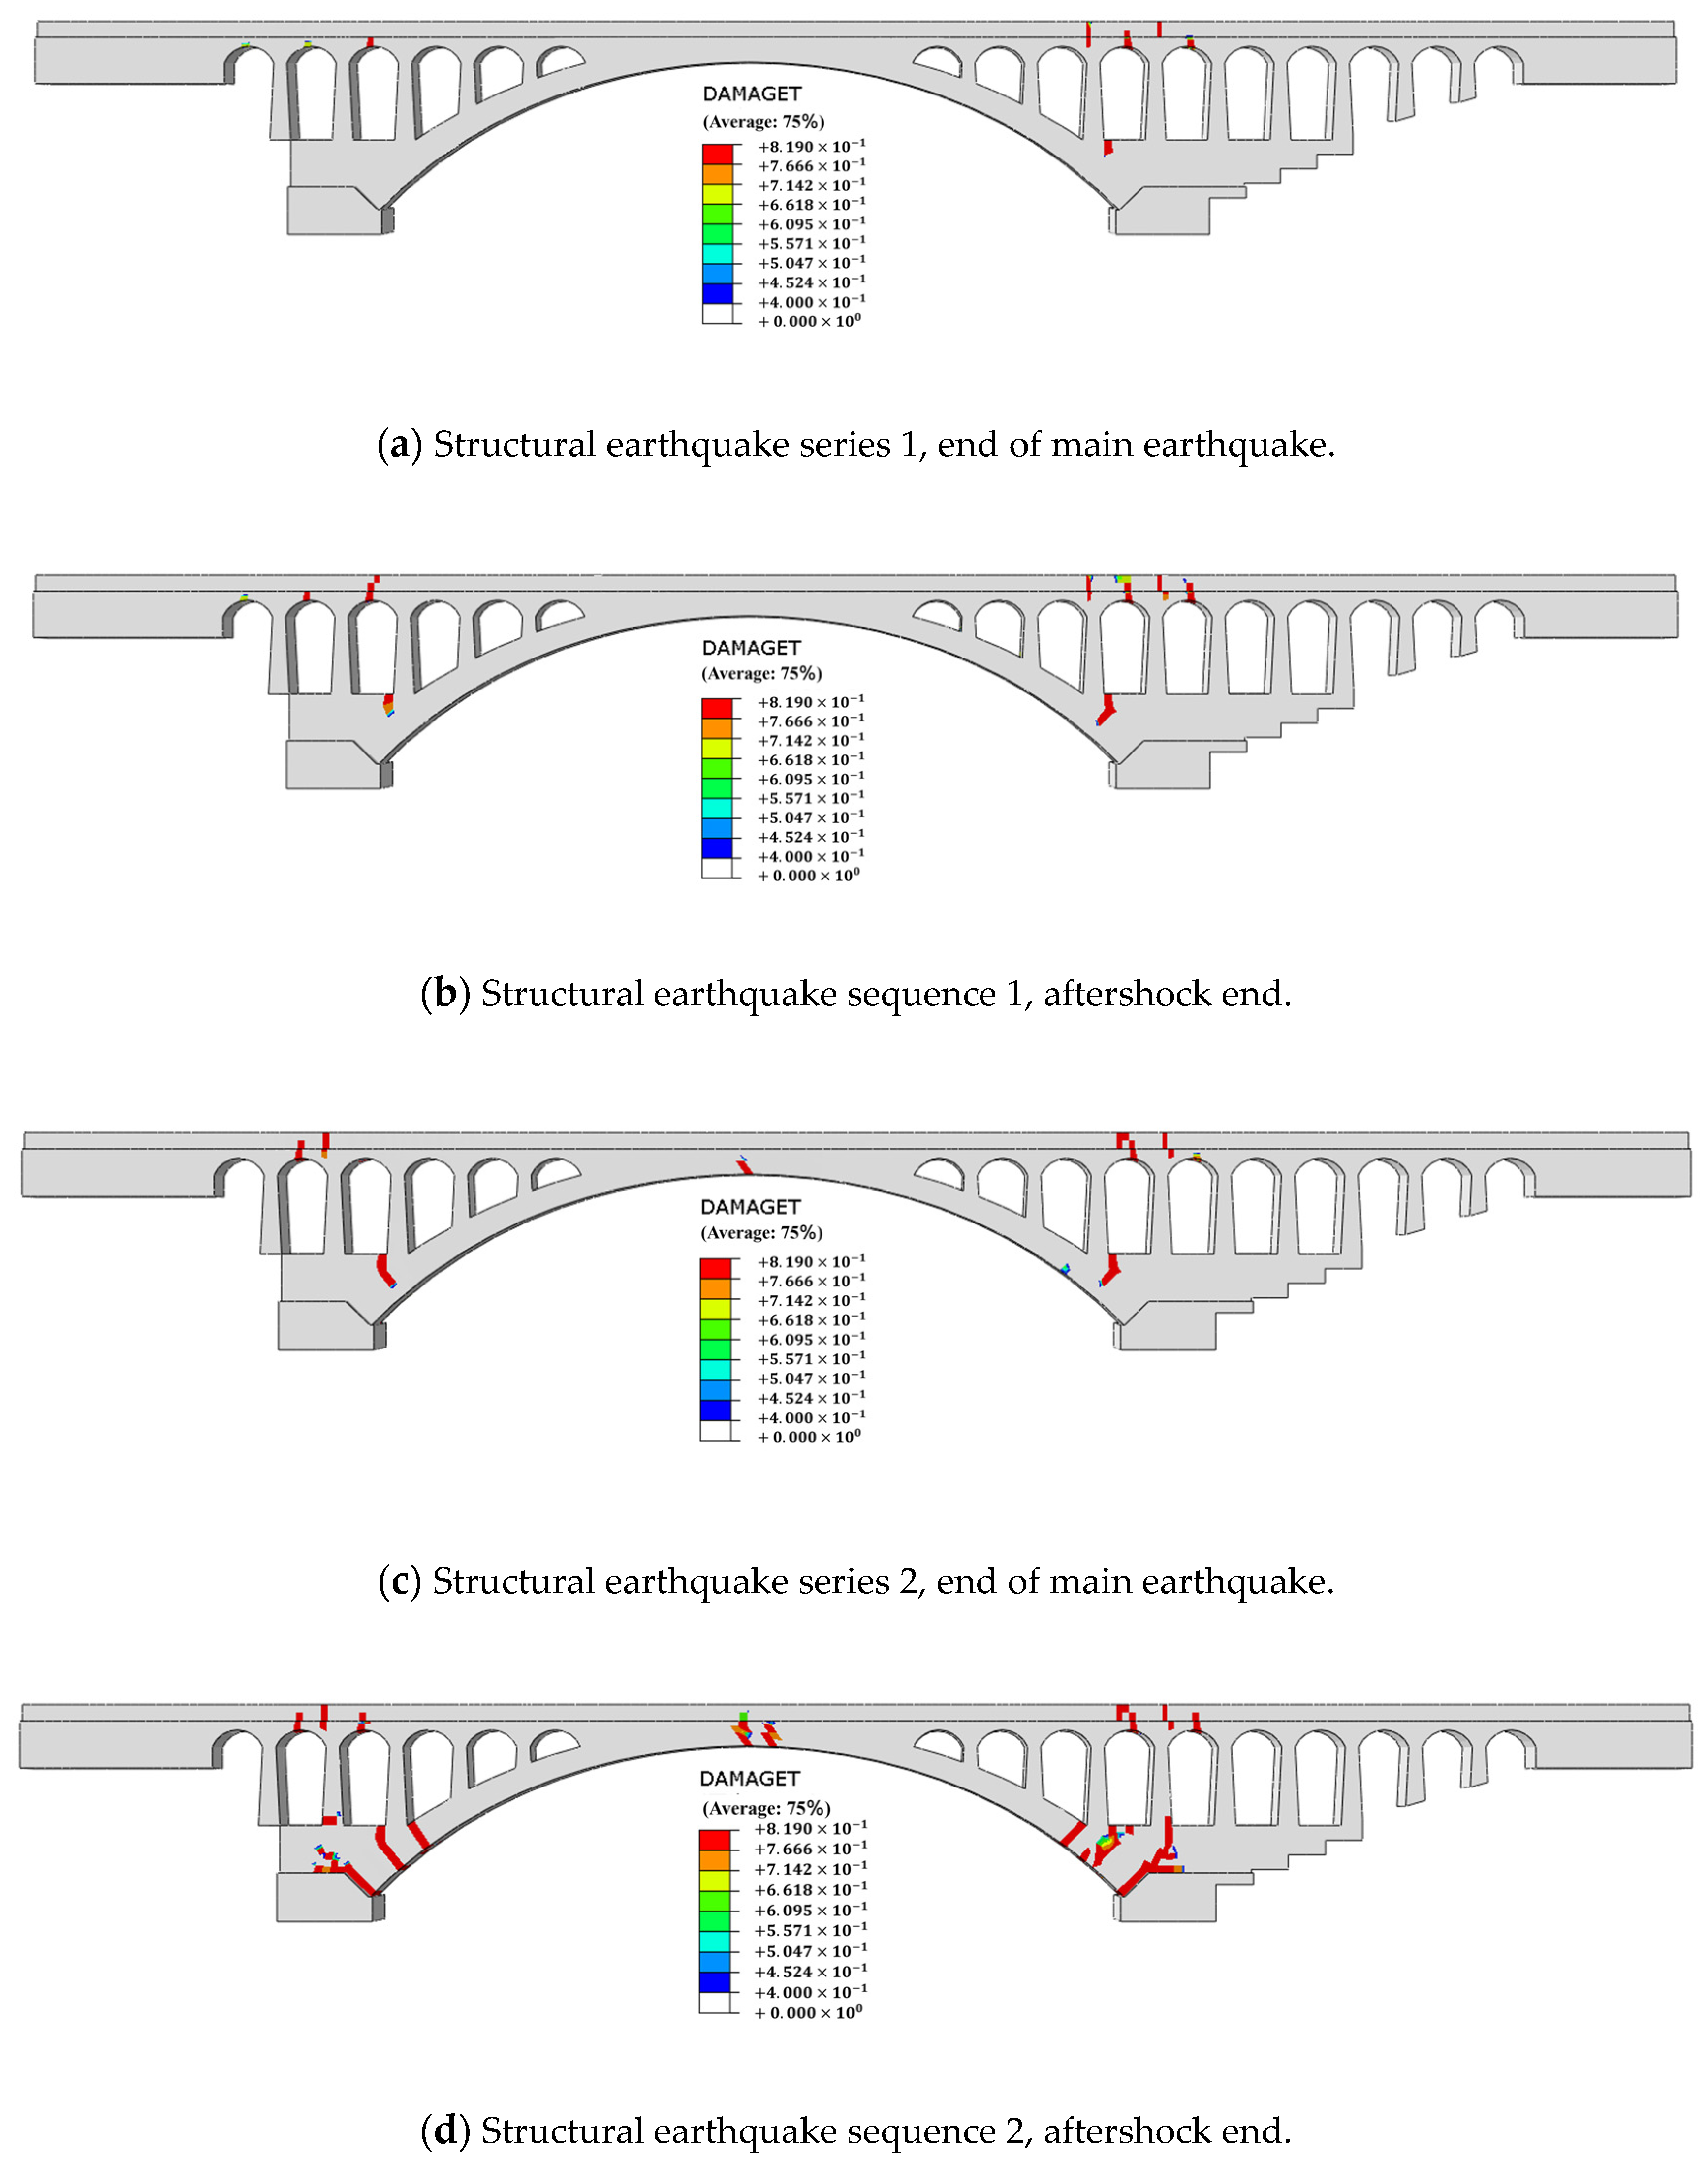
In this paper, two typical seismic sequences are selected to output the cracking cloud map of the aqueduct with the tensile damage factor as the performance parameter, and the dynamic damage characteristics of the aqueduct under the action of the main aftershock sequence are analyzed.
As shown in Figure 8, the damage cracking ranges of the aqueduct all appeared at the bottom of the arch and at the location of the aqueduct, and the aftershocks intensified the existing damage and failure forms of the aqueduct during the main earthquake period. From the development law of damage and failure, the main aftershocks make the damage development range of the bottom of the arch and the aqueduct body wider, and the top of the big arch circle also has different degrees of secondary incremental damage, which appears at the joint of the big arch circle and the aqueduct body. The reason for the incremental damage at the two arch ends in the east and west direction at the bottom of the aqueduct is that the dynamic water pressure in the aqueduct body is transmitted to the arch supports at both ends through the special stress mode of the three-hinged arch structure and then causes great damage at the bottom of the aqueduct arch end. The aqueduct area directly above the failure at the bottom of both sides of the arch also showed different degrees of damage and failure. The reason for this may be that after the damage and failure at the bottom of the arch of the aqueduct, the tensile damage crack appearing at this part had an impact on the aqueduct body directly above it, and the tensile damage collapse at the arch end then caused obvious tensile damage and failure to the aqueduct body above it. The reason for the damage at the crown of the big arch circle is that the dynamic motion direction of the mountain on both sides is inconsistent under the action of the earthquake, which causes great tensile and torsion damage at the crown of the big arch circle and causes the damage and failure of the aqueduct at the crown of the big arch circle. With the application of aftershocks, the damage at the bottom of the aqueduct arch and the vertex of the arch begins to expand around, and the damage range of the aqueduct extends to both ends. The damage range develops continuously and has an obvious effect under the action of aftershocks. Therefore, the application of aftershocks increases the dynamic accumulation damage of the aqueduct. In the analysis and design of the seismic performance of the aqueduct, the influence of seismic shock should be fully considered.
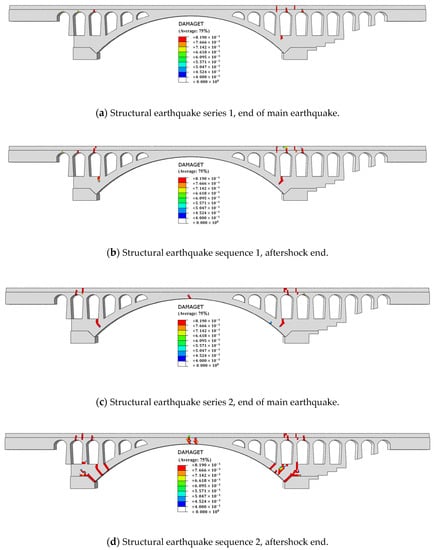
Figure 8.
Damage evolution diagram of aqueduct under main earthquake and main aftershock under different earthquake sequences.
4.2. Fragility Analysis
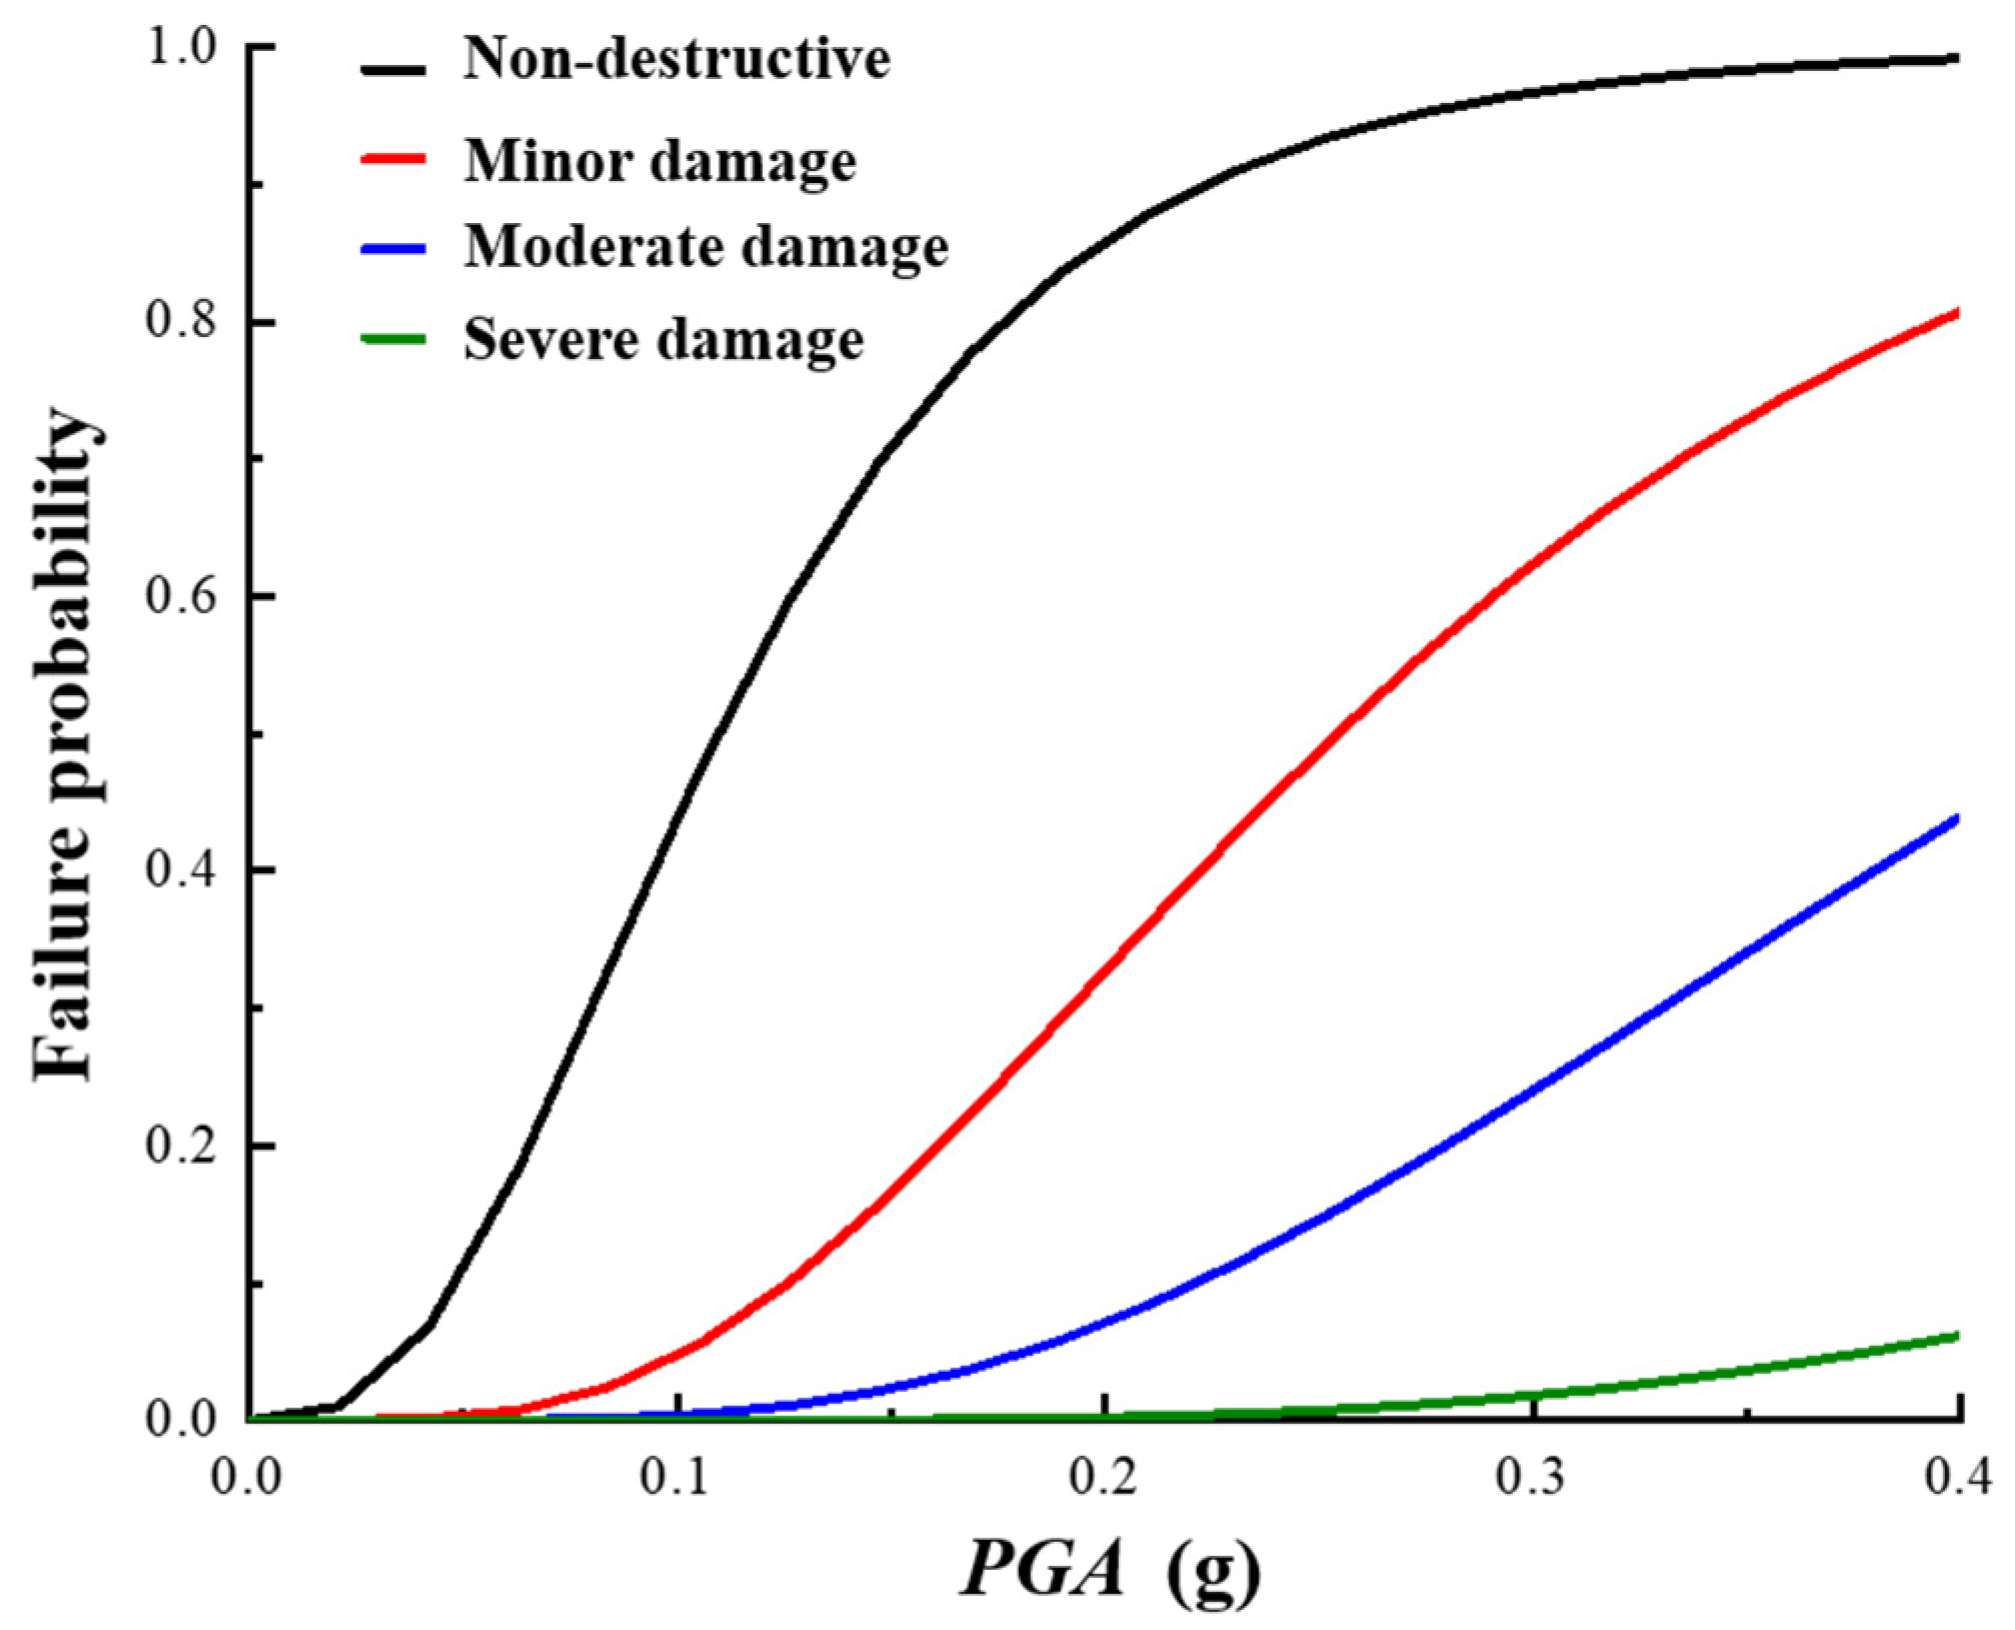
Figure 9 shows the vulnerability curve of the aqueduct structure under a single main shock based on the maximum ratio of plastic strain energy to total strain energy . With the gradual increase in earthquake intensity, the probability of structural damage is greater. Before the ground motion of the 0.1 g main earthquake, the probability of moderate failure and severe failure of the aqueduct structure is close to 0, and the entire aqueduct structure is in the elastic stage of recoverable deformation. The probability of the relative slip of the arch support of the aqueduct is very small, which can maintain the overall stability of the aqueduct structure. When the main earthquake action intensity is 0.2 g, the failure probabilities of severe damage, moderate damage, slight damage, and basically intact are 0.01%, 8.47%, 36.21%, and 87.93%, respectively. When the ground motion intensity of the main earthquake is 0.3 g, the probability of moderate failure of the aqueduct structure is 27.16%, and the probability of exceeding severe failure is 23.06%. When the earthquake intensity is 0.4 g, the probability of the aqueduct structure reaching mild failure is 80.79%, the probability of reaching moderate failure is 43.97%, and the probability of reaching severe failure is 6.21%. It can be seen that with the gradual increase of the main earthquake ground motion, the percentage of the aqueduct structure under all levels of failure probability gradually increases, that is, the damage risk of the aqueduct structure increases.
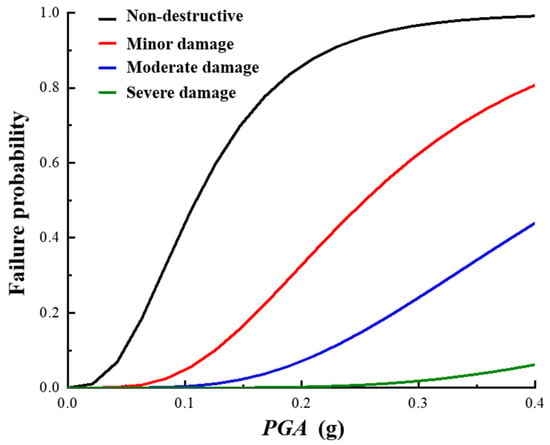
Figure 9.
Vulnerability curve of aqueduct structure under single main shock.
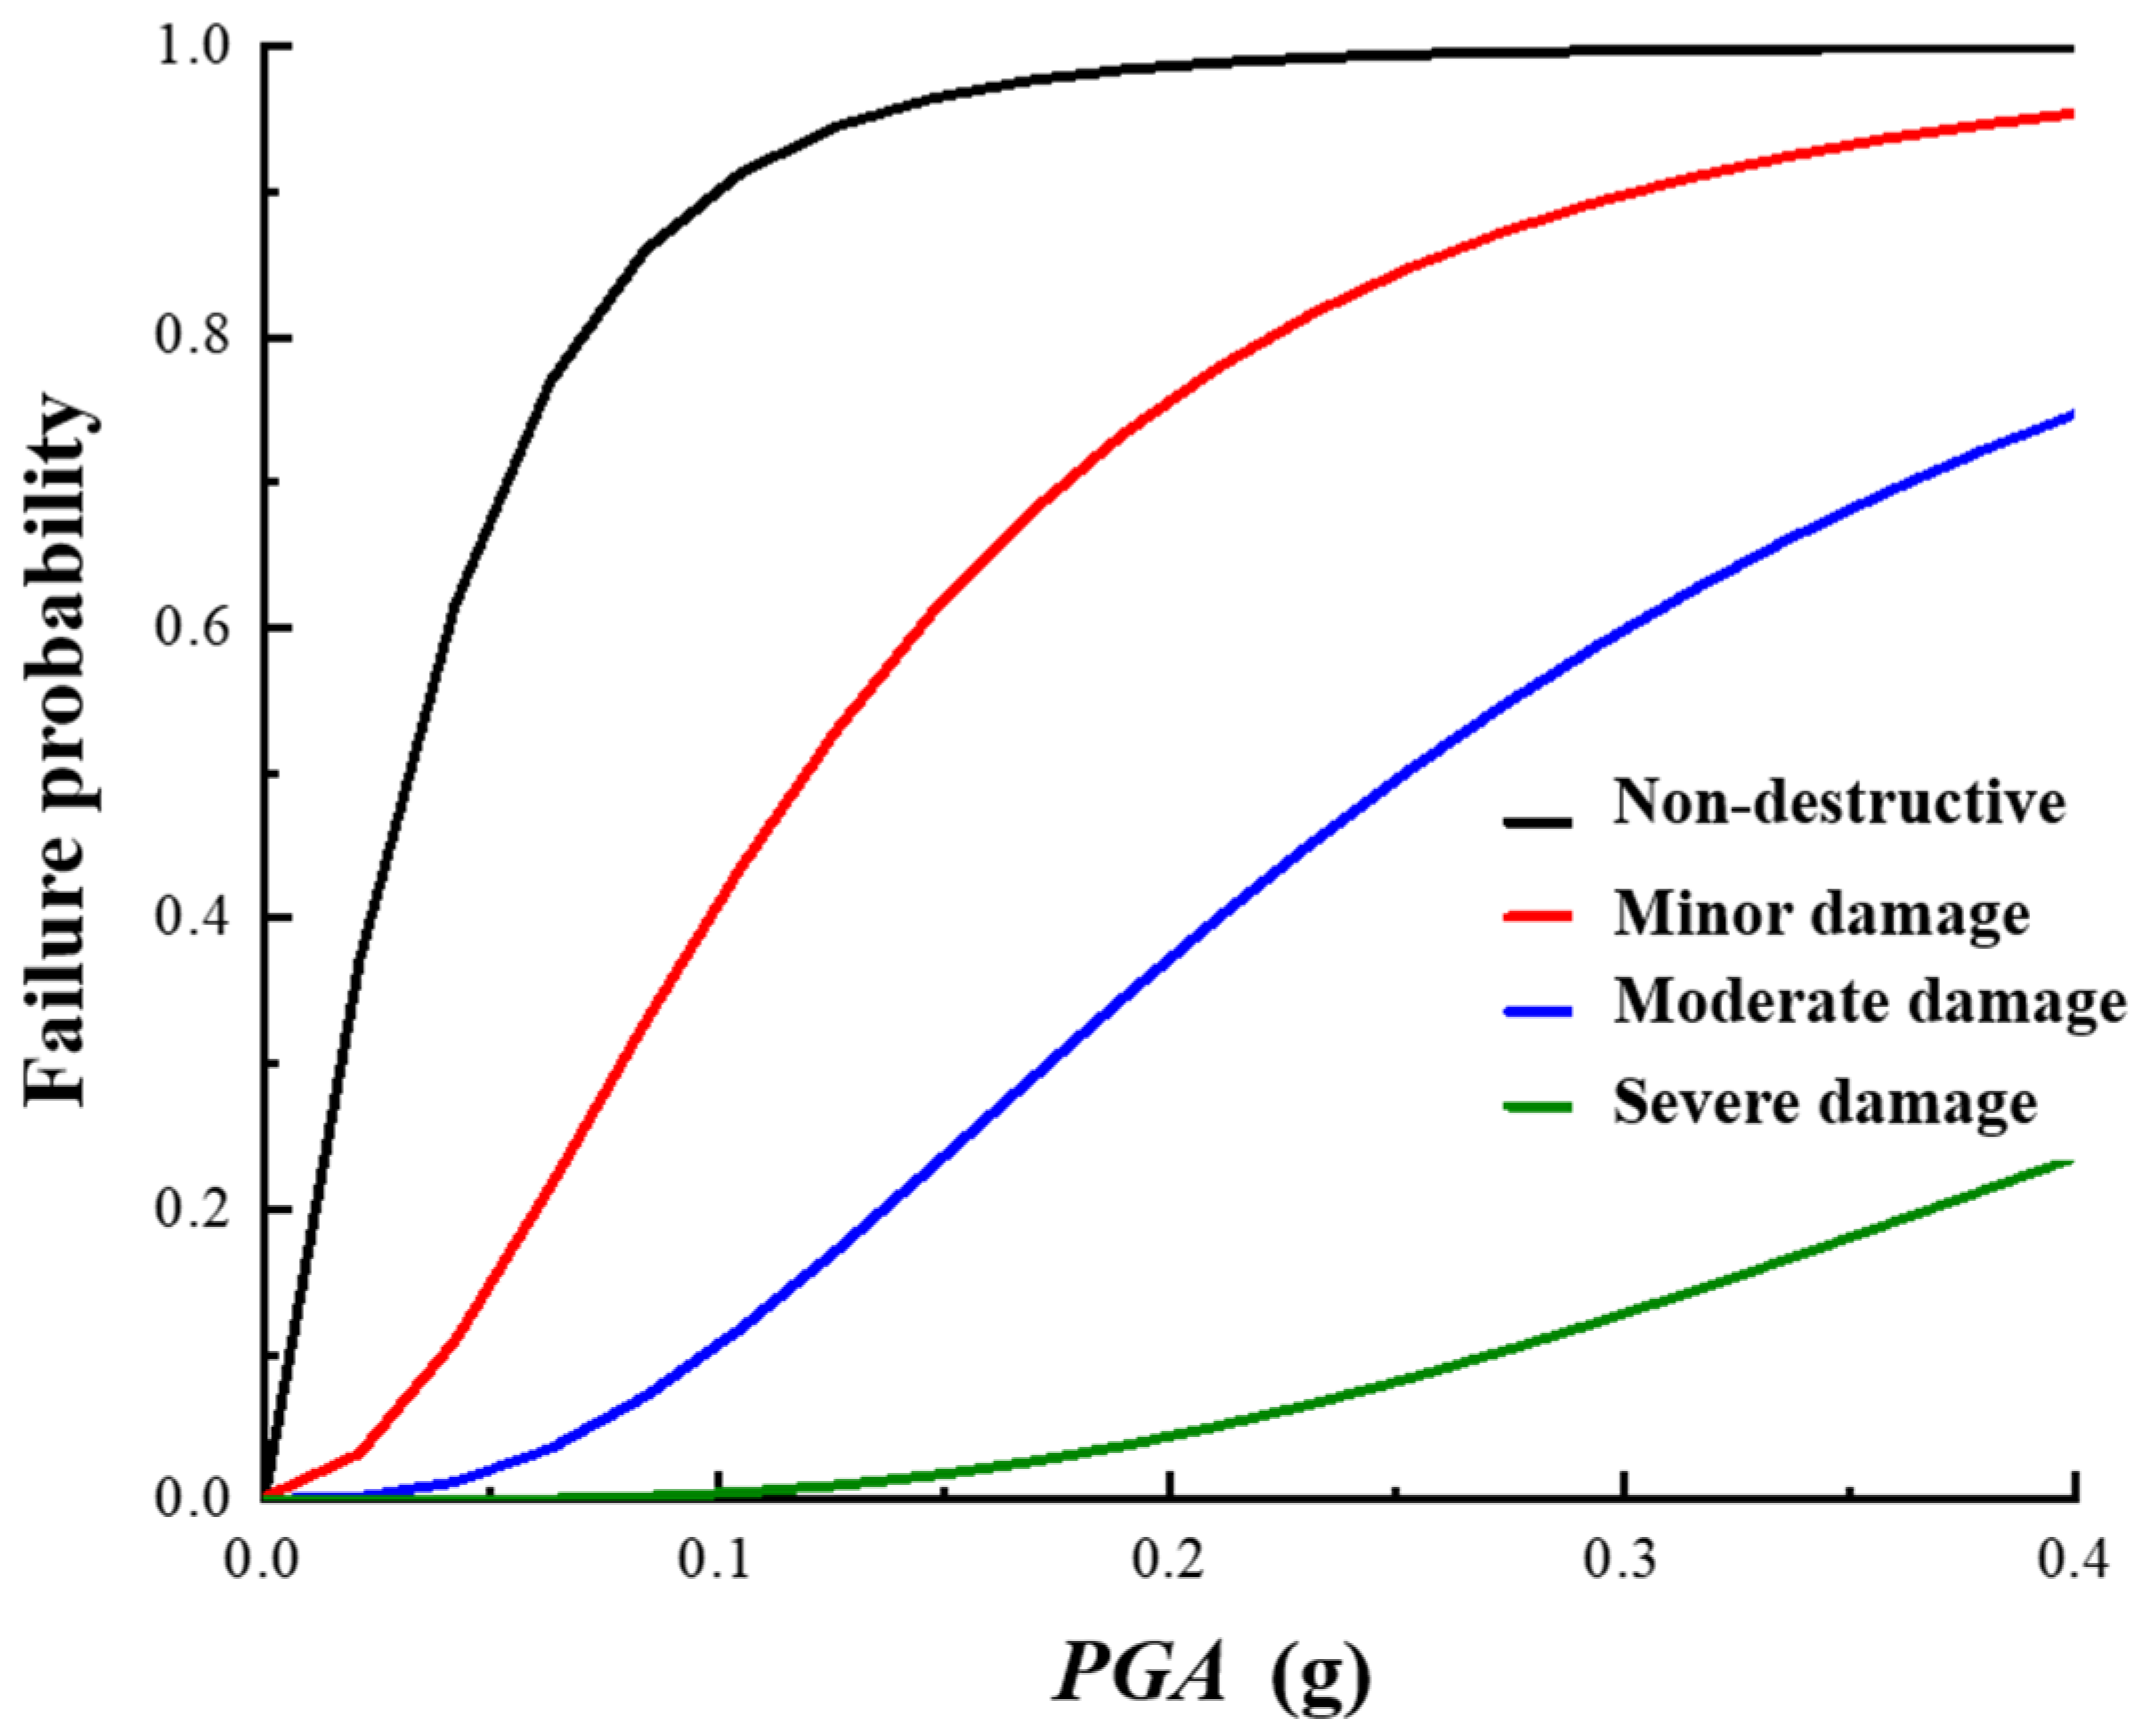
The vulnerability curve of the aqueduct under the action of the main aftershock sequence is shown in Figure 10. Compared with the vulnerability curve of the single main shock in Figure 9, the variation trend of the vulnerability curve under the action of two different earthquakes is similar to some extent. The aqueduct structure can maintain its stability under both kinds of seismic loads under the action of low intensity earthquakes. With the intensification of ground motion, the vulnerability curve drawn by the main aftershock sequence is greater than the vulnerability result of a single main earthquake under the same seismic load acceleration, that is, the transcendence failure probability of the main aftershock sequence under the same seismic intensity is greater than the probability of a single main earthquake. Taking an earthquake intensity of 0.3 g as an example, the exceedance probabilities of aqueduct reaching moderate damage and severe damage under a single main earthquake are 27.16% and 2.31%, respectively, and the exceedance probabilities of moderate damage and severe damage under the main aftershock sequence are 62.68% and 14.39%. The exceedance probability of the main aftershock is 38.52% and 12.08% higher than that of the single main shock. The reason for the increase in the exceedance probability of the aqueduct is mainly that the aqueduct material enters the plastic stage or even the post-peak failure stage after the main earthquake. In this stage, the aqueduct structure can produce a large residual deformation even if the action intensity of the aftershock is smaller than that of the main earthquake. Therefore, the exceedance probability under the action of the main aftershock sequence is greater than that of the single main earthquake. Comparing and analyzing the slopes of the four kinds of threshold curves of ultimate failure, it is found that the slope of the basically intact vulnerability curve is higher than that of the remaining three kinds of ultimate failure states, indicating that the structure is difficult to maintain at this level of ultimate failure state. In addition, when the seismic intensity of the main aftershock is 0.2 g, the failure probability of the aqueduct structure in basic good condition reaches 98.81%, indicating that the structure is difficult to maintain in the intact state without damage. With the increase of earthquake intensity, the slopes of minor damage, moderate damage, and severe damage gradually decrease. The reason for this phenomenon may be that after the aqueduct structure has experienced the main earthquake period, the displacement ductility of materials entering the elastoplastic stage offsets part of the seismic action, which makes the slope of its vulnerability curve gradually decrease.
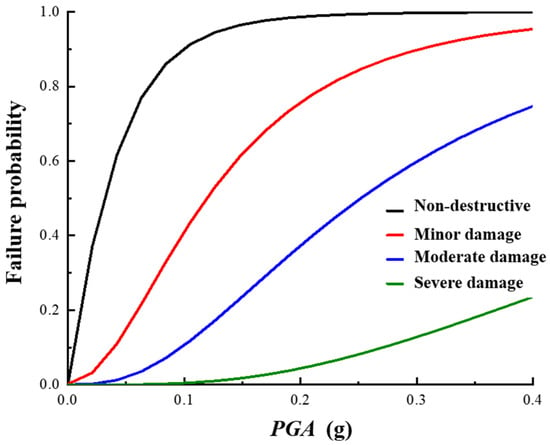
Figure 10.
Vulnerability curve of aqueduct structure under the action of main aftershock sequence.
5. Conclusions
In this paper, based on the background of the actual engineering aqueduct structure, a three-dimensional finite element model of aqueduct–water body–foundation is established by ABAQUS, and the dynamic response analysis and structural vulnerability analysis of the aqueduct are carried out based on the incremental dynamic analysis (IDA) method through the construction of major aftershock series seismic waves. The main conclusions are as follows:
- (1)
- IDA curve clusters of the aqueduct structure under incremental dynamic analysis were established, and the reasons for the strong difference between the two IDA curve clusters were analyzed. For the aqueduct structure, the IDA curve, which takes the maximum ratio of the plastic strain energy to total deformation energy as the performance index, shows low discretization in the whole seismic time history and more accurately reflects the damage condition of the aqueduct. It provides a new structural damage index for the study of aqueducts.
- (2)
- Based on the main aftershock sequence of the structure, the dynamic response analysis of the maximum relative displacement, damage energy dissipation analysis, and loss characteristic analysis of the aqueduct shows that the residual displacement of the aqueduct increases by 33%, 66%, 44%, 37%, 0.01%, 60%, and 59%, respectively, under the effect of the aftershock. The incremental damage percentages at the end of the aftershock compared with the end of the main shock were 9.85%, 15.00%, 26.53%, 2.10%, 0.9%, 35.97%, and 9.85%, respectively.
- (3)
- Based on the IDA analysis results of the aqueduct structure, vulnerability curves under a single main shock and main aftershock sequence were established. By comparing the vulnerability curves under different earthquakes, it can be seen that the vulnerability curves drawn by the main aftershock sequence are larger than the vulnerability results of a single main earthquake, that is, the aftershock ground motion increases the risk of damage and destruction of the aqueduct, which is more unfavorable to the aqueduct structure.
Author Contributions
Methodology, X.Z. (Xiaodong Zheng); Formal analysis, X.Z. (Xun Zhao); Investigation, X.Z. (Xingguang Zong); Data curation, Y.S.; Writing—original draft, Y.S.; Funding acquisition, H.S. All authors have read and agreed to the published version of the manuscript.
Funding
This research was funded by [Postdoctoral special fund project] grant number [SJ200100105], [State key laboratory project] grant number [2019KFKT-15], [Natural Science Foundation of Hebei Province] grant number [E2020402087], [Water conservancy research and extension project of Hebei Province] grant number [2020-11], [Handan Social Science Planning Project] grant number [2023072].
Data Availability Statement
Not applicable.
Conflicts of Interest
The authors declare no conflict of interest.
References
- Li, H.; Xiao, S.; Huo, L. Damage investigation and analysis of engineering structures in the Wenchuan earthquake. J. Build. Struct. 2008, 29, 10–19. (In Chinese) [Google Scholar]
- Hoshiba, M.; Iwakiri, K.; Hayashimoto, N.; Shimoyama, T.; Hirano, K.; Yamada, Y.; Ishigaki, Y.; Kikuta, H. Outline of the 2011 off the Pacific coast of Tohoku Earthquake (M w 9.0)-Earthquake Early Warning and observed seismic intensity. Earth Planets Space 2011, 63, 547–551. [Google Scholar] [CrossRef]
- Zhang, J.; Zhang, S.; Zhang, Y.; Huang, L.; Li, Z. Ground motion vulnerability analysis of aqueduct structure based on Copula function. J. Vib. Meas. Diagn. 2019, 39, 8. [Google Scholar]
- Xu, X.Y.; Liu, X.; Jiang, L.; Ali Khan, M.Y. Dynamic Damage Mechanism and Seismic Fragility Analysis of an Aqueduct Structure. Appl. Sci. 2021, 11, 11709. [Google Scholar] [CrossRef]
- Omori, F. On the After-shocks of Earthquakes. Coll. Sci. Imp. Univ. Jpn. 1894, 7, 111–200. [Google Scholar]
- Gutenberg, B.; Richter, C.F. Seismicity of the Earth and Associated Phenomenon, 2nd ed.; Princeton University Press: Princeton, NJ, USA, 1954. [Google Scholar]
- Bath, M. Lateral inhomogeneities in the upper mantle. Tectonophysics 1965, 2, 483–514. [Google Scholar] [CrossRef]
- Utsu, T.; Ogata, Y. The centenary of the Omori formula for a decay law of aftershock activity. J. Phys. Earth 1995, 43, 1–33. [Google Scholar] [CrossRef]
- Shcherbakov, R.; Turcotte, D.L.; Rundle, J.B. A generalized Omori’s law for earthquake aftershock decay. Geophys. Res. Lett. 2004, 31, L11613. [Google Scholar] [CrossRef]
- Chen, K.C.; Wang, J.H. Correlations between the mainshock and the largest aftershock for Taiwan earthquakes. Pure Appl. Geophys. 2012, 169, 1217–1229. [Google Scholar] [CrossRef]
- Tahir, M.; Grasso, J.R.; Amorese, D. The largest aftershock: How strong, how far away, how delayed. Geophys. Res. Lett. 2012, 39, L04301. [Google Scholar] [CrossRef]
- Zhang, S.; Wang, G.; Sa, W. Damage evaluation of concrete gravity dams under mainshock–aftershock seismic sequences. Soil Dyn. Earthq. Eng. 2013, 50, 16–27. [Google Scholar] [CrossRef]
- Pang, R.; Xu, B.; Zhang, X.; Zhou, Y.; Kong, X. Seismic performance investigation of high CFRDs subjected to mainshock-aftershock sequences. Soil Dyn. Earthq. Eng. 2019, 116, 82–85. [Google Scholar] [CrossRef]
- Kong, X.; Zhou, Y.; Zou, D.; Xu, D. Study on aftershock record of Wenchuan Earthquake and aftershock response of Ziping faced rockfill dam. Chin. J. Geotech. Eng. 2008, 25, 134–139. [Google Scholar]
- Zhi, Z.; Zhai, C.; Bao, X.; Pan, X. Seismic capacity estimation of a reinforced concrete containment building considering bidirectional cyclic effect. Adv. Struct. Eng. 2019, 22, 1106–1120. [Google Scholar]
- Yang, F.; Wang, G. Research on damage Energy dissipation of RC Frame Structure under Main Aftershock sequence ground motion. World Earthq. Eng. 2019, 35, 45–52. [Google Scholar]
- GB 50011—2010; Code for Seismic Design of Buildings. China Architecture & Building Press: Beijing, China, 2010. (In Chinese)
- Zheng, X.; Hao, J.; Li, D. Seismic performance evaluation of gravity dam based on incremental dynamic analysis. South-North Water Divers. Proj. Hydraul. Sci. Technol. 2020, 18, 184–190. (In Chinese) [Google Scholar]
- Zhang, A.; Yang, S.; Jiang, Z.; Zhang, W.; Yang, X. Seismic vulnerability analysis of steel frame structures with replaceable lateral energy dissipation devices. Ind. Build. 2023, 1–13. Available online: https://kns.cnki.net/kcms/detail/11.2068.TU.20230224.1521.003.html (accessed on 14 May 2023).
- Zhao, J. Based on Seismic Performance of the Intake Tower for the Seismic Time History Method Research. Master’s Thesis, Xi’an University of Science and Technology, Xi’an, China, 2021. [Google Scholar]
- Li, J. Based on Viscoelastic Artificial Boundary of Gravity Dam Damage Analysis and Vulnerability Research. Master’s Thesis, University of North China Water Conservancy and Hydropower, Zhengzhou, China, 2022. [Google Scholar]
- Hao, J. Based on the Seismic Time History Analysis of the Intake Tower at the Top of the Structure Optimization and Seismic Performance Evaluation. Master’s Thesis, Hebei University of Engineering, Handan, China, 2020. [Google Scholar]
- Alembagheri, M.; Ghaemian, M. Seismic assessment of concrete gravity dams using capacity estimation and damage indexes. Earthq. Eng. Struct. Dyn. 2012, 42, 123–144. [Google Scholar] [CrossRef]
- Alembagheri, M.; Seyedkazemi, M. Seismic performance sensitivity and uncertainty analysis of gravity dams. Earthq. Eng. Struct. Dyn. 2015, 44, 41–58. [Google Scholar] [CrossRef]
- Liu, P.; Wang, C.; Zhang, J. Vulnerability analysis of high strength reinforced concrete frame under main aftershock. World Earthq. Eng. 2022, 38, 20–27. [Google Scholar]
- Sun, J.; Wu, J.; Lu, X. Study on seismic vulnerability of frame-supported multi-ribbed composite wall structures. Eng. Mech. 2023, 40, 61–72. [Google Scholar]
- Hatzigeorgiou, G.D. Ductility demand spectra for multiple near- and far-fault earthquakes. Soil Dyn. Earthq. Eng. 2010, 30, 170–183. [Google Scholar] [CrossRef]
- Liang, Y.; Yan, J.; Niu, H.; Li, J. Time-varying seismic vulnerability analysis of offshore pier considering main aftershock. J. Seism. Eng. 2019, 41, 8. [Google Scholar]
- Wen, W. Research on Damage Spectrum of Ground Motion Based on Main Aftershock Sequence; Harbin Institute of Technology: Harbin, China, 2011. [Google Scholar]
Disclaimer/Publisher’s Note: The statements, opinions and data contained in all publications are solely those of the individual author(s) and contributor(s) and not of MDPI and/or the editor(s). MDPI and/or the editor(s) disclaim responsibility for any injury to people or property resulting from any ideas, methods, instructions or products referred to in the content. |
© 2023 by the authors. Licensee MDPI, Basel, Switzerland. This article is an open access article distributed under the terms and conditions of the Creative Commons Attribution (CC BY) license (https://creativecommons.org/licenses/by/4.0/).

