Article

Vulnerability of Affordable Housing to Global Warming in South Africa: Case Study of a Masonry House in Johannesburg

School of Civil and Environmental Engineering, University of the Witwatersrand, Johannesburg 2000, South Africa
Buildings 2023, 13(6), 1494; https://doi.org/10.3390/buildings13061494
Submission received: 19 April 2023 / Revised: 2 June 2023 / Accepted: 5 June 2023 / Published: 9 June 2023
(This article belongs to the Special Issue Thermal Comfort in Built Environment: Challenges and Research Trends)

Abstract

:
Global warming is expected to lead to longer and more intense heatwaves, which will have negative environmental and socioeconomic impacts around the world. South Africa is projected to experience significant warming, with surface temperatures possibly increasing by up to 3 °C by mid-century. This warming trend has implications for architecture, as the demand for cooling in buildings could rise dramatically. However, socioeconomic conditions in developing countries may limit the use of air conditioning to mitigate indoor overheating. In South Africa, research has shown that government provided low-cost housing structures are thermally inefficient, with temperatures occasionally exceeding outdoor levels. Residents often rely on natural ventilation and personal actions to cope with heat. However, the effects of climate change may render these strategies insufficient if energy poverty and housing improvement are not addressed. This study aims to examine the impact of global warming on a high mass, naturally ventilated, affordable housing structure in Johannesburg, South Africa. Measured operative temperature data from a long-term experimental study, alongside adaptive temperature limits to evaluate overheating, highlight the vulnerability of indoor spaces without adequate insulation and/or thermal mass. The results underscore concerns about the performance of low-cost and affordable housing in warmer future climates in the South African interior.

1. Introduction

The Intergovernmental Panel on Climate Change (IPCC) has reported that human activities have caused global warming, with global surface temperature reaching 1.1 °C above pre-industrial levels [1]. Climate change has also led to an increase in the frequency of heat waves (HWs), resulting in negative environmental and socioeconomic impacts in numerous regions worldwide [2]. As climate models predict rising surface temperatures in many regions across the world, the implications of climate change for architecture have become increasingly important. According to projections obtained from a dynamic regional climate model by the authors of the South African Risk and Vulnerability Atlas [3], South Africa is expected to experience the greatest future warming over the interior of the country, with temperatures projected to increase more than the global mean temperature [4]. Studies indicate that daily maximum temperatures may increase by up to 3 °C by mid-century based on high greenhouse gas (GHG) emission scenarios [2,5]. It is important to note that the predicted increase/decrease rates assigned to these climate models have some uncertainty, largely related to global emission scenarios. Nonetheless, even moderate GHG concentrations in the models indicate that HWs are expected to occur more frequently, last longer, and become more intense in South Africa [2].
Kruger and Mbatha (2021) presented evidence of gradual warming over the interior of South Africa, showing yearly average temperature deviation from the base period (Figure 1) for OR Tambo International Airport, Johannesburg, which has the most reliable long-term record in the region [6]. The presented data show that all years beyond 2001 have had average surface temperatures higher than the long-term average, with increased (1) hot extremes, (2) number of hot days and nights, and (3) duration of warm spells in the province (Gauteng) [6]. The observed rise in temperatures over the past two decades in Johannesburg may partially be ascribed to the amplification of the urban heat island (UHI) effect, and studies have highlighted the increased tendency of overheating, and associated health risks are associated with the UHI effect in large metropolitan areas [7,8]. The distinct trend in Figure 1 is, however, not unique to Johannesburg; similar patterns have been recorded across long-standing climate monitoring stations distributed throughout South Africa [6]. This widespread phenomenon implies that multiple environmental and human-induced factors may be contributing to the escalating temperatures. Many stations across South Africa, including Johannesburg International Airport, have also recorded their two hottest years on record in the last decade, with 2015 being the hottest (in many cases) due to the strongest El Niño event on record (Figure 2) [9,10]. In the South African interior during the summer, the occurrence of El Niño is typically associated with warmer and drier conditions, whereas the occurrence of La Niña is linked with cooler and wetter conditions [10].
Global warming poses a significant threat to the future performance of existing residential buildings, particularly in terms of energy demand and overheating [11,12,13]. In response, there has been a growing body of research dedicated to the topic, which has involved either full-scale testing or, most commonly, thermal and energy simulation studies [11,12,13,14,15,16,17,18,19,20,21,22,23]. The predominant approach typically involves either the exploration of extreme historical data or the forecast of future scenarios. The existing literature indicates that climate change-induced overheating could be a significant problem in many regions across the world [14,15,16]. However, the impact has large dependency on geographical location (climate) and building type [12]. Critical areas of concern include future deterioration of indoor comfort, at-risk populations, and upgrading regulations for future warmer climates. Moreover, studies have identified an anticipated increase in cooling loads and a need for the adoption of alternate cooling strategies [17,18]. For instance, a recent study by Andrić et al. (2021) reviewed numerous numerical studies on buildings in various climates. The findings suggest that cooling demand in 2050 could increase substantially, i.e., by up to 1050% compared to reference levels, contingent on specific building properties and prevailing climate conditions [19]. Several adaptation strategies have been examined to mitigate predicted degradation in future indoor thermal comfort. These include passive cooling strategies [17] and improvements in the thermal characteristics of building materials—insulation, glazing, and solar protection—to alleviate the risk of overheating [16,21,22,23].
In many developing countries, however, socioeconomic conditions may inhibit people’s ability to mitigate overheating and indoor discomfort through adaptive retrofitting or artificial means such as air conditioning (AC) [24]. For instance, a 2015 study [25] reported that the penetration rate of AC in residential households in South Africa is just 4%, but it is as high as 40% in the highest income households. Wright et al. (2022) examined perceptions of thermal comfort among people in a structurally disadvantaged community in Limpopo province, South Africa, and found that only 17 out of 406 respondents (<4%) selected “Use an air conditioner” as a mechanism to cope with thermal discomfort [26]. Instead, people largely relied on adaptive actions such as sitting outdoors in the shade or opening windows and doors. Other studies have also shown that lower-income households depend on employing personal action to improve their thermal situations, such as natural ventilation [23,27].
However, climate change may negate the impact of these actions in future climate years if energy poverty and infrastructure improvement (retrofitting) are not considered alongside personal actions. Thapa (2022) conducted a simulation study, which revealed that naturally ventilated low-rise concrete dwellings in northeast India would be unable to suppress the effects of global warming, and the indoor environment would deteriorate in future conditions [23]. In situ studies conducted in the South African interior have also highlighted deficiencies with some types of low-cost residential buildings in the present climate [26,27,28]. For instance, Naicker et al. (2017) measured indoor air temperature and relative humidity in 59 households across Johannesburg, South Africa, and found that temperatures in low-cost government houses exceeded outdoor temperatures by as much as 5 °C. The reported deficiencies with most of these formal housing structures were that (1) the walls were only 150 mm thick, (2) most lacked ceilings, and (3) none had any type of roof insulation [27]. In a similar study, Mabuya and Scholes (2020) reported that most post-apartheid era houses examined in their study were thermally inefficient [28]. Wright et al. (2022) also examined indoor dwelling and outdoor temperatures in Giyani, Limpopo province, and found that the maximum measured indoor temperature was approximately 36 °C, while the maximum outdoor temperature was 40 °C. The outdoor and indoor temperatures were comparable on several hot summer days during the study period, which meant that natural ventilation and sitting outdoors offered little to no reprieve from the heat [26].
The primary objective of this study is to investigate the potential influence of global warming on the performance of high-mass residential buildings in South Africa. To achieve this, data from a long-term experimental study conducted on an earth masonry house in Johannesburg were analyzed [29,30]. The house was monitored from 2018 to 2021, during which various passive cooling techniques were implemented to improve its thermal performance. Notably, the study period encompassed the second and fourth warmest years ever recorded in Johannesburg, as illustrated in Figure 1. This provided an opportunity for a practical investigation of global warming’s potential effects on a high-mass structure within the South African context. Although the summer of the second warmest year (2019) coincided with a neutral ENSO (El Niño Southern Oscillation) phase [31], the annual average temperature exceeded Johannesburg’s long-term average by more than 1.75 °C, making it second only to the hottest year ever recorded in 2015.
Similar trends were observed for annual average maximum temperatures, as displayed in Table 1 [31,32,33]. In 2020, the average maximum temperature was marginally lower than those in 2018 and 2019 but still comparable to the 30-year base period. This can be primarily attributed to a moderate La Niña phase during the latter half of the year [34]. Table 2 presents the average maximum and daily mean temperatures for the early summer months (October and November), which correspond to the data and analysis discussed in this paper. The temperatures recorded at OR Tambo Airport during October and November 2019 significantly exceeded the historical long-term means for the same period, as evidenced in Table 2.
The extraordinary heat of the 2019 summer prompted a more in-depth comparative analysis with other years monitored during the testing period. This analysis exposed the vulnerability of rooms without sufficient insulation, thermal mass, and ventilation to overheating during periods of very high temperatures. The first-floor spaces share some deficiencies with much of the formal low-cost housing infrastructure in South Africa, and the results presented herein support concerns raised in recent studies [26,28] about the performance of low-cost and affordable housing in the face of warmer future climates in the South African interior.

2. Materials and Methods

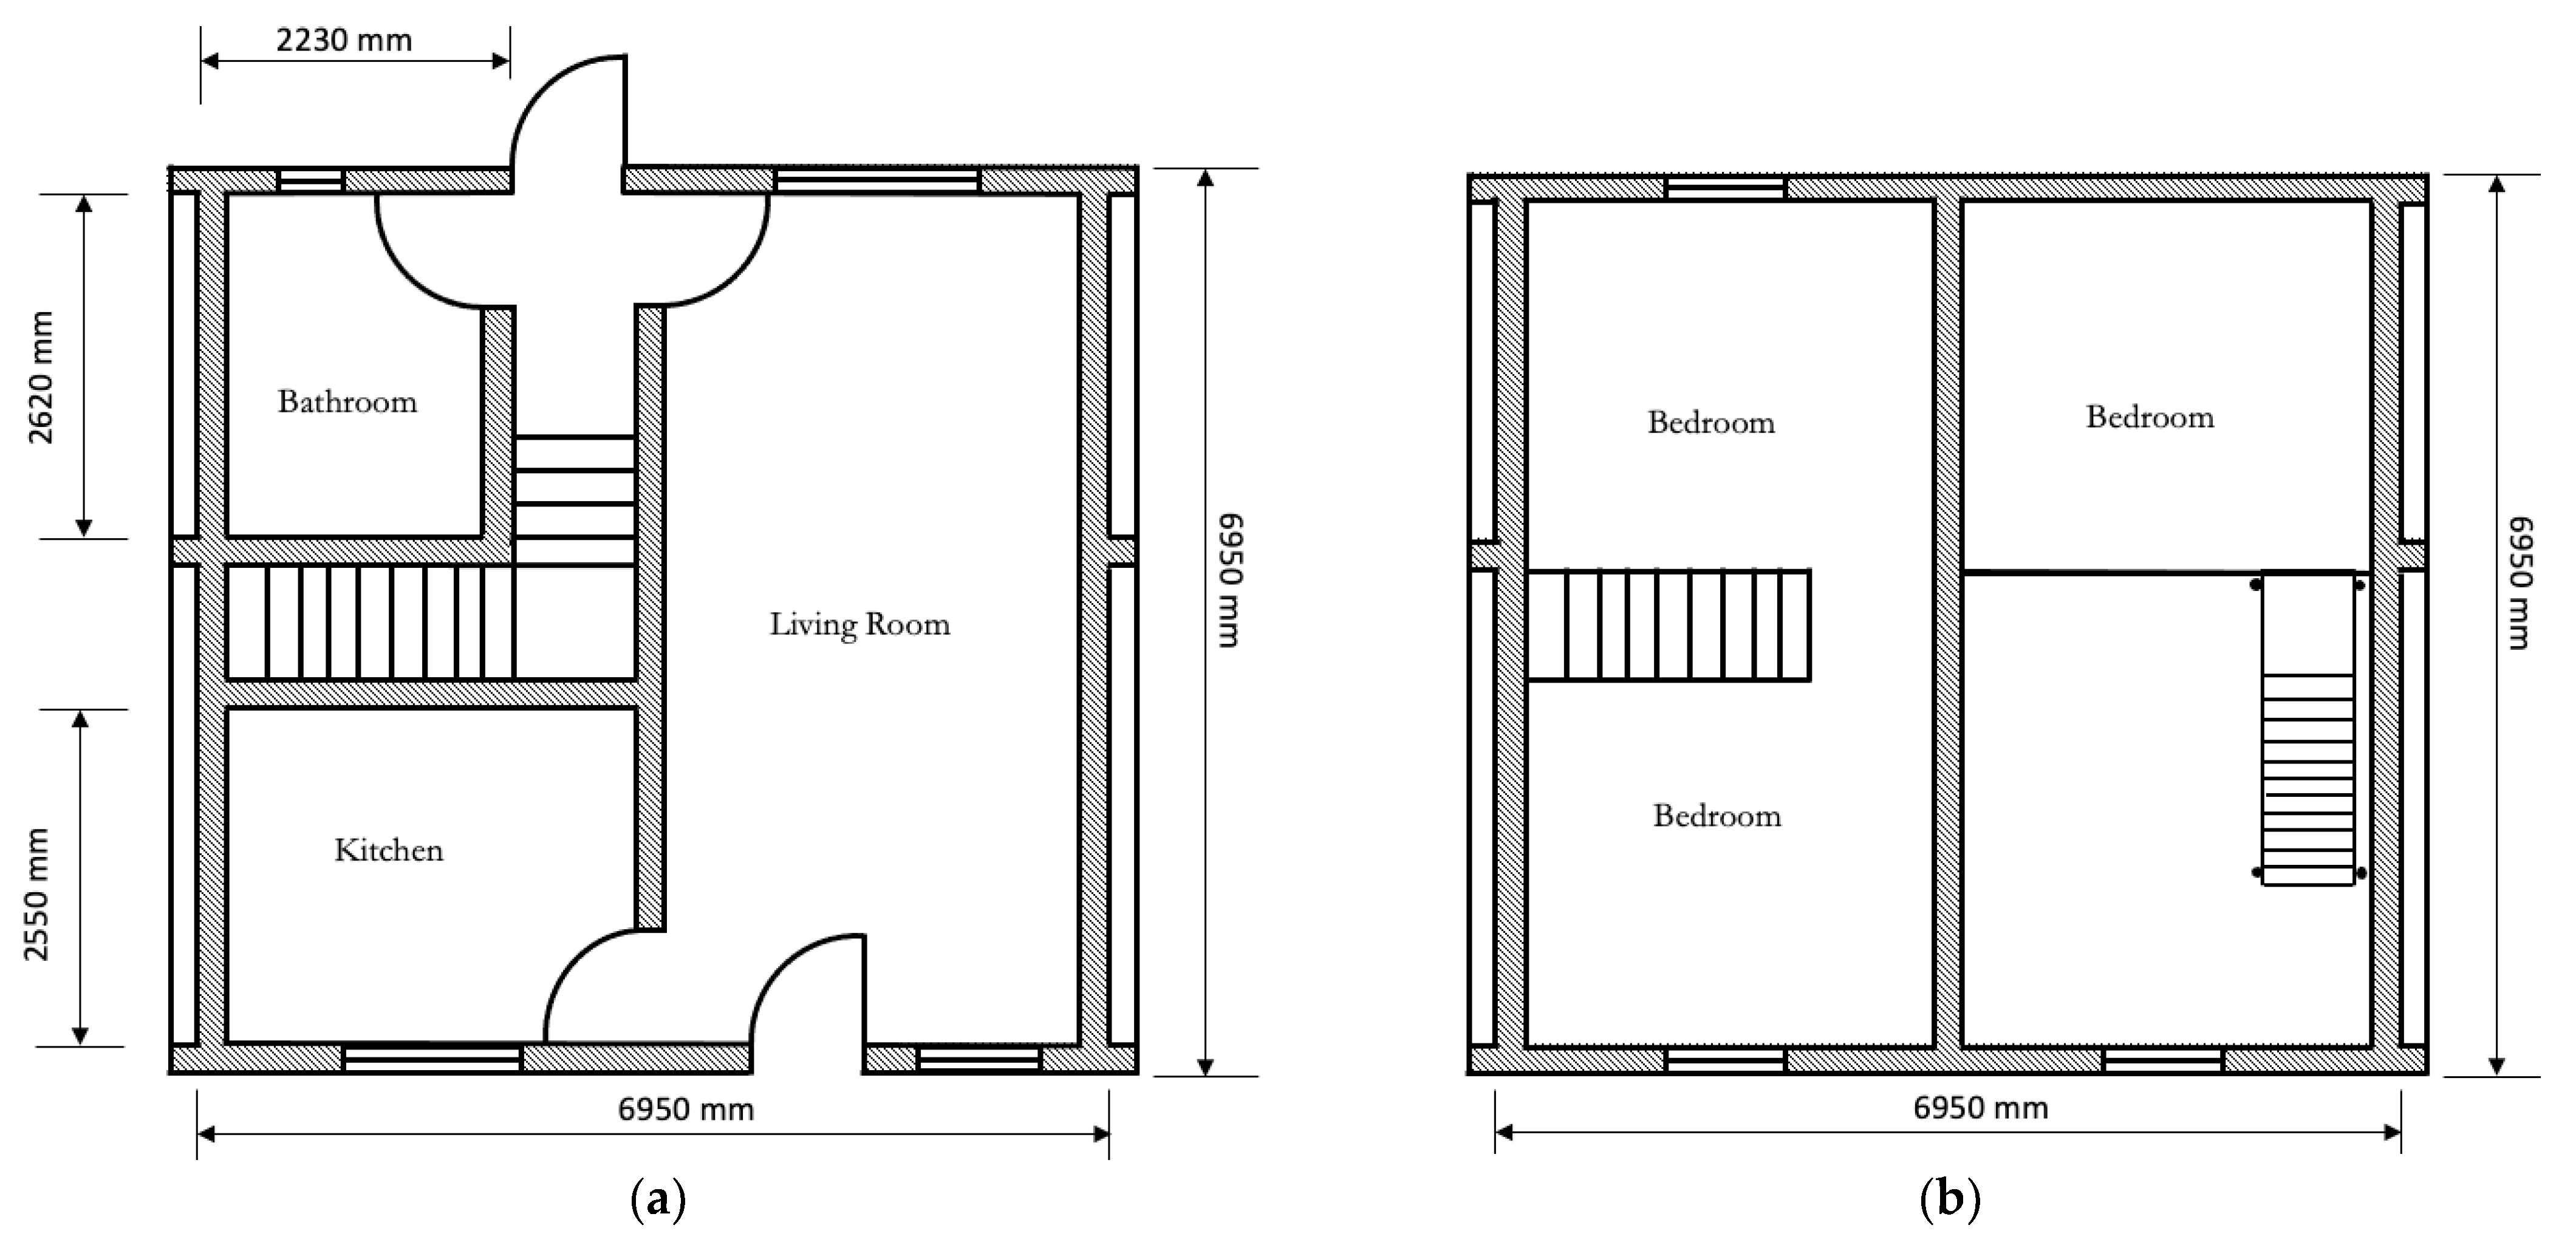
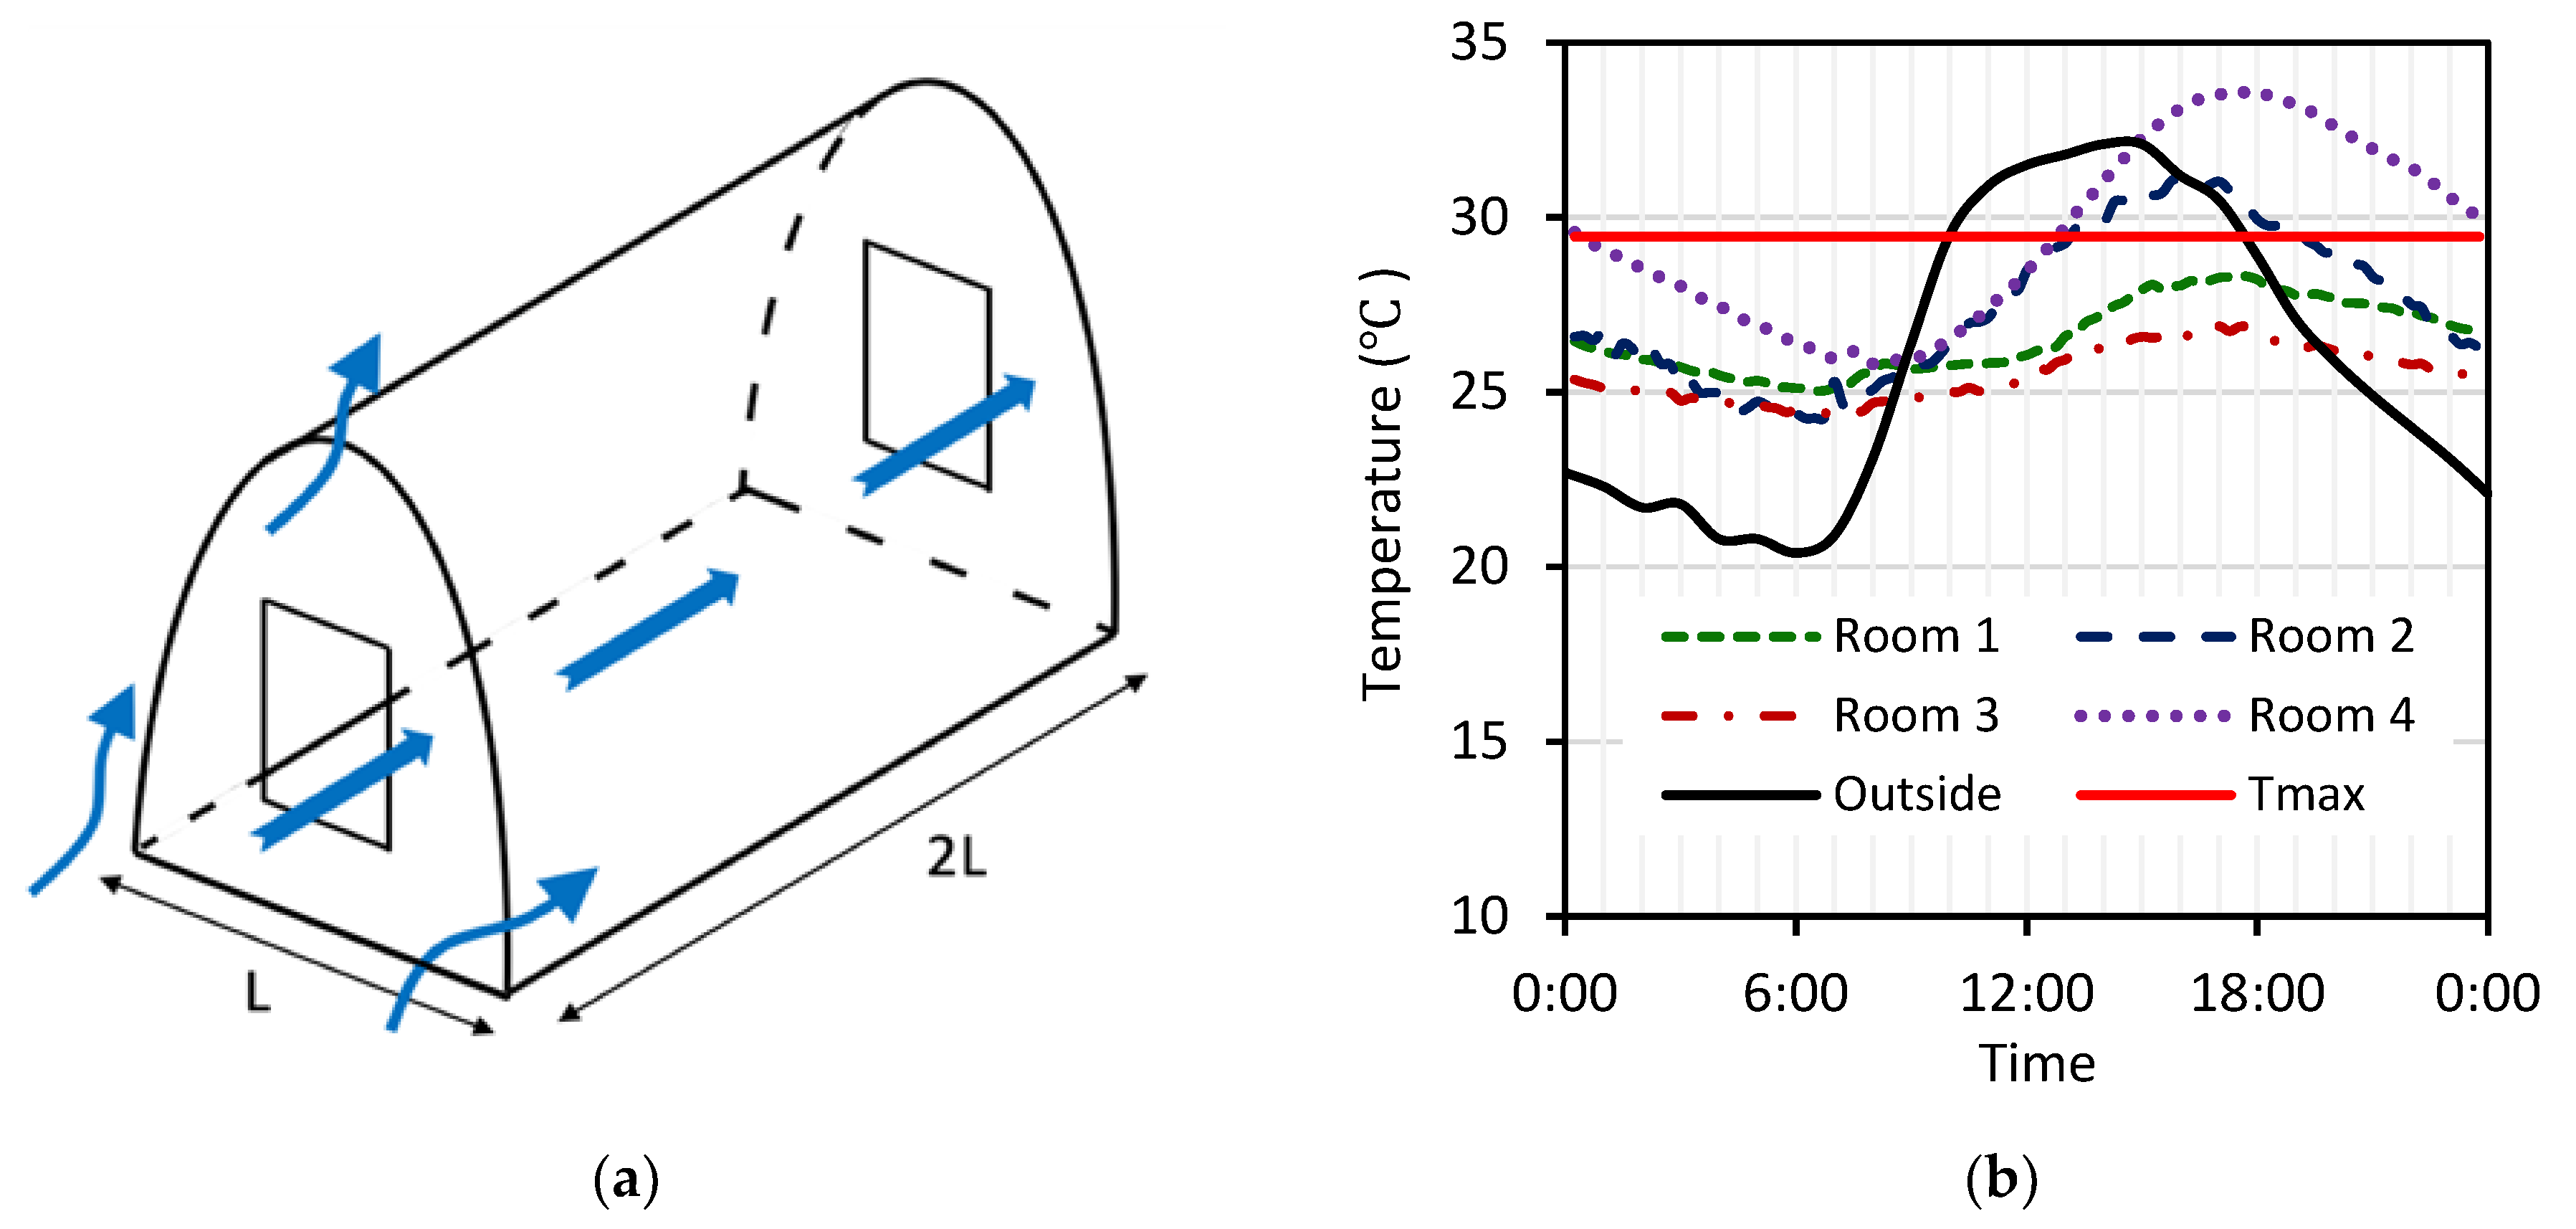
2.1. House Layout and Characteristics

The two-story house assessed in the study was located on the University of the Witwatersrand campus in Johannesburg, South Africa (coordinates: 26°11′09″ S 28°01′30″ E). The building layout is shown in Figure 3a,b. The first-floor spaces were designated as bedrooms and assumed to be occupied between 8:00 p.m. and 6:00 a.m. (i.e., a night-time space). The roof of the house consisted of two steep catenary vaults, enclosing the first-floor spaces, as shown in Figure 4a. The roof structure is somewhat unique: pitched roofs with wooden trusses topped with tiles or metal sheeting are the most common roofing arrangement across South Africa; the steep curved profile of the roof was chosen for its architectural performance, offering more usable floor space than pitched roofs and complying with dimensional and space requirements more effectively. All spaces met the dimensional requirements specified in the National Building Regulations [35].
The load and non-load bearing ground floor walls were constructed using interlocking blocks, made from recycled building rubble, while the vaults were made of compressed stabilized earth blocks (CSEBs) using traditional mortar. The shell, including internal plaster, was 170 mm thick, and the vertical walls were 220 mm thick. The first-floor slab was 170 mm deep and consisted of a rib and block system. The windows are comprised of aluminum framing and single-glazed low-E glass. No overhangs or shading elements were considered in the present study. The estimated and manufacturers’-quoted thermal transmittance (U-value) for the main elements of the building envelope are given in Table 3. Values for the wall and floor slabs were calculated using the approaches outlined in CIBSE Guide A [36]. The maximum U-value for masonry walling given in the deemed-to-satisfy approach in NBR [37] is 2.86 W/m2K (given in the code by the minimum thermal resistance of R = 0.35 m2K/W). Fenestration and openings also comply with the deemed to-satisfy requirements for ventilation and the minimum energy performance requirements (fenestration area < 15 % of net floor area per story).

2.2. Experimental Setup

Operative temperature (Top) was measured 1.1 m above the floor using 40 mm black globe thermometers positioned in the center of each space/room. The thermometers recorded temperatures every 15 min using an Agilent data-acquisition unit (Agilent Technologies Inc., Santa Clara, CA, USA). The evaluation encompassed four distinct spaces, which were designated as Room 1, Room 2, Room 3, and Room 4, as depicted in Figure 4b. Outdoor air temperature was measured using a thermo-hygrometer wirelessly connected to an Oregon Scientific Weather Station (Oregon Scientific Inc., Tualatin, OR, USA). The accuracy of the thermocouples in the black globe thermometers was around ±0.5 °C, and the manufacturer’s quoted accuracy for the outdoor thermometer was ±1 °C. More details on the instrumentation and setup can be found in [30].

2.3. Overheating Criteria

The assessment for indoor overheating was undertaken with the adaptive temperature limits specified by BS EN 15251 [38] in combination with the guidelines developed by the Chartered Institution of Building Services Engineers (CIBSE) [39]. Adaptive comfort models and accompanying temperature limits consider the occupants’ ability to adapt to their environment by adjusting their behavior, clothing, and surroundings to achieve comfort under a range of indoor conditions. This contrasts with traditional, prescriptive models, based on fixed indoor temperature ranges.
The adaptive comfort model used in BS EN 15251 expresses the comfort temperature through its relationship with the outdoor temperature, and the following equation is used to estimate the comfortable temperature (Tcomf) in naturally ventilated buildings:
Tcomf = 0.33 Trm + 18.8 (where Trm > 10 °C).
Trm is the exponentially weighted running mean temperature (°C) for the day under consideration. This calculation puts higher importance on the most recent days. The equation for the determination of the running mean temperature is given by Equation (2):
Trm = [1 − α]{Tod-1 + αTod-2 + α2Tod-3…}.
α is a constant and Tod-1, Tod-2, Tod-3, etc., are the daily mean temperatures for yesterday, the day before yesterday, and so on. A value of 0.8 for the parameter ‘α’ provides the best correlation between Trm and Tcomf based on comfort surveys conducted throughout Europe [39,40]. Category II (Normal expectation) limits prescribed in BS EN 15251 were assumed in the present study, i.e., an acceptable temperature range of ±3 °C, about the comfort temperature (Tcomf) for naturally ventilated buildings. The maximum acceptable temperature (Tmax) is subsequently given by Equation (3):
Tmax = Tcomf + 3 °C.
The CIBSE guidelines use three criteria to evaluate the risk of overheating [39]. These criteria account for the severity and frequency of overheating and are defined based on the difference (ΔT) between the indoor operative temperature (Top) and the maximum acceptable temperature (Tmax), as given by Equation (4). Overheating in a building or internal space is identified if it violates any two of the three criteria given in Table 4.
ΔT = Top − Tmax (rounded to the nearest whole degree)
The CIBSE guidelines set an absolute upper limit on indoor operative temperature, Tupp, which is 4 °C above the maximum temperature, as given in Equation (5).
Tupp = Tmax + 4 °C

3. Results

From January 2018 to March 2021, the building’s thermal comfort was assessed through periodic monitoring. Various strategies were employed during this period to enhance the comfort of specific internal spaces, such as external shading, reflective roof paint, and insulation of the ceiling. However, this study does not primarily focus on the effectiveness of these alterations. Instead, it selectively presents results demonstrating the influence of extreme high temperatures on building performance. For comparative purposes, the analysis concentrates on the early summer months of October and November in 2018, 2019, and 2020, when darker roof paint was applied.
During the evaluation, certain spaces experienced retrofitting or substantial changes in roof color, and the data collected during these periods have been excluded; specifically, data for Room 2 from the last few days of October and all of November in 2018, as well as all days in October and November 2020, have been disregarded. It is worth noting that the roofs were maroon colored in 2018 and grey in 2019 and 2020, which could have influenced indoor temperature levels to some extent.
The subsequent sub-sections will examine the performance of all monitored spaces and provide a detailed analysis of overheating in the more heat-vulnerable first-floor rooms.

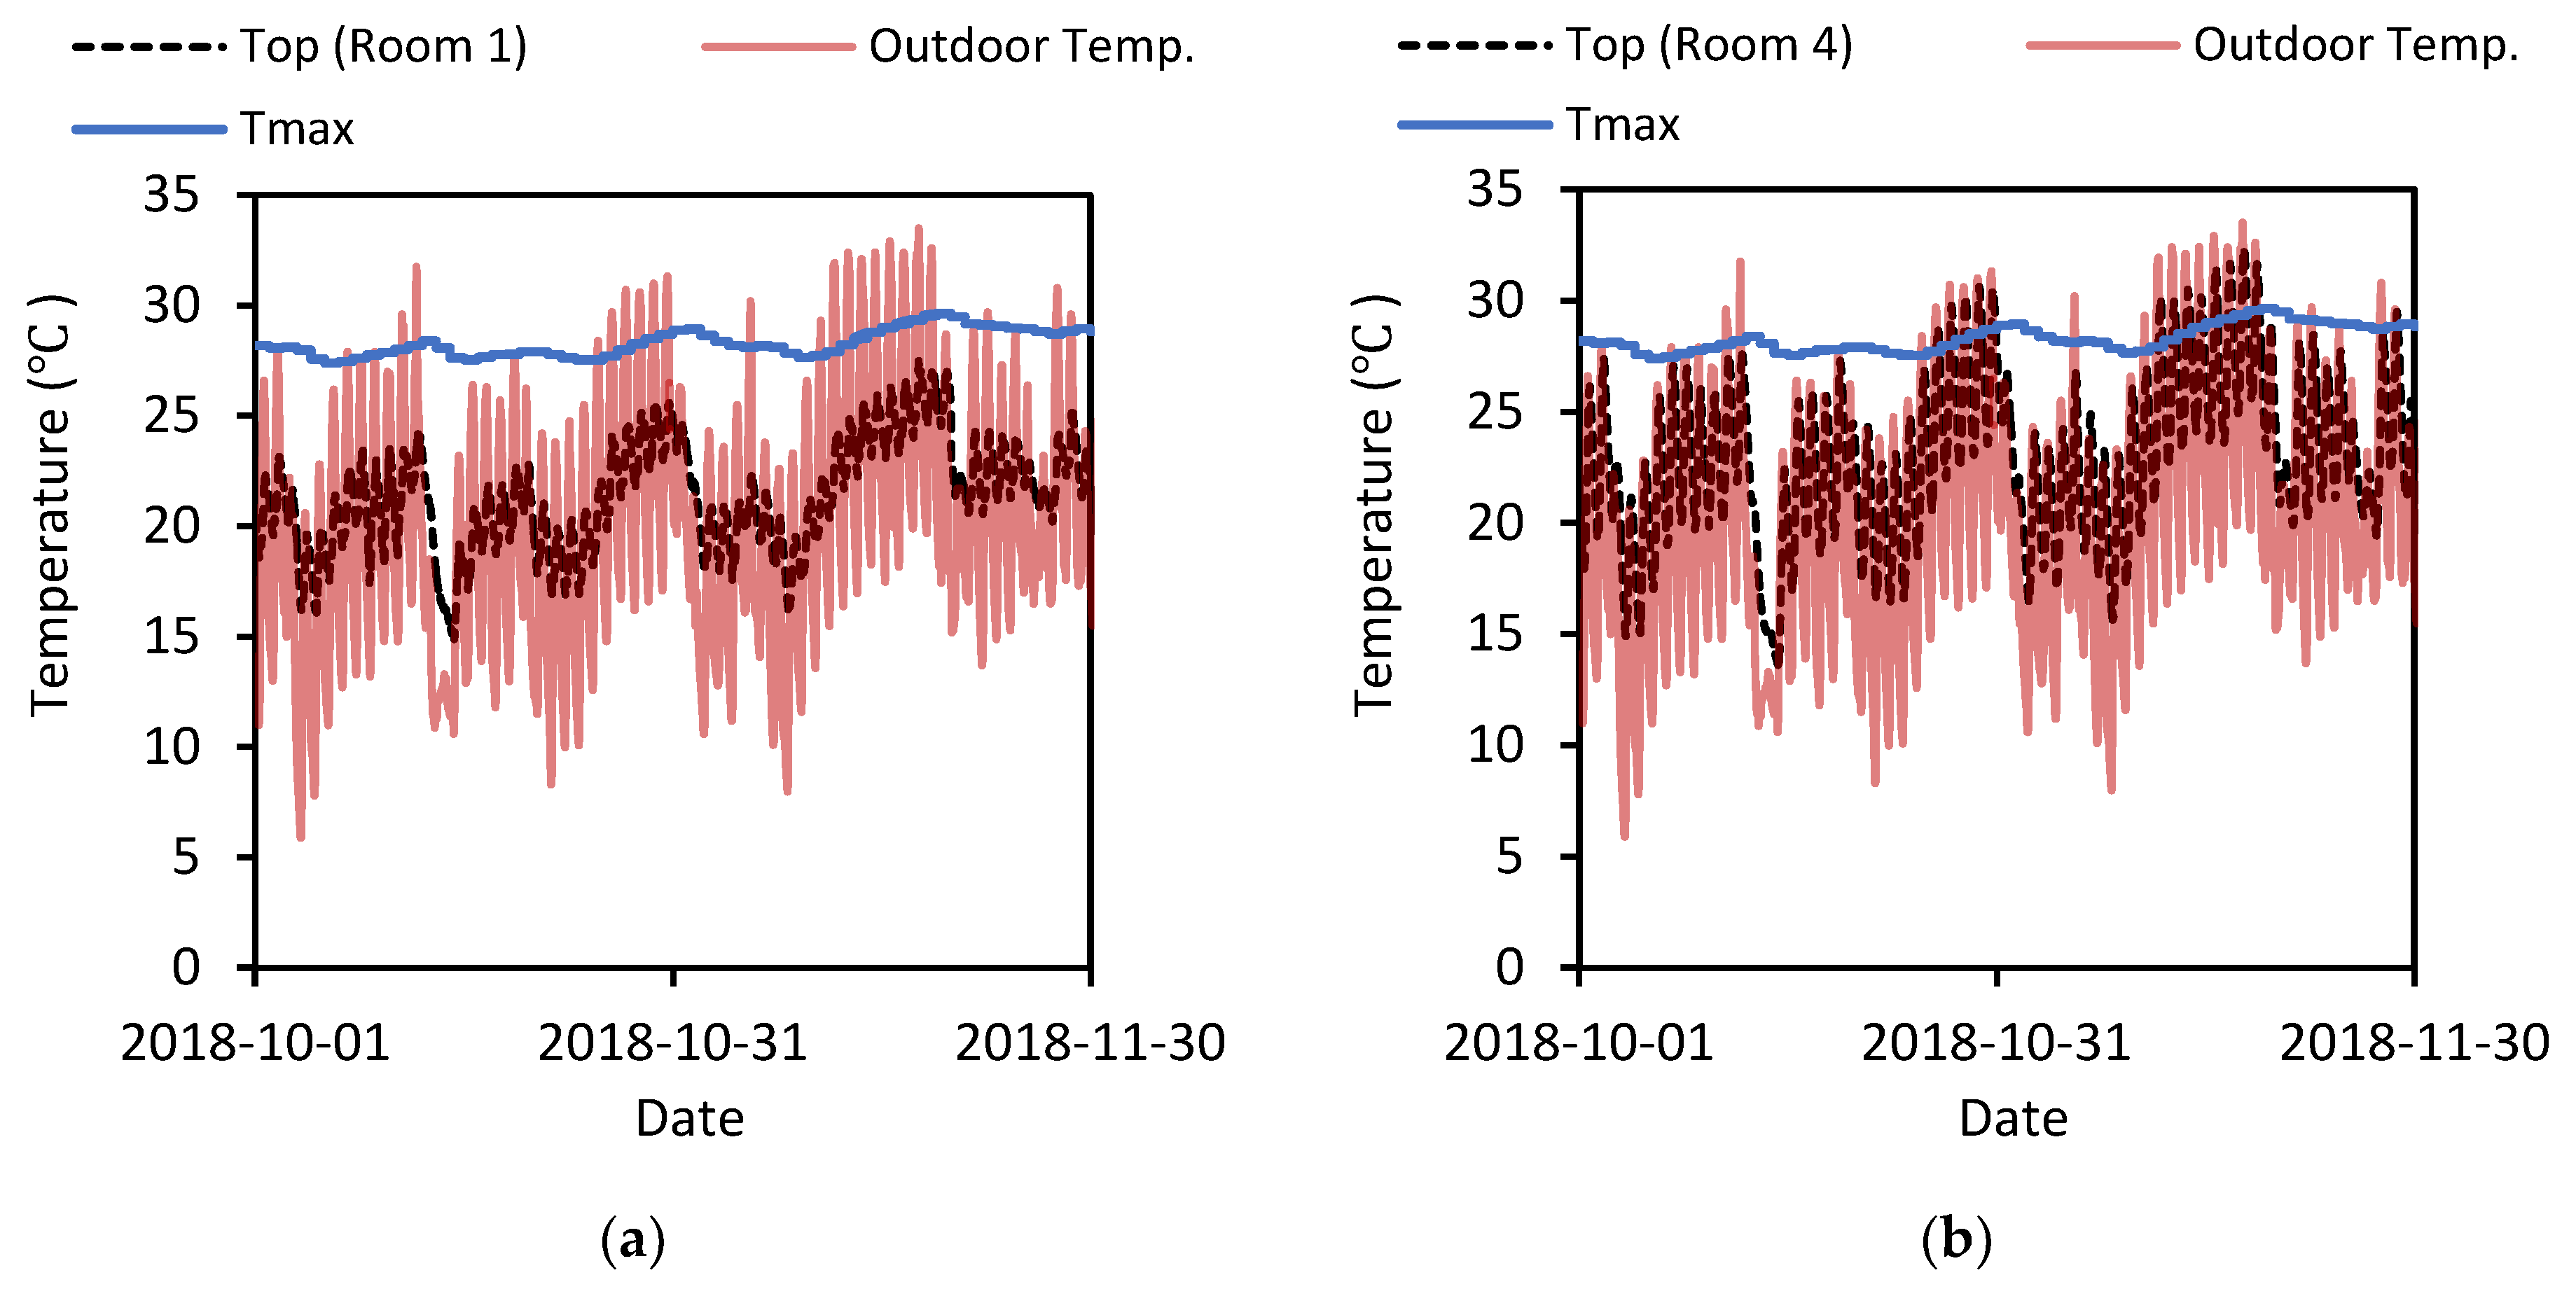
3.1. Ground versus First Floor Spaces

It is widely acknowledged that high-mass buildings, built using materials such as concrete and brickwork, typically exhibit a more significant temperature lag (the delay between outdoor temperatures attaining their highest or lowest points and the subsequent indoor temperature response) in comparison to buildings composed of lightweight materials. Figure 5a,b shows the indoor operative temperature plotted alongside outdoor air temperature for a ground and first-floor space during the early summer period of 2018. A clear lag and attenuation of peak indoor temperatures is apparent for the ground floor space, which highlights the benefit of high thermal mass in maintaining more stable indoor temperatures throughout the day (despite the large fluctuations in outdoor temperatures, as shown in Figure 5). In contrast, the first-floor space did not moderate high temperatures as effectively (Figure 5b) and other means (beyond thermal mass) would need to be implemented to improve the overall thermal performance of the space. The higher recorded temperatures in the first-floor space can be ascribed to the increased exposure of the of the roof envelope and its lower surface albedo than the ground floor walls, as well as the buoyant warm air rising from the ground floor spaces (passages and doors were open during the assessments). Surface albedo and solar exposure are, however, the dominant aspects affecting heat gain in the first-floor spaces [26].
Figure 6a–d display the hourly indoor operative temperature plotted against the outdoor air temperature for all evaluated spaces during the study period. The steep positive slopes and high correlation coefficients (R) of the linear trendlines in Figure 6c,d suggest a strong positive correlation between outdoor and indoor temperatures, whereas the more gradual slopes in Figure 6a,b imply a weaker relationship for first-floor spaces. Although natural ventilation typically results in greater temperature fluctuations compared to artificially heated and cooled spaces, the first-floor spaces exhibit a notably significant range in temperature through the study period. Furthermore, indoor operative temperatures frequently exceeded Tmax in the first-floor spaces, whereas temperatures in the ground-floor spaces did not exceed this limit (Figure 5). Based on the data presented in Figure 5 and Figure 6, only the first-floor spaces were assessed for overheating during the early summer period of 2018, 2019, and 2020 in the subsequent sections.

3.2. Exceedance of Tmax

Figure 7, Figure 8 and Figure 9 illustrate the outdoor air temperature and indoor operative temperatures for the first-floor spaces during the assessment period corresponding to the years 2018, 2019, and 2020, respectively. Indoor temperatures frequently surpassed the maximum threshold temperature (Tmax) during the 2nd (2019), 4th (2018), and 37th (2020) warmest years on record. It is important to mention that some data from 2019 are unavailable due to backup power supply issues with the data logger.
The most significant exceedance of Tmax was observed in Room 4, as depicted in Figure 7d, Figure 8d and Figure 9d. On hot summer days, particularly during heatwaves, the operative temperature routinely surpassed the daily maximum temperature (Tmax), beginning in the early afternoon, around 2:00 p.m., and persisting until around midnight. In contrast, Room 2 featured large windows in each gable wall, which were mostly open during late afternoons and early evenings. This facilitated natural ventilation and contributed to the cooler temperatures and fewer instances of Tmax exceedance in this space [29]. However, regardless of the presence or absence of cross-ventilation, the first-floor spaces experienced numerous days with operative temperatures (Top) exceeding Tmax.
Upon comparing the plots for 2018 (Figure 7), 2019 (Figure 8), and 2020 (Figure 9), it becomes evident that the maximum threshold temperature (Tmax) was surpassed most frequently during the 2019 assessment period, followed by 2020, and then 2018. Focusing on the worst-performing space, Room 4, the number of days with operative temperatures (Top) exceeding Tmax were 14, 35, and 19 for 2018, 2019, and 2020, respectively. The days of exceedance during the October–November period in 2019 considerably outpaced those in the same periods for 2018 and 2020. The lower number of days exceeding Tmax for the 2018 period may be attributed to factors such as a different roof color, as well as lower minimum outdoor temperatures during October and November that year.

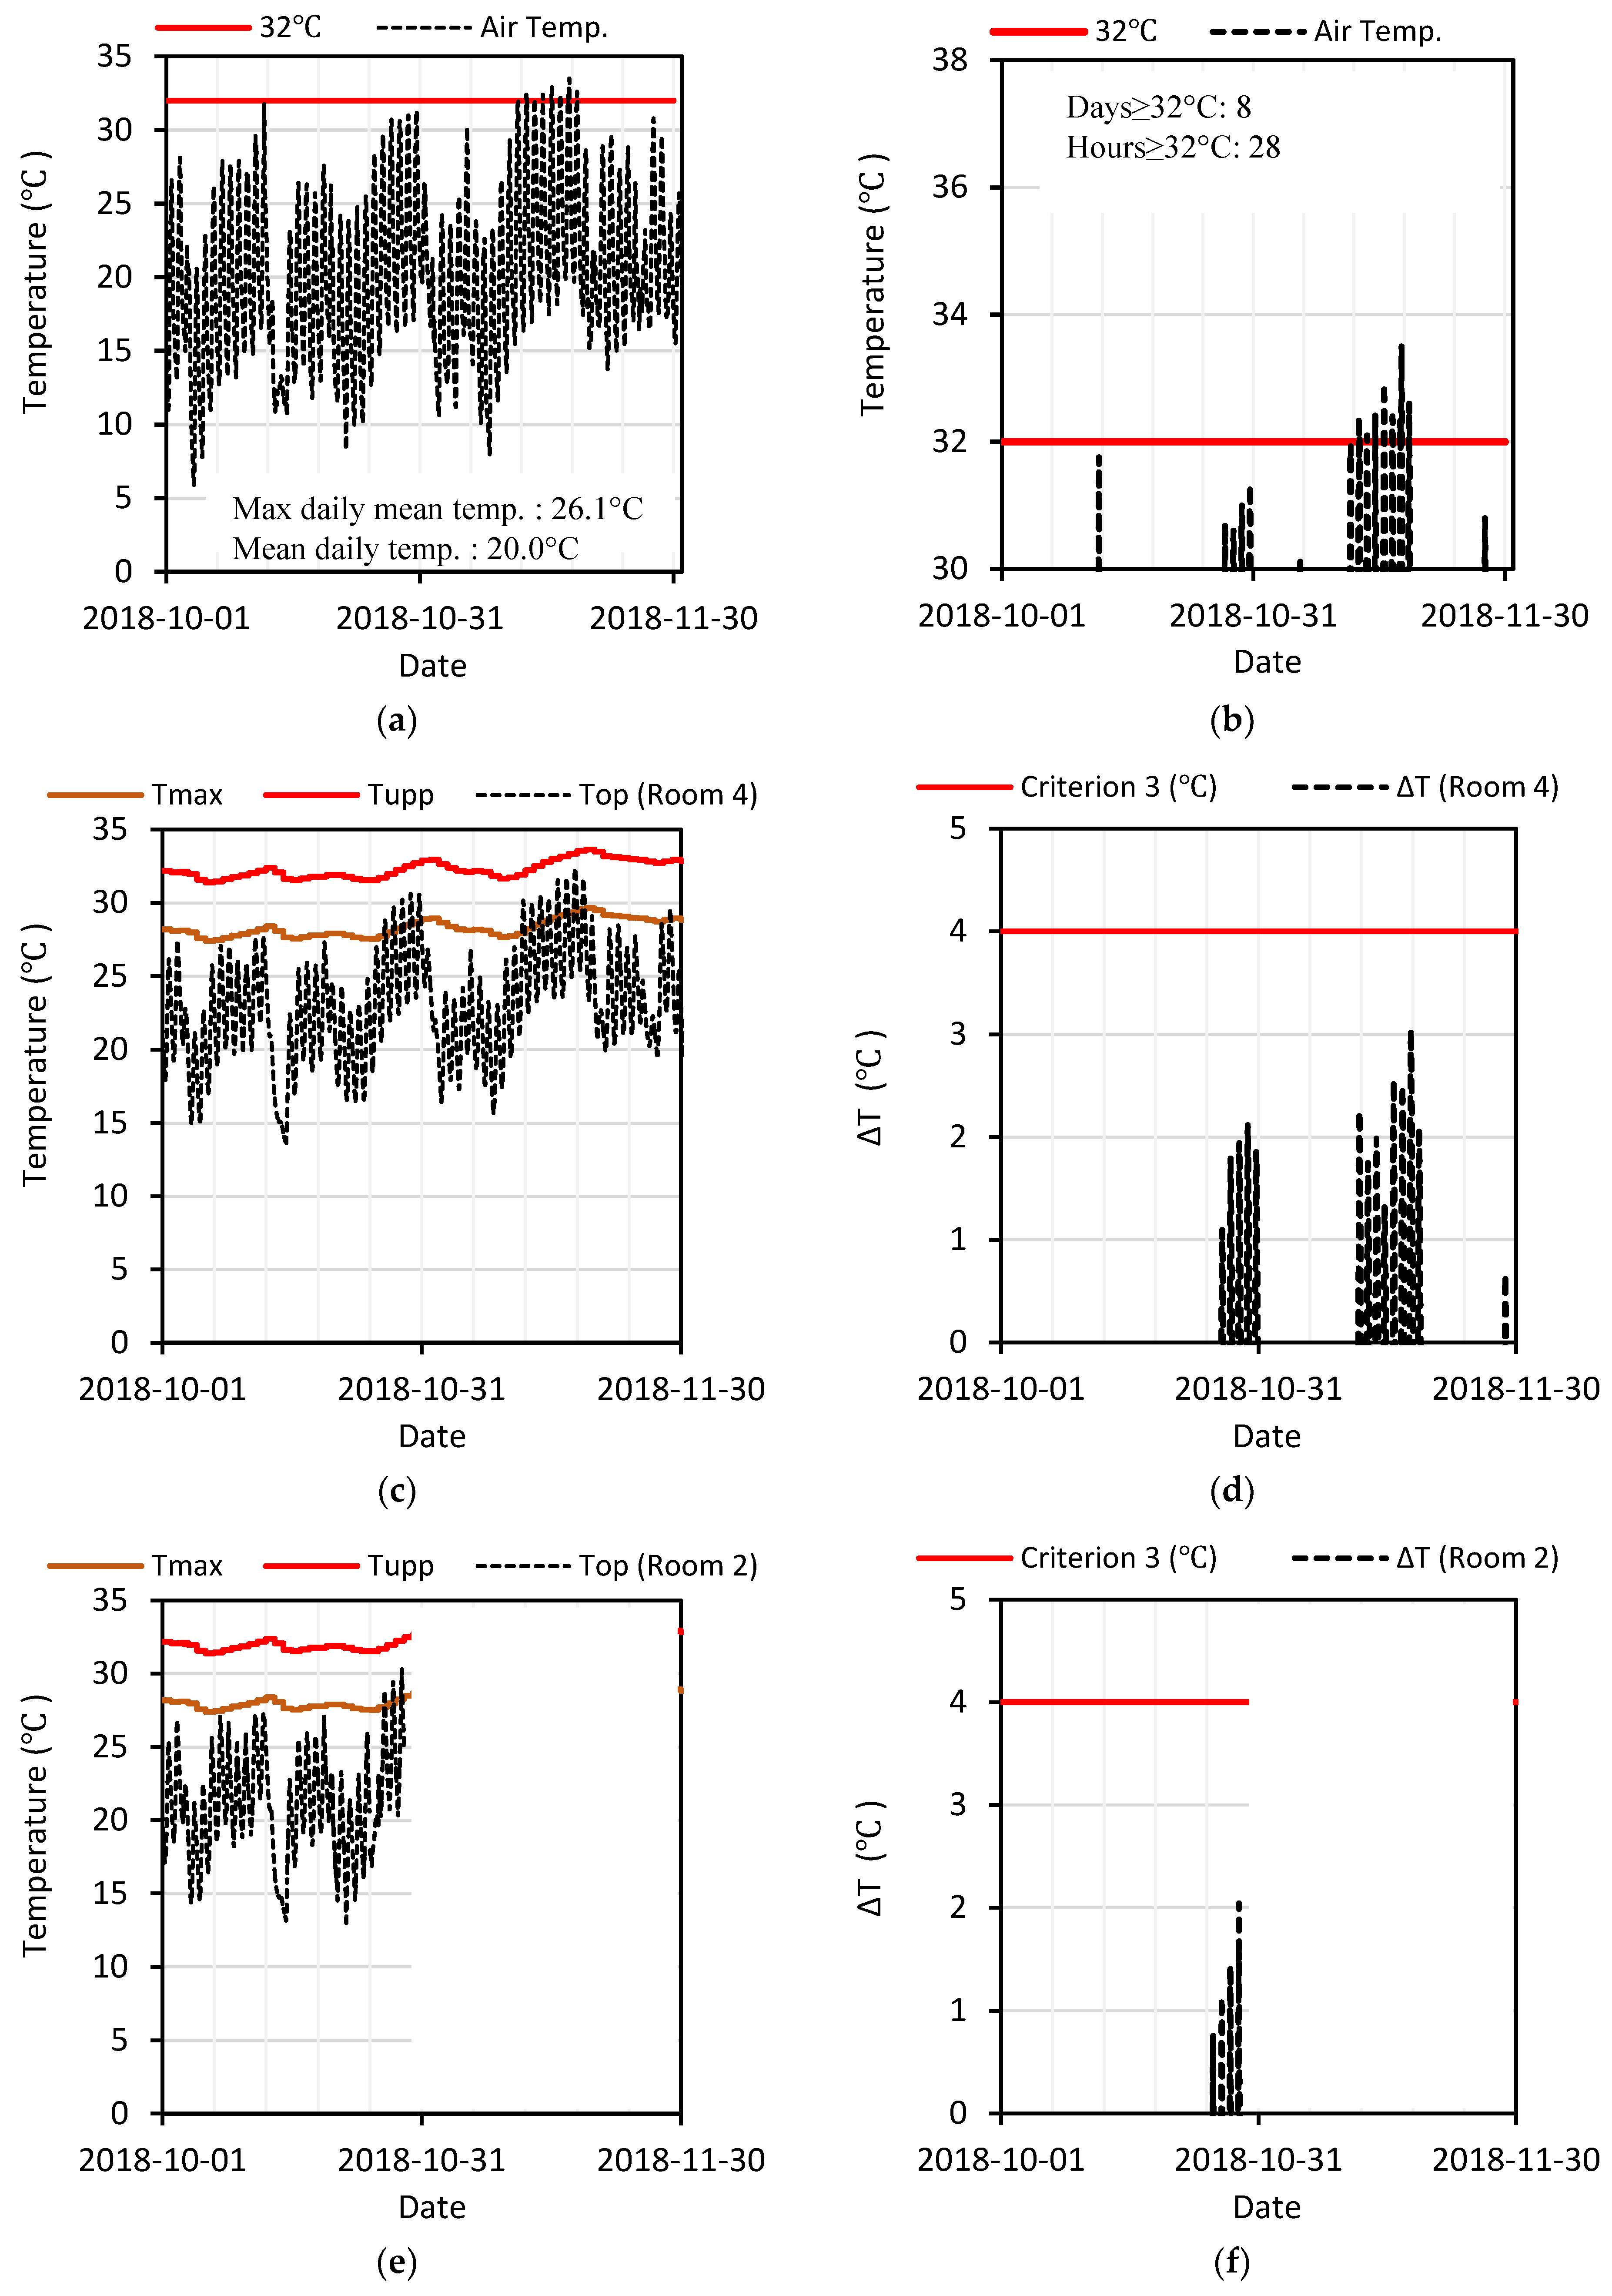
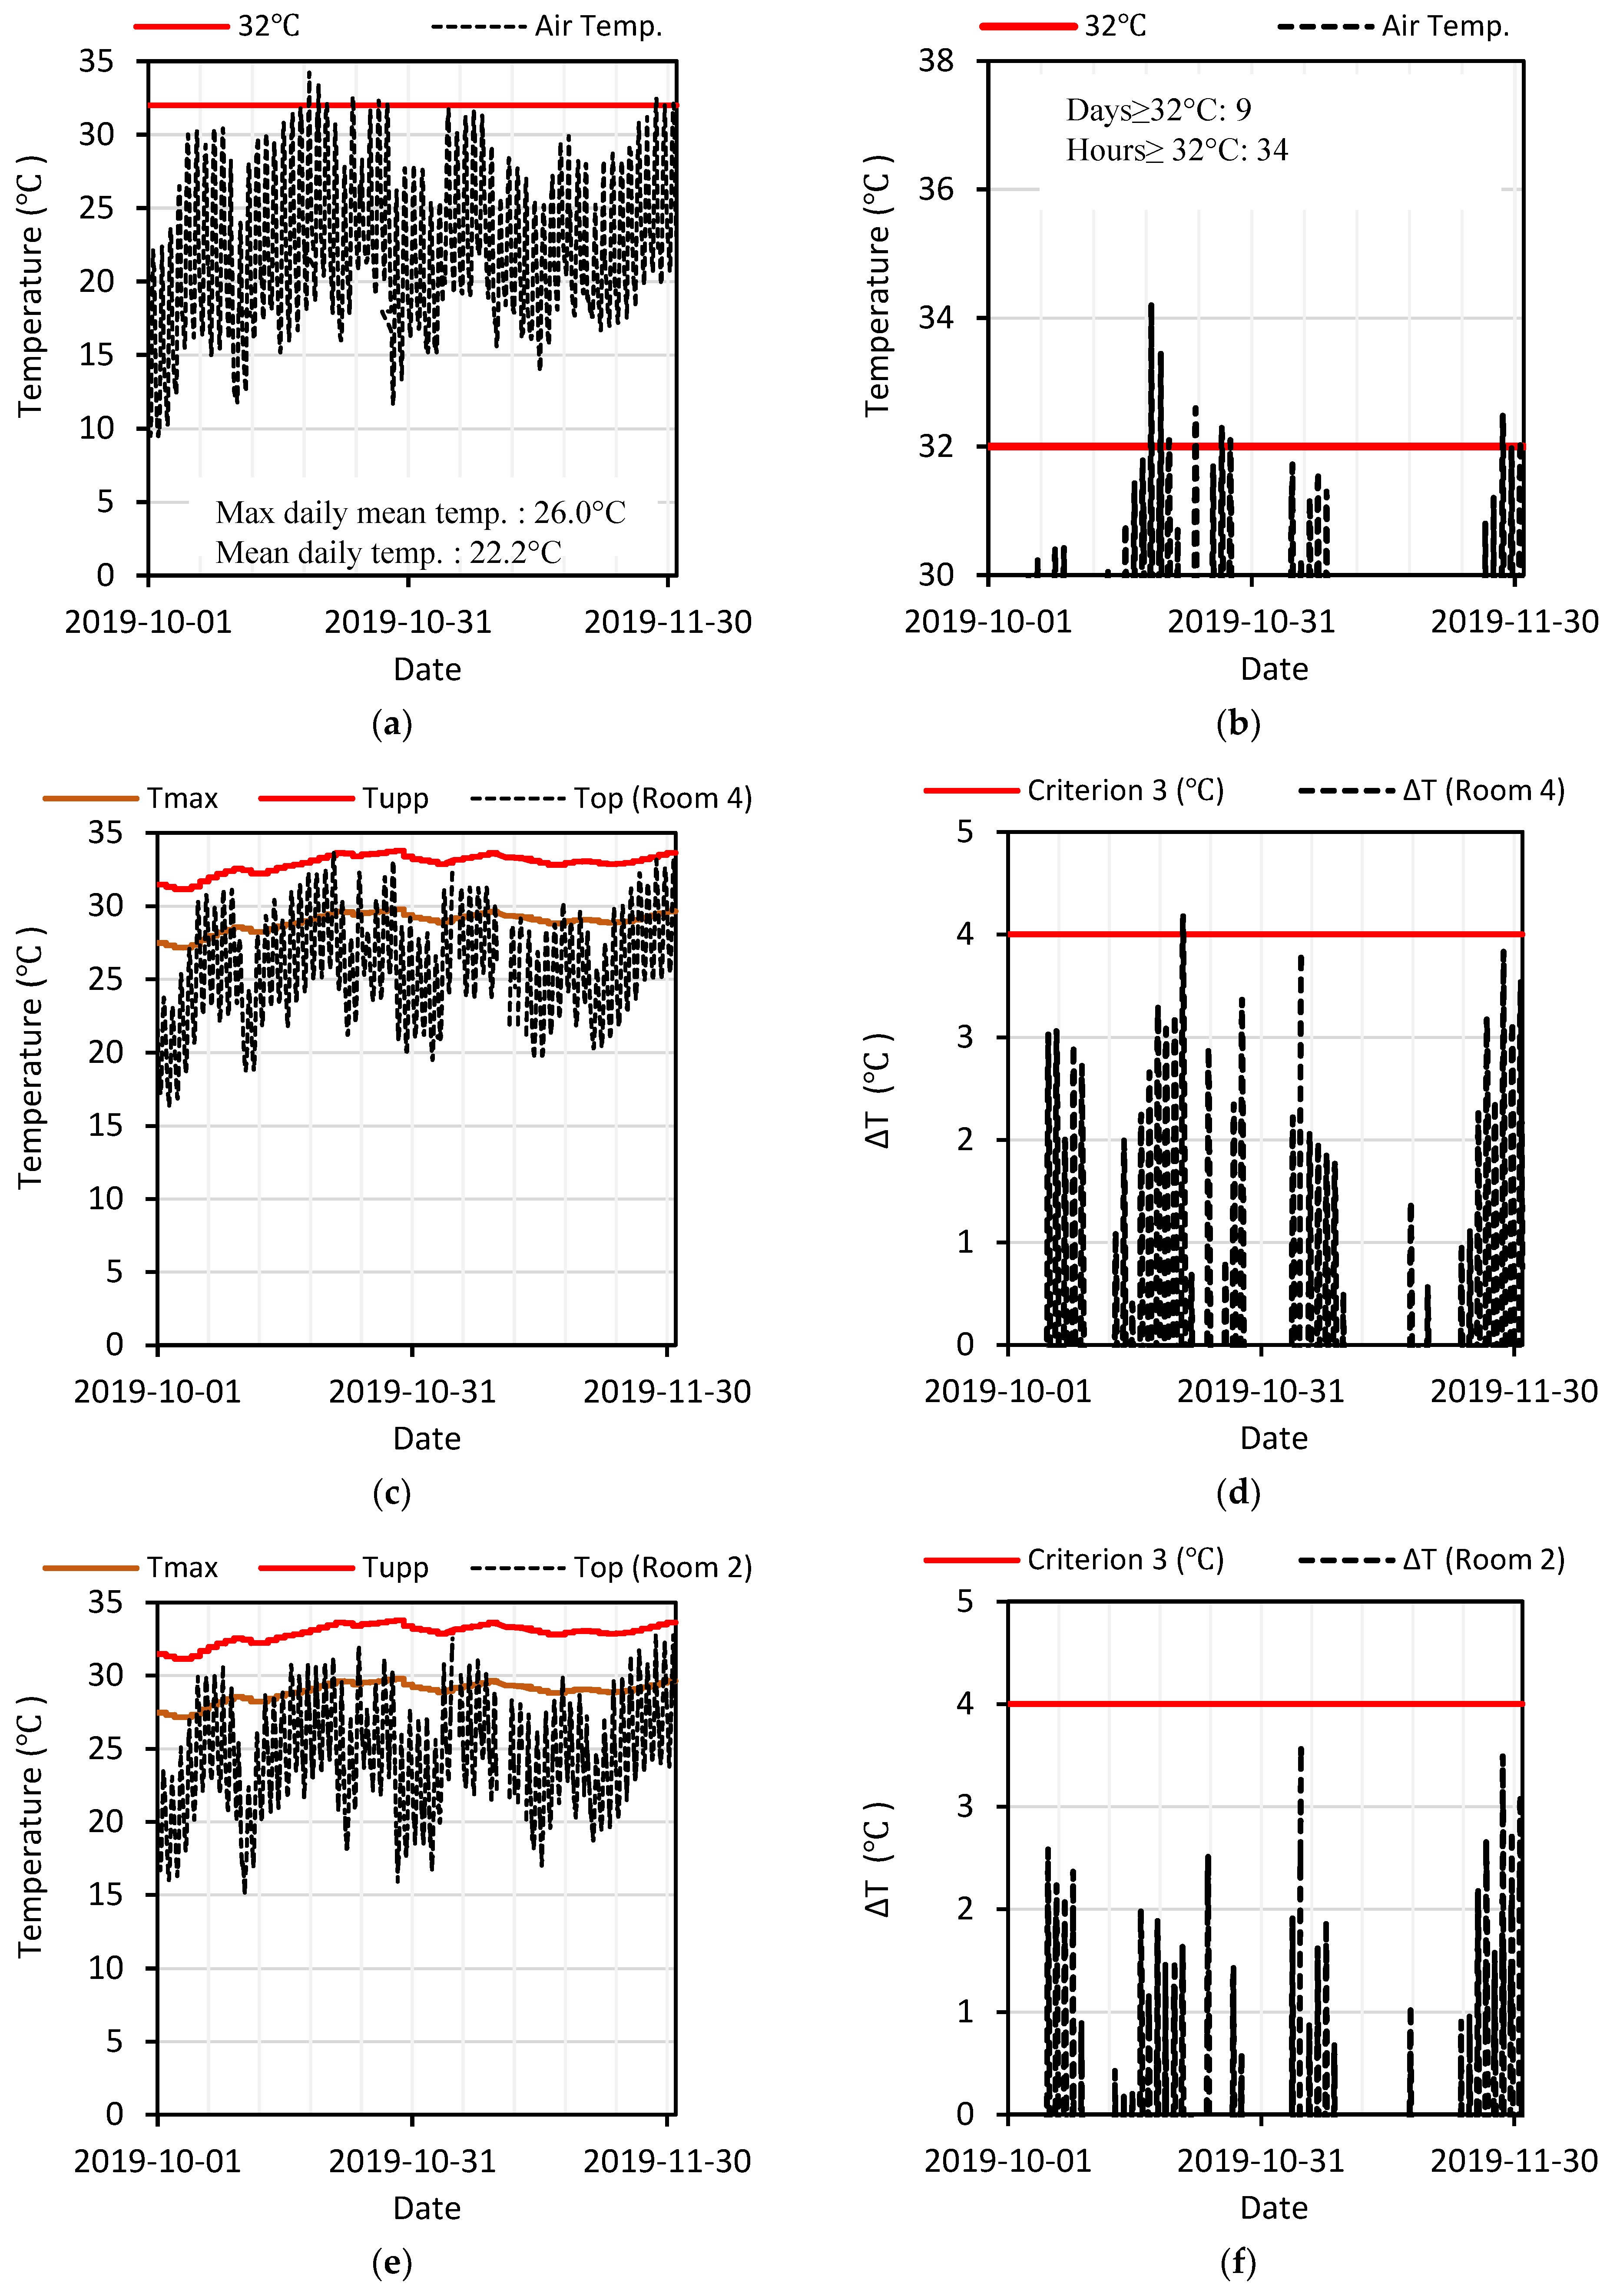
3.3. Results of the Overheating Assessment: Room 4

Table 5 presents the findings from the overheating assessment for Room 4 corresponding to the early summer period. The room was considered a nighttime space (bedroom), occupied between 8:00 p.m. and 6:00 a.m. The following observations can be made:
  • In 2018 and 2019, the space violated criteria 1 and 2, resulting in a failure of the CIBSE assessment (i.e., the space overheated); however, in 2020, the space successfully met all three overheating criteria;
  • All criteria were most severely violated in 2019; however, the performance against criterion 1 was the most striking, with approximately three to five times more hours of exceedance compared to 2018 and 2020, respectively;
  • High outdoor temperatures recorded during October and November 2019 (Table 6) led to higher comfortable (Tcomf) and maximum (Tmax) temperatures during the period; nonetheless, the increase in these parameters was offset by the corresponding rise in indoor operative temperature (Top), which meant that Tmax was frequently exceeded during October and November 2019;
  • The first-floor spaces were significantly affected by extreme temperatures, leading to a notable increase in both the duration and intensity of overheating. During the months of October and November 2019, the space experienced 12.5% exceedance hours, which was severe enough to suggest that the space failed to meet the requirements for the entire summer period (October–March), without requiring any further assessment (i.e., assuming all hours are below Tmax for the remaining summer months, the % hours above Tmax + 1 °C would still be approximately 4%).

3.4. Results of the Overheating Assessment: Room 2

In the evaluation of Room 2 as a nighttime space, it demonstrated adherence to all overheating criteria during October and November 2019, in contrast to Room 4. The significantly improved performance of Room 2, in comparison to Room 4, can be directly ascribed to the efficacy of cross-ventilation within the space. Several key attributes contributed to the successful implementation of nighttime cross-ventilation in Room 2, including: (1) a long, narrow floor plan; (2) an elevated location on the first-floor; (3) the absence of internal partitions or obstructions; (4) a large diurnal outdoor temperature variation; and (5) the presence of two large windows aligned on opposite sides of the space (Figure 10a). Figure 10b highlights the effectiveness of the cross-ventilation in question during a heatwave on 21 October 2019, with the windows remaining open during the late afternoon and night once the outdoor temperature decreased below the indoor temperature. It is important to highlight that both first-floor rooms, Rooms 2 and 4, did not meet the overheating criteria when assumed continually occupied (24/7).

4. Discussion

The evaluation of overheating unveiled an underperformance in the first-floor spaces, during notably hot summer days and months. The persistent, intense heat of heatwaves had a significant impact, particularly on the first overheating criterion assessing the frequency and duration of overheating. Room 2, with efficient cross-ventilation, emerged as the most effective first-floor space during the evening, highlighting the essential role of nighttime ventilation in mitigating overheating under severe heat conditions. Past research using building simulation tools has shown that dwellings lacking adequate ventilation are particularly vulnerable to overheating problems, a situation likely to worsen with the advent of warmer climates [15,21]. In this context, Room 4 failed the overheating assessment, while Room 2 met all criteria during the especially hot summer of 2019 when designated as a bedroom (nighttime space).
However, despite the improvement in indoor comfort due to nighttime ventilation, Room 2 would not meet the criteria of the Chartered Institution of Building Services Engineers (CIBSE) overheating assessment if occupied continuously (24/7). The role of natural ventilation in combating overheating was limited by the assumed occupancy of the space, and it alone may not sufficiently mitigate overheating in future climates. Some studies indicate that climate change will reduce the effectiveness of natural ventilation in certain regions [12,16]. Current experimental and simulation studies further suggest the efficacy of natural ventilation as a cooling strategy is already limited in South Africa’s hottest areas [26,41].
Room 4 and Room 2 on the first floor frequently recorded indoor temperatures that surpassed the maximum acceptable levels as stipulated by BS EN 15251 and the World Health Organization (WHO). Notably, this occurrence was more prevalent during the late afternoon and early evening during heatwaves. Room 4 reached a high of approximately 34 °C, while Room 2 reached a maximum of 33 °C, both in the late afternoon. Other researchers have also reported similar observations in simulation studies, e.g., [17] they have examined energy-efficient terraced houses and reported that operating temperatures in indoor rooms remained high throughout the day and night during heatwaves, ranging from a minimum of 24.7 °C to a maximum of 32.1 °C. The WHO recommends keeping daytime room temperatures below 32 °C and nighttime temperatures under 24 °C [42]. This is especially crucial in preventing heat-related health issues among vulnerable groups, such as infants, adults over 60, and individuals with chronic health conditions.
In stark contrast, ground floor spaces showed good performance, maintaining indoor temperatures below the maximum permissible limit even during the 2019 summer peak. This success is largely attributed to reduced solar exposure, lower thermal transmittance, and the favorable surface albedo. The effect of these features on building performance and thermal comfort is well-documented in free-standing residential buildings. A comparative performance assessment between ground and first-floor spaces pinpoints inadequate building fabric as the primary cause for extremely high bedroom temperatures. Several studies have presented similar observations with existing buildings, highlighting issues with building envelopes and the need for climate proofing of residential building stock [20,22,27]. Consequently, attention has shifted towards retrofitting or upgrading existing building envelopes for future climates, spanning a range of energy-efficient practices such as cool roofs, insulated wall systems, and green roofs [43,44,45,46,47].
In the context of low-cost and affordable housing in South Africa, this study supports recent research [26,27,28] reporting deficiencies in some types of formal low-cost housing. It necessitates the reevaluation of local building regulations, especially the deemed-to-satisfy approach (in which minima wall thickness, glazing areas, etc., are specified), and the introduction of adaptive comfort criteria to improve housing performance and thermal comfort in current and future climates.

5. Conclusions

In South Africa, surface temperatures are projected to increase at a rate surpassing the global mean, with the central interior region experiencing longer and more intense heatwave events. The escalating frequency, intensity, and duration of heatwaves associated with climate change highlight the crucial impact of thermal comfort on human health. The ability to alleviate extreme heat will disproportionately affect underprivileged communities, which lack the necessary resources to mitigate or address these challenges.
The residential building evaluated in this study demonstrated satisfactory performance during typical summer months. However, first-floor areas were vulnerable to elevated indoor temperatures under typical summer conditions. In contrast, the extreme summer conditions from late 2019 to early 2020 resulted in substantial indoor temperatures (peaking at 34 °C), and the failure of the Chartered Institution of Building Services Engineers’ (CIBSE) overheating criteria in a first-floor space without cross-ventilation.
The adaptive strategy of opening windows to enhance thermal comfort proved to be highly effective in mitigating overheating in well-ventilated sections of the house. However, as climates grow warmer, these personal actions may lose effectiveness, necessitating additional cooling strategies. Occupants might need to consider retrofitting the building fabric, particularly if low-cost construction practices continue. This study supports recent observations that climate change, especially prolonged periods of extreme heat (heatwaves), may pose a threat to the thermal comfort and health of inhabitants in affordable and low-cost housing structures in South Africa’s future climates. The findings emphasize the importance of addressing these challenges through improved construction practices and building regulations to protect vulnerable populations from the adverse health effects of extreme heat.
The study’s in situ experimental nature fixed certain parameters, namely, building layout, orientation, wall thickness, fenestration location, and climatic zone, thus limiting the investigation’s scope. Therefore, these factors and others should be incorporated in future building simulation modeling. Beyond the building examined in this study, future climate scenario simulations should also consider more conventional housing types to quantify global warming’s impact more accurately on South Africa’s building stock.

Funding

This research received no external funding. The APC was funded by the University of the Witwatersrand.

Data Availability Statement

Data presented in this study are available on request from the author.

Acknowledgments

The South African Weather Service (SAWS) is acknowledged for providing historic temperature data utilized in several analyses presented in this paper.

Conflicts of Interest

The author declares no conflict of interest.

References

  1. Urgent Climate Action Can Secure a Liveable Future for All. Available online: https://www.ipcc.ch/report/ar6/syr/downloads/press/IPCC_AR6_SYR_PressRelease_en.pdf (accessed on 21 March 2023).
  2. Mbokodo, I.; Bopape, M.-J.; Chikoore, H.; Engelbrecht, F.; Nethengwe, N. Heatwaves in the Future Warmer Climate of South Africa. Atmosphere 2020, 11, 712. [Google Scholar] [CrossRef]
  3. DST (Department of Science and Technology). South African Risk and Vulnerability Atlas; Department of Science and Technology: Pretoria, South Africa, 2010.
  4. Engelbrecht, F.A.; Adegoke, J.; Bopape, M.-J.; Naidoo, M.; Garland, R.; Thatcher, M.; McGregor, M.; Katzfey, J.; Werner, M.; Ichoku, C.; et al. Projections of rapidly rising surface temperatures over Africa under low mitigation. Environ. Res. Lett. 2015, 10, 085004. [Google Scholar] [CrossRef] [Green Version]
  5. Engelbrecht, F.A.; McGregor, J.L.; Engelbrecht, C.J. Dynamics of the Conformal-Cubic Atmospheric Model Projected Climate-Change Signal over Southern Africa. Int. J. Climatol. 2009, 29, 1013–1033. [Google Scholar] [CrossRef]
  6. Kruger, A.C.; Mbatha, S. Regional Weather and Climate of South Africa: Gauteng; South African Weather Service: Pretoria, South Africa, 2021. [Google Scholar]
  7. Taylor, J.; Wilkinson, P.; Davies, M.; Armstrong, B.; Chalabi, Z.; Mavrogianni, A.; Symonds, P.; Oikonomou, E.; Bohnenstengel, S.I. Mapping the Effects of Urban Heat Island, Housing, and Age on Excess Heat-Related Mortality in London. Urban Clim. 2015, 14, 517–528. [Google Scholar] [CrossRef]
  8. Santamouris, M. Recent Progress on Urban Overheating and Heat Island Research. Integrated Assessment of the Energy, Environmental, Vulnerability and Health Impact. Synergies with Global Climate Change. Energy Build. 2020, 207, 109482. [Google Scholar] [CrossRef]
  9. Niño 3.4 SST Index. Available online: https://psl.noaa.gov/enso/dashboard.lanina.html (accessed on 3 March 2023).
  10. El Niño Theme Page. Pacific Marine Environmental Laboratory. Available online: https://www.pmel.noaa.gov/elnino/impacts-of-el-nino (accessed on 13 March 2023).
  11. Coley, D.; Kershaw, T. Changes in Internal Temperatures within the Built Environment as a Response to a Changing Climate. Build. Environ. 2010, 45, 89–93. [Google Scholar] [CrossRef] [Green Version]
  12. Wang, H.; Chen, Q. Impact of Climate Change Heating and Cooling Energy Use in Buildings in the United States. Energy Build. 2014, 82, 428–436. [Google Scholar] [CrossRef] [Green Version]
  13. Porritt, S.M.; Cropper, P.C.; Shao, L.; Goodier, C.I. Ranking of Interventions to Reduce Dwelling Overheating during Heat Waves. Energy Build. 2012, 55, 16–27. [Google Scholar] [CrossRef]
  14. Escandón, R.; Suárez, R.; Sendra, J.J.; Ascione, F.; Bianco, N.; Mauro, G.M. Predicting the Impact of Climate Change on Thermal Comfort in A Building Category: The Case of Linear-Type Social Housing Stock in Southern Spain. Energies 2019, 12, 2238. [Google Scholar] [CrossRef] [Green Version]
  15. Dino, I.G.; Meral Akgül, C. Impact of Climate Change on the Existing Residential Building Stock in Turkey: An Analysis on Energy Use, Greenhouse Gas Emissions and Occupant Comfort. Renew Energy 2019, 141, 828–846. [Google Scholar] [CrossRef]
  16. Heracleous, C.; Michael, A. Assessment of Overheating Risk and the Impact of Natural Ventilation in Educational Buildings of Southern Europe under Current and Future Climatic Conditions. Energy 2018, 165, 1228–1239. [Google Scholar] [CrossRef]
  17. Ozarisoy, B. Energy Effectiveness of Passive Cooling Design Strategies to Reduce the Impact of Long-Term Heatwaves on Occupants’ Thermal Comfort in Europe: Climate Change and Mitigation. J. Clean Prod. 2022, 330, 129675. [Google Scholar] [CrossRef]
  18. Roshan, G.; Oji, R.; Attia, S. Projecting the Impact of Climate Change on Design Recommendations for Residential Buildings in Iran. Build. Environ 2019, 155, 283–297. [Google Scholar] [CrossRef] [Green Version]
  19. Andrić, I.; Corre, O.L.; Lacarrière, B.; Ferrão, P.; Al-Ghamdi, S.G. Initial Approximation of the Implications for Architecture due to Climate Change. Adv. Build. Energy Res. 2021, 15, 337–367. [Google Scholar] [CrossRef] [Green Version]
  20. Gupta, R.; Gregg, M. Preventing the Overheating of English Suburban Homes in a Warming Climate. Build. Res. Inf. 2013, 41, 281–300. [Google Scholar] [CrossRef]
  21. Hamdy, M.; Carlucci, S.; Hoes, P.-J.; Hensen, J.L.M. The Impact of Climate Change on the Overheating Risk in Dwellings—A Dutch Case Study. Build. Environ. 2017, 122, 307–323. [Google Scholar] [CrossRef]
  22. Mavrogianni, A.; Wilkinson, P.; Davies, M.; Biddulph, P.; Oikonomou, E. Building Characteristics as Determinants of Propensity to High Indoor Summer Temperatures in London Dwellings. Build. Environ. 2012, 55, 117–130. [Google Scholar] [CrossRef] [Green Version]
  23. Thapa, S. Risk of Overheating in Low-Rise Naturally Ventilated Residential Buildings of Northeast India—An Effect of Climate Change. Archit. Sci. Rev. 2022, 65, 14–41. [Google Scholar] [CrossRef]
  24. Abbas, K.; Li, S.; Xu, D.; Baz, K.; Rakhmetova, A. Do Socioeconomic Factors Determine Household Multidimensional Energy Poverty? Empirical Evidence from South Asia. Energy Policy 2020, 146, 111754. [Google Scholar] [CrossRef]
  25. Covary, T.; Du Preez, K.; Götz, T. Energy Efficient Air Conditioners. Wuppertal Institute for Climate, Environment and Energy. 2015. Available online: http://www.bigee.net/media/filer_public/2015/07/22/bigee_south_africa_ac_20150722.pdf (accessed on 7 March 2023).
  26. Wright, C.Y.; Wernecke, B.; Kapwata, T.; Kunene, Z.; Mathee, A.; Hey, J.V.; Theron, L. Perceptions of Thermal Comfort and Coping Mechanisms Related to Indoor and Outdoor Temperatures among Participants Living in Rural Villages in Limpopo Province, South Africa. South Afr. J. Psychol. 2022, 52, 449–459. [Google Scholar] [CrossRef]
  27. Naicker, N.; Teare, J.; Balakrishna, Y.; Wright, C.Y.; Mathee, A. Indoor Temperatures in Low Cost Housing in Johannesburg, South Africa. Int. J. Environ. Res. Public Health 2017, 14, 1410. [Google Scholar] [CrossRef] [PubMed] [Green Version]
  28. Mabuya, B.; Scholes, M. The Three Little Houses: A Comparative Study of Indoor and Ambient Temperatures in Three Low-Cost Housing Types in Gauteng and Mpumalanga, South Africa. Int. J. Environ. Res. Public Health 2020, 17, 3524. [Google Scholar] [CrossRef]
  29. Bradley, R.A. Assessing the Effectiveness of Several Passive Design Strategies Using the CIBSE Overheating Criteria: Case Study of an Earth Brick Shell House in Johannesburg, South Africa. Archit. Sci. Rev. 2022, 65, 232–246. [Google Scholar] [CrossRef]
  30. Bradley, R.A.; Gohnert, M.; Fitchett, A. Long-Term Monitoring of an Earth-Masonry Shell House in Johannesburg, South Africa: Thermal Performance. Proc. Inst. Civ. Eng.—Constr. Mater. 2021, 174, 21–33. [Google Scholar] [CrossRef]
  31. South African Weather Service. Annual State of the Climate 2019. Available online: https://www.weathersa.co.za/Documents/Corporate/Annual%20State%20of%20the%20Climate%202019.pdf (accessed on 4 March 2023).
  32. South African Weather Service. Annual State of the Climate 2020. Available online: https://www.weathersa.co.za/Documents/Corporate/Annual%20State%20of%20the%20Climate%202020_19032021121122.pdf (accessed on 4 March 2023).
  33. South African Weather Service. Annual State of the Climate 2021. Available online: https://www.weathersa.co.za/Documents/Corporate/Annual%20State%20of%20the%20Climate%202021_04042022114230.pdf (accessed on 4 March 2023).
  34. El Niño/Southern Oscillation (ENSO). Available online: https://www.ncei.noaa.gov/access/monitoring/enso/sst (accessed on 13 March 2023).
  35. SANS 10400-C; Application of the National Building Regulations—Part C: Dimensions. South African National Standards (SANS): Pretoria, South Africa, 2016.
  36. CIBSE. CIBSE Guide A: Environmental Design, 8th ed.; Chartered Institution of Building Services Engineers: London, UK, 2019; ISBN 9781906846541. [Google Scholar]
  37. SANS 10400-XA; Application of the National Building Regulations—Part X: Environmental Sustainability—Part XA: Energy Usage in Buildings. South African National Standards (SANS): Pretoria, South Africa, 2011.
  38. BS EN 15251; Indoor Environmental Input Parameters for Design and Assessment of Energy Performance of Buildings Addressing Indoor Air Quality, Thermal Environment, Lighting and Acoustics. British Standards Institution (BSI): London, UK, 2007.
  39. CIBSE TM52; The Limits of Thermal Comfort: Avoiding Overheating in European Buildings. Chartered Institution of Building Services Engineers: London, UK, 2013.
  40. Tuohy, P.G.; Humphreys, M.A.; Nicol, F.; Rijal, H.B.; Clarke, J.A. Occupant Behaviour in Naturally Ventilated and Hybrid Buildings. Am. Soc. Heat. Refrig. Air Cond. Eng. (ASHRAE) Trans. 2009, 115, 16–27. [Google Scholar]
  41. Conradie, D.C. South Africa’s Climatic Zones: Today, Tomorrow. In Proceedings of the International Green Building Conference and Exhibition: Future Trends and Issues Impacting on the Built Environment, Sandton, South Africa, 25–26 July 2012. [Google Scholar]
  42. World Health Organization. Climate Change, Heat and Health. 2022. Available online: https://www.who.int/news-room/factsheets/detail/climate-change-heat-and-health (accessed on 13 April 2023).
  43. Karimpour, M.; Belusko, M.; Xing, K.; Boland, J.; Bruno, F. Impact of Climate Change on the Design of Energy Efficient Residential Building Envelopes. Energy Build. 2015, 87, 142–154. [Google Scholar] [CrossRef]
  44. Dabaieh, M.; Wanas, O.; Hegazy, M.A.; Johansson, E. Reducing Cooling Demands in a Hot Dry Climate: A Simulation Study for Non-Insulated Passive Cool Roof Thermal Performance in Residential Buildings. Energy Build. 2015, 89, 142–152. [Google Scholar] [CrossRef] [Green Version]
  45. Pisello, A.L.; Castaldo, V.L.; Piselli, C.; Fabiani, C.; Cotana, F. Thermal Performance of Coupled Cool Roof and Cool Façade: Experimental Monitoring and Analytical Optimization Procedure. Energy Build. 2017, 157, 35–52. [Google Scholar] [CrossRef]
  46. Fitchett, A.; Govender, P.; Vallabh, P. An Exploration of Green Roofs for Indoor and Exterior Temperature Regulation in the South African Interior. Environ. Dev. Sustain. 2020, 22, 5025–5044. [Google Scholar] [CrossRef]
  47. Bradley, R.A. Mitigating the Potential of Overheating in an Earth-masonry Shell House Situated in Johannesburg through Passive Design Strategies. In Proceedings of the 5th Biennial Residential Building Design and Construction Conference, State College, PA, USA, 5–6 March 2020; Memari, A., Klinetob-Lowe, S., Eds.; Pennsylvania Housing Research Centre: University Park, PA, USA, 2020. [Google Scholar]
Figure 1. Annual average surface temperature deviation from the base period (1981–2010) at OR Tambo International Airport (Johannesburg): 2002–2020 (Data from [6]).
Buildings 13 01494 g001
Figure 2. Nino3.4 SST (sea surface temperatures) anomalies averaged over the NINO34 region 5° N–5° S; 170–120° W: 1950–2022 (Data from US National Oceanic and Atmospheric Administration (NOAA) website: https://psl.noaa.gov/data/correlation/nina34.anom.data (accessed on 3 March 2023)).
Buildings 13 01494 g002
Figure 3. Floorplan: (a) ground floor; (b) first floor.
Buildings 13 01494 g003
Figure 4. Housing structure: (a) building from the south-east; (b) spaces investigated.
Buildings 13 01494 g004
Figure 5. Indoor operative temperature and outside air temperature: (a) Top Room 1 (2018); (b) Top Room 4 (2018).
Buildings 13 01494 g005
Figure 6. Indoor operative temperature versus outside air temperature (2018): (a) Room 1; (b) Room 3; (c) Room 4; (d) Room 2 (1 to 27 October only).
Buildings 13 01494 g006
Figure 7. Temperatures, October through November 2018: (a) outdoor air; (b) outdoor air (max); (c) Top Room 4; (d) ΔT Room 4; (e) Top Room 2; (f) ΔT Room 2.
Buildings 13 01494 g007
Figure 8. Temperatures, October through November 2019: (a) outdoor air; (b) outdoor air (max); (c) Top Room 4; (d) ΔT Room 4; (e) Top Room 2; (f) ΔT Room 2.
Buildings 13 01494 g008
Figure 9. Temperatures, October through November 2020: (a) outdoor air; (b) outdoor air (max); (c) Top Room 4; (d) ΔT Room 4.
Buildings 13 01494 g009
Figure 10. Cross-ventilation in Room 2: (a) illustration of cross-ventilation (Room 2); (b) temperatures, 21 October 2019.
Buildings 13 01494 g010
Table 1. Average daily maximum surface temperatures, OR Tambo Airport (Johannesburg) 1.
YearAverage Maximum Temp. (°C)RankENSO:
1981–2010 222.3--
201524.21El Niño (very strong)
201823.24El Niño (weak)
201923.92Neutral/El Niño (very weak)
202022.437La Niña (moderate)
1 Temperature data obtained from SAWS publications [31,32,33]. 2 Normal (30-year base period).
Table 2. Temperature data for OR Tambo Airport: Early summer (1 October–30 November).
YearAverage Maximum Temp. (°C)Daily Mean Temp. (°C)
1961–1990 123.817.5
2015 227.820.5
2018 225.818.9
2019 227.720.8
2020 225.419.7
1 Data for 1961–1990 obtained from Meteonorm v7.3 software. 2 Data obtained from SAWS.
Table 3. Estimated U-values.
Materials DescriptionU-Value (W/m2K)
Solid dry-stack (mortarless) block masonry (220 mm)2.11 1
CSEB block masonry (150 mm) with cement-sand plaster (20 mm)2.38 1
Window glazing (6.38 mm) (single-glazed low-E glass: 83% transmission of visible light and 70% solar energy)3.57
Solid concrete floor slabs (150 mm) on sand (uninsulated)1.01 2
1 R-values (m2K/W) for internal and external surfaces assumed 0.13 and 0.04, respectively. 2 R-values (m2K/W) for internal and external surfaces assumed 0.17 and 0.04, respectively.
Table 4. Overheating assessment criteria.
CriterionAssessment CriteriaLimit
1Percentage of occupied hours during
which ΔT ≥ 1 °C
Up to 3% of occupied hours
2Daily weighted exceedance (We) in any
one day > 6 °Ch (degreeHours)
0 days
3Maximum temperature level (Tupp) ΔT > 4 °C0 h
Table 5. Overheating assessment of Room 4: October and November (only hours between 8:00 p.m.–6:00 a.m.).
YearExceed Tmax (Y/N) *Criterion 1 (<3%)Criterion 2 (<6 °Ch)Criterion 3 (<4 °C)Overheat (Y/N)
2018YFail (3.4%) Fail (We = 6.25 °Ch)Pass (T = 3 °C)Y
2019YFail (12.5%) Fail (We = 7.75 °Ch)Pass (T = 3 °C)Y
2020YPass (2.3%)Pass (We = 4.75 °Ch)Pass (T = 2 °C)N
* Room 2 is assumed occupied between 8 p.m. and 6 a.m.
Table 6. Outdoor temperatures recorded at the house: 1 October–30 November.
YearMaximum Temp. (°C)Mean Daily Maximum Temp. (°C)Daily Mean Temp. (°C)
201833.527.020.0
201934.229.122.2
202031.325.620.5
Disclaimer/Publisher’s Note: The statements, opinions and data contained in all publications are solely those of the individual author(s) and contributor(s) and not of MDPI and/or the editor(s). MDPI and/or the editor(s) disclaim responsibility for any injury to people or property resulting from any ideas, methods, instructions or products referred to in the content.

