

Study on Crystallization Mechanism of Asphalt Mixture in Bridge Deck Pavement


Abstract
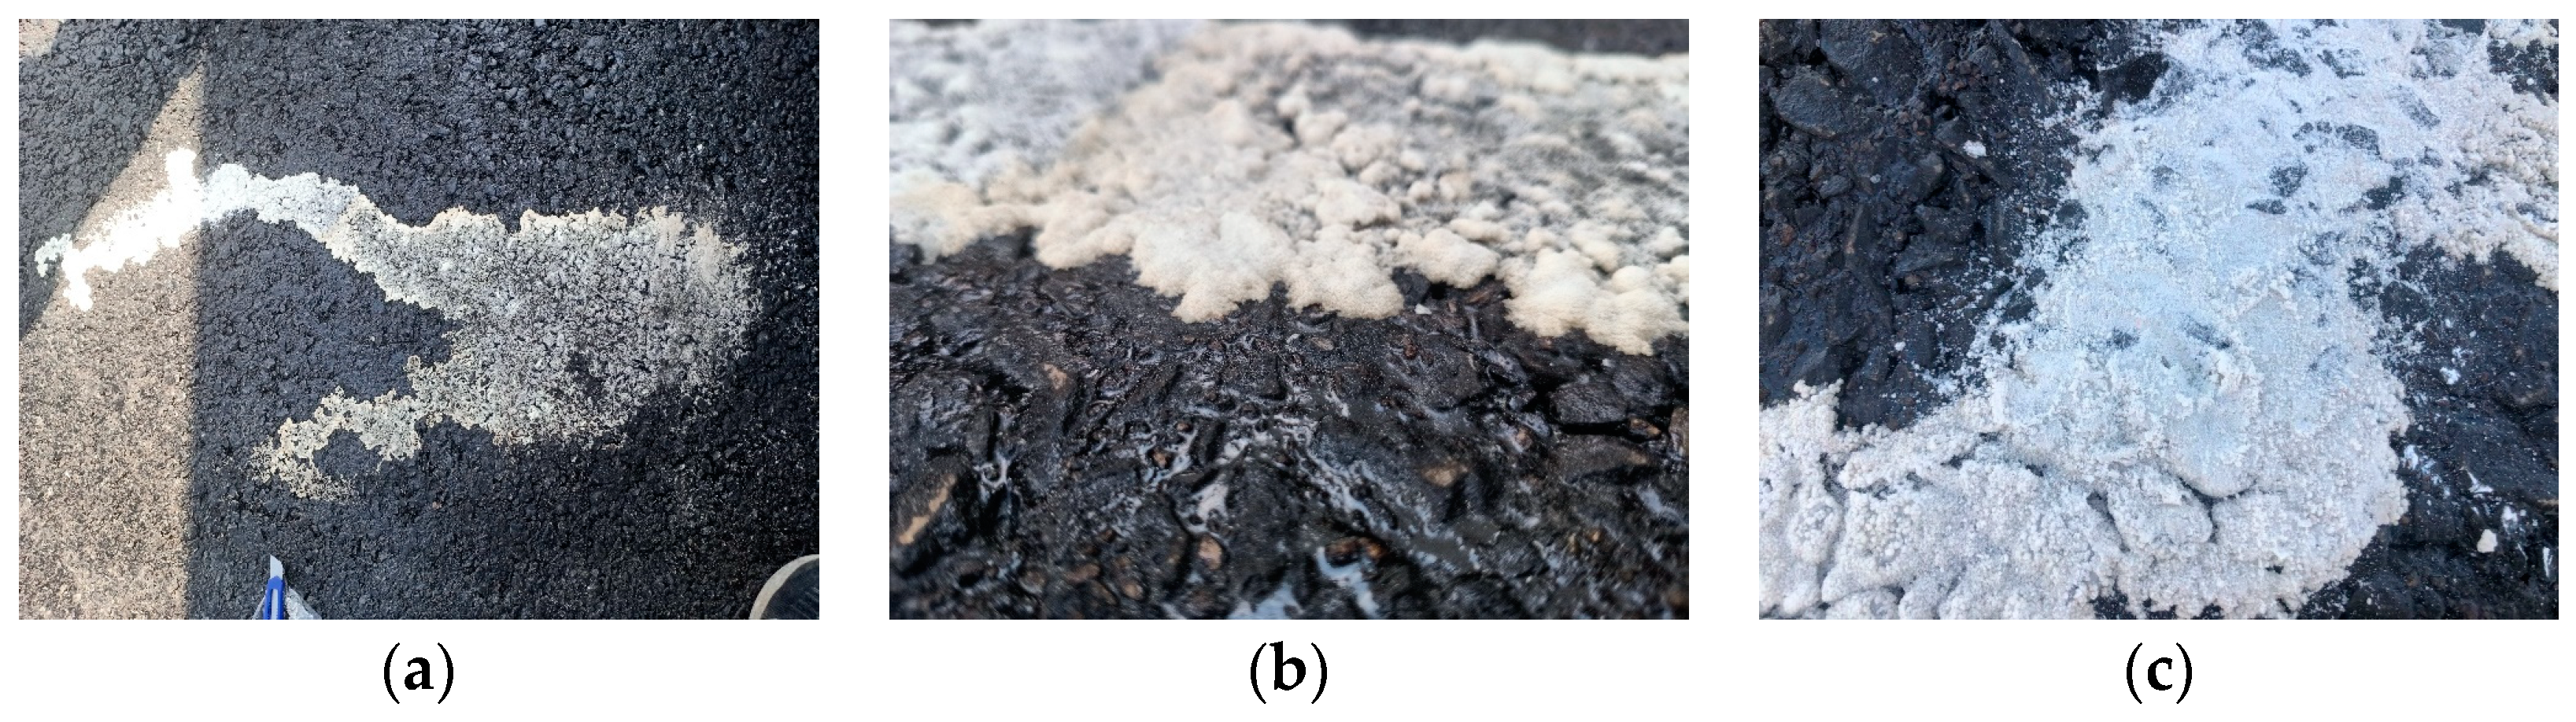
:1. Introduction
2. Methods
2.1. Composition and Source Analysis of Crystals
2.2. Influence Analysis of Pavement Performance
2.3. Analysis of Precipitation Mechanism of Crystals
3. Experimental Plan
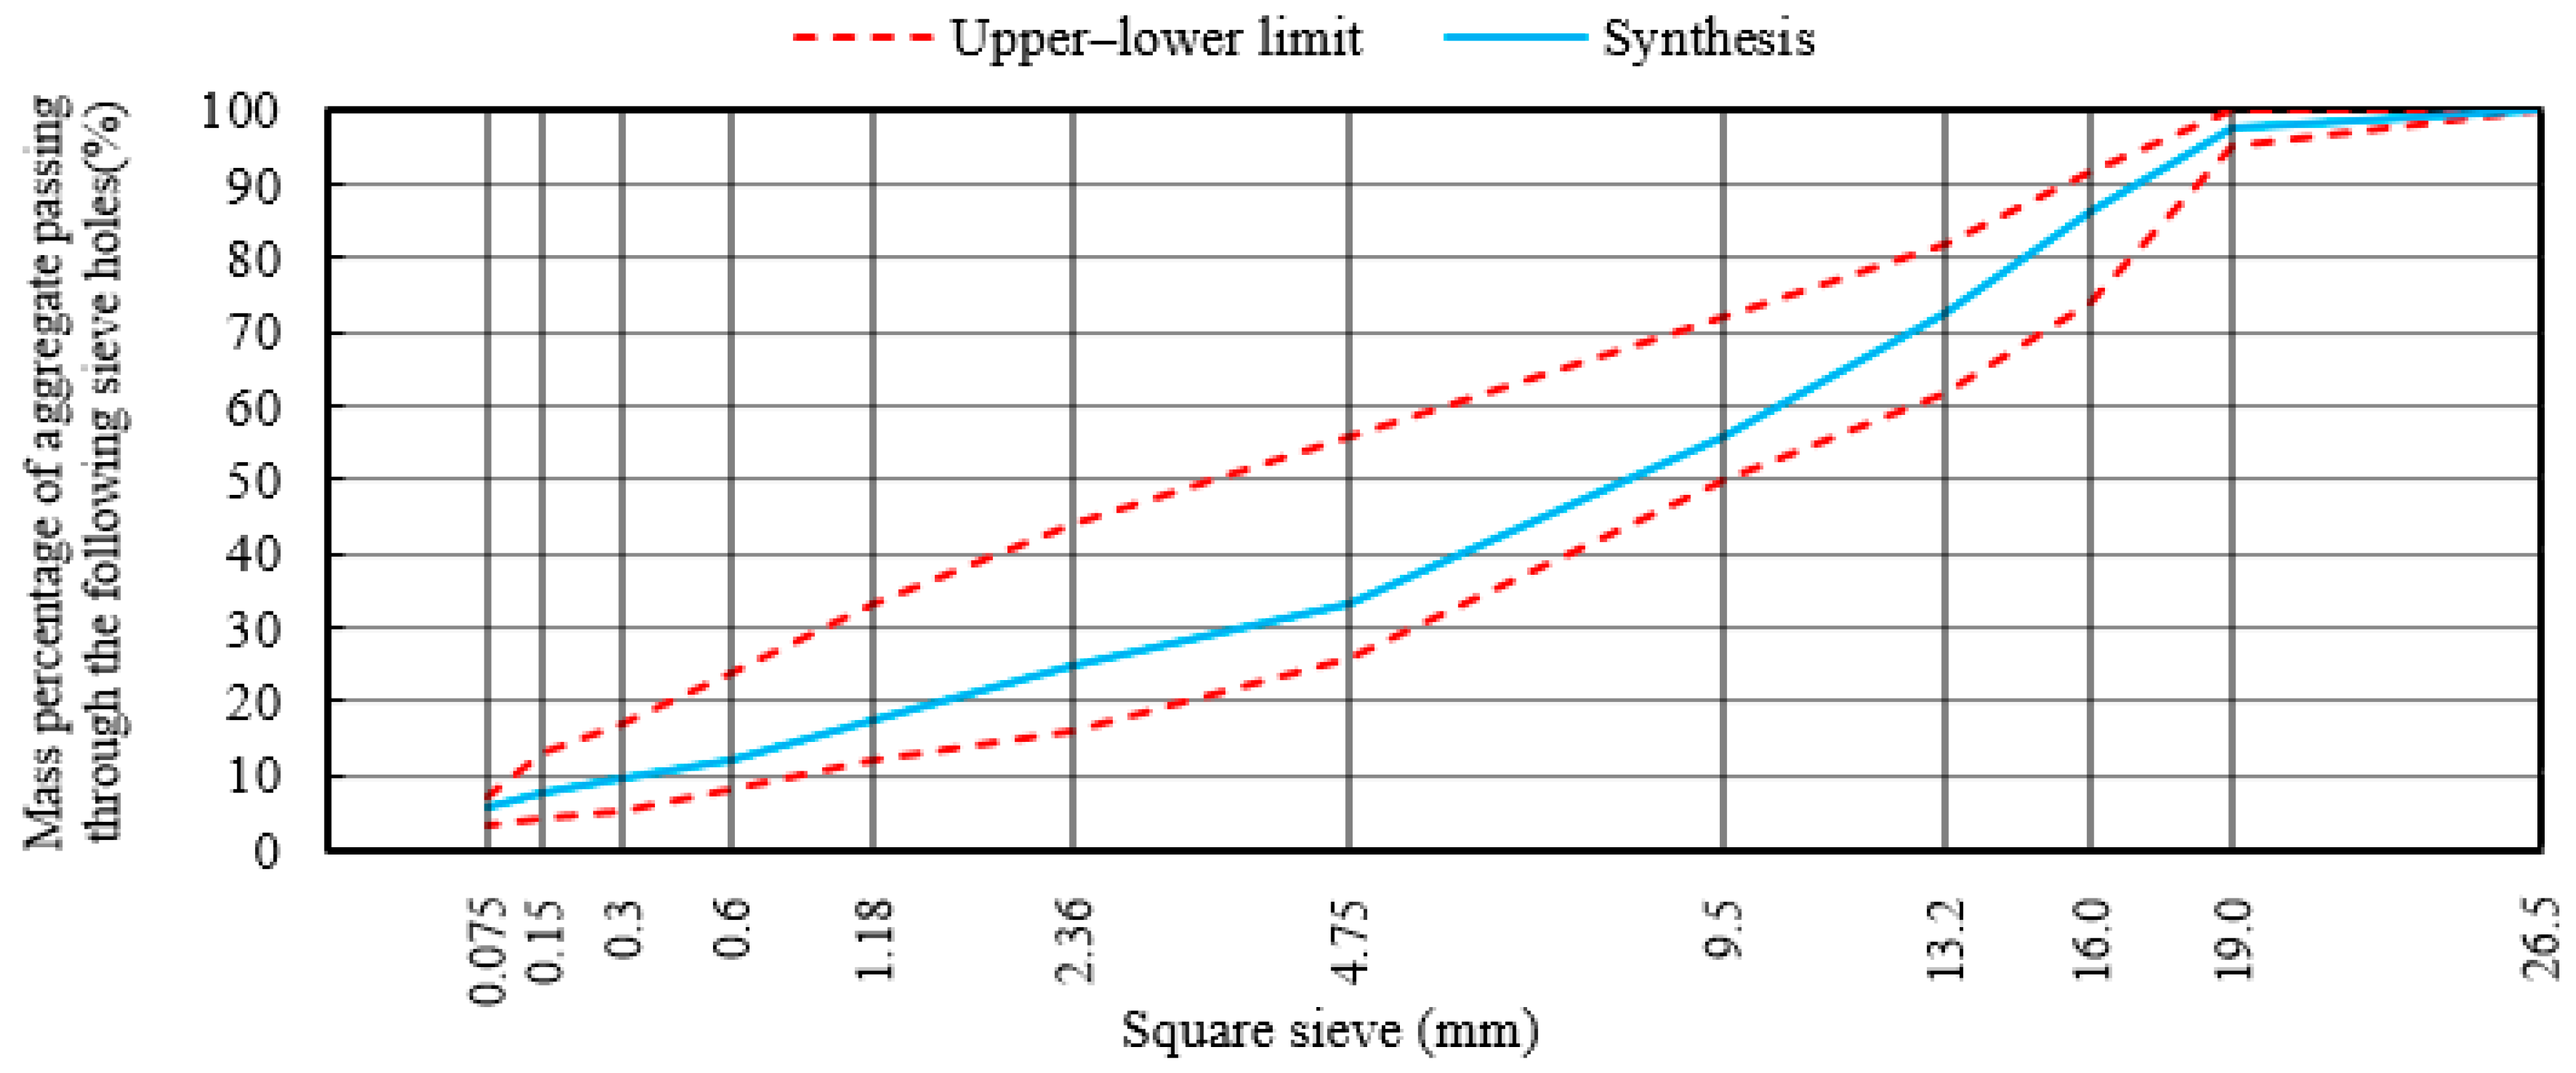
3.1. Raw Materials
3.2. Test Plan of X-ray Fluorescence Spectrometry
3.3. Test Plan of Pavement Performance
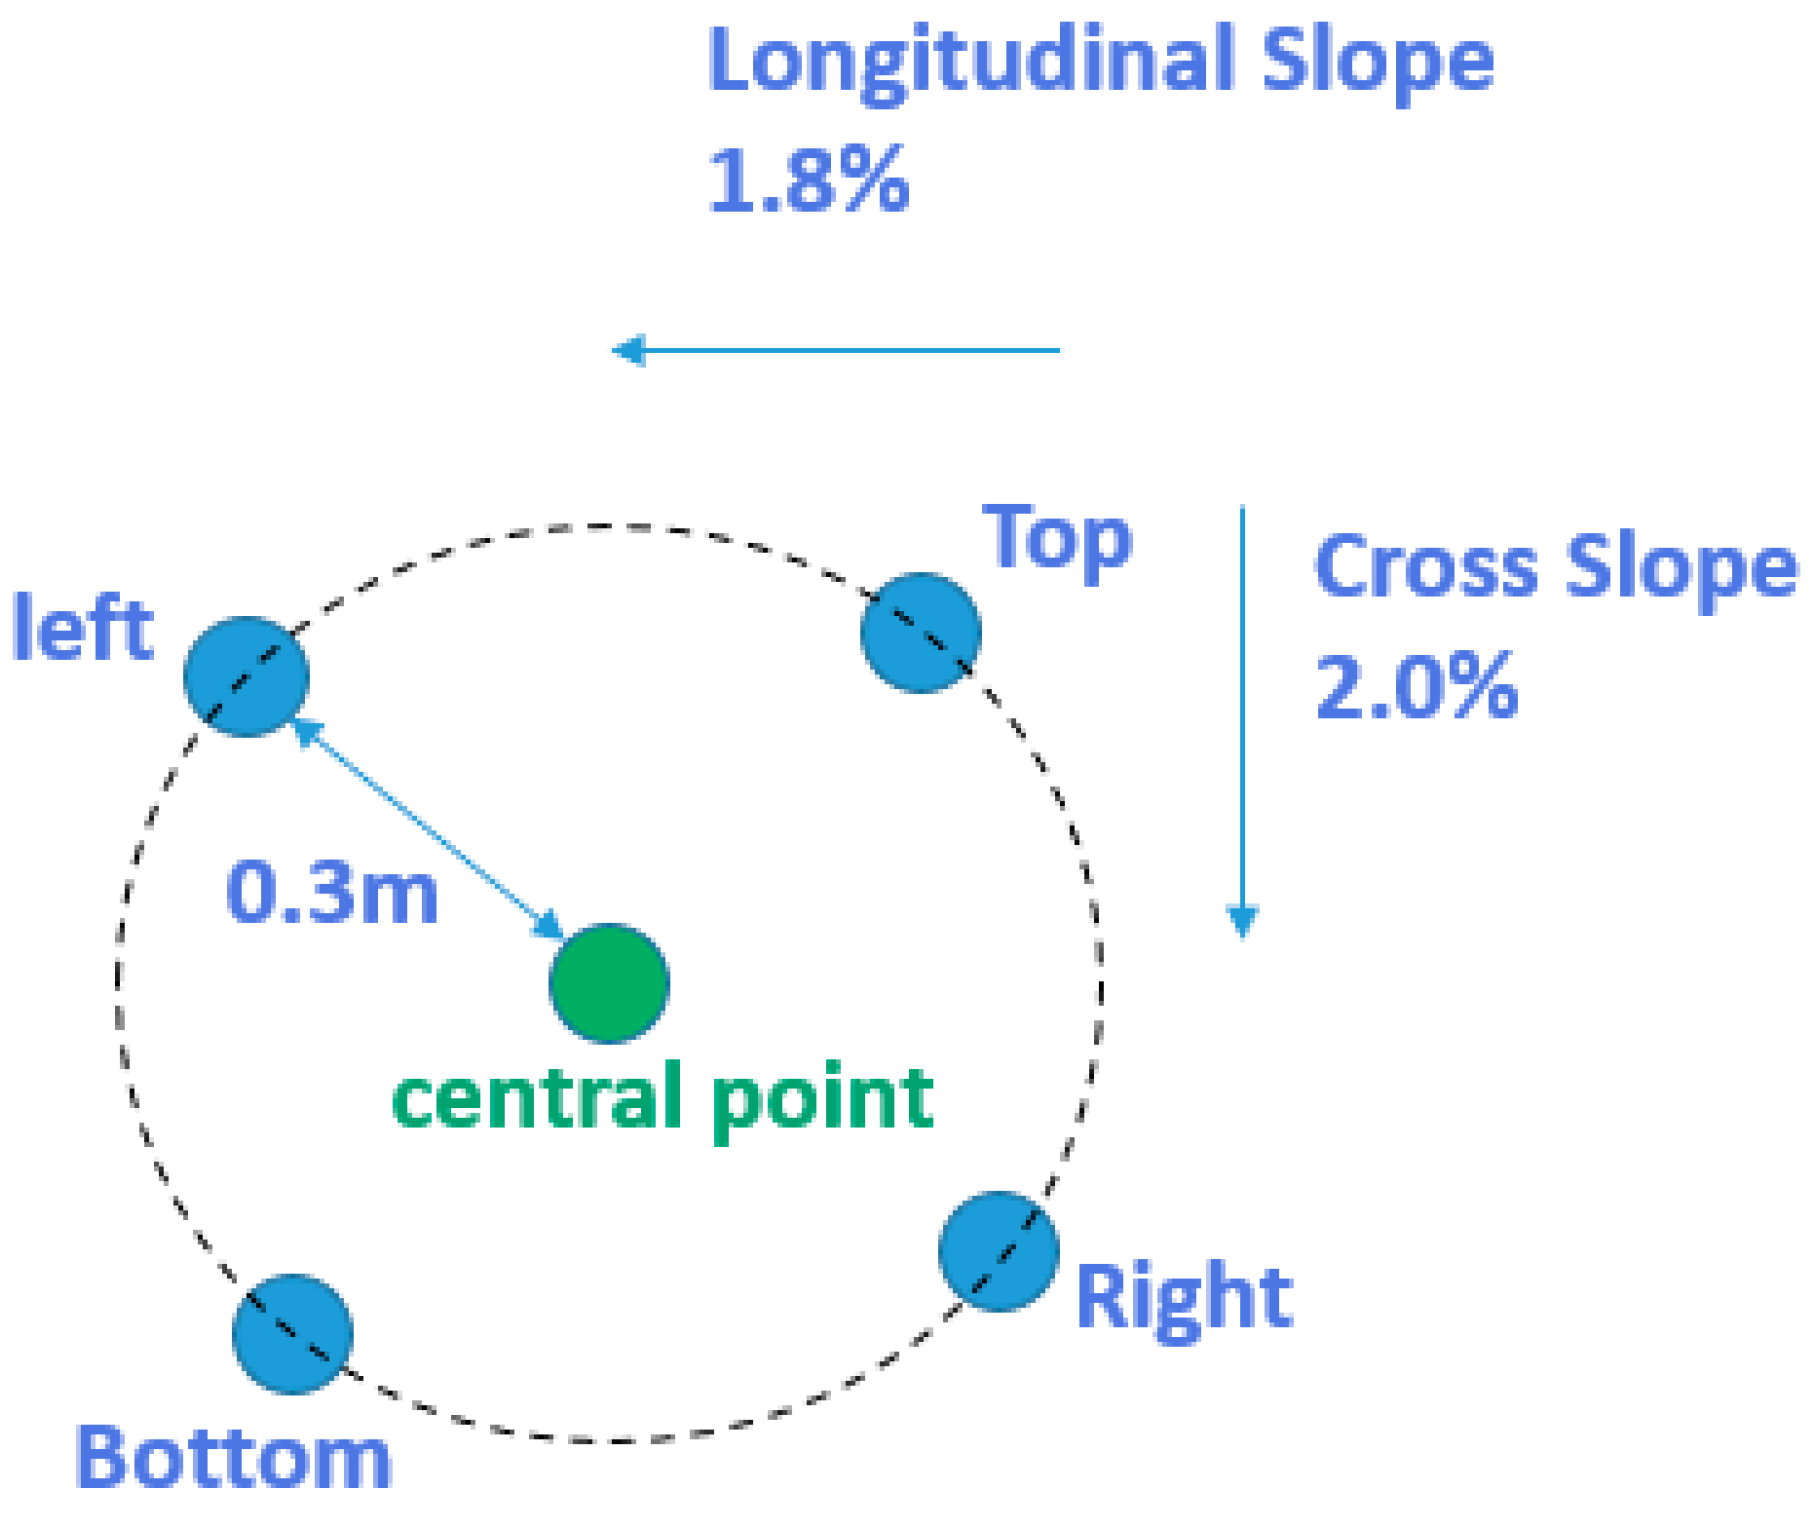
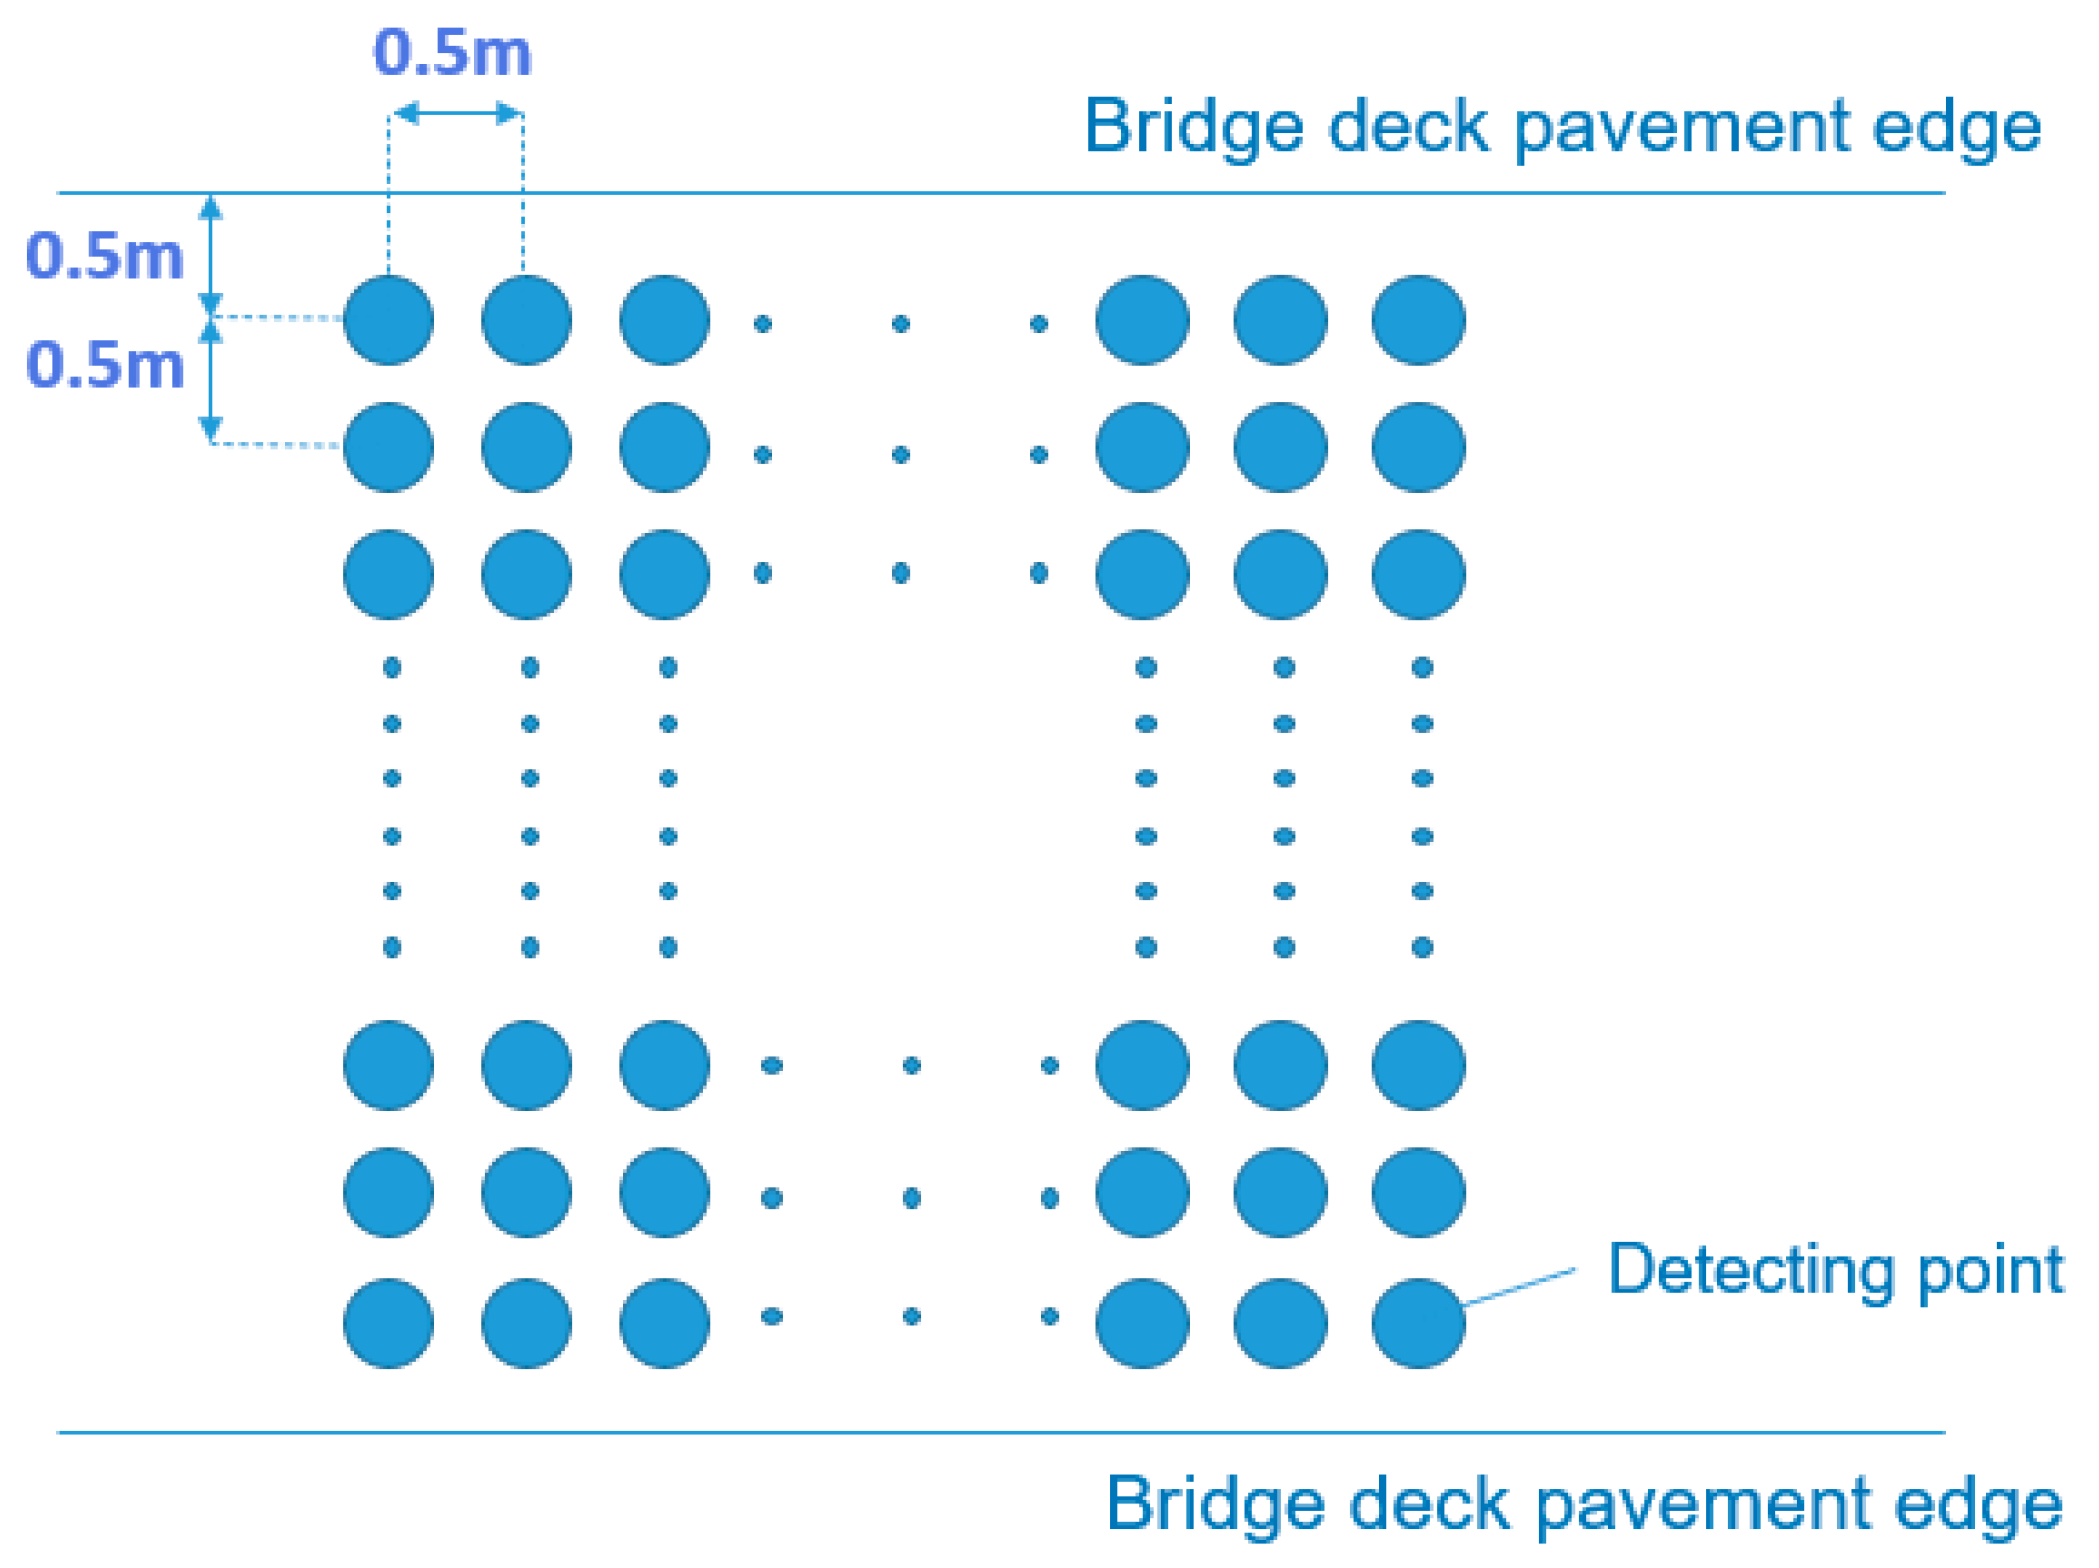
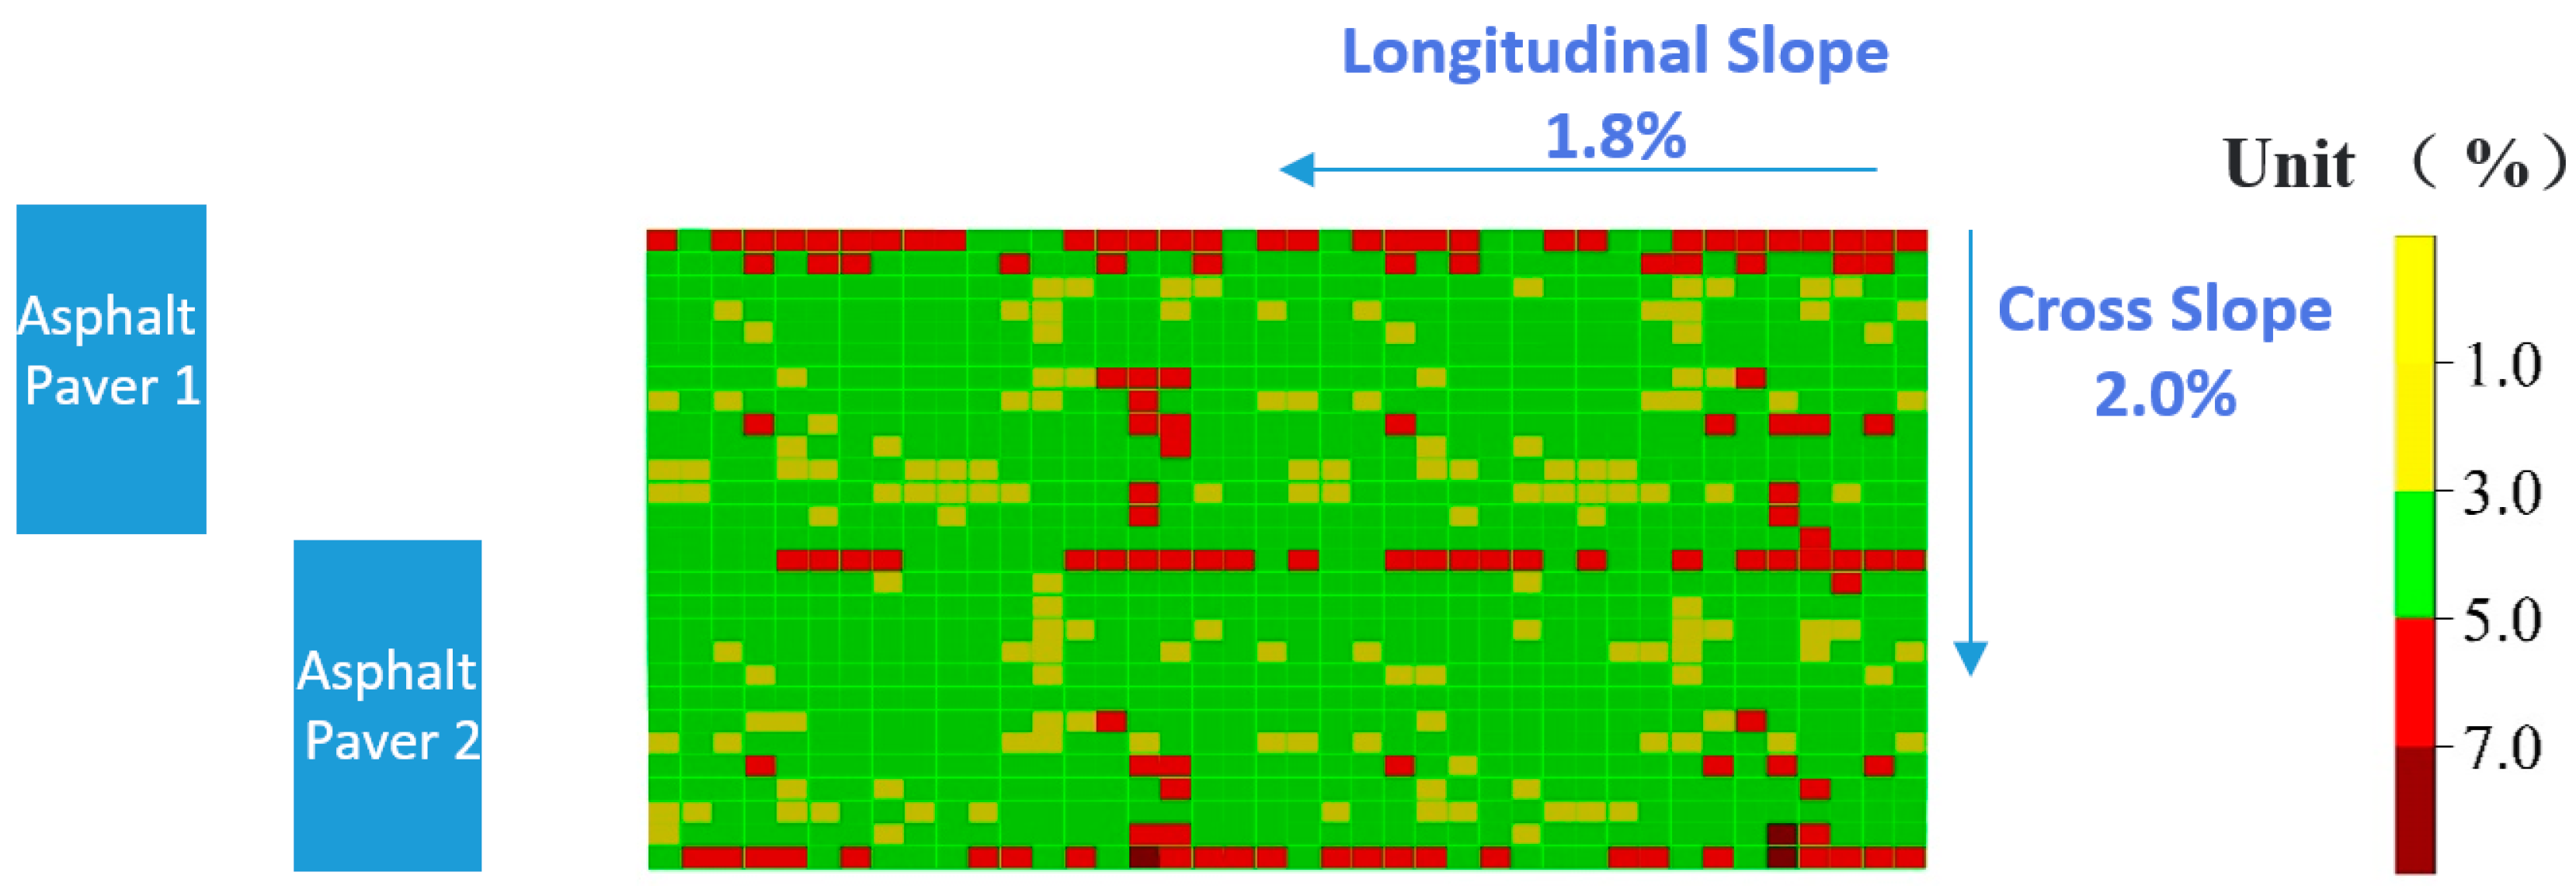
3.4. Nuclear-Free Density and 3D GPR Test Plan
4. Results and Analysis
4.1. Source Analysis of Crystals
4.2. Road Performance Analysis
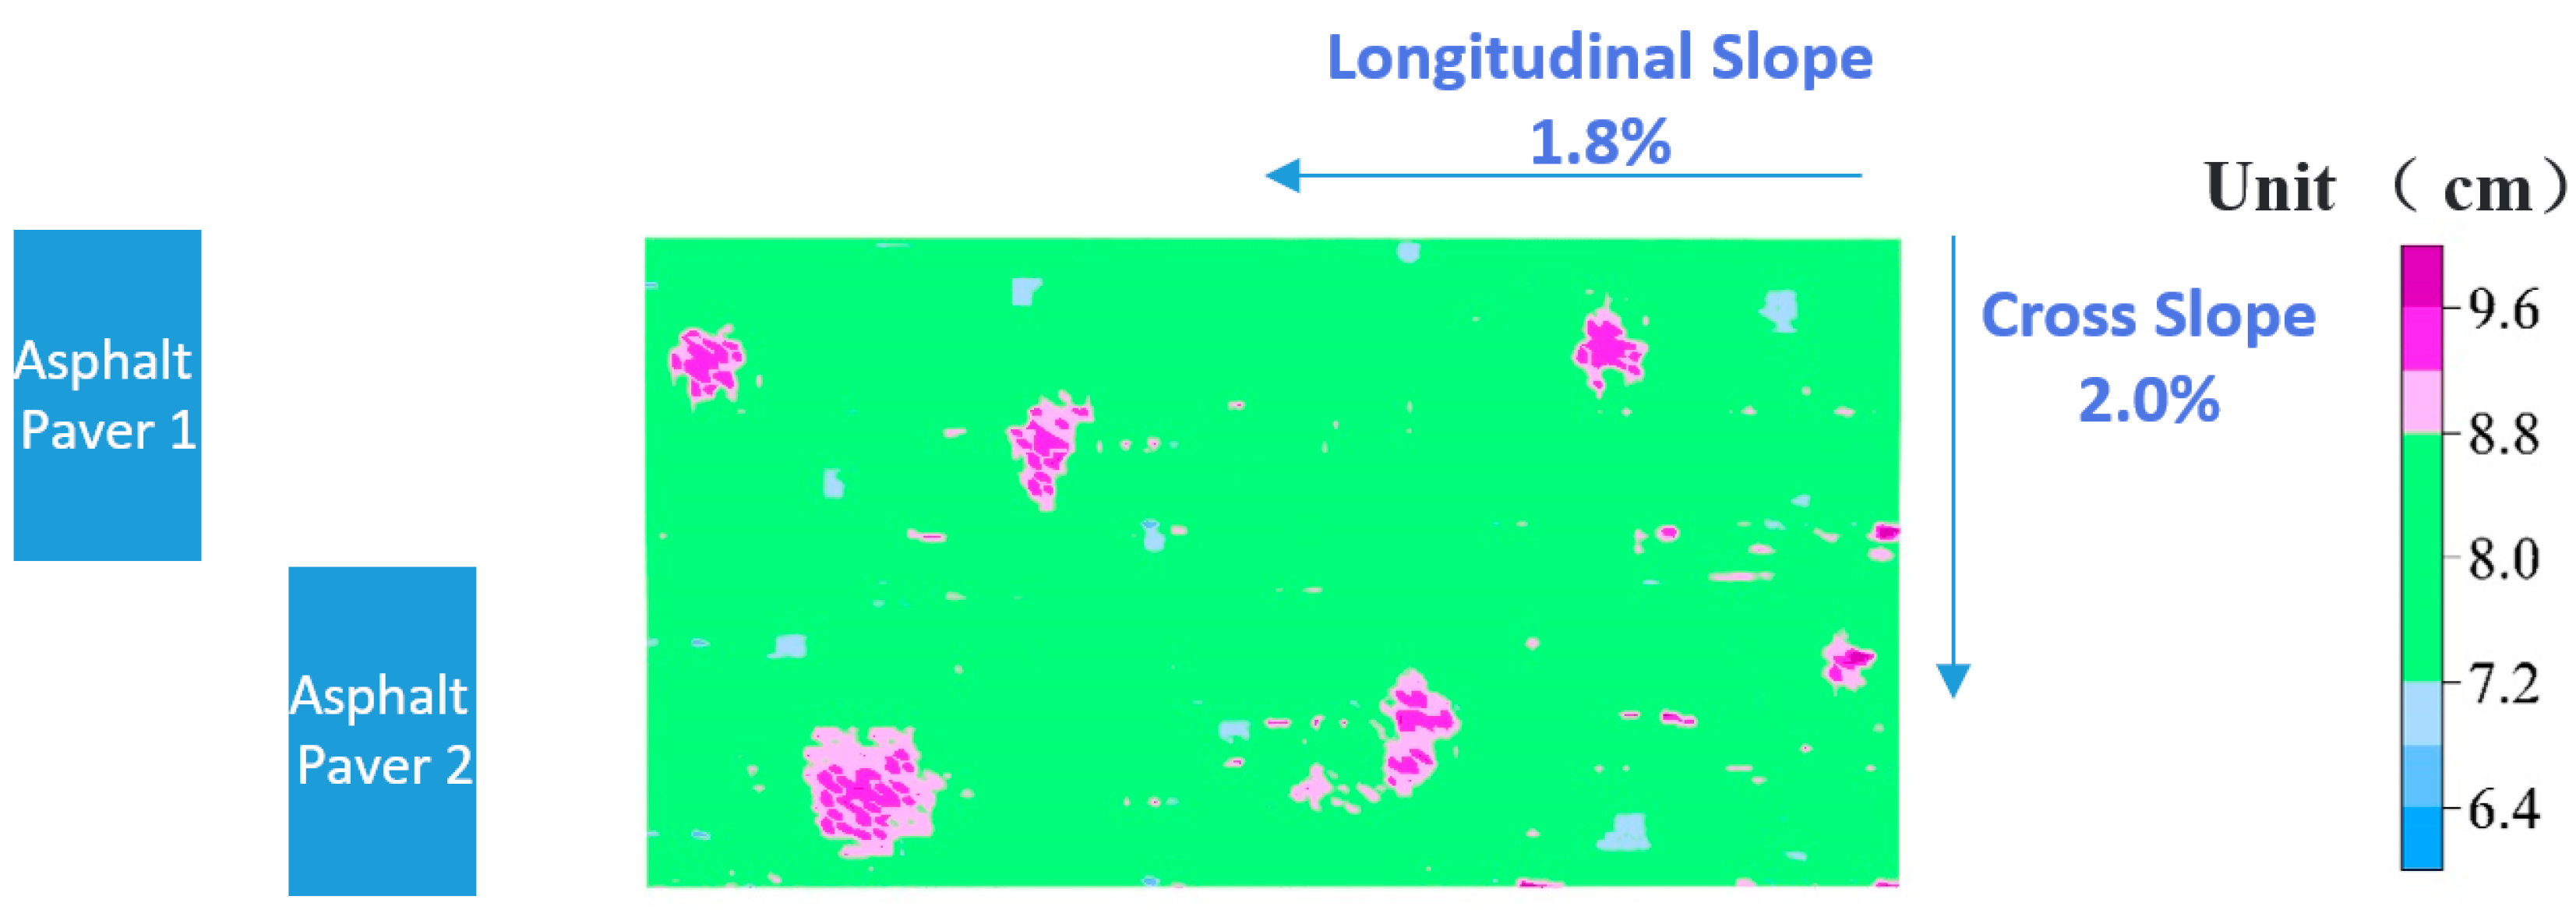
4.3. Nuclear-Free and Radar Test
5. Conclusions
- (1)
- In total, 99% of the crystals are composed of H2O, and the other components with a higher content include Al2O3, SiO2 and CaO.
- (2)
- The crystals (after deducting water molecules) mainly come from machine-made sand.
- (3)
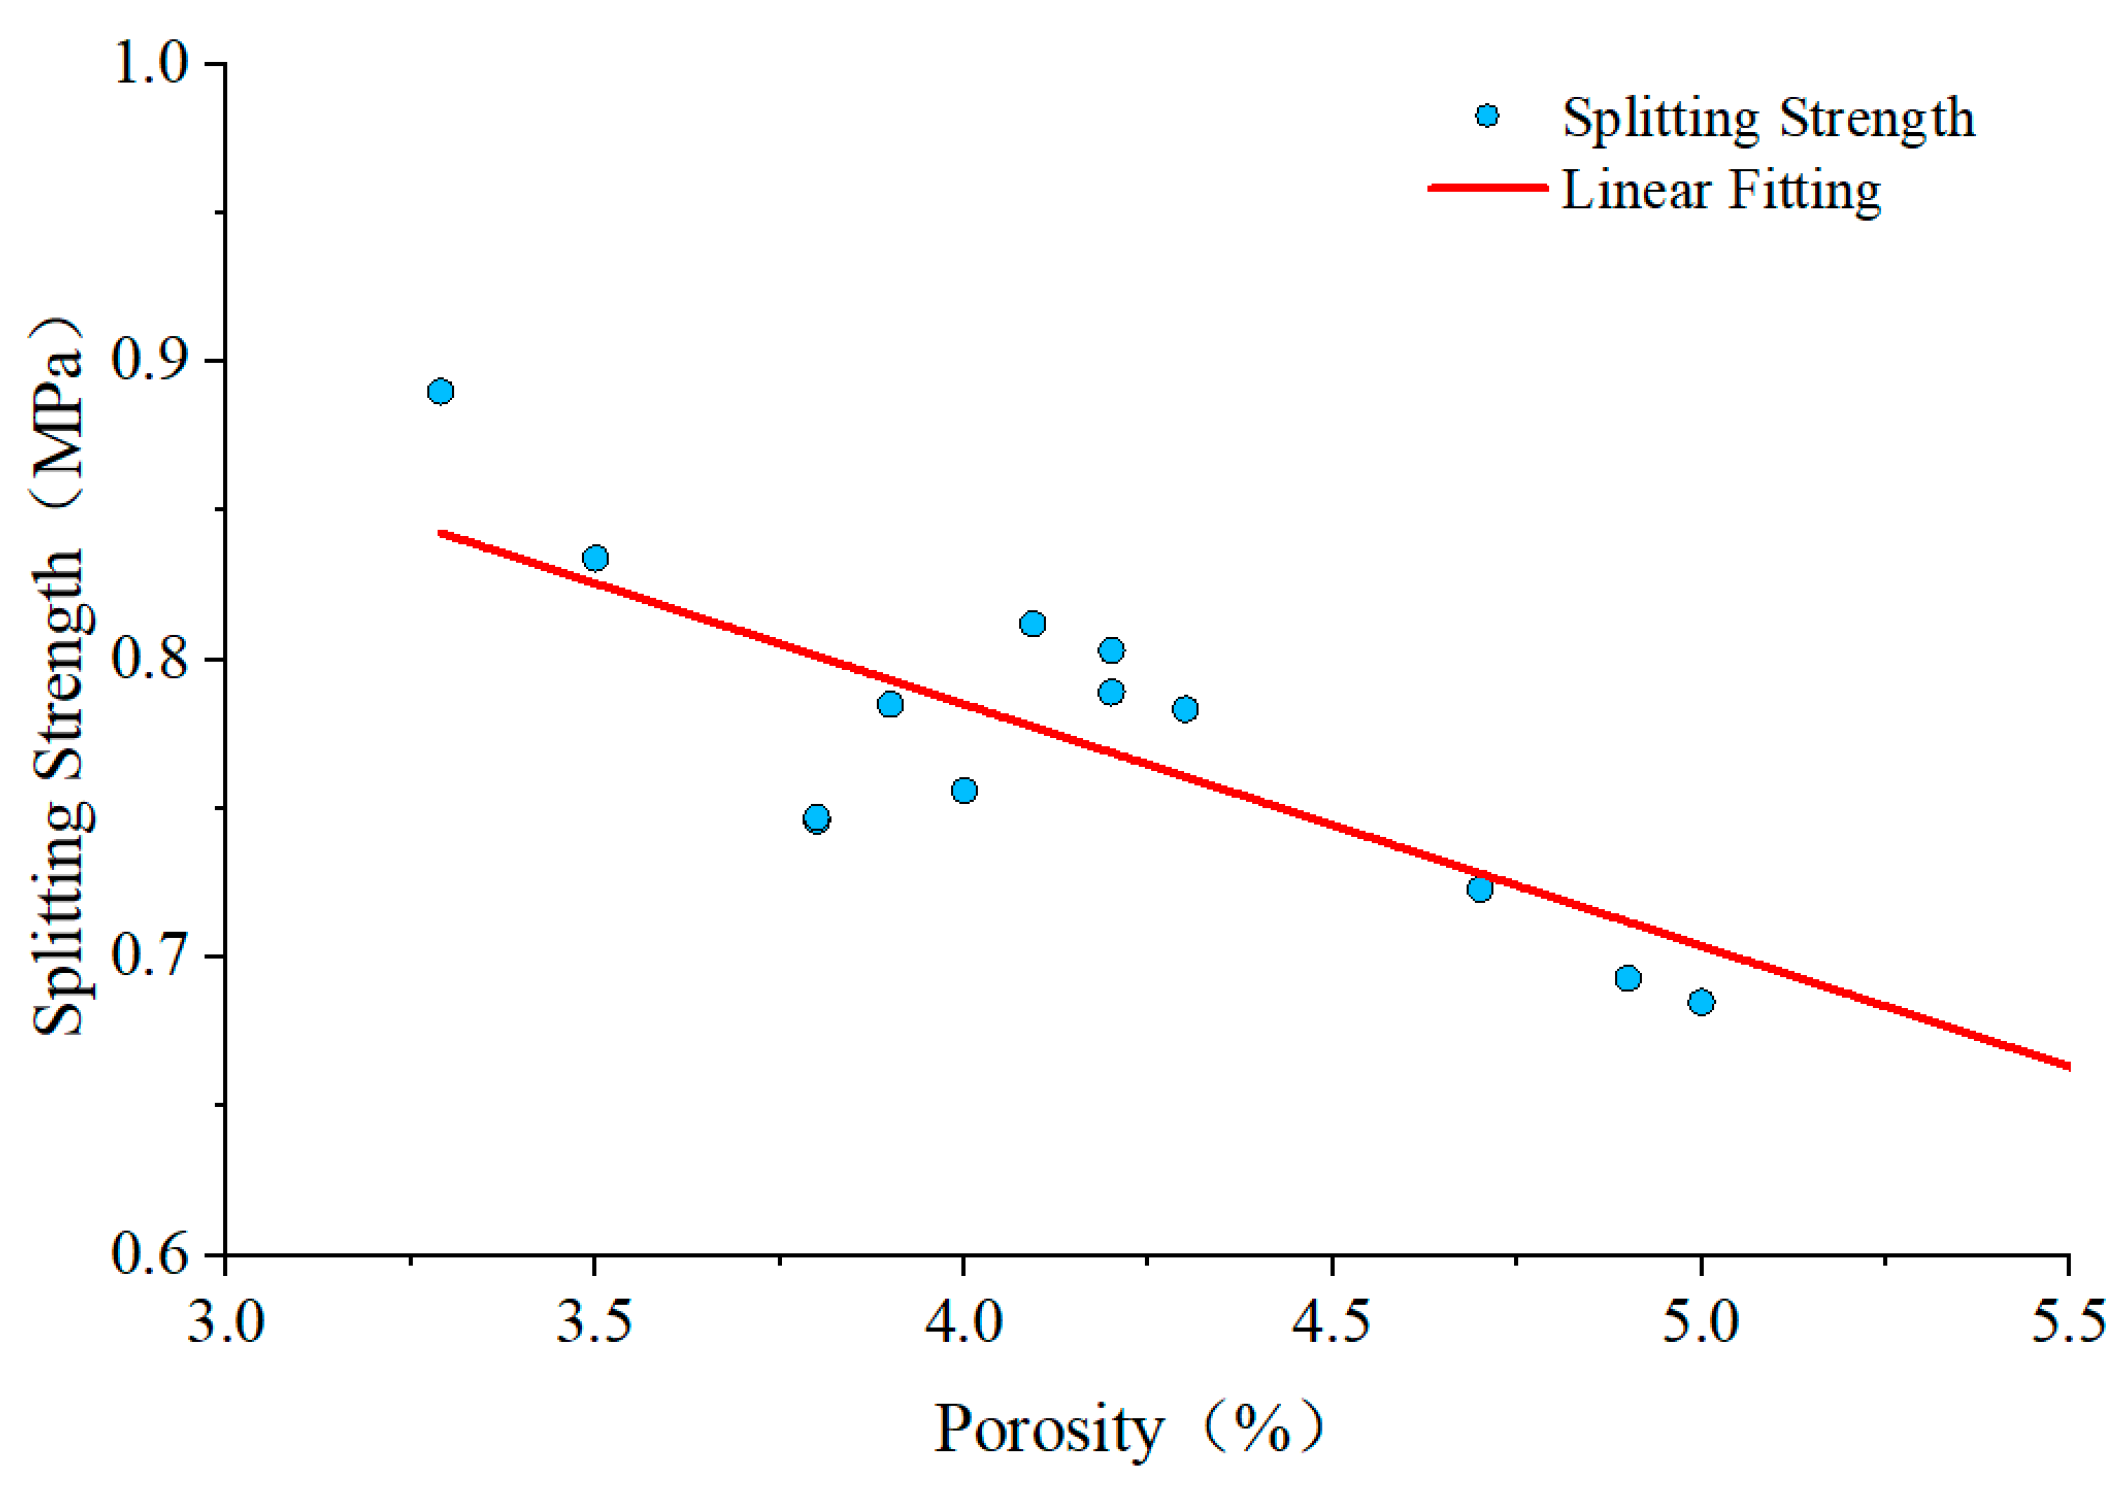
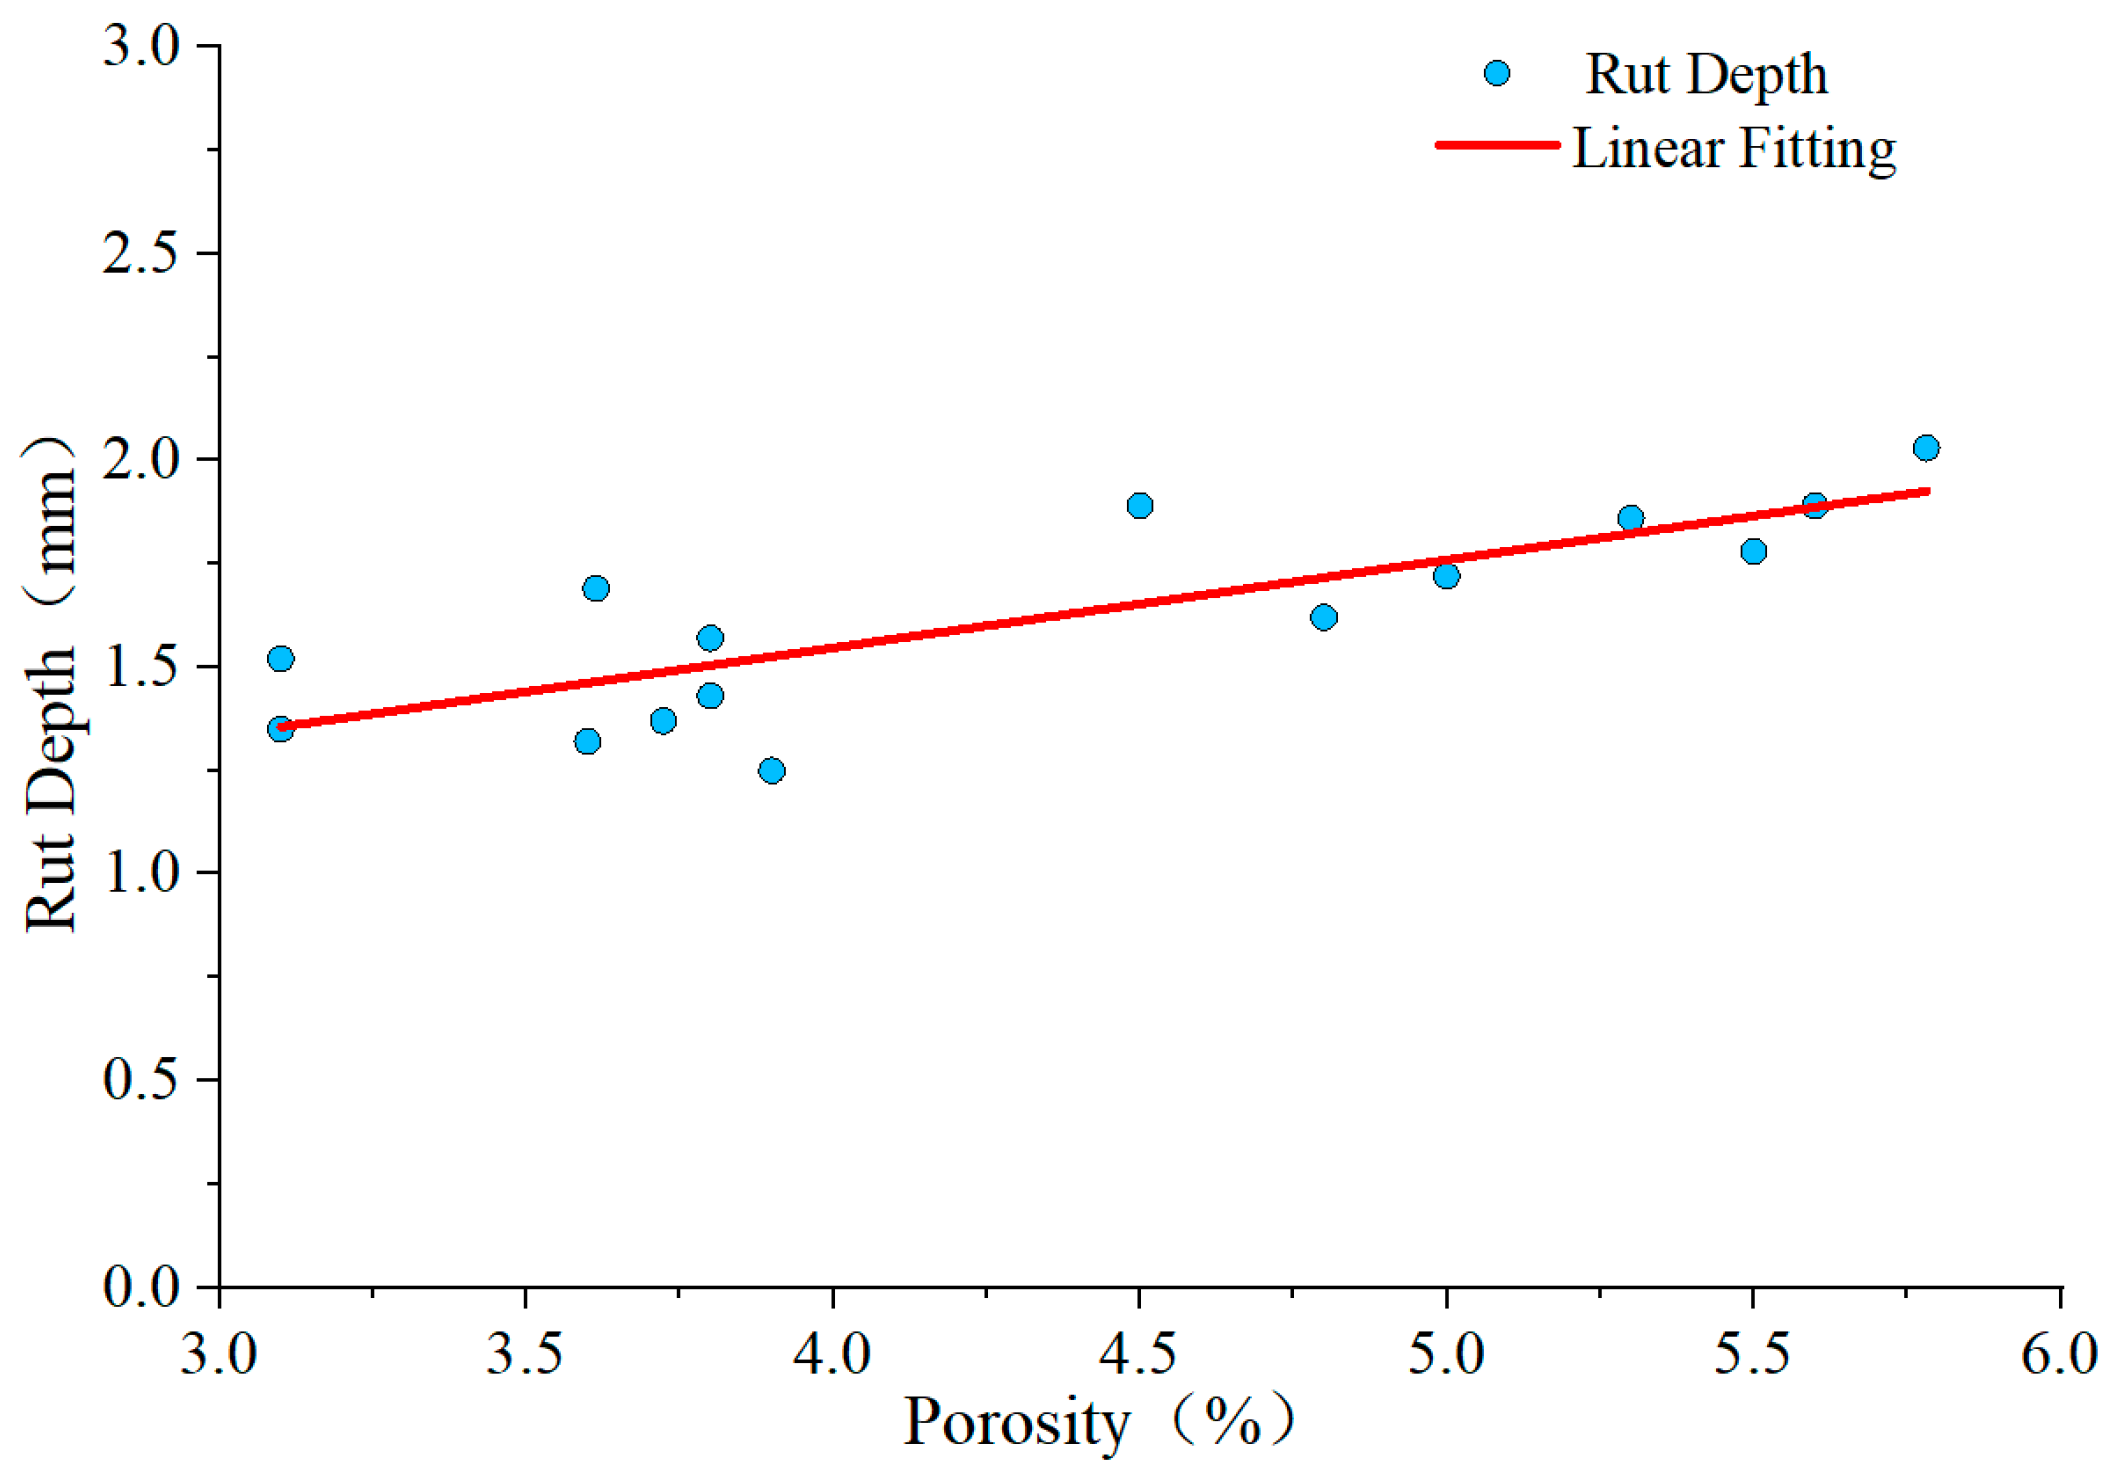
- The water permeability coefficient and porosity in the precipitation area are slightly larger than those in the non-precipitation area, but they all meet the design requirements; for splitting strength and multi-wheel rutting depth, there is no obvious difference between the precipitated area and non-precipitated area.
- (4)
- The formation mechanism of crystals; rainwater penetrates into the pavement through the coarse segregation area, and collects in the depression of the lower bearing layer through the connecting gap. Under the action of high temperature, the solution precipitates out of the pavement surface and undergoes crystallization.
- (5)
- In order to avoid the formation of crystals, the voidage ratio should be properly reduced in the design of the mixture to improve the dense water performance. The construction process should ensure the formation of the bottom bearing layer, to avoid the accumulation of water seepage. At the same time, the uniformity of the pavement should be further improved to ensure the watertight performance of the paving layer.
Author Contributions
Funding
Data Availability Statement
Acknowledgments
Conflicts of Interest
References
- Baojun, M. Study on Pavement Quality Control Technology of Asphalt Concrete Bridge Deck of Highway in Mountainous Areas. Master’s Thesis, Chang’an University, Xi’an, China, 2020. [Google Scholar]
- Hongjun, W.; Yuxia, L.; Jianlin, S. Types and Causes of asphalt pavement damage of cement concrete bridge deck. Highw. Transp. Sci. Technol. (Appl. Technol. Ed.) 2014, 10, 213–216. [Google Scholar]
- Changan, Z. Damage cause analysis and preventive measures of asphalt concrete bridge deck pave-ment. Gansu Sci. Technol. 2013, 29, 110–111. [Google Scholar]
- Yue, F. Study on Color Generation and Decay Mechanism of Asphalt Pavement. Master’s Thesis, Fuzhou University, Fuzhou, China, 2019. [Google Scholar]
- Cui, P.; Xiao, Y.; Fang, M.; Chen, Z.; Yi, M.; Li, M. Residual Fatigue Properties of Asphalt Pavement after Long-Term Field Service. Materials 2018, 11, 892. [Google Scholar] [CrossRef] [PubMed] [Green Version]
- Karki, P.; Zhou, F. Systematic Method for Quantifying Re-Refined Engine Oil Bottom Content in Binders Using X-Ray Fluorescence Spectroscopy. Transp. Res. Rec. 2017, 2632, 52–59. [Google Scholar] [CrossRef]
- Qian, G.P.; Li, S.J.; Yu, H.N.; Gong, X.B. Interlaminar Bonding Properties on Cement Concrete Deck and Phosphorous Slag Asphalt Pavement. Materials 2019, 12, 1427. [Google Scholar] [CrossRef] [Green Version]
- Muyu, L.; Luy, W.; Chunling, Y.; Juan, T. An experimental study on fading and whitening of asphalt pavement in Guangxi Region. Smart Cities 2021, 7, 31–32. [Google Scholar] [CrossRef]
- Lei, Y.; Hu, X.D.; Wang, H.N.; You, Z.P.; Zhou, Y.L.; Yang, X. Effects of vehicle speeds on the hydrodynamic pressure of pavement surface: Measurement with a designed device. Measurement 2017, 98, 1–9. [Google Scholar] [CrossRef]
- Liang, B.; Jiang, B.L. Study on Composition and Simulation Analysis of Traffic Loads in Submerged Floating Tunnels. In Proceedings of the 2nd International Symposium on Submerged Floating Tunnels and Underwater Tunnel Structures (SUFTUS), Chongqing, China, 16–18 December 2016; pp. 180–189. [Google Scholar]
- Bocci, E.; Graziani, A.; Canestrari, F. Mechanical 3D characterization of epoxy asphalt concrete for pavement layers of orthotropic steel decks. Constr. Build. Mater. 2015, 79, 145–152. [Google Scholar] [CrossRef]
- Budzinski, B.; Mieczkowski, P.; Slowik, M.; Mielczarek, M.; Bilski, M.; Fornalczyk, S. Assessment of the low-temperature performance of asphalt mixtures for bridge pavement. Road Mater. Pavement Des. 2023, 24, 409–423. [Google Scholar] [CrossRef]
- Graczyk, M.; Zbiciak, A.; Michalczyk, R.; Kowalewski, L. Numerical modelling of bubbles formation in the bridge asphalt pavement under gas pressure impact. Transp. Res. Proc. 2016, 14, 3925–3934. [Google Scholar] [CrossRef] [Green Version]
- Zou, G.L.; Xu, X.Y.; Li, J.X.; Yu, H.Y.; Wang, C.J.; Sun, J. The Effects of Bituminous Binder on the Performance of Gussasphalt Concrete for Bridge Deck Pavement. Materials 2020, 13, 364. [Google Scholar] [CrossRef] [Green Version]
- Shi, C. Research on Causes and Maintenance Measures of High Speed Bridge Damage in Liaoning Province. Master’s Thesis, Chang’an University, Xi’an, China, 2017. [Google Scholar]
- Tianyu, C. Analysis of deck pavement disease of hollow slab Bridge in Alpine region. Smart Cities 2021, 7, 69–70. [Google Scholar] [CrossRef]
- Guanhua, H.; Liting, Z.; Yapeng, Y.; Mengrou, Y. Asphaltic Concrete bridge Deck paving mechanism and prevention measures. Highway 2019, 64, 21–25. [Google Scholar]
- Fuxing, R. Causation analysis of asphalt concrete bridge deck whitening disease. Commun. World 2018, 8, 103–104. [Google Scholar] [CrossRef]
- Chao, H. A brief discussion on the whitening pulp disease of asphalt concrete bridge deck pavement. Heilongjiang Sci. Technol. Inf. 2013, 25, 230. [Google Scholar]
- Renjie, Q.; Lin, Z.; Cao, S.; Bin, L.; Ming, S. Causes and solutions of AC-20 whitening in the middle surface layer of Guilai Ex-pressway. Highw. Automob. Transp. 2015, 5, 119–121. [Google Scholar]
- Yang, Y.M.; Qian, Z.D.; Song, X. A pothole patching material for epoxy asphalt pavement on steel bridges: Fatigue test and numerical analysis. Constr. Build. Mater. 2015, 94, 299–305. [Google Scholar] [CrossRef]
- Aiguo, L.; Yang, L.; Xicai, M. Analysis of seepage causes and control technology of asphalt pavement layer of cement concrete bridge deck. Highw. Transp. Sci. Technol. (Appl. Technol. Ed.) 2012, 8, 59–61. [Google Scholar]
- Hao, P.W.; Zhang, M.Y.; Zhang, Q.; Xu, J.Z.; Dong, S. Study on evaluation method of mud-pumping of cement concrete bridge deck pavement. Constr. Build. Mater. 2018, 167, 106–114. [Google Scholar] [CrossRef]
- Tarefder, R.A.; Ahmad, M. Evaluation of pore structure and its influence on permeability and moisture damage in asphalt concrete. Int. J. Pavement Eng. 2017, 18, 274–283. [Google Scholar] [CrossRef]
- Fu, J.C.; Shen, A.Q.; Zhang, H. Study on the Influence and Law of Waterproof System Design Factors on the Typical Stress of Bridge Deck Pavement. Coatings 2021, 11, 1540. [Google Scholar] [CrossRef]
- Haynes, M.A.; Coleri, E.; Obaid, I. Performance of Waterproofing Membranes to Protect Concrete Bridge Decks. Transp. Res. Rec. 2021, 2675, 1693–1706. [Google Scholar] [CrossRef]
- Wang, J.W.; Ji, B.F.; Chen, B.; Chen, S.Q. Application of High-Viscosity Modified Asphalt Mixture in Curved Bridge Pavement. Sustainability 2023, 15, 3411. [Google Scholar] [CrossRef]
- Gao, Y. Causation analysis and treatment suggestion of asphalt surface of a highway bridge in Gansu Province. Gansu Sci. Technol. 2022, 38, 19–23. [Google Scholar]
- Haimin, S. Analysis of the causes of asphalt pavement whitening based on surface energy. Hei-Longjiang Transp. Sci. Technol. 2019, 42, 91–93. [Google Scholar] [CrossRef]
- Chao, Z. Key points and Technical Analysis of Fujian high-speed Asphalt Pavement Maintenance Engineering Design. Fujian Transp. Sci. Technol. 2021, 1, 6–8. [Google Scholar]
- Xiong, Z.; Ningbo, L.; Peiwen, H.; Yujing, W.; Shaohui, L. Evaluation method and influencing factors of anti-whitening performance of asphalt mixture for bridge deck pavement. Inn. Mong. Highw. Transp. 2021, 6, 9–16. [Google Scholar] [CrossRef]
- Zhiyong, H.; Chunlong, X.; Weixiong, L.; Wen, N.; Jiangmiao, Y. Analysis and control of caustic flooding mechanism of newly built asphalt pavement. Highway 2019, 64, 40–47. [Google Scholar]
- Hu, J.; Qian, Z.D.; Liu, P.F.; Wang, D.W.; Oeser, M. Investigation on the permeability of porous asphalt concrete based on microstructure analysis. Int. J. Pavement Eng. 2020, 21, 1683–1693. [Google Scholar] [CrossRef]
- Li, W.X.; Wang, D.Y.; Xiong, C.L.; Yu, J.M.; Chen, B.; Yu, X.S. Mechanism, prevention and remedy of alkali-pumping in new constructed asphalt pavement. Int. J. Pavement Eng. 2022, 23, 2689–2702. [Google Scholar] [CrossRef]
- Sasaki, I.; Moriyoshi, A.; Tsunekawa, M. Water accumulation and behavior of surfactant associated with moisture permeation in bituminous pavement on concrete deck bridge. J. Jpn. Pet. Inst. 2006, 49, 315–320. [Google Scholar] [CrossRef] [Green Version]
- Xu, S.F.; Lu, G.Y.; Hong, B.; Jiang, X.Y.; Peng, G.; Wang, D.W.; Oeser, M. Experimental investigation on the development of pore clogging in novel porous pavement based on polyurethane. Constr. Build. Mater. 2020, 258, 12–37. [Google Scholar] [CrossRef]
- Jahandari, S.; Tao, Z.; Saberian, M.; Shariati, M.; Li, J.; Abolhasani, M.; Kazemi, M.; Rahmani, A.; Rashidi, M. Geotechnical properties of lime-geogrid improved clayey subgrade under various moisture conditions. Road. Mater. Pavement 2022, 23, 2057–2075. [Google Scholar] [CrossRef]
- Toghroli, A.; Shariati, M.; Sajedi, F.; Ibrahim, Z.; Koting, S.; Mohamad, E.T.; Khorami, M. A review on pavement porous concrete using recycled waste materials. Smart Struct. Syst. 2018, 22, 433–440. [Google Scholar] [CrossRef]
- Larsen, T.; Randhol, P.; Lioliou, M.; Josang, L.O.; Ostvold, T. Kinetics of CaCO3 scale formation during core flooding. In Proceedings of the 9th International Conference on Oilfield Scale 2008—”Managing Scale Through the Field Lifetime”, Aberdeen, UK, 28–29 May 2008; pp. 162–173. [Google Scholar]
- Charpentier, T.V.J.; Neville, A.; Baraka-Lokmane, S.; Hurtevent, C.; Ordonez-Varela, J.R.; Nielsen, F.M.; Eroini, V.; Olsen, J.H.; Ellingsen, J.A.; Bache, O. Evaluation of anti-fouling surfaces for prevention of mineral scaling in sub-surface safety valves. In Proceedings of the SPE International Conference and Exhibition on Oilfield Scale 2014, Aberdeen, UK, 14–15 May 2014; pp. 31–45. [Google Scholar]
- Foroutan, S.; Moghadasi, J. A neural network approach to predict formation damage due to calcium sulphate precipitation. In Proceedings of the SPE European Formation Damage Conference and Exhibition 2013: Unconventional and Conventional Solutions to Challenging Reservoirs, Noordwijk, The Netherlands, 5–7 June 2013; pp. 714–725. [Google Scholar]
- Gao, C.Q. Study on the Regularity of Groundwater Crystallization Clogging Drainage Pipe and Its Influence on the Stability of High Slope. Ph.D. Thesis, Chongqing Jiaotong University, Chongqing, China, 2020. [Google Scholar]
- Liu, Y.Y.; Lai, H.P.; Zhao, Y.B.; Sun, W.X. Spatio-Temporal Variation of Crystallites and Water Environment and Crystallization Path Analysis in Tunnel Drainage System of Calcium-Rich Surrounding Rock. Mod. Tunn. Technol. 2023, 1–10. Available online: http://kns.cnki.net/kcms/detail/51.1600.U.20230331.1343.006.html (accessed on 14 May 2023).
- Wu, Y.Z.; Li, G.P.; Jia, Q.Q.; Qi, H.Y.; Li, D.W. Study on the component characteristics and sources of porous crystallites in loess tunnel. Mod. Tunn. Technol. 2020, 57, 154–159. [Google Scholar] [CrossRef]
- Jiang, X.; Mu, S.; Liu, J.P. Influence of chlorides and salt concentration on salt crystallization damage of cement-based materials. J. Build. Eng. 2022, 61, 105260. [Google Scholar] [CrossRef]
- Yang, S.Y.; Han, M.; Chen, X.L.; Song, J.J.; Yang, J.S. Influence of sulfate crystallization on bond-slip behavior between deformed rebar and concrete subjected to combined actions of dry-wet cycle and freeze-thaw cycle. Constr. Build. Mater. 2022, 345, 128368. [Google Scholar] [CrossRef]


| Layer | Type |
|---|---|
| Upper pavement | SMA-13 (SBS modified asphalt) |
| Lower pavement | GAC-20 (SBS modified asphalt) |
| Waterproof adhesive layer | Synchronous macadam seal (SBS modified asphalt) |
| Adhesive layer | Modified emulsified asphalt |
| Pilot | Test Results | |
|---|---|---|
| Penetration 25 °C, 100 g, 5 s, (0.1 mm) | 49 | |
| Ductility 5 °C, 5 cm/min, (cm) | 33 | |
| Softening point, TR&B (°C) | 88 | |
| Solubility (%) | 99.8 | |
| Storage stability: 163 °C; 48 h; softening point difference, °C | 0.8 | |
| Elastic recovery 25 °C, % | 96 | |
| Kinematic viscosity at 135 °C (Pa·s) | 2.42 | |
| Rolling thin film oven test (RTFOT) Residue (163 °C, 85 min) | Quality change (%) | 0.016 |
| Ductility 5 °C, 5 cm/min, (cm) | 22 | |
| Penetration ratio (%) | 77.7 | |
| Test Index | Unit | Test Results |
|---|---|---|
| Apparent relative density | — | 2.947 |
| Rigidity (>0.3 mm part) | % | 2.7 |
| Sand equivalent | % | 69 |
| Methylene blue value | g/kg | 0.9 |
| Angularity (flow time) | s | 38.7 |
| Indicators | Position | Average | Difference |
|---|---|---|---|
| Water permeability coefficient (mL/min) | Center point | 39.5 | −13 |
| Peripheral average | 26.5 | ||
| Porosity (%) | Center point | 4.7 | −0.5 |
| Peripheral average | 4.2 | ||
| Splitting strength (MPa) | Center point | 0.737 | 0.034 |
| Peripheral average | 0.771 | ||
| Rutting depth (mm) | Center point | 1.59 | −0.05 |
| Peripheral average | 1.54 |
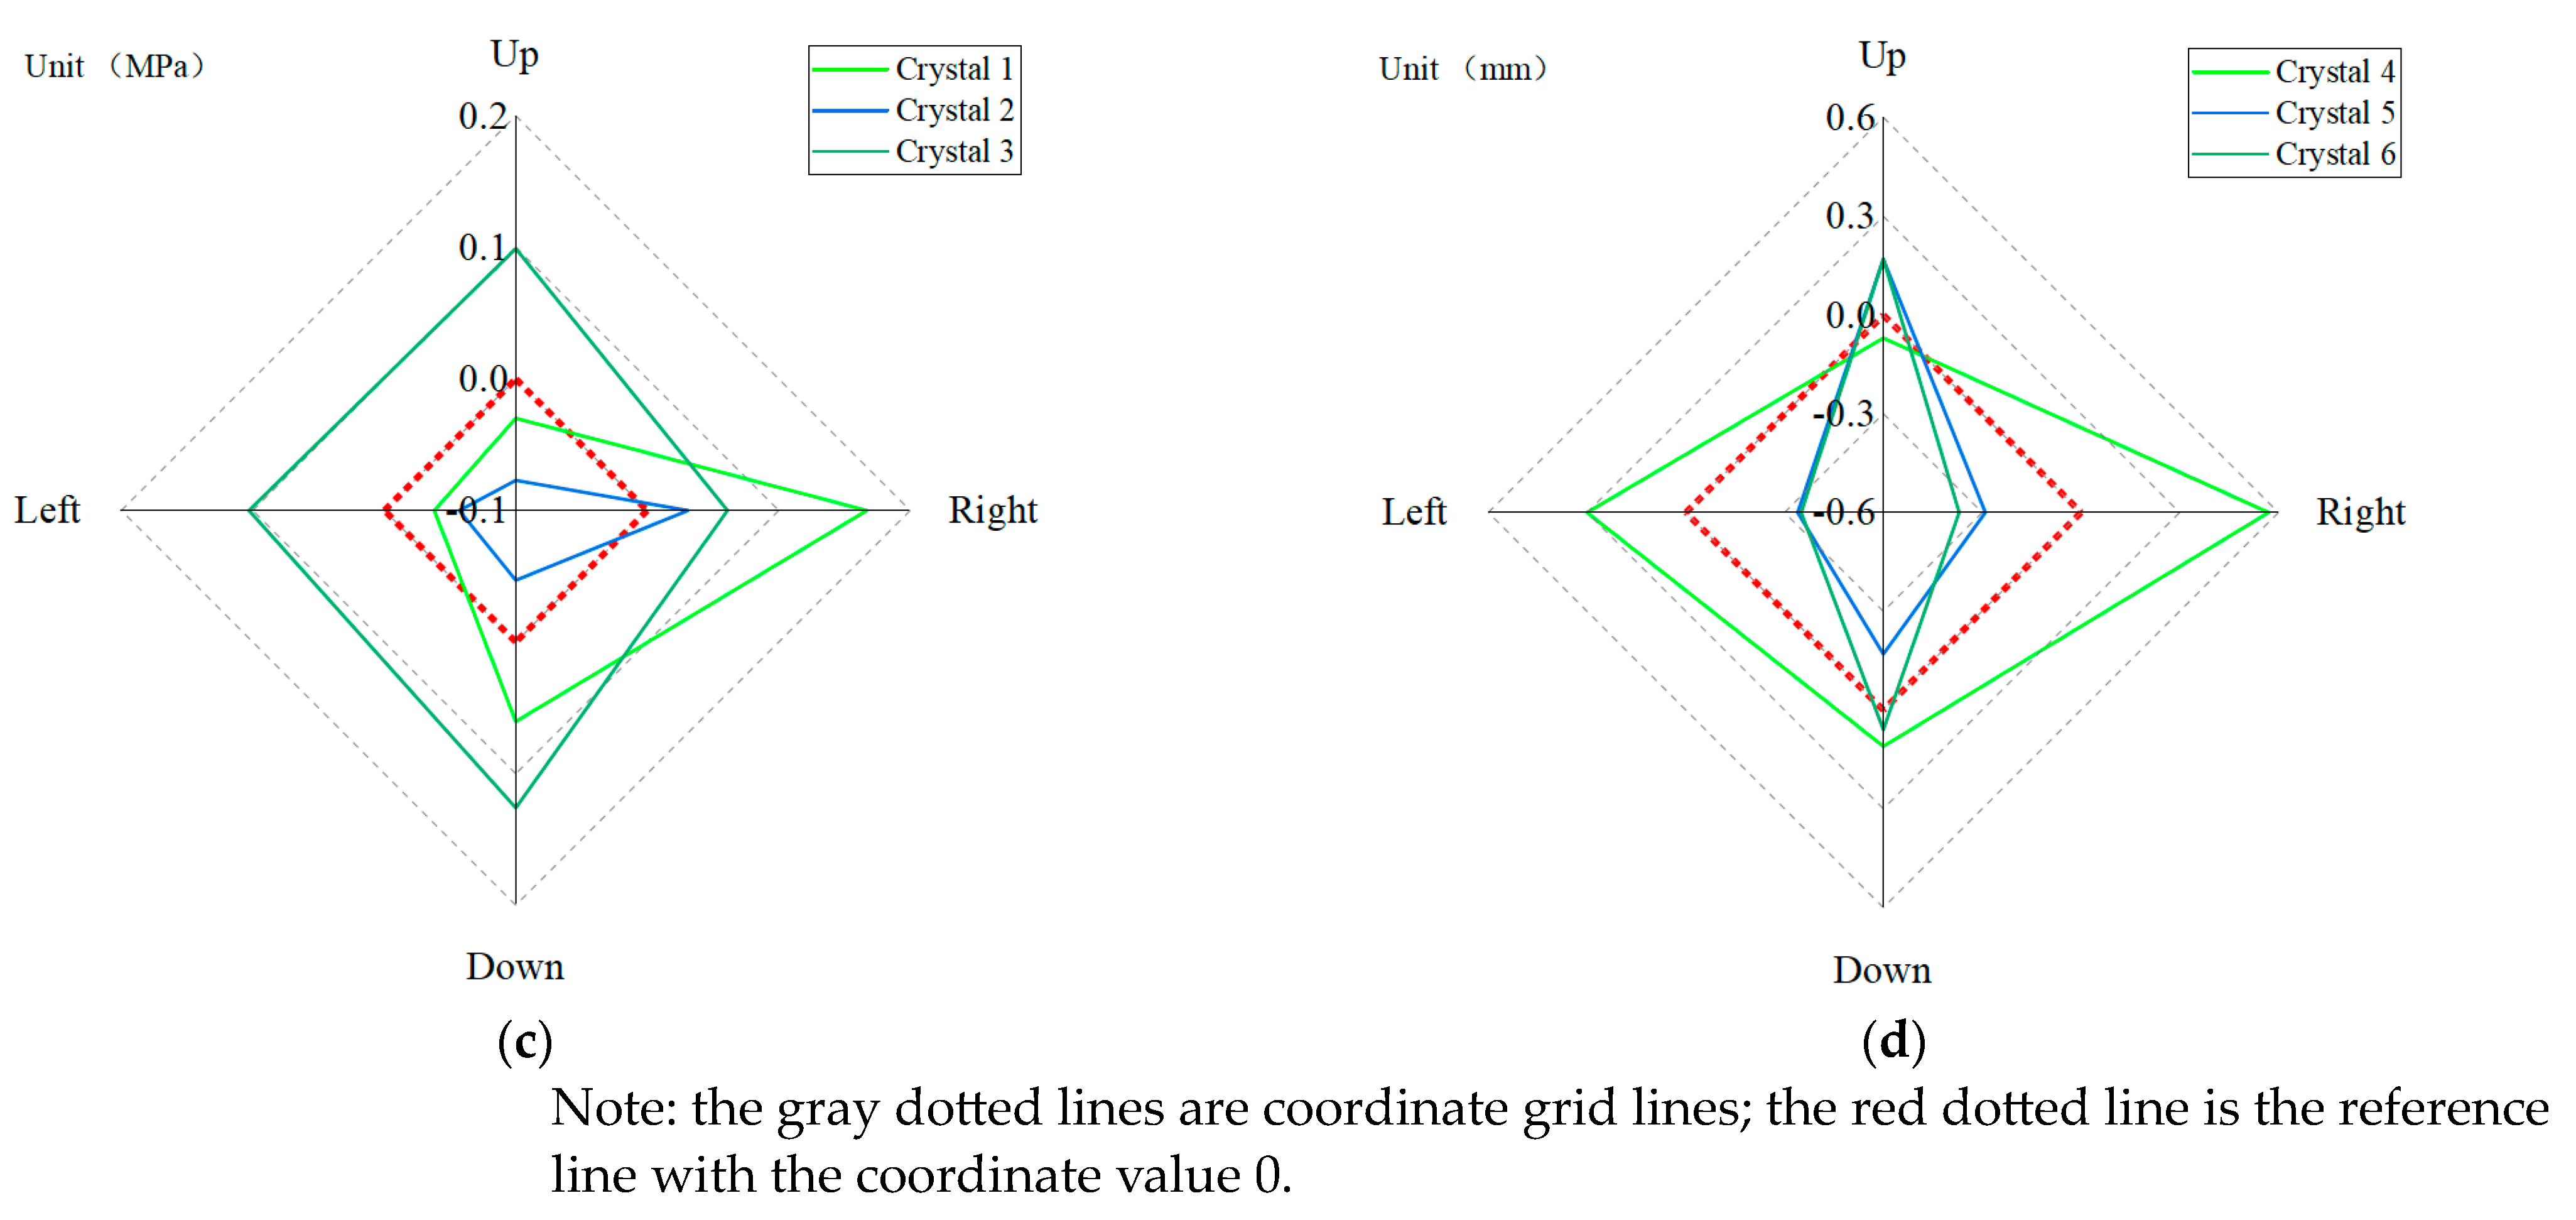
| Position | Splitting Strength (MPa) | Rutting Depth (mm) | ||||
|---|---|---|---|---|---|---|
| Crystal 1 | Crystal 2 | Crystal 3 | Crystal 4 | Crystal 5 | Crystal 6 | |
| Crystal region | 0.723 | 0.803 | 0.686 | 1.32 | 1.86 | 1.72 |
| Average value of peripheral area | 0.763 | 0.766 | 0.783 | 1.55 | 1.7 | 1.6 |
| Difference | 6% | −5% | 14% | 17% | −9% | −7% |
Disclaimer/Publisher’s Note: The statements, opinions and data contained in all publications are solely those of the individual author(s) and contributor(s) and not of MDPI and/or the editor(s). MDPI and/or the editor(s) disclaim responsibility for any injury to people or property resulting from any ideas, methods, instructions or products referred to in the content. |
© 2023 by the authors. Licensee MDPI, Basel, Switzerland. This article is an open access article distributed under the terms and conditions of the Creative Commons Attribution (CC BY) license (https://creativecommons.org/licenses/by/4.0/).
Share and Cite
Luo, C.; Wang, D.; Li, J.; He, J. Study on Crystallization Mechanism of Asphalt Mixture in Bridge Deck Pavement. Buildings 2023, 13, 1527. https://doi.org/10.3390/buildings13061527
Luo C, Wang D, Li J, He J. Study on Crystallization Mechanism of Asphalt Mixture in Bridge Deck Pavement. Buildings. 2023; 13(6):1527. https://doi.org/10.3390/buildings13061527
Chicago/Turabian StyleLuo, Chuanxi, Duanyi Wang, Jian Li, and Jun He. 2023. "Study on Crystallization Mechanism of Asphalt Mixture in Bridge Deck Pavement" Buildings 13, no. 6: 1527. https://doi.org/10.3390/buildings13061527