Article

Optimal Shape Design of Concrete Sleepers under Lateral Loading Using DEM

by
Jafar Chalabii
1,
Majid Movahedi Rad
1,* and
Seyedsaber Hosseini
2
1
Department of Structural and Geotechnical Engineering, Széchenyi István University, Egyetem tér 1, 9026 Győr, Hungary
2
Department of Civil and Environmental Engineering, Amirkabir University of Technology, Tehran 1591634311, Iran
*
Author to whom correspondence should be addressed.
Buildings 2023, 13(7), 1574; https://doi.org/10.3390/buildings13071574
Submission received: 18 May 2023 / Revised: 9 June 2023 / Accepted: 14 June 2023 / Published: 21 June 2023
(This article belongs to the Section Building Materials, and Repair & Renovation)

Abstract

:
Despite the significant contribution of sleepers to the lateral resistance of ballasted tracks, limited research has focused on improving the shape of sleepers in this aspect. This study aims to evaluate proposed sleeper shapes based on the B70 form, utilizing a linear optimization algorithm. First, a DEM model was verified for this purpose using the outcomes of the experiments. Then, using this model, the effect of the weight of the B70 sleeper was carried out on lateral resistance. Next, suggested shapes contacted with ballast materials were applied to lateral force while maintaining the mechanical ballast’s properties until a displacement of 3.5 mm was achieved. The current study’s results showed that the rate of lateral resistance increasing becomes lower for weights higher than 400 kg. Additionally, it was demonstrated that the sleeper’s weight will not always increase lateral resistance. The findings also indicated that although some proposal shapes had higher lateral resistance in comparison to other forms, these designs are not practical from an economic standpoint. Furthermore, despite the lower weight of some other suggested shapes in comparison with B70, the lateral resistances are 31.2% greater. As a result, it is possible to recommend employing a proposed sleeper rather than a B70 sleeper.

1. Introduction

Due to their advantages, such as greater freight and passenger capacity, travel safety, higher speed, lower fuel consumption, and, ultimately, lower environmental pollution, railway transportation systems have recently garnered ever-increasing attention [1].
Compared to other railroad types, ballasted tracks have a much wider variety of uses; in fact, in 2017, it was estimated that the length of all ballasted tracks worldwide was around 1.4 million kilometers [2]. The lateral instability of railroad tracks or track buckling can be brought on by the high axial forces on continuously welded rails (CWR), primarily brought on by daily and seasonal temperature gradients. Researching ways to improve track lateral resistance or prevent track buckling is of utmost importance due to the maintenance and cost needed for railway renovation after buckling. The various characteristics of the track elements affect track lateral stability, also referred to as the preventative factor against buckling. The characteristics of the rail section, the lateral, longitudinal, and torsional stiffness of the fasteners, the type and geometry of the sleepers, and the ballast specs all affect the track’s lateral resistance. Experimental investigations showed that the most crucial factor in supplying lateral resistance is the interaction between the sleeper and ballast [3].
Additionally, studies have shown that increasing the friction between the ballast layer, the sleeper bottom, and the contact between the ballast particles and the sleeper bottom increases the lateral resistance of ballasted rails [4]. The difficulties of high-volume maintenance and increasing lateral stability in the ballast layer have been addressed in various ways, including the use of specialized sleepers. Most of these methods concentrate on reducing ballast stress. For a variety of reasons, such as ballast particles escaping beneath the sleeper or a reduced height of the crib/shoulder ballast after the train passes by, it is more acceptable to change the sleeper shape, size, or weight rather than the ballast layer to increase the lateral resistance of ballasted track (mostly on high-speed trains). It is also difficult to increase the lateral resistance using polyurethane or geogrid materials through tamping and maintenance procedures [5]. They are unused primarily because improving the ballast’s shear resistance requires expensive processes [5].
The performance of three different types of concrete sleepers—B70, winged, and frictional—on track buckling temperature was examined in 2021 by Miri et al. [6]. Based on the outcomes of single-tie push tests carried out on each kind of sleeper, a finite element model of the track was created and updated. According to the study cited, if a safe temperature of 40 °C is taken into account for the track, only frictional concrete sleepers can withstand track buckling for a tight curve of a radius of 100 m. Conventional B70 sleepers may only be utilized in curves with a radius greater than 1200 m with the same safe temperature [6].
In 2021, Koyama et al. [7] investigated how changes in sleeper spacing on conventional railway lines affected a ballast’s lateral resistance characteristics. To assess the lateral resistance of the ballast in the aforementioned study, single-sleeper pullout tests were carried out on models based on various sleeper spacing situations. The effect of interference between adjacent sleepers on the amount of lateral resistance experienced by each sleeper was examined based on the test findings. The sleeper width was used as a parameter in a quantitative function model to represent the results (normalized by sleeper spacing) [7].
On several concrete sleepers on a test track, Khatibi et al. conducted a sensitivity analysis of track lateral resistance in 2017 using the discrete element method (DEM), and the results of the single-tie push test were simulated by the discrete element method used in PFC 3D. Numerous sensitivity analyses were carried out on the ballast depth, ballast shoulder width, ballast shoulder height, inter-particle friction of the ballast material, and ballast layer porosity based on the good compatibility of the findings (density) [8].
In 2022, Mansouri et al. investigated the lateral resistance of four types of sleepers B70, HA110, middle-winged, and winged sleepers [9]. In the mentioned study, the results of the single-tie push test (STPT) and DEM was compared. Findings of STPT showed that applying HA110, winged, and middle-winged sleepers improved the lateral resistance by 31%, 50%, and 17%, respectively, compared to conventional B70 sleepers. Additionally, DEM was used to examine the lateral resistance of four different sleeper types (HA110, winged, middle-winged, and B70) under four different support conditions (i.e., full support, lack of center support, high center binding, and lack of rail seat support). The results indicated that winged and HA110 sleepers behaved similarly in terms of providing lateral track resistance without taking crib and shoulder ballasts into account in the absence of center and high center binding support conditions, whereas winged sleepers displayed the highest lateral resistance in the presence of crib and shoulder ballasts in full support, lack of rail seat support, and lack of center support conditions.
In 2022, Chalabii et al. [10] evaluated the effect of sleeper shape on the lateral resistance of ballasted tracks through DEM. In the investigated study, according to experimental results, a DEM model was verified. The effect of the various contact areas that the B70 sleeper encounters with the crib, shoulder, and beneath ballast aggregates on the lateral resistance of a single sleeper was then subjected to sensitivity analysis. The findings indicated that, in terms of lateral resistance, the head area of the sleeper has an 8.2 times greater effect than the bottom area of the sleeper and a 14.5 times greater effect than the side area of the sleeper.
A thorough study of the technical literature revealed that, despite the significance of optimizing the shape of concrete sleepers under lateral force in ballasted track, only a small number of research has been conducted in this area so far. Therefore, the purpose of the current study is to adequately address the question of which shapes might be suitable alternatives to B70 sleepers with the aim of optimizing. As a result, in the first stage, a DEM model was verified in the PFC 3D environment using the experimental STPT data from previous [8] studies. Afterward, some proposed geometric shapes based on the form of B70 were inputted to PFC 3D using an optimization algorithm. Then, these shapes were filled with clumps of particles to form the sleeper. In the following, the sleeper contacted with ballast materials was applied lateral force until 3.5 mm displacement. Finally, certain forms were recommended by the optimization algorithm to use instead of the B70 sleeper.

2. Material Specifications and DEM Simulations
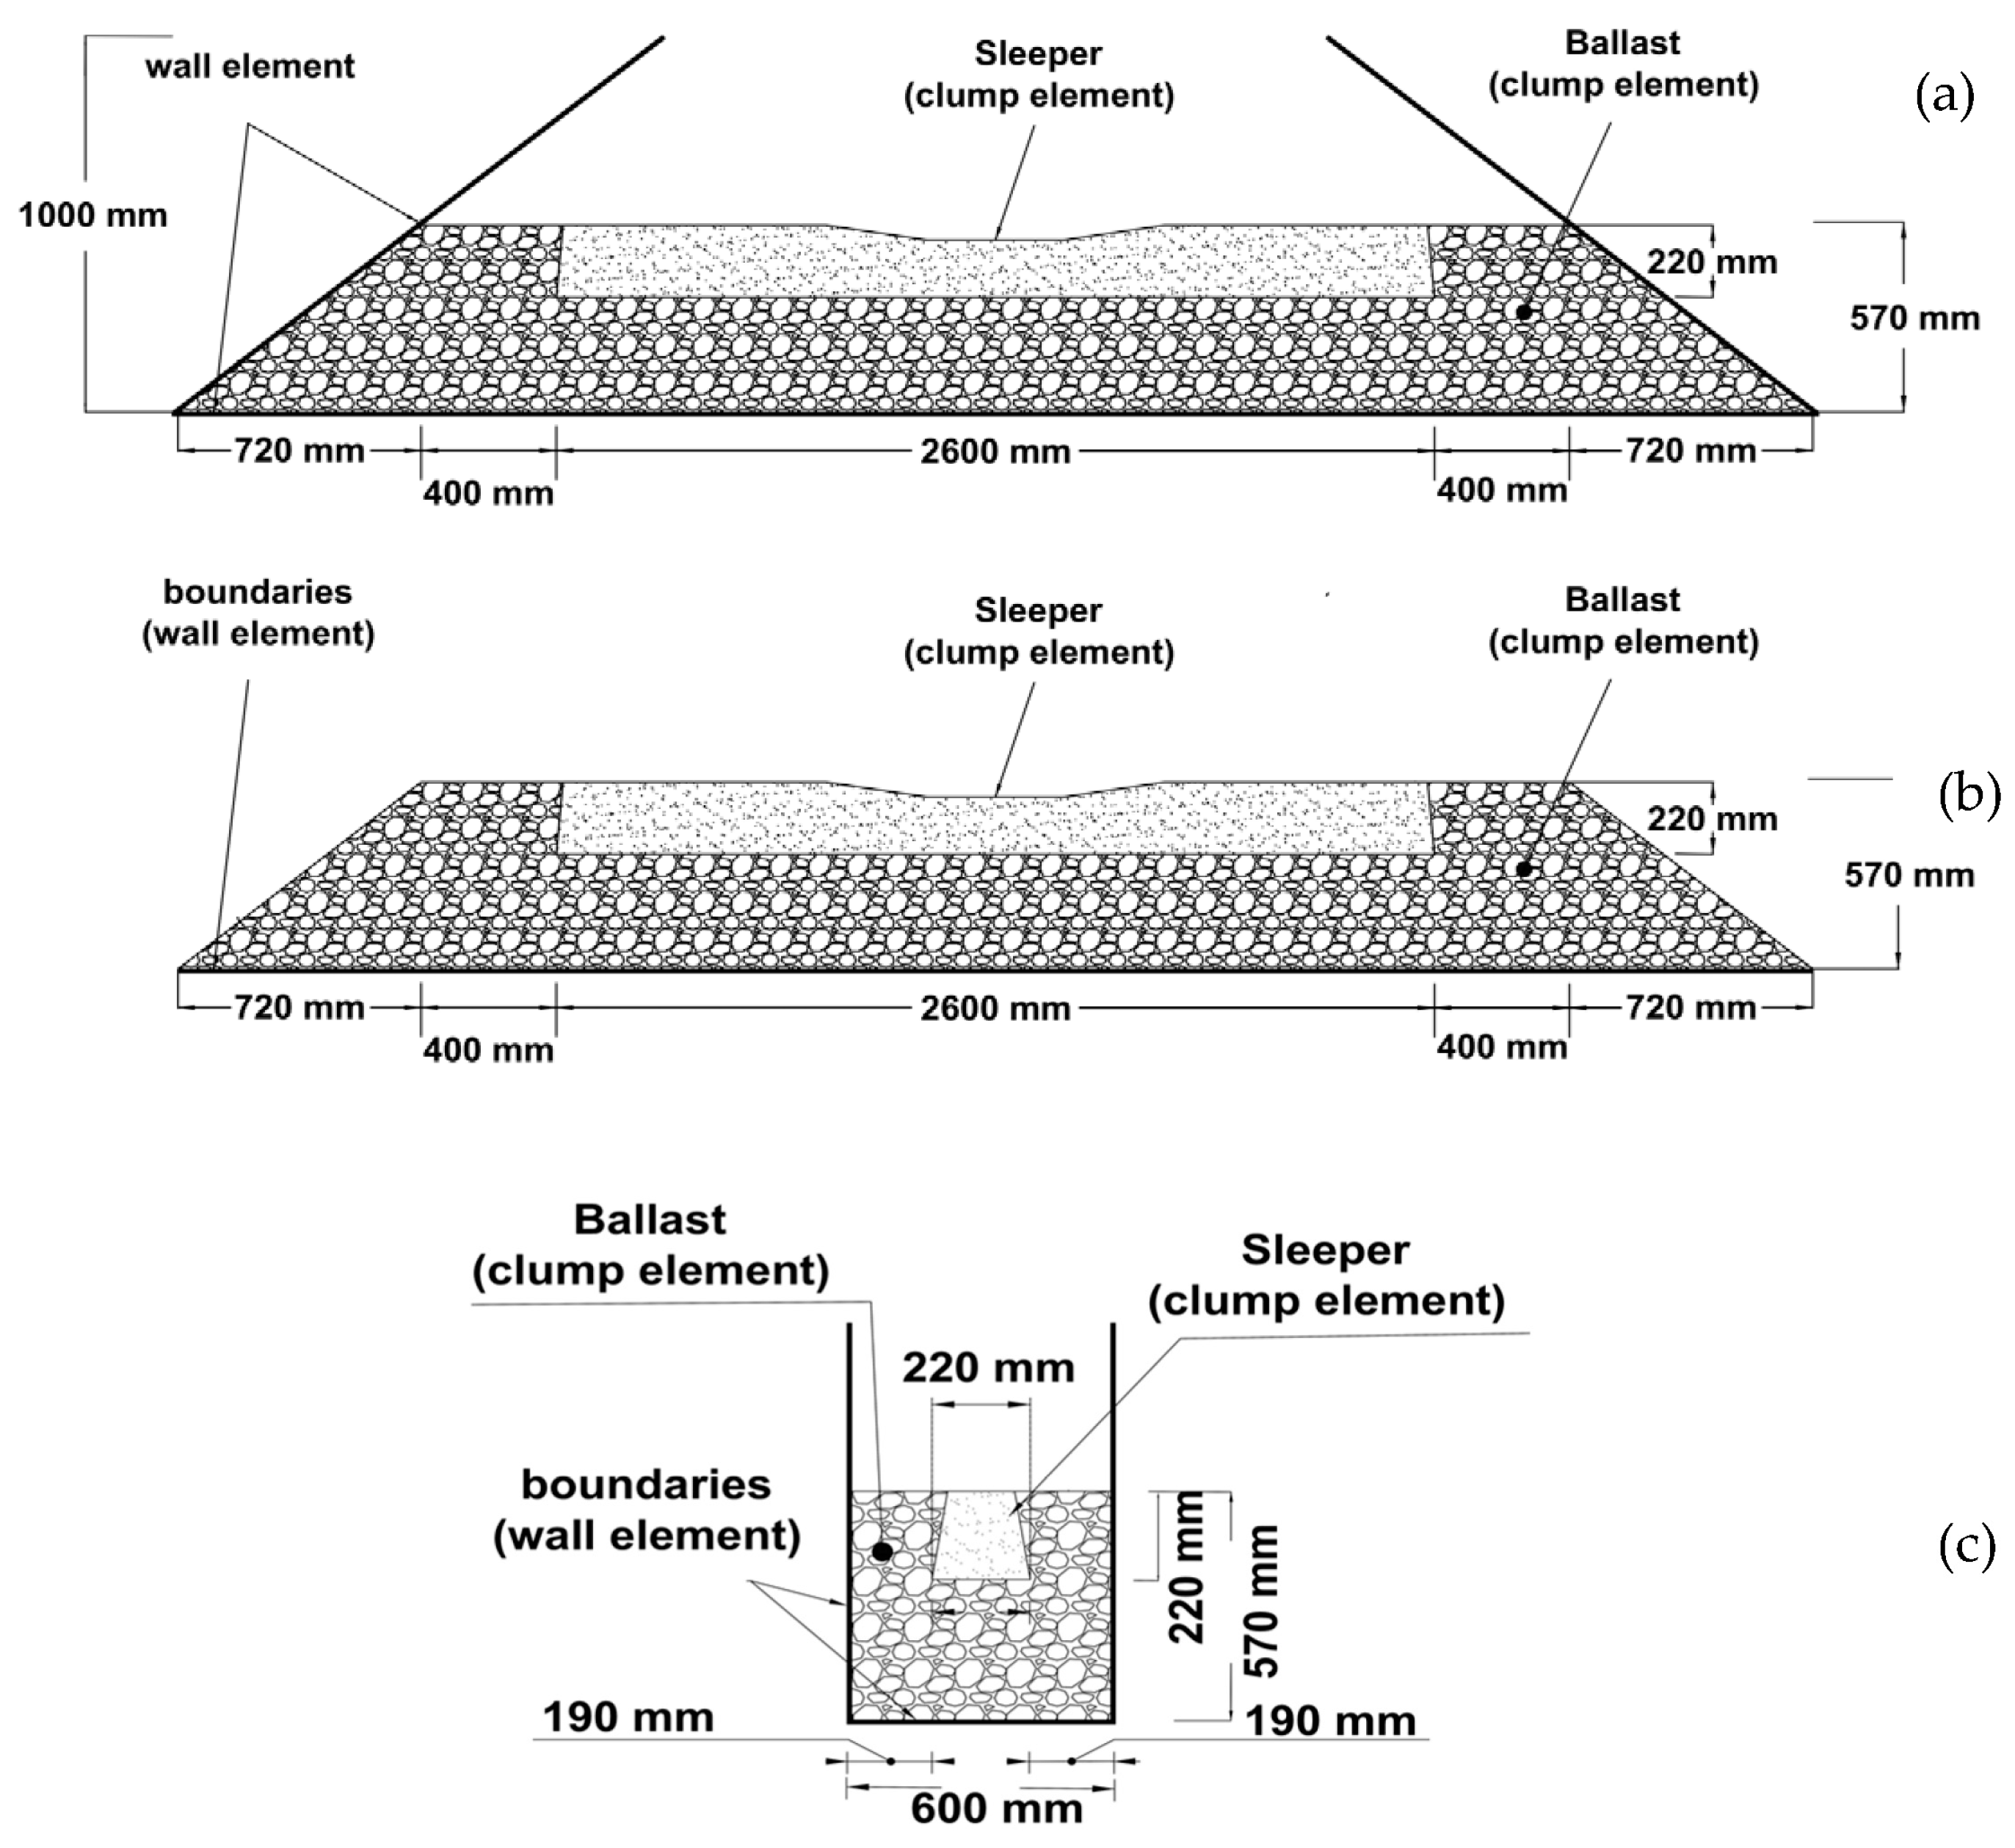
DEM is a numerical solution employed to explain how discontinuous structures behave mechanically. The DEM was created for the study of rock mechanic issues using deformable polygonal-shaped pieces and then utilized in soils, according to Peter Cundall [11]. Itasca’s UDEC (universal distinct element code) and 3DEC (three-dimensional distinct element code) tools were created because of this. PFC (particle flow code) is a polished version of the DEM because it significantly improves contact recognition between elements for quicker model solutions by using rigid disks (PFC2D) or spherical particles (PFC3D) [12].
In this section, the procedure of DEM modeling of the STPT test is described. Since FEM has been the foundation for most numerical models of STPT to date, it is essential to investigate the STPT responses in a discrete environment that can model individual particles and describe inter-particle contacts. Based on the testing results obtained by Khatibi et al., contact model components are chosen in this study [8].
The model’s geometry and its border conditions are first explained in the sections that follow. The details of the sleeper and ballast components are then discussed, along with the associated characteristics. Additionally, in the following, the contact model is discussed. The development of a model for gradual lateral loading is finally given step by step.

2.1. Model Geometry

The basic longitudinal and lateral arrangements of the numerical model are shown in Figure 1. The PFC3D environment’s simulation area is a trapezoidal cube with the following dimensions: 4.48 m in base length, 1.954 m in top length, 0.6 m wide, and 1 m high. The 4.48 m length of the model is sufficient to generate a track model with a ballast shoulder 40 cm in width. The model width corresponds to test track sleeper spacing. To produce the required amount of non-overlapping ballast particles, the domain height must be sufficient.
Following the ballast granules’ self-weight settling, the extra ballast particle is deleted to achieve the first 350 mm layer. Two walls that are in the direction of lateral force were removed after the ballast embankment was shaped in accordance with Figure 1b and to be the closest real situation. Rigid wall components simulate the model’s side and base boundaries. The wall element cannot accurately represent interactions between ballast and subgrade. To solve this problem, a suitable friction angle has been assigned for interaction between ballast–ballast and ballast–subgrade. The track layout is depicted in Figure 1 by the model measurements.

2.2. Simulation of Sleeper

The B70 sleeper was selected to be simulated since Khatibi et al. [8] estimated the lateral resistance of this sleeper in the experimental test. The standard concrete sleeper type B70 is shown in Figure 2.
In the PFC3D environment, the sleeper representative volume shown in Figure 3a is known as the STL (standard triangle language) file, and because it is based on the clump logic of spherical particles, the sleeper was formed as a clump element. The clump sleeper element created from 2888 pebbles is shown in Figure 3b.
The capability of force assignment is one advantage of creating the sleeper as a clump element instead of using wall limits. If wall elements were utilized, they had to be pushed in the direction of the ballast surface in order to provide sleeper self-weight equivalent stress. Finding the proper level of stress and producing a uniform stress distribution under the sleeper’s face using this method required a process of trial and error, which demonstrated how difficult the task was. It should be emphasized that the STPT should be carried out by giving the sleeper walls a horizontal velocity while recording the wall response forces as the sleeper is moved gradually. For a clump element, the sleeper weight may be applied simply by assigning density, and for STPT simulation, the lateral force can be applied. Maximum inter-pebble angular smoothness was employed to reduce the amount of roughness on the surface of the sleeper clump.
Taghavi [13] formed this parameter’s idea. The roughness at the interface of two disks or spheres is defined by this angle, as shown in Figure 4. A rough surface will be produced when pebbles of a clump particle are stacked at an ϕ angle of less than 180 ° , which will enhance the inter-particle shear strength. However, when ϕ = 180 ° , the pebble arrangement will provide a flat surface, and the inter-particle interaction is a function of the particle form and contact model parameters. For the formation of the sleeping clump in this study, ϕ = 180 ° , which symbolizes an absolutely smooth contact, was chosen.
Additionally, since any optimization process requires certain bounds, in this study, it was assumed that the base form would display the minimum dimensions, as illustrated in Figure 5. Additionally, as there is a 60 cm gap between each sleeper, a 60 cm maximum width was assumed.
According to the limitations mentioned, some shapes of sleepers have been proposed based on the B70 sleeper’s shape, as shown in Figure 6. To achieve these shapes, the angle of α was increased, as seen in Figure 6 for the B70-α sleeper. Additionally, due to the 60cm gap between the two sleepers, the maximum α is 14 ° . It should be mentioned that α = 4 ° creates the shape of B70, so this shape has not been simulated again. As a result, 14 proposed shapes of sleeper were created. These proposal shapes were named B70-0, B70-1, B70-2, B70-3, B70-5, B70-6, B70-7, B70-8, B70-9, B70-10, B70-11, B70-12, B70-13, and B70-14.
In addition, Figure 7 shows some sleepers’ clump particles created in PFC as sleeper elements for proposal shapes.

2.3. Simulation of Ballast Particles

One of the DEM modeling techniques for ballast particulates is to create spheres [14,15]. The use of a sphere lowers processing time while also simplifying computations. However, due to the spheres’ low rolling resistance, they will distort more than actual ballast granules and have less shear strength. The RR-linear (rolling resistance linear) contact model (as used by Chen et al.) can be used to cover this gap [16,17].
The size distribution curve in Figure 8 with the three distinct sizes of 2.5, 3/2, and 3/4 inches, which correspond to 10%, 65%, and 25% of the total samples, respectively, served as the template for the size distribution of particles in the model.

2.4. Contact Model

To compute contact forces at both inter-particle and wall–particle interactions, a linear elastic contact model is used. In terms of accuracy and calculation time, this contact model is sufficient for an analysis involving significant deformations and monotonic loadings [12]. The linear elastic contact model can be represented using a variety of formulas. Mindlin and Deresiewicz’s version [18] was used here; this has been used in many DEM models [19,20,21,22]. Normal and shear contact stiffness, as well as friction rate, are important factors to consider when developing an elastic linear contact model [20].
K n = G s 3 ( 1 υ ) 8 R e δ n
K s = 2 [ 3 G s 2 1 υ F n R e ] 1 / 3 2 υ
where K n and K s denote the normal and shear stiffnesses, G s the shear modulus, and υ the Poisson’s ratio. R e indicates the particle radius and is defined as follows in the instance of two contacting particles A and B, with radiuses of R A and R B :
R e = 2 R A R B R A + R B
The normal contact force, F n , is determined by the following equation:
F n = δ n K n
Three distinct particle sizes were discovered in the ballast layer, according to the size distribution curve. This means that three distinct pairs of interacting particles are likely. As a result, R e is not a unique quantity. The size distribution curve of the ballast layer showed three distinct particle sizes with radii of 31.7, 19.05, and 9.5 mm in the ballast layer. Therefore, R e is not a unique number, and there are three for all possible twin contact. Equation (3) was used to determine the quantities of R e , which were 23.8, 14.4, and 12.7 mm. The averaged R e = 17 mm was determined by using the weighted average and percentage of granular measurements, which are 10, 65, and 25% for radii of 31.7, 19.05, and 9.5 mm, respectively.
δ n denotes particle overlaps that can be fairly assumed to be less than 5% of the overlapping particles’ average radius [10]. Considering the accounted quantity of R e , the amount of particle overlap is δ n = 0.85 mm.
According to Equations (1) and (2), the quantities of K n and K s are determined by the mechanical properties of the ballast primary rock material G s and υ . The results of uniaxial compression tests performed by Khatibi et al. (2017) according to ISRM (1979)-EUR4 and the core cylindrical samples with a diameter of 54 mm and a height to diameter ratio of 2.5 were used, the Poisson’s ratio was found to be 0.2, and the shear elastic modulus was determined as 8.9 GPa [8]. The normal and shear contact stiffness was computed as K n = 0.4 × 10 8 Pa and K s = 0.5 × 10 8 Pa after substituting all the factors.
The findings of the direct shear tests conducted by Fathali et al. (2016) in accordance with ASTM D3080 in a shear box of 300 × 300 × 200 mm were utilized in the study to determine the coefficient of friction. The friction angle was calculated to be 43.6 ° , which roughly corresponds to an interparticle friction coefficient of 0.9 [23]. The contact model parameters in this study were well-congruent with those in previous research [24,25,26].
In order to show the rigid situation, it is assumed that the wall-particle normal and shear contact stiffness is about twice as high as the ballast stiffness. The friction coefficient of the base wall boundary was supposed to be 0.57 based on Khatibi et al.’s (2017) assumption that the friction angle was equal to 30° [8]. To simulate the continuance of the ballast layer over the track length, the friction coefficient of the side wall borders was considered the same as the inter-particle ballast friction, at 0.9.
Table 1 summarizes all the mechanical requirements and particle sizes employed in the numerical model, and the experimental test [8] that the simulated model was compared with.

2.5. Simulation of the STPT Process

The step-by-step procedure for STPT simulation in the PFC3D environment is described in this part. At first, the problem domain and wall boundaries were specified, and the wall contact properties were given. In the second step, the ballast materials were generated according to the size distribution curve Figure 8 by using the keyword of clump distribution in PFC. The inter-particle contact model was assigned, and gravity was activated to cause particles to settle under their own weight. Primarily, as Figure 9c shows, an extra number of ballasts was generated. Excess clumps were also removed, as shown in Figure 9d, to form a 350 mm layer. The third step was to create concrete sleepers. In this step, the sleeper density was assigned, and the equilibrium analysis continued until the vertical settling of the sleeper approached zero. In the fourth step, the shoulder and around the sleeper were created. After settling ballast due to self-weight, additional ballast was removed to create a 570 mm layer. Then, two walls that face the direction of lateral resistance were removed to simulate the actual situation, as seen in Figure 9g. It should be mentioned that before creating the 350 mm and 570 mm layers by removing the extra materials, the weight analysis of this ballast layer was conducted until the number of repetitions did not make a significant difference in the layer height. The model’s creation process is shown in Figure 9. Additionally, Figure 9g depicts the sleeper in the ballast layer, ready to be loaded laterally for STPT modeling. The STPT simulation procedure began with a uniform load of the sleeper at 100 N per iteration.

3. Numerical Simulation and Optimization Algorithm

This section presents validation first, based on the findings of the experiment. Then, to introduce the optimization parameters, the effect of the B70 sleeper’s weight on lateral resistance is shown. Due to the geometrical change in the proposed shapes compared to the B70 traverse, their weight will also change. Therefore, it is feasible to compare the lateral resistance of the suggested shape with the lateral resistance of the B70 sleeper with the same weight by taking the effect of the sleeper’s weight into consideration. In the following, some parameters are proposed to consider lateral resistance, economic factor, and geometric factor. Additionally, a recommended optimization algorithm is offered to choose the best form given parameters. Finally, the results are presented and discussed.

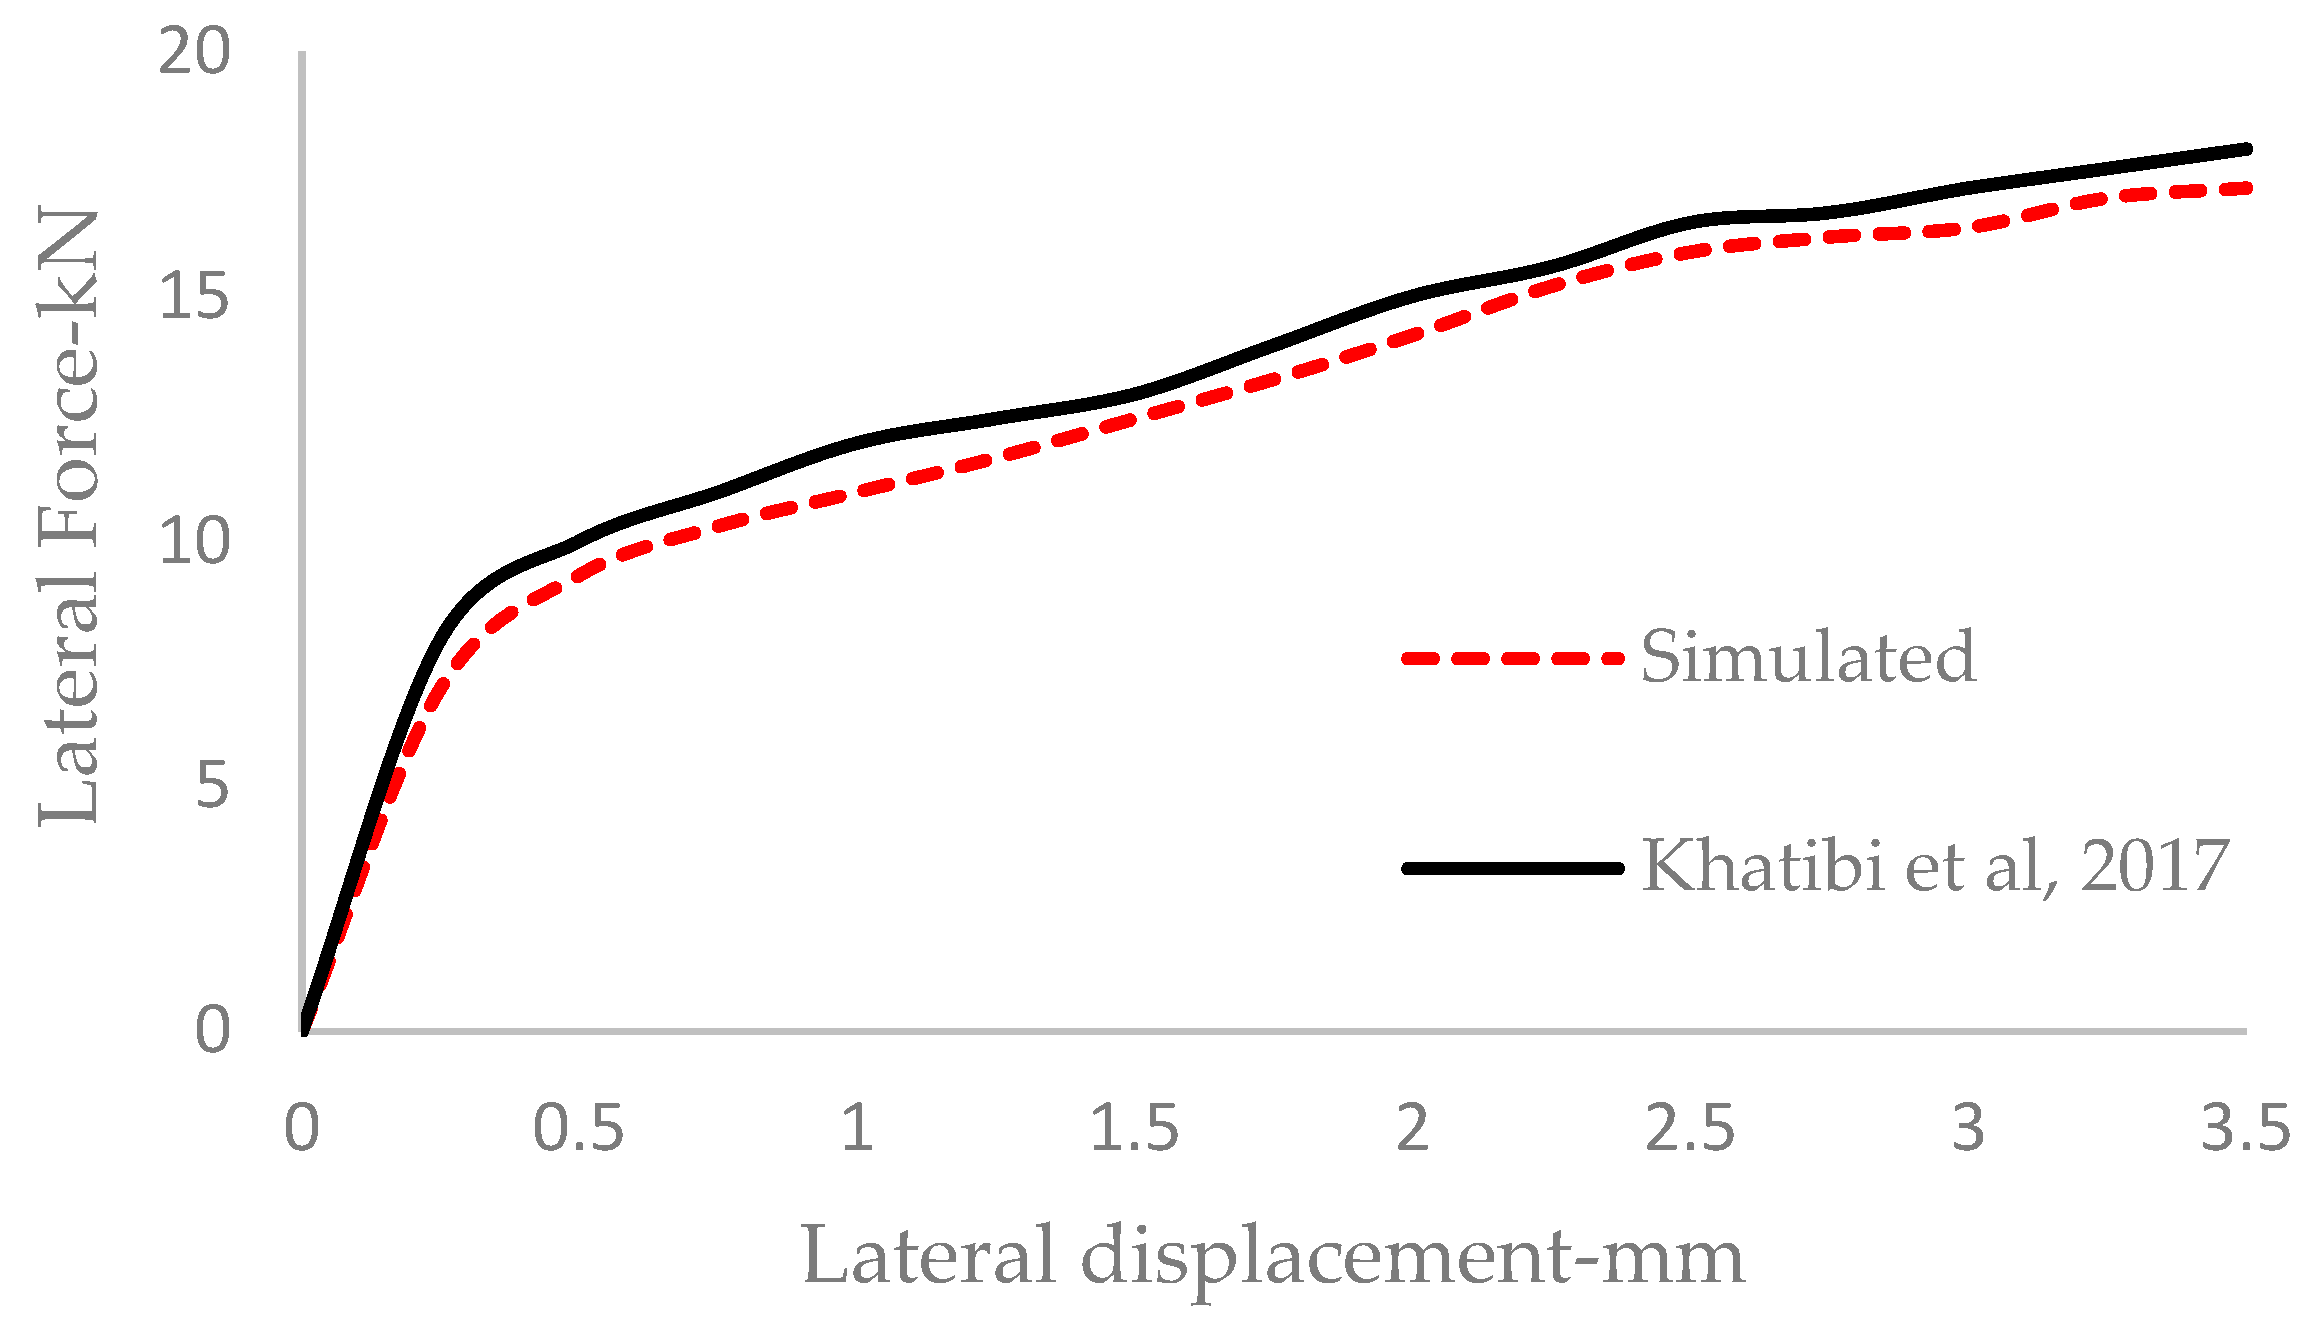
3.1. Validation of DEM Model

The initial stage in creating a 3D DEM model was to compare the results of simulated STPT to those obtained in the field tests conducted by Khatibi et al. [8].
It should be noted that three different STPTs were performed as part of their investigation on a common ballasted test track southwest of Tehran. Results from the DEM simulation are compared with those from the experiments in Figure 10. The load-displacement response from the DEM simulation is shown in this figure, together with the field findings for a ballasted railway track with ballast depth, shoulder width, friction coefficient, and porosity of 35 cm, 40 cm, 0.9, and 0.35, correspondingly. With a maximum difference of 9.2% for lateral force proportional to lateral displacement of 3.5 mm, the curves in the figure show a good match. The difference can be due to variations in-test situations, ballast, and sleeper shapes.

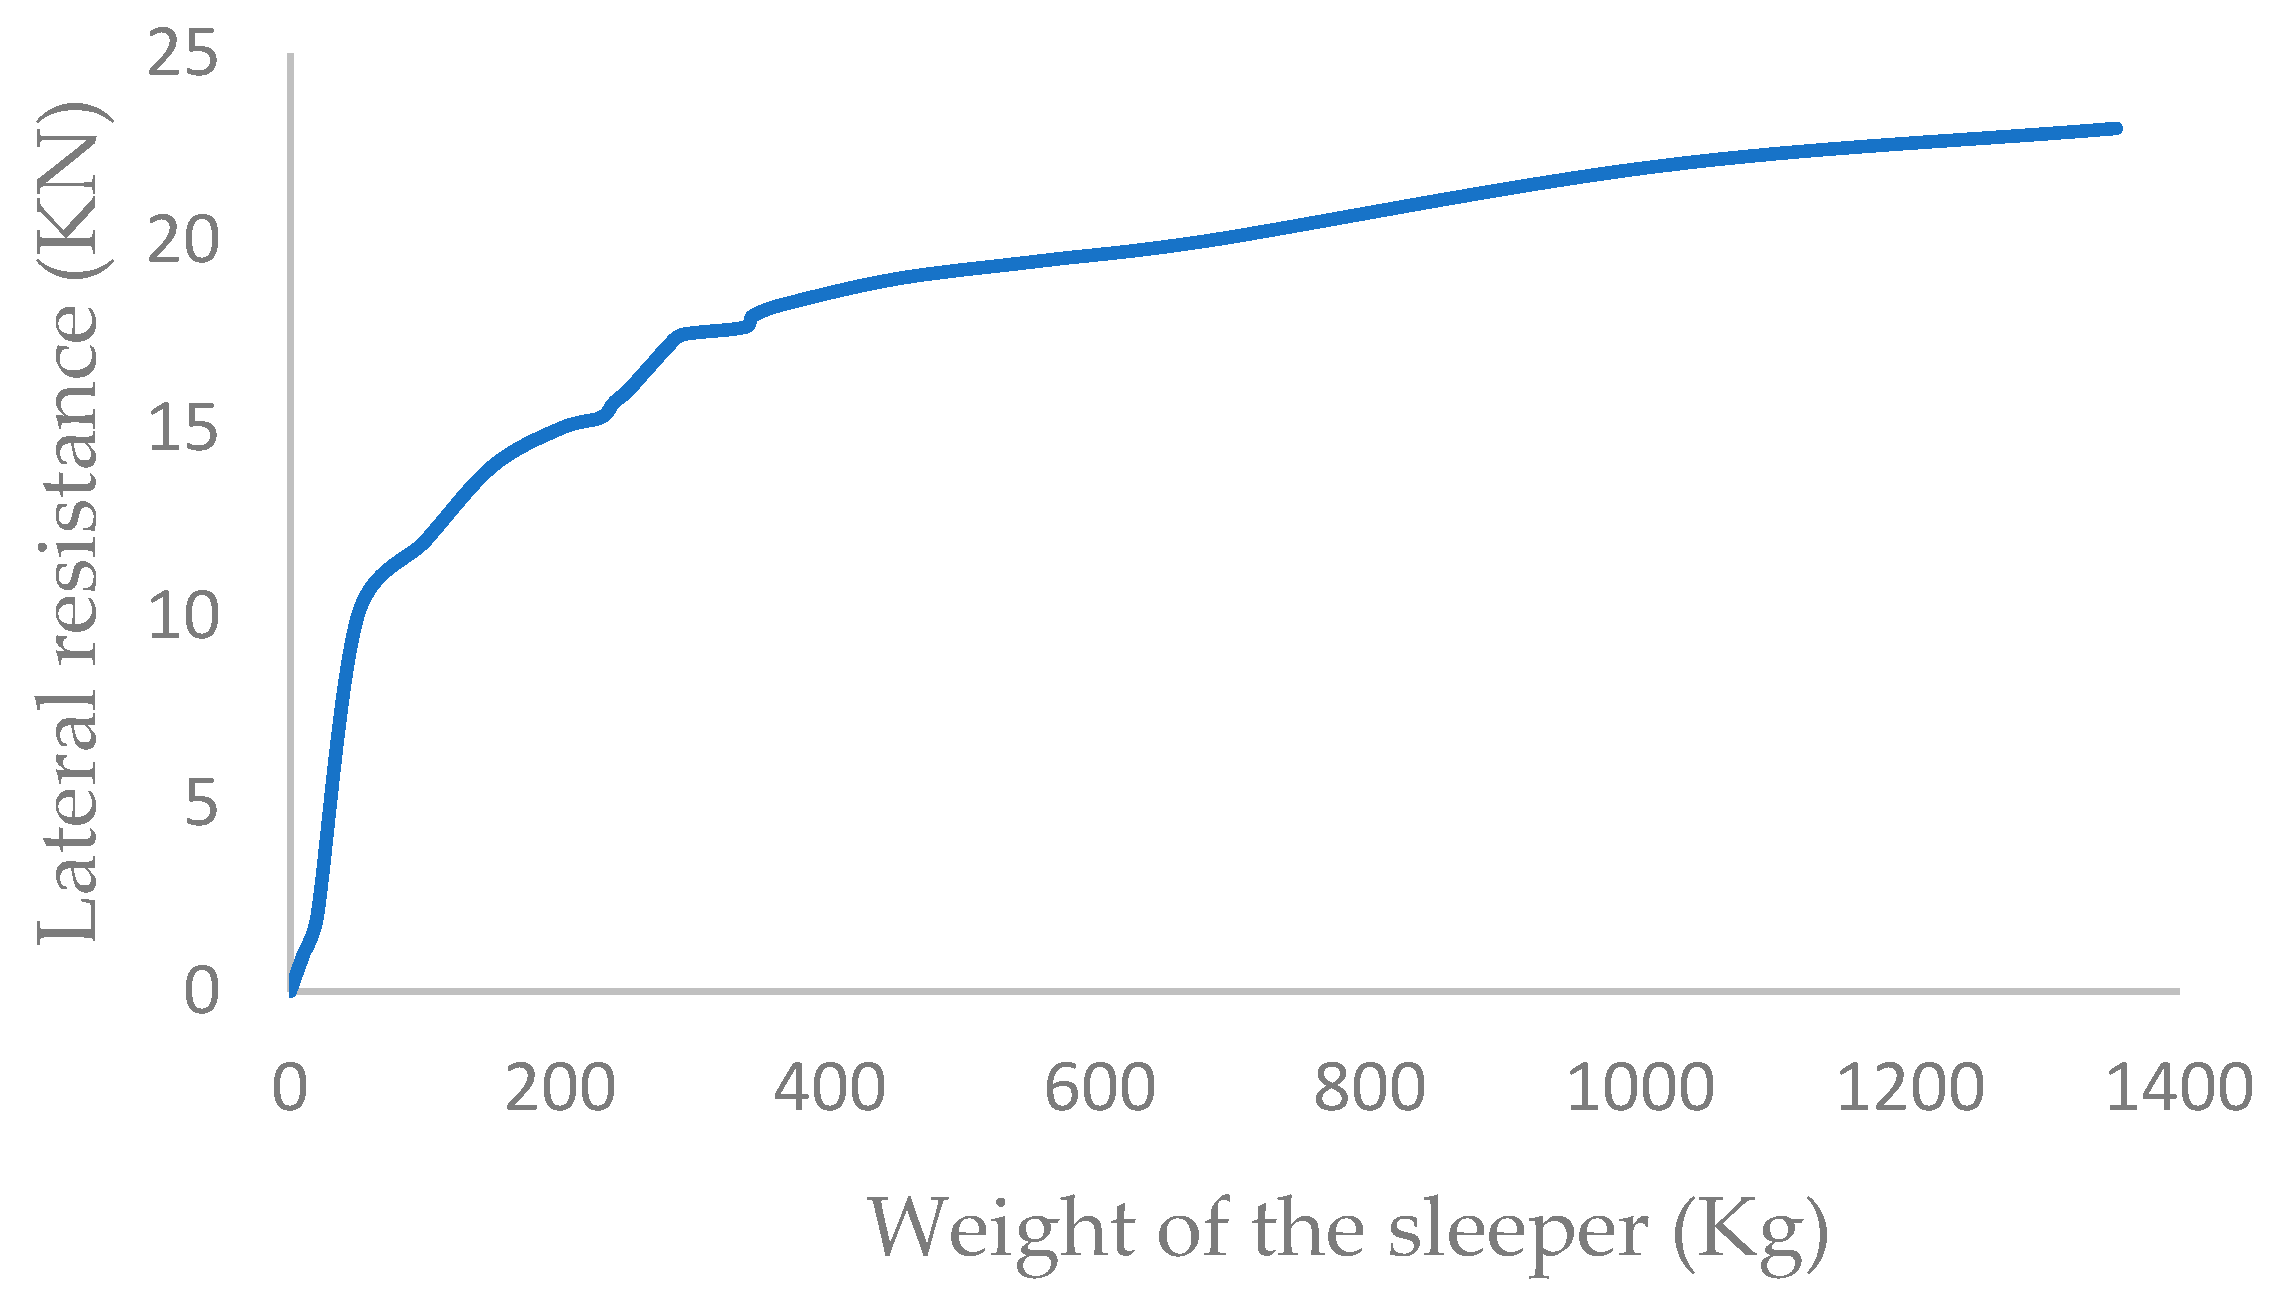
3.2. Effect of the Sleeper’s Weight on Lateral Resistance

The weight of one type of sleeper can vary because, under actual situations, different ratios of water to cement, as well as different types of granular materials from other nations and companies, might be employed in an execution. Therefore, it is essential to look into how the sleeper’s weight affects lateral resistance. To investigate this effect, different densities were assigned to B70 while keeping constant particle size distribution and friction between the sleeper and ballast. The effect of various sleeper weights on lateral resistance is seen in Figure 11. As shown in the figure below, by increasing the weight of the sleeper, lateral resistance rises. However, after 400 kg, the rate of lateral resistance growth decreases. This means that using a sleeper heavier than 400 kg is not economically justified because it does not significantly increase the lateral resistance in ballasted track.

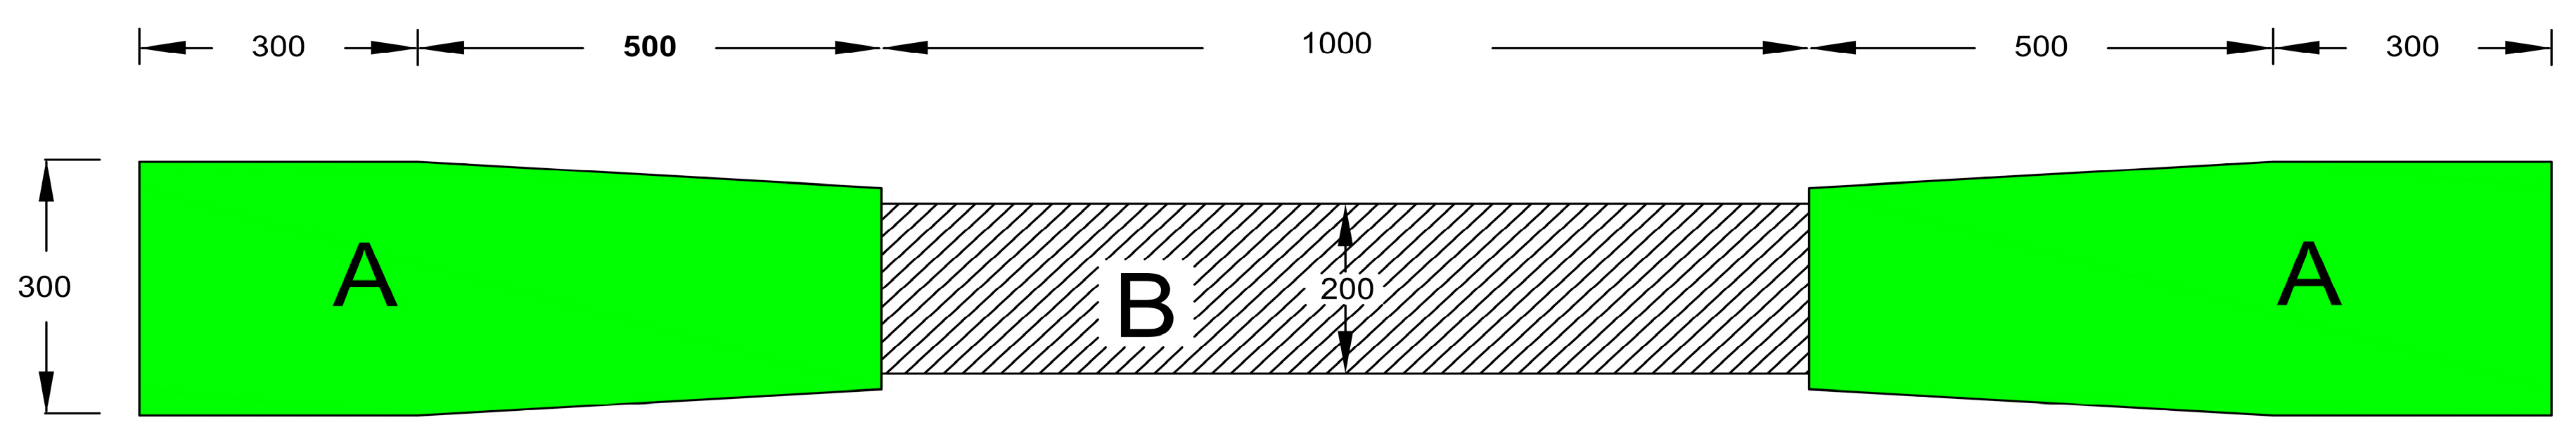
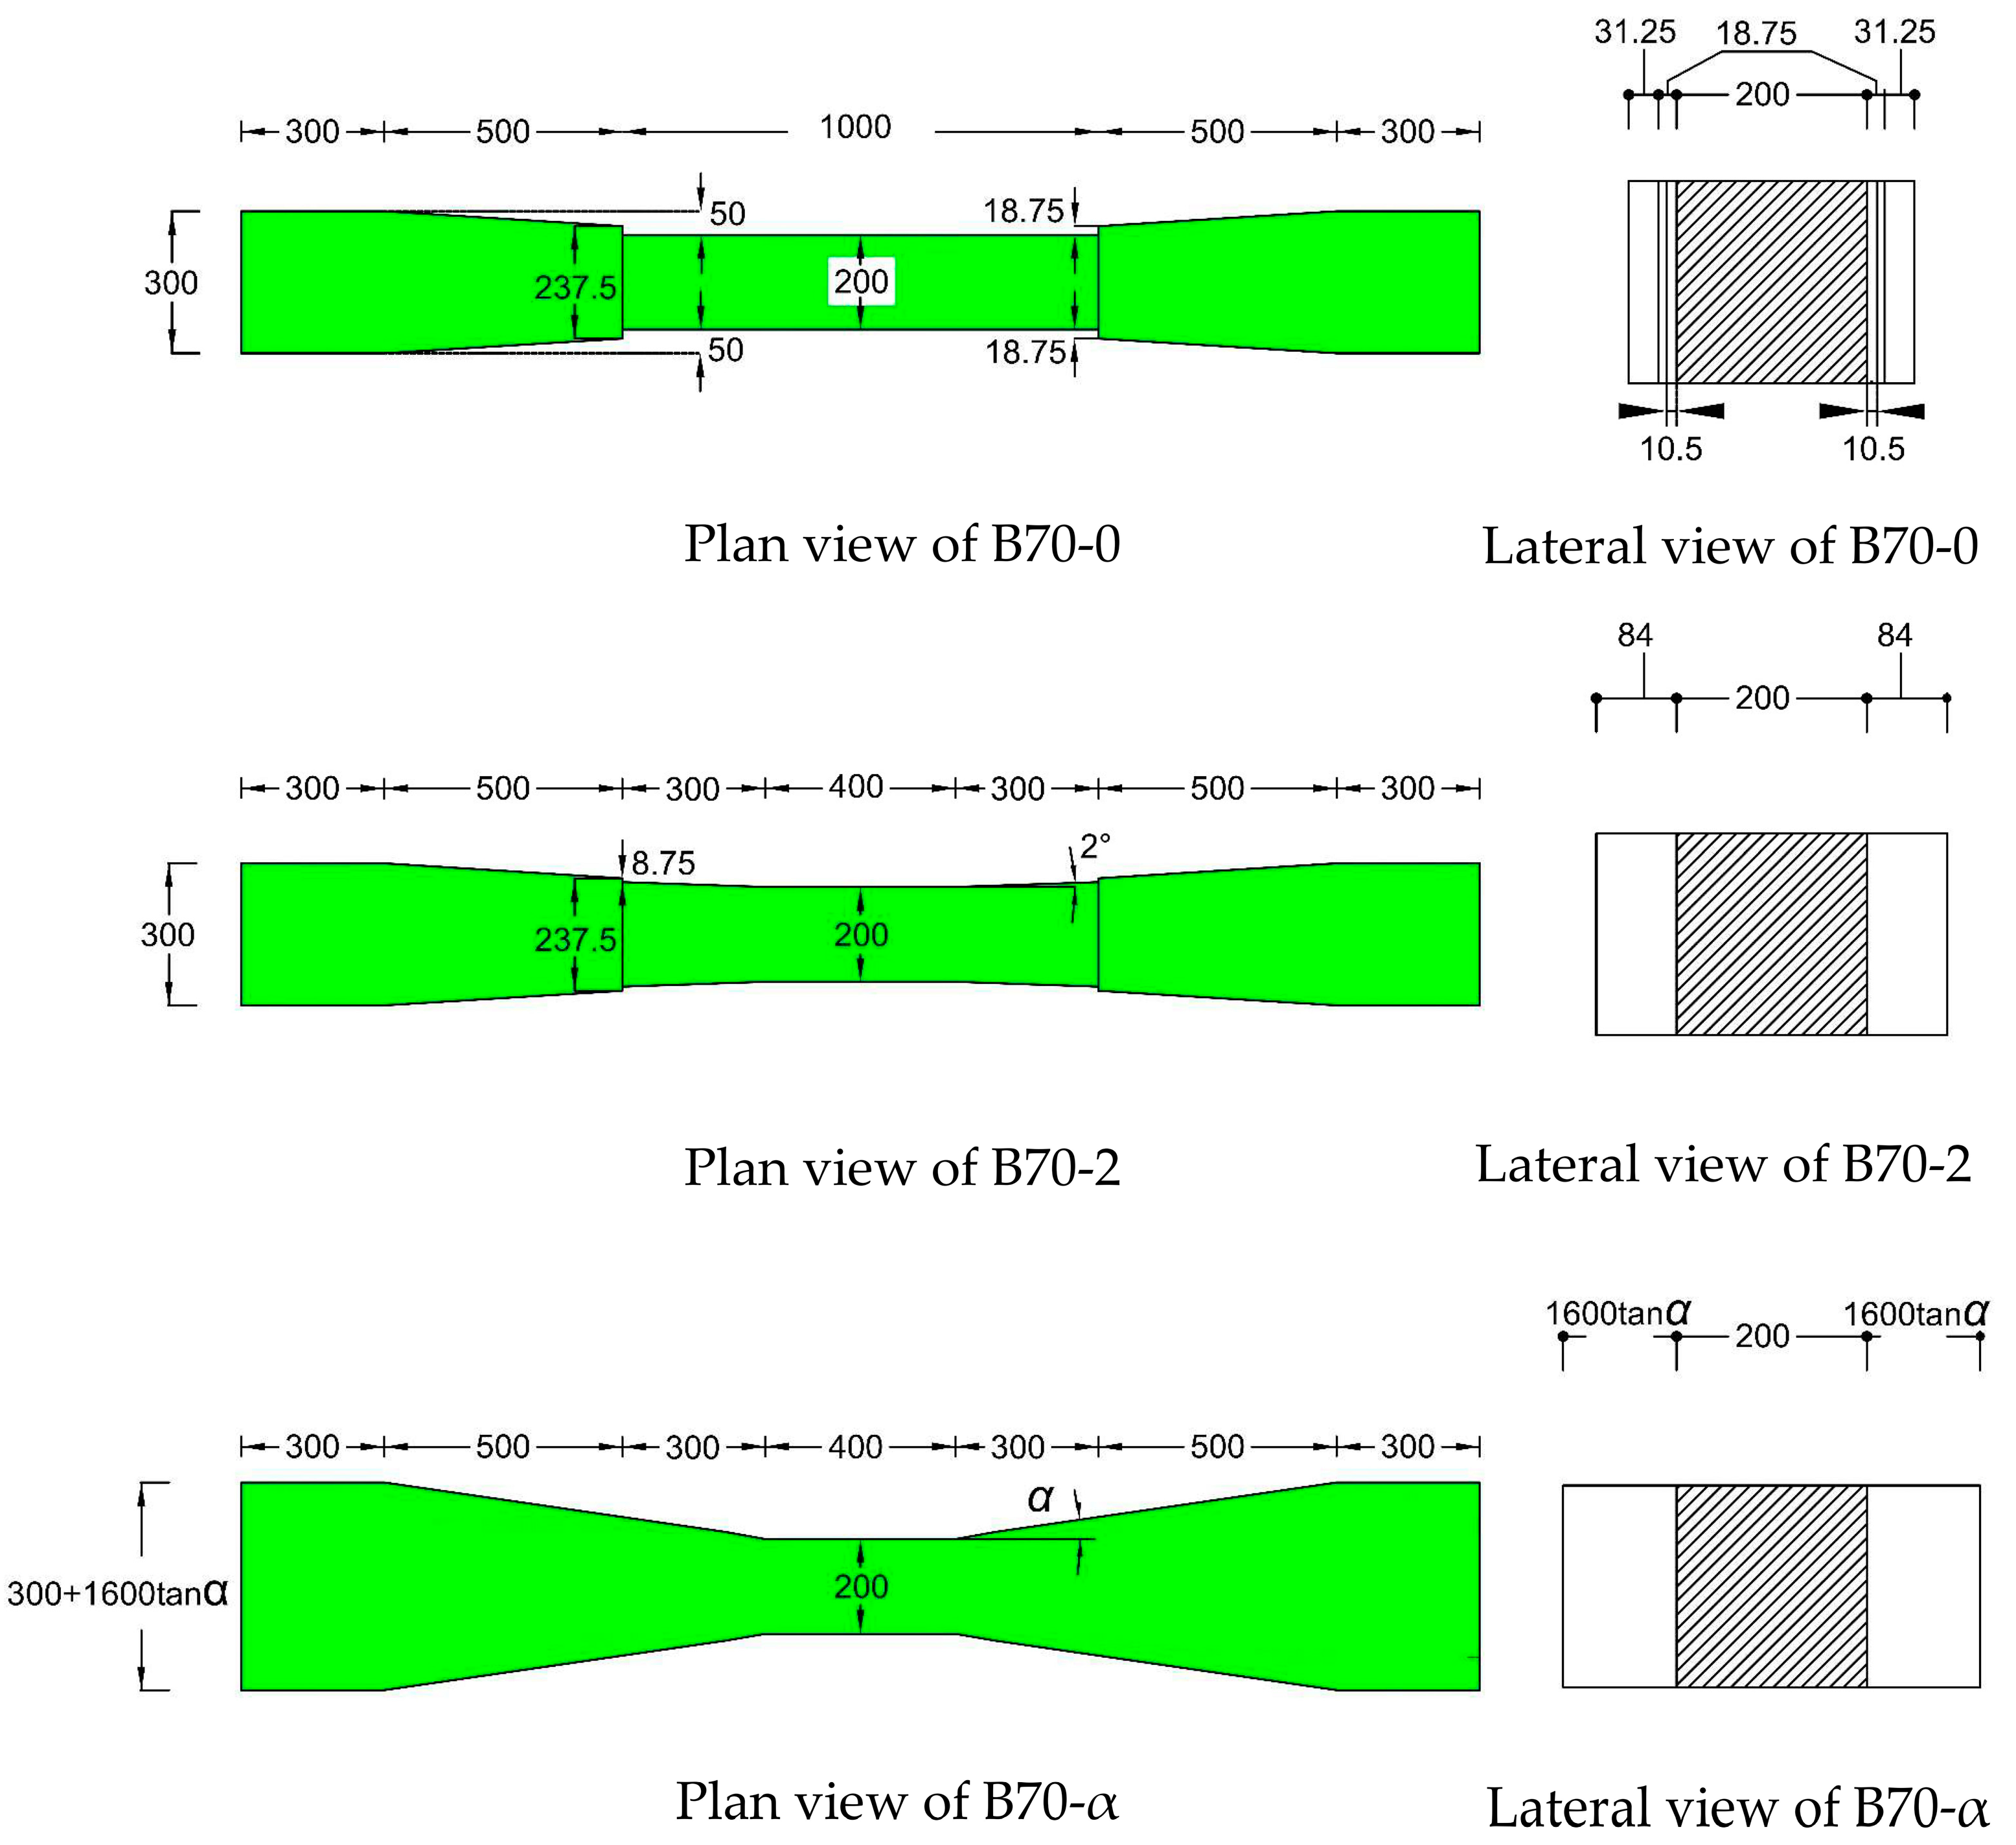
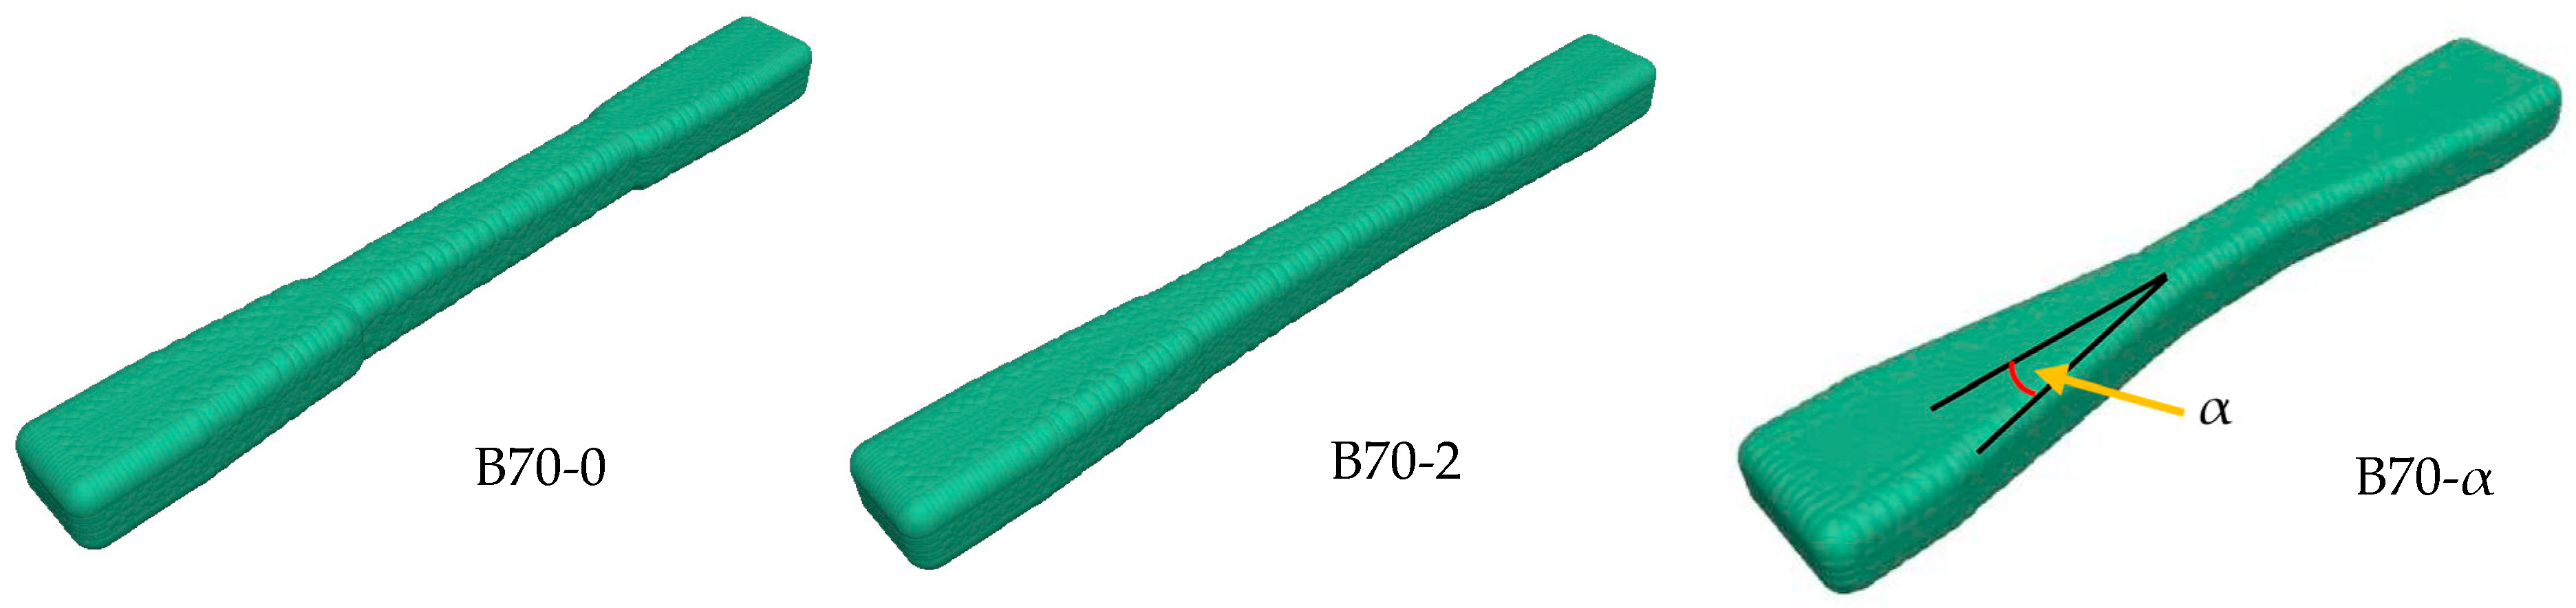
3.3. Parametric Study

To understand the lateral resistance of the sleeper and compare them, three additional parameters are introduced in this part. The first parameter is the lateral resistance factor for 3.5 mm displacement, defined as the area under the lateral force-displacement curve. As illustrated in Figure 12, the first parameter, the lateral resistance factor for 3.5 mm displacement ( L R F 3.5 m m ), is defined as the area below the lateral force-displacement curve.
For considering the economic parameter, the economic factor is presented as the second one. It is described as follows:
E F = L R F 3.5 W
In Equation (5), E F and W are the economic factor and weight of the sleeper, respectively. Additionally, the following factor of geometry’s impact on the sleeper is suggested in order to take into account how the geometry of the sleeper affects lateral resistance:
F G I S = L . R . F 3.5 . W . B 70 α L . R . F 3.5 . W . B 70
This factor considers the effect of geometry changes for the sleeper’s proposal shape to the base shape of B70 on lateral resistance. In Equation (6), F G I S is the factor of geometry’s impact on the sleeper. Additionally, L . R . F 3.5 . W . B 70 α shows the lateral resistance of the B70-α sleeper with 3.5 mm displacement and weight of W . Moreover, L . R . F 3.5 , W . B 70 displays lateral resistance of the B70 sleeper with the weight of W at 3.5 mm displacement. In addition, to compare the three presented factors L R F 3.5 , E F and F G I S , the following factors are suggested:
L R F 3.5 % = L R F 3.5 . B 70 α L R F 3.5 . B 70 L R F 3.5 . B 70 × 100
E F % = E F B 70 α E F B 70 E F B 70 × 100
F G I S % = F G I S B 70 α F G I S B 70 F G I S B 70 × 100
Here, L R F 3.5 % , E F % , and F G I S % are the respective percentages of the lateral resistance factor for 3.5 mm displacement, the economic factor, and the impact of geometry on the sleeper. Additionally, indexes B70-α and B70, which are related to factors of the B70-α and B70 sleeper, respectively, are presented in Equations (7)–(9).

3.4. Optimization Algorithm

An optimal linear method was used to achieve the optimization shape of the sleeper. This was considered by using an optimization approach, as shown in Figure 13. Thus, an optimization program was linked to models simulated by PFC 3D.
In Figure 13 termination condition is as follows:
300   m m b 600   m m
L R F 3.5 . B 70 i % 0 ( 0 i 14 )
E F B 70 i % 0
f o r   W B 70 i W B 70 j i f   L R F 3.5 . B 70 i L R F 3.5 . B 70 j B 70 i   i s   a c c e p t a b l e 0 i 14 , 0 j 14 i f   L R F 3.5 . B 70 i L R F 3.5 . B 70 j B 70 i   i s n t   a c c e p t a b l e
F G I S B 70 i % F G I S B 70 j %
E F B 70 i % E F B 70 j %
In inequality 11, W i , W j And L R are the weight of sleeper i, j, and lateral resistance of the sleeper, respectively. Additionally, in unequal 10, b is the width of the sleeper. In addition, inequalities 11, 12, 13, 14, and 15 contain indices B 70 i and B 70 j , which are connected to factors of the B 70 i and B 70 j sleeper, respectively. By considering these inequalities and using the algorithm mentioned, we can determine the optimization shape. In the following, the results are presented.
Equation (13) demonstrates that if L R F 3.5 . B 70 j is less than L R F 3.5 . B 70 i for each W B 70 i more than W B 70 j , the lateral resistance will decrease with the increase in weight, which is the unsatisfactory shape of B 70 i an economic standpoint. Additionally, it shows that B 70 i can be acceptable if L R F 3.5 . B 70 i is bigger than L R F 3.5 . B 70 j , which means that as the sleeper’s weight increases, so does its lateral resistance.
It should be mentioned that the mechanical requirements of the proposed shapes and particle size of ballast were assumed as the same as in Table 2 and Figure 8, respectively. In addition, for modeling these shapes, we chose ballast depth, shoulder width, friction coefficient, and porosity of 35 cm, 40 cm, 0.9, and 0.35, correspondingly. In fact, the mechanical specifications, particle size distribution, and boundary conditions of the model are not changed for the modeling of proposal shapes and were chosen with the same specifications mentioned for the verified model. This was mentioned in the Table 2 summary of results and illustrated the factors mentioned for proposal shapes of sleepers. The negative amount of EF% shows a decrease in EF of the sleeper’s proposal shape compared to the shape of B70. Therefore, EF of B70-5, B70-6, B70-7, B70-8, B70-9, B70-10, B70-11, B70-12, B70-13, and B70-14 are lower than EF of B70. In other words, as compared to B70, according to inequality 12, these shapes cannot be economically justified. Additionally, the amount of L R F 3.5 % indicates the percentage increase of L R F 3.5 for the proposed shape compared to B70, as seen in Table 2, the highest and lowest values of this factor are for the proposed shapes B70-14 and B70-5, respectively. The quantity of F G I S % also shows how much more F G I S there is for the suggested shape compared to B70. The suggested shapes B70-14 and B70-5 have the largest and lowest values of this factor, respectively. According to inequality 13, with the increase in the sleeper’s weight, the lateral resistance must also increase to be acceptable. As seen in Table 2, although B70-5, B70-6, B70-7, B70-8, B70-9, and B70-10 are heavier than B70-0, their lateral resistance is lower than B70-0′s. All in all, considering inequalities 11 until 15, B70-0 was selected as an optimized shape.

4. Conclusions

The current study is dedicated to investigate some concrete sleeper’s proposal shapes based on the B70 shape under lateral force in ballasted railway tracks to achieve an optimization shape. In order to achieve this, PFC 3D 7.0 software was first used to create a DEM model of an experimental STPT in three dimensions. Then, using experimental data already provided by Khatibi et al., the lateral displacement–lateral resistance response of the DEM model was validated [8]. Then, the lateral force was applied to the verified DEM model to achieve the effect of increasing B70′s weight on lateral resistance. Afterward, based on this validated model, 14 sleeper shapes were proposed by an optimization algorithm connected to PFC 3D, and these shapes were modeled in PFC 3D under lateral force. The following is a summary of the outcomes attained:
  • Regarding lateral resistance displacement, the DEM results exhibit good agreement with experimental data. However, there was a gap in the graph, which is logically connected to the different shapes of the ballast and sleepers, as well as the loading procedure and environmental factors;
  • The effect of the weight of sleeper B70 on lateral resistance was investigated. The findings demonstrated that elevating the sleeper’s weight causes the lateral resistance to rise. However, as shown in Figure 11, the rate of lateral resistance increasing becomes lower for weights higher than 400 kg;
  • Results show that a rise in sleeper weight does not necessarily increase lateral resistance. This can be seen in B70-5, B70-6, B70-7, B70-8, B70-9, and B70-10 in comparison with B70-0. Therefore, these shapes are not suggested as optimization shapes. Furthermore, although B70-11, B70-12, B70-13, and B70-14 sleepers have greater L R F 3.5 in contrast to other shapes, their E F is lower than B70′s. It means that these shapes are not acceptable economically. Additionally, L R F 3.5 of B70-0, B70-1, B70-2, and B70-3 are 31.2%, 23.9%, 18.8%, and 9.5% higher than B70, respectively. Moreover, they weigh 1.8%, 1.07%, 0.71%, and 0.36% lower than the B70 sleeper, respectively. Thus, B70-0 sleepers can be suggested instead of using B70 sleepers;
  • According to the presented algorithm and achieved results, it can be mentioned that this algorithm has the potential to be used for other kinds of sleepers under lateral force in order to find optimized shapes in ballasted tracks.
However, it should be pointed out that this research had certain limitations, such as the assumption that ballast particles were spherical. According to the results, this issue was somewhat mitigated by the sliding resistance, but more precise results would have been obtained by taking into consideration the real shape of the particles. In addition, in this study, some shapes were proposed for editing the shape of the B70 sleeper. In future studies, proposal shapes can be presented for another kind of concrete sleeper.

Author Contributions

Writing—review and editing, M.M.R. and S.H.; data curation, M.M.R. and J.C.; investigation, M.M.R. and J.C.; supervision, validation, M.M.R.; conceptualization, software, methodology, J.C.; formal analysis, visualization, S.H. All authors have read and agreed to the published version of the manuscript.

Funding

This research received no external funding.

Data Availability Statement

The datasets.

Conflicts of Interest

The authors declare that they have no known competing financial interest or personal relationships that could have appeared to influence the work reported in this paper.

References

  1. Profillidis, V. Railway Management and Engineering; Routledge: London, UK, 2017. [Google Scholar]
  2. ASTM C136/C136M-14; Standard Test Method for Sieve Analysis of Fine and Coarse Aggregates. ASTM International: West Conshohocken, PA, USA, 2014.
  3. Zakeri, J.A. Lateral Resistance of Railway Track, Reliability and Safety in Railway. In Reliability and Safety in Railway; InTech: Rijeka, Croatia, 2012. [Google Scholar]
  4. Zakeri, J.A.; Mirfattahi, B.; Fakhari, M. Lateral Resistance of Railway Track with Frictional Sleepers. Proc. Inst. Civ. Eng. Transp. 2012, 165, 151–155. [Google Scholar] [CrossRef]
  5. Guo, Y.; Fu, H.; Qian, Y.; Markine, V.; Jing, G. Effect of Sleeper Bottom Texture on Lateral Resistance with Discrete Element Modelling. Constr. Build. Mater. 2020, 250, 118770. [Google Scholar] [CrossRef]
  6. Miri, A.; Ali Zakeri, J.; Thambiratnam, D.; Chan, T.H.T. Effect of Shape of Concrete Sleepers for Mitigating of Track Buckling. Constr. Build. Mater. 2021, 294, 123568. [Google Scholar] [CrossRef]
  7. Koyama, E.; Ito, K.; Hayano, K.; Momoya, Y. A New Approach for Evaluating Lateral Resistance of Railway Ballast Associated with Extended Sleeper Spacing. Soils Found. 2021, 61, 1565–1580. [Google Scholar] [CrossRef]
  8. Khatibi, F.; Esmaeili, M.; Mohammadzadeh, S. DEM Analysis of Railway Track Lateral Resistance. Soils Found. 2017, 57, 587–602. [Google Scholar] [CrossRef]
  9. Mansouri, P.; Zakeri, J.A.; Esmaeili, M.; Ghahremani, S. Discrete Element Method Analysis of Lateral Resistance of Different Sleepers under Different Support Conditions. Constr. Build. Mater. 2022, 327, 126915. [Google Scholar] [CrossRef]
  10. Chalabii, J.; Movahedi Rad, M.; Hadizadeh Raisi, E.; Esfandiari Mehni, R. Effect of Sleeper-Ballast Particle Contact on Lateral Resistance of Concrete Sleepers in Ballasted Railway Tracks. Materials 2022, 15, 7508. [Google Scholar] [CrossRef]
  11. Cundall, P.A.; Strack, O.D.L. A Discrete Numerical Model for Granular Assemblies. Géotechnique 1979, 29, 47–65. [Google Scholar] [CrossRef]
  12. CGI Itasca. PFC3D (Particle Flow Code in Three Dimensions); CGI Itasca: Grand Rapids, MN, USA, 2021. [Google Scholar]
  13. Taghavi, R. Automatic Clump Generation Based on Mid-Surface. In Proceedings of the 2nd International FLAC/DEM Symposium, Melbourne, Australia, 14–16 February 2011. [Google Scholar]
  14. Irazábal, J.; Salazar, F.; Oñate, E. Numerical Modelling of Granular Materials with Spherical Discrete Particles and the Bounded Rolling Friction Model. Application to Railway Ballast. Comput. Geotech. 2017, 85, 220–229. [Google Scholar] [CrossRef]
  15. Jing, G.; Aela, P.; Fu, H. The Contribution of Ballast Layer Components to the Lateral Resistance of Ladder Sleeper Track. Constr. Build. Mater. 2019, 202, 796–805. [Google Scholar] [CrossRef]
  16. Chen, C.; McDowell, G.R.; Thom, N.H. Discrete Element Modelling of Cyclic Loads of Geogrid-Reinforced Ballast under Confined and Unconfined Conditions. Geotext. Geomembr. 2012, 35, 76–86. [Google Scholar] [CrossRef]
  17. Benmebarek, M.A.; Movahedi Rad, M. Effect of Rolling Resistance Model Parameters on 3D DEM Modeling of Coarse Sand Direct Shear Test. Materials 2023, 16, 2077. [Google Scholar] [CrossRef]
  18. Mindlin, R.D.; Deresiewicz, H. Elastic Spheres in Contact Under Varying Oblique Forces. J. Appl. Mech. 1953, 20, 327–344. [Google Scholar] [CrossRef]
  19. Yimsiri, S.; Soga, K. Dem Analysis of Soil Fabric Effects on Behaviour of Sand. Geotechnique 2010, 60, 483–495. [Google Scholar] [CrossRef]
  20. Lin, X.; Ng, T.T. A Three-Dimensional Discrete Element Model Using Arrays of Ellipsoids. Geotechnique 1997, 47, 319–329. [Google Scholar] [CrossRef]
  21. Chen, Y.C.; Hung, H.Y. Evolution of Shear Modulus and Fabric during Shear Deformation. Soils Found. 1991, 31, 148–160. [Google Scholar] [CrossRef] [Green Version]
  22. Sitharam, T.G.; Vinod, J.S.; Ravishankar, B.V. Evaluation of Undrained Response from Drained Triaxial Shear Tests: DEM Simulations and Experiments. Geotechnique 2008, 58, 605–608. [Google Scholar] [CrossRef] [Green Version]
  23. Fathali, M.; Nejad, F.M.; Esmaeili, M. Influence of Tire-Derived Aggregates on the Properties of Railway Ballast Material. J. Mater. Civ. Eng. 2017, 29, 04016177. [Google Scholar] [CrossRef]
  24. Laryea, S.; Safari Baghsorkhi, M.; Ferellec, J.F.; McDowell, G.R.; Chen, C. Comparison of Performance of Concrete and Steel Sleepers Using Experimental and Discrete Element Methods. Transp. Geotech. 2014, 1, 225–240. [Google Scholar] [CrossRef]
  25. Tutumluer, E.; Qian, Y.; Hashash, Y.M.A.; Ghaboussi, J.; Davis, D.D. Discrete Element Modelling of Ballasted Track Deformation Behaviour. Int. J. Rail Transp. 2013, 1, 57–73. [Google Scholar] [CrossRef]
  26. Indraratna, B.; Ngo, N.T.; Rujikiatkamjorn, C.; Vinod, J.S. Behavior of Fresh and Fouled Railway Ballast Subjected to Direct Shear Testing: Discrete Element Simulation. Int. J. Geomech. 2014, 14, 34–44. [Google Scholar] [CrossRef] [Green Version]
Figure 1. Schematic of the model (a) cross-section model before deleting the walls in the direction of lateral force, (b) cross-section model after deleting the walls in the direction of lateral force, and (c) longitudinal section.
Buildings 13 01574 g001
Figure 2. Dimensions of concrete sleeper type B70 in millimeters.
Buildings 13 01574 g002
Figure 3. The concrete sleeper (a) 3D sketch of sleeper B70 as an STL file and (b) clump particle created in PFC as sleeper element.
Buildings 13 01574 g003
Figure 4. The conception of an angular measure of smoothness [13].
Buildings 13 01574 g004
Figure 5. The region between A and B, the sleeper’s smallest dimension in millimeters, indicates the smallest area.
Buildings 13 01574 g005
Figure 6. Dimensions of some proposal shapes for concrete sleeper based on type B70 in millimeters.
Buildings 13 01574 g006
Figure 7. Some clump particles created in PFC as sleeper elements.
Buildings 13 01574 g007
Figure 8. Ballast size distribution curve for simulation.
Buildings 13 01574 g008
Figure 9. The process of discrete element modeling for STPT simulation.
Buildings 13 01574 g009
Figure 10. Comparison of the lateral force-displacement curve between simulated and experimental data [8].
Buildings 13 01574 g010
Figure 11. Effect of the sleeper’s weight on lateral resistance.
Buildings 13 01574 g011
Figure 12. The lateral resistance factor for 3.5 mm displacement.
Buildings 13 01574 g012
Figure 13. Optimization problem process.
Buildings 13 01574 g013
Table 1. Mechanical requirements and particle sizes used in DEM simulation in comparison with experimental [8] parameters.
Particle and Contact ParameterSymbolUnitValue in SimulationExperimental Value [8]
Shear elastic modulus G P a -- 8.9 × 10 9
Poisson’s ratio of ballast υ ---- 0.2
Inter-particle normal stiffness K n P a 0.4 × 10 8 --
Inter-particle shear stiffness K s P a 0.5 × 10 8 --
Ballast particle density γ b K g / m 3 2600 2600
Sleeper clump density γ s K g / m 3 2560 2560
Inter-particle coefficient of friction F I -- 0.9 0.9
Wall normal and shear stiffness K s , K n P a 1 × 10 8 --
Side wall friction coefficient f w s --0.9--
Base wall friction coefficient (subgrade) f w b -- 0.57 0.57
Ballast size distribution ----AREMA NO.24AREMA NO.24
Table 2. Achieved parameters for proposal shapes of sleepers under lateral force.
Sleeper’s NameAngle of α (Degree)Weight of the Sleeper (Kg) L R F 3.5 (KN.mm) E . F (KN.mm/Kg) F G I S L R F 3.5 % E . F % F G I S %
B70-0027559.50.2161.335831.233.533.6
B70-1127756.20.2031.257623.925.525.8
B70-2227853.90.1931.202018.819.720.2
B70-3327949.70.1781.10119.59.810.1
B70428045.40.16210.00.00.0
B70-5531048.40.1561.05366.7−3.55.4
B70-6633151.50.15561.105913.5−3.910.6
B70-7735253.80.1531.128018.5−5.712.8
B70-8837355.90.14981.145223.2−7.614.5
B70-9939456.30.14291.145324.2−11.814.5
B70-101038457.50.1501.159626.7−7.316.0
B70-111143762.80.1431.252638.4−11.425.3
B70-121245967.90.1481.341349.7−8.734.1
B70-131348174.10.1541.458263.4−4.845.8
B70-141450478.40.1561.535772.8−3.953.6
Disclaimer/Publisher’s Note: The statements, opinions and data contained in all publications are solely those of the individual author(s) and contributor(s) and not of MDPI and/or the editor(s). MDPI and/or the editor(s) disclaim responsibility for any injury to people or property resulting from any ideas, methods, instructions or products referred to in the content.

