Article

Seismic Vulnerability Analysis of Long-Span Prestressed Concrete Composite Box Girder Bridge with Corrugated Steel Webs under Construction

1
Anhui Xinlu Construction Group, Co., Ltd., Fuyang 236000, China
2
College of Civil Engineering, Hefei University of Technology, Hefei 230009, China
3
College of Civil Engineering, Anhui Jianzhu University, Hefei 230009, China
*
Author to whom correspondence should be addressed.
Buildings 2023, 13(7), 1598; https://doi.org/10.3390/buildings13071598
Submission received: 30 May 2023 / Revised: 13 June 2023 / Accepted: 19 June 2023 / Published: 24 June 2023
(This article belongs to the Special Issue Recent Research Progress of UHPC in Structural Engineering)

Abstract

:
In order to address the difficulty in determining the seismic damage probability of continuous girder bridges under construction, the seismic vulnerability analysis method of the construction state is proposed in this study. Firstly, taking a long-span prestressed concrete composite box girder bridge with corrugated steel webs (OSW) as an example, the finite element models (FEMs) of dynamic calculation in different phases of cantilever construction are simulated by OpenSEES. Secondly, by selecting reasonable seismic waves and seismic intensity measures, the non-linear time-history analysis is carried out, followed by the demand parameters and damage indexes suitable for the construction state proposed. Finally, the probabilistic seismic demand model (PSDA) of the continuous box girder bridge during the construction stage is constructed by using the “cloud method”, and the seismic vulnerability curves of the piers and temporary bearings are established to evaluate the seismic performance during the construction stage. The results indicate that the damage probability of piers and temporary bearings increases with the progress of construction. The initial formation of the cantilever structure and the sudden change in the size of the construction segmental girder correspond to a high probability of damage, and seismic protection measures should be strengthened during this construction state. Moreover, significantly higher damage probability of the components under construction compared to the completed bridge after it is built.

1. Introduction

The prestressed concrete continuous girder bridge (PCCGB) has the advantages of good overall performance, large structural stiffness, small deformation, and good seismic performance. In addition, the design and construction of such bridges are relatively mature, and the construction quality can be controlled well. Therefore, PCCBB is widely used in highway and railway bridge engineering [1,2,3]. Over the past years, studies on the seismic performance of continuous girder bridges have mostly focused on large-span, new technology continuous girder bridges and the vulnerability under spatial earthquakes. For example, Cao et al. [4] investigated the seismic susceptibility of a multi-span continuous girder bridge considering the slip behavior of steel bars by using the incremental dynamic analysis (IDA) method. Similarly, based on numerical simulation and the IDA method, Yuen et al. [5] studied the effect of prestress loss on the vulnerability of Post-tensioned Precast Concrete Segmental Bridges (PT-PCSB) under different ultimate states. Wang et al. [6] used the peak ground acceleration (PGA) as the ground motion intensity measure (IM) and adopted the linear fitting method of probabilistic seismic demand analysis (PSDA), then the vulnerability curves of bridges under uniform and spatially varying seismic motions were obtained. The results indicated that multi-span continuous girder bridges were significantly affected by spatial changes in seismic motion and were more prone to damage under non-uniform excitations.
However, the above studies mainly focused on the seismic vulnerability of completed bridges. The research on continuous girder bridges under construction mainly stays at the level of structural seismic response analysis [7,8,9], and there are few reports on structural damage assessment during the construction stage. Hsu et al. [10] proposed a construction classification and vulnerability analysis framework for existing buildings from the perspective of earthquake insurance. Both Huang et al. [11] and Li et al. [12] conducted studies on the seismic vulnerability analysis method and calculation process for cast-in-place cantilever continuous girder bridges under construction. Besides, Shi et al. [13] chose an irregular long, span-continuous rigid frame bridge with a high pier as the case, inputted velocity pulse type near fault seismic waves, calculated the seismic vulnerability during the cantilever construction, and compared and analyzed the influence of considering the internal force state on the seismic vulnerability of components. In addition, Li et al. [14] conducted a preliminary exploration of the application of seismic vulnerability of bridges under construction in earthquake insurance. By regression to the probability model of aftershock occurrence based on probabilistic seismic risk analysis, Yang et al. [15] proposed a calculation model of vulnerability during bridge construction and applied it to the damage assessment of a bridge with high piers under construction in mountainous areas. The results showed that the bridge in aftershock areas was prone to cracking and failure during construction. Xiong et al. [16] calculated the probability of damage during earthquakes during the bridge stage, providing strategies for bridges under construction to resist earthquakes. Luo et al. [17] studied the failure probabilities of a prestressed concrete continuous rigid frame bridge under earthquake action by using the IDA method. And the results showed that the failure probability of the pier gradually increased with the increase of earthquake intensity, but the probability of complete damage to the bridge was extremely low. In the face of the risk assessment of the construction process of long-span bridges, Ohashi and Kiyomiya [18] divided the construction of cable-stayed bridges into five stages and calculated the seismic safety of Bridges at each stage. In addition, based on the reliability theory, Wang et al. [19] established the calculation formula of damage exceeding probability, carried out damage calibration on the components of the rotary construction cable-stayed bridge, and obtained the damaged parts of the cable-stayed bridge during the construction.
Actually, there is a structural system transition in the construction stage of continuous girder bridges, such as small and medium-span continuous girder bridges (especially in the case of continuous decks), which will undergo a transition from a simply supported bridge to a continuous bridge. For the long-span continuous girder bridge, the pier will be temporarily consolidated when symmetrical construction is adopted, and there is a stress state similar to that of a large cantilever in the construction process. Therefore, continuous beam bridges in the construction state have significant differences from the completed state in terms of both the dynamic characteristics and seismic resistance of the structure itself. From previous earthquake damage investigation and analysis, the girder was in a cantilever state during the construction process, and the bending moment of the consolidated end caused by the lateral and vertical seismic action increased with the progress of the construction. Additionally, the girder is prone to misalignment, leading to a sharp increase in shear force on the temporary bearing and inducing sliding and detachment. Thus, it is necessary to conduct a seismic vulnerability analysis of bridge structures during the construction process, which is of great significance for understanding the seismic performance of different construction states, identifying the most unfavorable construction stage, and reducing the seismic threat of bridges under construction.
Therefore, this paper takes a long-span continuous girder bridge under construction with the main girder as the prestressed concrete composite box girder with OSW as an example. By establishing a refined FEM, setting reasonable damage states and indicators, determining engineering demand parameters, establishing seismic vulnerability curves of key bridge components at each stage of construction, and ultimately achieving damage assessment of bridges under construction.

2. Seismic Vulnerability Analysis Methodology in Construction Phase

The seismic vulnerability is defined as the conditional probability that the seismic demand (D) of structural components exceeds the capacity I of structural components when the intensity measure (IM) is specified, which can be expressed as follows:
P f = P [ D C | I M ]
The seismic demand (D) and seismic capacity (C) of a bridge structure are measured by the probabilistic seismic demand model (PSDM) and the capacity limit states (LS), respectively. The PSDM, namely the probabilistic relationship between D and IM, is obtained by expressing D as a function of IM and generally assuming that the two obey an exponential relationship [20], that is:
S D = a ( I M ) b   or   ln ( S D ) = ln ( a ) + b ln ( I M )
where a and b are regression coefficients.
In fact, it is usually assumed that both D and C follow a log-normal distribution, so the exceedance probability of Equation (1) can be converted into the following:
P f = P [ D C | I M ] = Φ [ ln ( S D ) ln ( S C ) β D 2 + β C 2 ]
where  Φ [ ]  is the standard normal function, SD and Sc are the median values of demand and capacity, respectively, and βD and βC are their log standard deviations, respectively.
β D = i = 1 n ( ln D i ln S D ) 2 / ( n 2 )
where Di is the ith peak seismic demand; n is the number of ground motions for the non-linear time history analysis.
The above is a general method for generating structural seismic vulnerability curves. Under this framework, the seismic vulnerability curves of structural construction stages can be established by dividing construction stages, specifying earthquake intensity measures, selecting demand parameters during the construction state, and defining damage indexes. The overall analysis process is shown in Figure 1.

3. Case Study

3.1. Bridge Description

A dismantled and reconstructed three-span continuous girder bridge is used for analysis, with a span arrangement of 65 m + 98 m + 65 m, depicted in Figure 2. The main girder of the reconstructed bridge adopts the continuous box girder with variable cross section corrugated steel web, and the cross section of the girder is presented in Figure 3. Both the height of the girder and the thickness of the bottom plate transition according to the quadratic parabola. Q345D steel is used for corrugated steel webs, and C50 concrete (with a cube strength of 50 Mpa) is used for concrete bridge panels. The middle pier is a Y-shaped single-pillar column made of C50 concrete, and the side pier is a double limb column made of C50 concrete. The reconstructed continuous girder bridge is built using the symmetrical cantilever method (Figure 4). In order to facilitate the reconstruction of the superstructure, a temporary bearing was set up, which used the steel tube pile foundation laid during the demolition of the bridge.

3.2. Numerical Model

OpenSEES (Open System for Earthquake Engineering Simulation) [21] is used to establish the finite element model (FEM) for dynamic simulation of large-span continuous girder bridges with OSW at different construction states. Generally, it is usually assumed that the main girder of the superstructure keeps elastic under the actions of earthquakes, so elastic plate elements are chosen to describe the concrete deck slab, and elastic beam-column elements are selected to simulate the corrugated steel web, with a rigid connection between the deck slab and the steel girder. In order to consider the damage behavior of piers under earthquake, non-linear beam-column elements are adopted to simulate the piers, and the cross sections are discretized into a concrete protective layer, a concrete core layer, and a reinforcement layer, in which the concrete model proposed by Mander [22] is used to describe the stress-strain relationship of concrete, whereas the Giuffré–Menegotto–Pinto model with isotropic strain hardening is adopted to simulate the strain-stress relationship of reinforcement steel [23]. An elastic beam element is used to simulate the temporary pier of a steel pipe column. In addition, in order to obtain the response of temporary bearings between the temporary scaffold and the main girder under the action of an earthquake, zero-length elements are chosen to simulate them, and the schematic diagram of the FEM of temporary bearing is shown in Figure 5. By integrating the superstructure, substructure, and temporary bearings, the FEM of the bridge in different construction states is obtained. Due to the 11 construction stages of this bridge, the FEMs for all construction stages are not listed here due to space limitations.

3.3. Selection of Ground Motions and Intensity Measures

This study uses the “cloud method” to obtain a seismic response of critical components of the bridge, which requires the selected seismic waves to have a wide strength range and a large number to meet statistical requirements. Nielson and Pang [24] recommended no less than 80 seismic waves for the dynamic response analysis based on the “cloud method”. However, historical seismic records of this bridge site that meet the requirements are not available. Thus, specific and small amounts of seismic waves at the bridge site are not selected. Besides, to eliminate the defects of artificially generated seismic waves, 100 actual seismic wave records used by Shafieezadeh et al. [25] are adopted as seismic loads in this study. Wherein 80 seismic waves are from the PEER (Pacific Earthquake Engineering Research Center) strong earthquake database. The magnitude of these waves ranges from 5.74 to 7.62, and the epicentral distance ranges from 10 km to 60 km. The distribution of PGA, magnitude, and epicenter distance of these waves are detailed in Figure 6. Moreover, 20 seismic waves are selected from the Seismic Analysis Code (SAC) engineering database, with a 50-year 2% and 10% exceeding probability.
The selection of the optimal IM is a key factor affecting probabilistic seismic demand analysis. Many scholars have conducted extensive research on the selection of IM for continuous girder bridges. Within the scope of bridge engineering, peak acceleration seismic intensity indicators such as Peak ground acceleration (PGA) are commonly used IMs. Chaudhary [26] evaluated the effect of pile-soil interaction on medium-span bridges based on PGA. To investigate the applicability of PGA and structural fundamental periodic spectral acceleration (Sa,T1) to girder bridges considering uncertainties, Nielson et al. [27] presented that PGA as IM was more suitable for damage assessment of girder bridges. From seismic response comparison, Wei et al. [28] concluded that both Sa and PGA can accurately predict the seismic response of high-speed railway continuous girder bridges. From the above discussion, PGA seems to be more suitable for seismic vulnerability analysis of continuous girder bridges. Thus, PGA is chosen as the IM in this study.

3.4. Determination of Engineering Demand Parameters and Their Damage Indicators

Seismic vulnerability is the convolution of the demand (D) model and capacity (C) model. Defining the capacities and limit states of the engineering demand parameters (EDPs) is a crucial step in the generation of vulnerability curves. Several seismic data show that pier yielding and bearing failure are the more common damage modes for continuous girder bridges. In addition, the investigating focus of this paper is to assess the damage performance of the structure during construction. As can be seen from the construction characteristics of the cantilever casting method, the bending moment and shear force at the root of the main girder will increase as the construction progresses, and its safety needs to be ensured by anchoring and fixing the temporary piers during the construction process. Therefore, the curvature coefficient at the bottom of the pier and the shear coefficient of the temporary bearing were chosen as the EDPs in this paper.
The damage state of a structure can be divided into 5 categories, namely the intact state, slightly damaged state, moderately damaged state, severely damaged, and completely damaged state. The four boundaries between the 5 damage states are: intact to slight, slight to moderate, moderate to severe, and severe to complete [29]. For the above EDPs, this paper uses the damage indicators defined in the existing studies. The curvature coefficient is chosen as the damage indicator for piers due to its simple output, clear concept, and applicability to bi-directional seismic damage evaluation [30], and the damage state is classified into four levels: slight (DS-1), moderate (DS-2), severe (DS-3) and complete (DS-4). Calculate the characteristics of the component sections using XTRACT software, and the ductility coefficient corresponding to the initial curvature of 1, 2, 4, and 8 times was taken as the dividing boundary of the 5 damage states.
The shear factor of a bearing is defined as the ratio of the shear force to the yield shear force on the bearing under seismic action. During the construction process, the connection between the pier and the beam is realized by temporary support, so the investigation focuses on the vulnerability of the temporary bearings. According to the design of the pouring scheme, a symmetrical distribution of 60 finely tied bars is buried between block 0 and the temporary pier as a temporary bearing. By referring to the study of Nielson [31], when the overall reinforcement group was simulated as a rigid bearing, two times and 6.66 times the shear force at yield were taken as the basis for the classification of the damage index. To be clear, for continuous girder bridges at this state of construction, damage to the temporary bearings does not cause serious damage or collapse of the bridge structure as a whole, so performance indicators for serious damage and collapse states of the bearings are not defined in this paper. The EDPs and their damage indicators are summarized in Table 1.

4. Results Discussion

The bridge case is constructed using the cantilever construction method, and the construction steps are briefly described as follows: Concreting of girder segment No. 0 and temporary consolidation of pier and girder; Installation of cantilever hanging baskets and pouring of the main girder in symmetrical sections on both sides of Segment No. 0 up to the pre-consolidation section; Pouring of cast-in-place sections on temporary scaffolds; In-situ casting of jointed section. From the structural characteristics of the girder and the convenient purpose of the construction, the cantilever construction of the girder is divided into 11 segments s. The FEM model corresponding to each construction state is inputted with 100 ground motions for consistent excitation to obtain the demand response of the bridge piers and bearings, the PSDMs are obtained by Equation (2), and the vulnerability curves for piers and bearings under each construction state are calculated using Equation (3). Due to a large number of construction states and limited space, this section only plotted the seismic vulnerability curves for piers and bearings for each of the three preceding and following construction states.

4.1. Seismic Vulnerability of Piers during the Construction

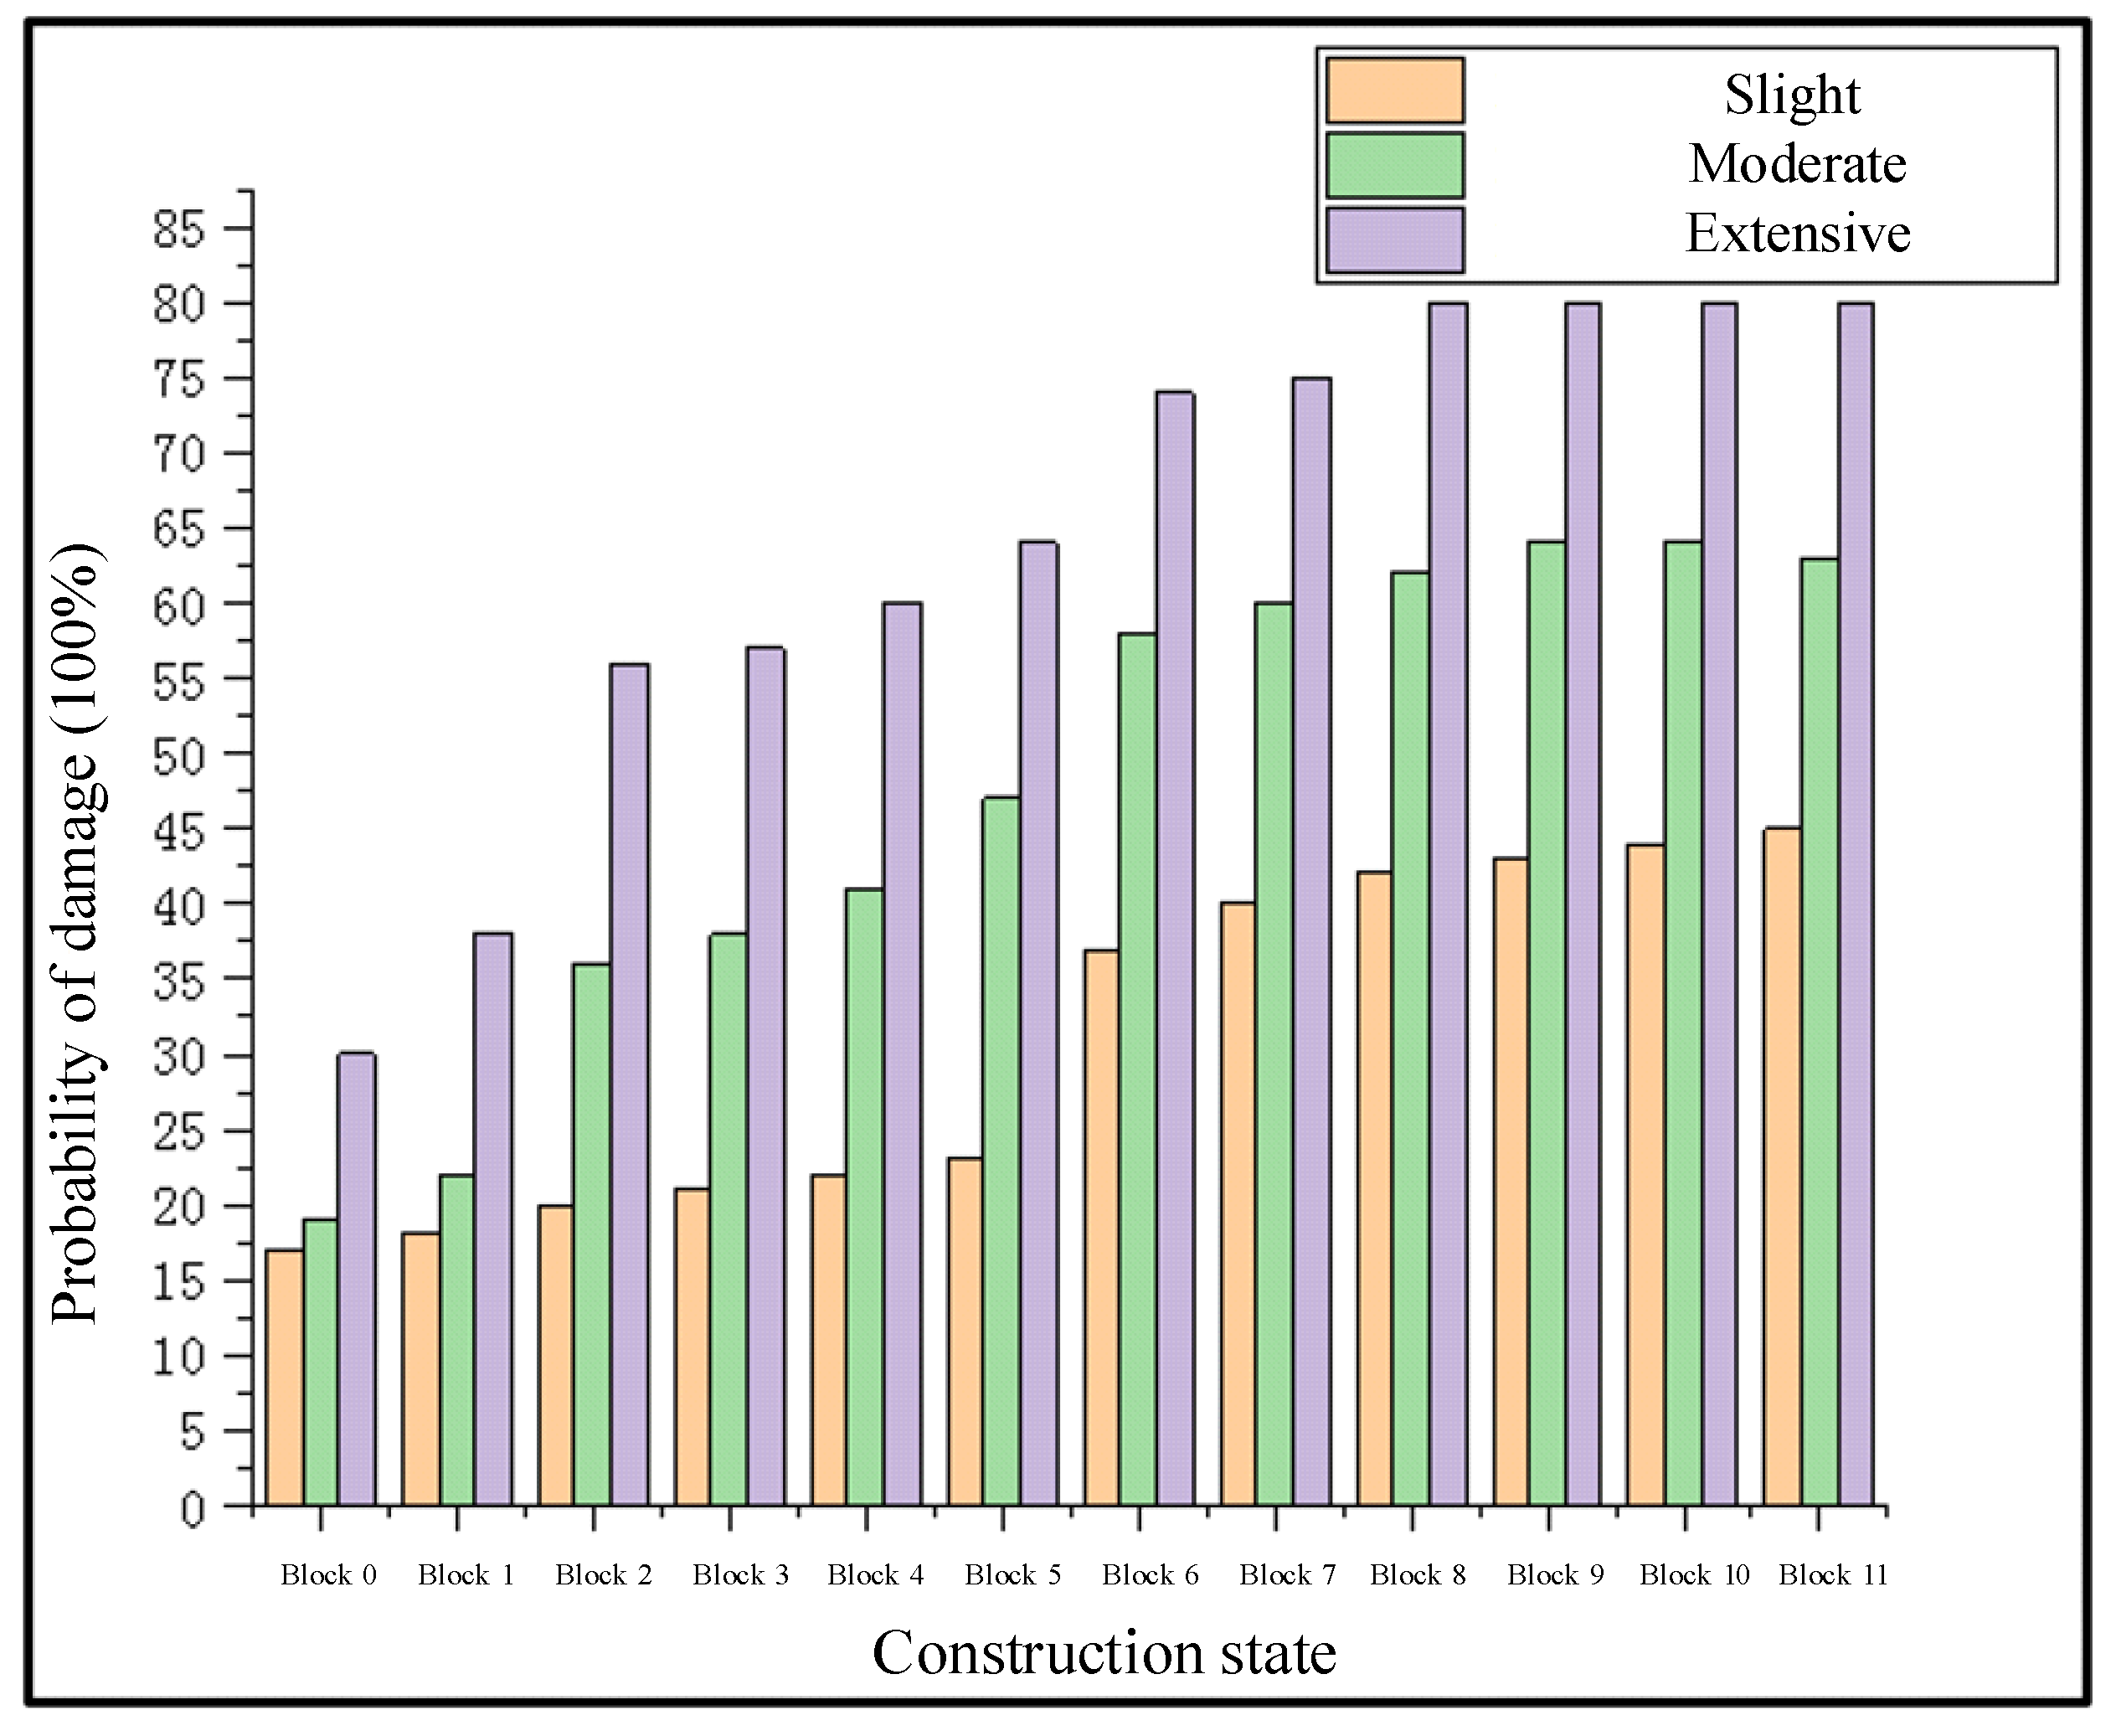
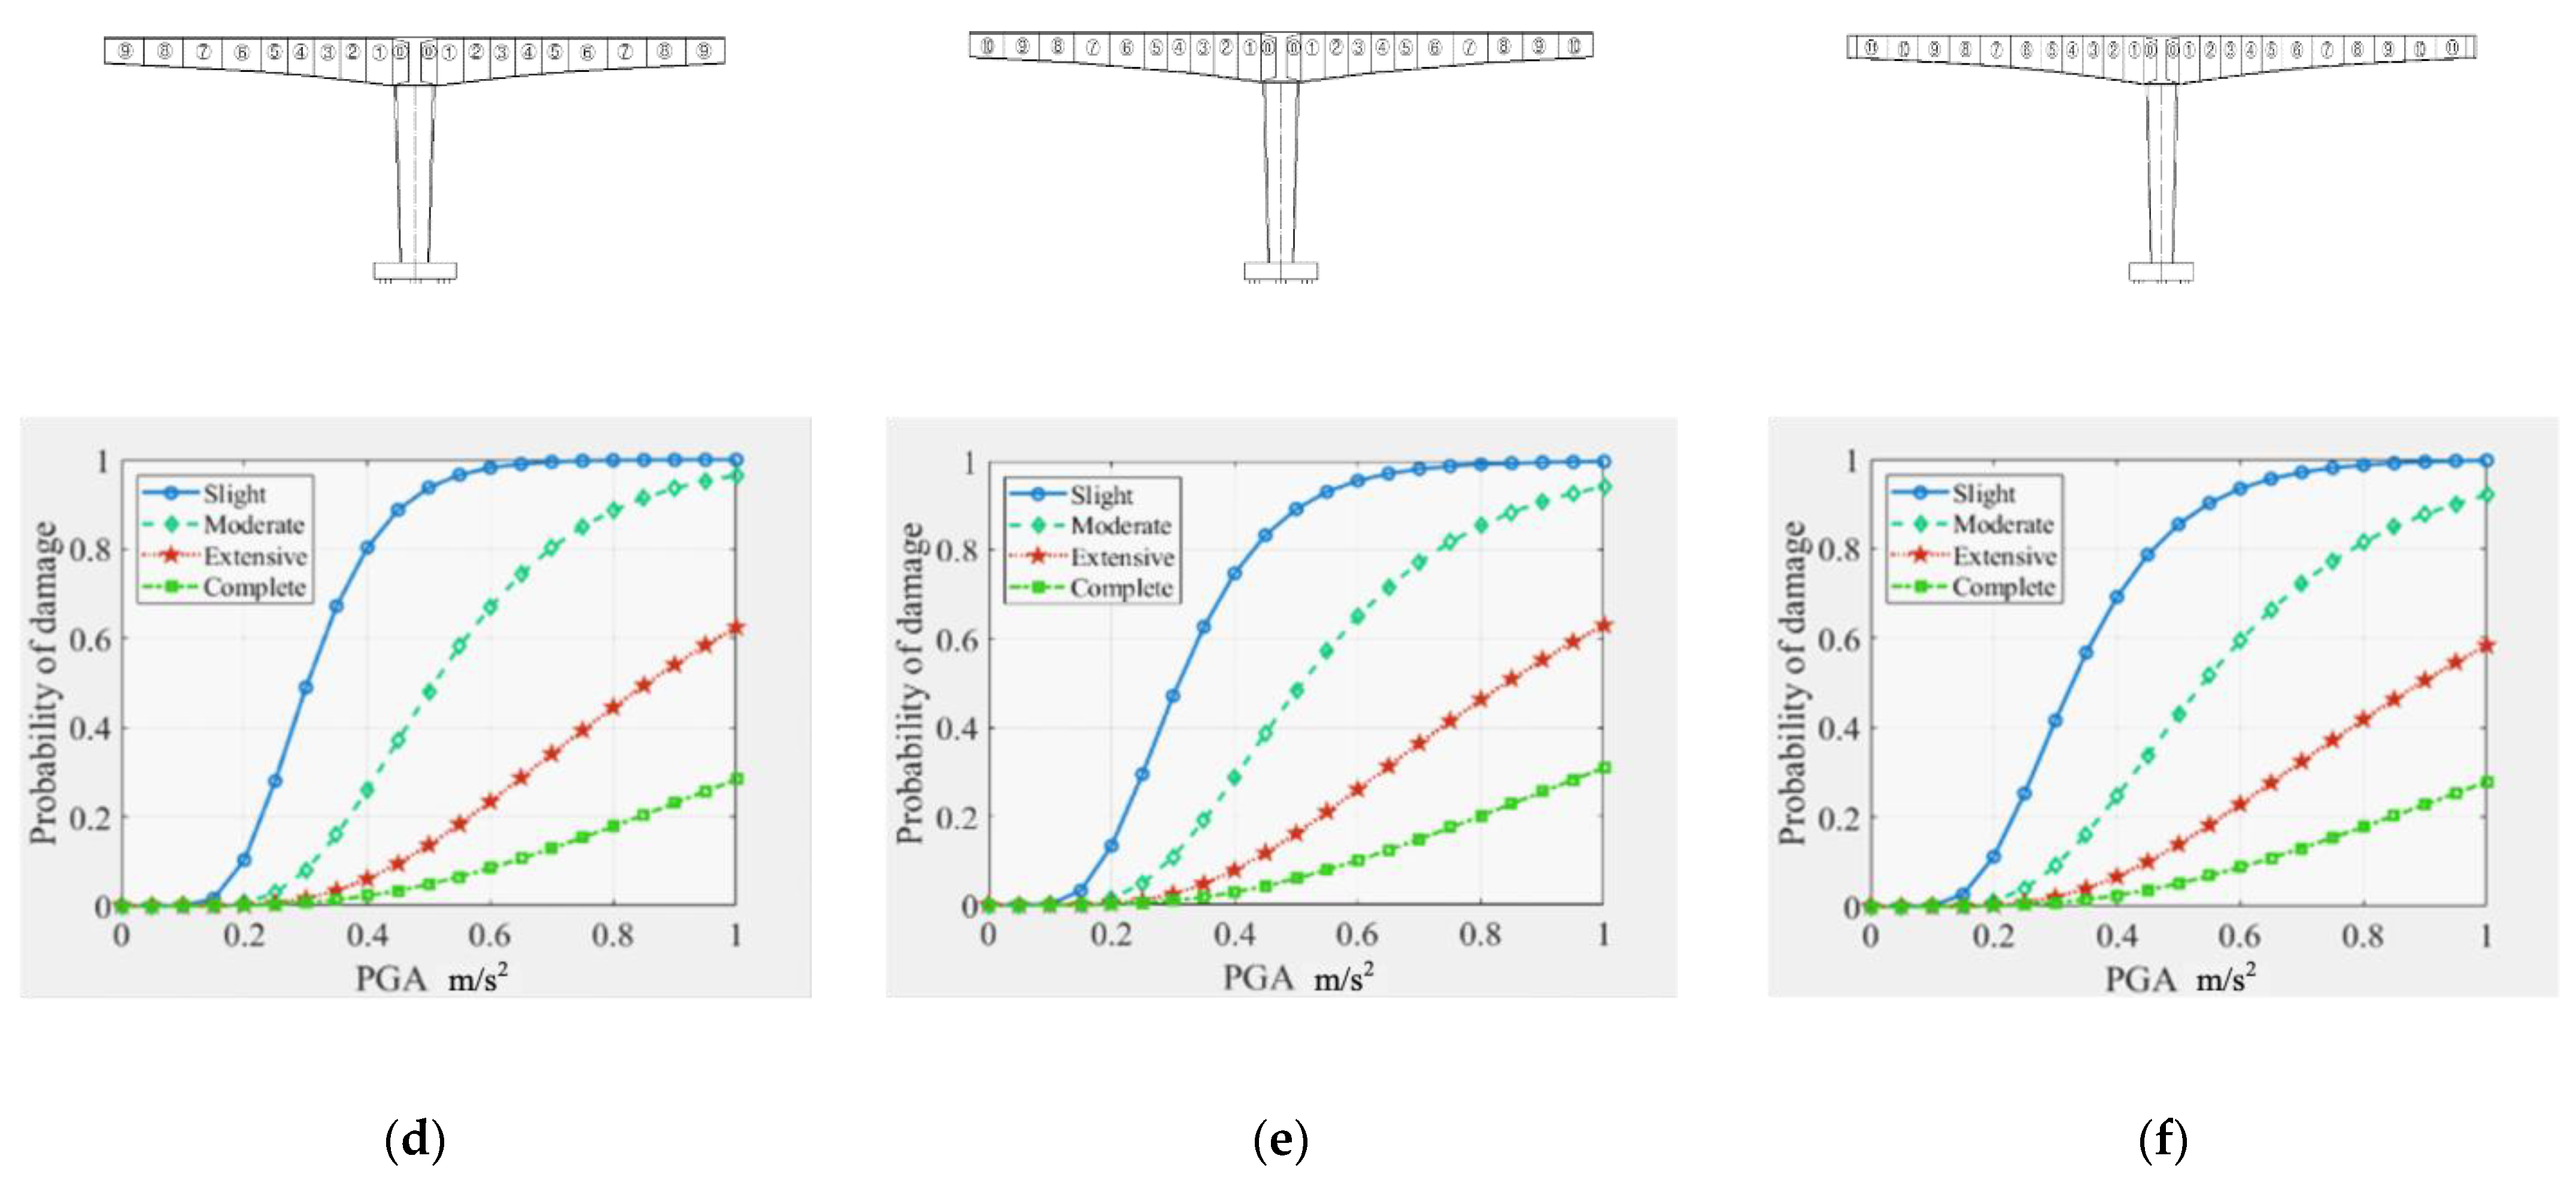
Figure 7 shows the seismic vulnerability curves of a pier in a partial construction state under horizontal bidirectional seismic excitation. When PGA reaches 0.8 g, the probability of slight damage, moderate damage, and severe damage of the pier in all construction states is shown in Figure 8. It can be seen from Figure 7 and Figure 8 that the damage probabilities of the pier present a significant and increasing trend during the whole construction process. In the initial construction state (the pouring state of segment No. 0 and No. 1), the probability of severe damage to the pier is small because the consolidation effect of the temporary pier led to a smaller shear force and bending moment at the bottom of the pier, so the curvature of pier bottom is also low. After the completion of the pouring of segment No. 1, the cantilever structure begins to form. The damage probability of the pier after the pouring of segment No. 2 is obviously higher than that of the initial construction state. For example, the probability of slight damage to the pier increased from 40% to 57% during the pouring of segment No. 2. After the completion of segment No. 6 pouring, the damage probability of the pier increased with the change of construction progress. For example, the probability of slight damage to the pier increased from 64% to 76% in the process of segment No. 6 pouring. This is caused by the change in the segmented size of the pouring block (the length of the pouring block has changed from 3.2 m to 4.8 m), resulting in an increase in weight and response.
For the cantilever structure, the vertical action may produce a larger bending moment at the consolidated end, so the effect of vertical ground motion is considered. The seismic vulnerability curves of a pier in part of the construction state under a three-directional earthquake are drawn in Figure 9. It can be seen that the vertical seismic action slightly increases the probability of pier damage, especially after the formation of the lower cantilever structure.
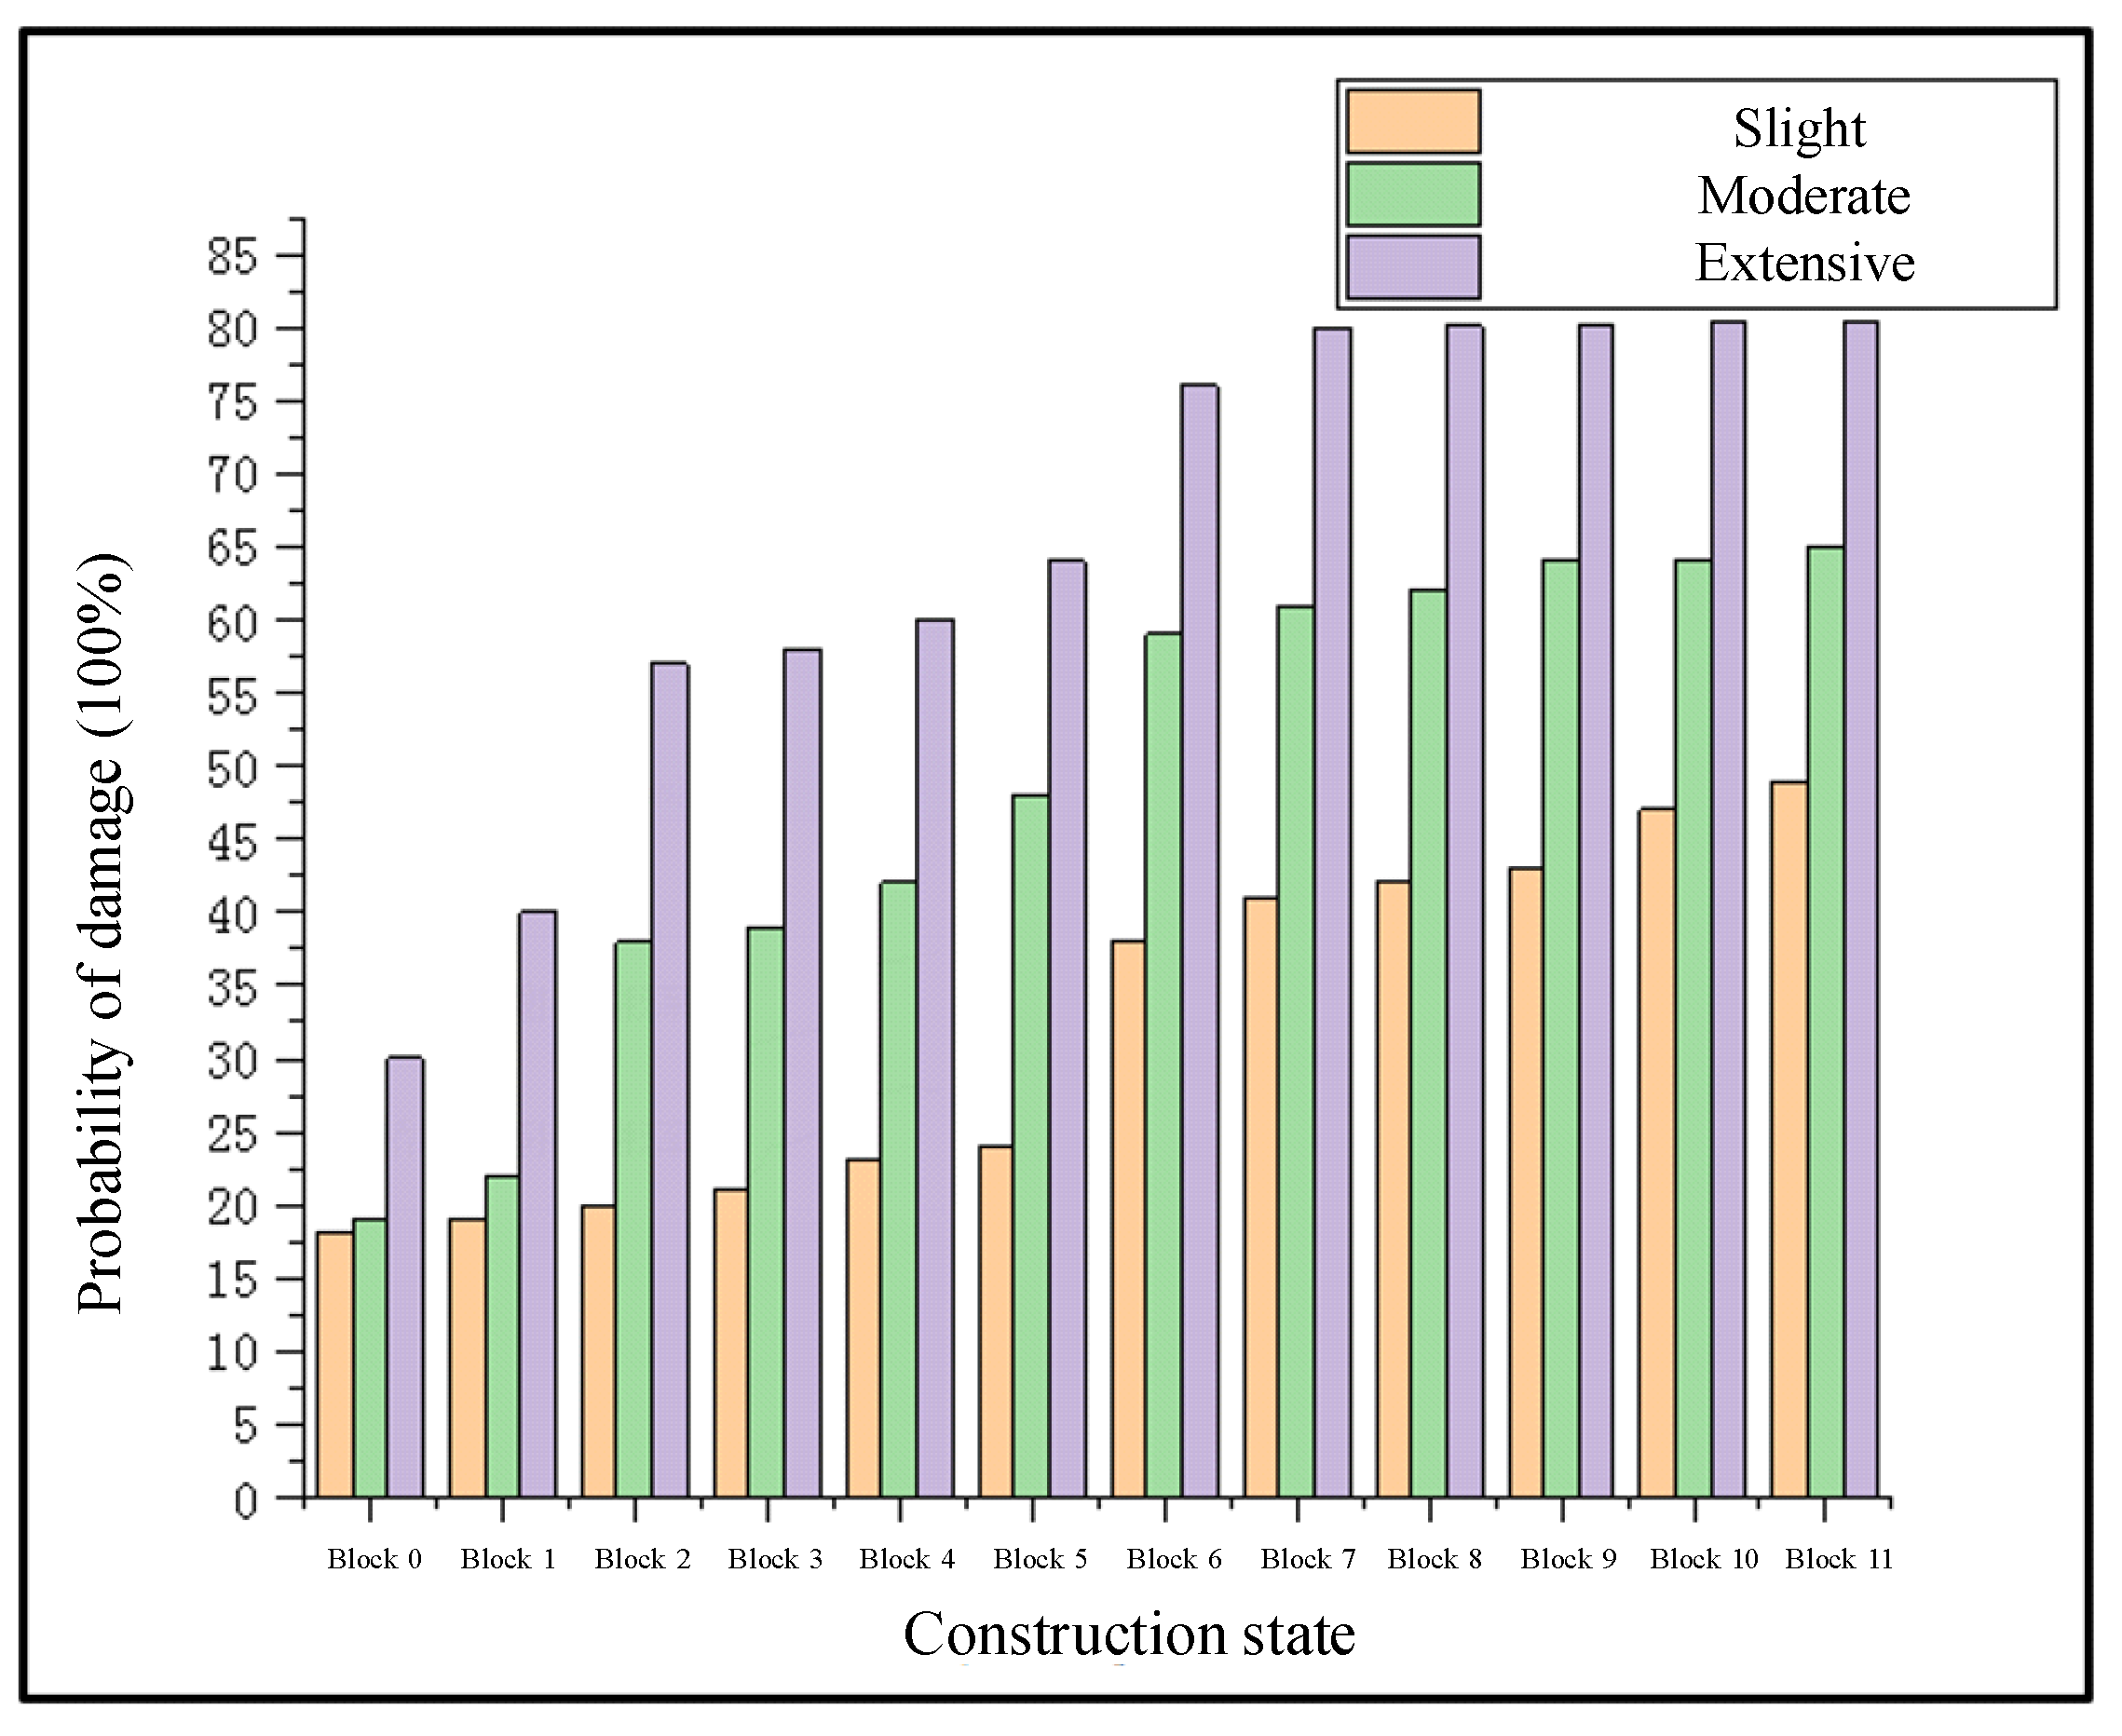
For example, when PGA = 0.8 g in the process of segment No. 11 pouring, the damage probabilities of a pier’s slight, moderate, and severe state are 80%, 62%, and 45%, respectively, under bidirectional earthquake, and the probability of corresponding pier damage grade is 81%, 65% and 48% respectively under three-directional earthquake, plotted in Figure 10.
In conclusion, in the pouring process of segment No. 2, No. 6, and the previous stage of closing (segment No. 11), the pier damage probability is large. Therefore, it is necessary to strengthen the anti-seismic protection measures of the concrete protective layer at the bottom of the pier in these several construction stages to reduce the probability of minor damage types. Besides, it is advisable to pay attention to strengthening the seismic protection of the pier bottom after the pouring of segment No. 5 is completed.

4.2. Seismic Vulnerability of Temporary Bearing during Construction

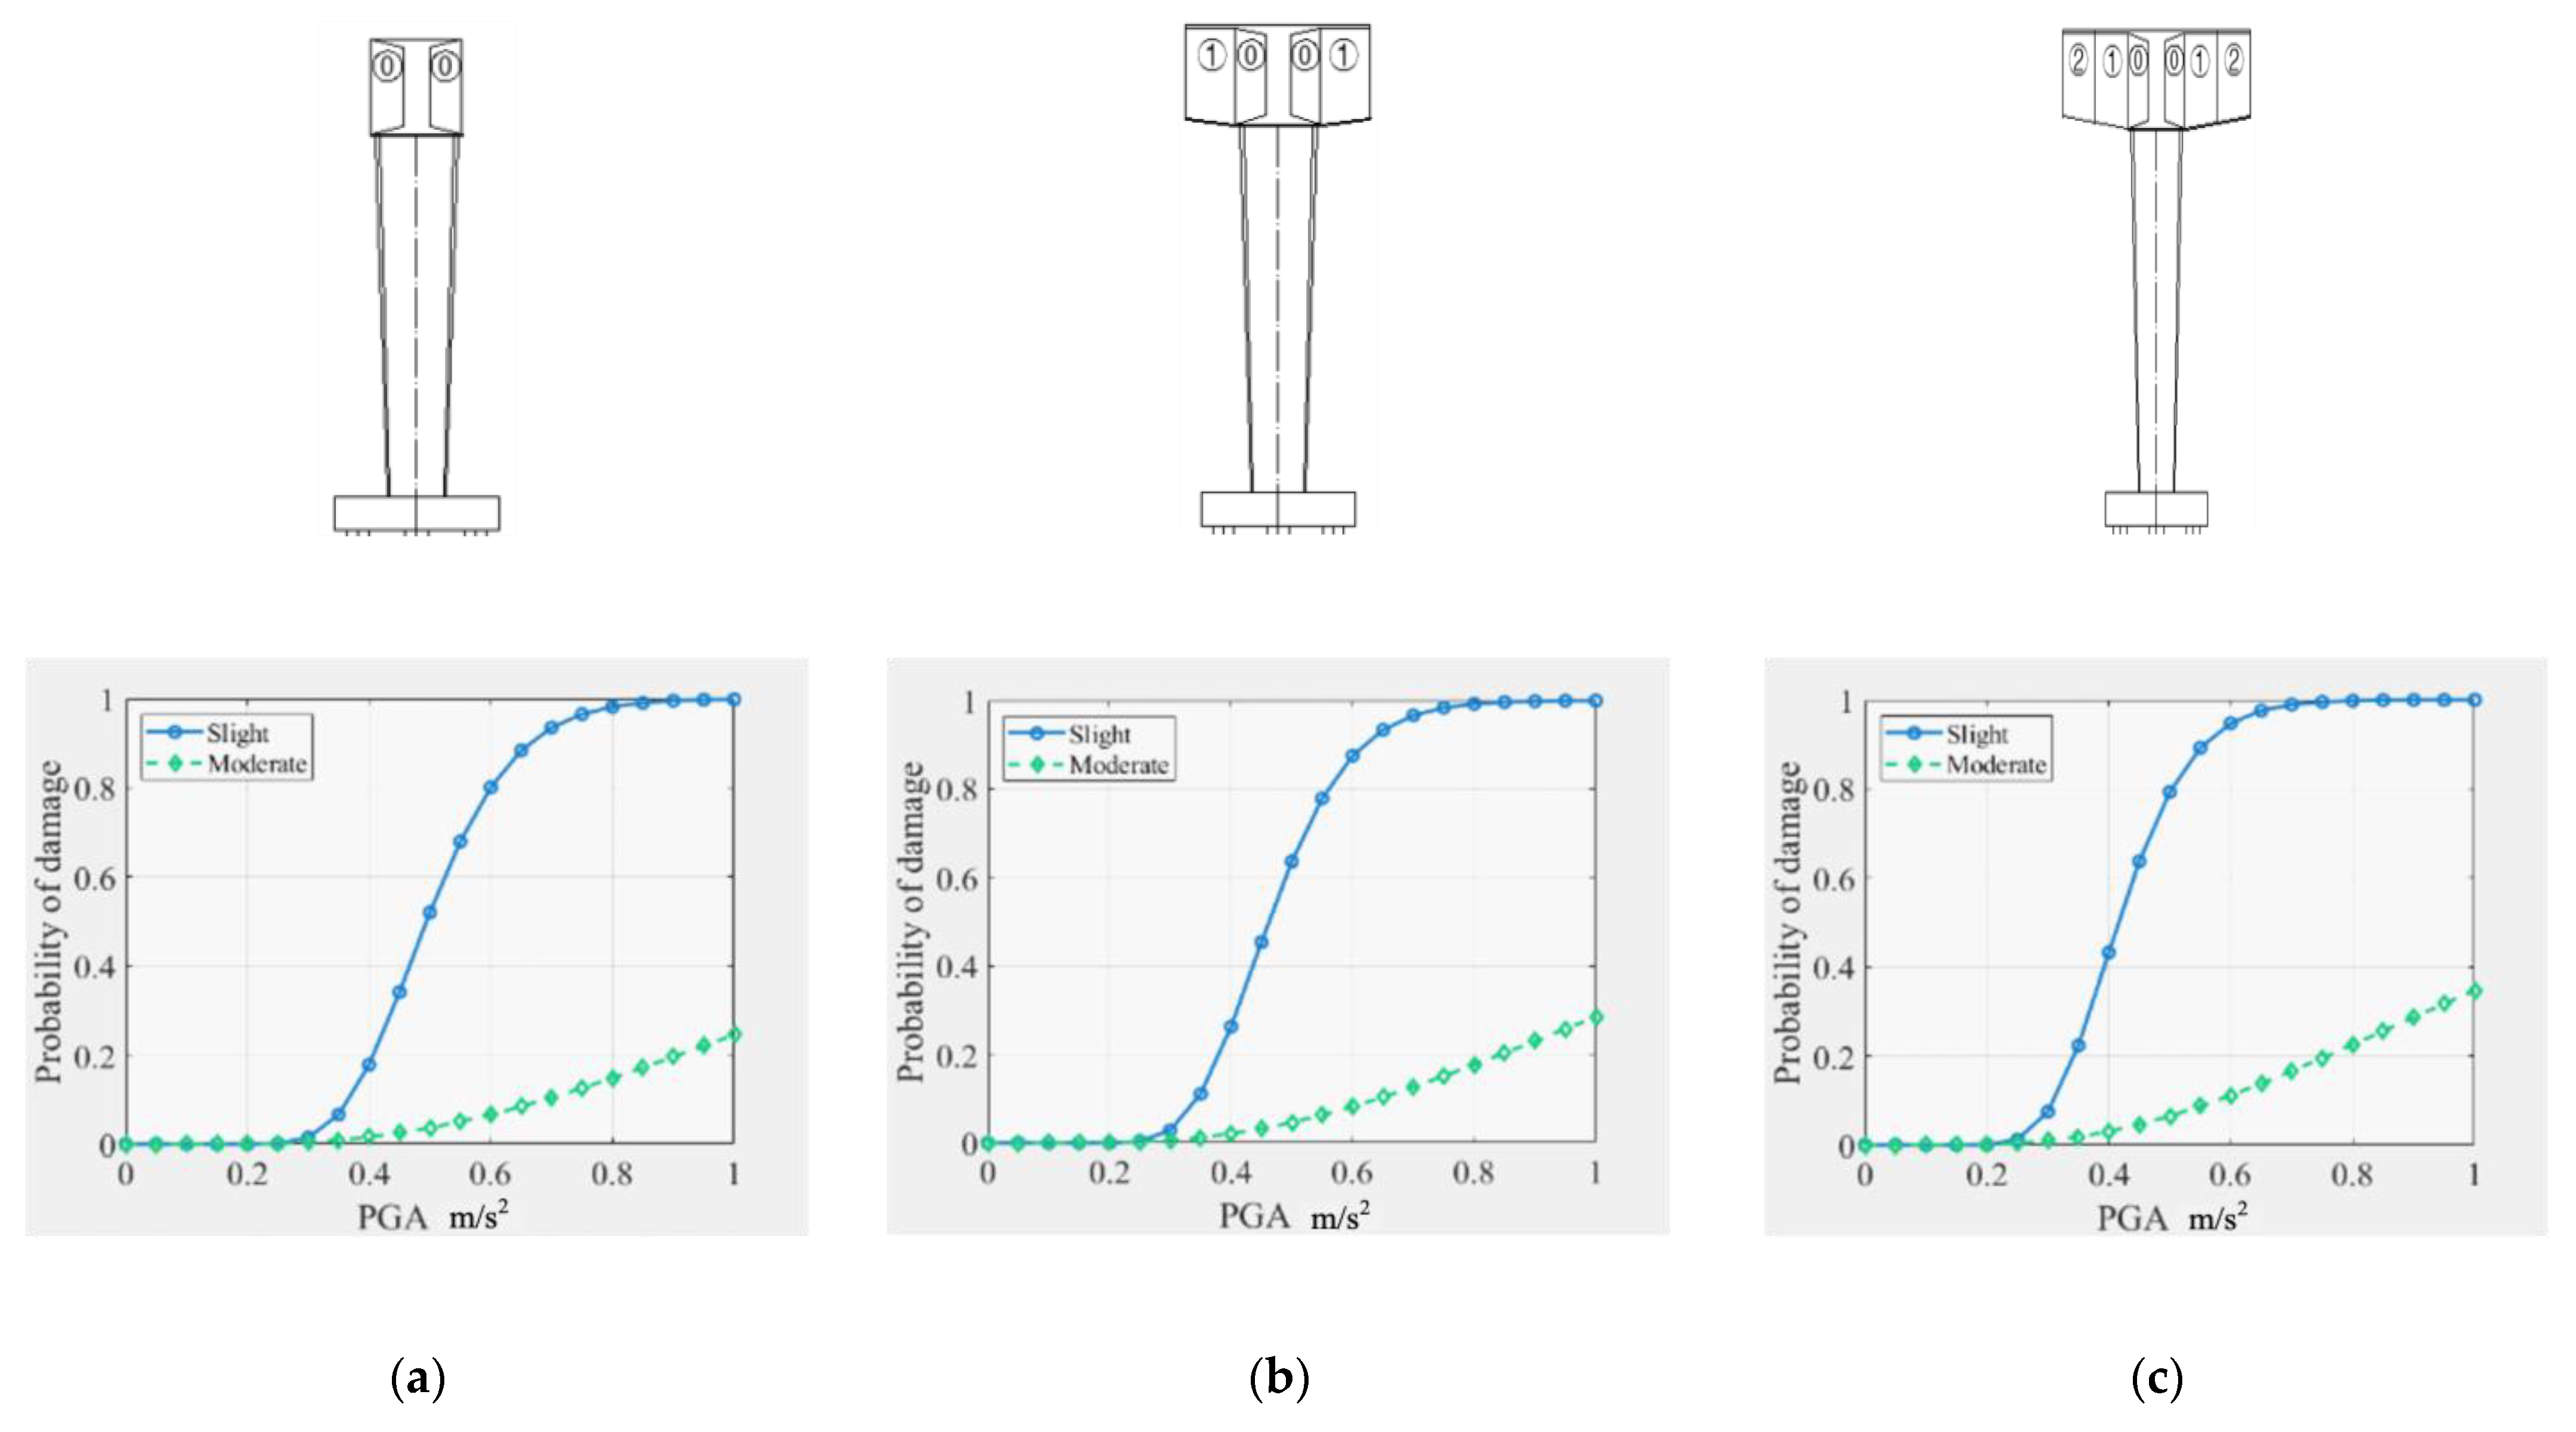
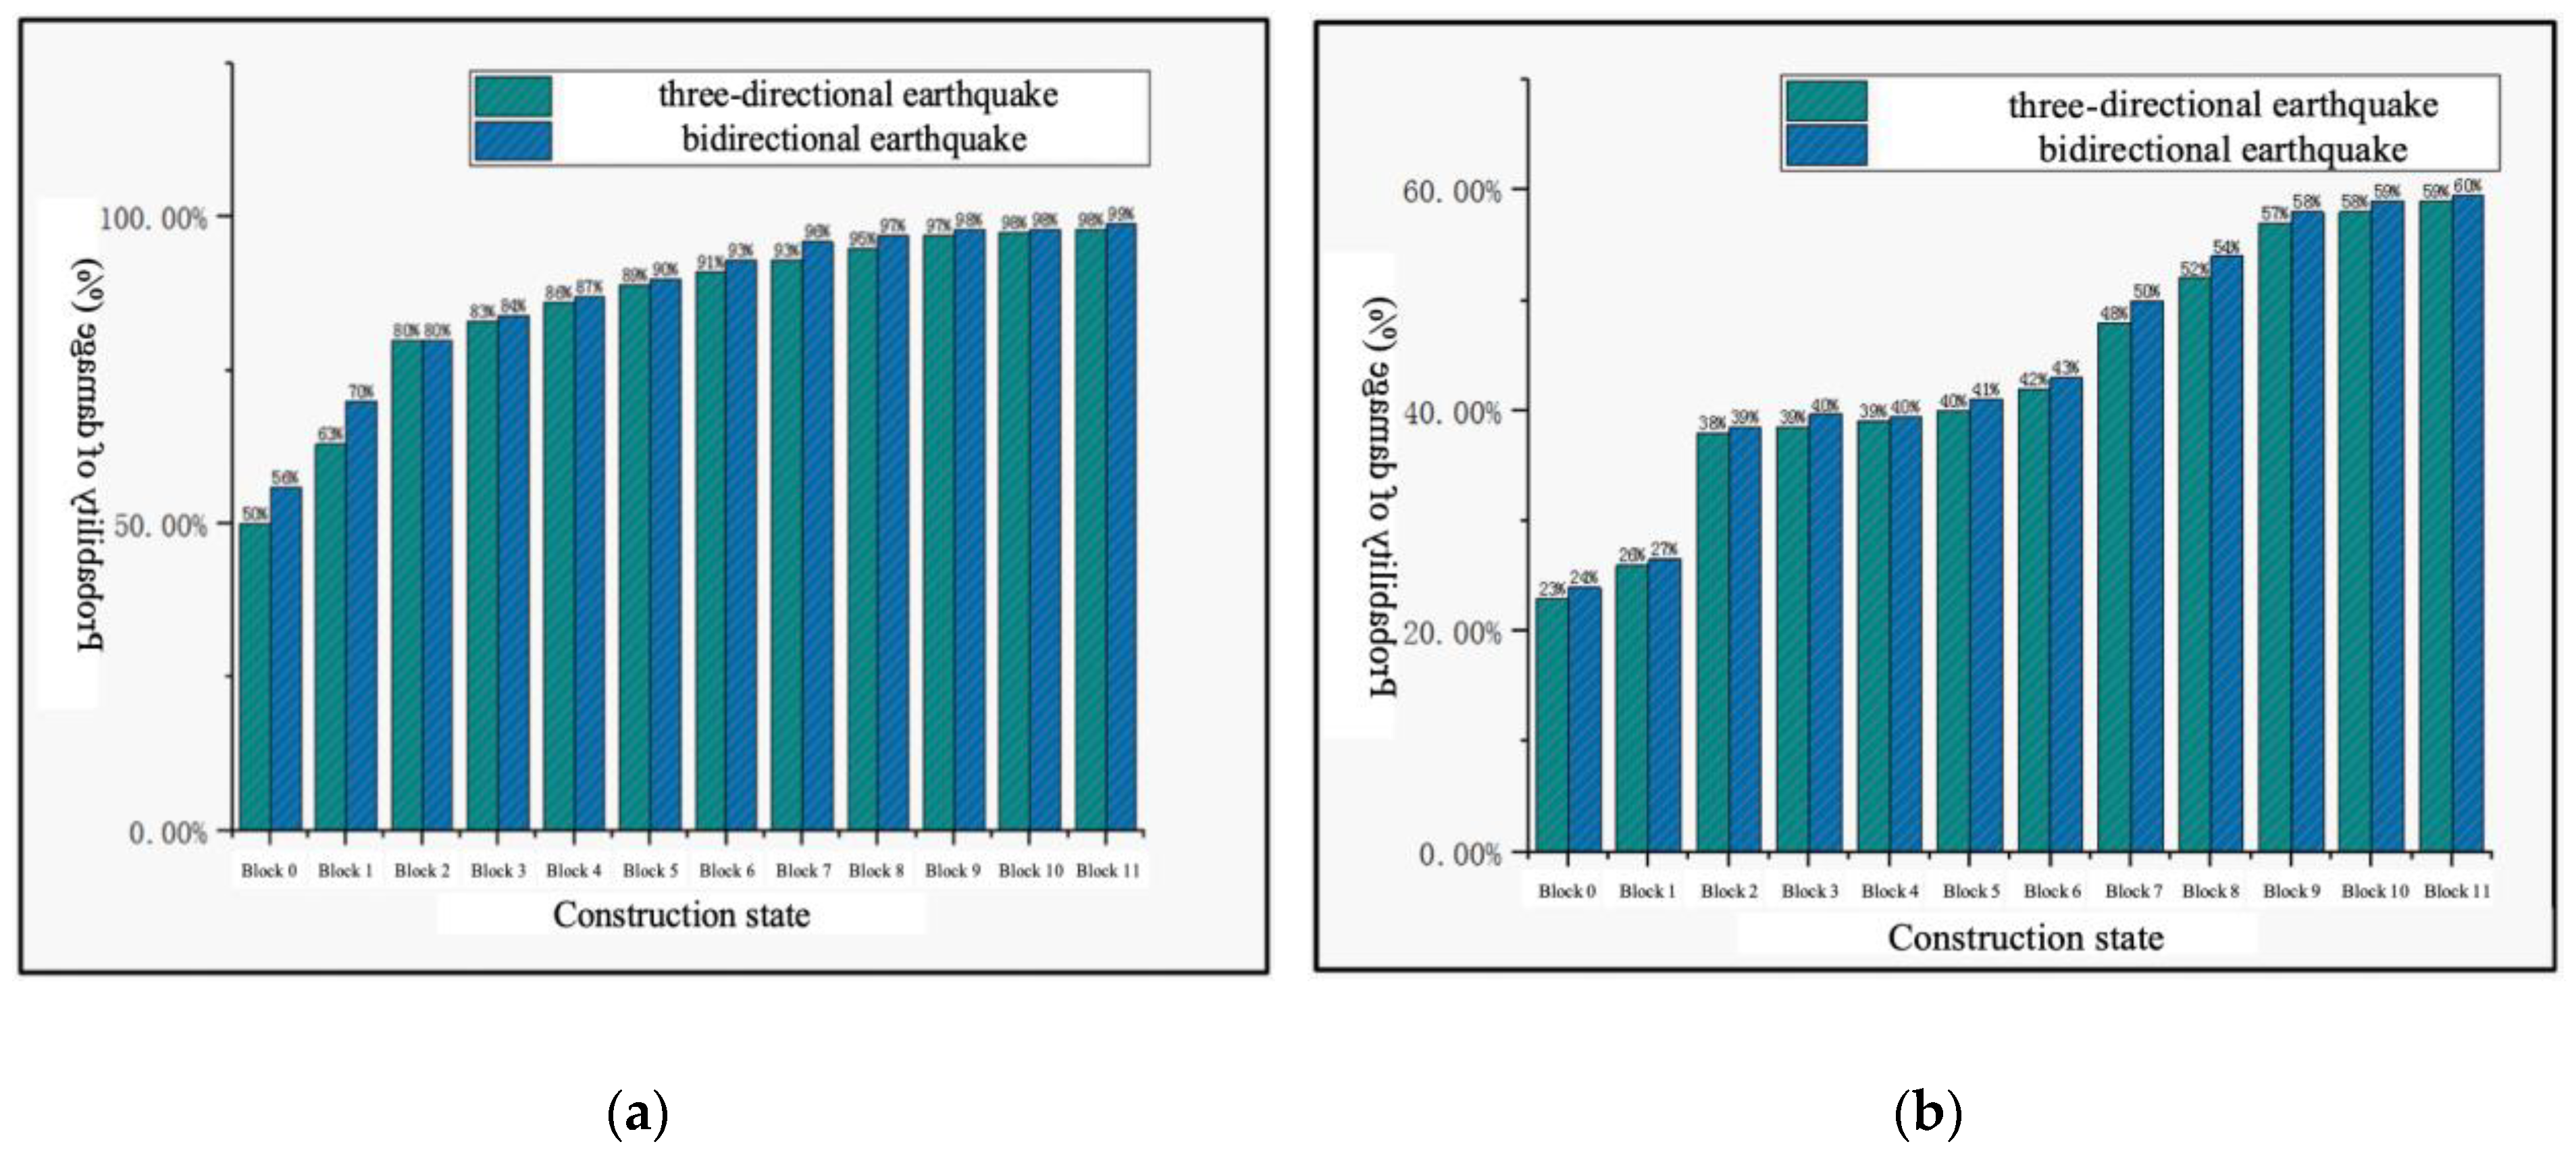
The seismic vulnerability curves of temporary bearings in a partial construction state under horizontal bidirectional seismic excitation are shown in Figure 11. It presents that the vulnerability increased significantly during the whole construction project from the initial pouring of segment No. 0 to the cantilever end of the main bridge. When PGA = 0.5 g and PGA = 1.0 g, the probabilities of slight damage to the temporary bearing increase with the progress of the working condition. At the stage of construction approaching closure (segment No. 11), the damage probability of the temporary bearing under the action of an earthquake is close to 100%. Figure 12 shows that after the completion of the pouring of blocks two and six, the damage probability of the temporary support underwent a sudden change, which is consistent with the distribution of damage probability of the bridge pier.
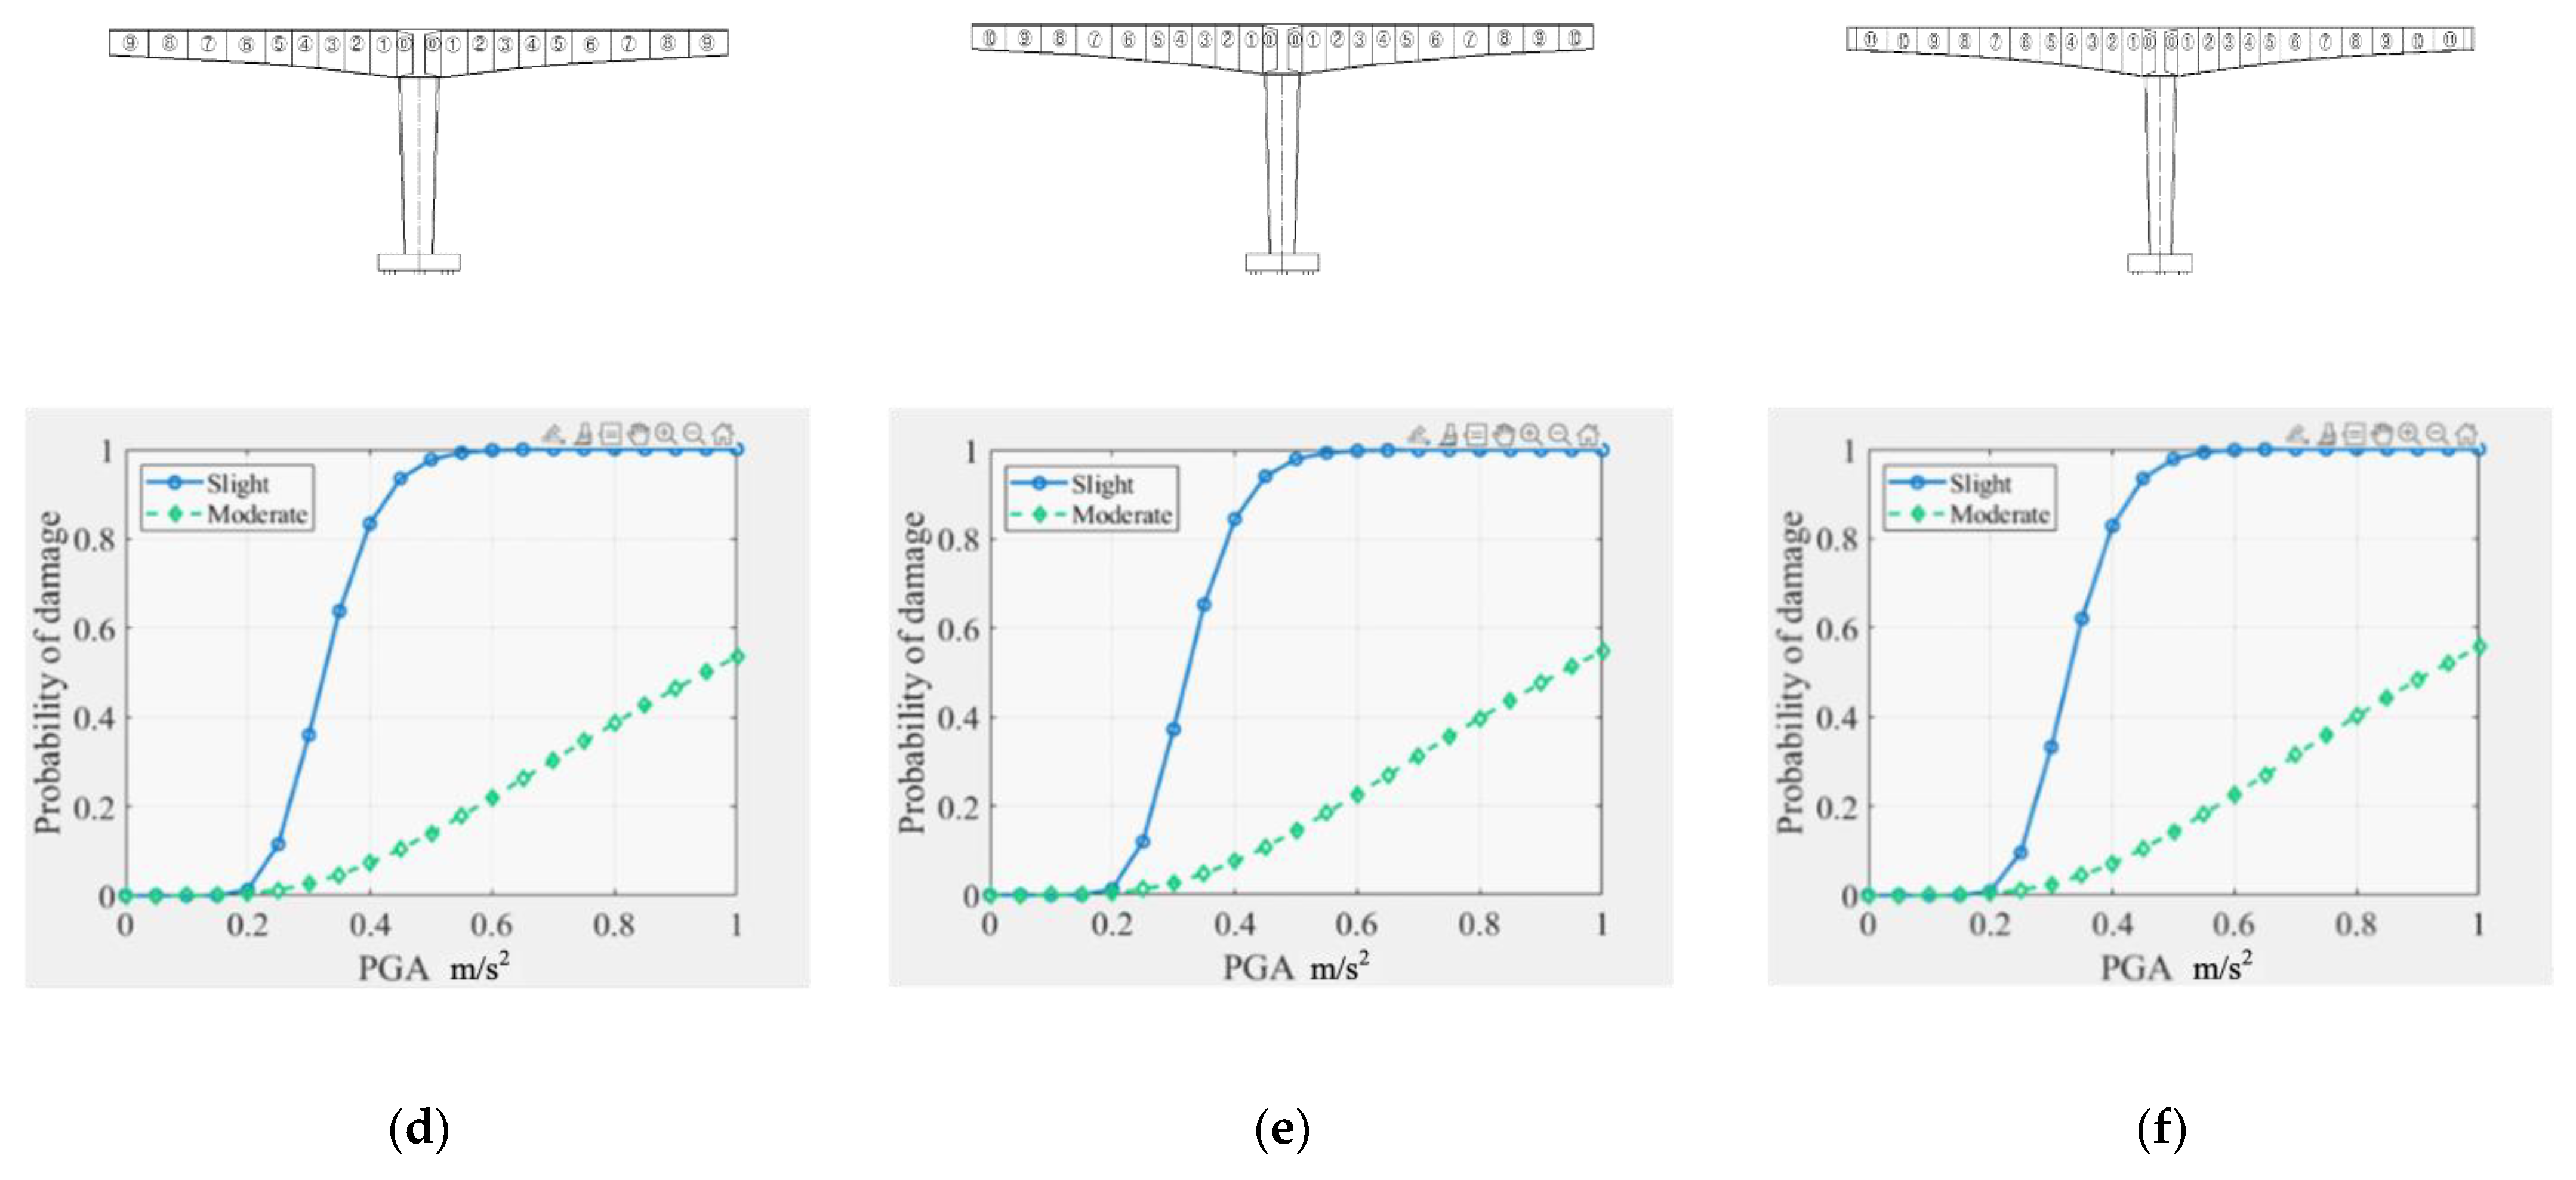
The seismic vulnerability curves of temporary bearings during partial construction under a three-directional earthquake are shown in Figure 13. It can be found that considering the effect of vertical ground motion, the damage probability of temporary bearing is slightly improved in the whole construction state. Taking the pouring process of segment No. 11 as an example, when PGA = 0.8 g, the probability of slight and moderate damage to the temporary bearing under the action of a bidirectional earthquake are 98% and 59%, and the probability of slight and moderate damage to the temporary bearing under the action of a three-directional earthquake is 99% and 60%.

4.3. Comparison of Seismic Vulnerability between Completed Bridge and Construction Stage

When the bridge is completed, the temporary bearing is removed, and the pier bears the main load. At this time, the curvature of the bottom section of the pier under the action of an earthquake is compared with the initial yield curvature as the EDP, and the vulnerability curves are compared at the stage of construction approaching closure (segment No. 11), as shown in Figure 14.
Due to the cantilever state at both ends of the pier top during construction, the pier bottom will generate a significant seismic response under seismic action. In addition, the stiffness of the temporary bearing is relatively high, so the bending moment transmitted from seismic action to the pier bottom increases. Compared with the bridge completion state after closure, the increase of bridge boundary constraint and the damping effect of the bearing would significantly reduce the damage probabilities of the pier. For example, Figure 15 compares the damage probability of the pier bottom section when PGA = 0.1(Corresponding to a 7-degree earthquake zone). It can be observed that the probability of minor damage to the pier bottom decreases from 87% to 24%, the probability of moderate damage decreases from 43% to 7%, the probability of severe damage decreases from 12% to 2%, and the probability of complete damage decreases from 4% to 1%.

5. Conclusions

In order to accurately evaluate the risk probability of seismic damage of continuous girder bridge during construction and effectively identify the most unfavorable construction state, a seismic vulnerability analysis method suitable for the construction state is proposed in this paper, and seismic damage assessment is carried out on a long-span continuous girder bridge whose main girder section is prestressed concrete composite box type with corrugated steel webs. The following conclusions are reached:
(1)
A seismic damage index system for continuous beam bridges during the construction phase is established, targeted seismic intensity measure and engineering demand parameters are proposed, and finally, a seismic vulnerability analysis method for continuous girder bridges during the construction phase is established.
(2)
The damage probability of piers and temporary bearings under construction increases with the progress of construction. The initial formation of the cantilever structure and the size change of the construction girder section corresponds to the greater seismic vulnerability in the construction state, so the seismic damage prevention measures should be strengthened. Vertical earthquake actions slightly increase the damage probability of key components during construction.
(3)
The damage probability of a continuous girder bridge after completion under an earthquake is less than that of the corresponding structure at any construction state. The continuous girder bridge is more vulnerable to earthquakes in the construction stage than in the completion stage.
This paper only puts forward the seismic vulnerability analysis method of bridges under construction and carries out damage probability analysis of components. The following two aspects still need further research. One of the aspects is to develop the system vulnerability analysis method for the bridge under construction. The other is to combine with the construction stage risk probability, insurance rate, loss rate, etc., to achieve the actuarial calculation of the bridge under construction.

Author Contributions

Conceptualization, R.W. and Z.H. (Zhiming Hao); writing—original draft preparation, Z.H. (Zhangliang Hu); writing—review and editing, L.C. and G.S.; revising the work, R.H. and R.Z. All authors have read and agreed to the published version of the manuscript.

Funding

This research was supported by the Anhui Provincial Natural Science Foundation under grant No. 2208085ME151.

Data Availability Statement

The data presented in this study are available on request from the corresponding author. The data are not publicly available due to data has a certain degree of privacy.

Conflicts of Interest

The authors declare that they have no known competing financial interests or personal relationships that could have appeared to influence the work reported in this paper.

References

  1. Mackie, K.; Stojadinovic, B. Probabilistic seismic demand model for California highway bridges. J. Bridge Eng. 2001, 6, 468–481. [Google Scholar] [CrossRef] [Green Version]
  2. Lupoi, A.; Franchin, P.; Schotanus, M. Seismic risk evaluation of RC bridge structures. Earthq. Eng. Struct. Dyn. 2003, 32, 1275–1290. [Google Scholar] [CrossRef]
  3. Wei, B.; Yang, T.; Jiang, L.; He, X. Effects of uncertain characteristic periods of ground motions on seismic vulnerabilities of a continuous track-bridge system of high-speed railway. Bull. Earthq. Eng. 2018, 16, 3739–3769. [Google Scholar] [CrossRef]
  4. Cao, Y.; Liang, Y.; Huai, C.; Yang, J.; Mao, R. Seismic fragility analysis of multispan continuous girder bridges with varying pier heights considering their bond-slip behavior. Adv. Civ. Eng. 2020, 2020, 8869921. [Google Scholar] [CrossRef]
  5. Yuen, T.Y.; Chan, W.; Zhou, X.; Deb, T.; Liu, Y.; Zhang, H. Effect of prestress loss on seismic fragility of post-tensioned precast concrete segmental bridge. In Proceedings of the 17th World Conference on Earthquake Engineering, Sendai, Japan, 27 September–2 October 2021. [Google Scholar]
  6. Wang, D.; Wang, X.; Liu, H. Seismic fragility analysis of multi-span continuous girder bridge considering spatial variation of ground motions. In Proceedings of the 17th World Conference on Earthquake Engineering, Sendai, Japan, 27 September–2 October 2021. [Google Scholar]
  7. Yin, C.B.; Yu, F. Seismic Response Analysis of High Pier and Long Span Rigid Framed Bridge under Non Uniform Excitation. Appl. Mech. Mater. 2012, 193–194, 1315–1319. [Google Scholar] [CrossRef]
  8. Zhang, Y.; Li, J.; Wang, L.; Wu, H. Study on the Seismic Performance of Different Combinations of Rubber Bearings for Continuous girder Bridges. Adv. Civ. Eng. 2020, 2020, 8810874. [Google Scholar]
  9. Tan, Y.; Fang, R.; Zhang, W.; Zhao, H.; Du, X. Theoretical study on the seismic response of a continuous girder bridge with safe-belt devices. Soil Dyn. Earthq. Eng. 2021, 151, 106948. [Google Scholar] [CrossRef]
  10. Hsu, W.-K.; Chiang, W.-L.; Xue, Q.; Hung, D.-M.; Huang, P.-C.; Chen, C.-W.; Tsai, C.-H. A probabilistic approach for earthquake risk assessment based on an engineering insurance portfolio. Nat. Hazards 2013, 65, 1559–1571. [Google Scholar] [CrossRef]
  11. Huang, Y.; Li, H.G.; Xie, G.M.; Li, W.; Zu, L. Seismic fragility Analysis of Bridges under Construction. In Proceedings of the 17th World Conference on Earthquake Engineering, Sendai, Japan, 27 September–2 October 2021. [Google Scholar]
  12. Li, H.; Huang, Y.; Guo, E. Construction state Seismic fragility Evaluation of a Continuous Girder Bridge with the Cast-in-Place Cantilever Construction Method. Adv. Civ. Eng. 2021, 2021, 9915947. [Google Scholar]
  13. Li, H.X.; Huang, Y.; Guo, E.D. Seismic fragility analysis of bridges in the construction state for insurance. J. Harbin Eng. Univ. 2022, 43, 549–556. (In Chinese) [Google Scholar]
  14. Shi, Y.; Zhang, Z.C.; Li, J.; Qin, H. Seismic Fragility of the Long-span, Continuous, Rigid-frame Bridge with High-rise Pier Involving the State of the Internal Force. J. Seismol. Res. 2022, 45, 8–16. (In Chinese) [Google Scholar]
  15. Yang, C.; Chen, W.L.; Xu, T.F. The vulnerability analysis of bridge construction in aftershock area. Eng. Mech. 2016, 33, 251–256. [Google Scholar]
  16. Xiong, H.; Jiang, S.; Huang, Y.; Zhang, J. Seismic vulnerability analysis of simply supported continuous bridge during construction. Multidiscip. Model. Mater. Struct. 2022, 18, 459–476. [Google Scholar] [CrossRef]
  17. Luo, H.; Liang, Y.; Feng, J.; Li, B.; Liu, W. Seismic Vulnerability Analysis of Long Span Prestressed Concrete Continuous Rigid Frame Bridge. J. Eng. Sci. Technol. Rev. 2022, 15, 35–41. [Google Scholar]
  18. Ohashi, R.; Kiyomiya, O. Examination of safety against earthquake at each stage of construction of long cable-stayed bridge. In Proceedings of the 2016 JSCE Annual Meeting, Toronto, ON, Canada, 7–20 January 2016; Abstracts of Annual Meeting of JSCE. Volume I. [Google Scholar]
  19. Wang, S.; Sun, Q.; Yu, H.; Wang, H. Seismic vulnerability analysis of cable-stayed bridge during rotation construction. Stavební Obz. Civ. Eng. J. 2022, 31, 384–399. [Google Scholar] [CrossRef]
  20. Cornell, C.A.; Jalayer, F.; Hamburger, R.O.; Foutch, D.A. Probabilistic basis for 2000 SAC Federal Emergency Management Agency steel moment frame guidelines. J. Struct. Eng. 2002, 128, 526–533. [Google Scholar] [CrossRef] [Green Version]
  21. Opensees Manual. Open System for Earthquake Engineering Simulation User Command-Language Manual; Pacific Earthquake Engineering Research Centre, University of California: Berkeley, CA, USA, 2009. [Google Scholar]
  22. Mander, J.A.B.; Priestley, M.J.N. Theoretical Stress-Strain Model for Confined Concrete. J. Struct. Eng. 1988, 114, 1804–1826. [Google Scholar] [CrossRef] [Green Version]
  23. Filippou, F.C.; Popov, E.P.; Bertero, V.V. Effects of Bond Deterioration on Hysteretic Behavior of Reinforced Concrete Joints; Report EERC 83-19; Earthquake Engineering Research Center, University of California: Berkeley, CA, USA, 1983. [Google Scholar]
  24. Nielson, B.; Pang, W. Effect of ground motion suite size on uncertainty estimation in seismic bridge fragility modeling. In Proceedings of the Structures Congress 2011, ASCE, Las Vegas, NV, USA, 14 April 2011; pp. 23–34. [Google Scholar]
  25. Shafieezadeh, A.; Ramanathan, K.; Padgett, J.E.; DesRoches, R. Fractional order intensity measures for probabilistic seismic demand modeling applied to highway bridges. Earthq. Eng. Struct. Dyn. 2012, 41, 391–409. [Google Scholar] [CrossRef]
  26. Chaudhary, M.T.A. Effect of soil-foundation-structure interaction and pier column non-linearity on seismic response of bridges bearinged on shallow foundations. Aust. J. Struct. Eng. 2016, 17, 67–86. [Google Scholar] [CrossRef] [Green Version]
  27. Nielson, B.G.; Desroches, R. Seismic fragility methodology for highway bridges using a component level approach. Earthq. Eng. Struct. Dyn. 2007, 36, 823–839. [Google Scholar] [CrossRef]
  28. Wei, B.; Li, C.B.; He, X.H. The applicability of different earthquake intensity measures to the seismic fragility of a high-speed railway continuous bridge. Int. J. Civ. Eng. 2019, 17, 981–997. [Google Scholar] [CrossRef]
  29. Azevedo, J.; Guerreiro, L.; Bento, R.; Lopes, M.; Proença, J. Seismic fragility of lifelines in the greater Lisbon area. Bull. Earthq. Eng. 2009, 8, 157–180. [Google Scholar] [CrossRef]
  30. Zhong, J.; Hu, Z.; Yuan, W.; Chen, L. System-based probabilistic optimization of fluid viscous dampers equipped in cable-stayed bridges. Adv. Struct. Eng. 2018, 21, 1815–1825. [Google Scholar] [CrossRef]
  31. Nielson, B.G. Analytical Fragility Curves for Highway Bridges in Moderate Seismic Zones; Georgia Institute of Technology: Atlanta, GA, USA, 2005. [Google Scholar]
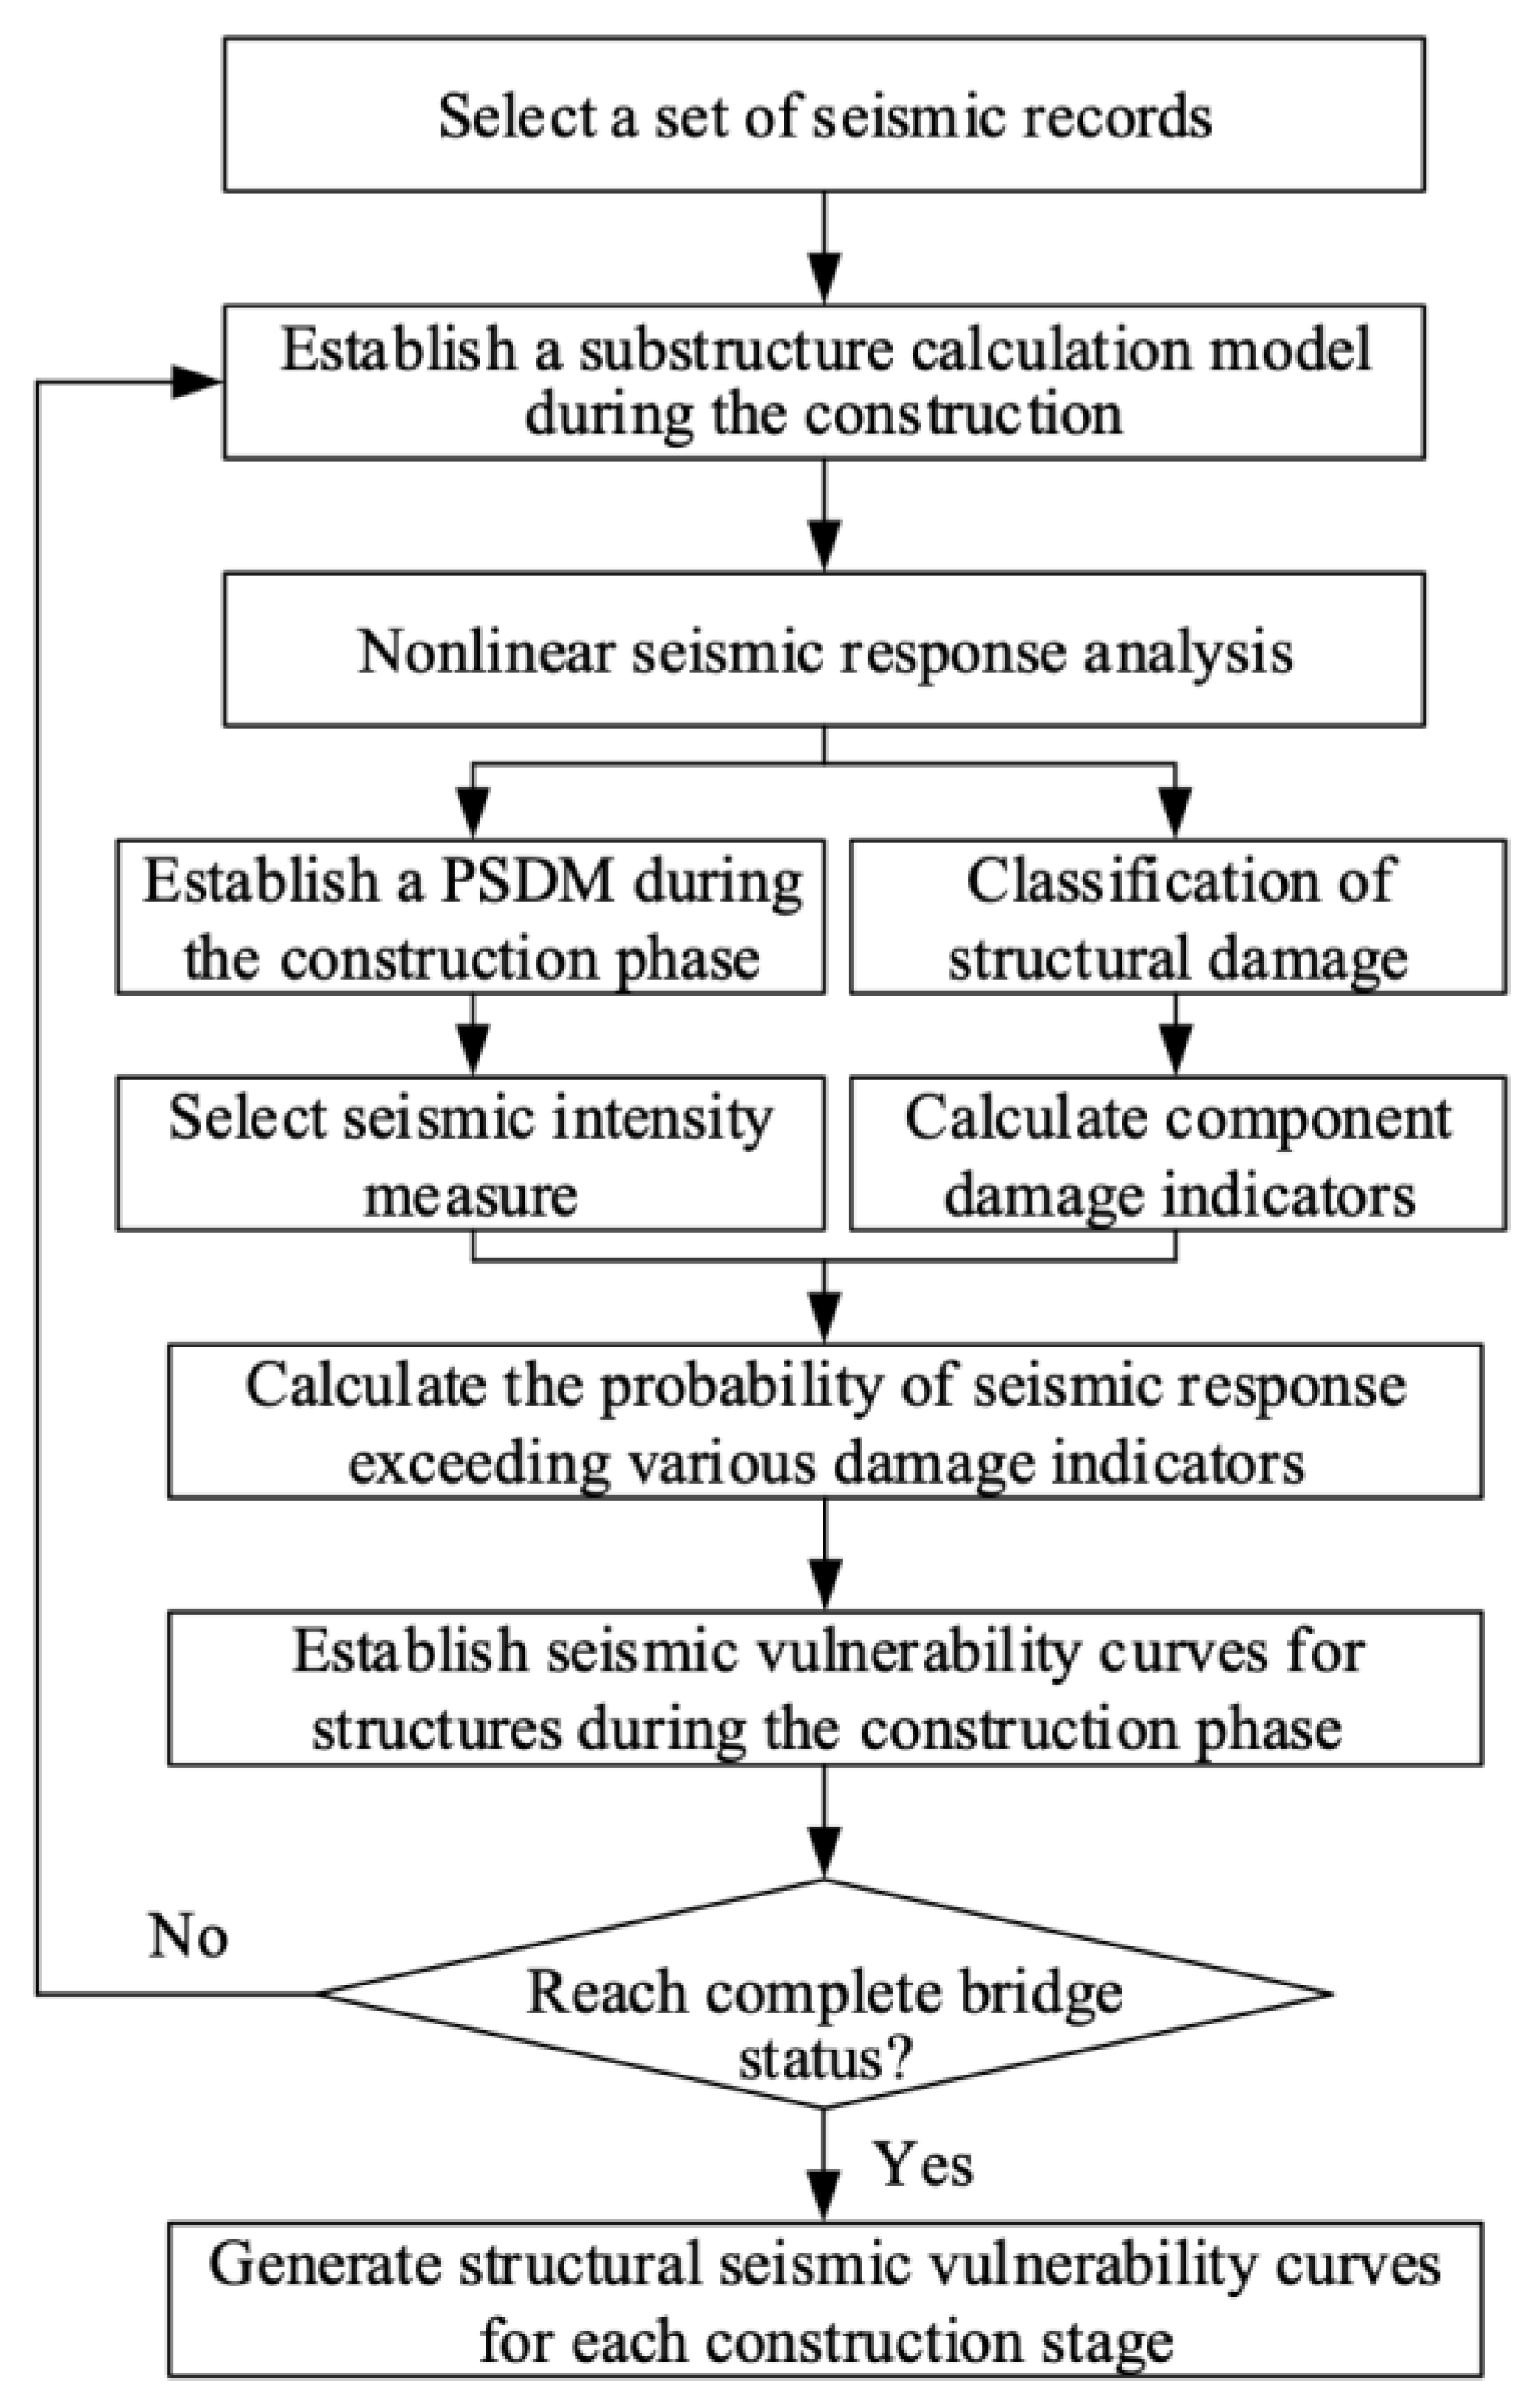
Figure 1. Generation process of seismic vulnerability curve during construction phase.
Buildings 13 01598 g001
Figure 2. Layout of the reconstructed continuous girder bridge.
Buildings 13 01598 g002
Figure 3. Cross sectional diagram of the girder (Unit: m): (a) Cross sectional view of fulcrum; (b) Cross section view of mid-span position.
Buildings 13 01598 g003
Figure 4. Elevation of temporary bearing for main pier.
Buildings 13 01598 g004
Figure 5. Schematic diagram of FEM of pier, temporary scaffold, and temporary bearing.
Buildings 13 01598 g005
Figure 6. 80 ground motions from PEER: (a) PGA-epicentral distance- magnitude distribution; (b) The linear acceleration spectra.
Buildings 13 01598 g006
Figure 7. Seismic vulnerability curves of a pier in partial construction state under horizontal bidirectional earthquake: (a) Segment No. 0; (b) Segment No. 1; (c) Segment No. 2; (d) Segment No. 9; (e) Segment No. 10; (f) Segment No. 11.
Buildings 13 01598 g007
Figure 8. Damage probability distribution of a pier at each construction state when the horizontal bidirectional IM is 0.8 g.
Buildings 13 01598 g008
Figure 9. Seismic vulnerability curves of a pier in partial construction state under three-directional earthquake: (a) Segment No. 0; (b) Segment No. 1; (c) Segment No. 2; (d) Segment No. 9; (e) Segment No. 10; (f) Segment No. 11.
Buildings 13 01598 g009aBuildings 13 01598 g009b
Figure 10. Damage probability distribution of a pier at each construction state when three-directional IM is 0.8 g.
Buildings 13 01598 g010
Figure 11. Seismic vulnerability curves of temporary bearings during partial construction under bidirectional earthquake: (a) Segment No. 0; (b) Segment No. 1; (c) Segment No. 2; (d) Segment No. 9; (e) Segment No. 10; (f) Segment No. 11.
Buildings 13 01598 g011aBuildings 13 01598 g011b
Figure 12. Temporary bearing damage probability distribution at each construction state when the horizontal bidirectional IM is 0.8 g: (a) Slight damaged; (b) Moderate damaged.
Buildings 13 01598 g012
Figure 13. Seismic vulnerability curves of temporary bearings during partial construction under three-directional earthquake: (a) Segment No. 0; (b) Segment No. 1; (c) Segment No. 2; (d) Segment No. 9; (e) Segment No. 10; (f) Segment No. 11.
Buildings 13 01598 g013
Figure 14. Comparison of seismic vulnerability curves between the most unfavorable construction state and the completed bridge state: (a) Stage of construction approaching closure; (b) State of bridge completion.
Buildings 13 01598 g014
Figure 15. Comparison of damage probability between construction and completed bridges.
Buildings 13 01598 g015
Table 1. EDPs and damage indicators.
EDPsDS-1DS-2DS-3DS-4
Coefficient of pier bottom
curvature (µϕx)
1µϕVϕV 4µϕV 8µϕV
Bearing shear coefficient (µV)26.66--
Note: µϕy is the initial curvature coefficient.
Disclaimer/Publisher’s Note: The statements, opinions and data contained in all publications are solely those of the individual author(s) and contributor(s) and not of MDPI and/or the editor(s). MDPI and/or the editor(s) disclaim responsibility for any injury to people or property resulting from any ideas, methods, instructions or products referred to in the content.