Article

Ground Surface Deformation Caused by Pipe Jacking Construction in a Soft Soil Area: An Experiment-Based Study

1
School of Civil Engineering, Sichuan Agricultural University, Chengdu 611830, China
2
Sichuan Higher Education Engineering Research Center for Disaster Prevention and Mitigation of Village Construction, Sichuan Agricultural University, Chengdu 611830, China
3
Institute of Mountain Hazards and Environment, Chinese Academy of Sciences, Chengdu 610041, China
*
Author to whom correspondence should be addressed.
Buildings 2023, 13(7), 1628; https://doi.org/10.3390/buildings13071628
Submission received: 11 May 2023 / Revised: 18 June 2023 / Accepted: 19 June 2023 / Published: 27 June 2023
(This article belongs to the Section Building Structures)

Abstract

:
Soft soil has the characteristics of high compressibility, large void ratio, and strong structure. Therefore, it is more likely to cause surface subsidence or even surface cracking and collapse when laying oil and gas pipelines in soft soil areas through the pipe jacking method. In this study, test soil was pressurized using a flexible loading bladder, and variable formation losses brought on by pipe jacking were mimicked by varying the loading bladder’s water injection level. The surface deformation brought on by pipe jacking construction is related to the four parameters of stratum loss rate, overburden load, soil disturbance, soil tension fissures, and horizontal deformation. The findings demonstrate that the surface deformation brought on by the excavation gradually reduces and starts to stabilize after the thickness of the overlying soil layer on the pipe jacking surpasses 1.5 times the diameter of the pipe jacking. The constructed settling tank is broader the deeper the jacking pipe is submerged. Further ground surface settling will be exacerbated by the weight above the jacking pipe. The maximum ground surface deformation value will decrease with an increase in the overlying load when the overlying load is high (0.018 MPa).

1. Introduction

Pipe jacking construction is a commonly used non-excavation technology [1]. The use of this non-excavation technology to build tunnels has the benefits of high cross-sectional area utilization, shallow burial depth, no interruption of ground road traffic, and less environmental pollution. Recently, pipe jacking construction technology has been widely used in subway stations, urban underground space development, buried piping, and other projects [2]. However, pipe jacking construction is a highly complex and uncertain process, will result in some ground movement and subsidence [3,4,5], and will cause surface cracking and ground deformation when the surface deformation of the crossing section exceeds a certain threshold, leading to serious accidents like damage to nearby buildings and damage to underground pipelines, affecting the safe operation and use of pipelines and surface buildings [6] and causing serious property losses [7].
Many academics have investigated the potential ground deformation and associated issues produced by pipe jacking construction in soft soil locations using techniques like the mathematical analysis method and model experiment method, with monitoring data and construction experience at the construction site. Peck’s empirical formula technique, which is now the most used, uses the suggested normal distribution of the ground deformation trough to obtain the empirical formula for surface deformation [8]. According to engineering practice, Hong et al. [9] established a new mathematical model considering the radial offset of pipe jacking. Huang et al. [10] used the space matrix transformation method to calculate the parameters of the specified position of a pipe jacking machine. Shou et al. [11] comprehensively considered factors such as soil pressure static balance, pipe surface friction, and the driving force behind the pipe string, and the jacking force of curved pipe jacking was theoretically studied. Zhen et al. [12] used the finite strip method (FSM) to analyze the main elastic buckling behavior of steel pipe jacking under axial compression Pasternak foundation. Xiao et al. [13] evaluated the effectiveness of the pipe jacking construction scheme by comparing it with the results of degradation analysis, finite difference analysis, and model tests.
Among the studies related to model experiments, Nomoto et al. [14] studied the compression of soil, lateral and longitudinal ground deformation, and earth pressure acting on the pipe sheet during the advance of pipe jacking machines and made a miniature pipe jacking machine. Jia et al. [15] conducted experimental research on the flexural performance of CFST composite structures and proposed a new type of pipe roof structure known as steel pipe sheet (STS) construction. Yang et al. [16] studied the jacking force of densely arranged pipeline jacks through large-scale similar model tests and engineering measured data and analyzed the jacking force in different positions during the model test. Dong et al. [17] tested the stable bearing capacity of pipe jacking under three working conditions, and verified the accuracy of finite element analysis through the test results. Senda et al. [18] discussed the condition of the cavity at the end of deep pipe jacking construction through numerical analysis. Han et al. [19] used numerical simulation to study the effect of pipe jacking. They focused on the factors that mainly influenced the surface deformation of the ground, including in situ stress release rate (or ground loss ratio), chamber pressure, elastic modulus of the soil, buried depth, and diameter of the pipe. Ma et al. [20] studied the distribution characteristics and variation patterns of ground settlement during pipe jacking construction and conducted a series of numerical simulations to study the impact of cover layer thickness. Wang et al. [21] used the three-dimensional discrete element method (3DDEM) to conduct large-scale model tests and numerical simulations in parallel.
The previous research has discussed the ground deformation brought on by the pipe jacking construction method in soft soil areas [22], but there are still some shortcomings, such as not taking into account how soft soil peculiarities affect ground deformation and the facts that existing model experimental studies rarely take the overlying load into account and the research scope is primarily restricted to vertical deformation [23], without describing and studying other issues brought on by pipe jacking (such as surface cracks, etc.) [24]. It is shown that the surface deformation trough caused by a single tunnel fits well with the Peck curve, where the maximum deformation Smax and the horizontal distance i to the inflection point define the shape of the curve [25,26], and the soil volume loss Vs and the tunnel volume loss Vt describe the magnitude of the ground motion (Figure 1 shows the details of the defined parameters Smax, i, Vt, and Vs). Due to the law of surface deformation caused by the pipe jacking construction method in soft soil areas [27], this paper adopts model experiments to investigate the influence of factors on the ground deformation during pipe jacking construction [28,29,30,31]. It also analyzes the size of ground deformation for specific engineering calculations of pipe jacking in soft soil areas, as well as the maximum ground deformation in soft soil areas and the overlying load [32,33]. The findings could offer some theoretical justification and support for a project’s safe development [34].

2. Materials and Methods

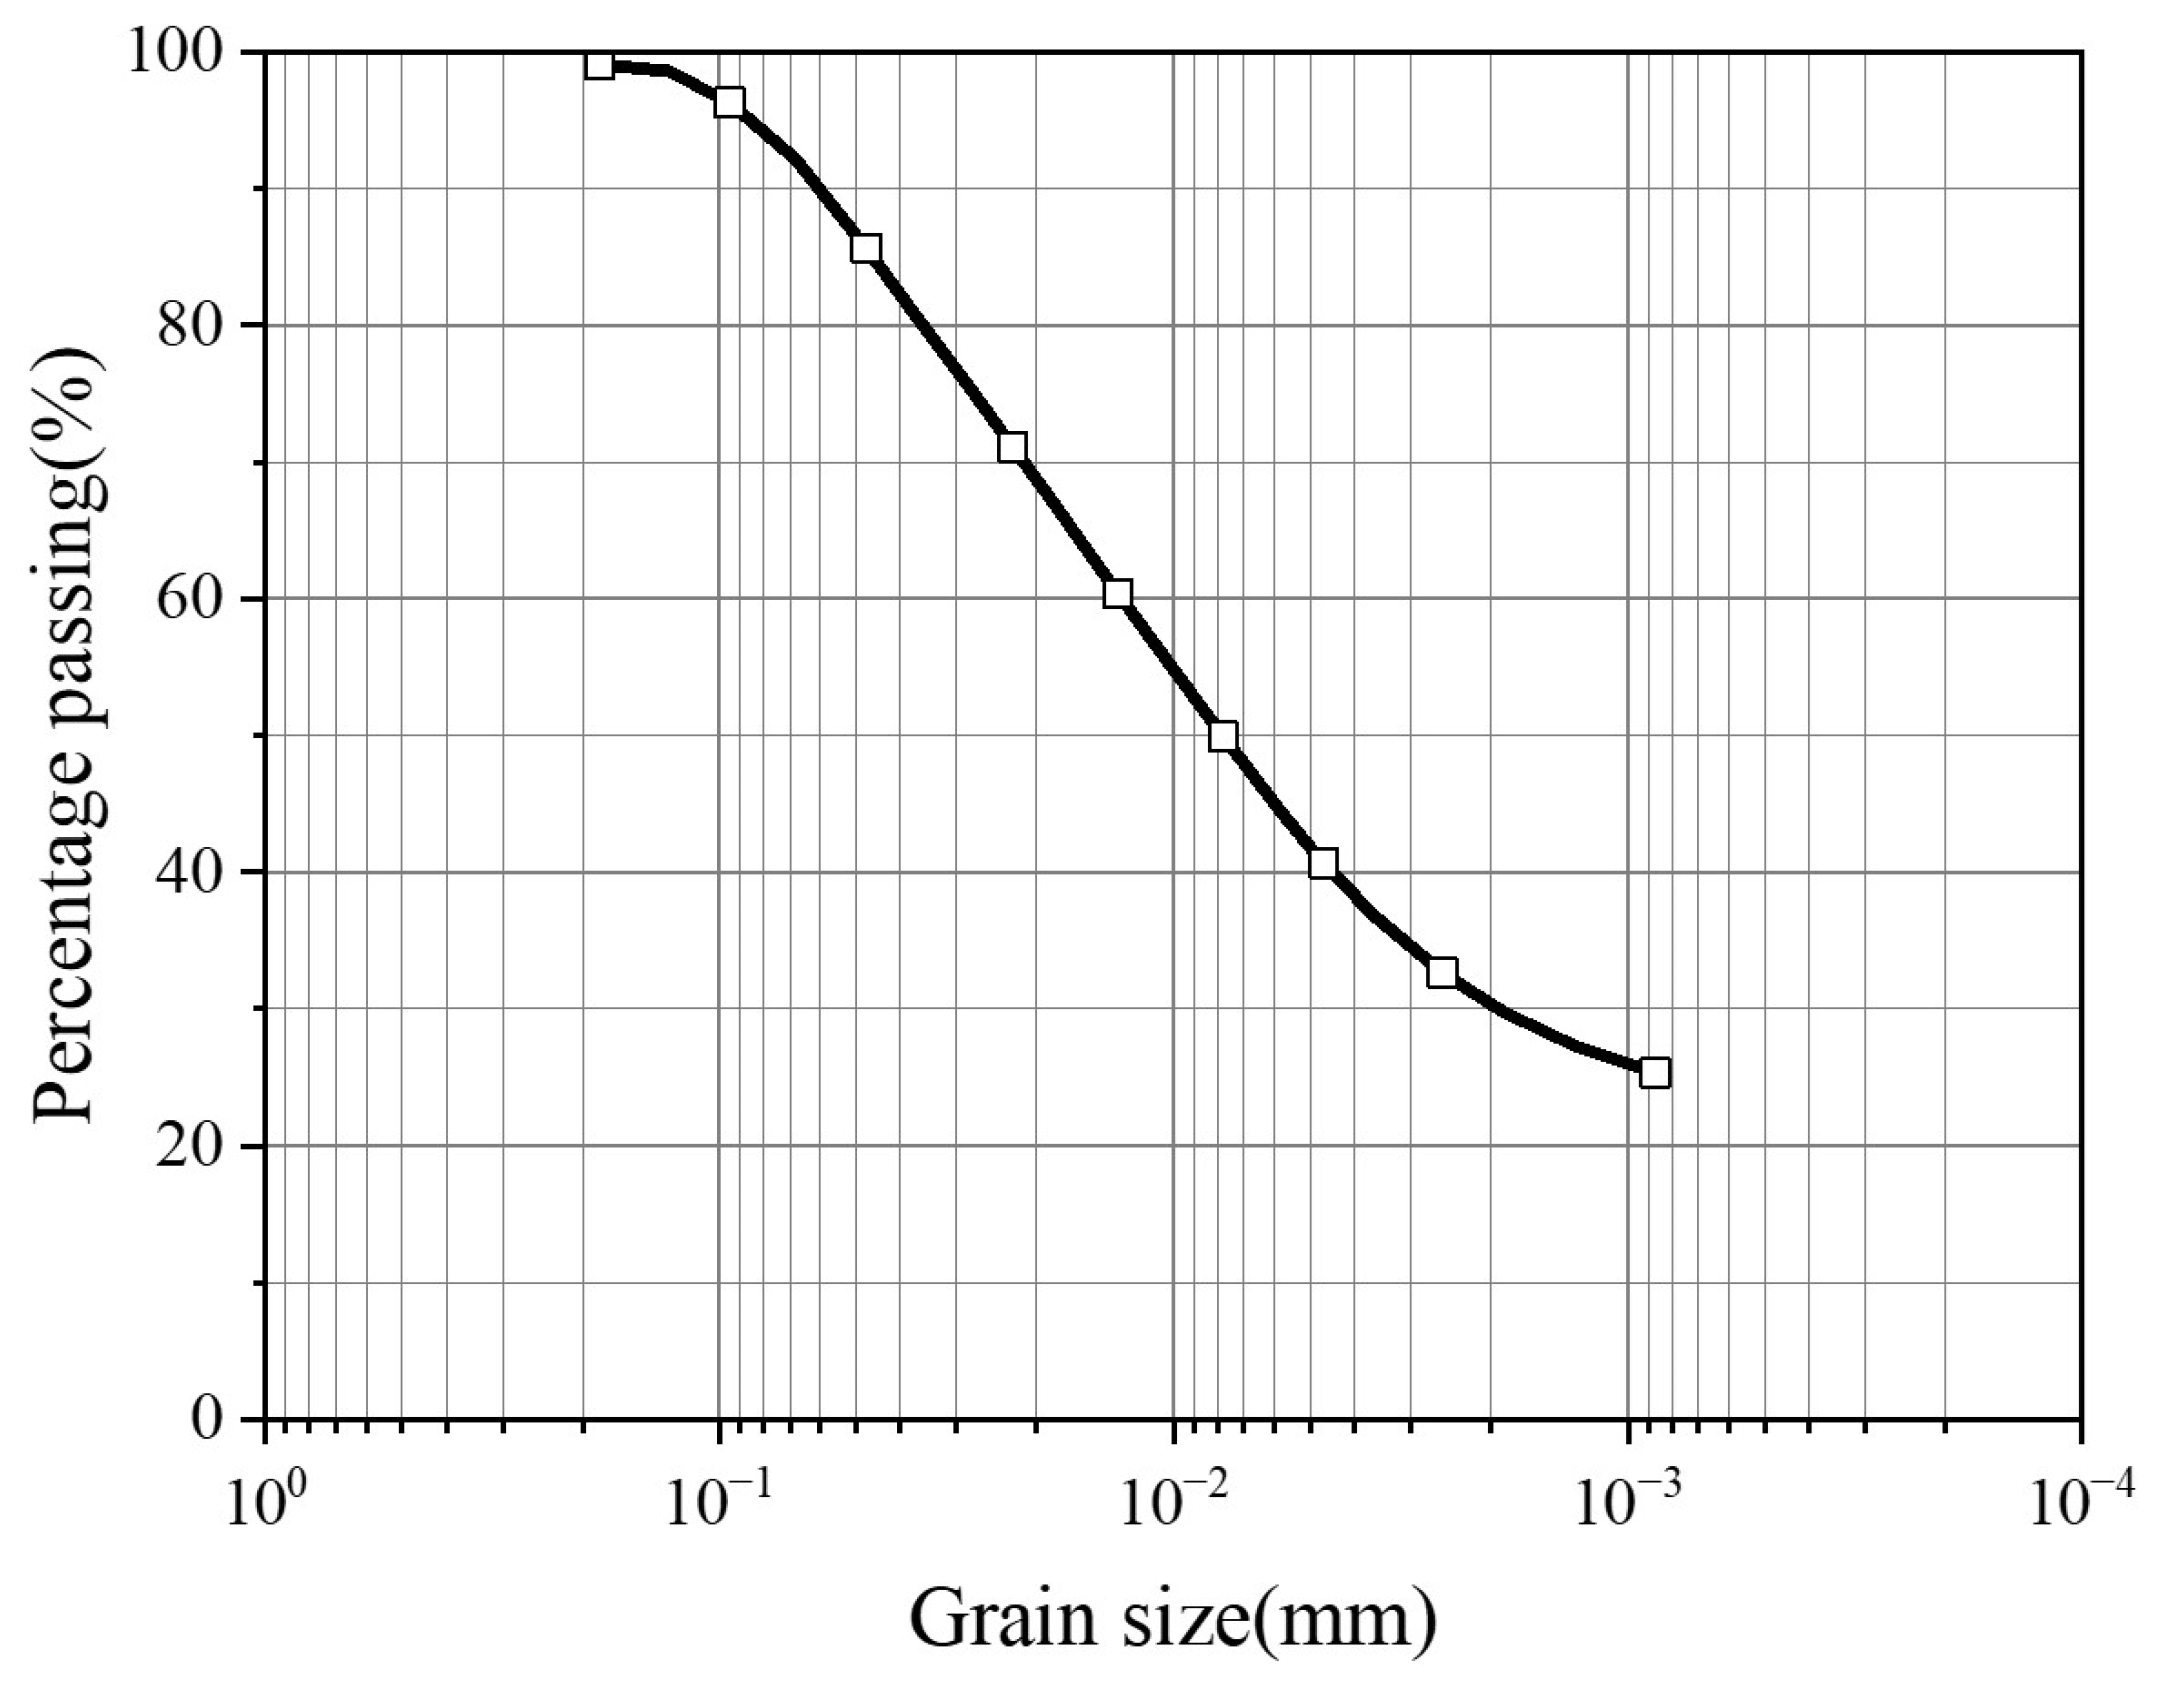
The experimental soft soil sample was acquired from the Longtan Temple region of Chenghua District, Chengdu, Sichuan Province (shown in Figure 2). The unified soil classification technique determined that the experimental soil sample type was powder clay after measuring the fundamental physical characteristics of the soft soil using a direct shear experiment and consolidation experiment (shown in Table 1), which yielded a weight of 1770 kg/m3 (see Figure 3).

2.1. Instrumentation

The instrumentation used in the study includes pipe jacking model apparatus, a flexible loading water bladder, pressurized jack, model experiment box, 3D laser scanner (Trimble FX), and related measurement instruments, as shown in Figure 4.

2.2. Experiment Flume

The model experimental box is made of a 10 mm thick high-strength steel plate and has front and back tempered glass window panels, bottom panels, side panels, and a reaction frame. The width of the experimental box must be larger than the estimated ground deformation trough width, and the width, thickness, and height of the internal soil body are 1800 mm × 600 mm × 1000 mm (as shown in Figure 5). The overlying load will be applied to the soil body and the measurement points will be layout on the soil surface during the experiment (shown in Figure 6). The box plate thickness is designed to meet the corresponding stress and deformation requirements.

2.3. Flexible Loading Bladder

The experimental flexible loading bladder (shown in Figure 7) has a lateral loading bladder and a vertical flexible loading bladder. During the experiment, the lateral flexible loading bladder is attached to the left inner wall of the model box, and the hole in the center of the left wall of the model box allocated for the water injection conduit is opened. In this experiment, the use of a jack, rigid loading plate, and flexible loading capsule for loading can better adapt to the soil deformation and completely respond to the development of surface deformation.

2.4. Cylindrical Water Bladder

The cylindrical water bladder (shown in Figure 8) is an experimental device for simulating formation loss triggered by pipe jacking construction, characterized by the fact that the said simulated pipe jacking consists of a cylindrical water bladder and a water inlet with an outer diameter of 260 mm, a wall thickness of 3 mm, and a length of 600 mm.

2.5. Counterweight Frame and Jack

During the experiment, by adjusting the hydraulic jack (shown in Figure 9), the soil overburden load level can be adjusted to reflect the effect of different overburden loads in the actual project, which means it is convenient to study the influence law of pipe jacking burial depth and overburden load size on the ground deformation.

2.6. Measuring Instruments

(i)
Pressure measurement system
During soil pressurization, the magnitude of the pressure value on the soil surface is recorded and stabilized at the pre-designed pressure value. Therefore, during the pressurization process using the jack, the water pressure gauge outside the vertical loading water bladder is positioned on the contact surface of the soil and the flexible loading bladder and readings are taken. The range of the pressure gauge is 0~0.06 MPa, as shown in Figure 8. In addition, while vertical loading, the lateral loading air bladder is inflated and made up to one fifth of the vertical loading bladder to be used to simulate the lateral stress of the soil in the actual stratum.
(ii)
Volumetric measurement
In the experiment, the water-filled cylindrical water bladder is first immersed in the experimental soil. During the experiment, the cylindrical water is released according to varying loss rates of the soil. At this time, according to the parameters designed before the experiment, the valve is opened and a measuring cylinder is used to measure the volume of water released, and the valve is closed when the volume of water released reaches a predetermined value.

2.7. Experimental Methods

Soil Sample Preparation

The experimental soil samples are placed into the model box separately in layers after basic treatment, and each layer is made up of 10 cm of soil and compacted to a weight of 1770 kg/m3. After the soil samples are laid, the lateral flexible loading bladders and vertical loading bladders are installed, and the counterforce frame, jacks, and other equipment are installed. After the installation, the soil is left to stand for about 24 h to allow it to settle before the subsequent operation.
After the soil has settled moderately, the vertical loading water bladder, water inlet valve, pressure gauge, etc. are assembled, and then one-way compaction and consolidation are carried out. A vertical pressure of 9.8 kPa is applied to the experimental soil in the first stage, and when the change curve of its main deformation is stabilized, the first stage of compaction is considered to be completed, followed by the next stage of compaction. The compaction stresses in the second and third stages are 19.6 kPa and 49 kPa, respectively, and the compaction time in each stage is about 12 h.
When the soil is filled to a predetermined height, the water-filled cylindrical water bladder is buried in the soil and the water inlet valve is closed. Under the condition that the surface soil is not disturbed as much as possible, the vertical loading bladder is put in place, water is injected and the water inlet valve is closed, the rigid loading plate is placed on the vertical water bladder, the counter frame jack, etc. are installed, and the experiment is started after the soil settles and stabilizes.
The outer diameter size of the top pipe in the actual project is 2.4 m, so the top pipe selected in the experiment is 0.24 m in diameter. According to the geometric similarity ratio, the burial depth of the top pipe in the experiment is 0.19 m, 0.24 m, 0.36 m, and 0.48 m, and the overburden load of the top pipe is 0.01 MPa, 0.015 MPa, 0.018 MPa, and 0.020 MPa, respectively. The resulting ground loss rate parameters are 2%, 4%, 6%, and 8%, and the released water volume is 637 mL, 1272 mL, 1908 mL, and 2544 mL, respectively (shown in Table 2).

3. Experimental Results

Ground deformation was monitored using a scanner for various overburden loads, C/D (depth to diameter ratios), and ground loss rates at each monitoring site in the model experiment. Alternative Playwork was used to compile the measured experimental results, which are summarized in Table 3, Table 4, Table 5 and Table 6.
Table 3 displays the variation in surface deformation for different overlying loads and different distances from the center of the pipe. As the load increases, the surface deformation gradually increases. However, as the distance from the center of the pipe increases, the surface deformation decreases. At a distance of 0 cm from the center of the pipe and a load of 0.020 MPa, the maximum surface deformation is 22.14 mm, and at a distance of 60 cm from the center of the pipe and a load of 0.01 MPa, the minimum surface deformation is around 1.12 mm.
In addition, the surface deformation due to different distances from the center of the pipe and the ground loss rates were collected for a burial depth of 0.24 m, i.e., a C/D of 1. The relevant results are summarized in Table 4. As the ground loss rate increases, the surface deformation also increases gradually. However, the surface deformation shows a decreasing trend as the distance from the center of the pipe increases. The maximum surface deformation is 19.52 mm at an 8% ground loss rate and 0 cm from the center of the pipe, and similarly, at a 2% ground loss rate and 60 cm from the center of the pipe, the surface deformation is 0 cm.
Similarly, the surface deformation for different distances from the center of the pipe and ground loss rates for a pipe jacking depth of 0.36 m when the C/D is 1.5 can be seen in Table 5. As the ground loss rate increases, the surface deformation also increases gradually. However, the surface deformation shows a decreasing trend as the distance from the center of the pipe increases. The maximum surface deformation is 12 mm at 8% ground loss and 0 cm from the center of the pipe, and similarly, it is 0 cm at 2% ground loss and 50 cm from the center of the pipe.
From the data in Table 6, it is apparent that the surface deformation shows a decreasing trend as the distance from the center of the pipe increases. For example, the maximum surface deformation is 2.78 mm at 8% ground loss is and 0 cm from the center of the pipe.

4. Discussion

Ground Loss Ratio and Ground Deformation

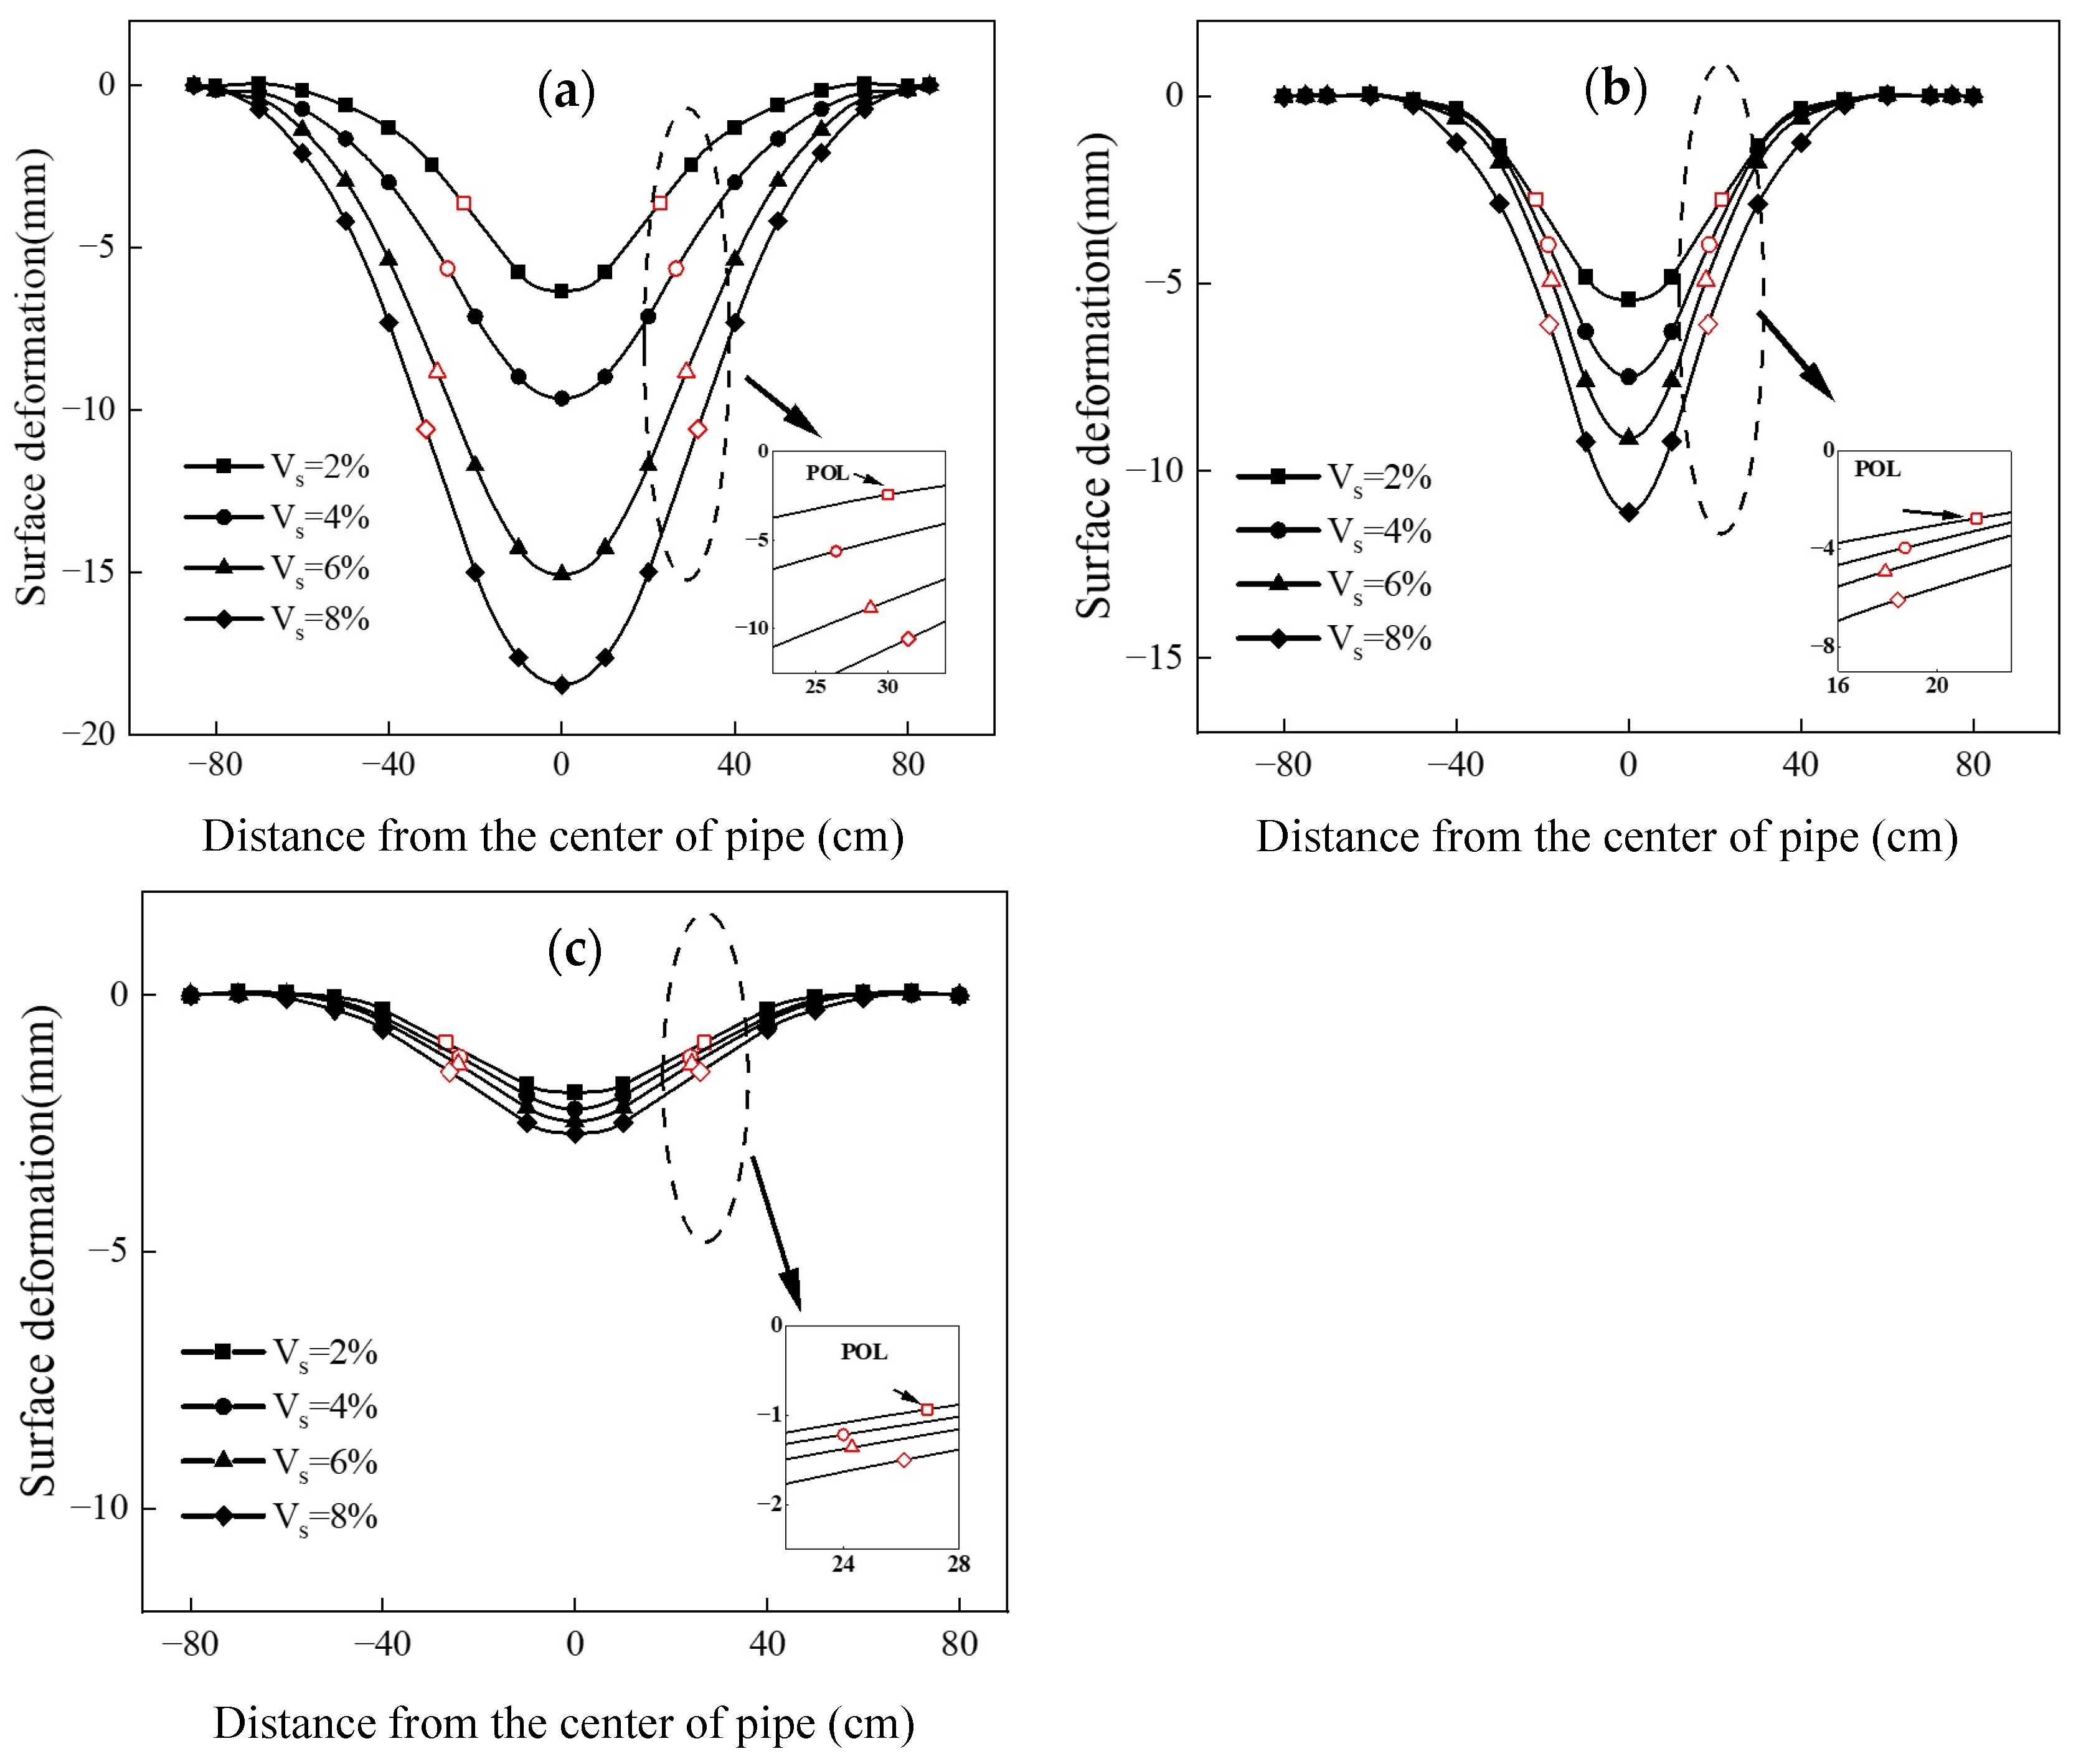
According to the analysis of the lateral deformation of the ground surface caused by the pipe jacking construction in soft ground [35,36], the soil layer of the crossing section is disturbed and over-excavated due to the excavation of the pipe jacking [37], which changes the original soft soil stress equilibrium state and makes the soil outside the pipe jacking machine surge into the pipe diameter void and form the soil loss (ground loss). The ratio between the volume of soil per unit length of soil into the pipe diameter gap volume ∆V and the volume of pipe jacking V0 is called the soil loss ratio (VL%), which is the main cause of ground deformation caused by pipe jacking construction and is an important assessment basis for pipe jacking safety consideration [38]. The relationship between the soil loss rate and ground deformation is further discussed in this section [39]. Based on the surface deformation caused by the collected loss rate of different strata, the corresponding fitted curves are drawn. Figure 10 shows the fitted curves of the surface deformation in the experiment of the jacking model with different stratigraphic loss rates.
Figure 10 depicts the effect of the distance from the center of the top pipe and the ground loss rate on the surface deformation for different depth to diameter ratios. As can be seen from Figure 10, the surface displacement gradually decreases as the depth to diameter ratio, i.e., the burial depth of the pipe, increases. This indicates that the high shear strength of the deep soil body and the small effect of additional stresses can produce smaller surface displacements. When the burial depth of the pipe jacking is 0.24 m, i.e., the depth to diameter ratio is 1.0, the maximum surface deformation value is obtained at the center of the pipe jacking. When the ground loss rate is 8%, the surface deformation is −19.52 mm. In the same experiment with three different pipe jacking depths of 0.24 m, 0.36 m, and 0.48 m, the maximum surface deformation value varies similarly with the ground loss rate. The greater the ground loss rate, the greater the surface deformation.
In Figure 10, the fitted curves of surface deformation are drawn for three sets of experimental data, the fitted curves are quadratically derived, and the horizontal coordinates of the intersection of the second derivative function and the x-axis are the width of the deformation tank. When the burial depth of the top pipe is 0.24 m, the coordinates of its curve reverse bend points (POL) are (22.7, −3.63), (26.4, −5.64), (28.8, −8.83), and (31.4, −10.59), respectively; when the burial depth of the top pipe is 0.36 m, the coordinates of its curve reverse bend points are (21.6, −2.76), (18.7, −3.96), (17.9, −4.93), and (18.4, −6.96), respectively; when the burial depth of the top pipe is 0.48 m, the coordinates of its curve reverse bend points are (26.9, −0.935), (24.0, −1.216), (24.3, −1.36), and (26.1, −1.5), respectively. In the three sets of coordinates, the difference between the bend points at different ground loss rates is less in the horizontal direction but further apart in the vertical direction at larger depth to diameter ratios, i.e., larger burial depths of the pipes. Therefore, the experiments show that for an increase in the width factor of the lateral deformation groove, the increase in the ground loss rate is less obvious.
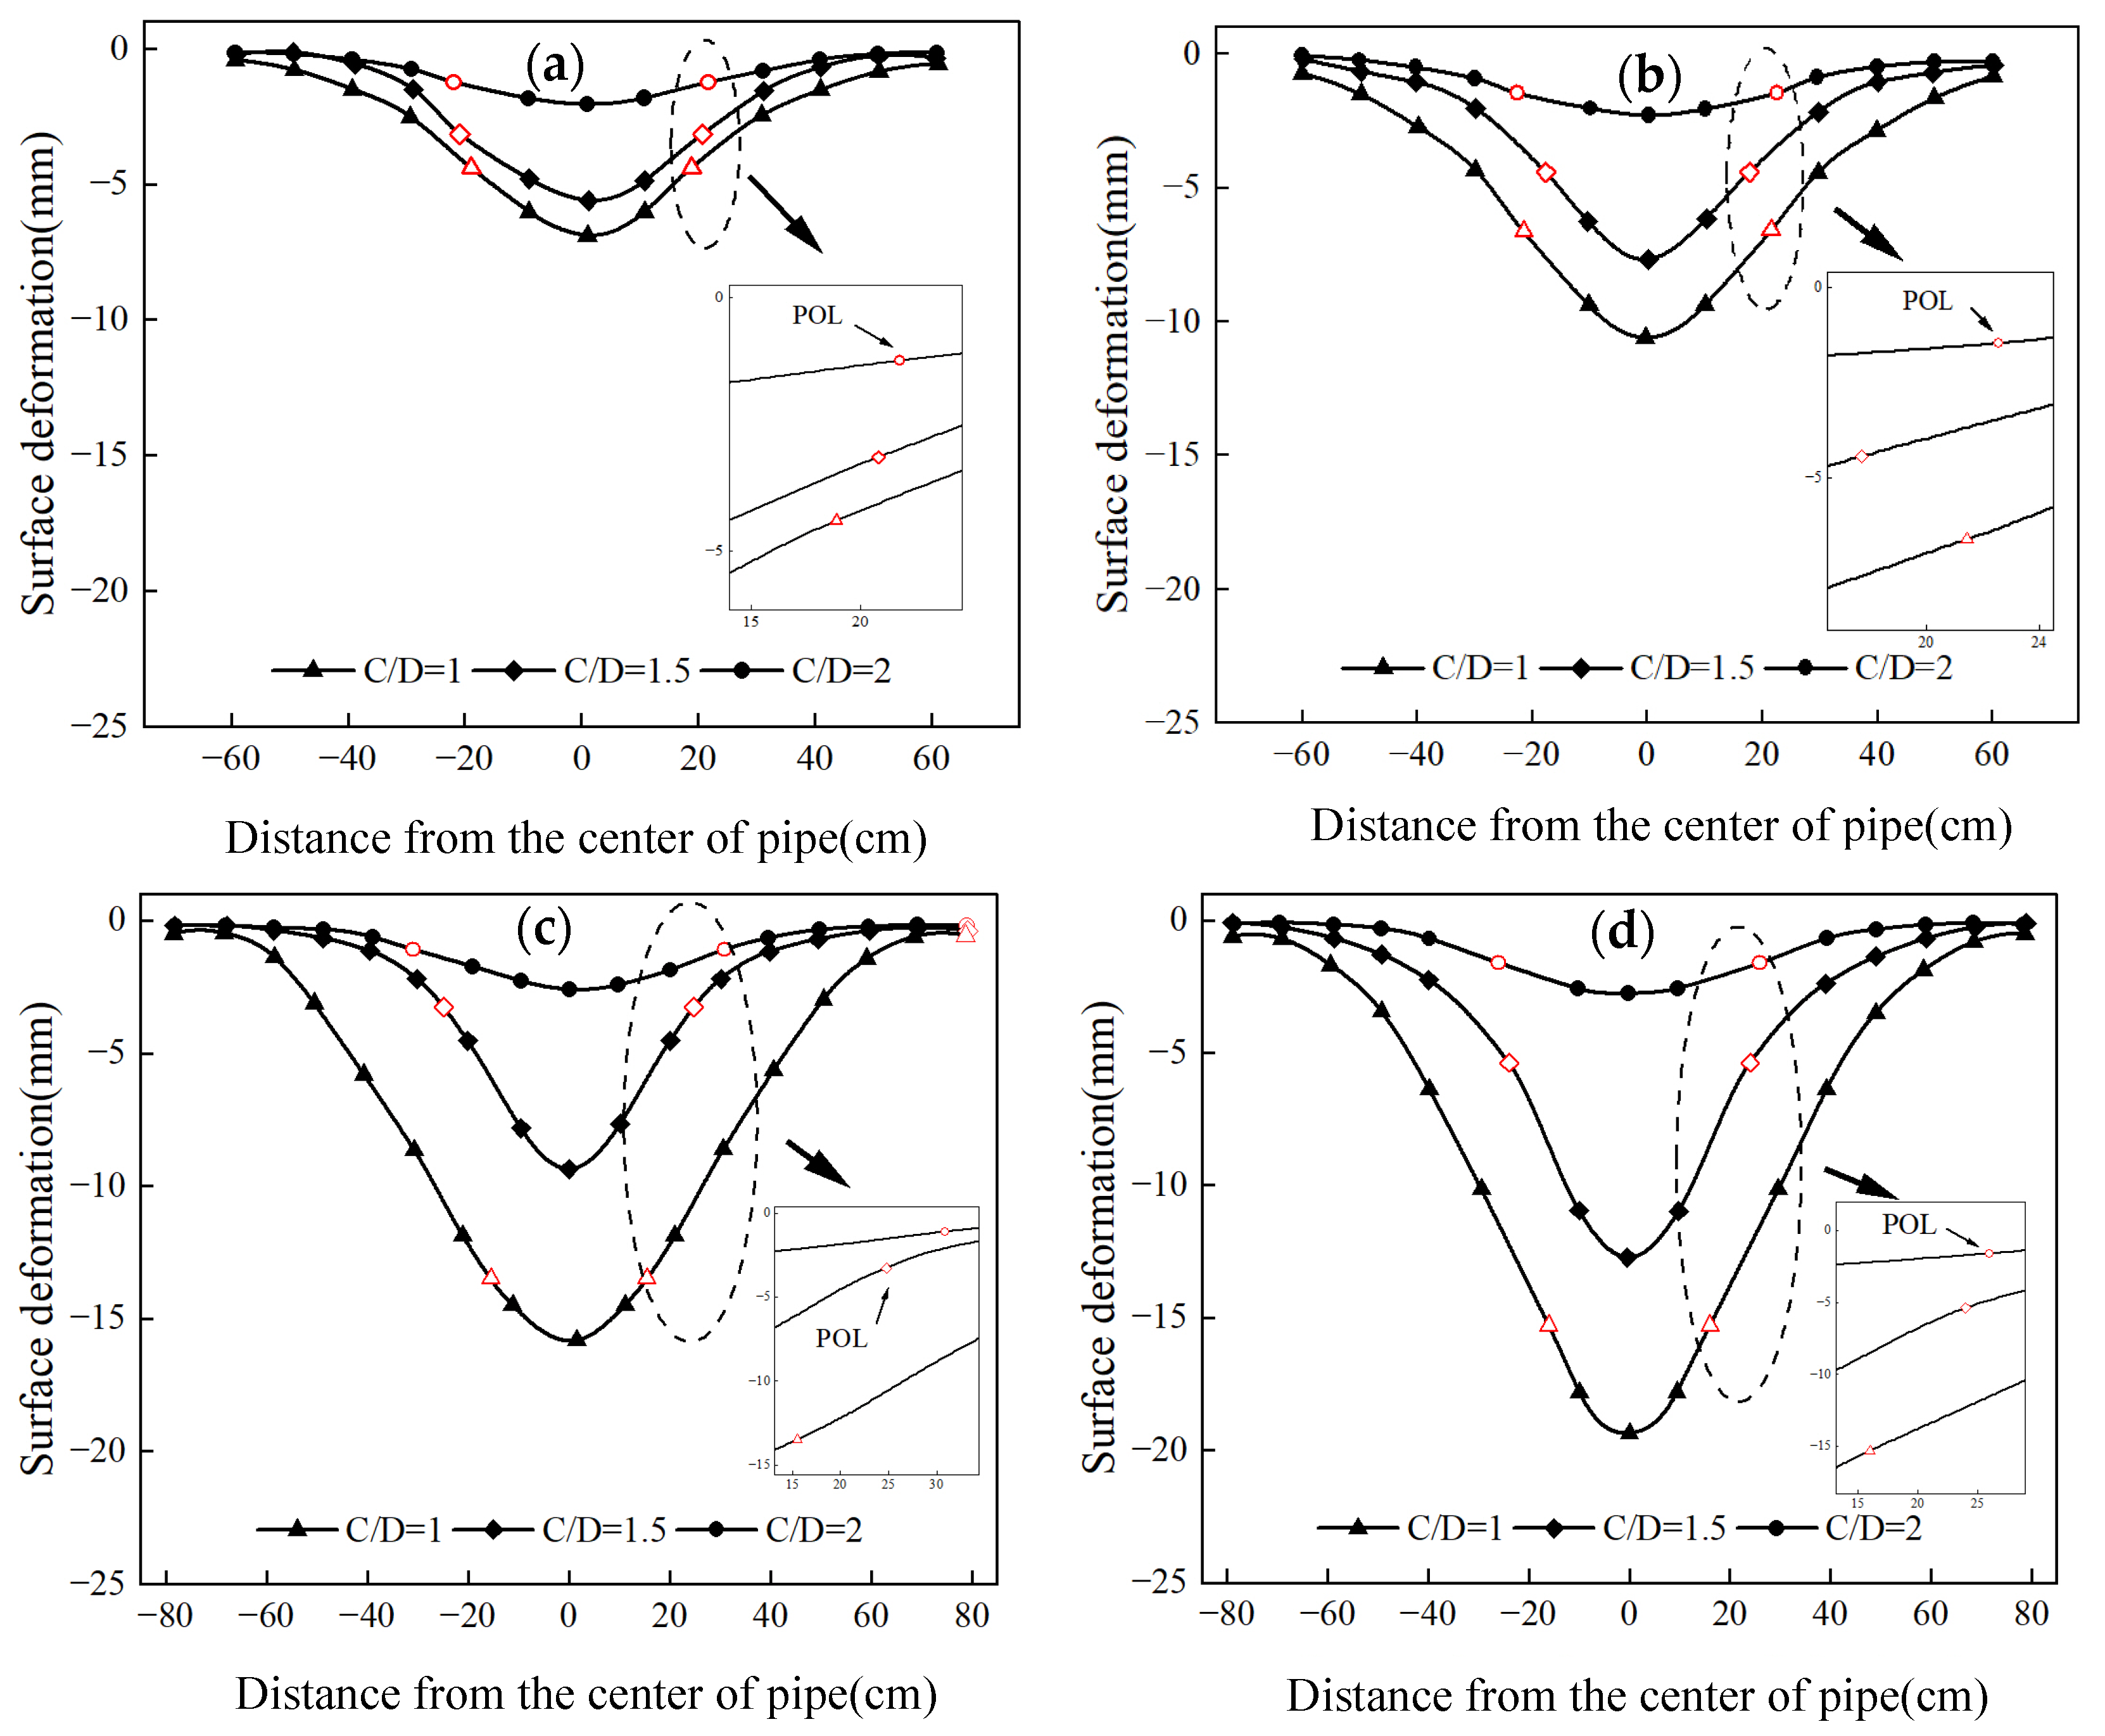
As shown in Figure 11a–d, under the circumstance of a certain burial depth of the pipeline, the larger the ground loss ratio is, the larger the maximum deformation value of the surface is. The maximum deformation value caused by different ground loss rates varies greatly for very shallow burial depth, and the effect of the ground loss rate becomes smaller as the burial depth of the pipeline becomes larger. The mechanism of the effect of burial depth on ground deformation in actual construction is the thinner the overburden layer, the smaller the soil pressure, and the more sensitive the overburden is to the top pushing force, frictional resistance, stress release, and other disturbances, so it is easy to produce deformation. When the depth to diameter ratio (C/D) is 1, the deformation brought by 2% stratum loss is 7.32 mm and the deformation brought by 8% stratum loss is 19.52 mm, which is 3.7 times 2%; when the depth to diameter ratio is 2, the deformation brought by 8% stratum loss is essentially the same as that of 2%, showing a trend of gradual decrease.
It was found that the deformation trough distribution pattern of lateral deformation under different overlying loads can also be described using Peck’s normal chance regression curve. Under the condition that the pipe is buried at a certain depth and ground loss rate, the higher the overburden load, the higher the maximum deformation value of the ground surface and the wider the deformation trough width at the same time. Figure 12 shows the variation in ground deformation with increasing overburden load at 0 cm, 10 cm, 20 cm, 30 cm, 40 cm, 50 cm, and 60 cm from the center of the pipe jacking.
When the overburden load is small, the trend of the maximum deformation value with the overburden load is faster. When the overburden load is larger, the trend of the maximum deformation value with the overburden load is relatively slow. This means that the influence of overburdened load on ground deformation gradually decreases as the soft soil consolidates and compacts. Therefore, in the actual project, it is necessary to avoid the structures above the pipe jacking construction as much as possible to reduce the influence of additional stresses on the surface deformation caused by the overlying load.
To facilitate the illustration of the influence of the ground loss, the depth to diameter ratio C/D, and the distance from the center of the pipe, Figure 13 demonstrates the surface deformation for different distances from the center of the pipe and ground loss. The results show that when the depth to diameter ratio (C/D) is constant, the greater the ground loss, the smaller the distance from the pipe center, and the greater the surface deformation. However, when the distance from the center of the pipe and the ground loss are constant, the larger the depth to diameter ratio (C/D) and the smaller the surface deformation. The size relationship of surface deformation is as follows: the depth to diameter ratio (C/D) = 1 > (C/D) = 1.5 > (C/D) = 2.
From Figure 14, an increasing trend in the value of Z/D can be observed with the development of the 2i/D; the results indicated that 2i/D has a linear relationship with the Z/D in the different model test. These experimental results also appeared in other research experiments.
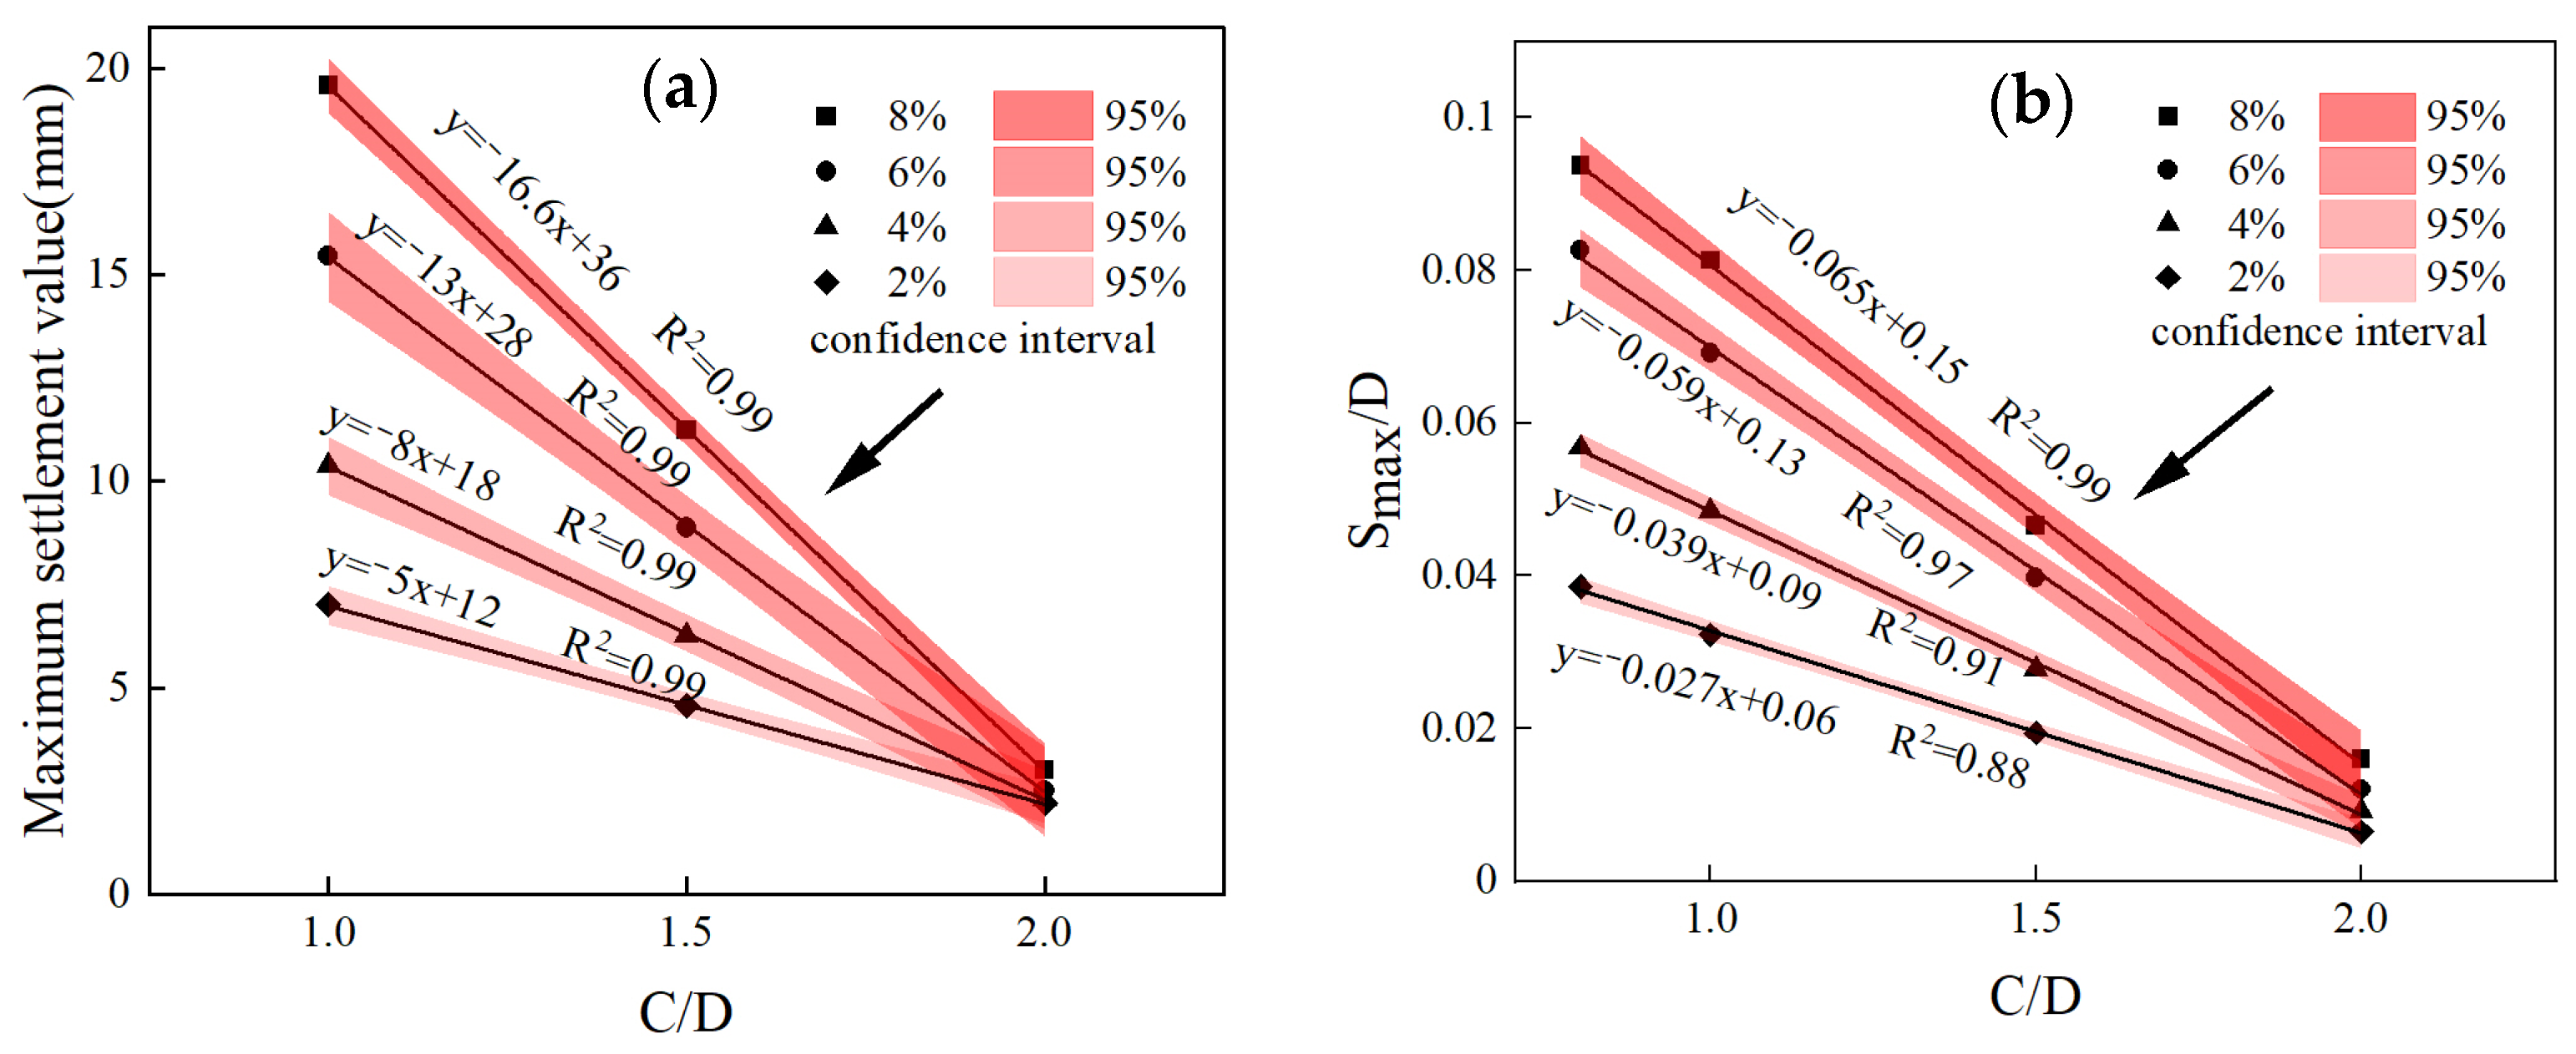
The relationship between the ground maximum deformation value and C/D are shown in Figure 15a. The results show that ground maximum deformation values have a linear relationship with C/D. The confidence interval was introduced as an indicator to evaluate the goodness of fit of the curves. Moreover, the fitting curve will change with the different ground loss ratios (Vs = 2%, 4%, 6%, 8%). As seen in Figure 15b, the Smax/D value was shown to linearly decrease with the value of C/D; it is also noted that the Smax/D value shows the same trend with different ground loss ratios (Vs = 2%, 4%, 6%, 8%).

5. Conclusions

This paper presented the results of physical model tests performed to study the pipe jacking-induced surface deformation in soft soil. The following conclusions can be drawn based on the results of the work:
(1) Surface deformation for different distances from the center of the pipe and ground loss rates for a pipe jacking depth of 0.36 m when the C/D is 1.5. As the ground loss rate increases, the surface deformation also increases gradually.
(2) The results indicated that 2i/D has a good linear relationship with the Z/D in the different model test. The mathematical formula 2i/D = 0.45(Z/D) + 1.8 for predicting the width parameters of the settlement trough is obtained.
(3) Ground maximum deformation values have a linear relationship with C/D, especially when ground losses are small.
(4) The load above the jacking pipe will aggravate the further deformation of the ground surface. The maximum deformation value of the ground surface will slow down with the increase in the overlying load.

Author Contributions

Conceptualization, J.T. and D.H.; methodology, D.H.; software, Z.C.; validation, J.X., D.Z. and K.Z.; formal analysis, D.Z.; investigation, J.T.; resources, J.T.; data curation, D.Z.; writing—original draft preparation, Y.L.; writing—review and editing, D.Z.; visualization, J.X.; supervision, Z.C.; project administration, J.T.; funding acquisition, J.T. All authors have read and agreed to the published version of the manuscript.

Funding

This research was funded by Unsaturated Soil Mechanical Properties and Engineering Technology Sichuan Colleges Engineering Research Center (SC-FBHT2022-05), the National Natural Science Foundation of China (No. 42201079) and the West Light Talent Program of the Chinese Academy of Sciences (2019E0R2230230).

Institutional Review Board Statement

Not applicable.

Informed Consent Statement

Not applicable.

Data Availability Statement

The data used to support the findings of this study are available from the corresponding author upon request.

Conflicts of Interest

The authors declare no conflict of interest.

References

  1. He, J.; Liao, S.; Tan, Y.; Liu, M. Field Measurement on the Interaction between Socketed Pipes during Pipe-Roof Jacking in Soft Ground and Corresponding Surface Settlement. Tunn. Undergr. Space Technol. 2022, 130, 104769. [Google Scholar] [CrossRef]
  2. Bai, Q.; Zhang, Y.; Zhao, W.; Jia, P.; Li, S.; Wang, Z. Construction of Subway Station Using the Small Pipe Roof-Beam Method: A Case Study of Shifu Road Station in Shenyang. Tunn. Undergr. Space Technol. 2023, 135, 105000. [Google Scholar] [CrossRef]
  3. Cheng, M.; Lu, Y. Developing a Risk Assessment Method for Complex Pipe Jacking Construction Projects. Autom. Constr. 2015, 58, 48–59. [Google Scholar] [CrossRef]
  4. O’Dwyer, K.G.; McCabe, B.A.; Sheil, B.B. Interpretation of Pipe-Jacking and Lubrication Records for Drives in Silty Soil. Undergr. Space 2020, 5, 199–209. [Google Scholar] [CrossRef]
  5. Feng, X.; Zhang, P.; Chen, X.; Zhang, Y.; Ma, B.; Liu, K.; Xu, T.; Zeng, C. Field Mechanical Properties of Large Section Concrete Pipes during Jacking in Fractured Moderately Weathered Siltstone. Tunn. Undergr. Space Technol. 2023, 131, 104818. [Google Scholar] [CrossRef]
  6. Sterling, R.L. Developments and Research Directions in Pipe Jacking and Microtunneling. Undergr. Space 2020, 5, 1–19. [Google Scholar] [CrossRef]
  7. Zhang, C.; Zhang, Y.; Xia, Y.; Fang, H.; Zhao, P.; Wang, C.; Bin, L.; Pan, Y.; Zou, Z.; Rabczuk, T.; et al. Risk Assessment and Optimization of Supporting Structure for a New Recyclable Pipe Jacking Shaft during Excavation Process. Process Saf. Environ. Prot. 2023, 172, 211–224. [Google Scholar] [CrossRef]
  8. Liu, S.; Zhang, B.; Zhang, X.; Fan, D.; Wang, H.; Yu, M. Formulation Optimization and Performance Analysis of the Thixotropic Slurry for Large-Section Rectangular Pipe Jacking in Anhydrous Sand. Constr. Build. Mater. 2022, 357, 129380. [Google Scholar] [CrossRef]
  9. Hong, Z.; Hu, X.; Zhang, J. Mathematical Model of Temperature Field and Its Analytical Solution for Freeze-Sealing Pipe-Roof Method Induced by Radial Offset of Adjacent Jacking Pipes. Cold Reg. Sci. Technol. 2023, 205, 103699. [Google Scholar] [CrossRef]
  10. Huang, Z.; Shen, X.; Wang, L.; Xu, Y.; Yan, Q.; Cheng, E.; Xiao, H. A Low-Cost and Real-Time Pose Measurement Method for Straight Pipe Jacking Machine Based on Dual-Screen Laser Target in Tunneling Guidance. Measurement 2022, 195, 111110. [Google Scholar] [CrossRef]
  11. Shou, K.J.; Jiang, J.M. A Study of Jacking Force for a Curved Pipejacking. J. Rock Mech. Geotech. Eng. 2010, 2, 298–304. [Google Scholar]
  12. Zhen, L.; Qiao, P.; Zhong, J.; Chen, Q.; Chen, J.-J.; Wang, J.-H. Design of Steel Pipe-Jacking Based on Buckling Analysis by Finite Strip Method. Eng. Struct. 2017, 132, 139–151. [Google Scholar] [CrossRef]
  13. Xiao, T.; Ni, P.; Chen, Z.; Feng, J.; Chen, D.; Mei, G. A Semi-Analytical Solution for Consolidation of Ground with Local Permeable Pipe Pile. Comput. Geotech. 2022, 143, 104590. [Google Scholar] [CrossRef]
  14. Nomoto, T.; Imamura, S.; Hagiwara, T.; Kusakabe, O.; Fujii, N. Shield Tunnel Construction in Centrifuge. J. Geotech. Geoenviron. Eng. 1999, 125, 289–300. [Google Scholar] [CrossRef]
  15. Jia, P.; Nie, Y.; Shi, P.; Jiang, X.; Lu, B.; Zhao, W. Flexural Performance of a Novel Pipe-Roof Structure and Optimization of Key Parameters. J. Constr. Steel Res. 2022, 199, 107594. [Google Scholar] [CrossRef]
  16. Yang, S.; Wang, M.; Du, J.; Guo, Y.; Geng, Y.; Li, T. Research of Jacking Force of Densely Arranged Pipe Jacks Process in Pipe-Roof Pre-Construction Method. Tunn. Undergr. Space Technol. 2020, 97, 103277. [Google Scholar] [CrossRef]
  17. Dong, J.; Liu, H.; Lei, M.; Fang, Z.; Guo, L. Safety and Stability Analysis of Variable Cross-Section Disc-Buckle Type Steel Pipe High Support System. Int. J. Press. Vessel. Pip. 2022, 200, 104831. [Google Scholar] [CrossRef]
  18. Senda, T.; Maeda, Y.; Shimada, H.; Sasaoka, T.; Matsui, K. Studies on Surrounding Soil during Construction Using the Deep Pipe Jacking Method in the Deep Strata. Procedia Earth Planet. Sci. 2013, 6, 396–402. [Google Scholar] [CrossRef] [Green Version]
  19. Han, X.; Li, W.; Chen, T.; Liu, W. Sensitivity analysis of ground deformation induced by pipe-jacking construction in soft soil stratum. E3S Web of Conferences. EDP Sci. 2019, 136, 04028. [Google Scholar]
  20. Ma, S.; Li, M.; Jin, J.; Bai, K. The Influence of Shallow Buried Double-Line Parallel Rectangular Pipe Jacking Construction on Ground Settlement Deformation. Alex. Eng. J. 2021, 60, 1911–1916. [Google Scholar] [CrossRef]
  21. Wang, J.; Feng, K.; Wang, Y.; Lin, G.; He, C. Soil Disturbance Induced by EPB Shield Tunnelling in Multilayered Ground with Soft Sand Lying on Hard Rock: A Model Test and DEM Study. Tunn. Undergr. Space Technol. 2022, 130, 104738. [Google Scholar] [CrossRef]
  22. Deng, Z.; Liang, N.; Liu, X.; de la Fuente, A.; Lin, P.; Peng, H. Analysis and Application of Friction Calculation Model for Long-Distance Rock Pipe Jacking Engineering. Tunn. Undergr. Space Technol. 2021, 115, 104063. [Google Scholar] [CrossRef]
  23. Ji, X.; Zhao, W.; Ni, P.; Barla, M.; Han, J.; Jia, P.; Chen, Y.; Zhang, C. A Method to Estimate the Jacking Force for Pipe Jacking in Sandy Soils. Tunn. Undergr. Space Technol. 2019, 90, 119–130. [Google Scholar] [CrossRef]
  24. Wang, L.; Chen, X.; Su, D.; Liu, S.; Liu, X.; Jiang, S.; Gao, H.; Yang, W. Mechanical Performance of a Prefabricated Subway Station Structure Constructed by Twin Closely-Spaced Rectangular Pipe-Jacking Boxes. Tunn. Undergr. Space Technol. 2023, 135, 105062. [Google Scholar] [CrossRef]
  25. Ma, P.; Shimada, H.; Sasaoka, T.; Moses, D.N.; Matsumoto, F.; Chen, X. Investigation on the Engineering Effects of the Geometrical Configuration of the Jacking Rectangular Pipe. Tunn. Undergr. Space Technol. 2022, 119, 104239. [Google Scholar] [CrossRef]
  26. An, R.; Kong, L.; Shi, W.; Zhang, X. Stiffness Decay Characteristics and Disturbance Effect Evaluation of Structured Clay Based on In-Situ Tests. Soils Found. 2022, 62, 101184. [Google Scholar] [CrossRef]
  27. Lehmann, G.; Käsling, H.; Cambier, A.; Praetorius, S.; Thuro, K. Performance Analysis of Utility Tunneling Data: A Case Study of Pipe Jacking in Hard Rock in Brittany, France. Tunn. Undergr. Space Technol. 2022, 127, 104574. [Google Scholar] [CrossRef]
  28. Liu, X.; Xiong, F.; Zhou, X.; Liu, D.; Chen, Q.; Zhang, J.; Han, Y.; Xu, B.; Deng, Z.; He, C. Physical Model Test on the Influence of the Cutter Head Opening Ratio on Slurry Shield Tunnelling in a Cobble Layer. Tunn. Undergr. Space Technol. 2022, 120, 104264. [Google Scholar] [CrossRef]
  29. Tian, Y.; Motalleb Qaytmas, A.; Lu, D.; Du, X. Stress Path of the Surrounding Soil during Tunnel Excavation: An Experimental Study. Transp. Geotech. 2023, 38, 100917. [Google Scholar] [CrossRef]
  30. Xiao, Q.; Lei, S.; Cui, K.; Li, W.; Han, X.; Liu, J.; Huang, X.; Chen, S. Effect of the Longitudinal Local Wetting-Induced Collapse on Tunnel Structure in Loess Strata. Tunn. Undergr. Space Technol. 2022, 122, 104361. [Google Scholar] [CrossRef]
  31. Ahmed, A.; Islam, M.A.; Alam, M.Z.; Quazi, H.S. Surface Settlement Induced by Horizontal Directional Drilling. Undergr. Space 2023, 8, 94–108. [Google Scholar] [CrossRef]
  32. Olsen, T.; Kasper, T.; de Wit, J. Immersed Tunnels in Soft Soil Conditions Experience from the Last 20 Years. Tunn. Undergr. Space Technol. 2022, 121, 104315. [Google Scholar] [CrossRef]
  33. Ma, P.; Shimada, H.; Sasaoka, T.; Hamanaka, A.; Moses, D.N.; Dintwe, T.; Matsumoto, F.; Ma, B.; Huang, S. A New Method for Predicting the Friction Resistance in Rectangular Pipe-Jacking. Tunn. Undergr. Space Technol. 2022, 123, 104338. [Google Scholar] [CrossRef]
  34. Han, J.; Jia, D.; Yan, F.; Zhao, Y.; Liu, D.; Wang, Q. Construction Technology of Pipe Jacking Method through Underground Obstacles. J. Archit. Environ. Struct. Eng. Res. 2022, 5, 3. [Google Scholar] [CrossRef]
  35. Wang, Q.; Liu, Z.; Yang, G.; Wang, H. Research on Pipe Jacking Construction Technology Based on Upcrossing Metro and Cable Tunnel. IOP Conf. Ser. Earth Environ. Sci. 2021, 651, 042014. [Google Scholar] [CrossRef]
  36. Zhou, X.; Shi, P.; Xu, X.; Liu, W. Theoretical Prediction Models for Ground Settlement during Box Jacking. Mech. Adv. Mater. Struct. 2021, 29, 5588–5595. [Google Scholar] [CrossRef]
  37. Xu, T.; Wang, L.; Zhang, P.; Zhou, Y.; Liu, K.; Feng, X.; Qi, Y.; Zeng, C. Key Techniques for Rapid Jacking and Laying of Pipelines: A Case Study on “Jingshihan” Gas Pipelines in China. Energies 2022, 15, 2918. [Google Scholar] [CrossRef]
  38. Pan, T. Influences of Double-Track Shield Tunnel Construction on Settlements of Adjacent Ground and Buildings in a Soft Soil Area. Hydrogeol. Eng. Geol. 2022, 49, 101–108. [Google Scholar]
  39. Pan, Z.; Du, K.; Lv, F.; Tao, S. Numerical Simulation of Mechanical Response of Bridge Foundation and Existing Tunnel Caused by Pipe Jacking Construction. J. Phys. Conf. Ser. 2022, 2230, 012008. [Google Scholar] [CrossRef]
  40. O’Reilly, M.P.; New, B.M. Settlements above tunnels in United Kingdom-their magnitude and prediction. In Tunnelling’82 Symposium; Institution of Mining and Metallurgy: London, UK, 1982; pp. 173–181. [Google Scholar]
  41. Mair, R.J.; Taylor, R.N.; Bracegirdle, A. Subsurface settlement profiles above tunnels in clays. Géotechnique 1993, 43, 315–320. [Google Scholar] [CrossRef]
  42. Takemura, J.; Kimura, T.; Wong, S.F. Undrained Stability of Two-Dimensional Unlined Tunnels in Soft Soil. Doboku Gakkai Ronbunshu 1990, 418, 267–277. [Google Scholar] [CrossRef] [PubMed] [Green Version]
  43. Huang, Y.S.; Hwang, R.N.; Huang, T.L.; Yang, P.F. Settlement troughs over tunnels. In Symposium on Construction and Underpinning for Rapid Transit System; Sino-Geotechnics Development and Research Foundations: Kaushung, Taiwan, 1997. (In Chinese) [Google Scholar]
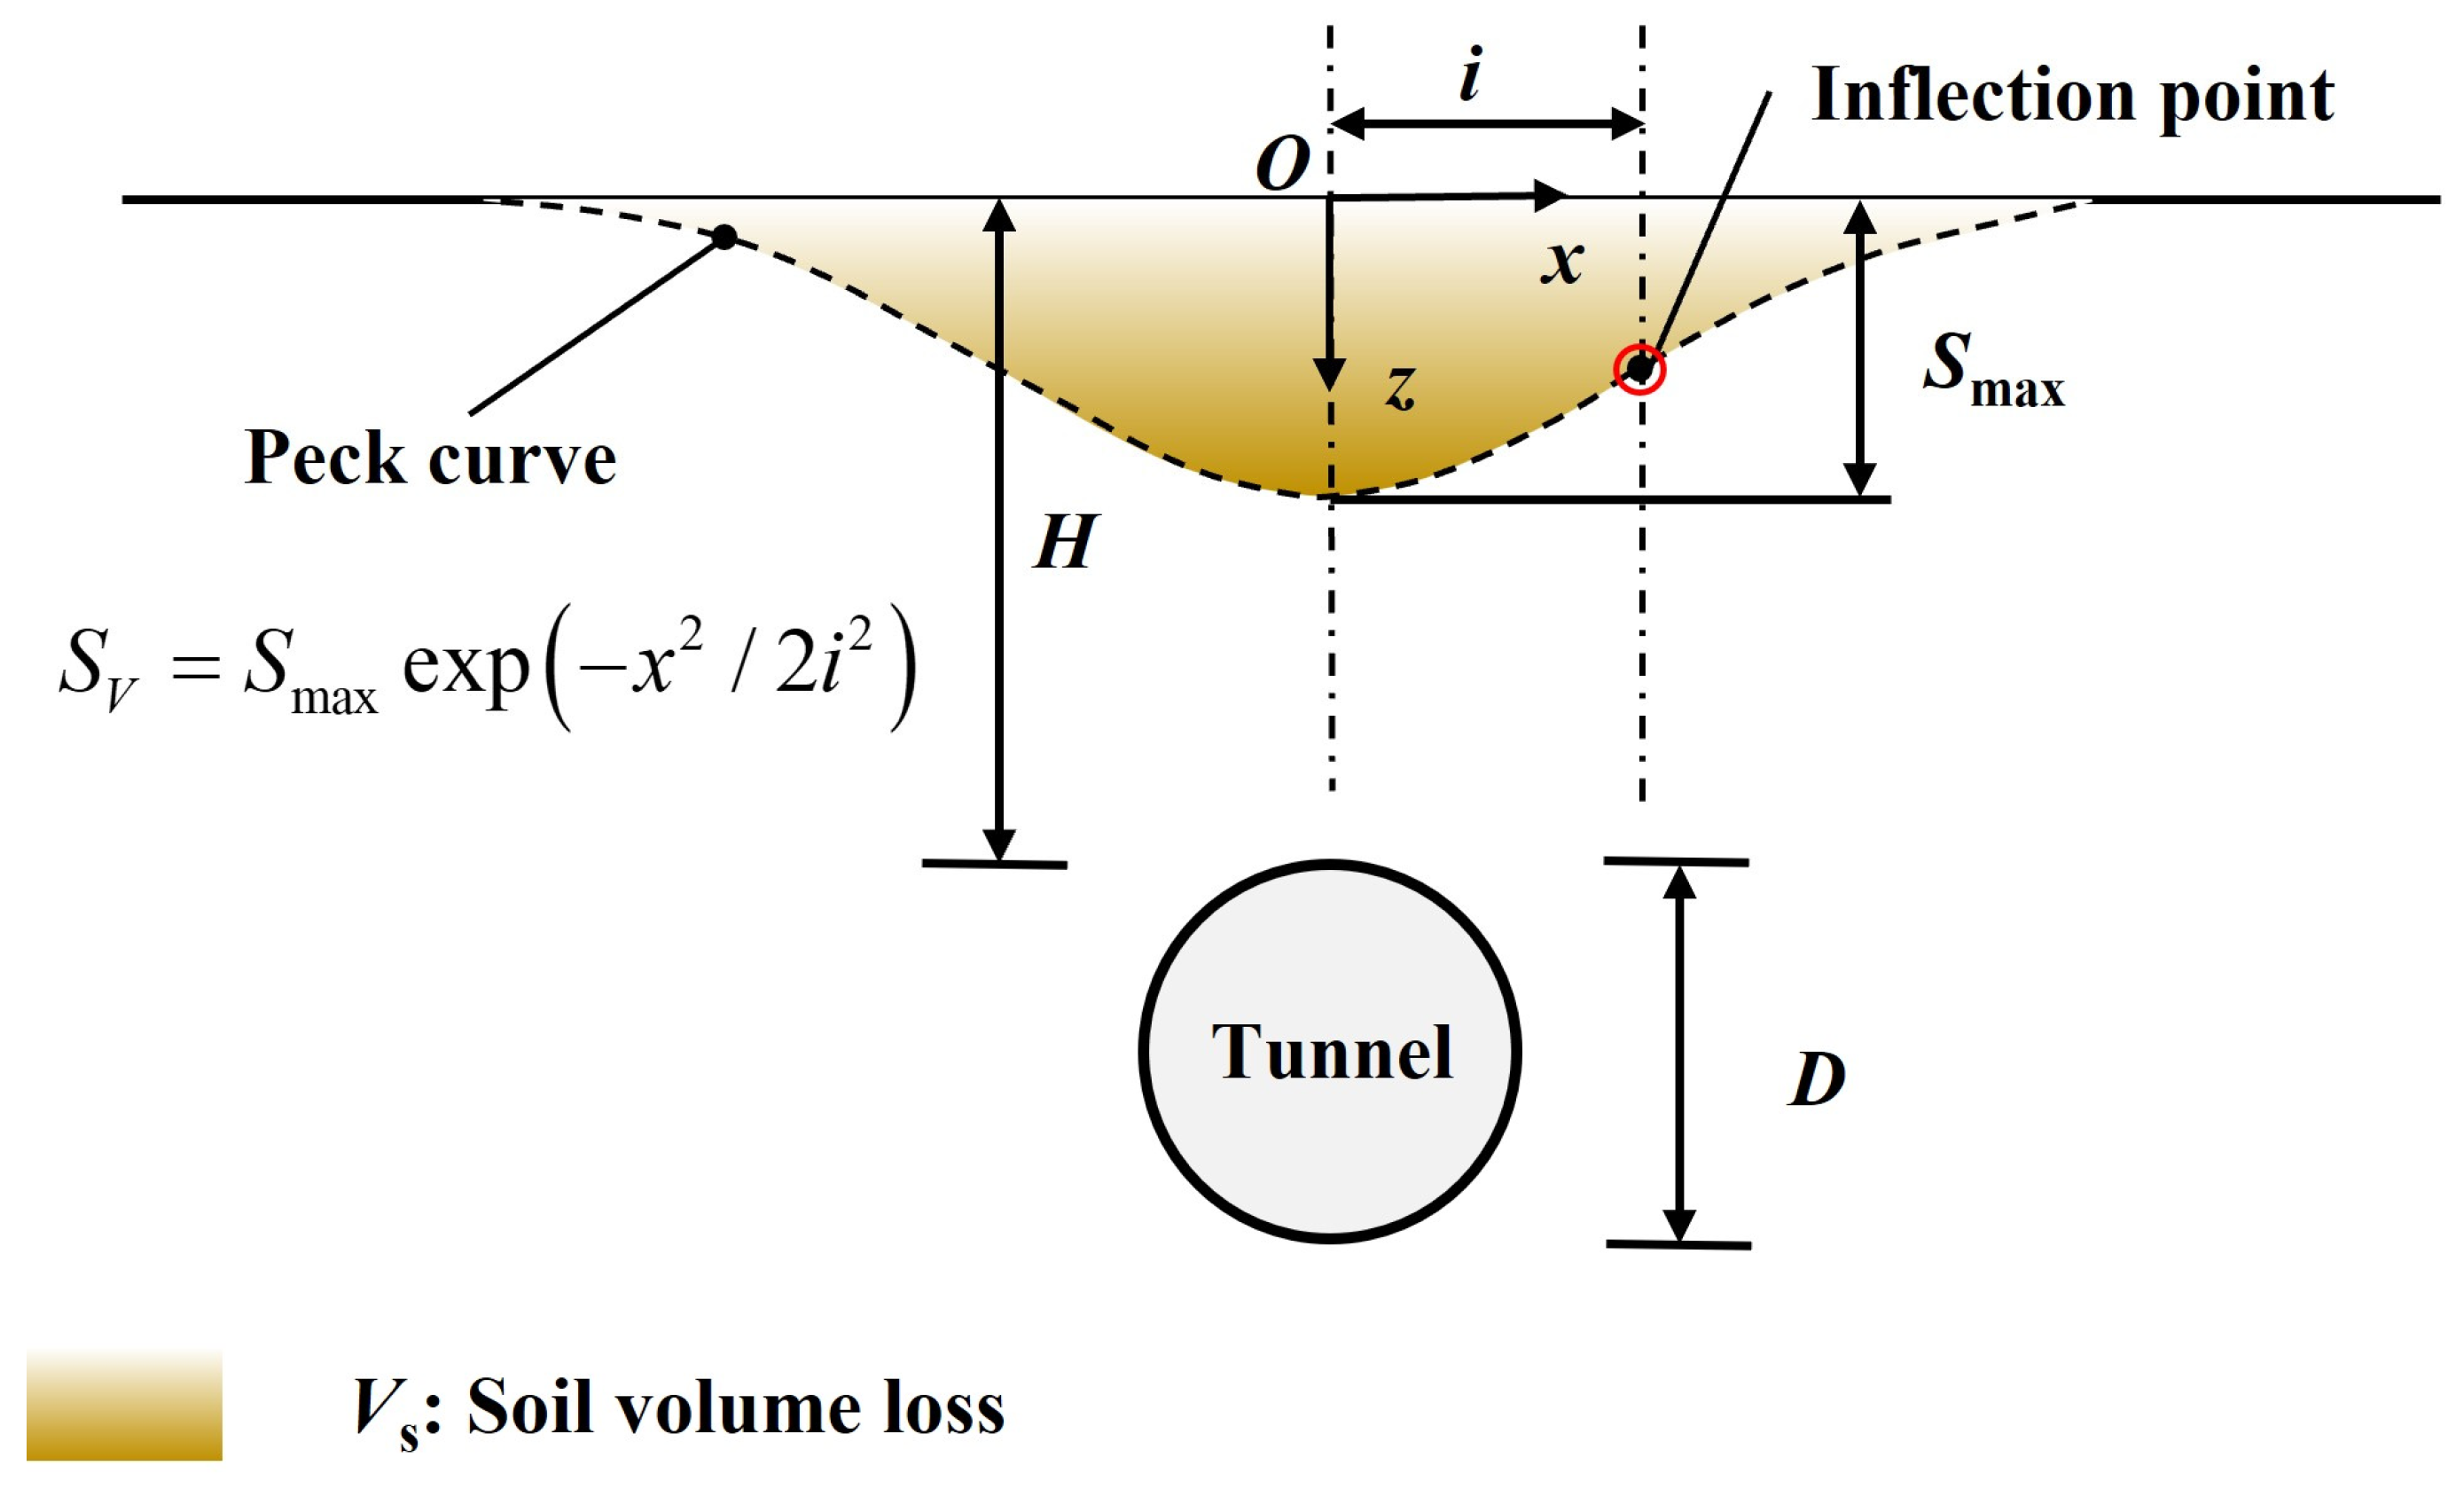
Figure 1. Surface deformation trough induced by a single tunnel.
Buildings 13 01628 g001
Figure 2. Soil sampling point.
Buildings 13 01628 g002
Figure 3. Particle size distribution map of experimental soil sample.
Buildings 13 01628 g003
Figure 4. Overall layout of the test system.
Buildings 13 01628 g004
Figure 5. Experiment flume.
Buildings 13 01628 g005
Figure 6. Locations of measurement points.
Buildings 13 01628 g006
Figure 7. Vertical flexible loading bladder.
Buildings 13 01628 g007
Figure 8. Cylindrical water bladder.
Buildings 13 01628 g008
Figure 9. Counterweight frame and jack.
Buildings 13 01628 g009
Figure 10. Fitting curves of the surface deformation under the experiment of the jacking model with different ground loss rates. (a) C/D = 1; (b) C/D = 1.5; (c) C/D = 2.
Buildings 13 01628 g010
Figure 11. The fitted curves of the surface deformation with different C/D and different overlying loads for ground loss ratio: (a) Vs. = 0.2, (b) Vs. = 0.4, (c) Vs. = 0.4, (d) Vs. = 0.8.
Buildings 13 01628 g011
Figure 12. Fitting curves of the surface deformation with the same C/D and different overlying loads.
Buildings 13 01628 g012
Figure 13. Cloud chart of ground deformation with different distances from the center of pipe and ground loss.
Buildings 13 01628 g013
Figure 14. Relationship between deformation trough width parameter and burial depth [40,41,42,43].
Buildings 13 01628 g014
Figure 15. (a)The fitting curves between ground maximum deformation value and C/D; (b) the fitting curves between Smax/D and C/D.
Buildings 13 01628 g015
Table 1. Basic physical properties of soft soil sample.
Soil TypeWater Content (w%)Density
kg/m3
Porosity RatioPlastic Limit (Wp%)Cohesion
(kPa)
Angle of Fiction (°)
Silty clay33.417700.95720.017.09
Table 2. General information for the model test.
GroupIIIIIIIV
Burial depth
(m)
0.190.240.360.48
Cladding loads
(MPa)
0.010.0150.0180.020
Ground loss rate
(%)
2468
Water volume
(mL)
637127219082544
Table 3. Summary table of surface deformation under different overlying loads.
LoadDistance from the Center of the Pipe
(cm)
0102030405060
0.01 MPa−15.12−10.42−5.16−3.21−2.11−1.21−1.12
0.015 MPa−18.52−14.74−9.54−4.74−3.24−1.50−1.24
0.018 MPa−21.62−16.18−10.51−6.62−4.57−1.76−1.27
0.020 MPa−22.14−18.73−13.19−8.55−5.53−3.01−1.51
Table 4. Summary of surface deformation at different ground loss rates for C/D = 1.
Ground Loss Rate (%)Distance from the Center of the Pipe
(cm)
01020304050607080
2%−7.32−5.80−3.62−2.40−1.22−0.84000
4%−10.17−9.14−6.81−4.84−2.91−1.53−0.81−0.24−0.11
6%−15.53−14.55−11.28−8.64−5.26−2.77−1.15−0.41−0.27
8%−19.52−17.72−14.12−11.61−7.75−3.20−1.73−0.83−0.32
Table 5. Summary of surface deformation at different ground loss rates for C/D = 1.5.
Ground
Loss Rate
(%)
Distance from the Center of the Pipe
(cm)
0102030405060
2%−5.51−4.82−3.17−1.01−0.5400
4%−7.5−6.5−3.54−1.20−0.61−0.080
6%−9.7−7.5−4.13−1.58−0.73−0.110
8%−12−9−5.17−3.10−1.12−0.230
Table 6. Summary of surface deformation at different ground loss rates for C/D = 2.
Ground
Loss Rate
(%)
Distance from the Center of the Pipe
(cm)
0102030405060
2%−1.91−1.75−1.35−0.73−0.3200
4%−2.23−1.96−1.45−0.87−0.44−0.110
6%−2.47−2.20−1.64−1.01−0.52−0.160
8%−2.78−2.45−1.93−1.20−0.74−0.22−0.12
Disclaimer/Publisher’s Note: The statements, opinions and data contained in all publications are solely those of the individual author(s) and contributor(s) and not of MDPI and/or the editor(s). MDPI and/or the editor(s) disclaim responsibility for any injury to people or property resulting from any ideas, methods, instructions or products referred to in the content.