Article

Risk of Microbial Growth in Ventilation Ductwork Located in the Humid and Cold Conditions

1
Department of Mechanical Engineering, School of Engineering, Aalto University, 02150 Espoo, Finland
2
Department of Environmental Sciences, University of Kuopio, 70211 Kuopio, Finland
3
Department of HVAC, College of Urban Construction, Nanjing Tech University, Nanjing 211800, China
4
Smart City Center of Excellence, TalTech, 19086 Tallinn, Estonia
*
Author to whom correspondence should be addressed.
Buildings 2023, 13(7), 1683; https://doi.org/10.3390/buildings13071683
Submission received: 19 May 2023 / Revised: 21 June 2023 / Accepted: 28 June 2023 / Published: 30 June 2023
(This article belongs to the Section Building Energy, Physics, Environment, and Systems)

Abstract

:
High humidity inside ductworks could be a potential risk for microbial growth and there is also a hypothesis that lower night-time ventilation increases the risk of growth. This study investigates the possibility of microbial growth in ventilation ductwork exposed to humid and cold conditions. Two different typical night-time ventilation strategies for public buildings were investigated: ventilation rate was either continuously the same (0.15 L/s, m2) or no airflow during the night-time. Experimental data were collected over a four-month period. In the experiment, microbial media was released inside the ductwork initially. During the test period, air temperature and relative humidity inside the ductwork were controlled between 11–14 °C and 70–90%. Wipe, swab and air samples were taken at the beginning, monthly and at the end of the test period. The study results showed the extinction of colonies by the end of the experiment regardless of the chosen night-time ventilation strategy. The colony count in the air was low throughout the study period. Therefore, the results indicate that the long-term growth on the walls of air ducts is unlikely and the risk of microbial transfer from the air ductworks to room space is low.

1. Introduction

Ventilation systems are essential to provide people with fresh and clean air. However, the systems may be subject to contamination by various microbial growth during operation. This challenge was described in earlier studies, and experiments were conducted to understand the possibility of such growth. According to the WHO, indoor air quality (IAQ) is one of the most important human health and well-being determinants. Thus, ventilation plays a significant role in the healthy indoor environment of a building [1]. Challenges in providing adequate IAQ may reduce productivity and increase sick building syndrome (SBS)-related symptoms, as promoted in several studies [2,3,4,5,6]. To ensure adequate IAQ in the European Union, EN15251 and EN 16798-1 give guidelines for indoor environmental criteria and building energy performance [7,8,9,10]. Some of these requirements are implemented in the building codes of the member countries [11]. However, even if the building ventilation system fulfils the requirements of the building codes in the design phase, system operation challenges may arise during the lifespan of the building.
One of the challenges of the ventilation system is fungal and bacterial growth due to dust accumulation, water condensation and other related factors [12]. Moisture damage, possibly leading to microbial growth, is caused when the material suffers prolonged exposure to humidity levels above its tolerance [13]. In addition to moisture, other parameters affecting the potential for microbial growth are temperature, relative humidity of room air and material type. Organic materials such as wood and paper are prone to fungal growth [14], whereas inorganic materials such as metals and glass are typically resistant. The ventilation systems are mostly made of inorganic materials, but the ductwork may accumulate dust, outdoor contaminants or moisture during use. If the system is contaminated, the air supplied by it may include fungi spores and bacterial colonies [15,16,17].
Indoor air heavily contaminated by fungi was suggested to induce mold allergy and fungi disease [18]. The common fungi Alternaria and Cladosporium and the xerophilic fungi are well-known causes of fungi allergy [19,20]. Thus, understanding the possibility of bacterial and fungal contamination of different parts of the ventilation system is essential.
It is widely reported that growth may occur in some air handling unit (AHU) components, such as filters with fiber structures, cooling coils and porous insulation material, fan coils and room units of split systems [21,22,23,24]. Studies on the most commonly used filters have revealed significant bacterial and fungal moist masses carried on filters [25,26]. Recent field studies show that public building filters may present a wide variety of fungal taxa with more than 12 species [27,28]. The cooling coils also provide humid conditions for bacterial and fungal growth. The studies indicate that the presence of water condensation enhances bioaerosol deposition behavior on the cooling coils [29,30,31,32]. The supply air is transported to room spaces via a long ductwork system; thus, the possibility of fungal and bacterial growth on its surfaces may significantly affect the supply air contamination level.
Previous studies indicate the possible risk of duct surface contamination and fungal growth in the ventilation ductwork. In one of the studies, the growth of incubated Penicillium sp. was studied [33]. The spores were inoculated and observed for 20 days under laboratory conditions with water condensation on the galvanized steel duct surface of the public building. The temperature (12 °C) and relative humidity (80%) conditions were kept constant. It was indicated that fungi could germinate and sporulate on the surface of a ventilation duct in cold and humid conditions [33]. The second part of the study was conducted as a field measurement in the ductwork of a public building in Finland, and no significant fungal growth was recognized in the ventilation system. Possible explanations were the inconsistency of air temperature and relative humidity not being constant throughout the time period. Thus, conditions for growth were not favorable [33]. In a study by Pasanen [34], the effects of different air temperatures (4–30 °C) and relative humidity (RH 11–96%) were studied on the growth of two common fungi, Aspergillus fumigatus and Penicillium sp. Cuts from duct plates with media were incubated in a humidity chamber for 12 days, and the results showed that a 7-day period was sufficient to start fungal growth. The relative humidity of the air did not directly affect the growth while moisture was present in the media. Thus, repeated or persistent moisture condensation is sufficient for fungal germination. A short-term (68 h) experimental study on a microorganism contamination mechanism in a closed-loop ductwork system was carried out under different humidity (RH 40–90%), temperature (22–32 °C) and air velocity (2.3 m/s) conditions [35]. The results showed that fungal and bacterial growth is possible under preferable conditions, resulting in colony-forming unit (CFU) increments. The results indicated that air temperature has the most influence on bacterial growth and humidity on fungal growth [35].
Concluding previous studies, they [33,34] showed that fungi and microbes might start germinating on galvanized steel if condensation or preferable temperature and humidity conditions for growth occur. A study [35] showed the possibility of short-term growth in the ventilation ductwork. All previous studies indicated that if germination happened, the increment of contamination would be most probable in preferable temperature and humid conditions. However, the researchers did not assess the long-term ventilation duct contamination and bacterial and fungi growth and its effect on the air and duct surface pollution.
In Finland, public buildings account for about 30% of Finland’s total employment [36]. These public buildings might be exposed to contaminants from ventilation ductwork [15,24,32]. Public buildings are unoccupied for more than 50% of the total time. One strategy is to stop ventilation during the unoccupied period. Another option is to supply the minimum airflow rate required to remove material emissions from the room spaces. Continuous night purging is justified to reduce the possible risk of indoor air problems [37,38,39,40]. However, energy consumption rises if the ventilation airflow rate is unnecessarily high during an unoccupied period.
In practice, ventilation could be either continuous or intermittent to guarantee good indoor air quality at the beginning of the occupied hours [41,42]. With the intermittent ventilation strategy, when there is no airflow rate during an unoccupied period, the ducts might cool down to the dew point, and thus create a possible risk of fungal and bacterial growth. For ventilation ductwork in contaminated conditions, the spores might then be transported to the room space. Primarily this could happen during the early morning start-up period when the pressure rises rapidly in the ductwork. As a possible solution, a low continuous ventilation airflow rate during an unoccupied period might prevent contaminants from collecting on the duct surface and spreading to the room spaces. However, neither the different ventilation strategies nor long-term ventilation exposure to contamination and cold and humid conditions has been studied.
The objective of this study was to determine the potential risk for microbial growth in ventilation ductwork under laboratory-controlled conditions. The aim was also to study the influence of intermittent and continuous ventilation on the microbial growth risk in ductwork. The mock-up of the ductwork consists of two separate ductwork systems for the intermittent and continuous ventilation strategies for unoccupied time.
The novelty of this laboratory study is the long-term investigation of microbial growth in cold and humid conditions. In this study, a simple microbial growth was created. The conditions were continuously recorded for four months, during which the same moisture and temperature conditions were maintained in two separate ductworks. Afterwards, the microbial growth was monitored by taking wiping, swab and air samples.

2. Materials and Methods

The microbial growth in the ventilation duct was studied for four months in laboratory conditions. A specific duct setup was designed and built for the fungal and bacterial growth test. The possible risk of contaminant growth was separately assessed for continuous or intermittent ventilation in cold and humid conditions. During the test periods, air temperature, dew point, relative humidity and surface temperature of the duct were continuously monitored and controlled within preferable conditions. The study compared two ventilation strategies during the unoccupied period. In the setup, microbial media was released inside the ductwork. During the test period, wipe, swab and air samples were taken initially, monthly and at the end of the test period. Afterwards, the collected samples were analyzed and compared.

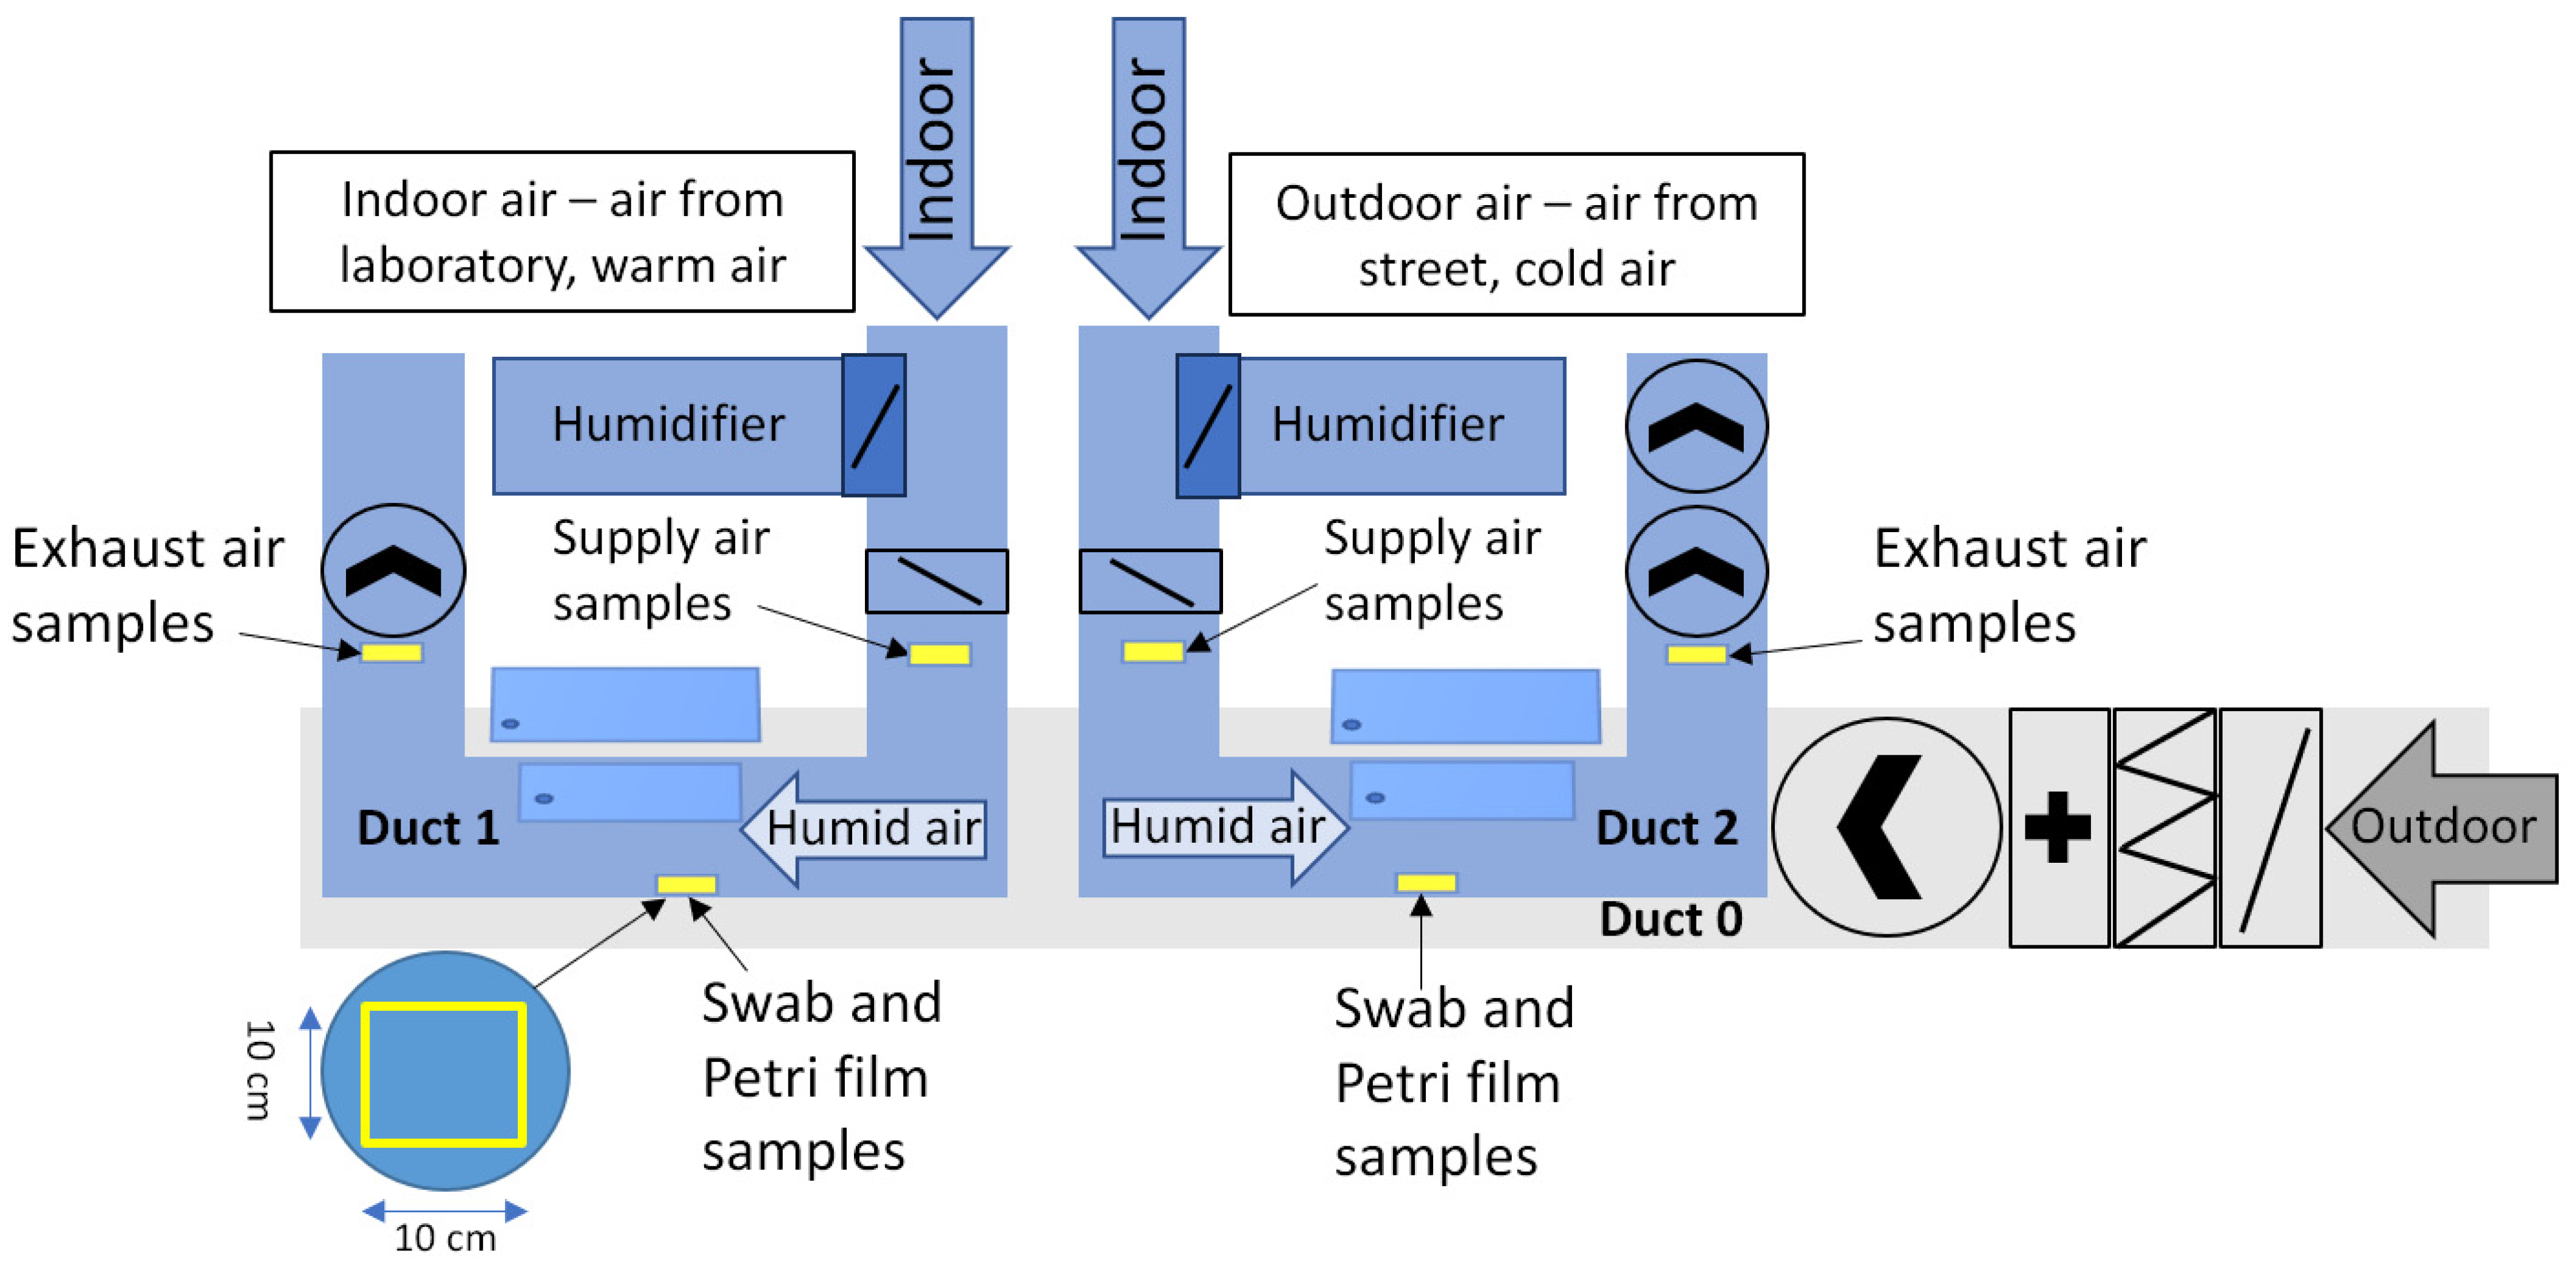
2.1. Ductwork and Measurement Equipment Setup

The test equipment with two parallel ventilation ductworks was built to simulate cold and humid conditions in the supply ductwork after the air handling unit, as presented in Figure 1. The test setup had two separate ventilation ducts where thermal conditions could be individually controlled. In the setup, ventilation ductwork was built with commonly used new circular galvanized steel ducts of 250 mm in diameter. The two different operation modes of ventilation were studied simultaneously. The primary fans operated in both ventilation ducts for 12 h daily with nominal airflow. The fan in duct 1 was switched off during the simulated unoccupied period. For the other 12 h, the secondary fan in the indoor duct 2 operated at a lower supply airflow.
Both ventilation ducts 1 and 2 had air humidifiers and air cooling with free cooling by using cold outside air flowing in the outer duct (0) (see Figure 1) and heated by a heating coil if necessary. The steam humidifiers were connected to the ductwork with vertical ducts. The humidifier’s model was the Trotec B400 and they were both equipped with custom latches allowing direct connection to the ductwork. The humidifiers were connected with three-way dampers (D1), which were used to minimize the influence of its airflow, as the airflow in the ducts was regulated by dampers D2 and their associated fans. It allowed us to prevent disturbing the airflow conditions there. In the experimental ductwork, microbial growth was continuously monitored in conditions of 70–90% relative humidity of air and a 11–14 °C air temperature and temperature on the duct surface.
The air temperature, relative humidity and dew point of the duct were measured with TinyTag loggers every 15 min. The air temperature and humidity were measured in two locations of the duct 0: before the damper and after duct 1. The air temperature, relative humidity and dew point in ducts 1 and 2 were measured at the sample hatch and in duct 2 after the hatch. The surface temperatures inside ducts 1 and 2 were measured next to the sample hatch. The surface temperatures of both ducts were monitored with PT100 class A thermal resistive sensors in the middle of the sampling zone covered by insulation. The reference indoor air temperature, humidity and dew point were measured by TinyTags installed on the outer surface of duct 0. The airflow in ducts 1 and 2 was measured with an Airflow LCA 6000 rotary vane anemometer. The sensors’ accuracy is shown in Table 1.

2.2. Microbial Media Preparation, Initial Duct Surface Contamination

At the beginning of the study, fungal and bacterial contamination was determined on the duct surfaces and the ductwork air. To be sure about the presence of microbial contamination on the duct surface, fungal spores were generated onto the dusty duct surface. The used ducts were new, stored in warm and clean indoor conditions and not specially cleaned before use to offer a normal amount of dust and debris for microorganisms after manufacturing. The ducts were visibly dusty. The dust on ventilation ducts offers sufficient nutrients for fungal growth if moisture is available [43].
The P. brevicompactum was chosen to represent the common fungi, which is also able to grow in chosen conditions if moisture is available and it is commonly found in ventilation systems [33,44,45]. The chosen experimental conditions, with temperatures ranging from 11–14 °C and relative humidity levels between 70–90%, were selected to simulate conditions which promote bacterial and fungal growth based on previous research [2,34]. This species also is fast-growing and fast-proliferating, which will promote its spread in the system if present. Previous studies showed a doubling of the colony size in 100 h in close to our conditions [46]. These conditions allowed for the assessment of their potential proliferation in ventilation systems under realistic scenarios.
The P. brevicompactum was grown on 2% malt extract agar on squared plates at room temperature for 4 weeks to obtain a dense spore surface on the agar. The spores were generated by using an FSSST aerosol generator to mimic the natural dry deposition of fungal spores [47]. The flow rate of the generator was 12 L per minute. An aerosol insertion method was chosen to introduce spores and bacteria into the ducts rather than directly applying them to the dust present in the ducts. This method was selected to simulate the natural dispersion of bacterial and fungal contaminants within the ventilation system [48]. Aerosolized contaminants are more likely to spread evenly and come into contact with various duct surfaces, providing a more representative assessment of the risks associated with bacterial and fungal growth in ventilation systems.

2.3. Biological Sampling, Schematic and Schedule

After initial measurements and generation of the spores, the ventilation ducts’ microbial contamination samples were collected monthly for four months. The monthly samples were taken from the inner surface of the duct as contact samples via Petri film. In general, swabs and contact samples are the common methods that were chosen in a number of studies [45]. The swab samples were taken at the beginning and the end of this study. Microbial air samples were taken from the ducts’ supply air and exhaust air with an Andersen impactor also at the beginning and the end of the 4-month period, shown in Table 2 [49]. Air samples were taken from the duct perforations made after the air damper and before the exhaust fan, as shown in Figure 2. The swab sampling points were located on the duct surface under the observation hatch and had a 10 × 10 cm2 area for each sampling. Petri film samples were taken parallel to the swab samples. Each swab and Petri film sample was taken from a different location to ensure that all sampling locations had been untouched from the beginning of the experiment.
The Petri film samples were taken by pressing the film onto the duct’s surface, carefully removing it and placing it into the sample bag. During the first (initial contamination) and last sampling times (end of the whole test period), swab samples were taken with a moistened cotton swab from an untouched surface, after which the swab was placed in a test tube to be transported to the analysis. The total surface of the duct area available from the cleaning hatch for sampling restricted the number of samples and therefore the samples were collected only once per month. We like to have a study design so that microbial growth will have time enough for growing in these conditions.

2.4. Analysis of Biological Samples

Air samples were taken with an Andersen impactor at the beginning and end of the study period to control the microbial concentrations in the supply air and exhaust air if microbes had proliferated in the studied duct area, see Figure 2. The sampling time of simultaneously collected samples was 15 min, we used the sampling schematic according to the Andersen impact collector protocol [50].
The sampling medium was 2% malt extract agar (M2) [47] for fungi and Tryptone soy agar [51], Sigma Aldrich, USA, for bacteria. The samples for fungi were incubated at room temperature (21 °C) for 7 days, and those for bacteria at 21 °C for 7 days and continued for Actinomycetes for 14 days. After incubation, the colony-forming units were counted, and fungi were identified at the genus level. The number of bacterial colonies was counted, but species were not identified.
The microbial analysis for microbial counts in swap samples and air samples was carried out according to the standard operating procedures followed in the Indoor Air and Occupational Health research group at the University of Eastern Finland [52]. The swab samples were diluted to 10−1 and 10−2 and plated to M2 agar as parallels, and they were incubated in similar conditions to the Andersen air samples. The colonies were identified at the genus level.
The counts on contact samples were counted according to the Petri film manufacturer’s protocol (Labema, manufacturer 3M) [53].

2.5. Ductowrk Conditions: Airflow, Temperature and Humidity during the Experiment

Figure 3 shows weekly measured conditions for ducts 0, 1 and 2 (see Figure 1), and the indoor air reference conditions in the laboratory.
In the intermittent ventilation ductwork, during the first week of the monitoring period, the average operating airflow was 55 ± 6.3 L/s, corresponding to a specific airflow of 3.1 L/s, m2 with a room floor area of 18 m2. The air temperature was average at the nominal airflow (12 h) 13.3 ± 0.5 °C.
In the continuous ventilation ductwork, ventilation was running for 12 h with nominal room airflow and 12 h with low airflow. The average measured airflow was 54 ± 6.2 L/s, corresponding to a specific airflow of 3 L/s, m2 with a floor area of 18 m2 in the room. At the lower fan speed, the airflow was on average 5 ± 1 L/s, corresponding to a specific airflow of 0.29 L/s, m2 with a floor area of 18 m2, so the night airflow was only 10% of the room airflow. The air temperature was average at 13.3 ± 0.5 °C, and the relative humidity was 72 ± 3% in the air and 73 ± 3% at the surface. At low airflow, the air temperature was 12.4 ± 0.5 °C, and the relative humidity were 75 ± 3% and 79 ± 3%, respectively. The surface temperatures of the inner surface of the ventilation ducts were about one degree lower than the air temperature measured inside the duct.

3. Results

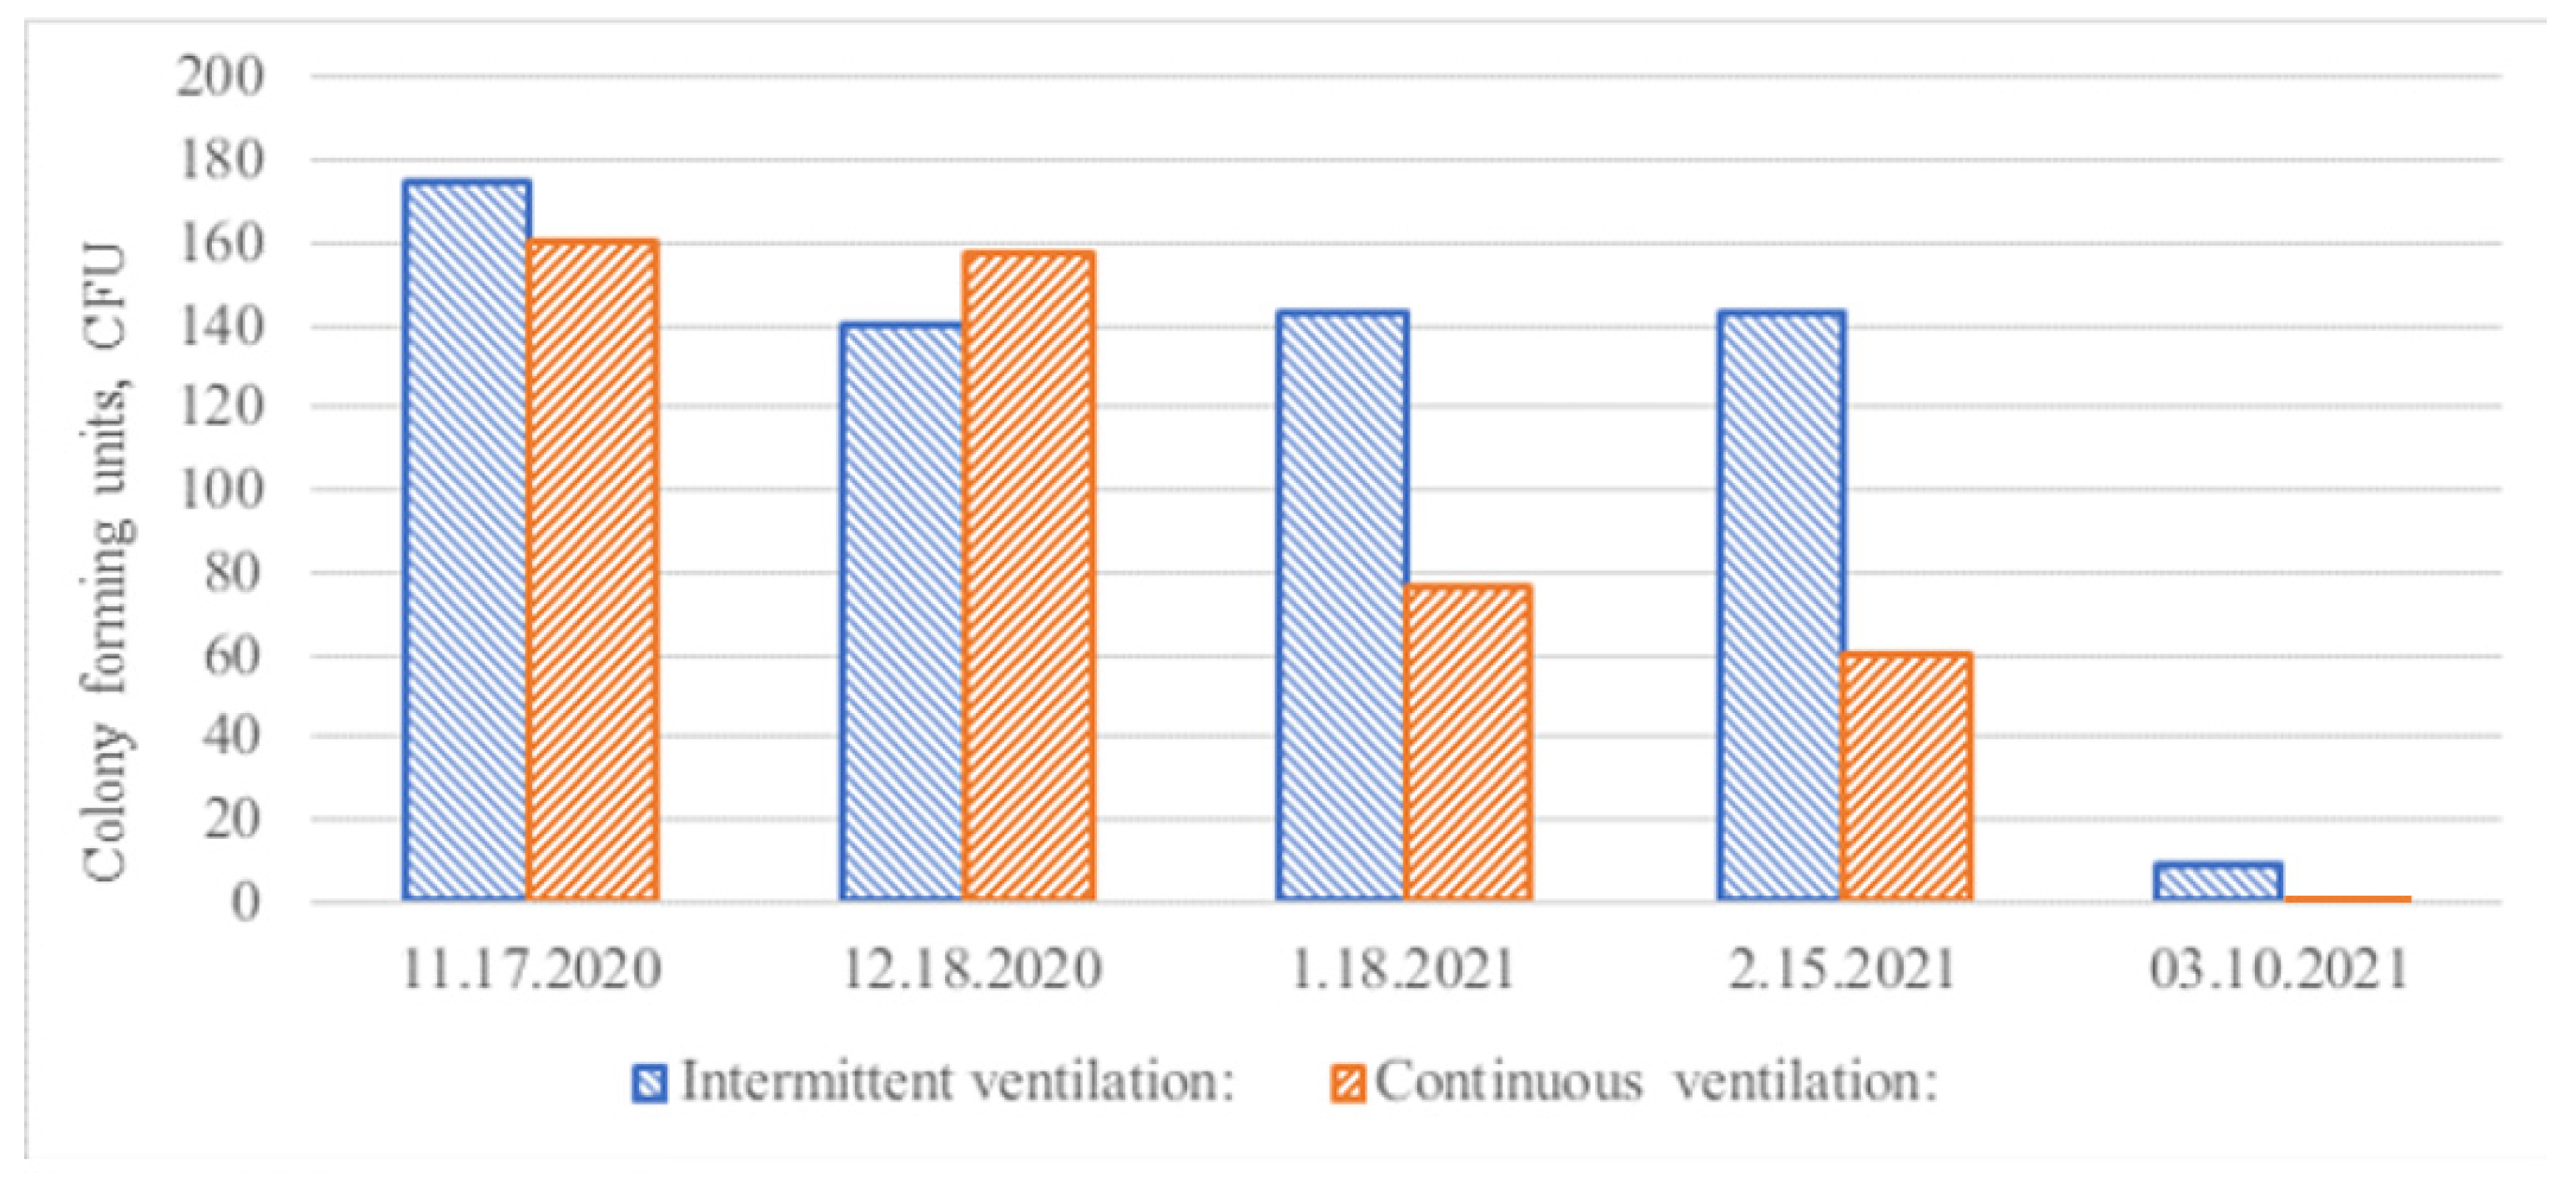
3.1. Duct Surface Contact Samples for Fungal Growth

Based on the results, fungal spore levels in the ventilation duct decreased during the period under review, as shown in Figure 4. In general, fungal spore counts were low. With continuous use of ventilation, the spore count initially remained at the same level. However, it rapidly decreased towards the end of the measurement period, and the sample for the last month was at a zero level. With intermittent ventilation, the spore count decreased after the first month, after which it remained constant until the concentration plummeted to zero during the last month. Based on the results, in both test cases, there was no colony growth on the surface of the ventilation duct. In the case of continuous ventilation, fungal spore viability decreased at a slightly higher rate than with intermittent ventilation.

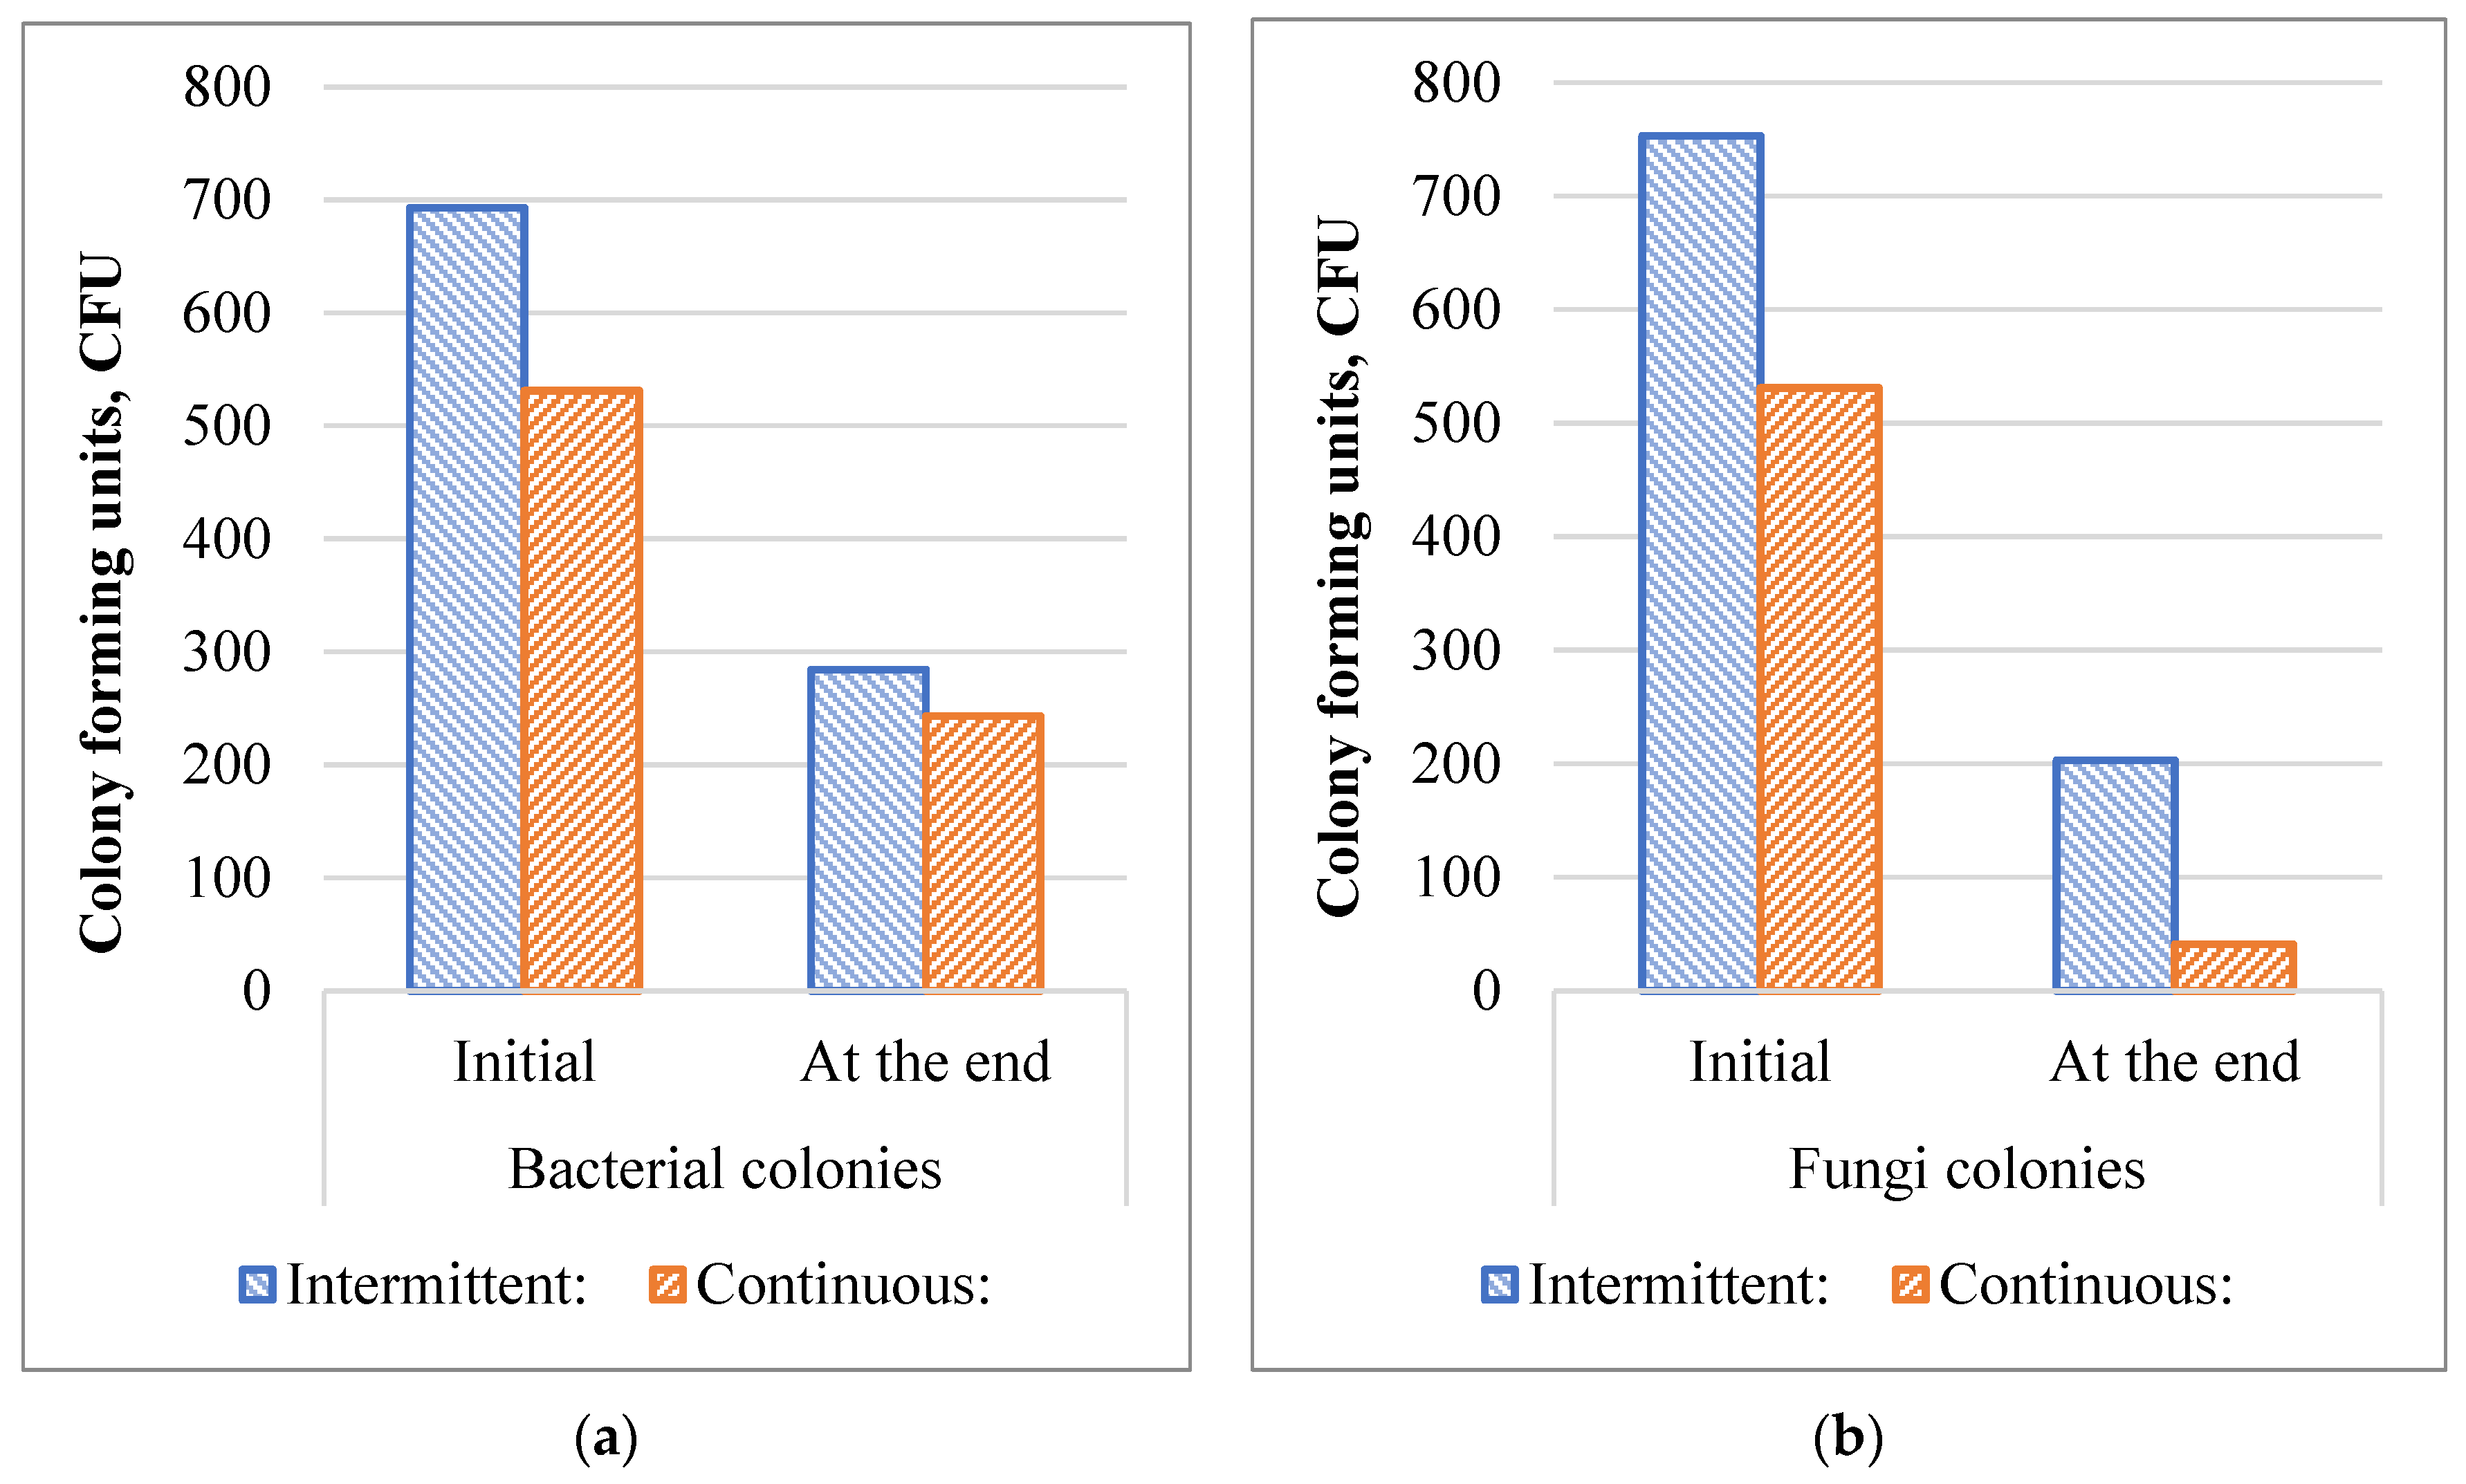
3.2. Duct Surface Swab Fungal and Bacterial Growth

The bacterial and fungi colony count of both ventilation test cases decreased at the surfaces during the observation period based on the swab samples, as shown in Figure 5. The change ratio of the bacterial colonies with intermittent ventilation was 0.41, and with continuous ventilation, it was 0.46. For fungi, change ratios were higher with 0.27 and 0.08, respectively, shown in Table 3. Based on swab samples, the relative decrease in fungi spores was greater with continuous ventilation than with intermittent ventilation. In contrast, the relative reduction in the bacterial colony was comparable for both ventilation uses.

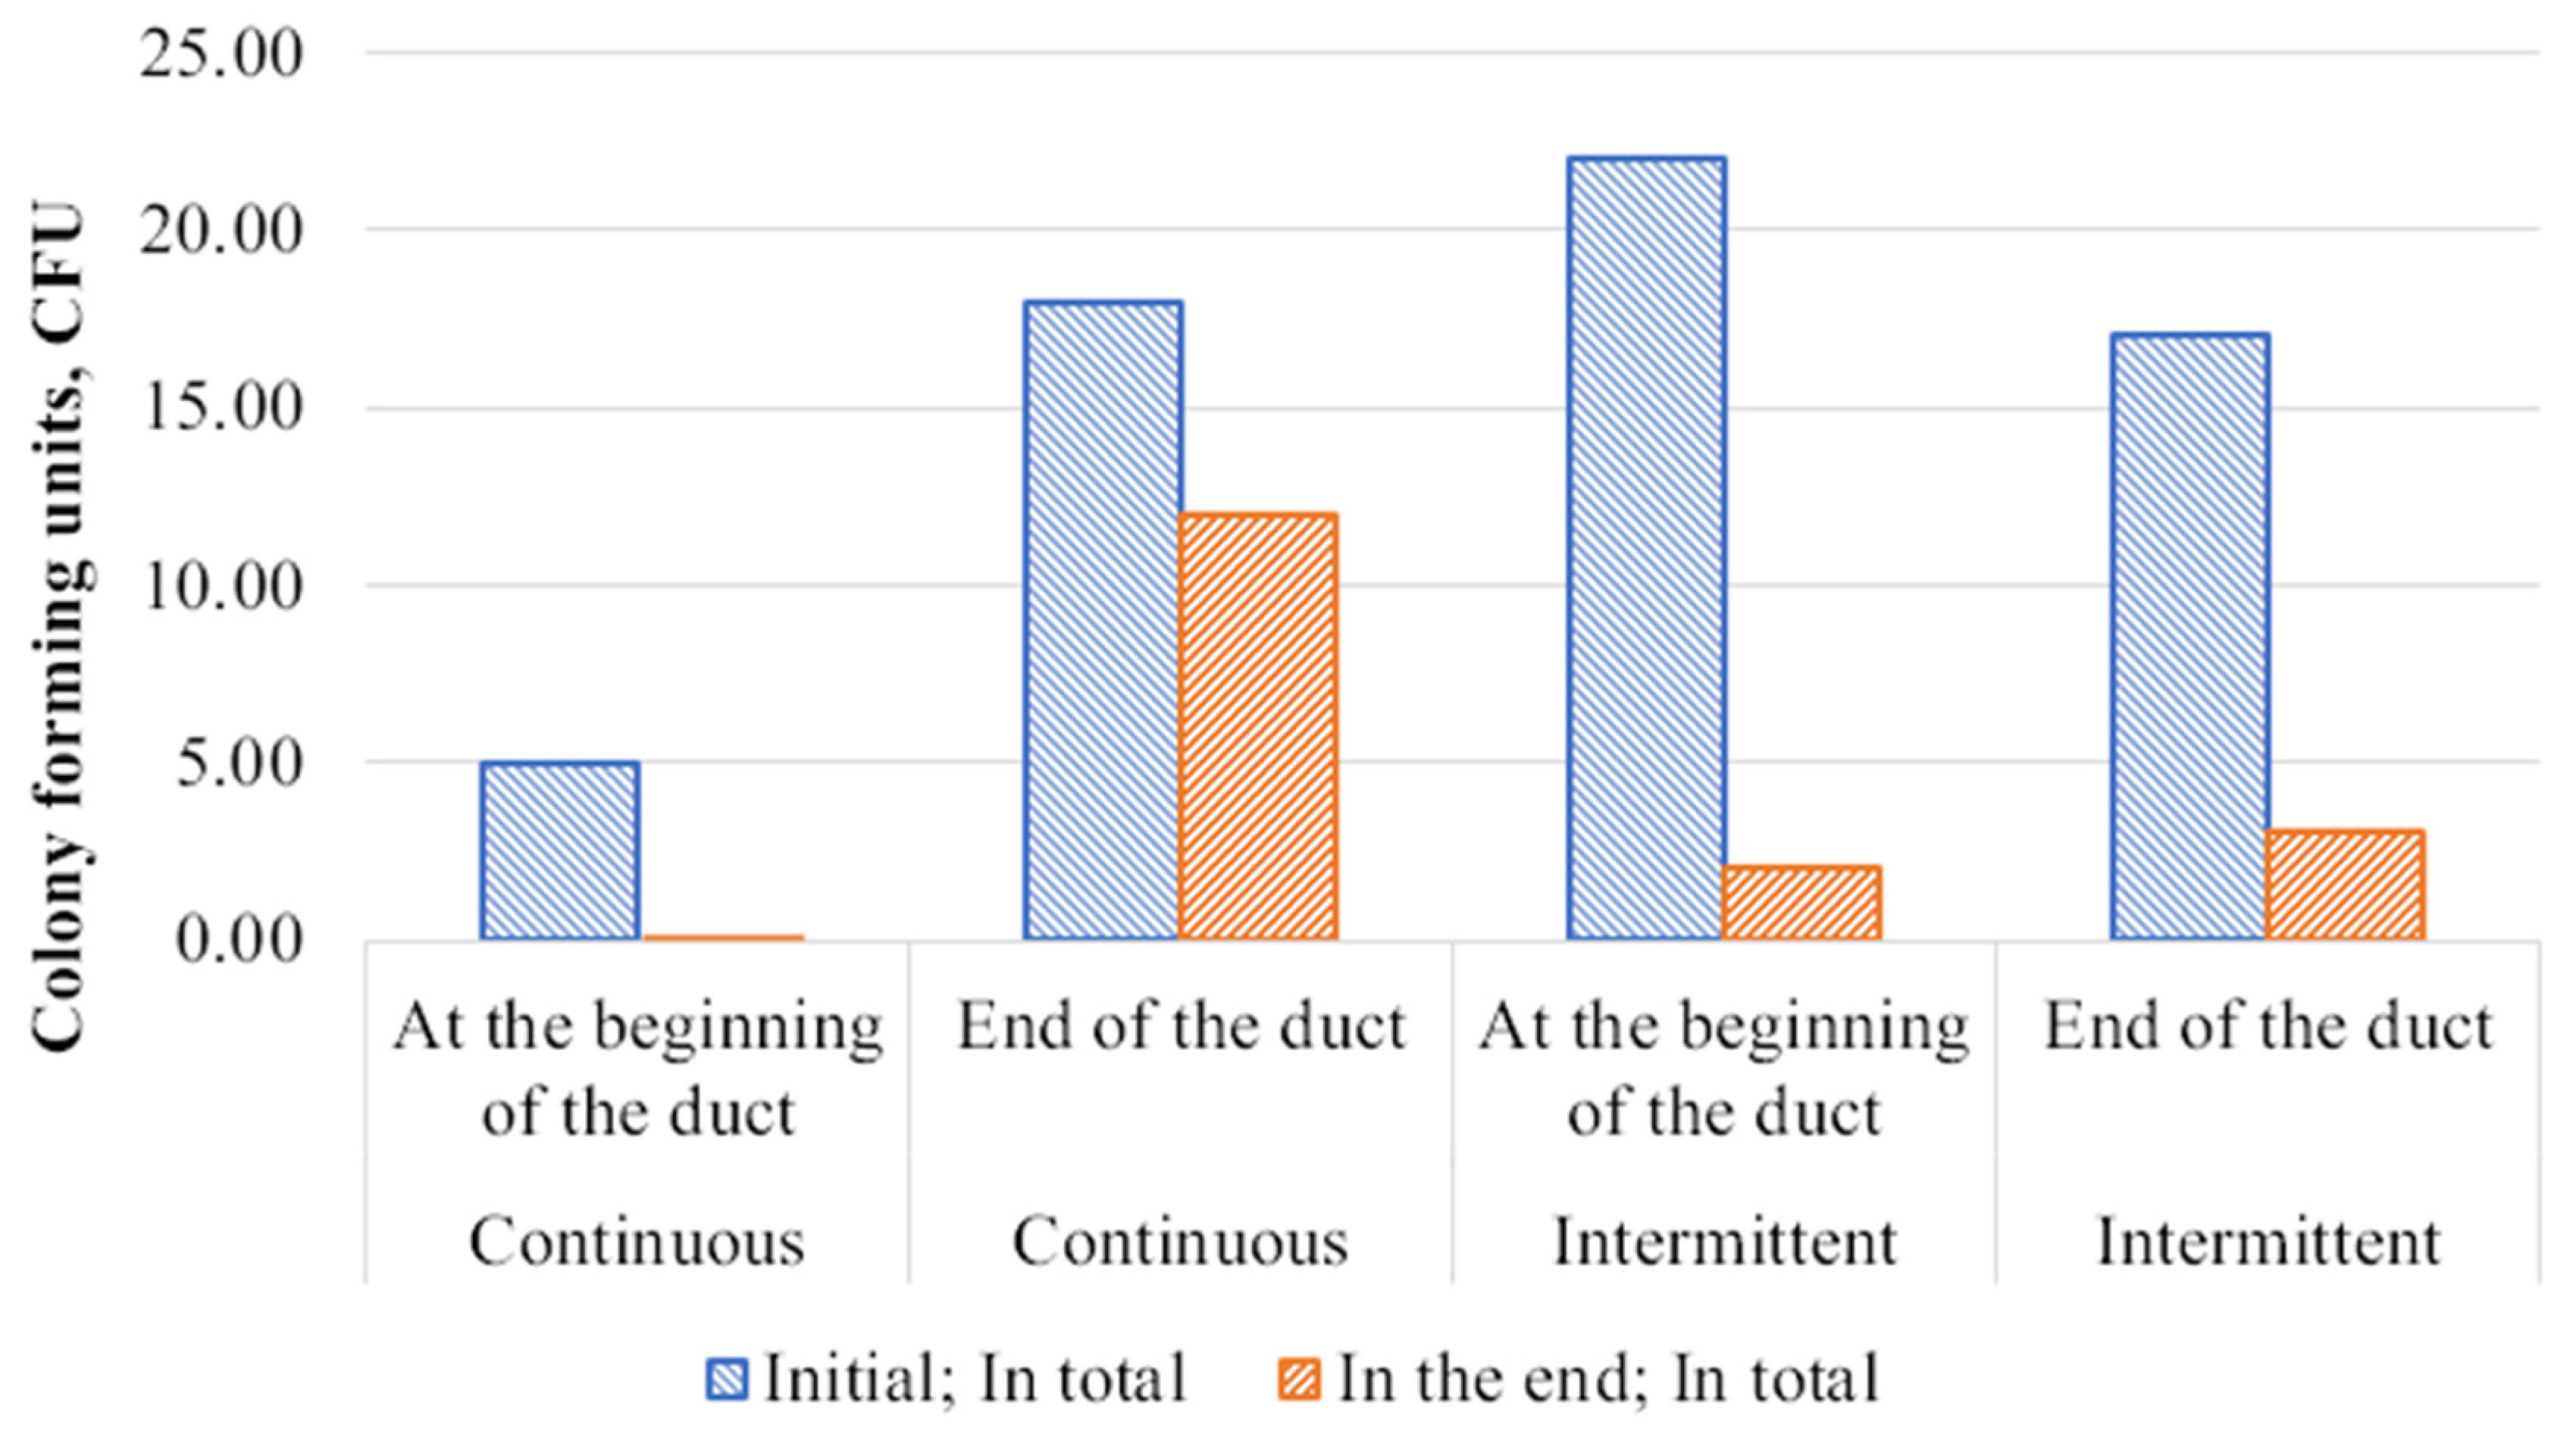
3.3. Ductwork Air Samples

Figure 6 shows the results of air samples at the beginning (12 November 2020) and at the end (10 March 2021) of the observed period and samples were taken from the beginning and end of the ducts. The bacterial colony count in all cases at the end of the observed period was significantly lower than the initial. Initially, the most polluted place was the beginning of the duct, however, the transfer via air was low, resulting in at least a 60% decrease in colony count. Continuous ventilation had lower CFU in all cases, showing a more sustainable ability to resist bacterial colony transfer. The resulting change rates are presented in Table 4 accordingly.
The fungal CFU initially had a different pattern, there the colonies were mostly presented at the end of the duct of the continuous ventilation and the beginning of the duct in intermittent ventilation, as shown in Figure 7 and Table 5. The explanation might be that the supply air was not filtered, so the counts may originate from lab air. However, the counts are low, and the detection limit is about 2 CFU/m3 (15 min sampling with Andersen sampler), which means that the number of counted colonies is limited with the duct’s relatively low airflow rate.
In general, air samples support the results of the Petri film and swab samples, based on which the number of CFUs in the ventilation duct did not increase with the intermittent or continuous ventilation operation. Our initial theory, that the start of ventilation might create a pressure wave, which would distribute the spores, was not directly proven, however, the small difference in CFU levels is presented. Based on the results of the air samples, there was no growth in the ventilation ducts.

4. Discussion

Previous studies [33,34,35] showed the possibility of ventilation fungal or bacterial colony growth on duct surfaces. However, these studies were focused on a short-term (no more than 3 weeks) period, where colonies were monitored until they had shown a saturated, stable size and then the experiments were stopped. Our study concentrated on a longer time frame (several months) and employed already saturated colonies with prepared media. Fast-growing Penicillium species proliferate on moist, dusty surfaces and they are commonly found in ventilation system surfaces, on dust and also in filters [33]. The results indicated that the moisture conditions were not favourable to promote extensive microbial growth in our laboratory set-up. The colonies showed size stability during the first month, but later the extinction of colonies was observed.
The study might be compared to the field measurements of HVAC systems, as such systems present long-term exposure to microbial contamination if polluted. Offices and schools showed 0.02–2.4 × 10⁴ CFU/m2 via contact method on the duct surface, but only a very small proportion of spores (<2%) are culturable in dust that has settled on supply ducts [54]. Furthermore, some laboratory studies on the growth of fungi (P. chrysogenum) on galvanized sterilized steel showed that the growth profile only with soiling the samples with dust collected from the residential HVAC system [43]. Previous studies assessed the influence of airflow rate on dust accumulation and colony growth [35] and did not indicate that colony extinction might be caused by low duct accumulation if dust with spores is presented and well-moisturized. However, the amount of dust and nutrients in its effect on microbial growth, for example, fungi are willing to use nutrients in housed dust as nutrients if moisture and temperature are favourable to the growth [55].
We also compared the efficiency of commonly used strategies in public building ventilation with different night-time airflow rates: intermittent and continuous ventilation. Our results indicate that continuous ventilation is slightly more resistant to potential contamination under extreme operating conditions. However, intermittent ventilation is more energy-efficient. These findings have practical implications for choosing the most appropriate ventilation strategy depending on the specific needs and constraints of a given building or system. If the ventilation system of the building is advanced, continuous ventilation can be applied only to the ductwork sections, which might be exposed to cold and humid conditions [56]. This will allow us to reduce the required operational energy demand during the night. This is especially important if renewable energy is used, as during the night it is limited.
Regarding some challenges during the experiment, the ambient level of pollution was not directly assessed. The supply air was taken from the laboratory environment but not directly from the HVAC system. Thus, some biological contaminants might be present at an ambient level. This is reflected in fungi air sampling with a low CFU amount at the end of the experiment. Moreover, we used sections of the ductwork with a realistic low amount of dust on the surface, which is expected in modern ventilation systems, especially in Nordic countries. The study was carried out during winter time when the spore counts in outdoor air, and also in indoor air, are usually low and therefore an extra filtration unit was considered unnecessary. For the experiment, we chose P. brevicompactum, as it is commonly present in the ventilation system and has the ability to proliferate and grow quickly. However, in addition, we used the P. brevicompactum as a pollution indicator within ventilation systems to assess overall microbial contamination. The presence of P. brevicompactum might show the existence of other microbial species, given the similar growth conditions necessary for various fungi and bacteria. In our case, we assessed the presence of Actinomycetes in swabs and air samples, which showed the close-to-fungi performance. Thus, P. brevicompactum signals the likely presence of other microbial contaminants. Nevertheless, caution is necessary when generalizing these results. The presence of P. brevicompactum may not indicate the existence of specific microbes with unique growth requirements.
Nonetheless, our study has important implications for real-world applications. Our results show that when duct surfaces are contaminated with microbes or fungi, the number of CFUs in the air remains relatively low (near the permissible upper limit), suggesting that the probability of air ducts becoming a source of contaminants in the system is low. Consequently, we recommend focusing efforts to prevent the infection of ventilation systems with fungal or bacterial colonies in areas most likely to support their growth, such as filters and heat exchangers. By keeping these components clean, no additional actions, besides standard cleaning, related to the ventilation system would be necessary, and even if pre-infected, they will naturally be cleaned over time. Future studies may consider assessing the ambient level of pollution directly and exploring other factors influencing bacterial and fungal growth in ventilation systems to further optimize preventive strategies.

5. Conclusions

One of the pollution causes is the inoculation and growth of bacterial colonies and fungi in ventilation systems. This study investigates the behavior of bacterial colonies and fungi placed on the walls of air ducts under cold and humid conditions for growth conditions for four months. A laboratory installation was built to simulate ventilation systems in a public building. Two different strategies for controlling night-time ventilation were investigated: intermittent ventilation and the continuous use of minimal airflow. The study was carried out for four months. The colonies were cultivated at the beginning of the study, with the media maintained throughout the experiment. Control samples were obtained using Petri film, swab sampling and air analysis at the inlet and outlet of the ducts.
The study results showed the extinction of colonies by the end of the experiment regardless of the chosen strategy of night-time ventilation. This finding suggests that the long-term growth of bacterial colonies and fungi on the walls of air ducts is improbable. Additionally, the colony count in the air remained low for the entire study period, indicating that the transfer of colonies from the air ducts to other elements of the ventilation system is also unlikely. Both intermittent and continuous ventilation strategies proved effective in minimizing bacterial and fungal contamination. However, continuous ventilation exhibited slightly better performance in resisting colony growth. These insights can inform the selection of optimal ventilation strategies for public buildings to maintain a healthy indoor air environment.

Author Contributions

Conceptualization, I.K., R.K., S.L., S.K. and P.P.; methodology, I.K., S.L., R.K. and P.P.; software, I.K. and S.L.; validation, R.K., S.L. and P.P.; formal analysis, P.P., I.K. and S.L.; investigation, P.P., I.K., S.L. and S.K.; resources, R.K.; data curation, P.P. and I.K.; writing—original draft preparation, I.K.; writing—review and editing, R.K., P.P. and S.K.; visualization, I.K.; supervision, R.K.; project administration, R.K.; funding acquisition, R.K. All authors have read and agreed to the published version of the manuscript.

Funding

The authors acknowledge the Finnish Work Environment Fund, the Aalto University Campus & Real Estate (ACRE), the Senate Properties and the cities of Helsinki, Espoo and Vantaa, for the financial support.

Data Availability Statement

Not applicable.

Conflicts of Interest

The authors declare no conflict of interest.

References

  1. World Health Organization. The World Health Report 2000: Health Systems: Improving Performance; World Health Organization: Geneva, Switzerland, 2000; ISBN 978-92-4-156198-3. [Google Scholar]
  2. Wargocki, P.; Sundell, J.; Bischof, W.; Brundrett, G.; Fanger, P.O.; Gyntelberg, F.; Hanssen, S.O.; Harrison, P.; Pickering, A.; Seppänen, O.; et al. Ventilation and Health in Non-Industrial Indoor Environments: Report from a European Multidisciplinary Scientific Consensus Meeting (EUROVEN). Indoor Air 2002, 12, 113–128. [Google Scholar] [CrossRef]
  3. Daisey, J.M.; Angell, W.J.; Apte, M.G. Indoor Air Quality, Ventilation and Health Symptoms in Schools: An Analysis of Existing Information: Indoor Air Quality, Ventilation and Health Symptoms in Schools. Indoor Air 2003, 13, 53–64. [Google Scholar] [CrossRef] [Green Version]
  4. Mendell, M.J.; Heath, G.A. Do Indoor Pollutants and Thermal Conditions in Schools Influence Student Performance? A Critical Review of the Literature. Indoor Air 2005, 15, 27–52. [Google Scholar] [CrossRef]
  5. Han, O.; Li, A.; Kosonen, R. Hood Performance and Capture Efficiency of Kitchens: A Review. Build. Environ. 2019, 161, 106221. [Google Scholar] [CrossRef]
  6. Bocanegra-Yanez, M.C.; Rojas, G.; Zukowska, D.; Burman, E.; Cao, G.; Hamon, M.P.Y.; Kolarik, J. Design and Operation of Ventilation in Low Energy Residences—A Survey on Code Requirements and Building Reality from Six European Countries and China. In Proceedings of the 38th AIVC Conference “Ventilating Healthy Low-Energy buildings”, Nottingham, UK, 13–14 September 2017; Available online: http://www.aivc.org/resource/design-and-operation-ventilation-low-energy-residences-survey-code-requirements-and (accessed on 4 November 2020).
  7. Brelih, N.; Seppanen, O. Ventilation Rates and IAQ in European Standards and National Regulations. In Proceedings of the 32nd AIVC Conference and 1st TightVent Conference, Brussels, Belgium, 12–13 October 2011. [Google Scholar]
  8. Fernbas Energy Performance of Buildings Directive. Available online: https://ec.europa.eu/energy/topics/energy-efficiency/energy-efficient-buildings/energy-performance-buildings-directive_en (accessed on 5 November 2020).
  9. EN 15251:2007; Indoor Environmental Input Parameters for Design and Assessment of Energy Performance of Buildings Addressing Indoor Air Quality, Thermal Environment, Lighting and Acoustics. Slovenian Institute for Standardization: Ljubljana, Slovenia, 2007. Available online: https://standards.iteh.ai/catalog/standards/cen/92485123-bf64-40e3-9387-9724a642eae8/en-15251-2007 (accessed on 2 September 2021).
  10. EN 16798-1:2019; Energy Performance of Buildings—Ventilation for Buildings—Part 1: Indoor Environmental Input Parameters for Design and Assessment of Energy Performance of Buildings Addressing Indoor Air Quality, Thermal Environment, Lighting and Acoustics—Module M1-6. Slovenian Institute for Standardization: Ljubljana, Slovenia, 2019. Available online: https://standards.iteh.ai/catalog/standards/cen/b4f68755-2204-4796-854a-56643dfcfe89/en-16798-1-2019 (accessed on 2 September 2021).
  11. Dimitroulopoulou, C. Ventilation in European Dwellings: A Review. Build. Environ. 2012, 47, 109–125. [Google Scholar] [CrossRef]
  12. Norbäck, D.; Zock, J.-P.; Plana, E.; Heinrich, J.; Tischer, C.; Jacobsen Bertelsen, R.; Sunyer, J.; Künzli, N.; Villani, S.; Olivieri, M.; et al. Building Dampness and Mold in European Homes in Relation to Climate, Building Characteristics and Socio-Economic Status: The European Community Respiratory Health Survey ECRHS II. Indoor Air 2017, 27, 921–932. [Google Scholar] [CrossRef]
  13. Kokko, E.; Ojanen, T.; Salonvaara, M.; Hukka, A.; Viitanen, H. For Wooden Structures Technical Activities; VTT Technical Research Centre of Finland: Espoo, Finland, 1999; ISBN 978-951-38-5499-7. [Google Scholar]
  14. Viitanen, H.; Vinha, J.; Salminen, K.; Ojanen, T.; Peuhkuri, R.; Paajanen, L.; Lähdesmäki, K. Moisture and Bio-Deterioration Risk of Building Materials and Structures. J. Build. Phys. 2010, 33, 201–224. [Google Scholar] [CrossRef]
  15. Hamada, N.; Fujita, T. Effect of Air-Conditioner on Fungal Contamination. Atmos. Environ. 2002, 36, 5443–5448. [Google Scholar] [CrossRef]
  16. Morey, P.R.; Hodgson, M.J.; Sorenson, W.G.; Kullman, G.J.; Rhodes, W.W.; Visvesvara, G.S. Environmental Studies in Moldy Office Buildings: Biological Agents, Sources and Preventive Measures. Ann. Am. Conf. Gov. Ind. Hyg. 1984, 10, 21–35. Available online: https://hero.epa.gov/hero/index.cfm/reference/details/reference_id/22733 (accessed on 21 October 2021).
  17. Jareemit, D.; Shu, S.; Heidarinejad, M.; Kim, Y.-S.; Liu, J.; Alhafi, Z.; Srebric, J. Evaluation of Indoor Mold Growth Relative to Indoor Humidity Using a Multi-Zone Modeling. In Proceedings of the CLIMA 2013. Available online: https://www.researchgate.net/publication/266375006_Evaluation_of_Indoor_Mold_Growth_Relative_to_Indoor_Humidity_Using_a_Multi-zone_Modeling (accessed on 27 June 2023).
  18. Al-Doory, Y.; Domson, J.F. Mould Allergy; Lea & Febiger: Philadelphia, PA, USA, 1984; ISBN 978-0-8121-0897-2. [Google Scholar]
  19. Tariq, S.M.; Matthews, S.M.; Stevens, M.; Hakim, E.A. Sensitization to Alternaria and Cladosporium by the Age of 4 Years. Clin. Exp. Allergy 1996, 26, 794–798. Available online: https://onlinelibrary.wiley.com/doi/10.1111/j.1365-2222.1996.tb00610.x (accessed on 25 October 2021). [CrossRef]
  20. Sakamoto, T.; Ito, K.; Miyake, M.; Doi, S.; Yamada, M.; Torii, S. Cross-Allergenicity between Aspergillus restrictus, Aspergillus fumigatus and Alternaria alternata Determined by Radioallergosorbent Test Inhibition. Allergol. Int. 1996, 45, 45–49. [Google Scholar] [CrossRef] [Green Version]
  21. Sekhar, S.C. Enhancement of Ventilation Performance of a Residential Split-System Air-Conditioning Unit. Energy Build. 2004, 36, 273–279. [Google Scholar] [CrossRef]
  22. Lu, Z.; Lu, W.Z.; Zhang, J.L.; Sun, D.X. Microorganisms and Particles in AHU Systems: Measurement and Analysis. Build. Environ. 2009, 44, 694–698. [Google Scholar] [CrossRef]
  23. Bonetta, S.; Bonetta, S.; Mosso, S.; Sampò, S.; Carraro, E. Assessment of Microbiological Indoor Air Quality in an Italian Office Building Equipped with an HVAC System. Environ. Monit. Assess. 2010, 161, 473–483. [Google Scholar] [CrossRef]
  24. Piekarska, K.; Trusz, A.; Szczęśniak, S. Bacteria and Fungi in Two Air Handling Units with Air Recirculating Module. Energy Build. 2018, 178, 154–164. [Google Scholar] [CrossRef]
  25. Al-Abdalall, A.; Al-dakheel, S.; Al-Abkari, H. Impact of Air-Conditioning Filters on Microbial Growth and Indoor Air Pollution. In Low-Temperature Technologies; BoD—Books on Demand: Norderstedt, Germany, 2019; ISBN 978-1-83880-666-8. [Google Scholar]
  26. Pejtersen, J. Sensory Pollution and Microbial Contamination of Ventilation Filters. Indoor Air 1996, 6, 239–248. [Google Scholar] [CrossRef]
  27. Grbić, M.; Vukojevic, J.; Stupar, M. Fungal Colonization of Air-Conditioning Systems. Arch. Biol. Sci. 2008, 60, 201–206. [Google Scholar] [CrossRef]
  28. Abbasi, F.; Samaei, M.R.; Manoochehri, Z.; Jalili, M.; Yazdani, E. The Effect of Incubation Temperature and Growth Media on Index Microbial Fungi of Indoor Air in a Hospital Building in Shiraz, Iran. J. Build. Eng. 2020, 31, 101294. [Google Scholar] [CrossRef]
  29. Wu, Y.; Chen, A.; Luhung, I.; Gall, E.T.; Cao, Q.; Chang, V.W.-C.; Nazaroff, W.W. Bioaerosol Deposition on an Air-Conditioning Cooling Coil. Atmos. Environ. 2016, 144, 257–265. [Google Scholar] [CrossRef] [Green Version]
  30. Siegel, J.; Walker, I. Deposition of Biological Aerosols on HVAC Heat Exchangers. In Proceedings of the ASHRAE IAQ 2001, San Francisco, CA, USA, 4–7 November 2001. [Google Scholar]
  31. Bakker, A.; Siegel, J.A.; Mendell, M.J.; Peccia, J. Building and Environmental Factors That Influence Bacterial and Fungal Loading on Air Conditioning Cooling Coils. Indoor Air 2018, 28, 689–696. [Google Scholar] [CrossRef]
  32. Luongo, J.C.; Miller, S.L. Ultraviolet Germicidal Coil Cleaning: Decreased Surface Microbial Loading and Resuspension of Cell Clusters. Build. Environ. 2016, 105, 50–55. [Google Scholar] [CrossRef]
  33. Pasanen, P.; Pasanen, A.-L.; Jantunen, M. Water Condensation Promotes Fungal Growth in Ventilation Ducts. Indoor Air 1993, 3, 106–112. [Google Scholar] [CrossRef]
  34. Pasanen, A.-L.; Kalliokoski, P.; Pasanen, P.; Jantunen, M.J.; Nevalainen, A. Laboratory Studies on the Relationship between Fungal Growth and Atmospheric Temperature and Humidity. Environ. Int. 1991, 17, 225–228. [Google Scholar] [CrossRef]
  35. Li, A.; Liu, Z.; Liu, Y.; Xu, X.; Pu, Y. Experimental Study on Microorganism Ecological Distribution and Contamination Mechanism in Supply Air Ducts. Energy Build. 2012, 47, 497–505. [Google Scholar] [CrossRef]
  36. Rämö, A. Statistics Finland—Building Stock 2019. Available online: http://www.stat.fi/til/rakke/2019/rakke_2019_2020-05-27_kat_002_en.html (accessed on 5 November 2020).
  37. Wyon, D.P. The Effects of Indoor Air Quality on Performance and Productivity. Indoor Air 2004, 14 (Suppl. S7), 92–101. [Google Scholar] [CrossRef]
  38. Sundell, J.; Levin, H.; Nazaroff, W.W.; Cain, W.S.; Fisk, W.J.; Grimsrud, D.T.; Gyntelberg, F.; Li, Y.; Persily, A.K.; Pickering, A.C.; et al. Ventilation Rates and Health: Multidisciplinary Review of the Scientific Literature. Indoor Air 2011, 21, 191–204. Available online: https://onlinelibrary.wiley.com/doi/full/10.1111/j.1600-0668.2010.00703.x?casa_token=q6_qKmmD3OcAAAAA%3AvnjNkNO2q9T-wZoJPeamiLw_riLgjcA7HYqeGm_s9sgqjLrEXSgY45q7Wt9QVFMf_UIYvf5DSCvzzj8 (accessed on 29 September 2021). [CrossRef]
  39. Tang, J.W.; Bahnfleth, W.P.; Bluyssen, P.M.; Buonanno, G.; Jimenez, J.L.; Kurnitski, J.; Li, Y.; Miller, S.; Sekhar, C.; Morawska, L.; et al. Dismantling Myths on the Airborne Transmission of Severe Acute Respiratory Syndrome Coronavirus-2 (SARS-CoV-2). J. Hosp. Infect. 2021, 110, 89–96. [Google Scholar] [CrossRef]
  40. Wargocki, P. What We Know and Should Know about Ventilation. REHVA J. 2021, 58, 5–13. [Google Scholar]
  41. Wierzbicka, A.; Pedersen, E.; Persson, R.; Nordquist, B.; Stålne, K.; Gao, C.; Harderup, L.-E.; Borell, J.; Caltenco, H.; Ness, B.; et al. Healthy Indoor Environments: The Need for a Holistic Approach. Int. J. Environ. Res. Public Health 2018, 15, 1874. [Google Scholar] [CrossRef] [Green Version]
  42. Bhagat, R.K.; Linden, P.F. Displacement Ventilation: A Viable Ventilation Strategy for Makeshift Hospitals and Public Buildings to Contain COVID-19 and Other Airborne Diseases. R. Soc. Open Sci. 2020, 7, 200680. [Google Scholar] [CrossRef]
  43. Chang, J.C.S.; Foarde, K.K.; VanOsdell, D.W. Assessment of Fungal (Penicillium chrysogenum) Growth on Three HVAC Duct Materials. Environ. Int. 1996, 22, 425–431. [Google Scholar] [CrossRef]
  44. Korpi, A.; Pasanen, A.-L.; Pasanen, P. Volatile Compounds Originating from Mixed Microbial Cultures on Building Materials under Various Humidity Conditions. Appl. Environ. Microbiol. 1998, 64, 2914–2919. [Google Scholar] [CrossRef] [Green Version]
  45. Liu, Z.; Ma, S.; Cao, G.; Meng, C.; He, B.-J. Distribution Characteristics, Growth, Reproduction and Transmission Modes and Control Strategies for Microbial Contamination in HVAC Systems: A Literature Review. Energy Build. 2018, 177, 77–95. [Google Scholar] [CrossRef]
  46. Li, Y.; Wadsö, L. Simultaneous Measurements of Colony Size and Heat Production Rate of a Mould (Penicillium brevicompactum) Growing on Agar. J. Therm. Anal. Calorim. 2011, 104, 105–111. [Google Scholar] [CrossRef]
  47. Lab M—A NEOGEN Brand—Lab M. Available online: http://www.labm.com/ (accessed on 29 March 2022).
  48. Peitzsch, M.; Sulyok, M.; Täubel, M.; Vishwanath, V.; Krop, E.; Borràs-Santos, A.; Hyvärinen, A.; Nevalainen, A.; Krska, R.; Larsson, L. Microbial Secondary Metabolites in School Buildings Inspected for Moisture Damage in Finland, The Netherlands and Spain. J. Environ. Monit. 2012, 14, 2044–2053. [Google Scholar] [CrossRef] [Green Version]
  49. Li, C.-S. Sampling Performance of Impactors for Bacterial Bioaerosols. Aerosol Sci. Technol. 1999, 30, 280–287. [Google Scholar] [CrossRef] [Green Version]
  50. Andersen, A.A. New sampler for the collection, sizing, and enumeration of viable airborne particles. J. Bacteriol. 1958, 76, 471–484. [Google Scholar] [CrossRef] [Green Version]
  51. Tryptic Soy Agar for Microbiology Tryptone Soya Agar. Available online: http://www.sigmaaldrich.com/ (accessed on 20 June 2023).
  52. Research Group of Indoor Environment and Occupational Health. Available online: https://uefconnect.uef.fi/en/group/research-group-of-indoor-environment-and-occupational-health/ (accessed on 20 June 2023).
  53. 3MTM PetrifilmTM Aerobic Count Plates (2 × 50). Labema—Life Science—Ja Bioteknologia-Alan Asiantuntija. Available online: https://www.labema.fi/tuote-C6400 (accessed on 20 June 2023).
  54. Pasanen, A.-L.; Kujanpää, L.; Pasanen, P.; Kalliokoski, P.; Blomquist, G. Culturable and Total Fungi in Dust Accumulated in Air Ducts in Single-Family Houses. Indoor Air 1997, 7, 121–127. [Google Scholar] [CrossRef]
  55. Korpi, A.; Pasanen, A.-L.; Pasanen, P.; Kalliokoski, P. Microbial Growth and Metabolism in House Dust. Int. Biodeterior. Biodegrad. 1997, 40, 19–27. [Google Scholar] [CrossRef]
  56. Lestinen, S.; Kilpeläinen, S.; Kosonen, R.; Valkonen, M.; Jokisalo, J.; Pasanen, P. Effects of Night Ventilation on Indoor Air Quality in Educational Buildings—A Field Study. Appl. Sci. 2021, 11, 4056. [Google Scholar] [CrossRef]
Figure 1. Schematic of the ductwork and measurement equipment setup.
Buildings 13 01683 g001
Figure 2. Schematic of the ductwork sampling setup and placement.
Buildings 13 01683 g002
Figure 3. The median air temperature and humidity conditions in the ductwork, inside the laboratory and in the outside duct during the experiment.
Buildings 13 01683 g003
Figure 4. The change of ventilation duct fungal growth with intermittent and continuous night-time ventilation.
Buildings 13 01683 g004
Figure 5. Swab samples of ventilation duct with intermittent and continuous ventilation: (a) bacterial colony-forming units; (b) fungi colony-forming units.
Buildings 13 01683 g005
Figure 6. Air samples of ventilation duct bacterial colony-forming units with intermittent and continuous ventilation at the beginning of the experiment and at the end.
Buildings 13 01683 g006
Figure 7. Air samples of ventilation duct fungi colony-forming units with intermittent and continuous ventilation in the beginning of experiment and at the end.
Buildings 13 01683 g007
Table 1. Ductwork setup calibration and measuring devices details.
DeviceParameterAccuracy
Tinytag plus 2, TGP-4500Air temperature,
Relative humidity
0.5 °C (0… +45 °C);
±3% RH at 25 °C;
5 min interval
PT100 class ADuct surface temperature±0.19 °C at 20 °C
Airflow LCA 6000Air velocity0.25 to 4.99 m/s:
±0.1 m/s
5 to 30 m/s:
calibrated better than ±2% of reading
Table 2. Sampling schedule and methods.
SamplingMethod11.17.202012.18.202001.18.202102.15.202103.10.2021
Contact, FungalPetri film
Swab, Fungal10 × 10 cm2 area swabing
Swab, Bacterial10 × 10 cm2 area swabing
Air, FungalAnderson collector
Air, BacterialAnderson collector
Table 3. Swab samples of ventilation duct bacterial and fungi colony-forming units change ratio with intermittent and continuous ventilation.
Swab SampleBacterial ColoniesFungi Colonies
Change Ratio 1Change Ratio
Intermittent ventilation:0.410.27
Continuous ventilation:0.460.08
1 shows the relation between the number of colonies before and after the experiment.
Table 4. Air samples of ventilation duct bacterial colony-forming units change ratio with intermittent and continuous ventilation.
Air SampleAt the Beginning of the DuctEnd of the Duct
Change Ratio 1Change Ratio
Intermittent ventilation:0.050.33
Continuous ventilation:0.090.2
1 shows the relation between the number of colonies before and after the experiment.
Table 5. Air samples of ventilation duct fungi colony-forming units change ratio with intermittent and continuous ventilation.
Air SampleAt the Beginning of the DuctEnd of the Duct
Change Ratio 1Change Ratio
Intermittent ventilation:0.090.18
Continuous ventilation:0.00.67
1 shows the relation between the number of colonies before and after the experiment.
Disclaimer/Publisher’s Note: The statements, opinions and data contained in all publications are solely those of the individual author(s) and contributor(s) and not of MDPI and/or the editor(s). MDPI and/or the editor(s) disclaim responsibility for any injury to people or property resulting from any ideas, methods, instructions or products referred to in the content.

