Review

Vibration of Timber and Hybrid Floors: A Review of Methods of Measurement, Analysis, and Design

1
School of Engineering and Built Environment, Griffith University, Gold Coast, QLD 4215, Australia
2
Department of Agriculture and Fisheries, Queensland Government, Brisbane City, QLD 4000, Australia
3
Faculty of Society & Design, Bond University, Robina, QLD 4226, Australia
*
Author to whom correspondence should be addressed.
Buildings 2023, 13(7), 1756; https://doi.org/10.3390/buildings13071756
Submission received: 7 June 2023 / Revised: 4 July 2023 / Accepted: 7 July 2023 / Published: 10 July 2023
(This article belongs to the Special Issue Strength, Design and Performance of Light-Weight Metal Structures)

Abstract

:
Floor vibration, although not a safety concern, is a prevalent performance complaint in multi-story structures. With the increasing use of mass timber construction, various types of long-span timber floors (LSTFs), including plain cross-laminated timber (CLT), CLT with secondary beams (ribbed-deck), and hybrid systems such as timber–concrete composite (TCC) and CLT on-steel-support beams, are gaining popularity. However, due to limited knowledge regarding their vibration characteristics and acceptance criteria, these construction types are often overlooked during the design stage by architects, engineers, and builders. Existing standards and guidelines primarily calibrated for steel and concrete floors lack a validated and calibrated method for evaluating the vibration performance of LSTFs. Nonetheless, it is essential for structural engineers to address vibration concerns during the design stage and potentially investigate excessive vibration in existing buildings, providing mitigation solutions. This article provides a comprehensive overview, discussion, and analysis of the measurement, analysis, design, perception, and acceptability of vibration of timber floors as outlined in international standards and commonly used guidelines. Experimental and theoretical case studies, including vibration measurements of a CLT floor and a comparison of vibration acceptability in lightweight timber floors using different methods, are reported. The results highlight discrepancies between simplified equation calculations and modal analysis observations, underscoring the limitations of relying solely on simplified equations. Furthermore, it is observed that current modal superposition methods tend to be conservative in predicting floor acceleration and velocity responses. Recommendations are provided for future research in the field to enhance floor vibration assessment techniques, aiming for improved design optimization and occupant comfort.

1. Introduction

A study of the construction sector in 40 countries showed that the total CO2 emissions of the global construction sector in 2009 contributed 23% of the total emissions produced by global economic activities [1]. The study [2] identified methods for promoting the development and use of low embodied-carbon building materials as a major opportunity to reduce the emissions in the construction sector. In Australia, the government aims to reduce the nation’s greenhouse emissions to 28% below 2005 levels by 2030 (Paris convention) and aims to achieve net zero by 2050. Since the built environment, including construction, operation, and maintenance, currently accounts for almost 25% of the country’s greenhouse gas emissions, and given that the population is projected to reach 35.9 million by 2050, these reduced carbon emission goals can only be achieved with substantial investments in renewable alternatives. The industry can be more sustainable with timber construction due to its lower greenhouse gas emissions and higher carbon storage potential than concrete and steel. Timber buildings made of large wooden components such as cross-laminated timber (CLT) and glued-laminated timber (glulam) are carbon-negative, meaning they can store more carbon than is emitted in their construction (each cubic meter of softwood glulam captures 550 kg of carbon). Furthermore, in a lightweight or mass timber wood-based hybrid solution, engineered wood products (EWPs) can be integrated with steel and concrete to combine the benefits of all materials [3,4]. The benefits of mid-rise timber and hybrid timber buildings compared with steel and concrete alternatives are notable and include a smaller carbon footprint; off-site prefabrication using advanced manufacturing methods; lighter weight, which improves construction on sites with geotechnical constraints or above underground structures; vertical extension of existing structures; and healthier indoor environments for occupants. Apart from mass timber flooring, the growing trend in lightweight timber floors for use in the multi-story market is due mainly to the surge in land prices in large cities [5].
The “Deem-to-Satisfy” (DTS) provisions within the Australian National Construction Code (NCC) 2016 stimulated the use of timber and EWPs to a height of 25 m or eight storeys and was a primary driver for the construction industry to re-think the use of timber in mid-rise buildings [6]. The development of a local capacity to manufacture CLT and the broader use of computer-controlled machining equipment both have facilitated the prefabrication of EWPs and expedited the construction of multistorey timber buildings such as 25 King Street in Brisbane, International House Sydney, and The Atlassian Sydney HQ (proposed completion in 2025), a 40-storey hybrid structure with 4-storey CLT timber buildings [7]. Such investments align with the United Nations Sustainable Development Goal 11, UNSDG-11:2015 [8], to make cities safe, resilient, and sustainable. Incentives of $300 million from the Clean Energy Finance Corporation (CEFC), the federal government’s green funding body (February 2022), to use CLT in mid-rise projects, play a pivotal role in the broader use of timber in mid-rise construction, a trend seen internationally. Over 1300 mass timber projects had been constructed or were in the design phase in all 50 states in the US in 2021 [9], and hybrid glulam–CLT–concrete construction systems such as the Mjøstårnet Tower in Norway are increasingly being adopted in high-rise timber buildings. However, due to the lack of understanding regarding the vibration characteristics and acceptance requirements (occupant comfort) of long-span timber and hybrid timber floors, such construction types are typically disregarded by architects, engineers, and builders at the design stage [10,11].
This study presents a comprehensive review of existing measurement, evaluation, and design methods for assessing vibrations in timber floors under walking excitations, drawing from various international standards and guidelines. The objective is to highlight the absence of a universally accepted harmonized approach for designing long-span timber floors to walking-induced vibrations. Furthermore, through the analysis of case studies presented in this article, it becomes evident that current methods and equations often fail to accurately predict measured responses such as acceleration and velocity. As a result, this paper concludes by offering a comparative analysis of existing methods and proposing potential avenues for future research in this field.

1.1. Industry Challenge

Quantifying floor vibrations in terms of serviceability limit states (SLS) in engineering terms is difficult, particularly when the perception of floor liveliness is inherently subjective [12]. In 2015, 120 structural engineering practitioners from 10 different countries participated in a survey conducted by The Institution of Structural Engineers (IStructE) [13]. Over 40% identified drawbacks in design codes, and almost a quarter stated they had received adverse complaints of dynamic movement from walking and running in designs that were considered code compliant. About 30% had experienced vibration serviceability problems in timber floors compared to <13% in concrete floors. Vibration design approaches for timber flooring have evolved since the mid 1990s, mostly in Europe [14,15] and Canada [16], where such research has established significant insight into floor vibration and the influencing parameters or factors affecting human response, frequency components, vibration magnitude, and damping. Incorporated in limited standards, namely, the National Standard of Canada, CSA 086:19 [16], and Eurocode 5-1-1:2004 [15], the method outlined in Section 5.4.5 of CSA-086 (Canadian standard) [16], for example, uses a criterion that compares static deflection and fundamental floor frequency with a proposed limit and gives a pass/fail vibration criterion. The method does not provide any information on the vibration performance of the floor and is not calibrated for the long-span mass timber floor systems. Eurocode 5-1-1:2004 [15] uses static deflection and peak unit impulse velocity limits but is confined to residential floors with spans up to 6 m and a fundamental frequency of >8 Hz. The accuracy of the Eurocode 5-1-1:2004 [15] method has been challenged by researchers such as in [17,18]. Australian Standard AS/NZS 1170.0 [19] recommends a static deflection limit <2 mm under a 1 kN load to evaluate the vibration performance of a floor. However, the static response parameter is an approximation and does not necessarily provide satisfactory results, as a number of complaints from New Zealand building occupants has shown [20].
In the absence of a commonly agreed-upon standard or guideline, most engineers in Australia and internationally use guidelines developed for concrete and concrete–steel composite floor systems, namely, SCI-P354 [21] by the Steel Construction Institute, CCIP-016 [22] by the Cement and Concrete Industry, Steel Design Guide Series DG 11 [23] by the American Institute of Steel Construction (AISC), and OS-RMS90 [24] by the ArcelorMittal European Commission (Steel manufacturer) in their design for vibration of timber floors. The vibration response of the floor is influenced by the components that comprise the system, including slab material, connections, support systems, floor finishes such as raised access flooring commonly used in Australia, and acoustic fits. In the absence of validated load models and dynamic properties of LSTFs, engineers often adopt footfall-induced excitation forces of concrete floors and assume conservative damping values to design LSTFs. These conservative assumptions cause oversizing of the LSTF structural elements, which may result in forsaking a timber design, as was the case when 16 timber floors were tested by Chang et al. [18] in completed buildings with no adverse comments, and found that if the criteria proposed in SCI-P354 [21] developed for concrete and composite steel and concrete floors were enforced in the design stage, then most of the timber floors would not have been built in the first place. Clearly, there is a requirement to determine reliable floor properties and develop validated methods that can predict the vibration response of the LSTFs accurately. Architects, engineers, and builders also demand increased knowledge about the performance and design of long-span lightweight mass timber and hybrid timber floors.

1.2. Long Span Timber Floor Systems

Two types of timber floor systems are common: (1) a cassette-type floor with steel-wood board truss, laminated veneer lumber (LVL) or glulam web and particleboard, plywood, oriented strand board (OSB), LVL or CLT flanges (panels), and (2) a plate-type floor with CLT, CLT with concrete topping panels supported on CLT walls, LVL or glulam beams, or combinations of those. For the sake of referral in this article, long-span timber floors (LSTFs) are divided into lightweight LSTF and mass timber and hybrid LSTFs. Some examples of LSTFs used in projects across Australia are presented in Figure 1.
Lightweight LSTF construction is popular in buildings of two or more storeys in Australia. Such a system consist of a floorboard (particleboard) supported on steel trusses with bracings (Strongbacks). The cassette floors are prefabricated in a factory and lifted into place with a crane. The electrical or plumbing services are run through the open webs of the trusses. The lightweight LSTF can increase construction speed compared to built-on-site floors and are suitable for multistorey buildings. These systems are typically supported by steel bearer beams. In lightweight LSTFs, the vibration issue may be related to the bearer beams and/or the floor panel.
Mass timber and hybrid LSTFs have vibration issues due to the relatively lower mass and stiffness of CLT floors compared with those made from reinforced or post-tensioned concrete. The benefits of low wood mass and improved dynamic performance of the conventional CLT floors are possible due to novel concepts such as (a) a ribbed-deck made from CLT deck and LVL or glulam ribs; (b) a CLT band-beam system using wide flat beams made from CLT; and (c) composite systems such as a CLT floor supported on a steel frame and a delta beam–CLT hybrid using CLT, a steel beam, and concrete topping (see Figure 1).

2. Systems View of Vibration: Evaluation, Perceptibility, and Comfort

The vibration of building floors can arise from different sources and in different forms and periods [25]: (1) footfall, running, and aerobics; (2) machinery and equipment; (3) vehicular traffic, rail traffic, and forklifts; (4) ground-borne, structure borne, and airborne; (5) steady-state, episodic, and periodic; (6) harmonic, pulse, and random; and (7) moving and stationary. While the building may be isolated from external sources [26], vibration due to internal sources and, most importantly, pedestrian traffic is a major concern in the design of floors. A problematic floor requires major modifications to the mass, stiffness, or damping of the floor system to be modified [27]. Therefore, depending on the usage of the floor and at a conceptual design stage, the vibration performance of the floor must be assessed based on the acceptable levels and standards. Human perception of vibration, however, is considered psychological [28], as a person’s reaction to floor bounciness is not entirely due to the amplitude of vibration but partly based on the delicacy of the activity being performed as well as the accompanying visual and auditory stimuli [21,28].
Evaluation of vibration levels requires the determination of the dynamic characteristics of the floor, and calculation of the response at the receiver. Dynamic characteristics can be found from mathematical models that either use a continuous mass distribution or a discrete mass distribution. In a continuous medium, the vibration propagates in continua based on principles of wave propagation theory. Transmission properties are determined analytically or experimentally using frequency response functions (FRFs), transfer functions, or as functions of time. In a discreet mass distribution, the structure is analyzed as an equivalent single-degree-of-freedom (SDOF) or multiple-degrees-of-freedom (MDOF) models, and the vibration response is calculated from superposition of modes [29]. The response of the floor system to regular excitations (such as walking, running, and aerobic activities) can be divided into steady-state and transient categories. Figure 2a presents acceleration–time histories of two systems; both depict transient responses, initially, which turn into steady-states after a certain time, as seen in the settlement of the waveforms. In both responses in Figure 2a, the transient amplitude is not significantly larger than that of the steady-state. This behavior is known to be related to a floor system with a low frequency (compared to the excitation frequency). If the floor frequency is high compared to the walking frequency, an impulsive response (see Figure 2b) is observed, where the transient amplitude is much larger than the steady-state, and a series of impulses is recorded [21,22].
Figure 2. Different types of responses of a floor system to vibration [21] showing (a) steady-state, and (b) transient and impulsive.
Buildings 13 01756 g002

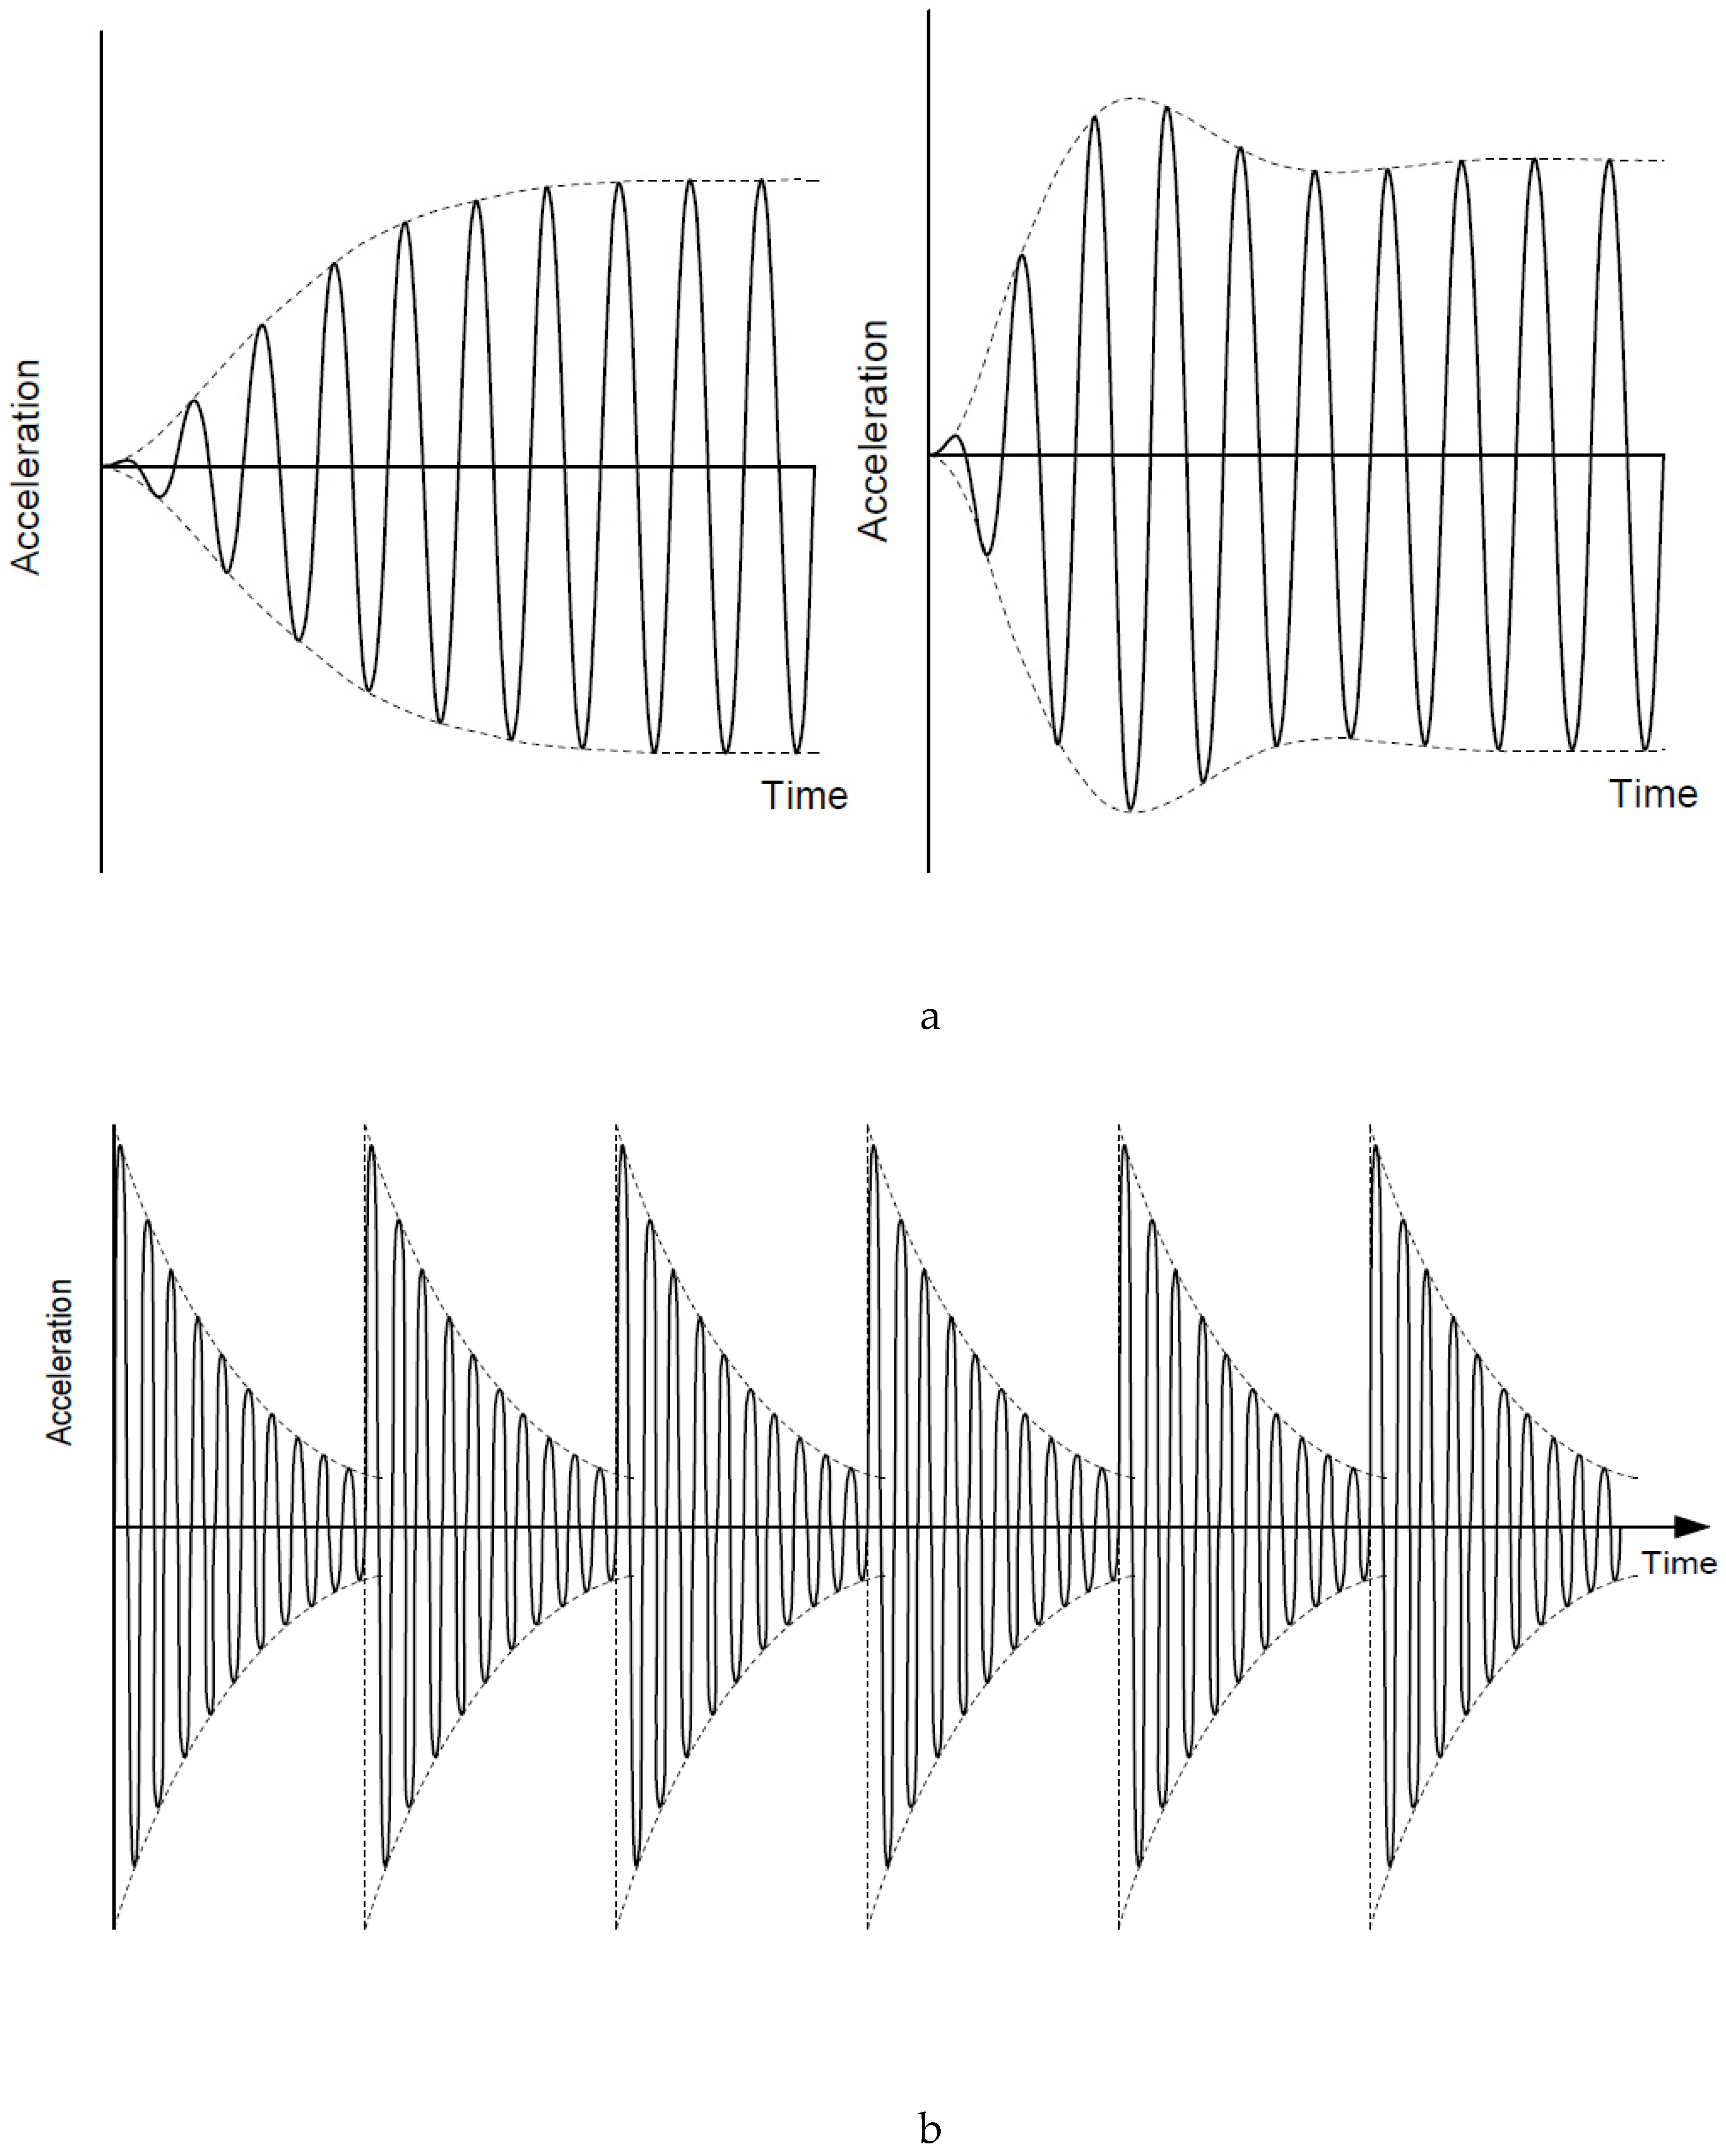
2.1. Vibration Evaluation According to ISO 2631-1 (AS 2670.1)

ISO 2631-1 (AS 2670.1) [30] provides information on the possible effects of vibration on health, comfort, and perception (frequencies from 0.5 Hz to 80 Hz) and on the incidence of motion sickness (frequencies from 0.1 Hz to 0.5 Hz) and defines evaluation methods that are used as the basis for limits such as accelerations. ISO 2631-1 [30] defines principal relevant basicentric coordinate systems that are used to measure the direction at a point from which vibration enters the human body, as shown in Figure 3a. The building vibration z-axis base curve for acceleration (foot-to-head vibration direction) from ISO 2631-1 [30] is also shown in Figure 3b. ISO 2631-1 [30] recommends the quantity of vibration magnitude be measured in the form of acceleration. However, at low frequencies and low vibration magnitudes (such as in buildings), velocity measurements are also acceptable. General requirements for signal conditioning and duration of measurement are given in ISO 2631-1 [30]. The duration of measurement and the filter bandwidth affect the measurement accuracy. Typically, a measurement error smaller than 3 dB with a confidence level of 90% is required using a one-third octave bandwidth. The vibration is evaluated based on the measurements of the weighted root-mean-square (RMS) acceleration aw:
a w = 1 T 0 T a w ( t ) 2 d t
where aw (t) is the weighted acceleration as a function of time in meters per second squared (m/s2), and T is the duration of the measurement. Equation (1) is recognized as a basic evaluation method and is known to be a good description of the steady-state response (see Figure 2a) with low crest factors, where the crest factor is defined as the modulus of the ratio of the maximum instantaneous peak value of the frequency-weighted acceleration signal to its RMS value. If the response is associated with high crest factors, i.e., greater than 9 [30] or greater than 6 [31], and in case of occasional shocks and transient vibrations (see Figure 2b), ISO 2631-1 [30] recommends alternative methods: (i) the running RMS method, and (ii) the fourth power vibration dose method. In the running RMS method, evaluation is based on using a short integration time constant, t0:
a w ( t 0 ) = 1 τ t 0 τ t 0 [ a w ( t ) ] 2 d t ,
where τ is the time (integration variable) recommended to be equal to 1 (s) in measuring the maximum transient vibration value (MTVV):
MTVV = max[aw(t0)].
The fourth power vibration dose method uses the fourth power instead of the second power for averaging and better represents responses that are sensitive to peaks. The vibration dose value (VDV) in meters per second to the power of 1.75 (m/s1.75) is defined as
V D V = 0 T a w ( t ) 4 d t 1 4 .
According to ISO 2631-1 [29], if the following ratios are exceeded, the MTVV and VDV should be used for evaluation of comfort:
M T V V a w > 1.5 , V D V a w T 1 / 4 > 1.75 .
In addition to the vibration amplitude, its frequency content has an influence on perception and comfort. For integration of the frequency-weighted acceleration time history in Equations (1)–(4), frequency weighting should be determined from ISO 2631-1 [30]. These weightings may be adopted from analogue or digital methods, which can be represented by mathematical forms (transfer functions). The principal frequency weighting factors used in the evaluation of vibration perception and comfort are Wk for vertical and Wd for horizontal vibration. Different frequency weightings are applied to different axes of vibration. An illustration of these factors is shown in Figure 3b, which shows larger weighting factors in the 4–8 Hz range, which correspond to the high sensitivity of vertical abdominal human body vibrations (Figure 3a) and the most onerous acceleration base limits shown in Figure 4. For evaluation of the vibration in more than one direction, individual weighted acceleration RMS values derived from orthogonal directions are combined:
a V = ( k x 2 a w x 2 + k y 2 a w y 2 + k z 2 a w z 2 ) 1 2 .
The weighting (W) and multiplying factors in different axes (k) for perception and comfort criteria are given in Table 1. It should be noted that AS ISO 2631.2:2014 [32] recommends using the frequency weighting, Wk, irrespective of the measurement direction. According to ISO 2631-1 [30], 50 percent of alert and fit persons can just detect a Wk weighted vibration with a peak in acceleration magnitude of 0.015 m/s2.
Figure 3. (a) Basicentric axes of the human body [30] and human body dynamics [woodworks seminar], and (b) frequency weighting factors [30].
Buildings 13 01756 g003
Figure 4. Building vibration base curves in ISO 10137 [31] in the (a) vertical z-axis (foot-to-head vibration direction), (b) horizontal x- and y-axes (side-to-side and back-to-chest vibration directions), (c) combined directions (x-, y-, and z-axes), and (d) recommended tolerance limits in DG 11 [23] and BS 6472 [33].
Buildings 13 01756 g004
Table 1. Frequency weighting and multiplying factors for estimation of comfort and perception [30].
CriterionPositionWdKxWdKyWkKz
ComfortSeated (translational vibration)1.01.01.0
Seated (rotary vibration)0.40.50.4
Standing1.01.01.0
Recumbent1.01.01.0
PerceptionAll1.01.01.0

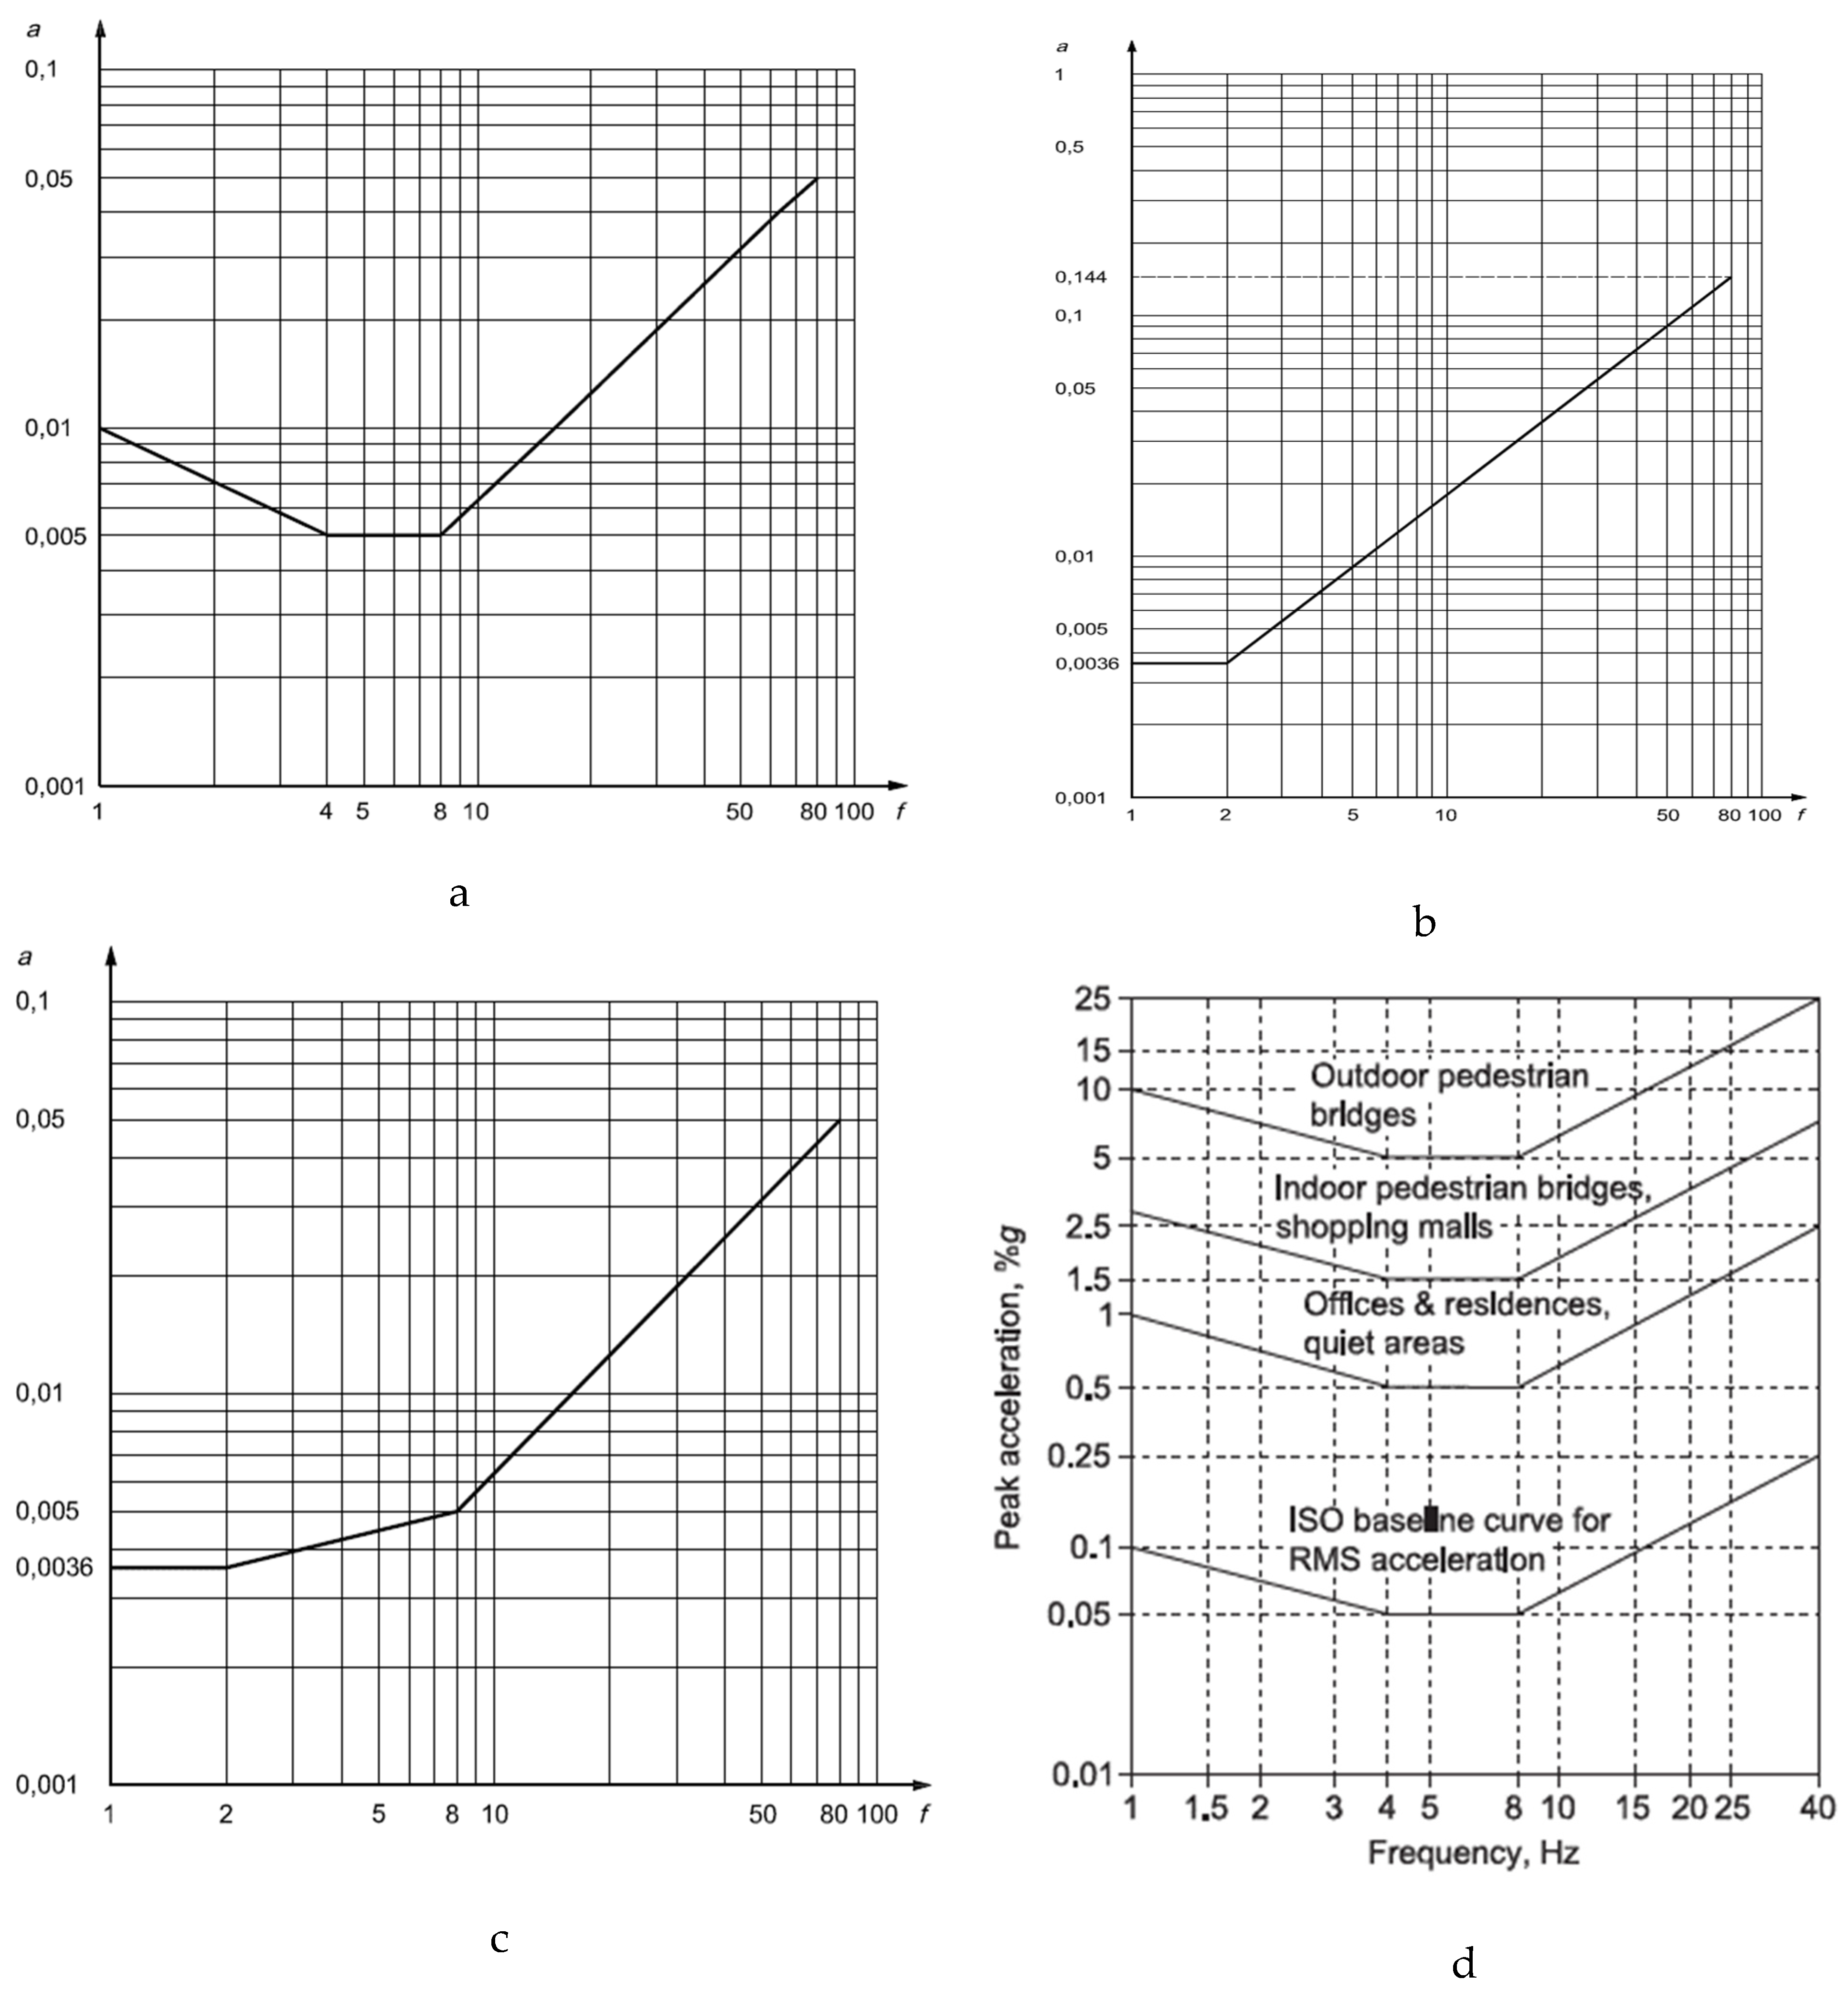
2.2. Vibration Criteria in ISO 10137

The ISO 10137 standard [31] identifies three occupancy categories for human reactions to vibrations: (1) sensitive (such as hospital operating rooms), (2) regular (offices and residential areas), and (3) active (such as exposure to heavy industrial work). The occupant responses to vibrations in buildings are influenced by direct effects (frequencies, magnitudes, duration, variability, form, directions, and exposure) and indirect effects (audible noise, visual cues, familiarity with vibration, knowledge of source of vibration, and population type). The floor vibrations fall within class b, basic threshold effects, in [31] in the frequency ranges from 1 Hz to 80 Hz. The procedure for determination of acceptability in ISO 10137 [31] is based on a comparison of factored weighted vibration accelerations with base curves and/or vibration dose values with reference values. The acceleration base curves are plotted in Figure 4 for vertical, horizontal, and combined directions, as well as tolerance limits in BS 6472 [33].
Some of the multiplying factors of continuous/intermittent and impulsive vibrations for residential and office buildings as well as VDVs for residential buildings are represented in Table 2. Exceeding these values is expected to lead to various degrees of adverse comments. As defined in [34], continuous vibrations are those with an interrupted duration of more than 30 min per 24 h, and intermittent vibrations surpass 10 events in 24 h. ISO 10137 [31] suggests an empirical equation to define the relationship between the number and duration of an event, and the magnitude of vibration on the human response. This is proposed through a factor, F, that should be further multiplied by the multiplying factors in Table 2.
F = 1.7 N e 0.5 T d ,
where Ne is the number of events in a 16 h period (daytime), T is the duration of the impulse and decay signal for the event (in seconds), and d is the duration stimuli, taken as zero for T < 1 s, 0.32 for wooden floors, and 1.22 for concrete floors. Assuming a 15 s event with 50 repetitions (walking in an office scenario), Equation (7) gives F values equal to 0.1 and 0.009 for wooden and concrete floors, respectively, which is almost a tenfold difference.
Table 2. Multiplying factors and VDVs in [22,35].
Multiplying Factors to Base Curves in Figure 4
Building UsageTimeContinuous and
Intermittent Vibration
Impulsive Vibration
ResidentialDay2–430–90
Night1.41.4–20
Office and SchoolDay4 *60–128
Night4 *60–128
Vibration Dose Values (m/s1.75) in Equation (4) from BS 6472 [36]
Building usageAdverse comment
unlikely
Adverse comment possibleAdverse comment probable
Residential 16 h day0.2–0.40.4–0.80.8–1.6
Residential 8 h night0.130.260.51
* A value of 2 is recommended for a quiet office.

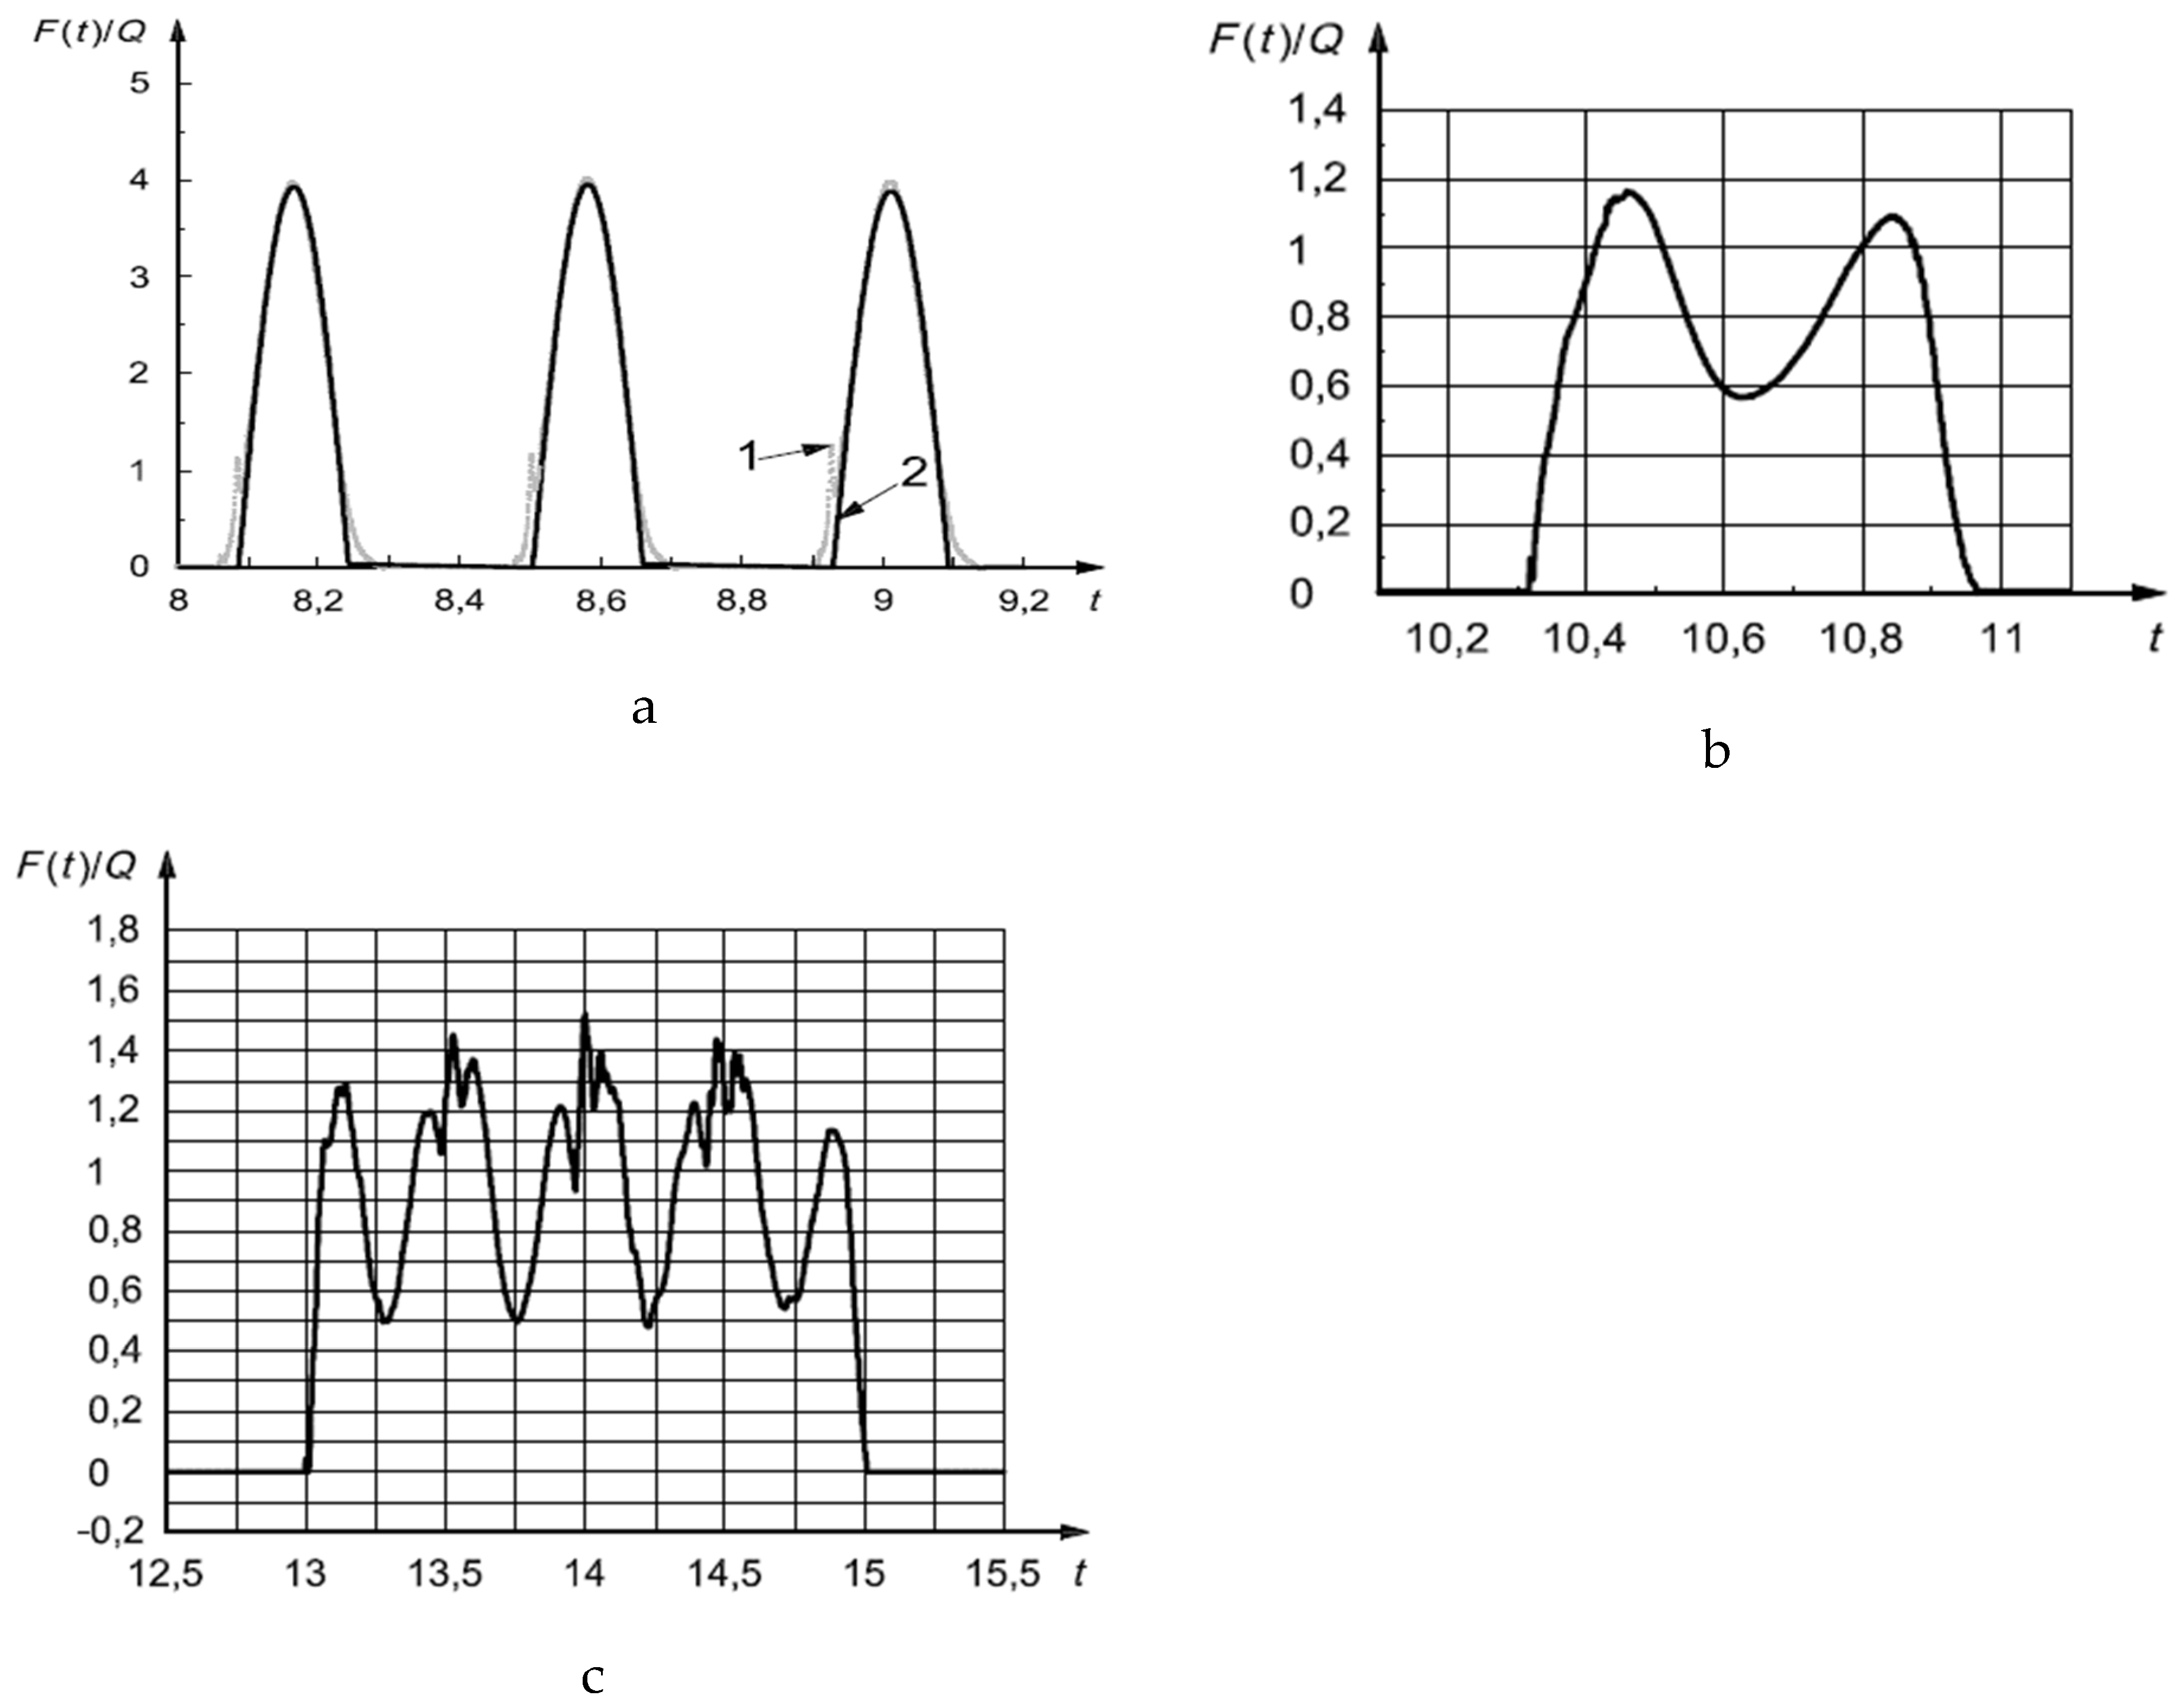
3. Dynamic Actions Applied to the Floor

The dynamics of walking were incorporated into standard ISO 10137 [31] in the form of time history of vertical forces against stiff ground for one person walking step by step and one person jumping continuously. The equations are based on works of Kerr [36], which include 882 measured footfall time histories, and those mentioned in the technical report by the European Commission, EUR 21972 [35], which is based on comprehensive studies of people walking at frequencies between 1.5 Hz and 2.2 Hz. These studies define force for a train of steps (periodic excitation), F(t), expressed in the frequency domain (f) using a Fourier series:
F ( t ) = Q 1 + n = 1 k α n sin ( 2 π n f w t + ϕ n ) ,
where Q is the static load of the walker with a recommended value of 746 N in SCI-P354 [21] and 700 N in CCIP-016 [22]. The Fourier coefficient αn and phase angle Øn correspond to the nth harmonic, and the number of harmonics k should be adequate to model the time history of the walking load. Examples of Equation (8) are illustrated in Figure 5 [37]. Table 3 compares parameters of the periodic excitation in Equation (8) from different standards and guidelines. The harmonic force in Equation (8) assumes the walking load to be perfectly periodic.
Table 3. Design Fourier coefficients for periodic walking force, F, in Equation (8) outlined in standards and guidelines.
ISO 10137 [31]CCIP-016 [22]SCI-P354 [21]AISC DG 11 [23]
Harmonic Number
n
Forcing
Frequency fw (Hz)
Fourier
Coefficient
αn
Harmonic Number
n
Forcing Frequency
fw (Hz)
Fourier
Coefficient
αn
Harmonic Number
n
Forcing Frequency fw (Hz)Fourier
Coefficient
αn
Harmonic Number
n
Forcing Frequency fw (Hz)Fourier
Coefficient
αn
11.2 to 2.40.37f − 0.3711–2.80.41f − 0.3895 < 0.5611.8–2.20.436f − 0.414211.6–2.20.5
22.4 to 4.80.122–5.60.069 + 0.0056f23.6–4.40.0738 + 0.012f23.2–4.40.2
33.6 to 7.20.0633–8.40.033 + 0.0064f35.4–6.60.0364 + 0.021f34.8–6.60.1
44.8 to 9.60.0644–11.20.013 + 0.0065f47.2–8.80.014 + 0.028f46.4–8.80.05
56.0 to 12.00.06>4>11.20>4>8.80
The walking force can also be represented by an effective impulse of short duration that produces the same structural response as the direct application of the walking force–time history. ISO 10137 [31] recommends an approximate method for identifying the response to human impacts, by applying an impulse equal to the area under the force–time history curve of the footfall activity, to the modal mass of the floor. Empirical equations for equivalent impulsive forces are:
F I = 60 f w 1.43 f n 1.3   SCI-P354   ,   F I = 54 f w 1.43 f n 1.3   CCIP-016   ,
where FI is the impulsive force in N.s, fw is the walking frequency in Hz, and fn is the frequency of the mode in consideration in Hz. A comparison between recommendations of different guidelines and standards shows significant discrepancies. Moreover, the aforementioned expressions are based on measurements of dynamic vertical forces applied to stiff ground (concrete floors) and may not be applicable to long-span timber floors [38]. The walking frequency, fw, that may occur is between 1.5 Hz and 2.5 Hz [39]; however, the probable range is between 1.8 Hz and 2.2 Hz. This pace significantly changes in staircases and can be as high as 4.5 Hz. ISO 10137 [31] recommends considering only two harmonics for the evaluation of the forces (Equation (8)) with Fourier coefficients of 1.1. The dynamic forces in Equations (8) and (9) are for a single person walking. In group activities, variations will exist in frequency, phase angle, and Fourier coefficient. ISO 10137 [31] recommends a coordination factor C(N) ≤ 1.0 be multiplied by the single person dynamic force function:
F ( t ) N = F ( t ) × C ( N ) ,
where N is the number of participants. The coordination effect varies with the complexity of the motion and can be taken as 1 for simple activities or C(N) = 1/√N for uncoordinated group movements, with a conservative phase angle of 90° for harmonic contributions below resonance.
Figure 5. Dynamic actions F(t) on floors normalized to the walker’s weight, Q, in ISO 10137 [31] showing (a) vertical force against stiff ground for one person jumping continuously, where 1 and 2 are measured and sinusoidal curve-fit, respectively; (b) vertical force against stiff ground for one walking step by one person; and (c) force function for one person walking across an instrumented 3 m long slab, and different measured step patterns (Wheeler [37]).
Buildings 13 01756 g005

4. Floor Dynamics

The prediction of vibration in floor systems requires the determination of vibration modes, associated frequencies, and damping values [40]. To assess the floor systems against serviceability criteria, the floors are categorized into (i) low-frequency floors and (ii) high-frequency floors. Table 4 represents the cut-off frequencies for the distinction of the two categories in general floors in buildings from previous works and different standards and guidelines. The cut-off frequencies range from 7 Hz to 10.5 Hz, and there is no clear quantitative measure that separates the two categories. The governing equation of motion of the timber floor as an orthotropic plate with a constant density of ρ and assuming a continuous system, in the x–y plane, with a thickness of h (in the z-axis corresponding to a deformed shape defined by w), Young moduli of E1 and E2, corresponding Poisson ratios of ν1 and ν2 (E1ν2 = E2ν1), and a shear modulus of G, under the action of a transient dynamic force function F(x,y,t), which is (kN/m2), takes the following form [41]:
D 1 4 w ( x , y , t ) x 4 + 2 D 3 4 w ( x , y , t ) x 2 y 2 + D 2 4 w ( x , y , t ) y 4 + ρ h 2 w ( x , y , t ) t 2 = F ( x , y , t )
where D1 to D3 are flexural stiffness, and Dt is the torsional stiffness defined as
D 1 = E 1 h 3 12 ( 1 ν 1 ν 2 ) ,   D 2 = E 2 h 3 12 ( 1 ν 2 ν 1 ) ,   D t = G h 3 12 ,   D 3 = ν 1 D 2 + 2 D t .
The term at the right-hand side of Equation (11) is force per unit surface. The supports are typically assumed to be simply supported or fixed at two opposite edges or at all sides based on the beam grid (or wall support) conditions in the building system and are considered as boundary conditions in Equation (11) for a floor with orthogonal spans of Lx and Ly:
x = 0 ,   x = L x :   w = 2 w x 2 = 0   ( Simply   supported ) w = w x = 0   ( Fixed ) y = 0 ,   y = L y :   w = 2 w y 2 = 0   ( Simply   supported ) w = w y = 0   ( Fixed )
Most cassette-type timber and CLT/hybrid floor systems in lightweight and mass timber construction are considered to have one-way action, where the flexural rigidity on one direction becomes dominant, and thus Equation (11) can be reduced to an isotropic form [42].
Table 4. Definition of general floors in buildings based on the fundamental natural frequency fn of the floor system.
Standard/GuidelineLow-Frequency FloorHigh-Frequency Floor
ISO 10137 [31]8 Hz < fn < 10 Hz or smaller10 Hz < fn
SCI-P354 [21]fn < 10 Hz10 Hz < fn
CCIP-016 [22]fn < 10.5 Hz10.5 Hz < fn
AISC DG11 [23]fn < 9 Hz9 Hz < fn
Toratti and Talja [40]fn < 10 Hz10 Hz < fn
BS 6472-1:2008 [34]7 Hz < fn < 10 Hz or smaller10 Hz < fn
Allen and Murray [43]fn < 9 Hz9 Hz < fn
Wyatt and Dier [44]fn < 7 Hz7 Hz < fn
Ohlsson [45]fn < 8 Hz8 Hz < fn

4.1. Frequency, Mode Shape, and Modal Mass in One-Way and Two-Way Spanning Floor Systems

Assuming a one-way spanning floor system, the natural frequency, fn, may be calculated from a beam formulation. For a beam with a flexural stiffness of EI, length of L (m), and distributed mass (kg/m) using SI units, the frequency of the nth mode in Hz is
f n = k n 2 π E I m L 4 ,
where kn is the boundary condition factor, equal to π2, 22.4, and 3.52 for the first mode of idealized conditions: simply supported, fixed and cantilevered beams, respectively. If the end-fixities cannot be idealized, the supports can be modelled with elastic springs, and some kn values are recommended in [46]. Of interest in floor vibration analysis is the fundamental natural frequency, f1, the lowest frequency normally associated with a bending mode shape. The fundamental frequency of the floor (beam analogy with appropriate kn) is related to its mid-span deflection δ (mm), under self-weight (uniformly distributed), through
f 1 = 17.8 δ
While Equation (15) is usually used in plain floors, in a composite floor system made of a thin slab with a frequency of fs, supported by secondary beams and primary beams of frequencies fb and fp, respectively, a more accurate expression normally known as Dunkerly’s modal decomposition [47] is used:
1 f 1 2 = 1 f s 2 + 1 f b 2 + 1 f p 2
Mode shapes of a simply supported beam for a mode n, are represented by a non-dimensional amplitude, μn (a value normalized to unity for the first mode), and are shown in a sinusoidal form at different positions denoted by x, to calculate the shape function μn(x), which can be multiplied by a time function, ψn(t), to yield wn(t) from a modal superposition:
μ n ( x ) = sin n π x L ; ψ n ( t ) = sin ( 2 π f n t ) w n ( x , t ) = n = 1 u n sin ( 2 π f w t + ϕ n ) sin ( n π x L )
where µn and Øn are related to the dynamic walking force, calculated from methods explained in Section 3. Using a beam analogy, the mode shapes of the floor system will only account for the flexural modes, where the torsional and transverse modes are ignored. However, a recent report for Forest and Wood Products Australia [48] shows experimental results of a simply supported CLT slab with a torsional second mode that has a significant modal contribution in the vibration response. Adopting a two-way spanning floor system analogy, frequency and mode shapes can be approximated by mathematical equations, though modal parameters are normally calculated from a finite element (FE) modal analysis. The fundamental frequency of a CLT floor (strong direction-x) from the unforced governing equation (Equation (11)) and parameters defined in Equation (12), and corresponding mode shapes are
f n , m = π 2 ρ h L x 2 i 4 D 1 + 2 D 3 i 2 j 2 ( L x L y ) 2 + j 4 D 2 ( L x L y ) 4 μ i , j ( x , y ) = sin ( i π x L x ) cos ( j π y L y )
where i and j are the number of half-sine waves in the x and y directions, respectively. In a two-way spanning system of a CLT slab with LVL or glulam beams (ribbed-deck), D3 should be used to consider the torsional rigidities of the supporting beams. In both one-way and two-way spanning systems, dynamic values of the Young’s modulus of the materials should be used. In hybrid systems with concrete sections, allowance should be made for the cracked stiffness under service loading [22]. The modal mass of the floor is related to the kinetic energy in the system and is an indication of the amount of mass involved in each mode shape. In each mode shape, the mass contribution, Mn, can be calculated by finding the maximum kinetic energy in the mode:
M n = 0 L x 0 L y ρ h μ i , j ( x , y ) 2 d y d x
where ρ is the mass per area of the floor with a thickness of h, and μ is the mode shape in the longitudinal and transverse directions. In a one-way spanning system and using the beam analogy, the modal mass is equal to ρhL/2 in all mode shapes. Exact solutions for calculation of dynamic properties of floors are complex to drive. For thick orthotropic plates, solutions are rare and mostly consider the plate as a 2D laminate such as the equivalent single layer (ESL) method used by [49]. Most engineers use finite element analysis (FEA) to obtain the floor dynamic properties such as frequency and modal mass for each mode shape. In cassette floor systems, the panel is modelled with shell elements and studs, while chords and joists are modelled with beam or link elements. In plate-type floors using classic laminate theory, CLT can be modelled with layered shells perfectly bonded together, where the equivalent stiffness values of boards in each layer are used to define the mechanical properties. Connections play an important part in the dynamic response of the timber floor systems. Bolts, screws, and tie plates are normally simplified in the FEA with translational and/or rotational springs. A comprehensive discussion on this topic can be found in the FPInnovations CLT Handbook [50]. Dynamic properties of the floor can be measured physically using experimental modal analysis (EMA). To excite the floors, two approaches, namely, (i) modal hammer testing, and (ii) shaker testing are employed. In modal hammer testing, the floor is hit with a modal hammer that excites a wide frequency range. The impulse energy is a function of mass and velocity of the hammer. Modal hammers with different masses and hammer tips can be used for different floor systems. Although modal hammers are efficient in laboratory testing of simple slabs, the method is not recommended for more complex structures and composites [51], and thus a shaker is used. In shaker testing, the floor is excited using a shaker, and the force is measured via a force transducer that is connected to the shaker with a connection rod (stinger). A random excitation technique is typically used due to its efficiency and the advantage of averaging the signal that can be limited to the frequency range of interest (normally less than 100 Hz in floors). A grid of accelerometers is placed on the slab, and the floor response is measured using a single input multiple output (SIMO) technique. In the SIMO method, the vibration response is recorded at several locations, simultaneously, while the floor is excited at a single point. The modal parameters will be calculated from FRFs by normalizing the response to excitation recordings. The frequency response matrix H takes the following form [52]:
X 1 X 2 X n = H 11 H 12 H 1 n H 21 H 22 H 2 n H n 1 H n 2 H n n F 1 F 2 F n H i j ( ω ) = X i ( ω ) F j ( ω ) = Response   @   i E x c i t a t i o n   @   j
where Xi(ω) is the Fourier transform of the response xi(t), and Fj(ω) is the Fourier transform of the excitation fi(t). In the SIMO method, using a modal hammer, excitation at each point on the floor gives information for a single row, whereas using a shaker yields data for a unique column of H. By using a grid of accelerometers and/or moving the hammer and shaker, the complete frequency response matrix can be generated. Defining cross-spectral density, GXF, load signal spectral density, GFF, and response signal spectral density, GXX, the validity of the frequency response function is evaluated by the coherence function γ2:
γ 2 ( ω ) = G X F ( ω ) 2 G F F ( f ) G X X ( f ) ,
where coherence values close to one are desirable and lower than 0.75 correspond to noise in measurements. The modal parameters (frequency, damping, and shape) are calculated by curve fitting of the FRF adopting SDOF or MDOF methods. The analytical curve fitting takes the following form [53]:
H i , k = r = 1 n ( ψ i ψ k ) r ( ω r 2 ω 2 + 2 ξ r ω r ω ) ,
where n is the total number of modes (r), ψr represents residues, ωr is the un-damped natural frequency, and ζr is the equivalent viscous modal damping ratio. SDOF curve fitting is based on the analysis of a single mode at a time, and MDOF curve fitting is applied to the several frequencies or entire set of frequencies, simultaneously, and is more suitable for heavily coupled modes. The modal parameters can be calculated from numerical modal analysis (NMA), typically carried out using FEA. The consistency between NMA and EMA is assessed by measuring the linear consistency between numerical and experimental mode shapes using a statistical indicator, modal assurance criterion (MAC) analysis. The MAC is a normalized quantity, calculated as the scalar product:
M A C ( m , n ) = ψ N m T ψ E n 2 ψ N m T ψ E n ψ E n T ψ E n ,
where m and n are the modes of interest, and {ψE} and {ψN} are the experimental and numerical modal vectors, respectively. A MAC presentation of a CLT floor is shown in the case study (I) in Part 2 of this study.
Test methods for the calculation of timber floor vibration performance are outlined in ISO 18324 [54]. It is recommended to keep the excitation point near the center of the slab but not close to the nodal points of the modes of interest. This is difficult in practice and in long-span floors where frequencies are close in different mode shapes. Adequate numbers of measurement points and in appropriate configurations should be recorded. In cassette floors and ribbed-decks, ISO 18324 [54] recommends a measurement grid (usually accelerometers) of three equally spaced rows along the span direction and above joist (secondary beam) lines. For plate-type floors, the accelerometer should be placed at the middle of each timber panel as well as on each joint between two adjacent panels. The test results should be validated by a reciprocity check, where the excitation and response points are swapped, and FRFs are compared. ISO 18324 [54] recommends a coherence function check at a resonance frequency, with a coherence value not significantly lower than unity. While using an impact excitation (such as a modal hammer) the impact duration should be short to produce a wider useful frequency range that covers the range of interested natural frequencies (at least up to 4–5 times the fundamental frequency of the floor). ISO 18324 [54] provides a correction factor to Equation (18) when the operator must remain on the floor during the test.

4.2. Modal Damping

Damping is determined as the sum of structural damping, damping due to furniture, and damping due to finishes [55]. Damping values differ between modes and vary with loading scenarios and amplitudes. Moreover, damping is affected by the connection system and human–structure interaction. Damping ratios of long-span timber floors are limited [38,55,56,57], and there are no specific damping ratios available for novel timber floor systems and innovative connections in the market. Standards are very conservative, with some suggesting a damping ratio of 1%. However, boarding, sound insulation, and other floor finishes can improve the damping ratios. For instance, experiments conducted on 9 m ribbed deck floors [38] showed increases in damping ratios from 0.8% on bare floor, to 4.7% and 6.9% in modes 1 and 2, respectively, with Sylomer elastomer interlayers placed at the supports. International codes and guidelines recommend different critical damping ratios. A comparison of damping values is given in Table 5 and suggests a significant variation based on the floor system and finish. Damping can be estimated experimentally using time domain or frequency domain analyses. The easiest and most frequently used time domain methods are (i) logarithmic decrement [55], which is defined with respect to a number of consecutive cycles of vibration initiated by any method; and (ii) envelope fitting [55], which captures decrements of all consecutive cycles. Although both methods are simple, drawbacks are in their accuracy. Both methods rely on damping information only at peak displacement points. Moreover, damping ratio is amplitude dependent, which influences the decrement. Frequency domain analysis methods for experimental measurement of damping are based on the measured transfer functions and frequency response functions. The half-power bandwidth method [30] recommended in ISO 18324 [54], also known as the −3 dB (decibels) technique, finds damping η from the sharpness of the peaks in the transfer function:
η = Δ ω ω 0 = 2 ω 2 ω 1 ω 2 + ω 1
where ω1 and ω2 are half-power points from the resonant peak frequency ω0 and correspond to −3 dB down from ω0 on a dB scale. Previous studies [58,59] have shown the sensitivity of the hysteretic damping η on the accuracy of the peak location, which in turn is highly dependent on the sampling rate. The relationship between the damping loss factor η for the hysteretic case and the damping ratio ζr for the viscous case is easy-to-understand via η = 2 ζr [60].
Table 5. Recommended critical damping ratios in timber floors.
Floor TypeEN 5 [14]UK NA
to EN 5 [61]
ISO 10137 [31]HIVOSS
[62]
Hamm et al.
[63]
Timber floor1%2% 1%1%
Wood joist floor 1% to 5.5%
Plain glulam floor with sound insulation 2%2%
Girder floors and nail laminated floors * 3%3%
* with sound insulation.

5. Vibration Design Methods

Several methods are available that provide insight into floor vibration. These methods vary from simple to sophisticated methods. Simple methods require less design effort, modelling, and analysis, whereas more complicated methods have more room for flexibility, engineering judgement, and innovation. With regards to LSTFs, most engineers in Australia seem to use simpler methods for lightweight cassette type floors and more complex methods for plate type floors such as plain CLT, ribbed-deck, and hybrid floors. These methods are sorted based on the level of intricacy, presented, and discussed through this section.

5.1. Rules of Thumb

The most accepted simple rule to minimize the vibration is a limit on deflection based on the design live load. The International Residential Code (IRC) 2006 [61] for one- and two-family dwellings permits a design live load of 30 psf (1.44 kPa) for “sleeping rooms” in a residential dwelling and a live-load deflection limit of L/360. In modern living it is not unusual for occupants to use a sleeping room as an office or exercise space, and the live load can be increased to 40 psf (1.91 kPa) or even more. In the Australian standard AS 1170.1 [64], the live load is 1.5 kPa in domestic and 3 kPa in commercial spaces (excluding shopping areas, public assembly areas, dance halls, etc.). The ripple/sag serviceability limit state criterion in AS 1170.0 [19] is a combination of L/300 for dead load plus 40% live load. Moreover, for vibration serviceability, a static mid-span deflection of less than 1 to 2 mm under a 1 kN vertical load, normally referred to as d1 kN, is recommended. A study by Woeste and Dolan [65] on timber joist floors at Virginia Tech University showed that a “code compliant” floor can be problematic if the floor system has components each with natural frequencies in the 7–10 Hz range. They [65] recommend using wider spacing between joists (600 mm instead of 300 mm), since it requires deeper members with larger flexural stiffness (EI), which in turn increases the natural frequency of the system. Based on a comprehensive study, Woeste and Dolan [65] recommend (1) using a 40 psf live load for design of residential floors, (2) increasing the joist depth (larger EI) or using a deflection limit of L/600 (or L/480 for solid joists or in trusses with Strongbacks), and (3) gluing floor sheathing and using screws instead of nails to improve long-term vibration performance.

5.2. Empirical and Simplified Analytical Methods

These methods typically propose relationships between the fundamental frequency and static deflection of a floor [66]. Multiple studies [17,67,68] have shown that deflection is related to the orthogonal stiffness properties of the floor system and provides a worthy indication of its vibration serviceability. Methods of measurement of the deflection under a concentrated load based on the floor construction details and the accessibility of the measurement location are given in ISO 18324 [54]. In joisted floors, the deflection should be measured on the floor framing and at the mid-span of the center joist. If finishes, toppings, soft layers, or floating flooring is available, the measurement should be taken from under the floor and on the ceiling surface. In mass timber slab floors, deflection can be measured at the center of each timber panel. The deflection measurement device should have a precision of 1% of the expected deflection. Timber floor acceptability from the general human acceptability criterion of vertical vibration in ISO 2631-2 [32] and BS 6472-1 [34] ascertained by more than 100 field lightweight floor tests in a Canada-wide survey [17] are presented in Equation (25) and illustrated in Figure 6.
d 1 k N f 2.56 1090.31   ( lightweight   cassette   type   floors )  
where d1 kN is the measured 1 kN point load deflection in mm, and f is the measured floor fundamental natural frequency in Hz.
Figure 6. Empirical expression for acceptability of floor vibration in ISO/TR21136 [66] showing: (a) logistic regression on the database of field light frame timber floors in the across Canada occupant survey [16] and testing and validated Equation (25) (solid dark line), and (b) EN 1995-1-1:2004 [15] showing criteria in Equation (29). (Better and poorer performances are shown with arrows 1 and 2).
Buildings 13 01756 g006

5.2.1. Empirical Method in ISO/TR21136

ISO/TR 21136 [66] proposes an empirical (semi-analytical) procedure to establish acceptability criterion for CLT floors. The method is based on full-scale laboratory tests on 20 CLT configurations with thicknesses of 140 mm, 185 mm, and 230 mm in spans from 4.5 m to 8 m with variable joint details, support conditions, toppings, and ceilings [69]. The floor performance was subjectively evaluated by 20 evaluators using a questionnaire and based on a procedure outlined in [69]. The acceptability criterion based on 1 kN static deflection of a 1 m wide CLT panel with apparent stiffness of EIapp is
d 1 k N f 1.43 39 f = π 2 L 2 E I a p p ρ A   ( CLT   floors ) E I a p p = 1 1 ( E I ) e f f + 11.52 ( G A ) e f f L 2
where EIeff (Nm2) and GAeff (N) are the flexural and shear stiffness values of a 1 m wide CLT panel with a density of ρ (kg/m3), cross-section of A (m2), and length L (m). This criterion is limited to (1) CLT slab floors without ribs; (2) bare CLT floors and ignoring the stiffening effects from the finish, partition, continuity of the multi-span, and ceiling; and (3) simply supported conditions.

5.2.2. Hamm et al.

The method proposed by Hamm et al. [63] is applicable to all types of timber floors and divides the floor into higher and lower performance demands for vibration control. For a floor with a mass, m (kg/m2), length of L (m), and width of b (m), the method suggests a cut-off frequency, f (in Equation (27)), of 8 Hz with d2 kN ≤ 0.5 mm for higher performance floors and 6 Hz with d2 kN ≤ 1.0 mm for lower performance floors, where the deflection under a 2 kN static load is derived from
f = π 2 L 2 ( E I ) L m d 2 k N = 2 L 3 48 ( E I ) L b min b min = min ( b , b e f )   b e f = L 1.1 ( E I ) b ( E I ) L 4
where EIL and EIb are the effective stiffness along the span and in the transverse direction in Nm2/m, respectively. Hamm et al. [63] do not specify formula for finding the stiffness. For low-frequency floors, with f in the range between 4.5 Hz and 8 Hz, maximum acceleration values are amax ≤ 0.05 m/s2 and amax ≤ 0.10 m/s2, for higher performance floors and lower performance floors, respectively, where the maximum acceleration is defined as
a max = 0.4 F ( m ) ( 0.5 L ) ( 0.5 b ) ( 2 ξ ) 1.5   Hz < f < 2.5   Hz   F = 280   N 3.0   Hz < f < 5.0   Hz   F = 140   N 4.5   Hz < f < 7.5   Hz     F = 70   N
where F is the harmonics of the dynamic force in N, and ξ is the structural damping.

5.2.3. Combined Frequency, Deflection, and Impulse Velocity Method in EN 5:2004

EN 1995-1-1:2004 [15] divides the floors into better performance and poorer performance using three criteria for controlling vibration in residential floors, namely, (i) frequency limit, (ii) deflection limit, and (iii) impulse velocity control, as illustrated in Figure 6b. These criteria are outlined in Equation (29):
f > 8   Hz   ( i ) f = π 2 L 2 ( E I ) L m d F s a ( ii ) v = 4 ( 0.4 + 0.6 n 40 ) m b L + 200 v b ( f ξ 1 ) ( iii ) n 40 = 40 f 2 1 b L 4 ( E I ) L ( E I ) b 0.25
where m is the mass per unit area (kg/m2), L and b are the span and width (m), respectively, and v is the unit impulse velocity response, calculated as the maximum initial vertical velocity (m/s) caused by an ideal unit impulse (1 Ns) applied at a location on the floor that gives the maximum response. The equation for calculating v in a square floor simply supported on all four edges is given in Equation (29). Similar to Hamm et al. [63], EC 1995-1-1:2004 [15] does not propose equations for finding EIL and EIb. EC 1995-1-1:2004 [15] accounts for the modal input in Equation (29) by introducing n40, which is the number of first-order modes with natural frequencies up to 40 Hz. Fs is the static vertical force applied at any point on the floor, and d is the corresponding maximum instantaneous deflection under the load. The deflection limit, a, is shown in Figure 6b. EC 1995-1-1:2004 [15] specifies that the method is applicable for an unloaded floor (only self-weight is included) and does not clearly give a method for finding deflection under the static load.

5.2.4. Vibration-Controlled Span Method in CSA 086:19

CSA 086:19 [16] has a vibration-controlled span approach for single-span wood joisted floor systems with prefabricated wood I-joists and a wood structural panel subfloor. The maximum recommended span lv (m) is
l v = 0.122 ( E I e f f ) 0.284 k t s s 0.14 m L k t s s = 0.0294 + 0.536 k 1 0.25 + 0.516 k 1 0.5 + 0.31 k 1 0.75
where EIeff (Nm2) is the effective flexural stiffness of the floor system in the span direction, ktss is a factor that accounts for the flexural stiffness in the transverse direction (for k1 see A.5.4.5.1.3 from CSA 086:19 [16]), and mL is the mass per unit length (kg/m) of the composite floor system. A composite floor system includes joists, the subfloor, and the topping (if any). The stiffness in longitudinal and cross-span directions are calculated using equations in CSA 086:19 [16], which account for composite actions from bending and axial contributions of each module in the composite floor system. For vibration control of prefabricated wood I-joist floors, other conditions are imposed in CSA 086:19: (1) subfloor thickness should be less than 28.5 mm (typical subfloors used in Canada are OSB, while in Australia particle board is more common), (2) in multi-span floors the effective composite joist bending stiffness factor should be 1.2, and (3) the stiffness contribution of a concrete topping should not be applied.

5.2.5. One Step Root Mean Square Method in HIVOSS:2007

The method was developed by ArcelorMittal [62] (a steel manufacturer) in their design for vibration of floors and is based on the statistical distribution of walking frequencies, fw, and body weights, Q, measured at the TNO building in Delft from 700 persons [35]. Twenty classes of body mass and thirty-five classes of step frequency were used in conjunction with polynomial curve-fit footfall contact forces due to a single step and were used to develop design charts. A design value OS-RMS90, called the “one step root mean square 90”, was developed that covers the response velocity, v, of the floor filtered using the weighting function in Equation (31) for a significant step with an intensity of 90% of people walking normally:
v R M S = 1 T 0 T v ( t ) 2 d t v = 1 v 0 1 1 + ( f w f w 0 ) 2 v 0 = 1.0   mm / s   f w 0 = 5.6   Hz  
The engineer finds fundamental frequency and corresponding modal mass from FEA or simple equations [46], chooses a proper value for damping, and classifies the floor from the provided design diagrams from A to F. The procedure and a typical design diagram for 3% damping are shown in Figure 7. Based on the utilization of the floor, acceptability is assessed as recommended, critical, or not recommended. In calculating the dynamic properties of the floor, a fraction of the live (imposed) loads, normally between 10 and 20% for residential and commercial buildings, is incorporated. Damping is determined by the summation of (1) the structural damping (6% recommended for wood, 2% for concrete, and 1% for steel), (2) damping due to furniture (0% in schools and gyms; 1% for residential dwellings, libraries, and open plan offices; and 2% for crowded offices with cubicles), and (3) damping due to finishings (0% for free floating floor to 1% for floors with ceilings and screeds). In derivation of the acceptability charts of HIVOSS [62], the OS-RMS90 [35] factors are harmonized to the multiplying factors of vibration limits for continuous vibration specified in ISO 10137 [31].
Figure 7. The HIVOSS:2007 [62] floor evaluation procedure showing: (1) frequency distribution of body mass and step frequency for a population of data of 700, (2) the OS-RMS90 [35], (3) floor classification for 3% damping, and (4) acceptability based on the floor utilization.
Buildings 13 01756 g007

5.2.6. Floor Performance vs. Floor Usage in prEN 1995-1-1: 2025 (Final Draft)

The revised prEN 1995-1-1:2025 (Final Draft) [70] gives recommendations for vibration design of joisted, rib type (deck supported by a plate–beam composite structure), and slab type (deck supported by a plate structure such as CLT or LVL slab) floors. In floors with a fundamental frequency less than 8 Hz, acceleration vibration should be checked, and for floors with a fundamental frequency equal or greater than 8 Hz, the vibration velocity should be verified. prEN 1995-1-1:2025 (Final Draft) [70] has a general formula for calculation of frequency of a floor with length, L, and width, B (both in meters), that applies to single or multi-span floors subject to uniform load.
f 1 = k e 1 k e 2 π 2 L 2 ( E I ) L m k e 2 = 1 + ( L B ) 4 ( E I ) T ( E I ) L f 1 = k e 1 k e 2 18 w s y s
where m is the floor mass per unit area (kg/m2), including weight of partitions and a 10% additional imposed load; and ke1 and ke2 are multi-span and transverse stiffness factors, respectively, and both can be taken as one for a single span and one way spanning floors. Floor stiffness in the span direction and transverse to it are represented with EIL and EIT, respectively. No clear guide is given for the calculation of these stiffness values. The simpler formula for deriving the fundamental frequency in Equation (32), which uses wsys, is the deflection of a single bay of the floor system under floor mass, m, where ke1 and ke2 can both be presumed to be equal to one in floors with flexible supports if transverse bending is considered. For a two-span floor system, values of ke1 are represented in prEN 1995-1-1:2025 (Final Draft) [70] and vary from 1 to 1.31 for floor span ratios of 1.0 and 0.2, respectively. The deflection criterion in prEN 1995-1-1:2025 (Final Draft) [70] is based on a simply supported single span assumption of length L and an effective width of bef:
b e f = min 0.95 L ( E I ) T ( E I ) L 0.25 , B
The derivation of RMS acceleration is given in Equation (34):
a r m s = α F 0 7 ξ M α = e 0.4 f 1 M = m L B 4
The weight of a walking person, an F0 of 700 N, is recommended, and a simple expression for calculation of the Fourier force coefficient, α, is given. In the absence of on-site testing applying EN 16929 [71], the following modal damping ratios, ζ, are proposed: 2% for joisted floors; 2.5% for timber–concrete, rib type, and slab type floors; 3% for joisted floors with a floating floor; and 4% for timber–concrete, rib type, and slab type with a floating floor. The reduction factor of 1/7 in Equation (34) comes from 0.4 × 1/√2, where the factor of 0.4 assumes that the resonance may not be due to an excitation in the center of the floor. This non-conservative assumption may be altered by the design engineer, for example, in long corridors. The derivation of velocity vibration response is given in Equation (35). The mean modal impulse, Im (Ns), is calculated based on a walking frequency, fw, of 1.5 Hz in residential floors and 2.0 Hz in other floors. The peak fundamental velocity, v1,peak, is amplified using a multiplier factor, kimp, that accounts for higher modes in the transient response.
v r m s = v t o t , p e a k ( 0.65 0.01 f 1 ) ( 1.22 11 ξ ) η η = 1.52 0.55 k i m p if 1.0 k i m p 1.5 else η = 0.69 k i m p = max 0.48 B L ( E I ) L ( E I ) T 0.25 , 1.0 v t o t , p e a k = k i m p v 1 , p e a k v 1 , p e a k = 0.7 I m ( M + 70 ) I m = 42 f w 1.43 f 1 1.3
The floor vibration criteria of prEN 1995-1-1:2025 (Final Draft) [70] and recommended floor performance levels are shown in Table 6. The minimum allowable fundamental floor frequency is 4.5 Hz. In floors with a fundamental frequency less than 8 Hz, d1kN and acceleration criteria need to be checked. The RMS acceleration in m/s2 (Equation (34)) should be greater than 0.005R, where R is the response factor given in Table 6 for each performance level. In floors with a fundamental frequency greater than 8 Hz, d1 kN and velocity criteria must be checked. The RMS velocity (Equation (35)) should be greater than 0.0001R. prEN 1995-1-1:2025 (Final Draft) [70] suggests that for the different building use categories, the assignment of floor performance levels to be applied can be stated in the national annex for use in a country.
Table 6. Floor performance levels and recommended selection for different use categories in prEN 1995-1-1:2025 (Final Draft) [70].
Floor Performance Levels
CriteriaLevel ILevel IILevel IIILevel IVLevel VLevel VI
d1kN (mm) ≤0.250.250.50.81.21.6
Response factor (R)4812203040
Floor UsageQuality ChoiceBase ChoiceEconomy Choice
Multi-family residentialLevels I, II, IIILevel IVLevel V
Single-family residentialLevels I, II, III, IVLevel VLevel VI
OfficeLevels I, II, IIILevel IVLevel V

5.3. Modal Superposition Methods

The most commonly used international guidelines are CCIP-016 [22] by the Cement and Concrete Industry, SCI-P354 [21] by the Steel Construction Institute, and the Steel Design Guide Series AISC/CISC DG 11 [23] by the American Institute of Steel Construction. The performance targets of SCI-P354 [21] are taken from BS 6472 [33], and those of CCIP-016 [22] and AISC/CISC DG 11 [23] are represented in Table 7 for corresponding floor use in terms of peak acceleration or response factor for low-frequency floors and RMS velocity for high-frequency floors (see Table 4 for the definitions of cut-off frequency in each guideline). In addition to these, ASHRAE [72] has some generic vibration criteria in the shape of curves defined using velocity limits. A simple rule is to avoid resonance in high performance floors by increasing the fundamental frequency of the floor. From target performances in Table 7, it can be seen that floor vibration is not an exact compliance check, and many assumptions and judgements go into predicting the response.
Table 7. Performance targets suggested in modal design approach in CCIP-016 [22] and AISC DG 11 [23].
CCIP-016 [22]
Low-Frequency FloorHigh-Frequency Floor
Floor UsePeak AccelerationResponse Factor,
R
VRMS
(m/s)
Response Factor,
R
Commercial
(offices, retail, restaurants, and airports)
0.57% g88 × 10−48
Residential (day)0.28–0.57% g4 to 84–8 × 10−44 to 8
Premium quality office, open office with busy corridors near midspan, heavily trafficked public areas with seating0.28% g44 × 10−44
Residential (night)0.2% g2.8--
Hospitals and critical work areas0.071% g1--
AISC DG 11 [23]
Low-Frequency FloorHigh-Frequency Floor
Floor UsePeak AccelerationResponse Factor,
R
VRMS
(m/s)
Response Factor,
R
Outdoor pedestrian bridges5% g70--
Indoor pedestrian bridges, shopping malls1.5% g21--
Offices, residences, quiet areas0.5% g7--
Ordinary workshops--8 × 10−48
Offices--4 × 10−44
Residences--2 × 10−42
Hospital patient rooms--1.5 × 10−41.5

5.3.1. CCIP-016

In floors with a low frequency (<10 Hz), the guideline [22] recommends prediction of vibration response based on the first four harmonics of the footfall forces, F, as shown in Table 3, for a range of walking frequencies. For instance, to determine the resonance response of a floor for a walking frequency of 2 Hz, the floor needs to be checked for potential resonance at frequencies of 2 Hz, 4 Hz, 6 Hz, and 8 Hz. That requires calculation of the response in all modes to each of these harmonics and then combining them. The method in CCIP-16 [22] is valid for floors with natural frequencies less than 4.2 times the maximum footfall frequency (i.e., about 15 Hz). The calculation method is comprised of the following steps:
  • Find the frequency, fn, modal mass, m*n, and modal damping, ζm, of each mode. The mode shape values at the excitation, μen, and response, μrn, locations in each mode on the floor are also needed. While this is normally conducted through FEA, it can also be calculated using simple equations such as those provided in Equations (17) and (18).
  • Calculate the harmonic forcing frequency, fh = h fw, for harmonic numbers, h, from 1 to 4, and the harmonic force, Fh, from coefficients in Table 3 and using Equation (8) at each harmonic.
  • Find the real and imaginary parts of the acceleration from Equation (36).
  • Sum the real and imaginary responses in all modes and find the magnitude of the acceleration at the harmonic, ah, by summing the square root of the real and imaginary accelerations at this harmonic.
  • Convert ah to a response factor, Rh, for this harmonic by dividing ah by the base acceleration, aR = 1,h (m/s2), given in Equation (37) for the corresponding fh.
  • Find the total response factor, R, which is the “square root sum of the squares” combination of the response factor for each of the four harmonics.
a r e a l , h , n = f h f n 2 F h μ r n μ e n ρ h n m n A n A n 2 + B n 2 A n = 1 f h f n 2 a i m a g , h , n = f h f n 2 F h μ r n μ e n ρ h n m n B n A n 2 + B n 2 B n = 2 ξ n f h f n ρ h n = 1 e 2 ξ n N N = 0.55 h L l s t
where ρ is a correction factor for crossing a floor span of L, with N footsteps of stride length ls.
a R = 1 , h = 0.0141 f h   m / s 2 f h < 4   Hz 0.0071   m / s 2   4   Hz   <   f h < 8   Hz 2.82 π f h × 10 4   m / s 2                 f h > 8   Hz
The calculated response factors are then compared to the target values in Table 7 for the intended use of the floor. In floors with high frequencies (>10 Hz), the impulsive response is calculated based on the assumption that under each footfall force, the floor is excited to an initial peak velocity, which is then decayed by the natural frequency of the floor before the next footfall. Each footfall generates a comparable impulsive response, and these individual responses will not build over time (see Figure 2b). The modal method is defined below:
  • The impulsive footfall force, FI, in Ns is calculated from Equation (9) [22] for all modes with frequencies up to twice the fundamental frequency of the floor.
  • Find the peak velocity of each mode, vn, and the time history of the velocity response, vn(t), over the period of one footfall, Tw, from Equation (38).
  • Add the velocity response in each mode, vn(t), in the time domain to find the total response, v(t) (m/s).
  • Calculate the RMS velocity (VRMS) and divide it by the baseline RMS velocity, VR = 1 (m/s), at the fundamental frequency, f1, to determine the response factor, R, and compare it against the target values in Table 7 for the desired floor use (see Equation (38)).
v n = μ r n μ e n F I m n V R = 1 = 5 × 10 3 2 π f 1 f 1 < 8   Hz 1 × 10 4 f 1 > 8   Hz v n ( t ) = v n e 2 π ξ f n t sin 2 π f n t V R M S = 1 T w 0 T w v ( t ) 2 d t

5.3.2. SCI-P354

The method described in SCI-P354 [21] is based on finding the peak response (acceleration or VDV) from a range of walking frequencies and floor frequencies. The cut-off frequency for general floors is 10 Hz (Table 4). However, for staircases and floors subjected to rhythmic activities, the proposed values are 12 Hz and 24 Hz, respectively. A conservative cut-off frequency of 8 Hz is recommended for enclosed spaces such as operating theatres and residential floors. In low-frequency floors, both steady-state responses and transient responses need to be checked. All modes of vibration with natural frequencies up to 2 Hz higher than the cut-off frequency should be considered. Initially, the weighted RMS acceleration response, awrms, of each force harmonic, h, at every mode, n, of the response at a location, r, from excitation at a point, e, on the floor is calculated. Then, the total acceleration response function, aw(t), is found by summing awrms of each mode of vibration at each harmonic of the forcing function:
a w ( t ) = n = 1 N h = 1 H μ r n μ e n F h m n h 2 f h f n 2 1 h 2 f h f n 2 2 + 2 h ξ f h f n 2 sin ( 2 π h f h t + ϕ h + ϕ n h ) W b tan ϕ n h = 2 h f h f n ξ 1 h f h f n 2 π ϕ n h 0
where Ønh is the phase of the response of the nth mode relative to the hth harmonic. In high-frequency floors, SCI-P354 [21] suggests that all modes with frequencies up to twice the fundamental frequency be accounted for. The upper limit of twice the fundamental frequency is due to the significance of the frequency weighting factors (see Figure 3b) in reducing the response at high frequencies. The acceleration due to an impulse force, FI, (Equation (9)) is calculated by summing the acceleration responses of each mode using the following superposition:
a w ( t ) = n = 1 N 2 π f n 1 ξ 2 μ r n μ e n F I m n sin ( 2 π f n 1 ξ 2 t ) e ξ 2 π f n t W b ρ = 1 e 2 π ξ L s t f h v w
The resonance build up factor, ρ, accounts for the length of the walking path, Lst, and the corresponding walking velocity, vw. The RMS acceleration can be found from Equation (2), with T equal to 1/fh. In order to determine the sum of accelerations from individual acceleration value calculated for each mode in each harmonic, SCI-P354 [21] recommends the following methods: (i) sum of peaks (SoP), and (ii) square root sum of squares (SRSS). SoP is conservative and assumes that all of the components of response will always peak at the same time. This will not be a true representation of an accurate summation in LSTFs, where multiple mode shapes of different frequencies actively contribute to the vibration response [38]. A better indicator, which is very closely related to a full-time history analysis, is the SRSS given in Equation (41). A comparison between SoP and SRSS for a typical response in the time domain is shown in Figure 8.
a w , r m s ( t ) = 1 2 h = 1 H n = 1 N μ r n μ e n F h m n h 2 f h f n 2 1 h 2 f h f n 2 2 + 2 h ξ f h f n 2 sin ( 2 π h f h t + ϕ h + ϕ n h ) W b 2
SCI-P354 [21] suggests two methods for the evaluation of floor vibration: the response factor, R, and VDV. The response factors in z-, x-, and y-axis vibrations are given in Equation (42) and are based on the base limits of BS 6472-1 [34] and ISO 10137 [31].
R = a w , r m s 0.005         z-axis vibration R = a w , r m s 0.00357   x- and y-axis vibration
The VDV can be used if the response factors in Equation (42) are beyond the recommended acceptable limits, and the vibrations can be deemed to be of an intermittent nature. In this case, a VDV or an equivalent maximum number of events (ne) that may produce a “low probability of adverse comment” according to BS 6472-1 [34] or the work of Ellis [73] can be considered:
V D V = 0.68 a w , r m s n e T a 4 or n e = 1 T a V D V 0.68 × a w , r m s 4
The acceptable range of VDV for 16 h day and 8 h night exposure is given in Table 2.
Figure 8. Different methods for estimation of the peak and root mean square (RMS) accelerations [21].
Buildings 13 01756 g008

5.3.3. American Institute of Steel Construction AISC/CISC DG 11

The guideline distinguishes between low-frequency and high-frequency floors at a frequency cut-off of 9 Hz (see Table 4). The Fourier coefficients of the first four harmonics are given in Table 3, which are derived from the works of Rainer et al. [74] and Allen and Murray [43]. As mentioned in the guideline, the evaluation criterion is based on the dynamic response of steel beam- or joist-supported level systems to walking forces. At low frequencies, assuming a single-degree-of-freedom system idealization, peak acceleration, ap, is calculated from Equation (44) and is compared against recommended acceleration tolerances in Figure 4d.
a p = R Q ( 0.83 e 0.35 f n ) ξ M
where M is the mass of the floor (lb); Q is the walker weight, which is 157 lb (71 kg) recommended by Allen and Murray [43]; and R is a reduction factor with a recommended value of 0.5 for floor structures with two-way modal shape configurations. The term in brackets in Equation (44) stands for the dynamic coefficient of the harmonic force and represents the coefficients in Table 3. In high-frequency floors, an equivalent sinusoidal peak acceleration aESPA is calculated as follows:
a E S P A = g 154 M f w 1.43 f n 0.3 1 e 4 π h ξ π h ξ
where h is the harmonic matching the natural frequency (Hz), equal to 5 Hz, for natural frequencies between 9 and 11 Hz, 6 Hz for frequencies between 11 and 13.2 Hz, and 7 Hz if the fundamental frequency is 13.2–15.4 Hz. Equation (45) is calibrated for 89 walking measurements in five bays in three steel-framed buildings, which returned a probability of exceeding the prediction of only 10%.

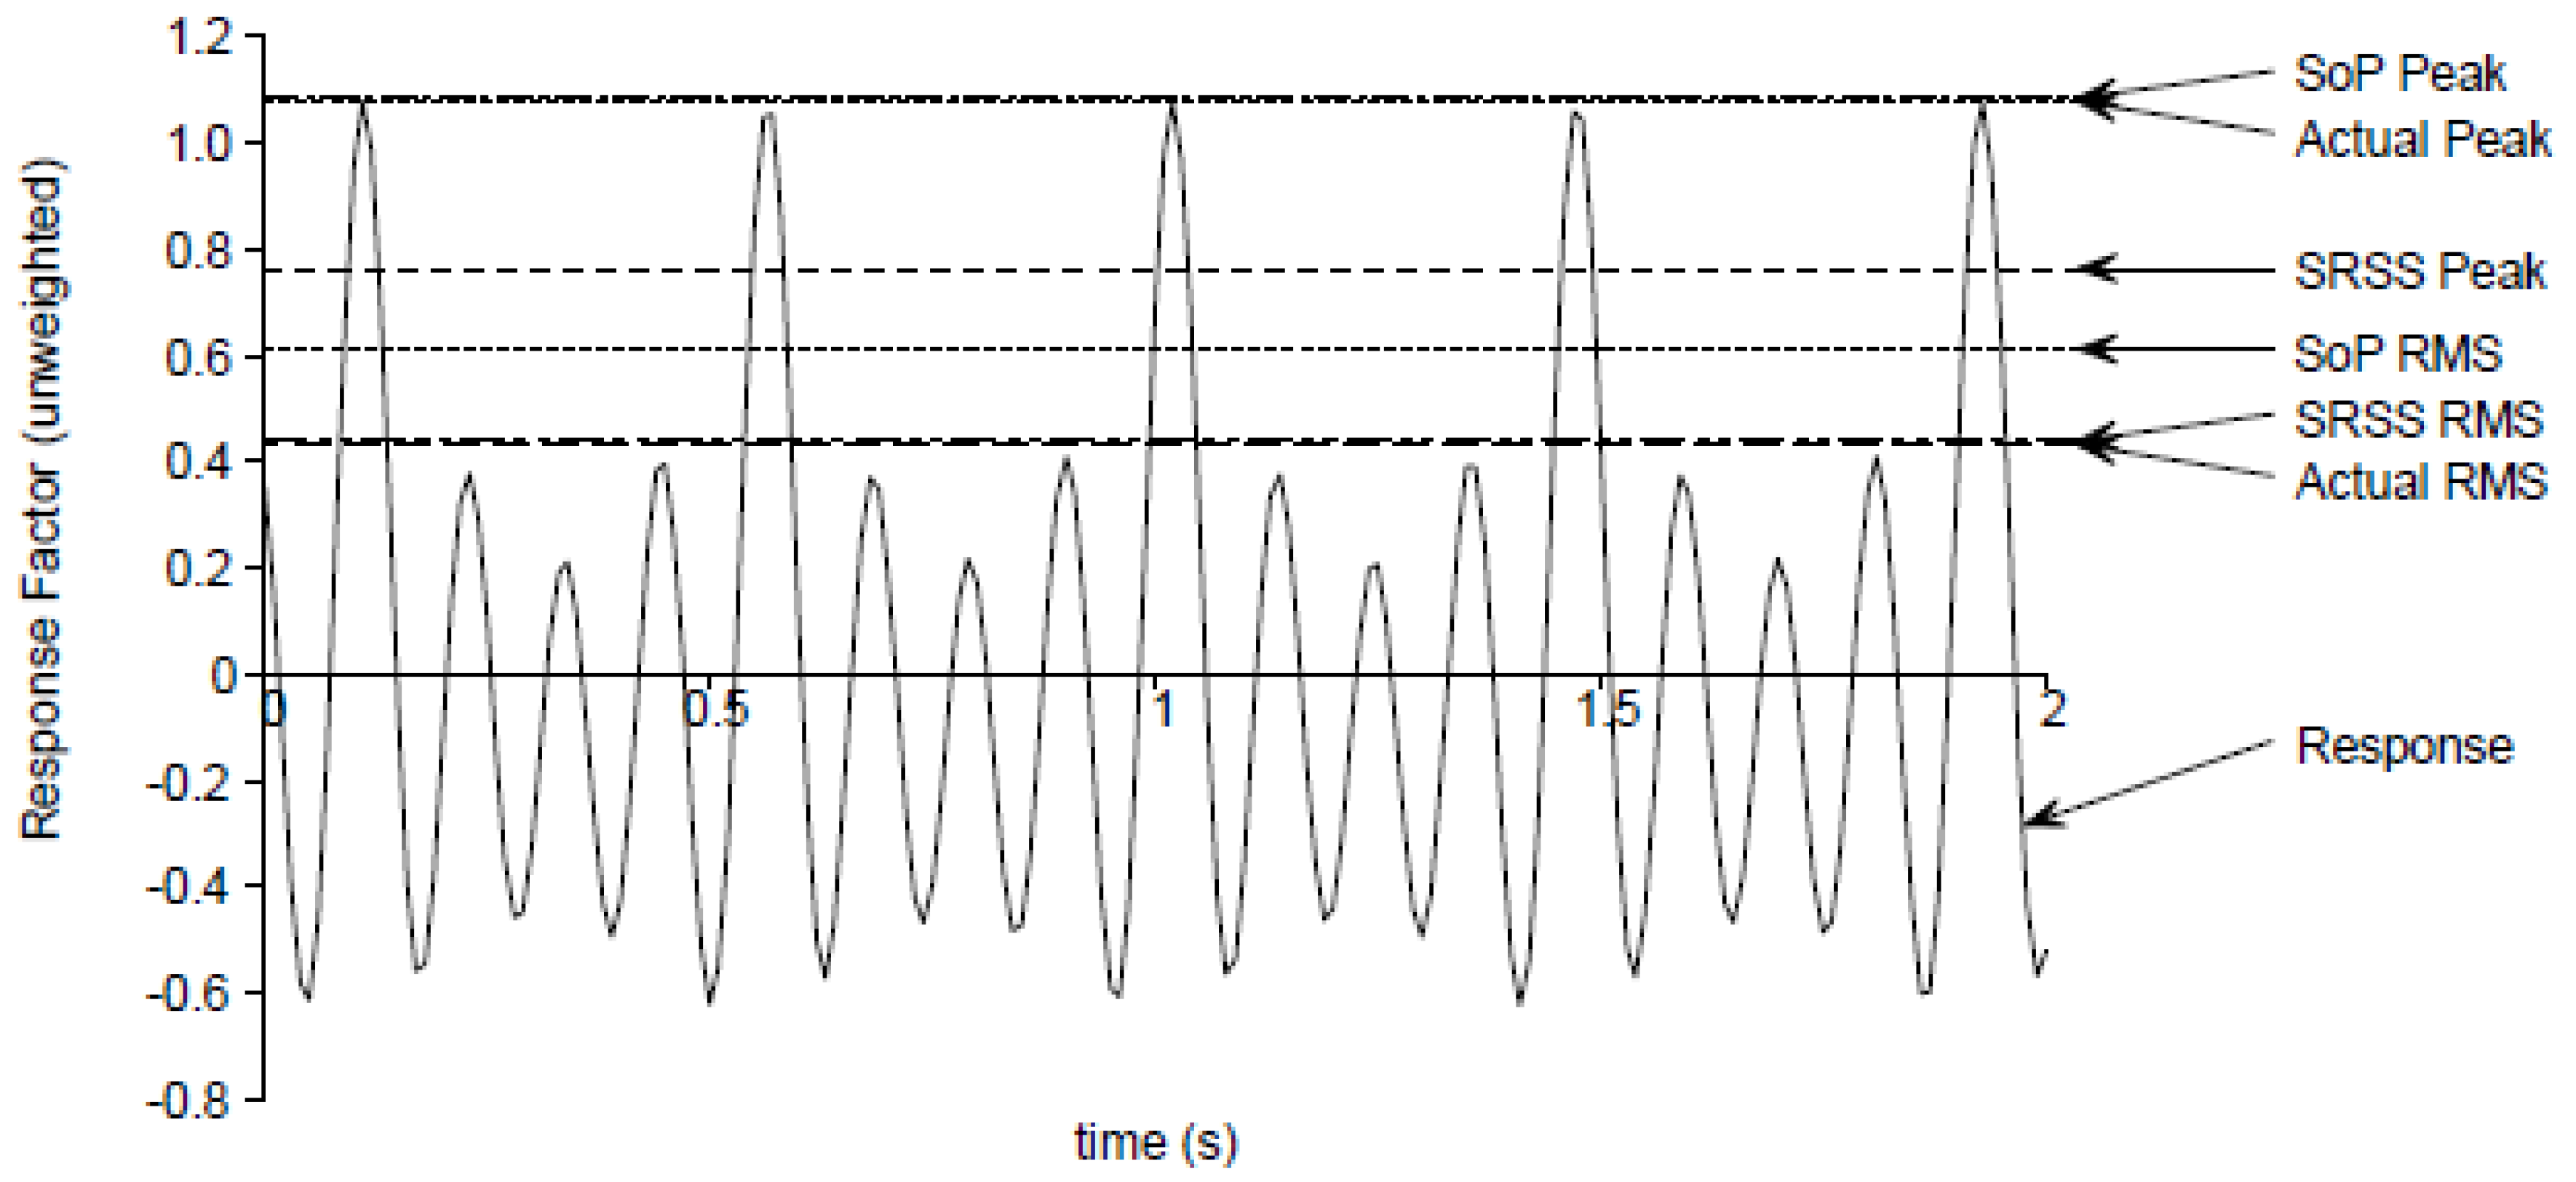
5.3.4. Harmonized Peak Acceleration and VDV Approach

Chang et al. [18] investigated vibrations of 16 timber floors comprised of 8 residential joist floors in the UK of span lengths less than 5.8 m; 4 CLT floors (3 office and 1 residential) in the UK, Germany, and Austria spanning from 7 m to 9 m; and 4 Profideck school floors with lengths of 6 m to 14 m in the UK. The floors were tested in a single walker (76 kg) in “slow”, “medium”, and “fast” walking paces. A total of 204 tests was carried out, and floor vibration responses were measured using accelerometer readings as well as calibrated FE models. Based on the comparison between their observations and calculated response factors and vibration dose values, Chang et al. [18] proposed an empirical equation for calculation of the peak acceleration:
V D V total = 1.31 n e 0.25 V D V single V D V 0.27 a w , p e a k a w , p e a k = 2 π K f n 1 ξ 2 F I M n W b F I = 54 f w 1.43 f n 1.30
where ne is the estimated number of events and is used to relate a single event VDV to a total VDV for the entire exposure period (day or night). The frequency weighting factor, Wb, is equal to 16/fn for modal frequencies, fn > 16 Hz and is equal to 1 for fn between 8 Hz and 16 Hz. The method is simple to use and is a better predictor of vibration performance of joist floors. The proposed floor modification factor, K, is equal to 2.8 for CLT floors and 4.6 for joist floors. From Equation (46) and in conjunction with criteria in SCI-P354 [21] (see Table 2), the number of allowed events can be estimated.

5.4. Time History Analysis Method

The dynamic response of the floor system under human-induced vibrations can be calculated using the time history analysis method, typically implemented using FEA. The floor panel (CLT or slab) is modelled using shell or solid elements; joists are normally modelled with beam or link elements; and the connectors (self-tapping screws, full or partially threaded screws or bolts) are modelled using beams, link elements, or a combination of those and spring elements. The boundary conditions and contact between elements may be modelled using contact formulations in the FEA or via springs of predefined translational and rotational stiffness. The non-structural elements are not modelled in the FEA, but their masses are considered. The loading protocol [75] is based on the walking/running pace, path, and actual number of steps it takes to transverse the floor. The force–time history of each step is modelled as two peaks: the heel strike and the toe-lift off contact. The loading time history pattern for walking and running is shown in Figure 9 [76]. The FEA is validated by comparing the modal and time history analysis against on-site measurements of free vibration (frequencies) and walking/running responses (acceleration parameters in Figure 8), respectively. It is not unusual to see differences between FEA time history results and those observed in measurements, mainly due to the idealization of human walking/running loading patterns. While a time history analysis is beneficial in terms of providing a time domain response, the downside of it is the computational cost.
Figure 9. Loading protocol in a time history analysis showing walking and running (a,b) footfall excitations on a hybrid CLT/steel floor system [76].
Buildings 13 01756 g009

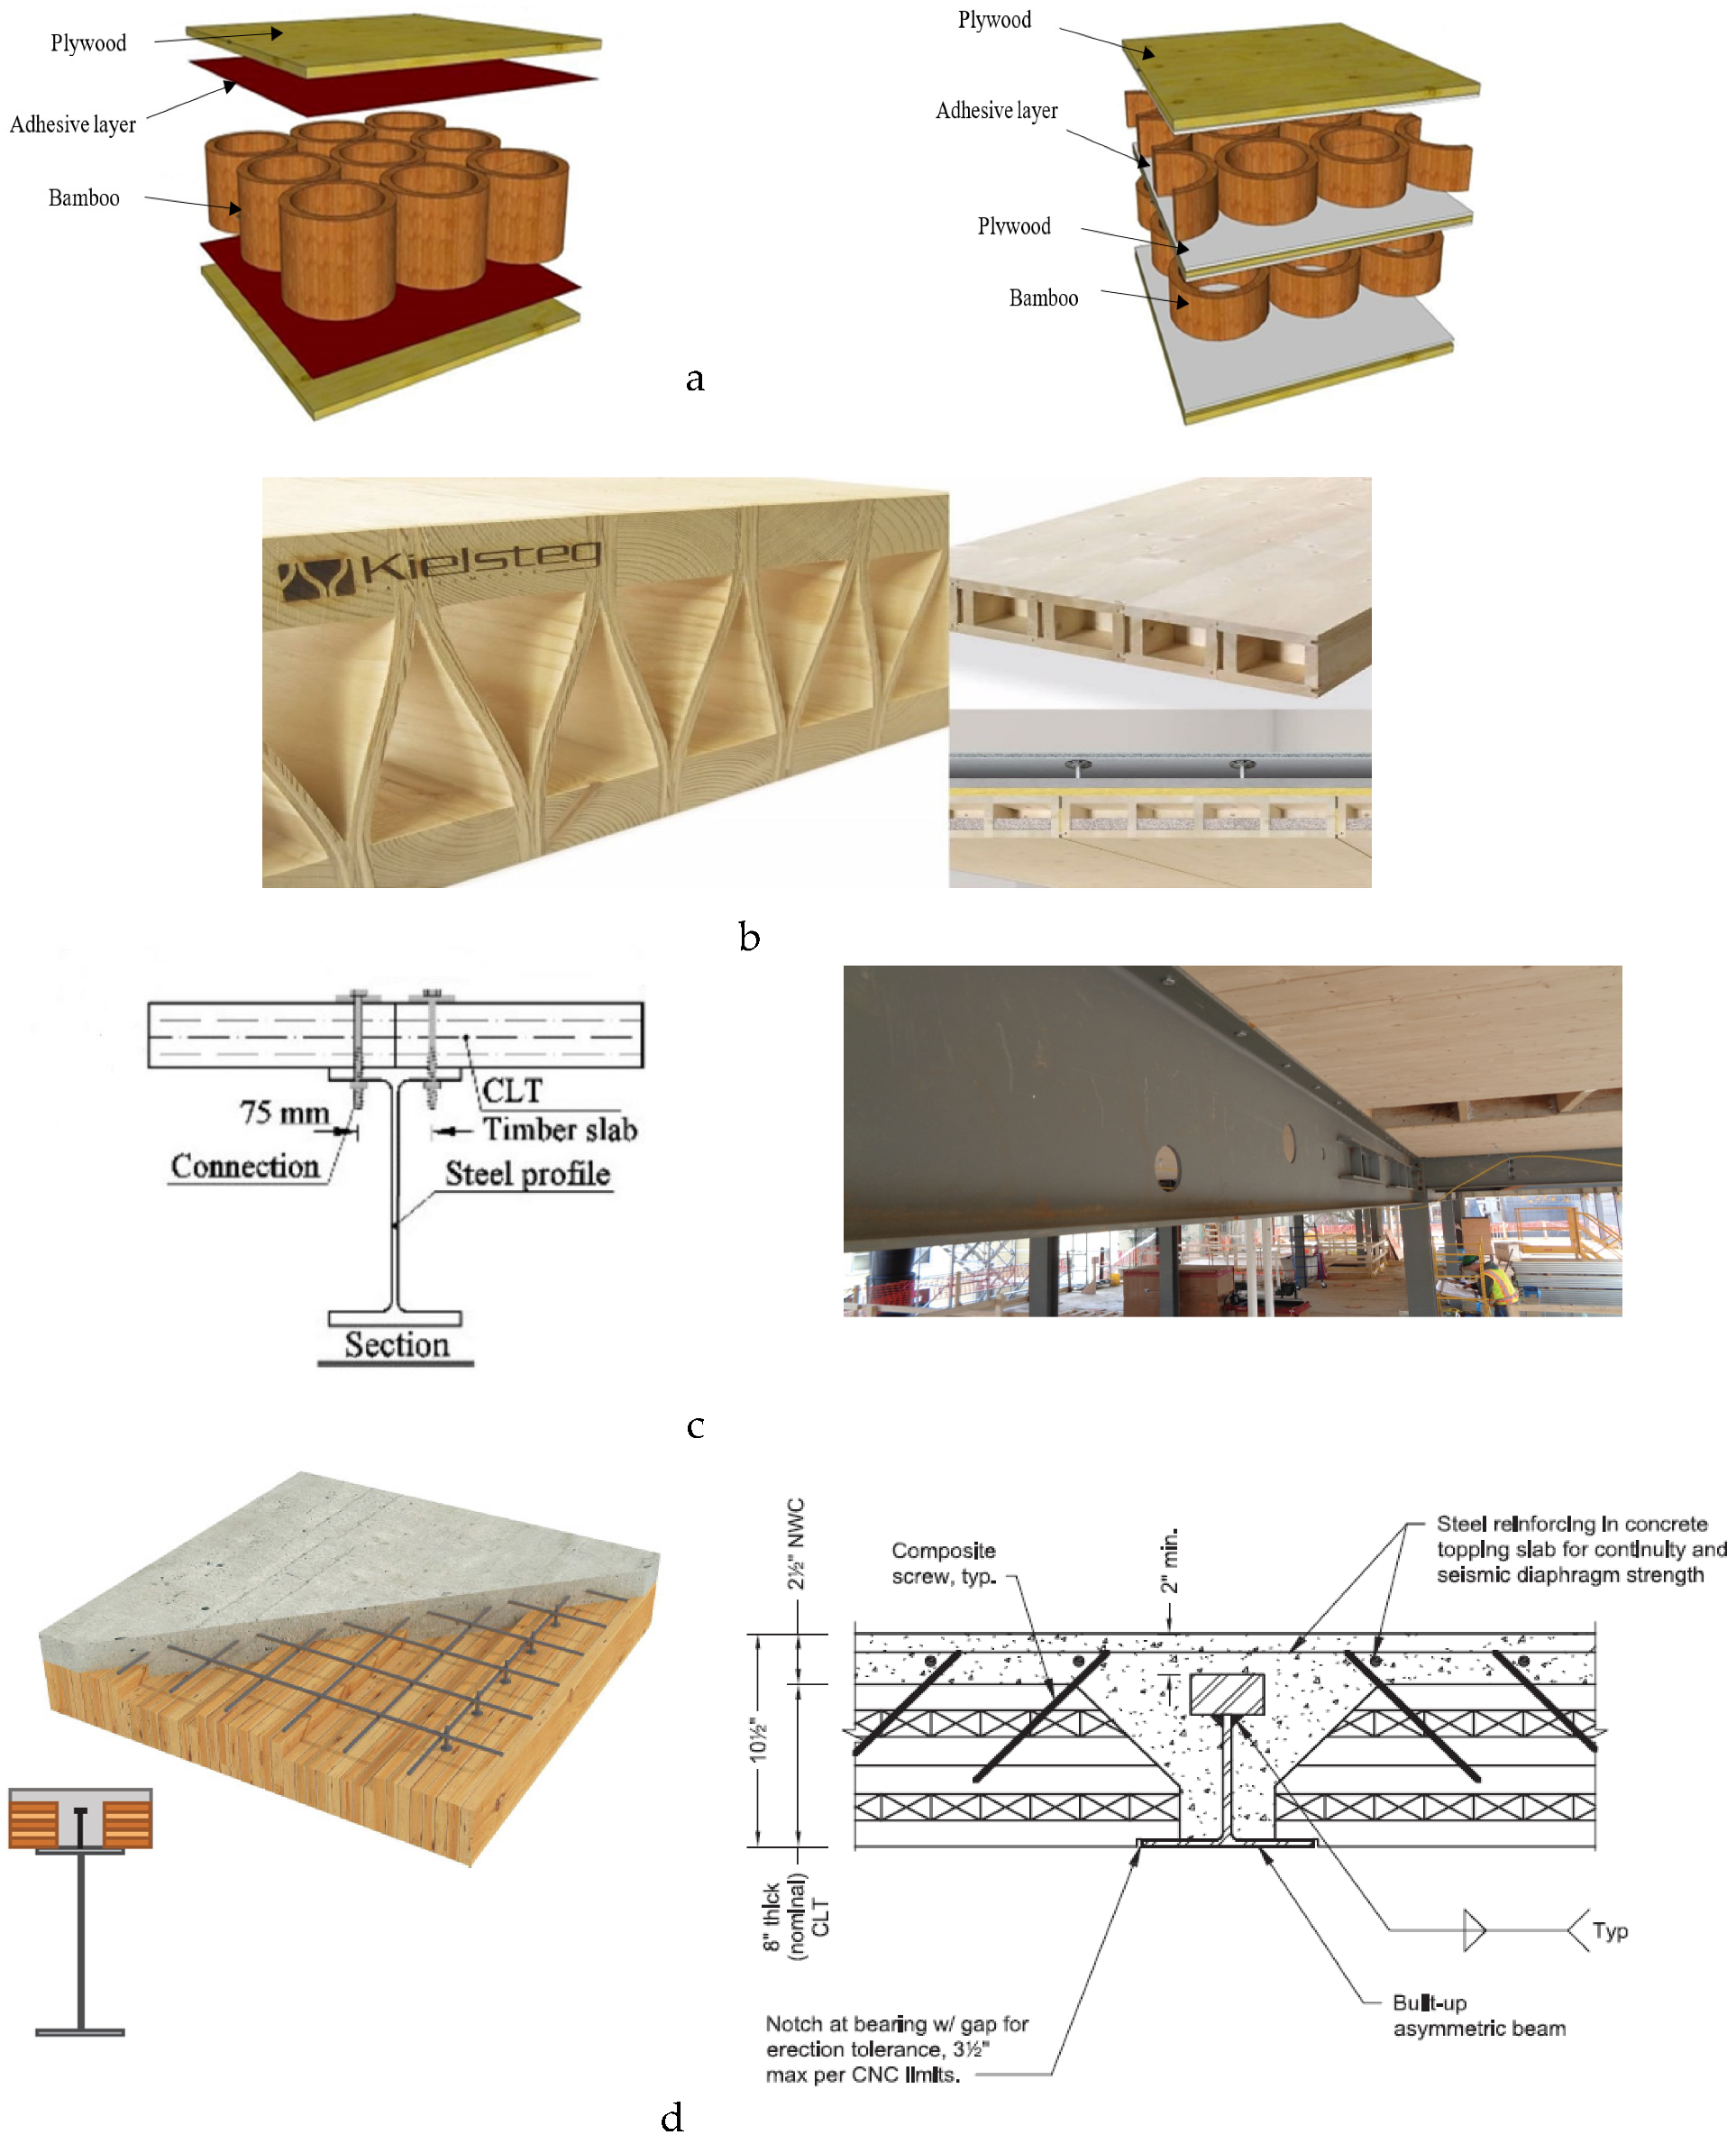
6. Hybrid Floor Systems

As the trend for taller timber buildings grows, the need for hybrid systems becomes more evident. By combining wood with concrete and steel, a system is formed that makes use of the strength of each material and simultaneously overcomes their individual weaknesses [77,78,79]. Mjøstårnet, currently the world’s tallest timber building at 85.4 m in height, and HoHo tower in Vienna (84 m in height), both have all-timber framing with a few floors made of concrete (to improve the robustness of the structure). The 39-storey Atlassian HQ is a hybrid steel-and-timber office tower in Sydney, to become the world’s tallest commercial hybrid timber tower (construction to be finished by 2026). Most common hybrid floor systems are TCC floors and flooring systems comprised of steel girders and CLT panels, namely, steel timber composite (STC). Investigations into other systems such as lightweight sandwich panels are limited to laboratory tests [80,81], while hybrids made of engineered wood products and those providing composite action with steel and concrete are commercialized [82] (see Figure 10) [83]. The design of hybrid timber floor systems to vibration has been addressed in some guidelines. The Canadian CLT Handbook [50] has a chapter on vibration of CLT floors and a section on TCCs. The handbook recommends a minimum reinforced concrete slab thickness of 70 mm, connected to the bottom CLT using shear connectors. In calculation of the composite action, the shear stiffness of the connector should be reduced if the shear studs pass through non-structural layers such as insulation. The maximum vibration-controlled span in the Canadian CLT Handbook [50] is based on limited field (only one TCC floor in a completed building) and laboratory testing of TCC floors by FPInnovations [84], and the Gamma-method concept used in design of CLT floors [3,85]. For a TCC floor with mass per unit length of m, timber panel thickness of ht, modulus of elasticity of Et, concrete topping with a thickness of hc, and a modulus of elasticity of Ec and simply supported at two ends, the vibration-controlled span Lv is:
L v 0.329 ( E I ) e f f 0.264 m 0.206 ( E I ) e f f = ( E I ) c + ( E I ) t + γ c ( E A ) c a c 2 + γ t ( E A ) t a t 2 ( E I ) c = E c b c h c , e f f 3 12 ( E A ) c = E c b c h c , e f f h c , e f f = α 2 + α ( h t + 2 h c + 2 t ) α h c α = γ t ( E A ) t γ c E c b c γ c = 1.0 γ t = 1 1 + π 2 ( E A ) t k L 2 a c = γ t ( E A ) t r γ c ( E A ) c + γ t ( E A ) t a t = γ c ( E A ) c r γ c ( E A ) c + γ t ( E A ) t r = h t 2 + t + h c h c , e f f 2
where (EI)t and (EA)t are, respectively, bending and axial stiffness of a 1 m wide mass timber panel (in (Nm2 and N, respectively), obtained from the producer’s specification or calculated according to CSA 086-14 [86]; (E)c and (EA)c, respectively, are bending and axial stiffness of a 1 m wide concrete panel (in Nm2 and N, respectively); K is the load-slip modulus in the major direction (N/m/m), which can be calculated from the shear stiffness of the timber–concrete connection [84]; t is the thickness of insulation, acoustic or construction layer (m); and ac and at are the distance (m) between the centroid of the concrete section and the timber section to the neutral axis of the composite section, respectively. The design method outlined in the U.S. Mass Timber Floor Vibration Design Guide [9] is very similar to the Canadian CLT Handbook [50] and is extended to nail- or dowel-laminated timber (NLT or DLT) and tongue-and-groove (T&G) decking as well. For NLT, more details are given in the NLT U.S. Design & Construction Guide [87]. The American Institute of Steel Construction (AISC) recently published Hybrid Steel Frames with Wood Floors (DG 37) [88]. DG 37 [88] follows the method described in CCIP-016 [22] and recommends a minimum fundamental frequency over 8 to 9 Hz for hybrid steel–timber floors. The suggested mass timber-to-steel connection fasteners are bolts, screws (partially threaded and fully threaded), nails, and pins, which provide the shear connection between the steel beam and mass-timber panel. DG 37 [88] allows for the use of simplified methods such as vibration-controlled spans for preliminary designs but recommends more rigorous methods of design at later stages.
Figure 10. Hybrid floor systems: (a) lightweight sandwich panel made from plywood and bamboo [79]; (b) Kielsteg LVL/CLT and CLT box floors [82]; (c) STC floor made of CLT on steel girders [88], photo courtesy of Odeh Engineers, Inc. (North Providence, RI, USA), also see Figure 1c; and (d) timber–concrete composite (TCC) floor [84] showing AISC-SOM composite timber deck and steel beam detail [83].
Buildings 13 01756 g010

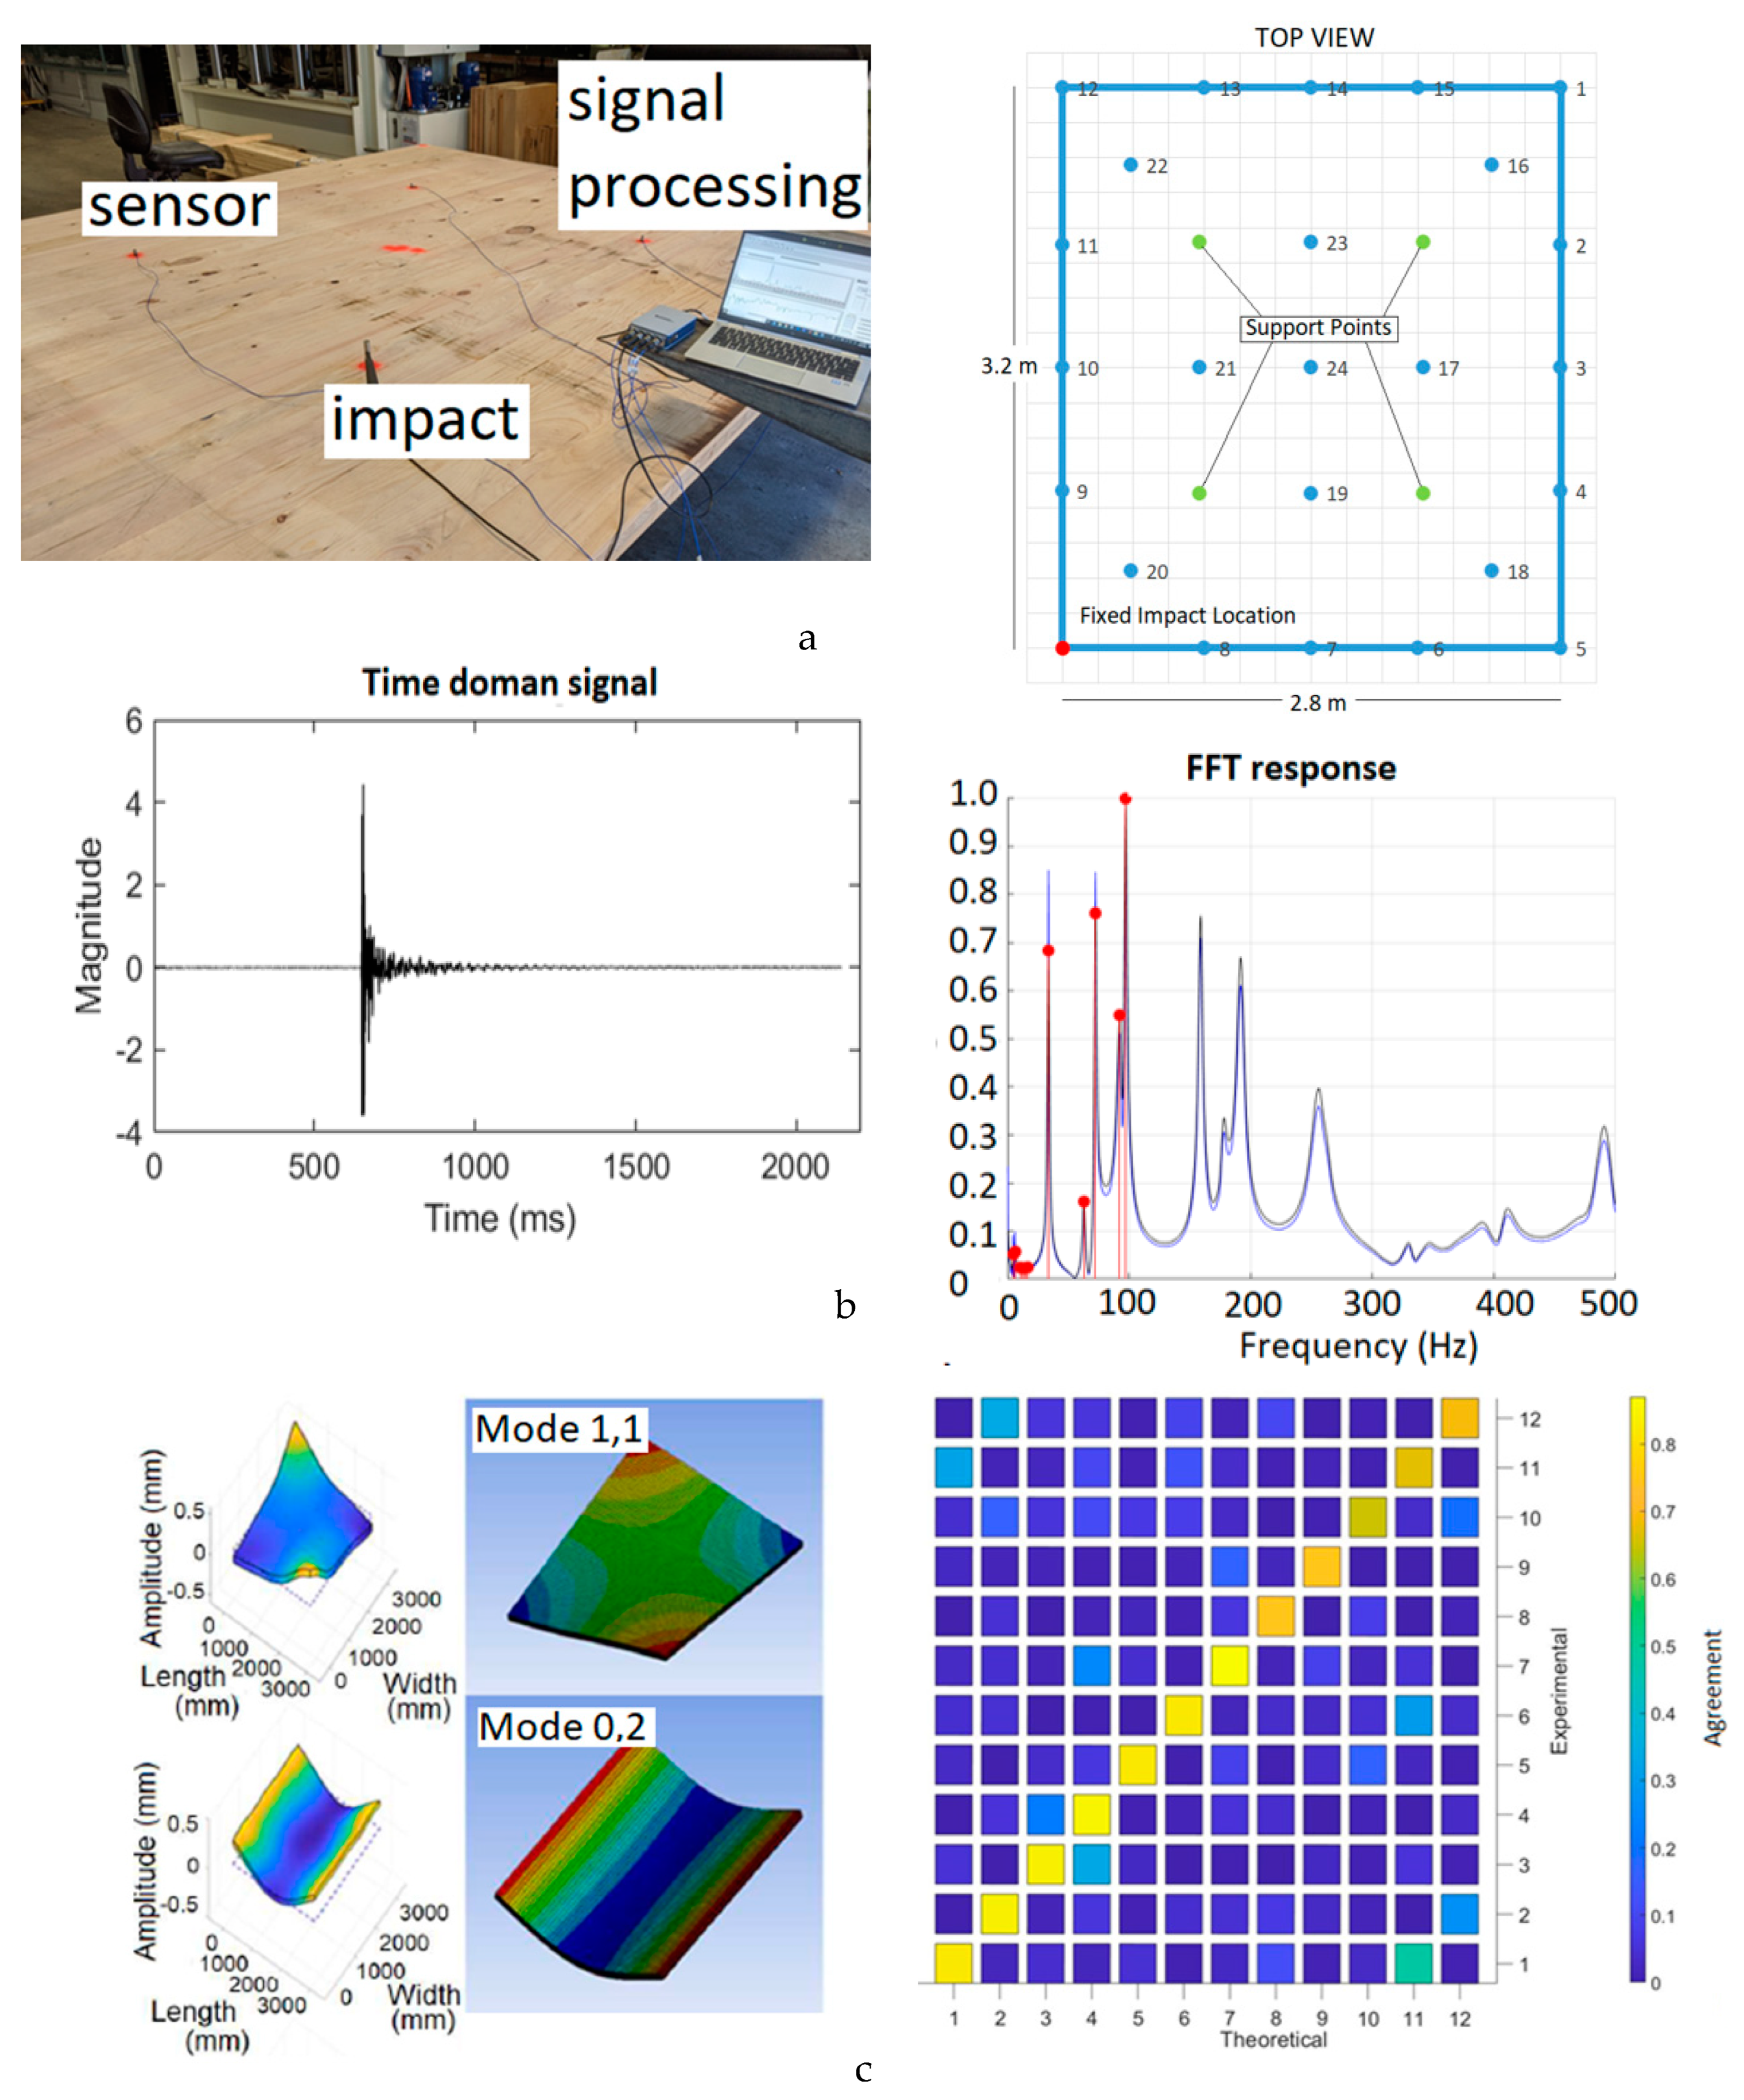
7. Case Study I: EMA and NMA of a CLT Floor

In order to describe the procedures of experimental modal analysis (EMA), numerical modal analysis (NMA), and mode shape construction and validation, a 3-layer cross laminated timber (CLT) panel (20/35/20 mm layering) with dimensions of 3000 (L—length) mm × 2800 (W—width) mm × 75 (T—thickness) mm was chosen. The CLT panel was supported on four inflated air bladders at locations shown in Figure 11a and was excited using a modal hammer (IEPE Brüel & Kjær type 8206) at the indicated impact location. Using a single input multiple output (SIMO) technique, the vibration response was collected using a single axis accelerometer (PCB Piezoelectronics, model 352C33) installed and moved along the 24 locations marked in Figure 11a. Signal acquisition was conducted at a sampling frequency of 8 kHz (for 51,200 samples resulting in a sampling resolution of 0.156 Hz) through (ADD HERE) LabVIEW [89], and data were transferred to MATLAB [90], where frequency response functions were created, and results were converted from the time domain to the frequency domain using fast Fourier transform (FFT). To improve the distortion of the frequency response function (FRF) due to the leakage, a Hanning window [88] was used. The positioning of supports, the impactor, and accelerometer was chosen to avoid the nodal lines of the panel corresponding to bending modes. The responses for time and frequency domains are shown in Figure 11b, where the peaks in the frequency response correspond to the natural frequencies of the CLT panel. Numerical integration of the accelerometer time signals at the target locations, peak displacements, and thus mode shapes of the CLT panel were re-constructed.
NMA was carried out using the ANSYS [91] finite element analysis (FEA) commercial package. The CLT panel was modelled using 4-noded shell elements (SHELL181) in 3 layers bonded together. Other methods of modelling the CLT with FEA such as using solid elements to mesh the radiata pine (Pinus radiata, softwood) boards individually (135 (W) × 20 (T) mm for face layers and 90 (W) × 35 (T) mm for the core) were also tested, but the layered shell with bonded contact proved to be most effective in terms of computational cost while maintaining acceptable accuracy (for the sake of brevity, the procedure and mesh sensitivity analysis are not shown here).
The experimental and numerical mode shapes are shown in Figure 11c. The EMA frequencies of the torsion mode (1.1) and bending mode (0.1) in the minor axis were f1EMA = 11.7 Hz and f2EMA = 16.5 Hz, respectively. The (i,j) labelling of mode shapes corresponded to the number of half waves in the major and minor directions, respectively. The NMA frequencies of the aforementioned modes were f1NMA 10.0 Hz and f2NMA 15.4 Hz, respectively, which differed by 15% and 7% from the EMA frequencies, respectively. Using a more computationally costly NMA, and modelling each single board with solid elements, a 1.5 mm gap between the boards and a friction coefficient (µ) of 0.1, in a fine mesh setting, the difference between NMA and EMA frequencies became as low as 5%. However, the computational effort required to model a full-scale CLT floor system in a real building makes it an inefficient exercise. Other EMA and NMA frequencies and differences are represented in Table 8. The NMA frequencies were lower than the EMA frequencies, which may be related to the adopted static modulus of elasticity (MOE) for defining mechanical properties of timber in FEA. Previous research on concrete floors suggests using the dynamic MOE of concrete. Results from vibration testing of softwood timber boards found the dynamic MOE to be 9–10% higher than the static moduli [92]. The other source of discrepancy between EMA and NMA frequencies may be attributed to the adopted boundary conditions. In the FEA, the CLT panel was assumed to be free (on all edges and top/bottom surfaces), whereas in the physical tests, the CLT panel was supported on four inflated air bladders.
Table 8. EMA and NMA frequencies of the CLT panel in Case study I, taken from AS 1720.1 [93].
RankMode Shape
(i,j)
EMA Frequency
f EMA (Hz)
NMA Frequency
f NMA (Hz)
Difference
11,111.710.015%
20,216.515.47%
31,227.925.110%
42,034.228.816%
52,140.634.715%
60,344.742.35%
72,255.350.78%
81,358.451.013%
93,085.675.112%
102,388.376.214%
113,194.079.915%
120,4112.882.227%
Using Equation (23), and from the generated EMA and NMA mode shapes and corresponding normalized modal amplitudes at the nodes shown in Figure 11a, modal assurance criteria (MAC) contours in an orthogonal presentation are plotted in Figure 11c for each mode rank in Table 8. The MAC agreement matrix was nearly diagonal, which showed a good correlation (agreement) between EMA and NMA. The off-diagonal agreements were due to close or overlapping resonance frequencies (referred to as double peaks). Both EMA and NMA frequencies in Table 8 (also can be seen in the FFT result in Figure 11b) showed that in some bending mode shapes such as in modes (2.2) and (1.3), the frequencies were very close. This was related to the orthotropic behavior of CLT and has been reported in previous modal studies of timber floors [38,93]. Some vibration discomfort has been reported to be related to this closeness of frequencies at different mode shapes due to the modal contribution in the vibration response [12].

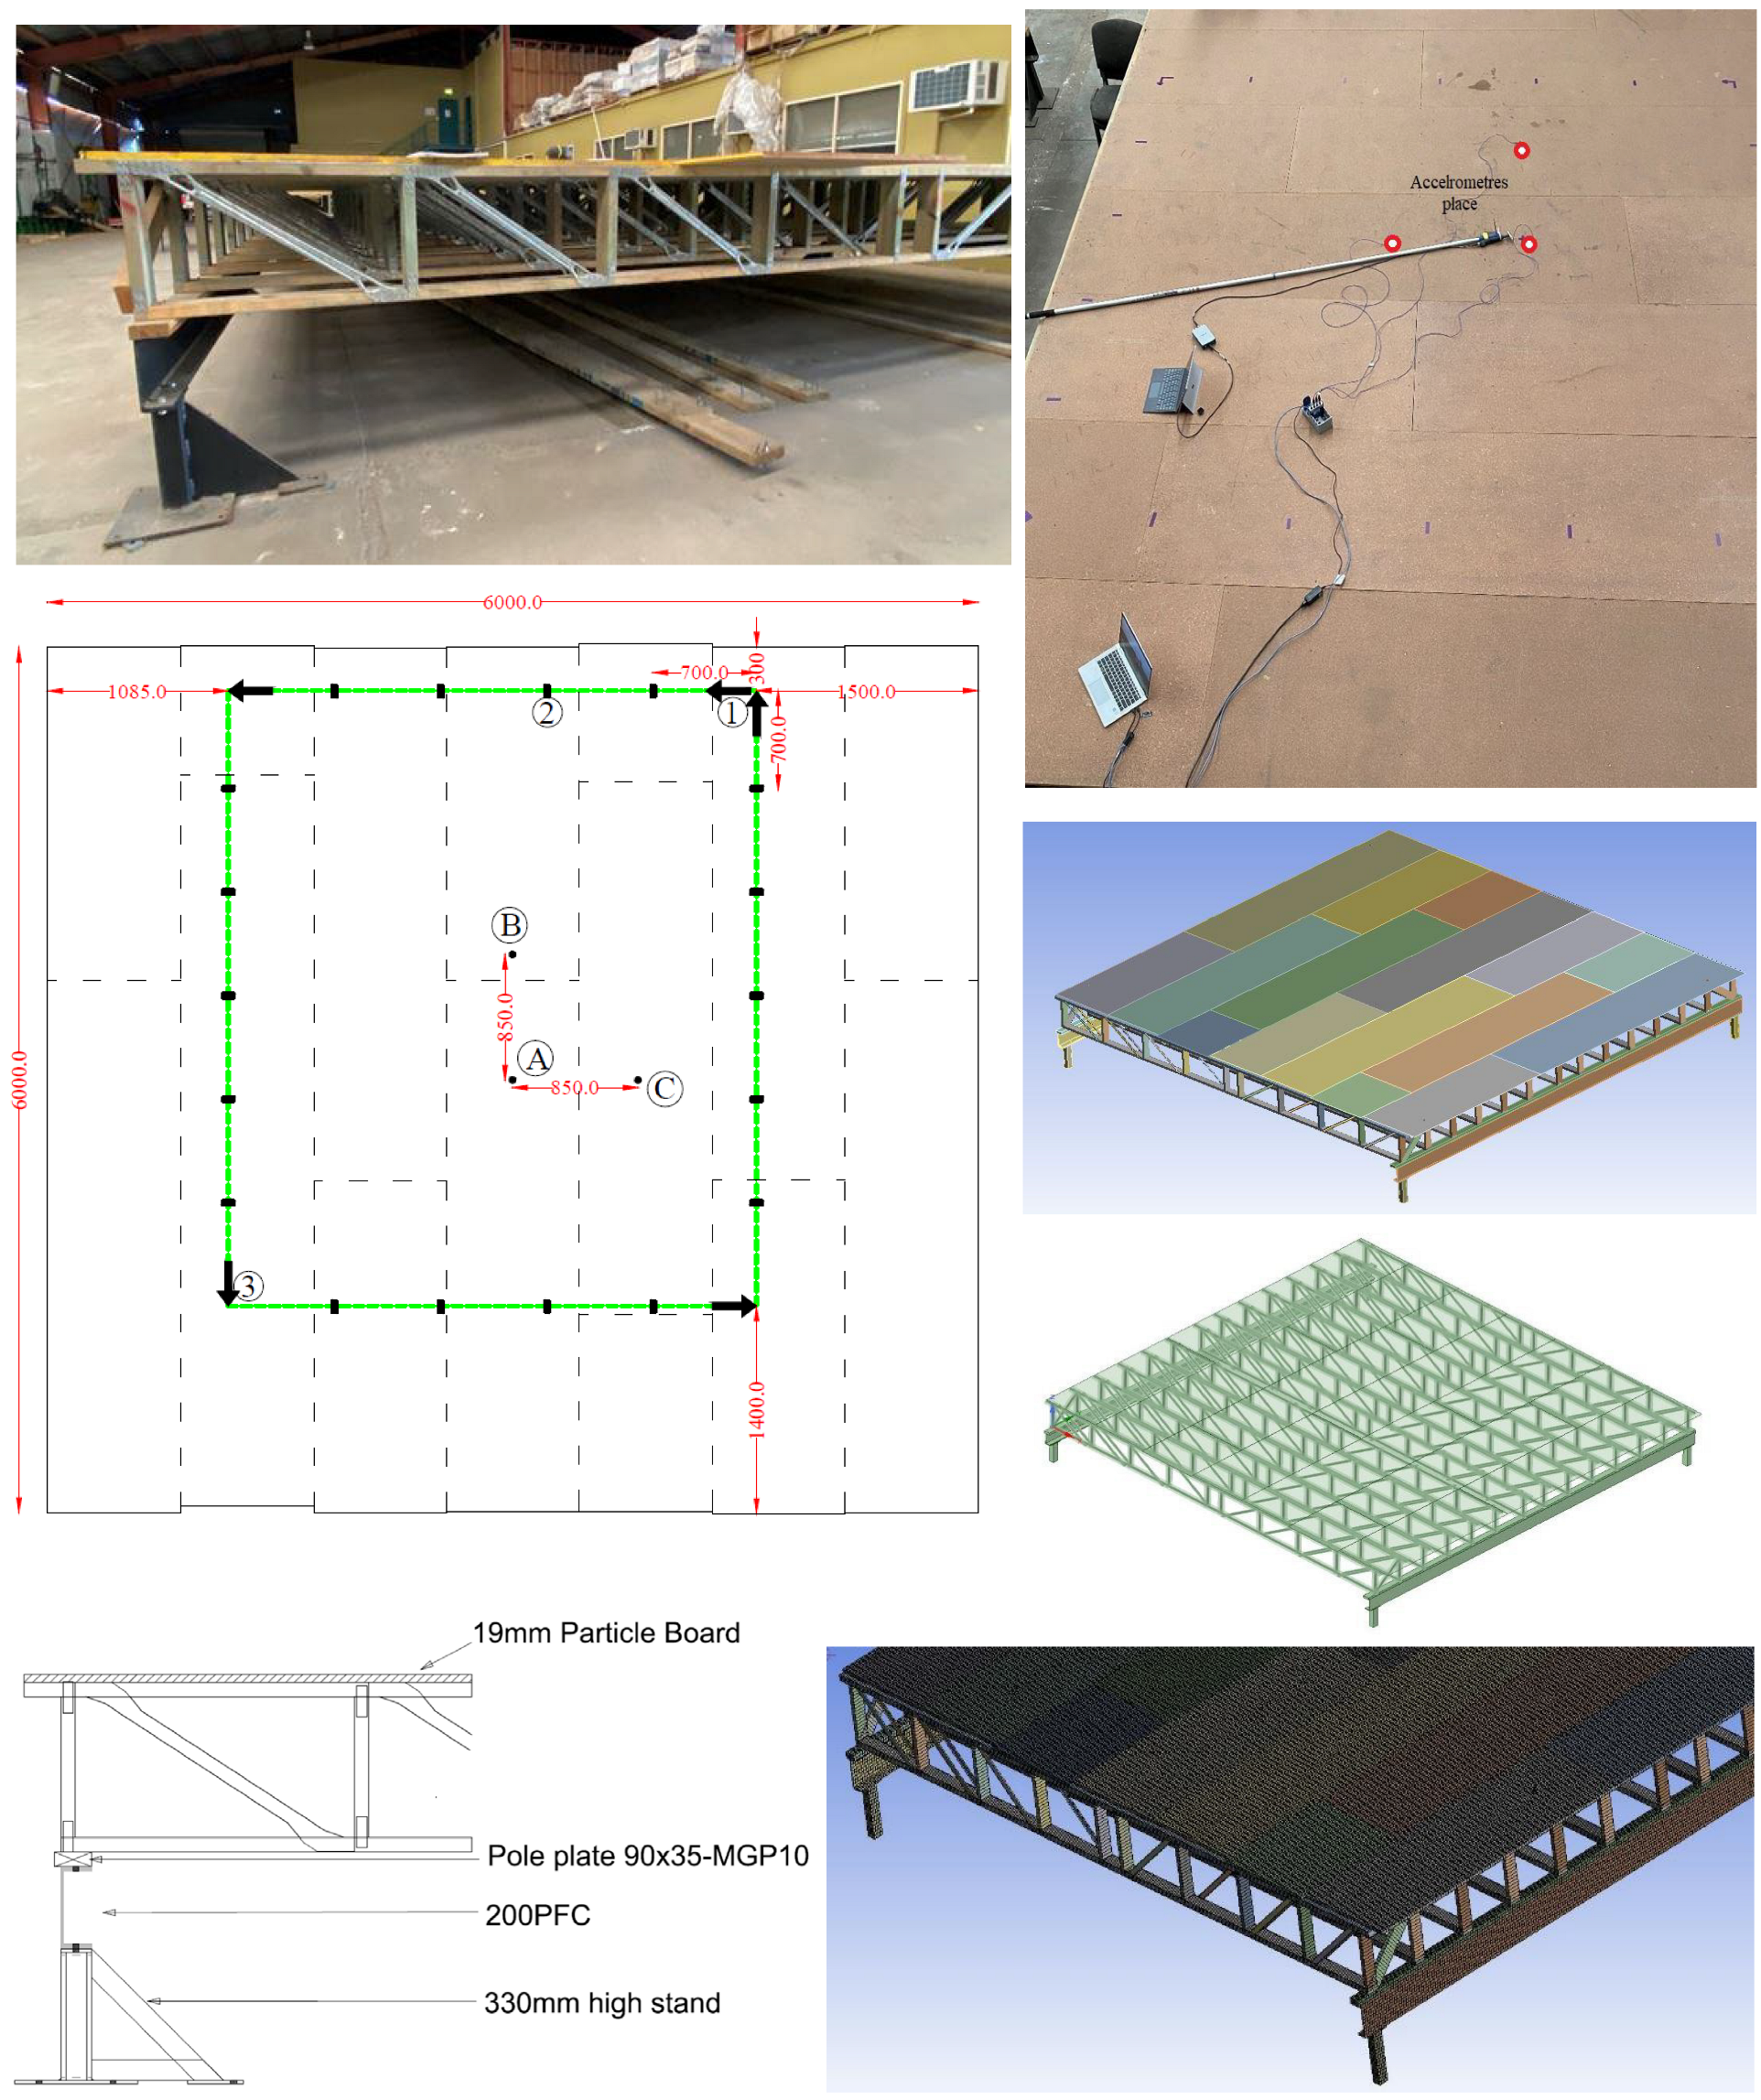
8. Case Study II: EMA and NMA of a 6 m × 6 m Cassette Floor

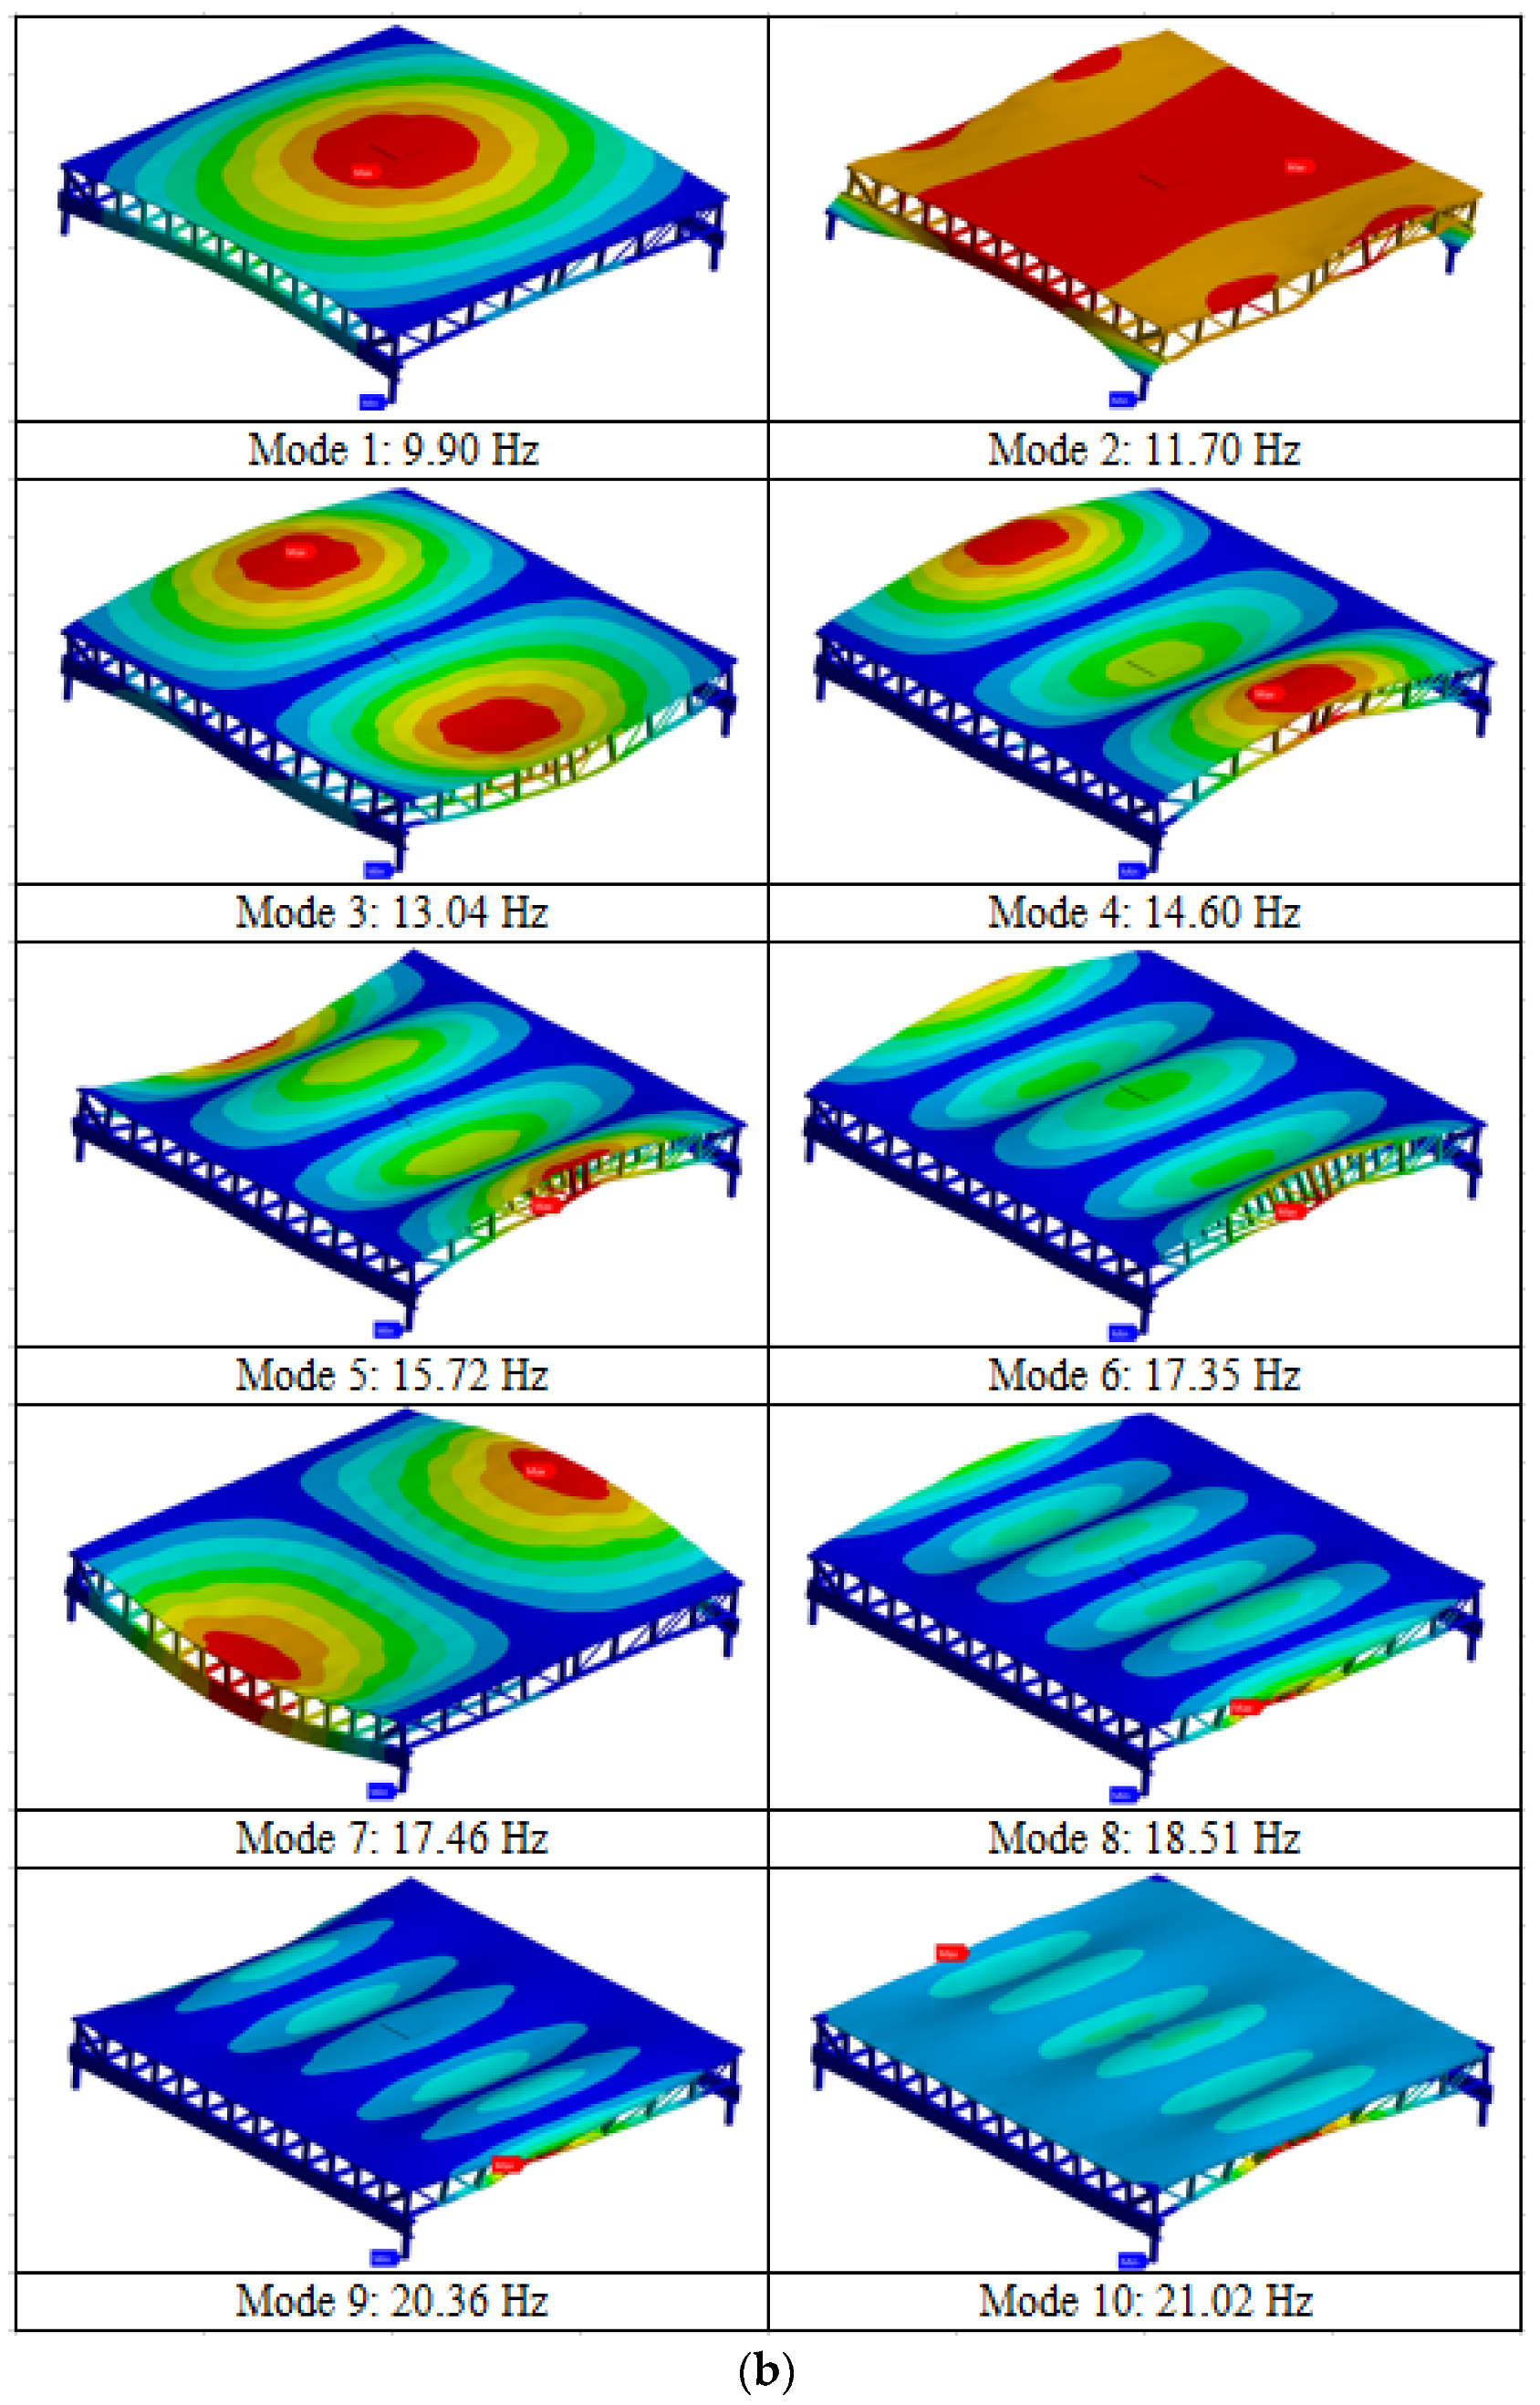
8.1. The Floor System and FEA Model

The 6000 (L) mm × 6000 (W) mm lightweight floor system is shown in Figure 12 and is a typical floor used in low-rise residential dwellings comprised of a 19 (T) mm particleboard (Structa Yellow tongue) panel bonded and screwed onto the floor joists, 413 mm in height, and placed at 450 mm center-to-centre. The floor joists were constructed using machine graded pine (MGP), namely, MGP10 and MGP12, 90 (W) × 35 (T) mm in cross-section for vertical and horizontal cords, respectively. Particleboard is isotropic [94], and the timber boards were assumed to be non-isotropic, with major axis mechanical properties taken from AS 1720.1 [95] and properties in other directions calculated from recommended ratios in the Wood Handbook [96]. The mechanical properties are represented in Table 9, where L, R, and T stand for longitudinal, radial, and tangential directions, respectively. Metal webs were Eco-joists 400–35 with a C-shape cross-section with a thickness of 1 mm and were connected to the timber boards using 1 mm thick nail plates. The floor system (Figure 12) was supported on two edges by MGP12 bearer beams of 90 (W) × 35 (T) mm in size sitting on 200 parallel flange channel (PFC) steel beams. The mechanical properties of steel from AS 4100 [97] are reported as 200 × 103 MPa for MOE and 80 × 103 MPa for shear modulus, with a Poisson’s ratio of 0.25. In the FEA (see Figure 2), MGP boards, particleboard, PFCs, and the supporting short columns were modelled using 8-noded ANSYS shell-181 elements with 5 integration points, and the metal webs were modelled with link elements [91]. The connection between the bearer beam and the PFC, and the connection between the PFC and the short column was Mohr–Coulomb frictional contact with a coefficient of friction calculated at 0.45 (calculated from a simple sliding test, not discussed here). From a mesh sensitivity analysis (not shown here for the sake of brevity) a mesh with a total of 182,550 nodes was selected, which had mid-span deflection and a fundamental frequency of less than 5% different from an FEA model with 303,015 nodes.
Table 9. Mechanical properties of the timber in the floor system of Case study II.
PropertyMGP 12MGP 10Particle Board
Density (kg/m3)594550748
EL (MPa)12,70010,0003000
ER (MPa)143511303000
ET (MPa)9917803000
GLR (MPa)10298101360
GLT (MPa)1651301360
GRT (MPa)10418201360
μLR0.2920.2920.103
μLT0.3820.3820.103
μRT0.3280.3280.103

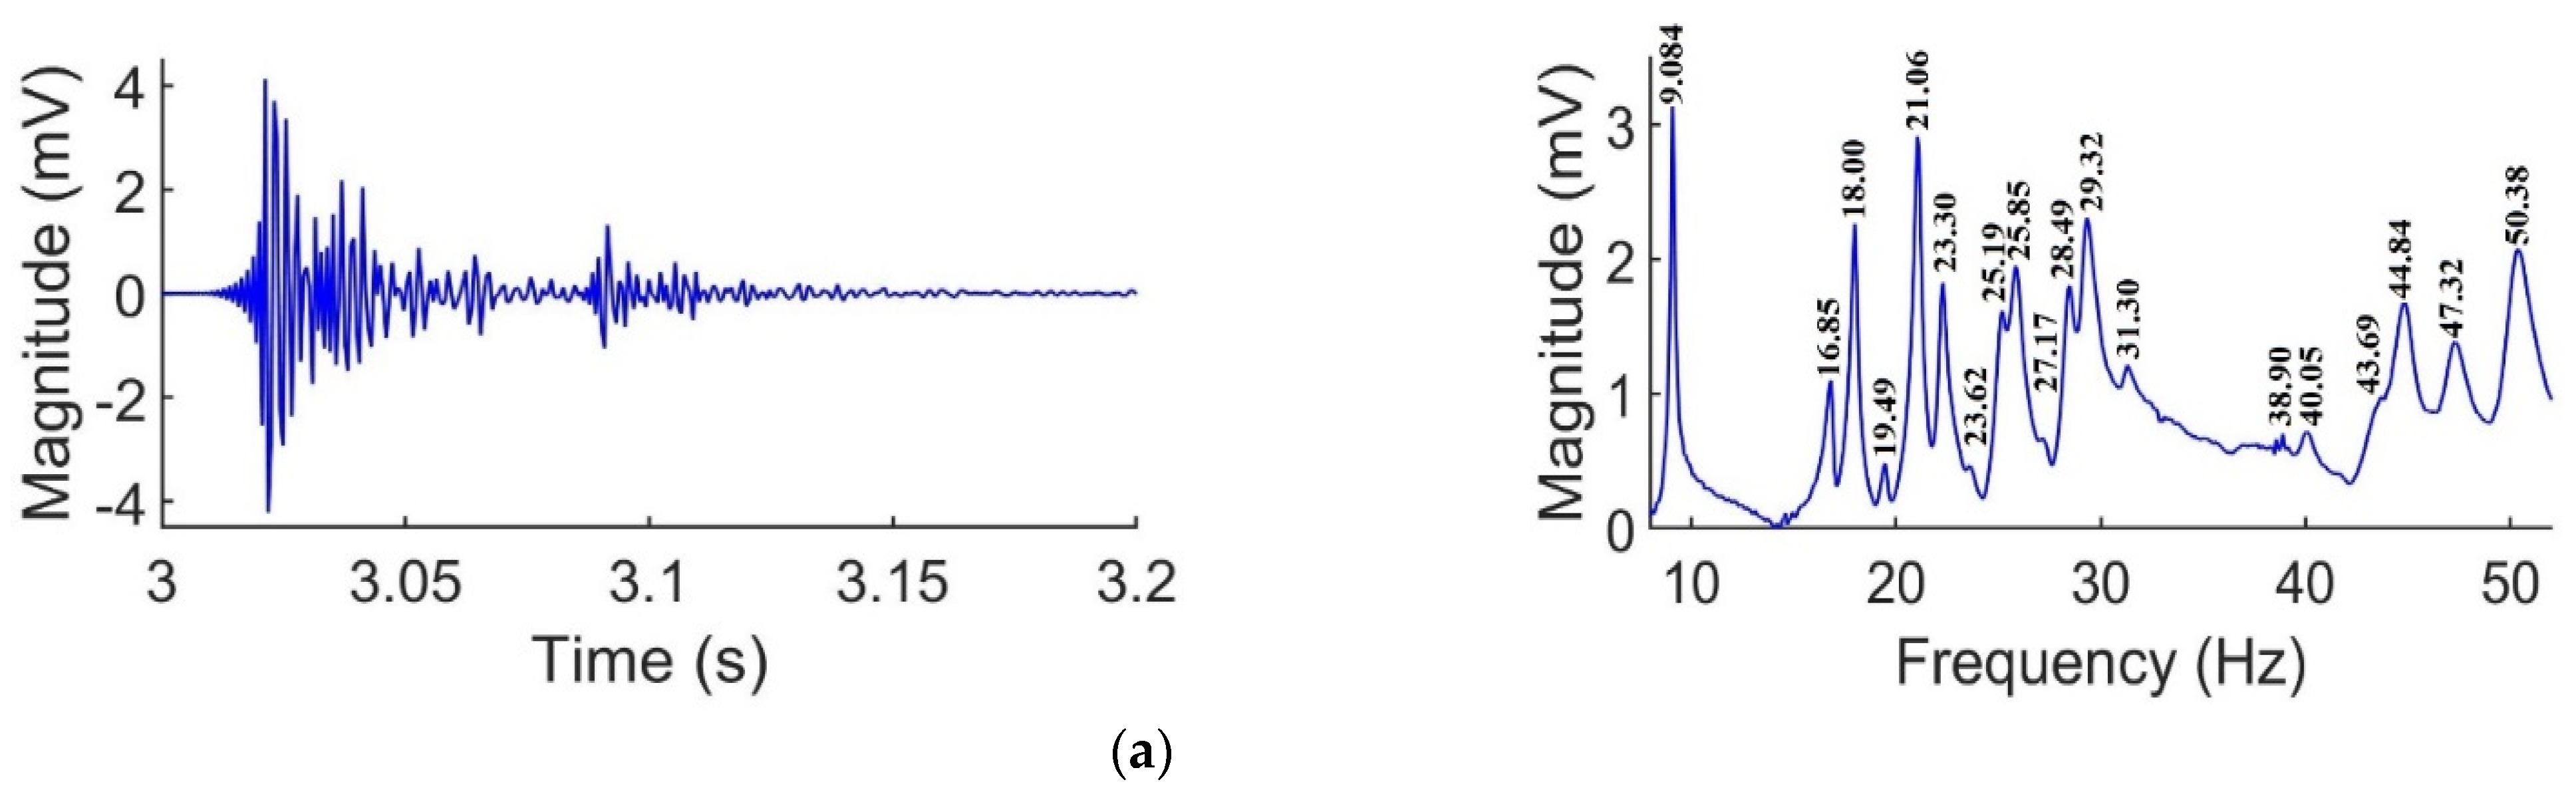
8.2. Dynamic Properties

Figure 12 presents the experimental setup of a series of floor vibration experiments where A, B, and C note the locations of the surface-mounted accelerometers. The floor was excited using a modal hammer (IEPE Brüel & Kjær type 8206) at a location close to the accelerometer (single axis PCB Piezoelectronics, model 352C33) A in Figure 2. The test was repeated 10 times. A sample time history and frequency domain result are plotted in Figure 13a. The deflection under a 1 kN load at the center of the floor was also measured using laser detectors and was found to be 1.54 mm, which is 23% lower than the deflection of 1.99 mm from the FEA. The difference is due to the idealized assumptions in material definition in the FEA as well as the expected environmental (humidity and temperature) effects. Since the purpose of this case study was to evaluate the codified design of the floor system, no effort was made to find mode shapes from the EMA. The deflection and fundamental frequency from the EMA were used to validate the FE model. The average and coefficient of variation (CoV) of the measured frequencies at accelerometers A, B, and C of the first seven peaks in the frequency domain response of Figure 13a are represented in Table 10. Damping values were calculated from the half-band width method and are also represented in Table 10. The NMA results showing mode shapes and corresponding frequencies of the first ten modes of free vibration from the FEA are presented in Figure 13b. The difference between EMA and that determined from FEA was 9%. The average floor damping for each mode was close to 1% critical damping.
Table 10. Dynamic properties of the floor system of Case study II from the digital hammer excitations.
Accelerometer
A
Accelerometer
B
Accelerometer
C
Damping
favg (Hz)CoVfavg (Hz)CoVfavg (Hz)CoVζCoV
19.080.59%9.080.01%9.080.01%0.90%0.14%
217.053.77%16.682.81%16.770.50%1.08%0.66%
317.840.01%17.452.65%17.980.31%1.03%0.17%
419.410.01%19.490.19%19.400.34%0.84%0.55%
520.980.01%21.030.20%21.040.24%0.91%0.14%
622.010.26%22.310.33%22.230.37%0.89%0.14%
724.860.01%23.692.41%23.550.40%0.95%0.21%
The EMA and NMA showed that the floor system had mode shapes closely spaced, i.e., different mode shapes with slight differences in frequencies. The fundamental frequency of the floor system was from the plate bending mode (1.1). The second bending mode from FEA appeared to be in the banding of the steel bearer beams (PFCs) and was not seen in any accelerometer readings. The mode shapes 1–6 were bending in the minor axis and range in frequencies from 13.04 Hz to 17.5 Hz. The 2-lobe major bending mode shape (mode 7 in Figure 13b) occurred at 17.46 Hz (FEA) and 18 Hz. The remaining mode shapes up to mode 10 were minor axis bending.
To determine the theoretical frequency of the floor system from Equation (16) [47], NMA was conducted to calculate frequencies of each component of the floor system. The fundamental frequency of a single PFC (steel bearer beam) and a single joist exhibited the same mode shape as those in Mode 1 of Figure 13b, which were 7.99 Hz and 16.32 Hz, respectively. Using Equation (16) and considering that the floor system had 2 PFC beams and 14 joists, a fundamental frequency of 15.94 Hz was calculated, which was 75% greater than the measured frequency. If the number of PFC beams and joists are reduced to one, the frequency calculated from Equation (16) becomes 7.18 Hz.

8.3. Walking Tests and Evaluation to ISO 2631.2 and BS 6472-1

The floor was tested for a single individual and two person walking path, as shown in green in Figure 12. The starting positions are indicated by numbers 1 to 3 on Figure 12. The finishing point was St. 1 in all walking scenarios. Two different walking frequencies, namely, fw of 1.80 Hz (brisk walking) and 2.25 Hz (fast walking), were selected such that the harmonics of the fundamental frequency (9.08 Hz), the 4th harmonic with a walking frequency of 2.25 Hz, and the 5th harmonic at a walking frequency of 1.80 Hz were excited. Walker 1 (800 N) and walker 2 (750 N) followed a constant stride length of 700 mm at both walking speeds. The walking configurations are outlined in Table 11.
Table 11. Measured vibration responses of the floor system of Case study II from different walking configurations.
Walking Configuration
fw
(Hz)
Walker 1
(80 kg)
Walker 2
(75 kg)
Single Walker W1 @ St. 1Double Walkers
W1 Start @ St.1
W2 Start @ St. 2
Double Walkers
W1 Start @ St.1
W2 Start @ St. 3
T11.80---
T22.25---
T31.80--
T42.25--
T51.80--
T62.25--
Vibration Response Parameters
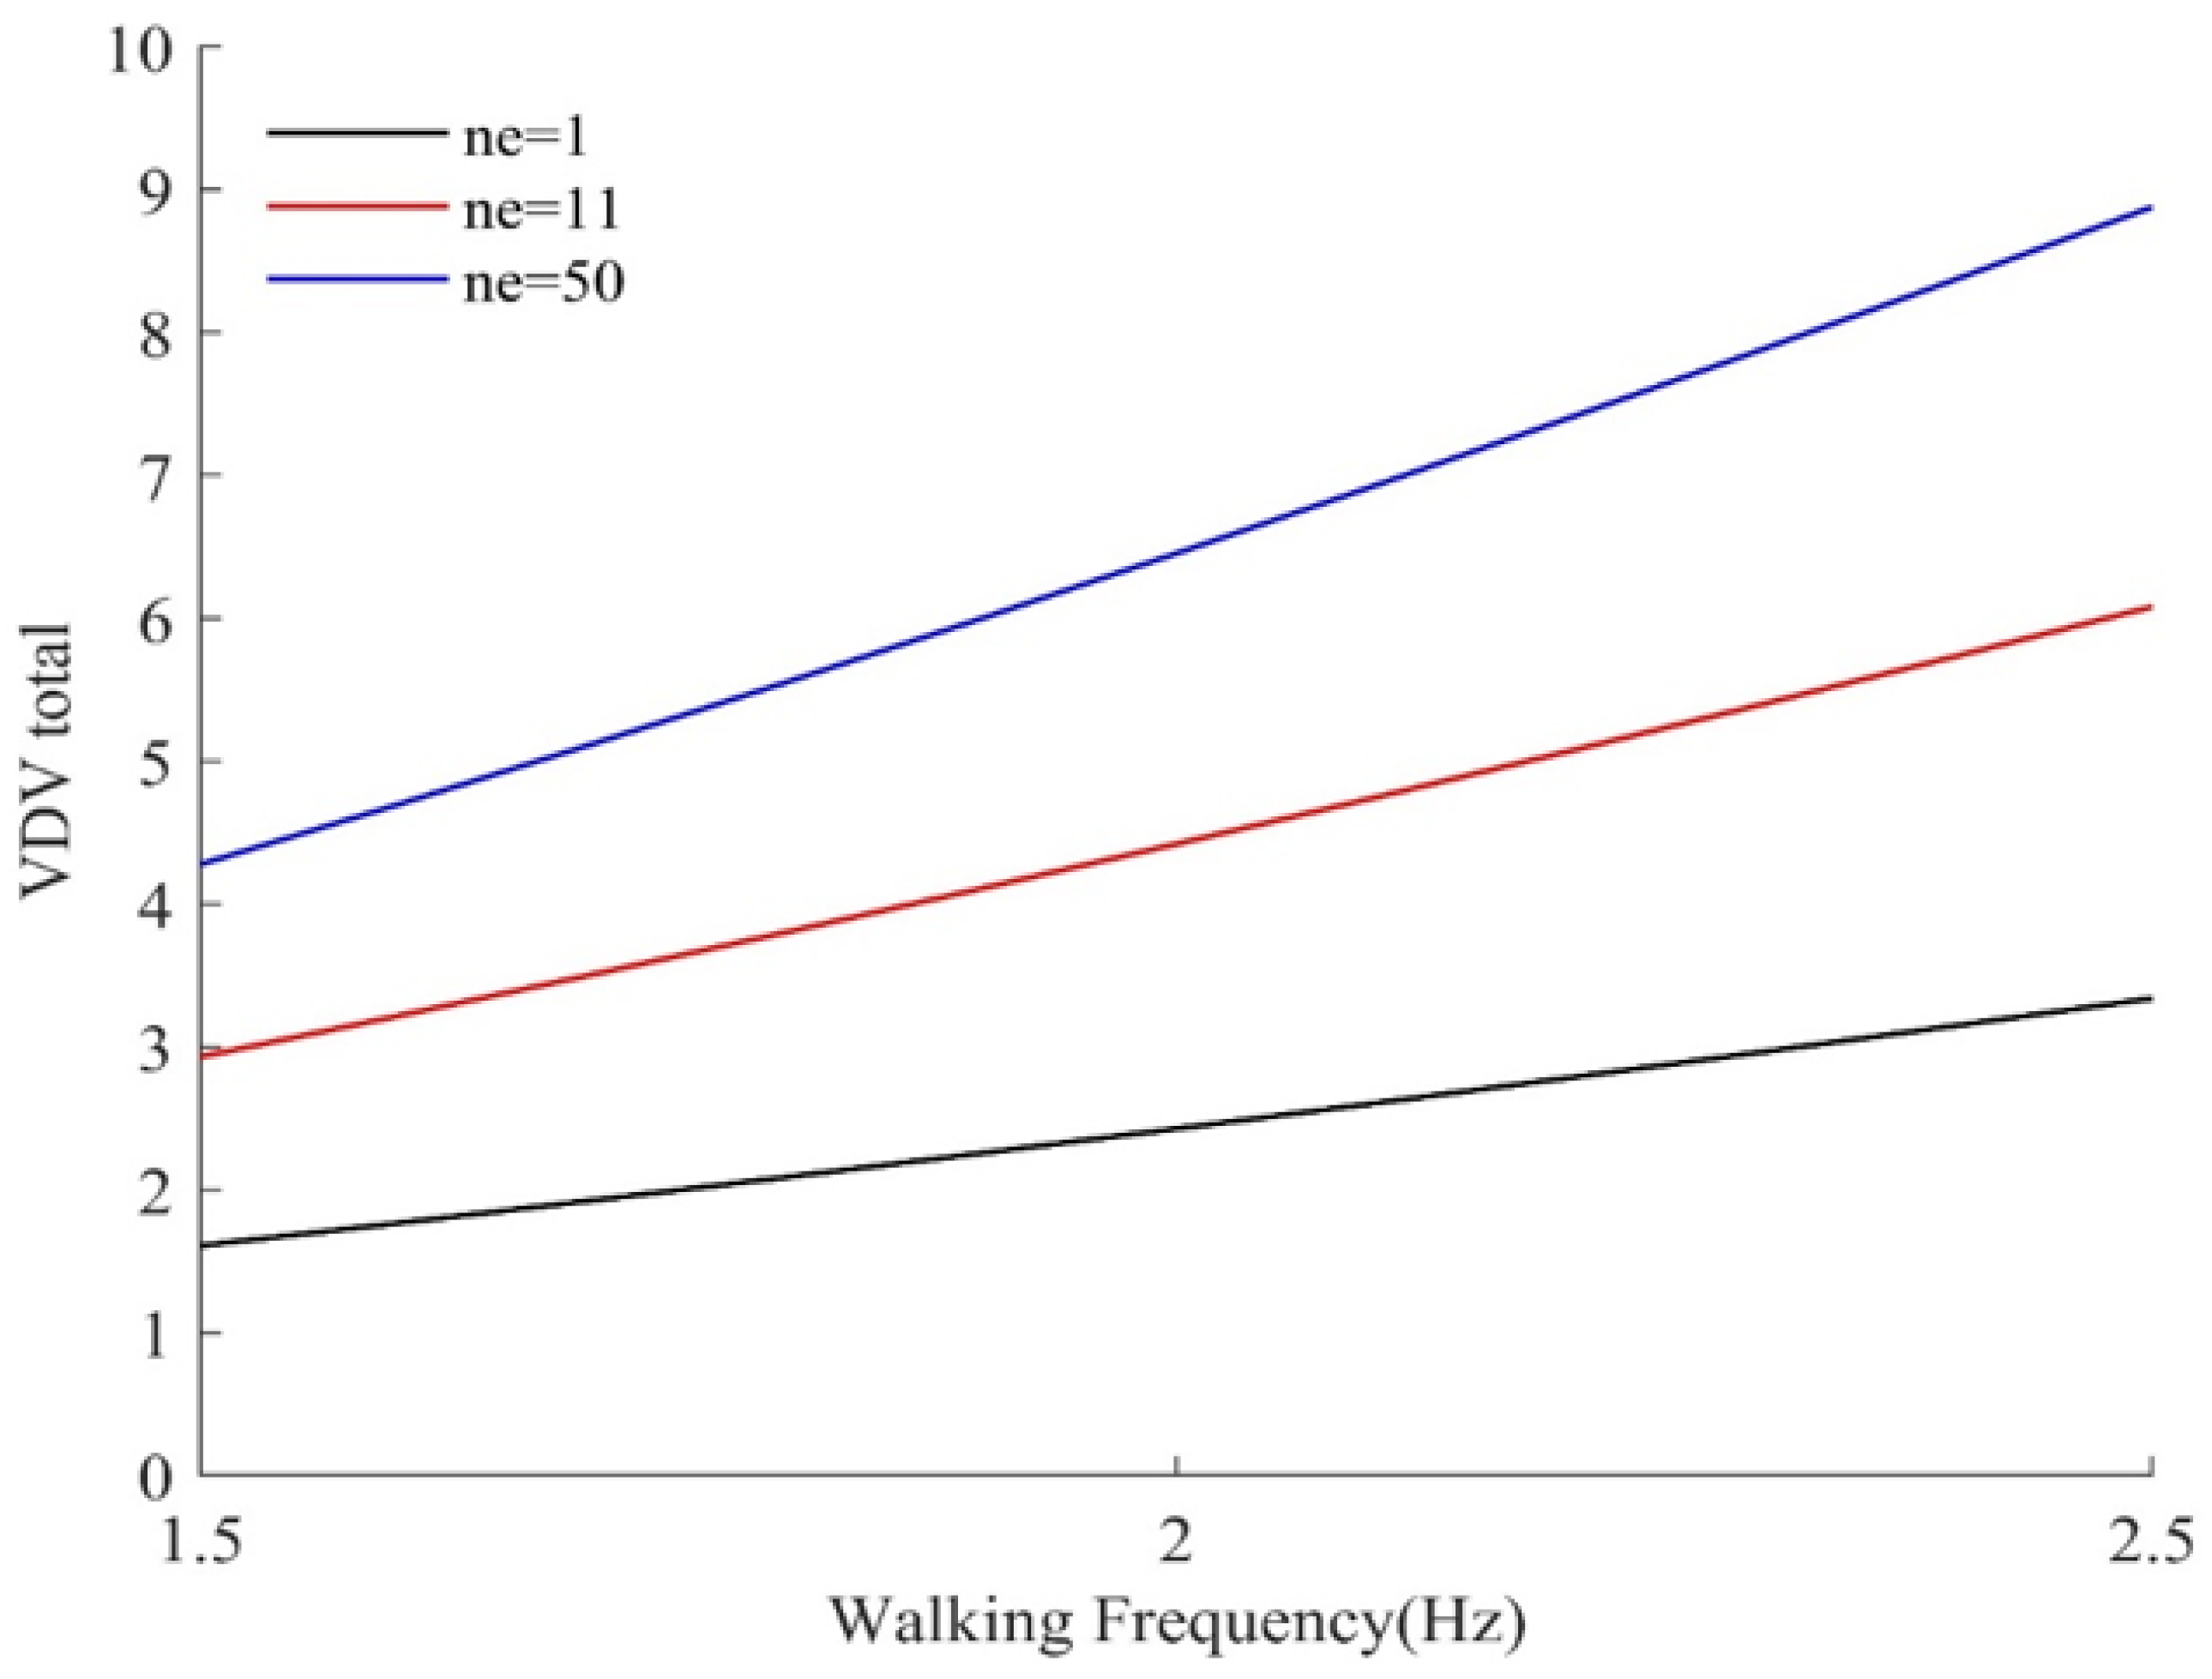
aw
(m/s2)
Equation (2)
aw,max
(m/s2)
MTVV
(m/s2)
Equation (3)
VDV
(m/s1.75)
Equation (4)
V D V a w T 1 / 4 > 1.75
M T V V a w > 1.5
Equation (5)
Max number of events, ne
Equation (43)
T10.751.750.750.92No11
T20.912.050.911.10No10
T31.172.661.171.39No10
T41.543.721.541.89No11
T50.781.790.780.92No9
T61.292.661.291.52No9
A Butterworth post-processing function was used to filter the data, and the accelerations were weighted by the vertical factors, wk, (Figure 3b) of ISO 10137 [31]. The experimental and ISO-weighted acceleration time histories of T1 to T6 walking configuration tests are plotted in Figure 14. The acceleration time histories in Figure 14 showed a steady-state (refer to Figure 2 for the definition) response much more significant than a transient response in all walking configurations. A clear resonant excitation response was seen in all configurations. It is worth noting that the measured fundamental frequency of 9.08 Hz in comparison with the recommended frequency cut-off rates in Table 4 suggests that the floor can be assumed to either have a steady state or transient response.
The frequency spectrum of each walking test is also shown on the corresponding plot, revealing that the fundamental frequency was significantly excited in all configurations. However, in dual walker configurations (T3–T6) the higher modes were also excited. Most significant was the 18 Hz peak in T3–T6, which was close to the FEA frequency of 17.46 Hz and the major bending mode shape (mode 7 in Figure 13).
The important vibration performance response parameters are represented in Table 11. Following the recommendations of ISO 2631-1 [30], the running root-mean-square (RMS) acceleration, aw, was calculated using an integration time constant of 1 s. The maximum acceleration, aw,max, corresponded to the sum of peaks (SoPs) in the time history (see Figure 8, for an illustration of SoP). The maximum transient vibration value (MTVV) and vibration dose value (VDV) were calculated from Equations (3) and (4), respectively. In all walking configurations, the conditions of Equation (5), ISO 2631-1 [30] were not satisfied. Therefore, in the evaluation of comfort, only aw, needed to be checked [30]. However, for the sake of comparison, the equivalent maximum number of events (ne) that may produce a “low probability of adverse comment” according to BS 6472-1 [34] was also calculated from Equation (43). The maximum acceleration and RMS accelerations in Table 11 were in T4, where the walkers followed a diagonal walking pattern. As shown in the frequency spectrum of T4 in Figure 14, many higher frequency modes were incorporated in the vibration response.
In single person walking scenarios (T1 and T2), by dividing the RMS acceleration, aw, (in Equation (2)) by the base acceleration of 0.05 m/s2 (Figure 4a), the multiplying factors of 15 and 18.2 were calculated, respectively. Both factors were outside the recommended multiplying factors (<4) for continuous and intermittent vibrations for residential and office buildings in Table 2. Assuming a transient vibration, the limit multiplying factors for residential and office were 90 and 128, respectively. Using Equation (7), as specified in ISO 10137 [31] to account for the number of events, assuming a 15 s event with 11 repetitions (ne of T1 in Table 4), Equation (7) gave an F value equal to 0.21. Multiplying F by the limit value of 90, it was reduced to 18.9, which means the floor was acceptable in residential and office settings with 11 events during the day. Comparing single person walking VDVs with those in Table 2, the floor was acceptable for residential usage during a 16 h day period.

8.4. Vibration Design to AS 1170.0 and IRC

The modelled static load at the mid-span deflection under a 1 kN vertical load, d1kN, from FEA was equal to 1.99 mm and was very close to the 2 mm limit recommended in the AS 1170.0 [19]. Under a combination of self-weight and a 40% live load, with distributed live loads of 1.5 kPa (residential) and 3 kPa (commercial), the floor center deflections were 13.9 mm and 23.1 mm, respectively, compared to the 20 mm limit (L/300) serviceability criterion recommended in AS 1170.0 [19]. The predicted deflection under live loads of 1.44 kPa (30 psf) and 1.91 kPa (40 psf) for residential and mixed-use dwellings were 22.3 mm and 29.5 mm, respectively, greater than the 16.7 mm (L/360) limit in the International Residential Code (IRC) [61].

8.5. Vibration Design Based on Empirical and Simplified Analytical Methods

8.5.1. Simplified Method in ISO/TR 21136

Comparison against the deflection–frequency relationship shown in Equation (25) is recommended in ISO/TR 21136 [66] with an f1 value equal to 9.08 Hz, which gave a deflection limit of 0.6 mm and was well below the measured and FEA deflections. With regards to the test results from the Canadian survey as depicted in Figure 6a of the companion paper 1, it is clear that the floor system did not meet the acceptance criteria. The measured frequency–deflection is presented in blue on Figure 6a and indicates that the floor response was far from the acceptable curve [66].

8.5.2. Empirical Method of Hamm et al.

Using Equation (28) of REF part 1 to determine the maximum acceleration as proposed by Hamm et al. [63] in Equation (28), with an F value equal to 280 N (for the measured range of walking frequencies), assuming m is equal to 1437 kg (equivalent to 40 kg/m2) including PFC beams and short columns and considering a measured damping of 0.9% (from Table 10), an amax value of 1.09 m/s2 was calculated, which was 38% smaller than the measured amax of 1.75 m/s2 at a fw of 1.80 Hz. Regardless, the maximum acceleration was larger than the 0.05 m/s2 and 0.10 m/s2 recommended for higher performance floors and lower performance floors, respectively.

8.5.3. Combined Frequency, Deflection, and Impulse Velocity in EN 1995-1-1:2004

With respect to design rules in EN 1995-1-1:2004 [15], three conditions in Equation (29) had to be validated. The fundamental frequency of the floor was greater than 8 Hz with deflection under 1 kN equal to 1.54 mm. Using FEA, the MOE values of a 1 m wide panel in longitudinal and cross-span directions were calculated as (EI)L = 2.35 × 10⁶ Nm2/m and (EI)b = 1.60 × 10³ Nm2/m, respectively. Using Equation (29), the fundamental frequency was 10.6 Hz, n40 was equal to 12, and the unit impulse velocity response was v equal to 18.6 mm/Ns2. With respect to the graph in Figure 6b, the floor system had an x-coordinate of 1.54 mm and a y-coordinate of 97 mm and fell into the better performance region. However, the third condition in Equation (29) suggests that v should be less than 16.2 mm/Ns2. If the FEA results, f1 = 9.90 Hz and a deflection of 1.99 mm with n40 = 15 (calculated from FEA) were used, the unit impulse velocity response, v, of 23.0 mm/Ns2 would still have been larger than the 19.5 mm/Ns2 criterion. Therefore, the floor system did not satisfy the velocity requirement of EN 1995-1-1 [15].

8.5.4. Vibration-Controlled Span in CSA 086:19

Following the recommendations of CSA 086:19 [16] for a vibration-controlled span, using Equation (30), k1 and Ktss were equal to 0.15 and 0.49, respectively, and EIeff was equal to 2.35 × 10⁶ Nm2 (from the FEA). A maximum recommended span lv of 5310 mm was calculated, which suggests that the floor system was not acceptable.

8.5.5. One Step Root Mean Square Method (HIVOSS)

Using the method in HIVOSS [62] with a damping of 3% (including damping of the floor finishes, furniture, and structural system), f1 = 9.90 Hz and modal mass of 359 kg (m* = m/4), the OS-RMS90 was almost 13 (see contours in Figure 7). The floor was classified in the border of E and F. Assuming Class E, the floor is not recommended in critical workspace or health and education buildings, and it is critical for residential, office, retail, hotels, and meeting rooms. If used in industrial and sport facilities the floor will have acceptable vibration performance.

8.5.6. Floor Performance vs. Floor Usage in prEN 1995-1-1: 2025 (Final Draft)

Following the recommendations in prEN 1995-1-1 2025 (Final Draft) [70] and using the simplified expression in Equation (31), including an added 10% imposed load of 2 kPa in residential and 3 kPa in office buildings from AS 1170.1:2002 [64], the fundamental frequency, f1, of the floor systems were calculated as 6.45 Hz (residential) and 5.90 Hz (office). The corresponding wsys values for residential and office floors from the FEA were 7.78 mm and 9.31 mm, respectively. The frequency multiplier factors ke1 and ke2 were equal to one. The calculated frequencies were larger than the minimum allowable fundamental floor frequency of 4.5 Hz prEN 1995-1-1 2025 (Final Draft) [70]. Since the fundamental frequency was below 8 Hz, the d1kN and acceleration criteria had to be checked. The arms values of the residential and office floors from Equation (34) were 1.05 m/s2 and 1.31 m/s2, respectively (assuming 2% modal damping ratios ζ recommended for joisted floors). In comparison with the performance levels in Table 6, d1kN > 1.6 mm, and from the calculated response factors, R (R = arms/0.005) values of 210 and 262 for residential and office floors, respectively, the floor did not fall within any recommended class according to prEN 1995-1-1 2025 (Final Draft) [70].
If the engineer decides to use the measured fundamental frequency, f1 = 9.08 Hz, and a d1kN value of 1.54 mm, the vibration velocity requirements of Equation (35) need to be checked. The calculated RMS velocities, vrms, of the residential and office floors (with fw of 1.5 Hz in residential floors and 2.0 Hz in other floors) were 0.0039 m/s and 0.0083 m/s, respectively. The corresponding response factors, R (R = vrms/0.0001) values of 40 and 83, were calculated, which placed the floor in a level VI, and “economic choice” for residential and “non-categorized” for office usage.

8.6. Vibration Design Based on the Modal Superposition Methods

8.6.1. AISC/CISC DG 11

The floor was assessed based on recommendations of DG 11 [23] with 3% critical damping and a measured fundamental frequency of 9.08 Hz. Assuming a low frequency (resonance response), the peak acceleration (Equation (44)) was equal to 0.21 m/s2, which returned a response factor, R, of 5.7. If Equation (45) was used, the equivalent sinusoidal peak acceleration, aESPA, ranged between 0.065 m/s2 and 0.112 m/s2 at walking frequencies between 1.5 and 2.2 Hz, respectively. The corresponding response factors, R, ranged from 12 to 21 at the mentioned walking frequencies. Comparing the response factors to the performance targets in Table 7, at low frequency, the floor would be acceptable for offices and residential buildings. At a high frequency, the floor would not be acceptable for any building usage.

8.6.2. CCIP-016

Following the procedure outlined in Equations (36) and (37), the floor was assessed for low-response modal evaluation. A critical damping of 3% was adopted based on the recommendations of CCIP-016 [22]. Several excitation points, corresponding to footfall impacts along the walking path on the panel as shown in Figure 12, were chosen to find the most onerous modal amplitude. Moreover, to find the largest response, accelerometer locations A, B, and C in Figure 12 were examined in the FEA, and up to mode 9 (Figure 13) with a modal frequency twice the fundamental frequency. Response factors, R, at different walking frequencies are plotted in Figure 15 at three accelerometer locations. A maximum R of 479 was calculated at a walking frequency of 2.48 Hz, which corresponded to the location of accelerometer A. The peaks at other locations were slightly lower. The response factor from DG 11 [23], R = 5.7, was also shown on the graph. Current findings from the CCIP-016 method [22] were significantly different from DG 11 [23]. Furthermore, CCIP-016 [22] curves suggest that the response factor should exponentially grow with the increase in the walking frequency. This was not in agreement with the experimental measurements using accelerometers at A, B, or C.
Figure 15. Case study II, showing the response factors from modal superposition methods: (a) CCIP-016 [22] for low-frequency floors; (b) CCIP-016 [22], SCI-P354 [21], and DG 11 [23] for high-frequency floors; and (c) the total response, v(t), using CCIP-016 [22] Equation (38) at experimental walking frequencies.
Buildings 13 01756 g015
The evaluation of the high-frequency response (impulse) is shown in Figure 15b,c. The total velocity responses v(t) at the experimental walking frequencies are plotted in Figure 15c and show a significant decay in the response within a 1 s duration. Experimental velocity responses calculated from a numerical integration of the measured acceleration (not shown here) did not display such a quick decay. The response factors from Equation (38) are plotted for different walking frequencies in Figure 15b from CCIP-016 [22] and DG 11 [23]. A linearly growing trend was seen with all of them, which showed good agreement between CCIP-016 [22] and DG 11 [23] predictions at locations A and C. Interestingly, at location B, which was closer to the free edge of the floor, the response factors were considerably larger. A comparison between the calculated response factors with the acceptable performance criteria in Table 7 suggests that the floor missed the target values by a large margin.

8.6.3. SCI-P354

The total acceleration response function, aw(t), was calculated by summing the awrms values of each mode of vibration at each harmonic (up to four harmonics) using Equation (39) with a critical damping of 1.1%, as suggested in the guideline. That yielded an RMS acceleration of 0.4 m/s2 (response factor of 80), which is shown in Figure 15a and compared to other modal predictions for low-frequency floors. Compared with the recommended tolerance limits of BS 6472-1 [34] shown in Figure 4d, the calculated acceleration (4% g) was outside the acceptable region for offices and residencies.
Response factors of the walking measurements are presented in a table in Figure 15a for each walking configuration (T1-T6). It can be seen that the measured response factors were well below the predictions of CCIP-016 [22] and SCI-P354 [21]. DG 11 [23] underestimated the physical test results. The maximum allowed numbers of events (Equation (43)) are represented in Table 11.

8.6.4. Harmonized Peak Acceleration and VDV Approach

Using the fundamental frequency of 9.08 Hz (from experiment), a modal mass of 316 kg (from FEA), and a critical damping of 3%, the total VDVs for a range of events were calculated from Equation (46) and are plotted in Figure 16 [18]. In derivation of the total VDVs, only the fundamental frequency of the floor was incorporated. It can be seen that even at ne equal to 1, the total VDVs were higher than the tolerances in Table 2, and thus the floor would not be acceptable for residential buildings. It should be noted that the peak acceleration calculated from Equation (46) was not very sensitive to the adopted damping ratio. A comparison between VDVs from physical tests in Table 11 and in Figure 16 [18] suggested that the harmonized method provided a higher bound of the experimental observations.
Figure 16. Total VDVs from Equation (46) proposed by Chang et al. [18] at different walking frequencies and for different numbers of events (ne).
Buildings 13 01756 g016

9. Conclusions and Suggestions for Future Work

A comprehensive review of the existing knowledge, methods of measurement, analysis, prediction, and design for vibration of timber floors is conducted and presented. The information gathered and presented in this study can be useful to architects and engineers in making an educated decision about the vibration performance of the long-span timber floor systems. Although there is ample information available, there is no harmonized method that can accurately predict the vibration performance of the timber floor systems. Additionally, the existing methods are calibrated for concrete and concrete/steel composite floors, and their direct application in assessment of timber floors is questionable. The information available on dynamic properties of long-span timber floor systems and their responses to dynamic excitations from walking, running, and rhythmic activities is very limited.
Simplified methods of vibration design provide a rigid “Yes” or “No” acceptance criterion. The acceptance criterion is based on frequency–deflection equations in which the frequency appears in powers of two and larger. Hence, finding the accurate frequency of the floor system is critical. It was shown that a modal analysis in FEA could provide a reasonable approximation of the measured fundamental frequency of the floor system. However, simplified equations fail to provide accurate fundamental frequencies. The other issue in using simplified methods is calculation of the deflection. The deflection of the floor system under a 1 kN concentrated load is normally smaller than 2 mm, and its measurement is a delicate task.
The engineer may decide to use modal superposition methods. The vibration performance in these methods is based on the frequency cut-offs, modal mass, mode shapes, and damping. This will provide the engineer more flexibility to make a judgement on the vibration performance of the floor. However, the current study shows that the response factors predicted by modal superposition methods considerably outweigh the experimental observations. The conservative design approach causes oversizing of the floor systems and their structural elements and may result in forsaking a timber design. Based on the findings of the current study, the following future research directions may be pursued to promote implementation of timber floors in longer spans in buildings of different usages:
  • Measure and formulate load functions of continuous and impulsive excitations as well as rhythmic activities, tailored for long-span timber floors. The existing dynamic vertical forces are based on measurement of footfall forces using force plates and on stiff grounds. Furthermore, these force models do not account for the human-induced response between the walker and the floor, such as the feed-back phenomenon observed between the user and the structure with the Millennium Bridge in [98]. These models can be improved by using more accurate measurement equipment such as digital pressure mats. In laboratory testing, the walker can be placed in a virtual reality (VR) environment using VR goggles to achieve more realistic walking dynamics.
  • Characterize the dynamic properties (frequencies, modal mass, mode shape, and damping) and response to vibration of long-span floor panels (i) in the laboratory environment, and (ii) floor systems in selected constructed or completed buildings. This will help in understanding the difference between a slab design analogy and the actual performance of the floor within the mass timber or light-frame structural system.
  • Develop experimentally validated analytical models that can reliably predict the dynamic properties and vibration response of the floor systems.
  • Assess occupant comfort with different floor usages and identify acceptance criteria for the investigated floor systems. Selected completed buildings with long-span timber floors, an office floor for instance, can be instrumented and monitored during working hours, and the occupants’ experiences can be collected from surveys. There will be vast benefit in gathering the data from field tests and occupant surveys to establish an international database for researchers and practitioners worldwide for vibration design of long-span timber floor systems.

Author Contributions

Conceptualization, H.K. and F.P.; methodology, H.K. and F.P.; formal analysis, H.K.; investigation, H.K. and F.P.; resources, H.K., F.P., A.F., N.T. and D.M.; data curation, H.K. and F.P.; writing—original draft preparation, H.K. and F.P.; writing—review and editing, H.K., F.P., A.F., N.T. and D.M.; visualization, H.K. and F.P.; supervision, H.K.; project administration, H.K. All authors have read and agreed to the published version of the manuscript.

Funding

This research received no external funding.

Data Availability Statement

No new data were created.

Conflicts of Interest

The authors declare no conflict of interest.

References

  1. Yu, M.; Wiedmann, T.; Crawford, R.; Tait, C. The carbon footprint of Australia’s construction sector. Procedia Eng. 2017, 180, 211–220. [Google Scholar] [CrossRef]
  2. Australian Industry Skills Committee. Construction; Australian Industry Skills Committee: Canberra, Australia, 2022. [Google Scholar]
  3. Mai, K.Q.; Park, A.; Nguyen, K.T.; Lee, K. Full-scale static and dynamic experiments of hybrid CLT–concrete composite floor. Constr. Build. Mater. 2018, 170, 55–65. [Google Scholar]
  4. Hassanieh, A.; Valipour, H.; Bradford, M. Experimental and numerical investigation of short-term behaviour of CLT-steel composite beams. Eng. Struct. 2017, 144, 43–57. [Google Scholar] [CrossRef]
  5. Carradine, D. Multi-Storey Light Timber-Framed Buildings in New Zealand—Engineering Design; BRANZ: Judgeford, New Zealand, 2019. [Google Scholar]
  6. Masaeli, M.; Gilbert, B.P.; Karampour, H.; Underhill, I.D.; Lyu, C.; Gunalan, S. Experimental assessment of the timber beam-to-column connections: The scaling effect. In Proceedings of the World Conference on Timber Engineering 2021, WCTE 2021, Santiago, Chile, 9–12 August 2021. [Google Scholar]
  7. TTW. Atlassian Sydney Headquarters. Available online: http://www.ttw.com.au/projects/atlassian-sydney-headquarters (accessed on 9 February 2023).
  8. United Nations. Department of Economic and Social Affairs, The 2030 Agenda for Sustainable Development. Available online: https://www.un.org/en/development/desa/publications/global-sustainable-development-report-2015-edition.html (accessed on 9 February 2023).
  9. WoodWorks. U.S. Mass Timber Construction Manual. Available online: https://www.woodworks.org/resources/u-s-mass-timber-construction-manual/ (accessed on 9 February 2023).
  10. Bazli, M.; Heitzmann, M.; Ashrafi, H. Long-span timber flooring systems: A systematic review from structural performance and design considerations to constructability and sustainability aspects. J. Build. Eng. 2022, 48, 103981. [Google Scholar] [CrossRef]
  11. Hosseini, S.M.; Peer, A. Wood Products Manufacturing Optimization: A Survey. IEEE Access 2022, 10, 121653–121683. [Google Scholar] [CrossRef]
  12. Hu, L.J.; Chui, Y.H.; Onysko, D.M. Vibration serviceability of timber floors in residential construction. Prog. Struct. Eng. Mater. 2001, 3, 228–237. [Google Scholar] [CrossRef]
  13. Pavic, A. Results of IStructE 2015 survey of practitioners on vibration serviceability. In Proceedings of the SECED 2019 Conference: Earthquake Risk and Engineering towards a Resilient Word, London, UK, 9–10 September 2019. [Google Scholar]
  14. Dolan, J.; Murray, T.; Johnson, J.; Runte, D.; Shue, B. Preventing annoying wood floor vibrations. J. Struct. Eng. 1999, 125, 19–24. [Google Scholar] [CrossRef]
  15. EN 1995-1-1; Eurocode 5: Design of Timber Structures—Part 1-1: General—Common Rules and Rules for Buildings. European Committee for Standardization: Brussels, Belgium, 2004.
  16. CSA 086:19; Engineering Design in Wood. National Standard of Canada: Ottawa, ON, Canada, 2019.
  17. Hu, L. Serviceability design criteria for commercial and multi-family floors. In Canadian Forest Service Report; Forintek Canada Corporation: Sainte-Foy, QC, Canada, 2000. [Google Scholar]
  18. Chang, W.; Goldsmith, T.; Harris, R. A new design method for timber floors–peak acceleration approach. In Proceedings of the International Network on Timber Engineering Research Meeting 2018, Tallinn, Estonia, 13–16 August 2018. [Google Scholar]
  19. AS/NZS 1170.0; Structural Design Actions, Part 0: General Principles. Australian Standard: Sydney, Australia, 2002.
  20. CEAS. Consulting Engineering Advancement Society. Available online: https://ceas.co.nz/ (accessed on 9 February 2023).
  21. Smith, A.L.; Hicks, S.J.; Devine, P.J. Design of Floors for Vibration: A New Approach; Steel Construction Institute Ascot: Berkshire, UK, 2007. [Google Scholar]
  22. Concrete Centre. A Design Guide for Footfall Induced Vibration of Structures; Concrete Centre: London, UK, 2006. [Google Scholar]
  23. Murray, T.; Allen, D.; Ungar, E.; Davis, D.B. Steel Design Guide Series 11: Vibrations of Steel-Framed Structural Systems Due to Human Activity; American Institute of Steel Construction: Chicago, IL, USA, 2016; Available online: https://www.aisc.org/Design-Guide-11-Vibrations-of-Steel-Framed-Structural-Systems-Due-to-Human-Activity-Second-Edition (accessed on 1 June 2023).
  24. Feldmann, M.; Heinemeyer, C.; Butz, C.; Caetano, E.; Cunha, A.; Galanti, F.; Goldack, A.; Hechler, O.; Hicks, S.; Keil, A. Design of Floor Structures for Human Induced Vibrations. JRC–ECCS Joint Report 2009. Available online: https://publications.jrc.ec.europa.eu/repository/bitstream/JRC55118/jrc_design_of_floor100208.pdf (accessed on 1 June 2023).
  25. Ebrahimpour, A.; Sack, R.L. A review of vibration serviceability criteria for floor structures. Comput. Struct. 2005, 83, 2488–2494. [Google Scholar] [CrossRef]
  26. Sitharam, T.; Sebastian, R.; Fazil, F. Vibration isolation of buildings housed with sensitive equipment using open trenches–case study and numerical simulations. Soil Dyn. Earthq. Eng. 2018, 115, 344–351. [Google Scholar] [CrossRef]
  27. Sanayei, M.; Zhao, N.; Maurya, P.; Moore, J.A.; Zapfe, J.A.; Hines, E.M. Prediction and mitigation of building floor vibrations using a blocking floor. J. Struct. Eng. 2012, 138, 1181–1192. [Google Scholar] [CrossRef]
  28. Wiss, J.F.; Parmelee, R.A. Human perception of transient vibrations. J. Struct. Div. 1974, 100, 773–787. [Google Scholar] [CrossRef]
  29. Chopra, A.K. Dynamics of Structures; Pearson Education India: Chennai, India, 2007. [Google Scholar]
  30. ISO 2631-1–AS 2670.1; Evaluation of Human Exposure to Whole-Body Vibration—Part 1: General Requirements. Australian Standard: Sydney, Australia, 2001.
  31. ISO 10137; Basis for Design of Structures-Serviceability of Buildings and Walkways against Vibrations. International Standards Organisation: Geneva, Switzerland, 2007.
  32. AS ISO 2631.2; Mechanical Vibration and Shock—Evaluation of Human Exposure to Wholebody Vibration, Part 2: Vibration in Buildings (1 Hz to 80 Hz). Australian Standard: Sydney, Australia, 2014.
  33. BS 6472; Guide to the Evaluation of Human Exposure to Vibration in Buildings (1Hz to 80 Hz). British Standards Institution: London, UK, 1992.
  34. BS 6472-1; Guide to Evaluation of Human Exposure to Vibration in Buildings. British Standards Institution: London, UK, 2008.
  35. Sedlacek, G.; Heinemeyer, C.; Butz, C.; Veiling, B.; Waarts, P.; Van Duin, F.; Hicks, S.; Devine, P.; Demarco, T. Generalisation of criteria for floor vibrations for industrial, office, residential and public building and gymnastic halls. EUR 2006, 1–343. Available online: https://op.europa.eu/en/publication-detail/-/publication/a2fc45db-6b9a-49e6-9f36-72fc25a8eded/language-en (accessed on 1 June 2023).
  36. Kerr, S.C. Human Induced Loading on Staircases; University of London: London, UK; University College London: London, UK, 1999; Available online: https://discovery.ucl.ac.uk/id/eprint/1318004/1/312827.pdf (accessed on 1 June 2023).
  37. Wheeler, J.E. Prediction and control of pedestrian-induced vibration in footbridges. J. Struct. Div. 1982, 108, 2045–2065. [Google Scholar] [CrossRef]
  38. Basaglia, B.M.; Li, J.; Shrestha, R.; Crews, K. Response prediction to walking-induced vibrations of a long-span timber floor. J. Struct. Eng. 2021, 147, 04020326. [Google Scholar] [CrossRef]
  39. Ji, T.; Pachi, A. Frequency and velocity of people walking. Struct. Eng. 2005, 84, 36–40. [Google Scholar]
  40. Toratti, T.; Talja, A. Classification of human induced floor vibrations. Build. Acoust. 2006, 13, 211–221. [Google Scholar] [CrossRef]
  41. Rahbar Ranji, A.; Rostami Hoseynabadi, H. A semi-analytical solution for forced vibrations response of rectangular orthotropic plates with various boundary conditions. J. Mech. Sci. Technol. 2010, 24, 357–364. [Google Scholar] [CrossRef]
  42. El-Dardiry, E.; Ji, T. Modelling of the dynamic behaviour of profiled composite floors. Eng. Struct. 2006, 28, 567–579. [Google Scholar] [CrossRef]
  43. Allen, D.; Murray, T. Design criterion for vibrations due to walking. Eng. J. 1993, 30, 117–129. [Google Scholar]
  44. Wyatt, T.; Dier, A. Floor serviceability under dynamic loading. In Proceedings of the International Symposium “Building in Steel-The Way Ahead”; ECCS Publication: Stratford-upon-Avon, UK, 1989; pp. 19–20. Available online: https://www.google.com.au/books/edition/Building_in_Steel/o95RAAAAMAAJ?hl=en (accessed on 1 June 2023).
  45. Ohlsson, S. Ten years of floor vibration research—A review of aspects and some results. In Proceedings of the Symposium/Workshop on Serviceability of Buildings (Movements, Deformations, Vibrations), Ottawa, ON, Canada, 16 May 1988; pp. 419–434. [Google Scholar]
  46. Karnovsky, I.A.; Lebed, O.I. Formulas for Structural Dynamics: Tables, Graphs and Solutions; McGraw-Hill Education: New York, NY, USA, 2001. [Google Scholar]
  47. Middleton, C.; Brownjohn, J. Response of high frequency floors: A literature review. Eng. Struct. 2010, 32, 337–352. [Google Scholar] [CrossRef]
  48. Basaglia, B.M. Dynamic Behaviour of Long-Span Timber Ribbed-Deck Floors. Ph.D. Thesis, University of Technology Sydney, Ultimo, Australia, 2019. [Google Scholar]
  49. Stürzenbecher, R.; Hofstetter, K.; Eberhardsteiner, J. Structural design of Cross Laminated Timber (CLT) by advanced plate theories. Compos. Sci. Technol. 2010, 70, 1368–1379. [Google Scholar] [CrossRef]
  50. Karacabeyli, E.; Gagnon, S. Canadian CLT Handbook; FPInnovations: Pointe-Claire, QC, Canada, 2019; Volume 1, Available online: https://web.fpinnovations.ca/wp-content/uploads/clt-handbook-complete-version-en-low.pdf (accessed on 1 June 2023).
  51. Fink, G.; Honfi, D.; Köhler, J.; Dietsch, P. Basis of design principles for timber structures. In A State-of-the-Art Report by COST Action FP1402/WG1; Shaker: Aachen, Germany, 2018; Available online: https://www.cost.eu/uploads/2018/11/Basis-of-Design-Principles-for-Timber-Structures.pdf (accessed on 1 June 2023).
  52. Jarnerö, K.; Brandt, A.; Olsson, A. Vibration properties of a timber floor assessed in laboratory and during construction. Eng. Struct. 2015, 82, 44–54. [Google Scholar] [CrossRef]
  53. Ewins, D.J. Modal Testing: Theory, Practice and Application; John Wiley & Sons: Hoboken, NJ, USA, 2009. [Google Scholar]
  54. ISO 18324; Timber Structure—Test Methods—Floor Vibration Performance. International Standards Organisation: Geneva, Switzerland, 2016.
  55. Labonnote, N. Damping in Timber Structures; NTNU-trykk: Trondheim, Norway, 2012. [Google Scholar]
  56. Rijal, R.; Samali, B.; Shrestha, R.; Crews, K. Experimental and analytical study on dynamic performance of timber floor modules (timber beams). Constr. Build. Mater. 2016, 122, 391–399. [Google Scholar] [CrossRef]
  57. Conta, S.; Homb, A. Sound radiation of hollow box timber floors under impact excitation: An experimental parameter study. Appl. Acoust. 2020, 161, 107190. [Google Scholar] [CrossRef]
  58. Ouis, D. On the frequency dependence of the modulus of elasticity of wood. Wood Sci. Technol. 2002, 36, 335–346. [Google Scholar] [CrossRef]
  59. Craik, R.J.; Barry, P.J. The internal damping of building materials. Appl. Acoust. 1992, 35, 139–148. [Google Scholar] [CrossRef]
  60. Lin, R.; Zhu, J. On the relationship between viscous and hysteretic damping models and the importance of correct interpretation for system identification. J. Sound Vib. 2009, 325, 14–33. [Google Scholar] [CrossRef]
  61. Code, B. International Residential Code; International Energy: Paris, France, 2018. [Google Scholar]
  62. RFS2-CT-2007-00033; Design of Footbridges Guideline. Human Induced Vibrations of Steel Structures. HIVOSS: Luxembourg, 2009.
  63. Hamm, P.; Richter, A.; Winter, S. Floor vibrations–new results. In Proceedings of the 11th World Conference on Timber Engineerig (WCTE2010), Riva del Garda, Italy, 20–24 June 2010. [Google Scholar]
  64. AS/NZS 1170.1; Structural Design Actions, Part 1: Permanent, Imposed and Other Actions. Australian Standard: Sydney, Australia, 2002.
  65. Woeste, F.; Dolan, J. Design to minimize annoying wood-floor vibrations. Struct. Eng. 2007, 8, 24–27. [Google Scholar]
  66. ISO/TR 21136; Timber Structures—Vibration Performance Criteria for Timber Floors. International Standards Organisation: Geneva, Switzerland, 2017.
  67. Onysko, D. Serviceability Criteria for Residential Floors Based on a Field Study of Consumer Response; FPInnovations: Ottawa, ON, Canada, 1986; Available online: https://library.fpinnovations.ca/en/permalink/fpipub38186 (accessed on 1 June 2023).
  68. Smith, I.; Chui, Y.H. Design of lightweight wooden floors to avoid human discomfort. Can. J. Civ. Eng. 1988, 15, 254–262. [Google Scholar] [CrossRef]
  69. Hu, L. Serviceability of Next Generation Wood Buildings: Laboratory Study of Vibration Performance of Cross-Laminated-Timber (CLT) Floors; FPinnovations: Québec, QC, Canada, 2013; Available online: https://library.fpinnovations.ca/en/permalink/fpipub39703 (accessed on 1 June 2023).
  70. prEN 1995-1-1:2025; Vibrations. European Committee for Standardization: Brussels, Belgium, 2025.
  71. EN 16929; Test Methods—Timber Floors—Determination of Vibration Properties. European Committee for Standardization: Brussels, Belgium, 2018.
  72. ASHRAE. Noise and Vibration Control; Handbook A49; ASHRAE: Peachtree Corners, GA, USA, 2019. [Google Scholar]
  73. Ellis, B. Serviceability Evaluation of Floor Vibration Induced by Walking Loads; Structural Engineer: London, UK, 2001. [Google Scholar]
  74. Rainer, J.; Pernica, G.; Allen, D.E. Dynamic loading and response of footbridges. Can. J. Civ. Eng. 1988, 15, 66–71. [Google Scholar] [CrossRef] [Green Version]
  75. Huang, H.; Gao, Y.; Chang, W.-S. Human-induced vibration of cross-laminated timber (CLT) floor under different boundary conditions. Eng. Struct. 2020, 204, 110016. [Google Scholar] [CrossRef]
  76. Wang, C.; Chang, W.-S.; Yan, W.; Huang, H. Predicting the human-induced vibration of cross laminated timber floor under multi-person loadings. Structures 2020, 29, 65–78. [Google Scholar] [CrossRef]
  77. Chen, F.; Li, Z.; He, M.; Wang, Y.; Shu, Z.; He, G. Seismic performance of self-centering steel-timber hybrid shear wall structures. J. Build. Eng. 2021, 43, 102530. [Google Scholar] [CrossRef]
  78. Schneider, J.; Tannert, T.; Tesfamariam, S.; Stiemer, S. Experimental assessment of a novel steel tube connector in cross-laminated timber. Eng. Struct. 2018, 177, 283–290. [Google Scholar] [CrossRef]
  79. Karampour, H.; Bourges, M.; Gilbert, B.P.; Bismire, A.; Bailleres, H.; Guan, H. Compressive behaviour of novel timber-filled steel tubular (TFST) columns. Constr. Build. Mater. 2020, 238, 117734. [Google Scholar] [CrossRef]
  80. Darzi, S.; Karampour, H.; Gilbert, B.P.; Bailleres, H. Numerical study on the flexural capacity of ultra-light composite timber sandwich panels. Compos. Part B Eng. 2018, 155, 212–224. [Google Scholar] [CrossRef]
  81. Darzi, S.; Karampour, H.; Bailleres, H.; Gilbert, B.P.; McGavin, R.L. Experimental study on bending and shear behaviours of composite timber sandwich panels. Constr. Build. Mater. 2020, 259, 119723. [Google Scholar] [CrossRef]
  82. Trummer, A.; Krestel, S.; Aicher, S. KIELSTEG-Defining the design parameters for a lightweight wooden product. In Proceedings of the World Conference on Timber Engineering: WCTE 2016, Vienna, Austria, 22–25 August 2016. [Google Scholar]
  83. Skidmore, O.M.S. Timber Tower Research Project. Available online: https://www.som.com/research/timber-tower-research/ (accessed on 25 January 2023).
  84. Auclair, S.C.; Hu, L.; Gagnon, S.; Mohammad, M. Effect of type of lateral load resisting system on the natural frequencies of mid-to high-rise wood buildings. In Proceedings of the WCTE 2018, World Conference on Timber Engineering, Seoul, Republic of Korea, 20–23 August 2018. [Google Scholar]
  85. Jiang, Y.; Crocetti, R. CLT-concrete composite floors with notched shear connectors. Constr. Build. Mater. 2019, 195, 127–139. [Google Scholar] [CrossRef]
  86. CSA 086-14; Supplement: Engineering Design in Wood. Canadian Standards Association: Toronto, ON, Canada, 2016.
  87. Council Binational Softwood Lumber. Nail-Laminated Timber: US Design & Construction Guide; Council Binational Softwood Lumber: Surrey, BC, Canada, 2017; Available online: https://info.thinkwood.com/nlt-design-and-construction-guide-u.s.-version-think-wood-0 (accessed on 25 January 2023).
  88. Barber, D.; Blount, D.; Hand, J.J.; Roelofs, M.; Wingo, L.; Woodson, J.; Yang, F. Design Guide 37: Hybrid Steel Frames with Wood Floors; The American Institute of Steel Construction: Chicago, IL, USA, 2022. [Google Scholar]
  89. Bitter, R.; Mohiuddin, T.; Nawrocki, M. LabVIEW: Advanced Programming Techniques; CRC Press: Boca Raton, FL, USA, 2017. [Google Scholar]
  90. MathWorks. MATLAB: The Language of Technical Computing: Computation, Visualization, Programming: Installation Guide for UNIX Version 5; MathWorks: Natwick, MA, USA, 2022. [Google Scholar]
  91. DeSalvo, G.J.; Swanson, J.A. ANSYS Engineering Analysis System: User’s Manual; Swanson Analysis Systems: Houston, TX, USA, 2022. [Google Scholar]
  92. Brancheriau, L.; Baillères, H. Natural vibration analysis of clear wooden beams: A theoretical review. Wood Sci. Technol. 2002, 36, 347–365. [Google Scholar] [CrossRef]
  93. Faircloth, A.; Brancheriau, L.; Karampour, H.; So, S.; Bailleres, H.; Kumar, C. Experimental modal analysis of appropriate boundary conditions for the evaluation of cross-laminated timber panels for an in-line approach. For. Prod. J. 2021, 71, 161–170. [Google Scholar] [CrossRef]
  94. Nemli, G.; Aydın, A. Evaluation of the physical and mechanical properties of particleboard made from the needle litter of Pinus pinaster Ait. Ind. Crops Prod. 2007, 26, 252–258. [Google Scholar] [CrossRef]
  95. AS 1720.1; Timber Structures—Part 1: Design Methods. Australian Standard: Sydney, Australia, 2010.
  96. Ross, R. Wood Handbook: Wood as an Engineering Material; Forest Products Laboratory: Madison, WI, USA, 1987. Available online: https://www.fpl.fs.usda.gov/documnts/fplgtr/fplgtr282/fpl_gtr282.pdf (accessed on 25 January 2023).
  97. AS 4100; Steel Structures. Australian Standard: Sydney, Australia, 2020.
  98. Dallard, P.; Fitzpatrick, A.; Flint, A.; Le Bourva, S.; Low, A.; Ridsdill Smith, R.; Willford, M. The London millennium footbridge. Struct. Eng. 2001, 79, 17–21. [Google Scholar]
Figure 1. Examples of long-span timber floors (LSTFs): (a) lightweight LSTFs with and without Strongbacks; (b) mass timber LSTFs with (left) ribbed-deck CLT floor, and the (right) CLT band-beam system concept; and (c) hybrid floors: (left) delta beam–CLT–concrete, and (right) CLT floor on steel frame; courtesy: David Barber.
Buildings 13 01756 g001
Figure 11. Case study I: EMA and NMA of a CLT slab showing (a) support points, impact location, and accelerometer positions; (b) signal processing and FFT from the time domain signal; and (c) mode shapes and the modal assurance criteria (MAC) results.
Buildings 13 01756 g011
Figure 12. Case study II: the lightweight 6 m × 6 m floor system; plan layout; walking path (in green) showing dot points of step footprints; accelerometers A, B, and C locations (circled in red); and the FEA geometry and mesh.
Buildings 13 01756 g012
Figure 13. Case study II showing (a) time history and frequency domain responses of a digital hammer excitation measured at accelerometer C in Figure 12, and (b) mode shapes and frequencies from the FEA.
Buildings 13 01756 g013aBuildings 13 01756 g013b
Figure 14. Case study II showing the raw and weighted acceleration time histories and frequency contents in walking configurations T1–T6 (refer to Table 4) measured at accelerometer A (see Figure 2).
Buildings 13 01756 g014aBuildings 13 01756 g014b
Disclaimer/Publisher’s Note: The statements, opinions and data contained in all publications are solely those of the individual author(s) and contributor(s) and not of MDPI and/or the editor(s). MDPI and/or the editor(s) disclaim responsibility for any injury to people or property resulting from any ideas, methods, instructions or products referred to in the content.

