
Integrating Urban Heat Island Impact into Building Energy Assessment in a Hot-Arid City


Abstract
:1. Introduction
- To provide insights into the significance of ambient temperature in BES compared to other building passive design parameters by global sensitivity analysis.
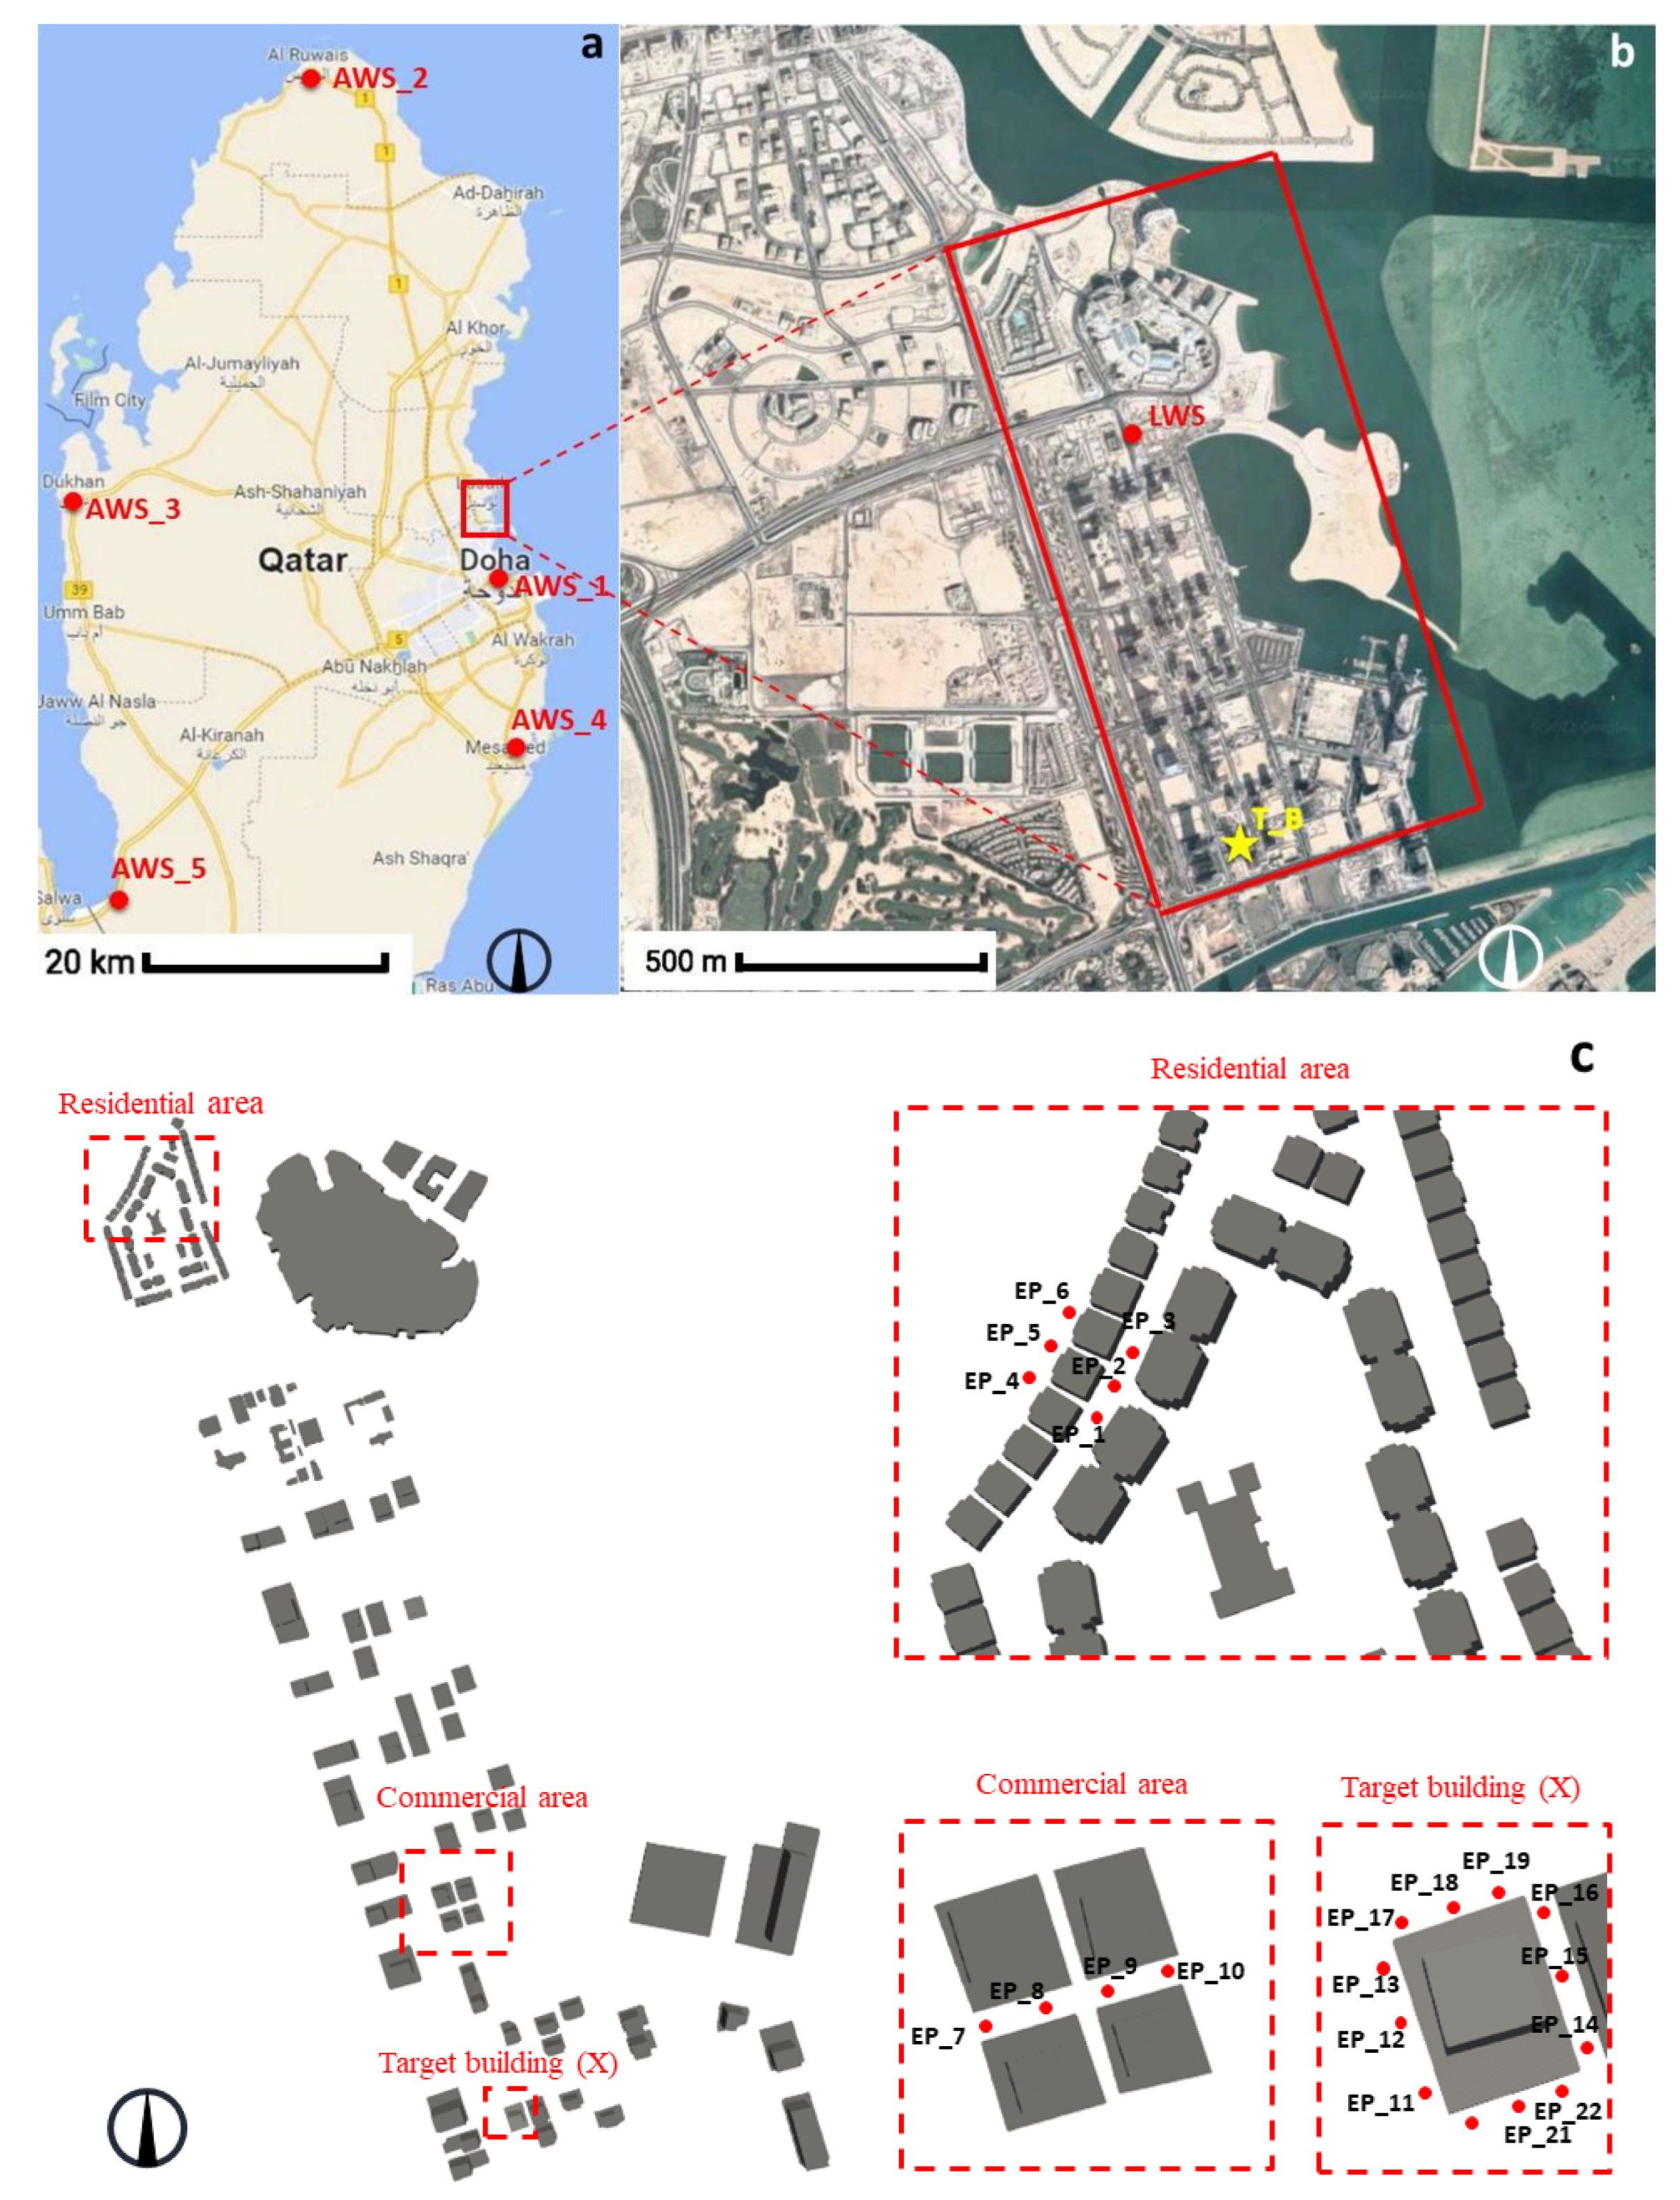
- To assess the tempo-spatial UHI effect with the help of year-round observation of six weather stations across the country in hot-arid coastal areas.
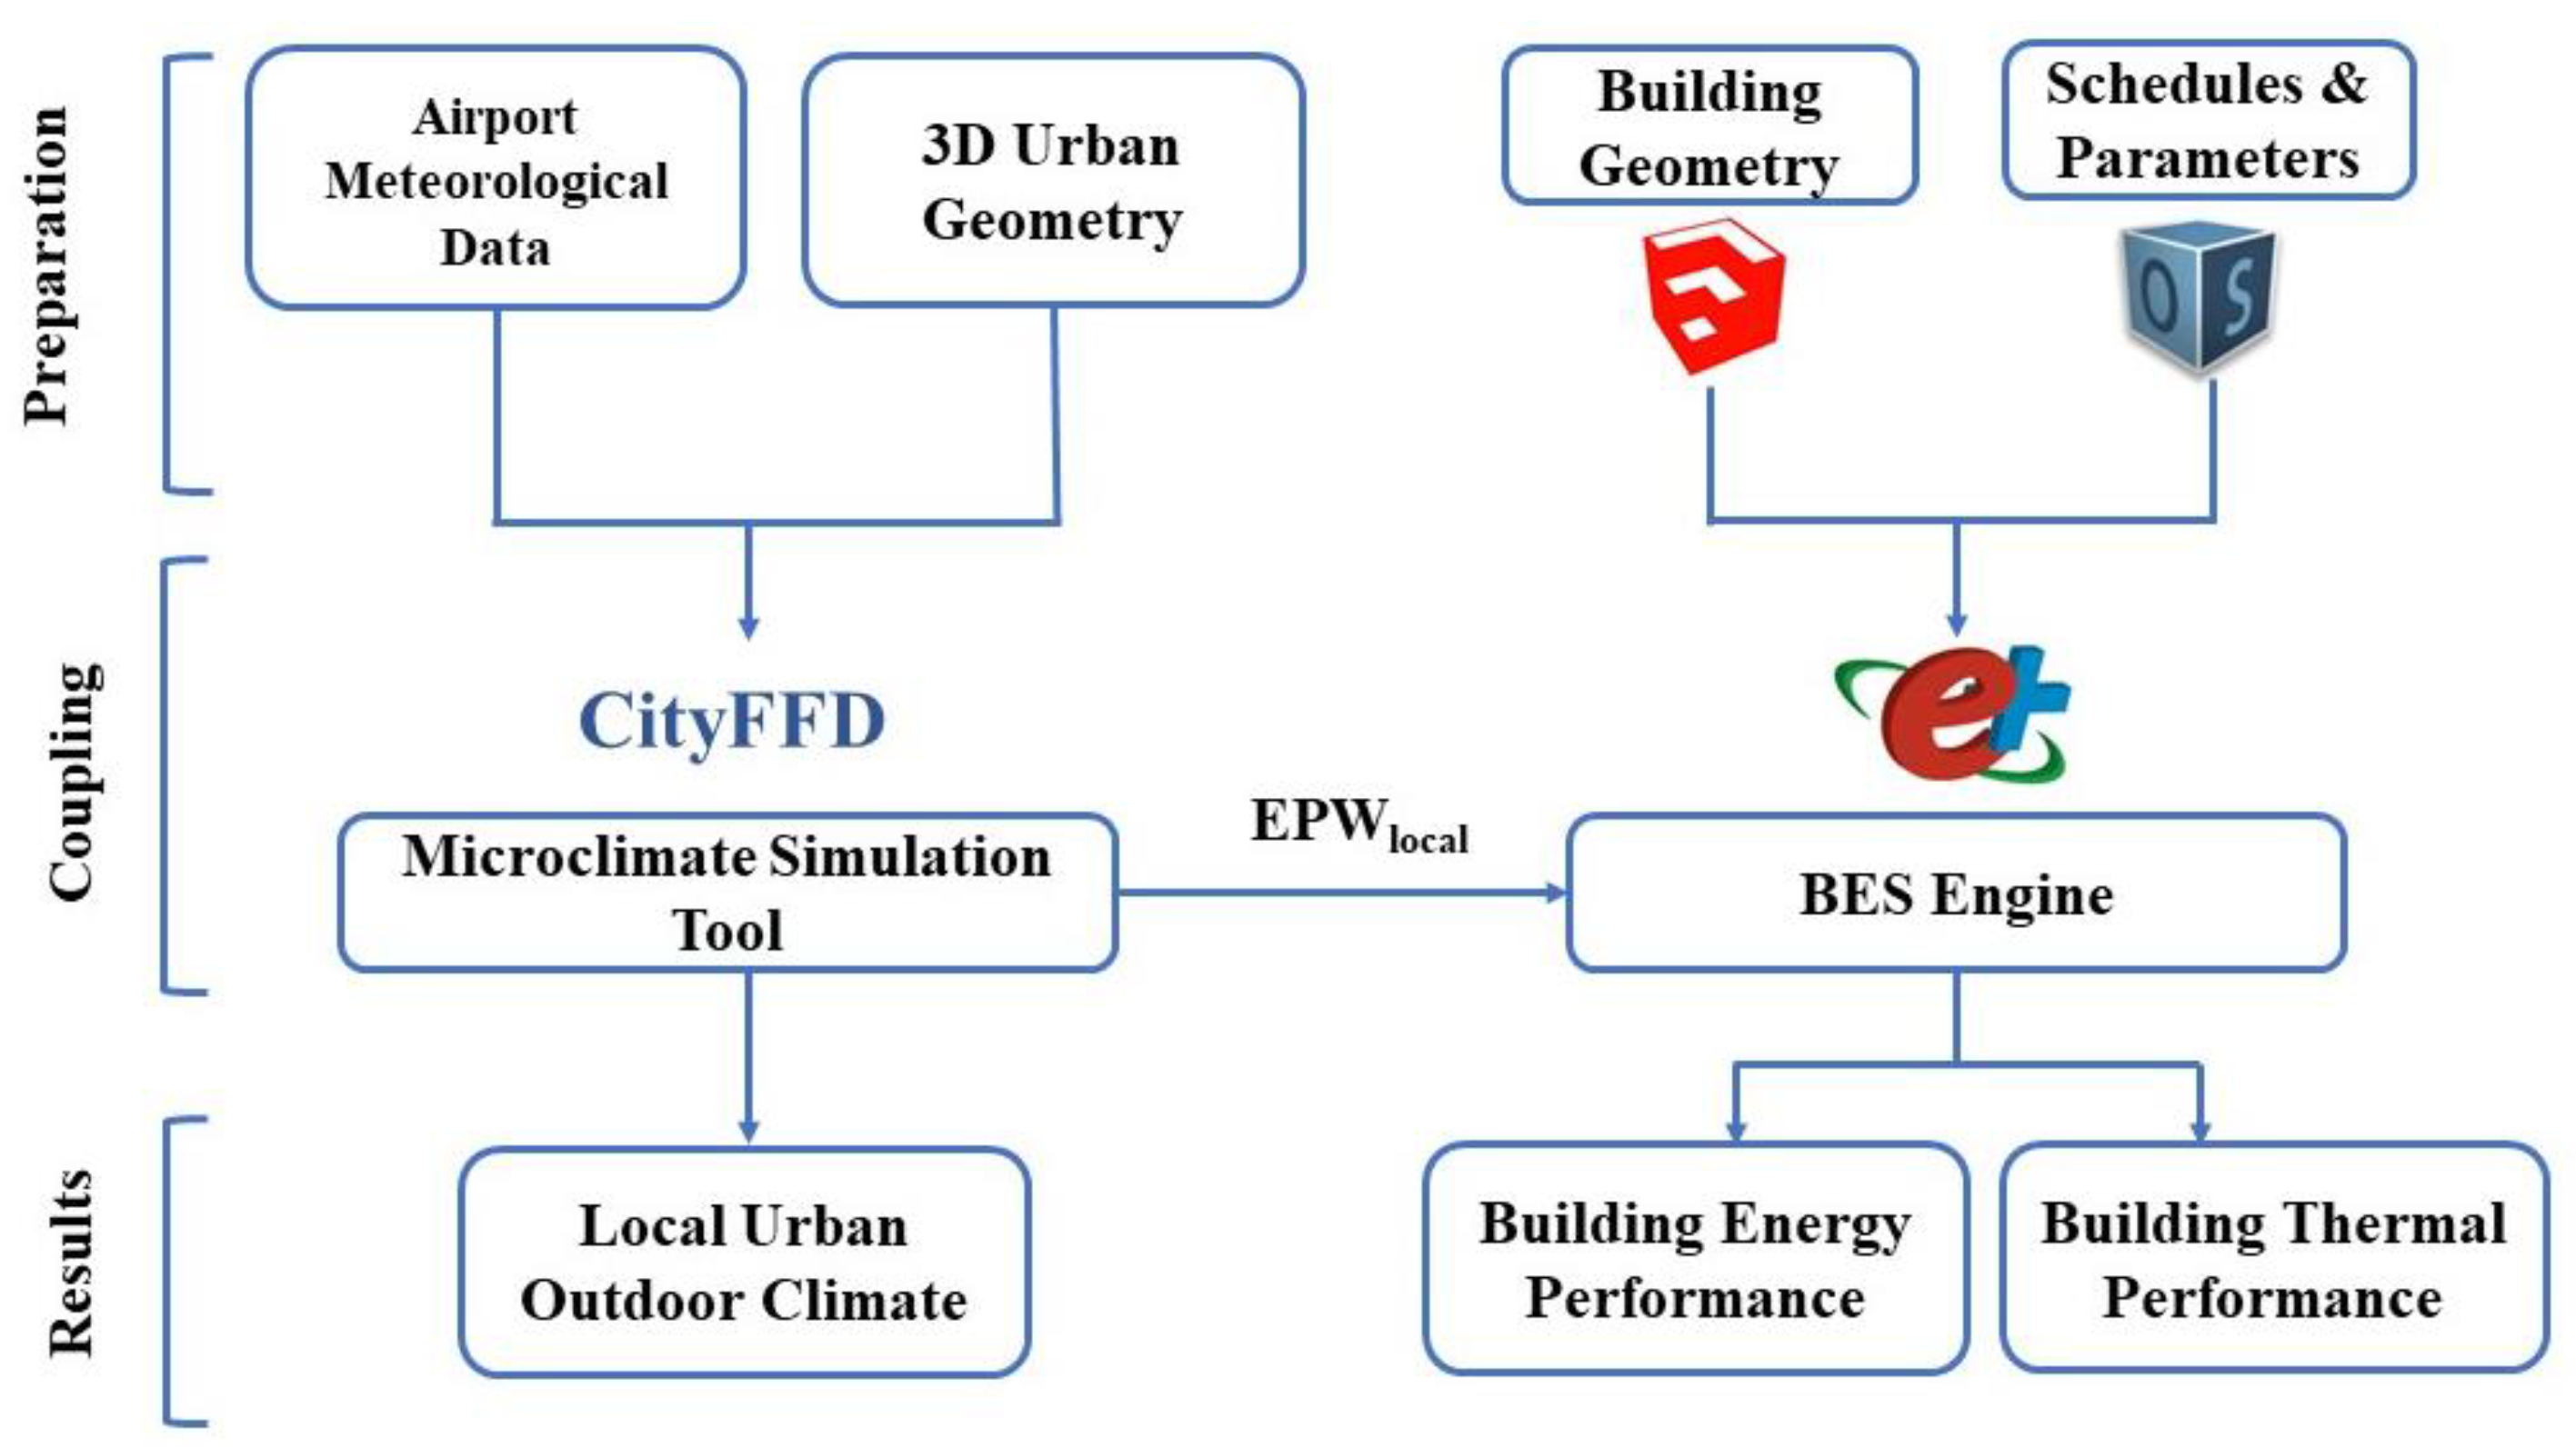
- To employ a one-way coupling strategy between urban microclimate simulation and building energy simulation using CityFFD and EnergyPlus, respectively.
- To demonstrate the impact of the UHI effect on building energy performance based on co-simulation results.
2. Literature Review
2.1. Building Energy Modeling
2.2. Urban Heat Island and Its Impact Evaluation
3. Description of Study Area
4. Methodology
4.1. Weather Data Collection
4.2. Urban Microclimate Modeling
4.3. Building Energy Modeling
4.4. Coupling Strategy
4.5. Sensitivity Analysis
5. Results and Discussion
5.1. Global Sensitivity Analysis
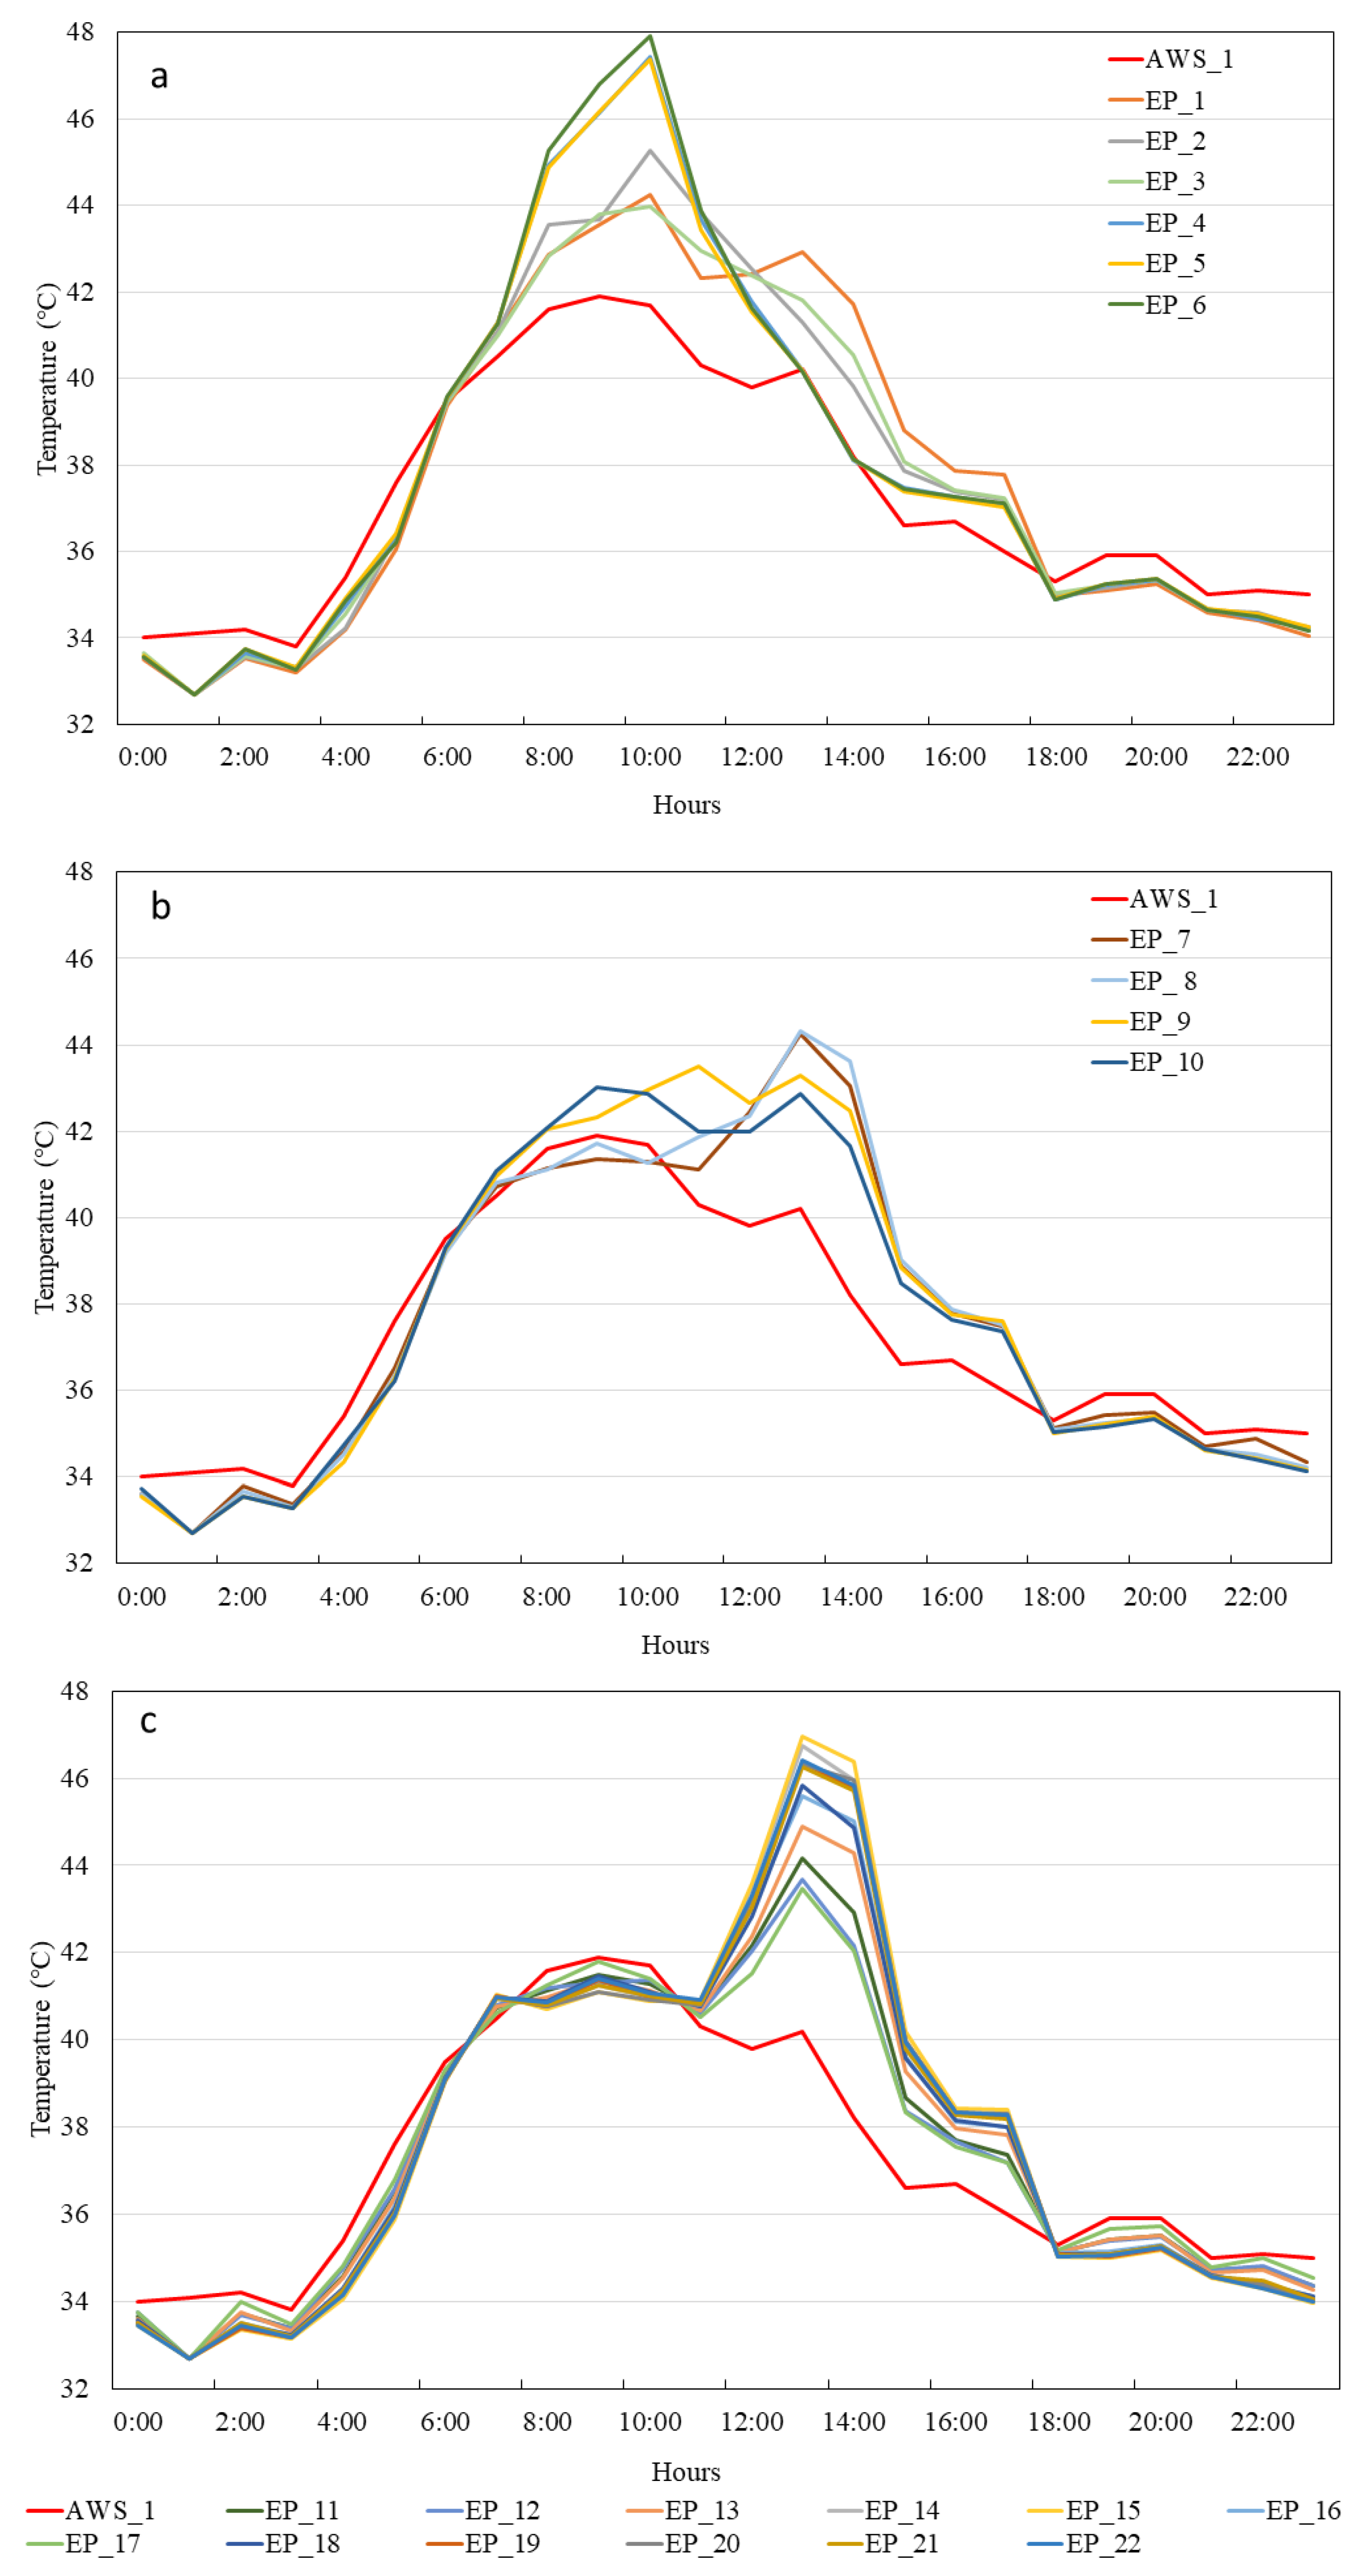
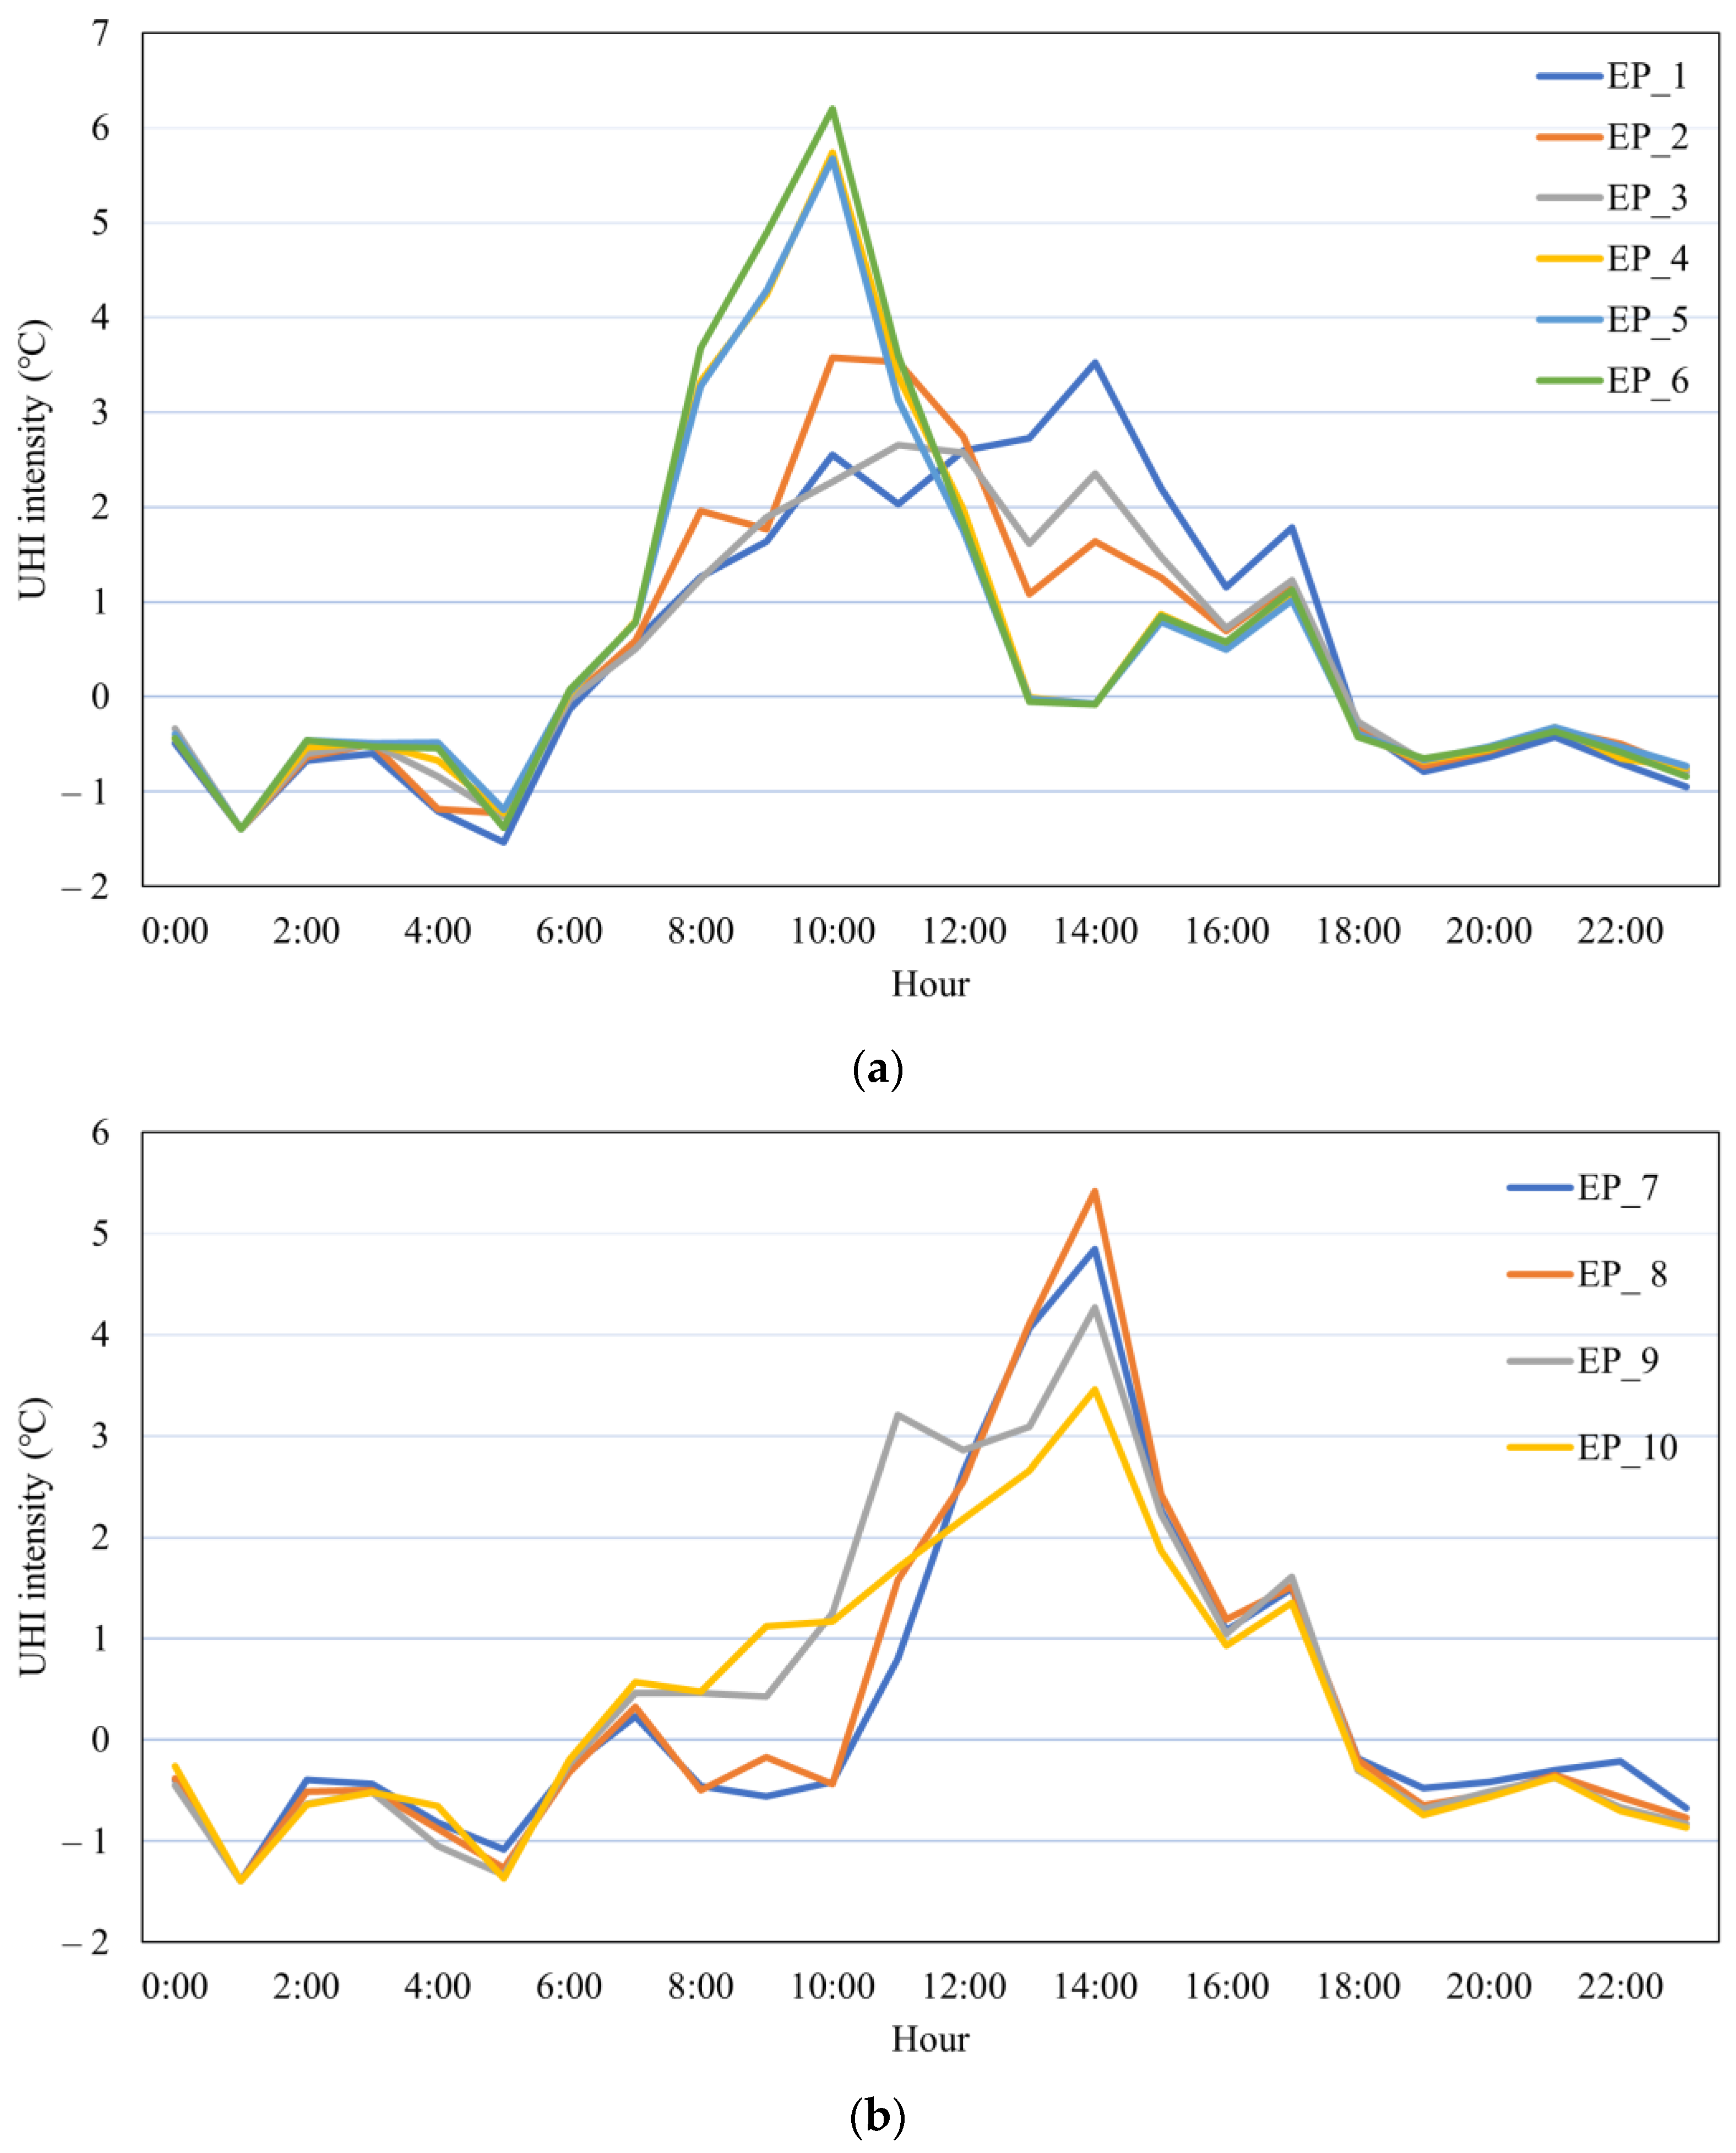
5.2. Urban Heat Island Effect
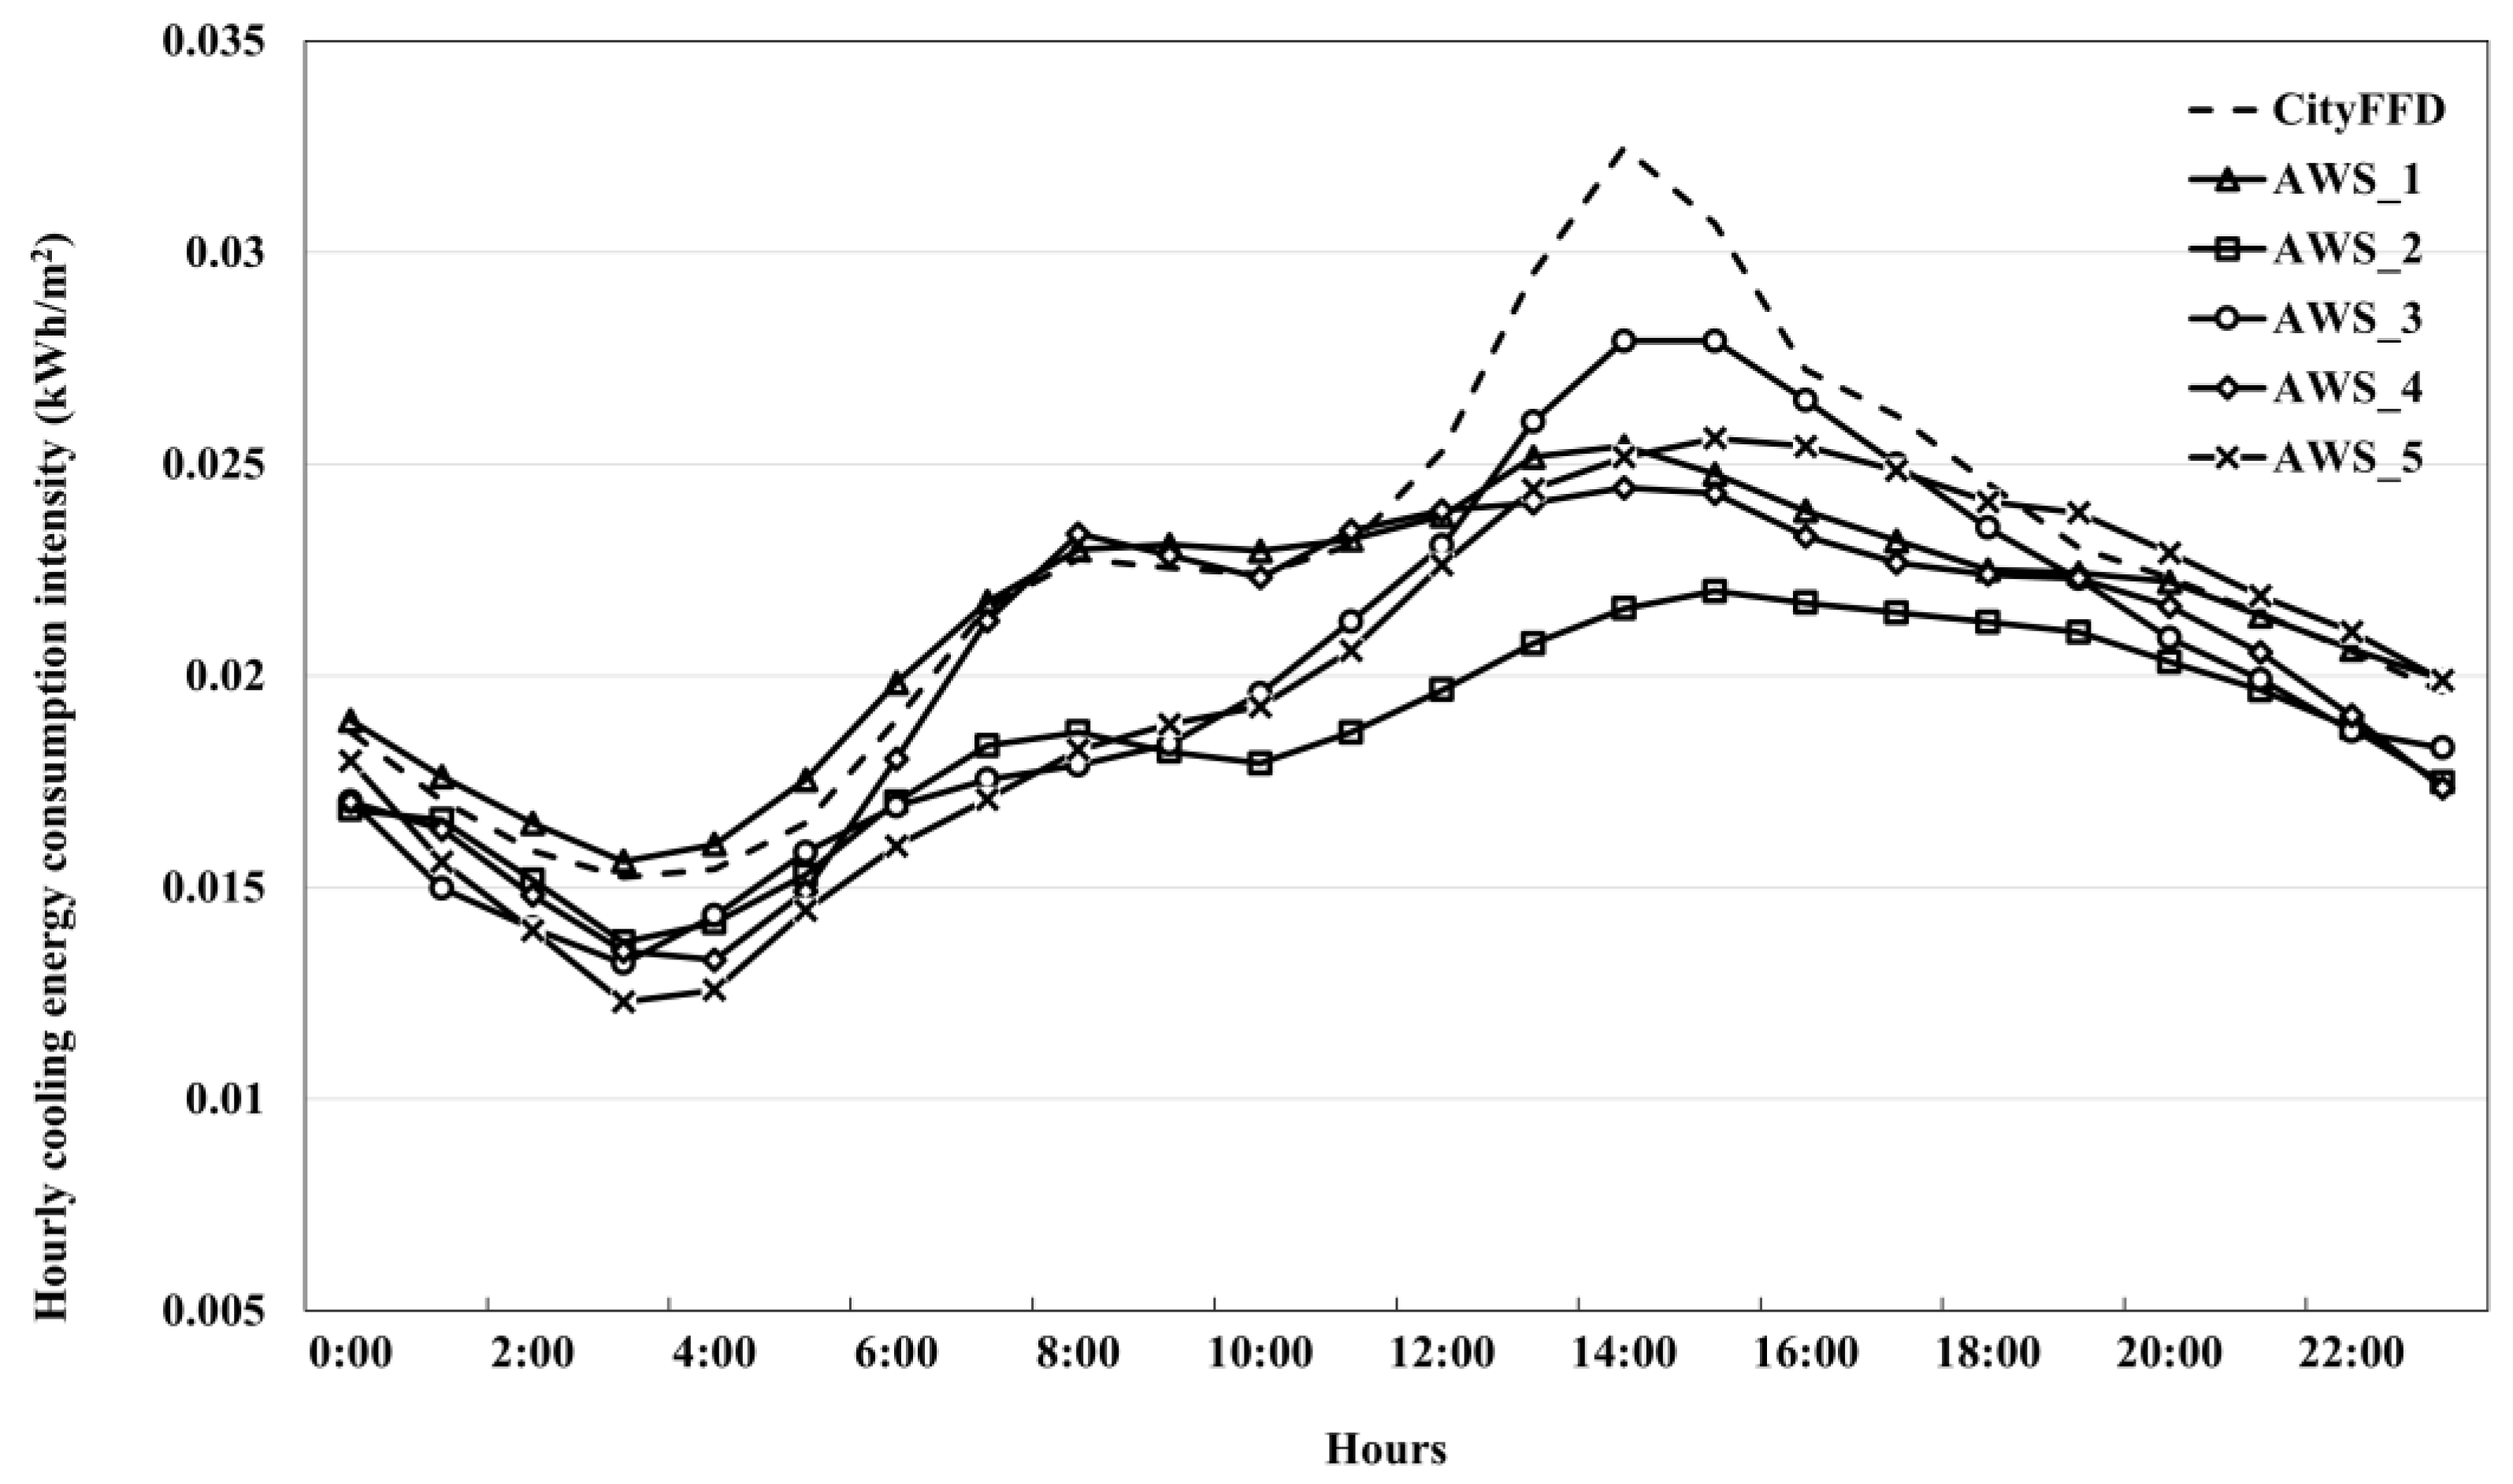
5.3. UHI Impact on Cooling Load
6. Conclusions and Outlook
- According to the impact ranking of input parameters in global sensitivity analysis, the most critical input parameter is the air temperature, followed by wind direction and wind speed.
- The air temperature difference between the local weather station data and airport weather station data indicated the UHI effect of the urban area.
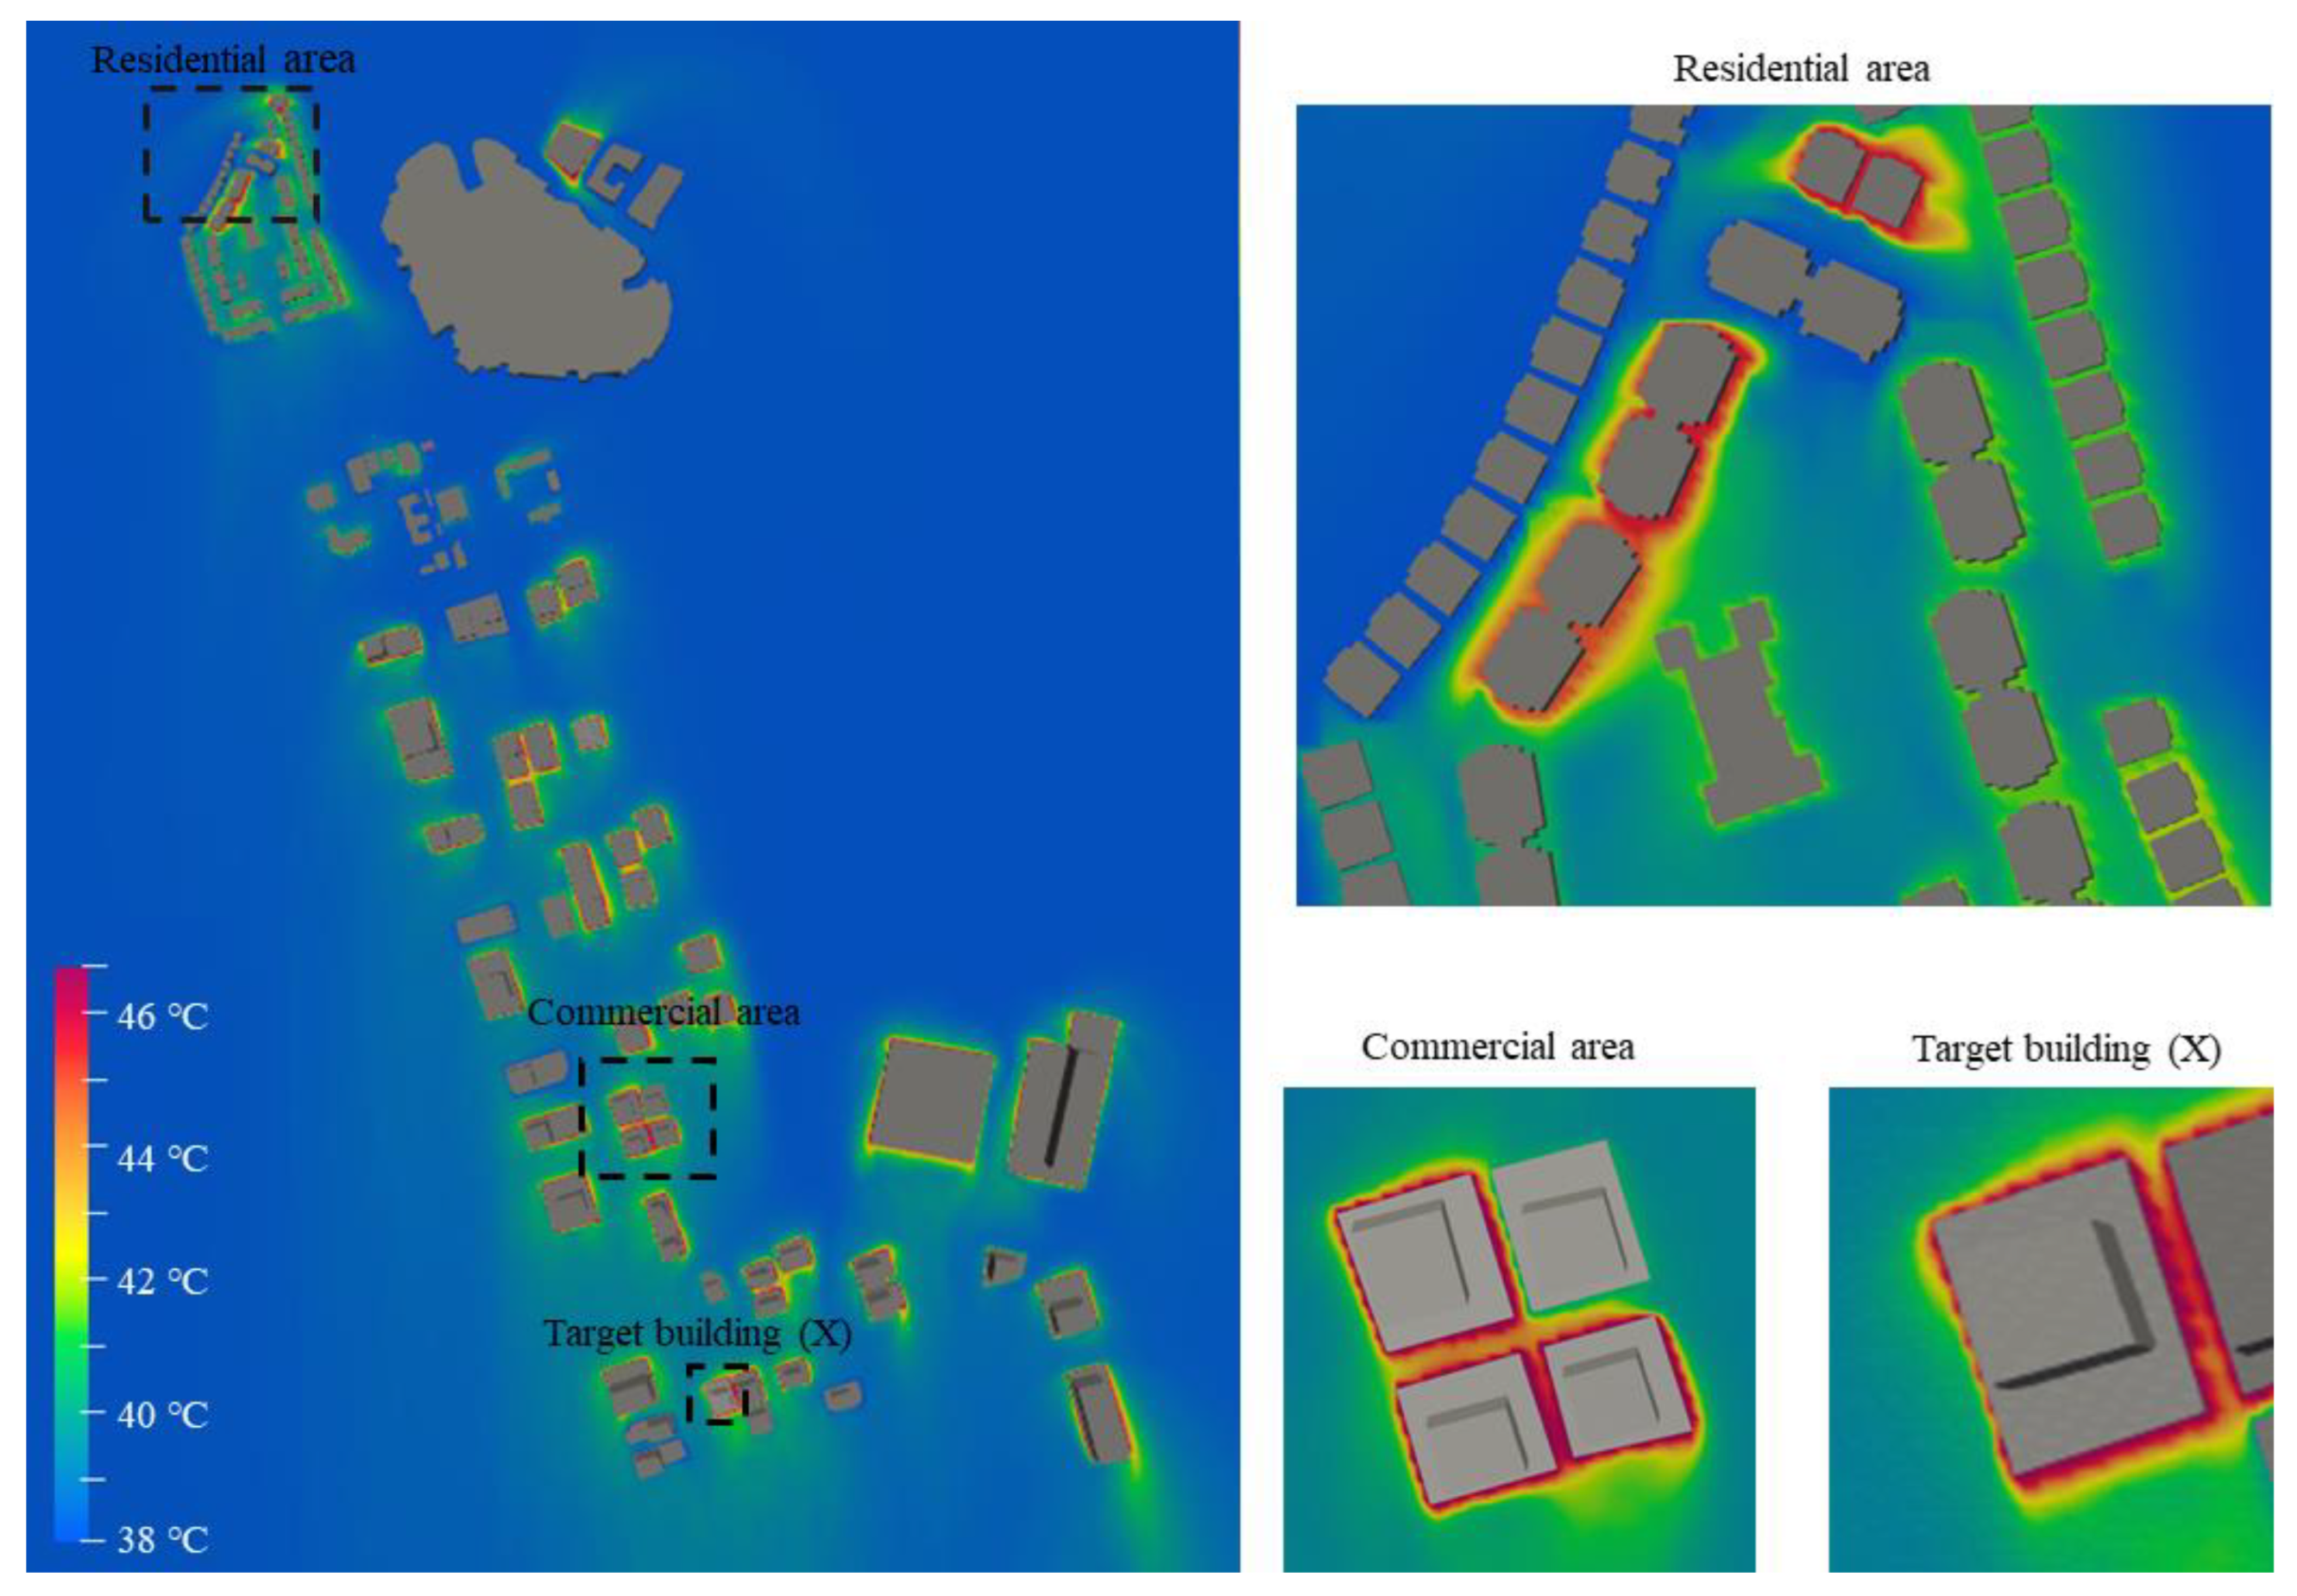
- The spatiotemporal variation of UHI intensity observed in residential and commercial areas in the Marina district stems from a number of factors, such as building density, thermal properties of building envelope material, shading equipment use, and the location of building stocks.
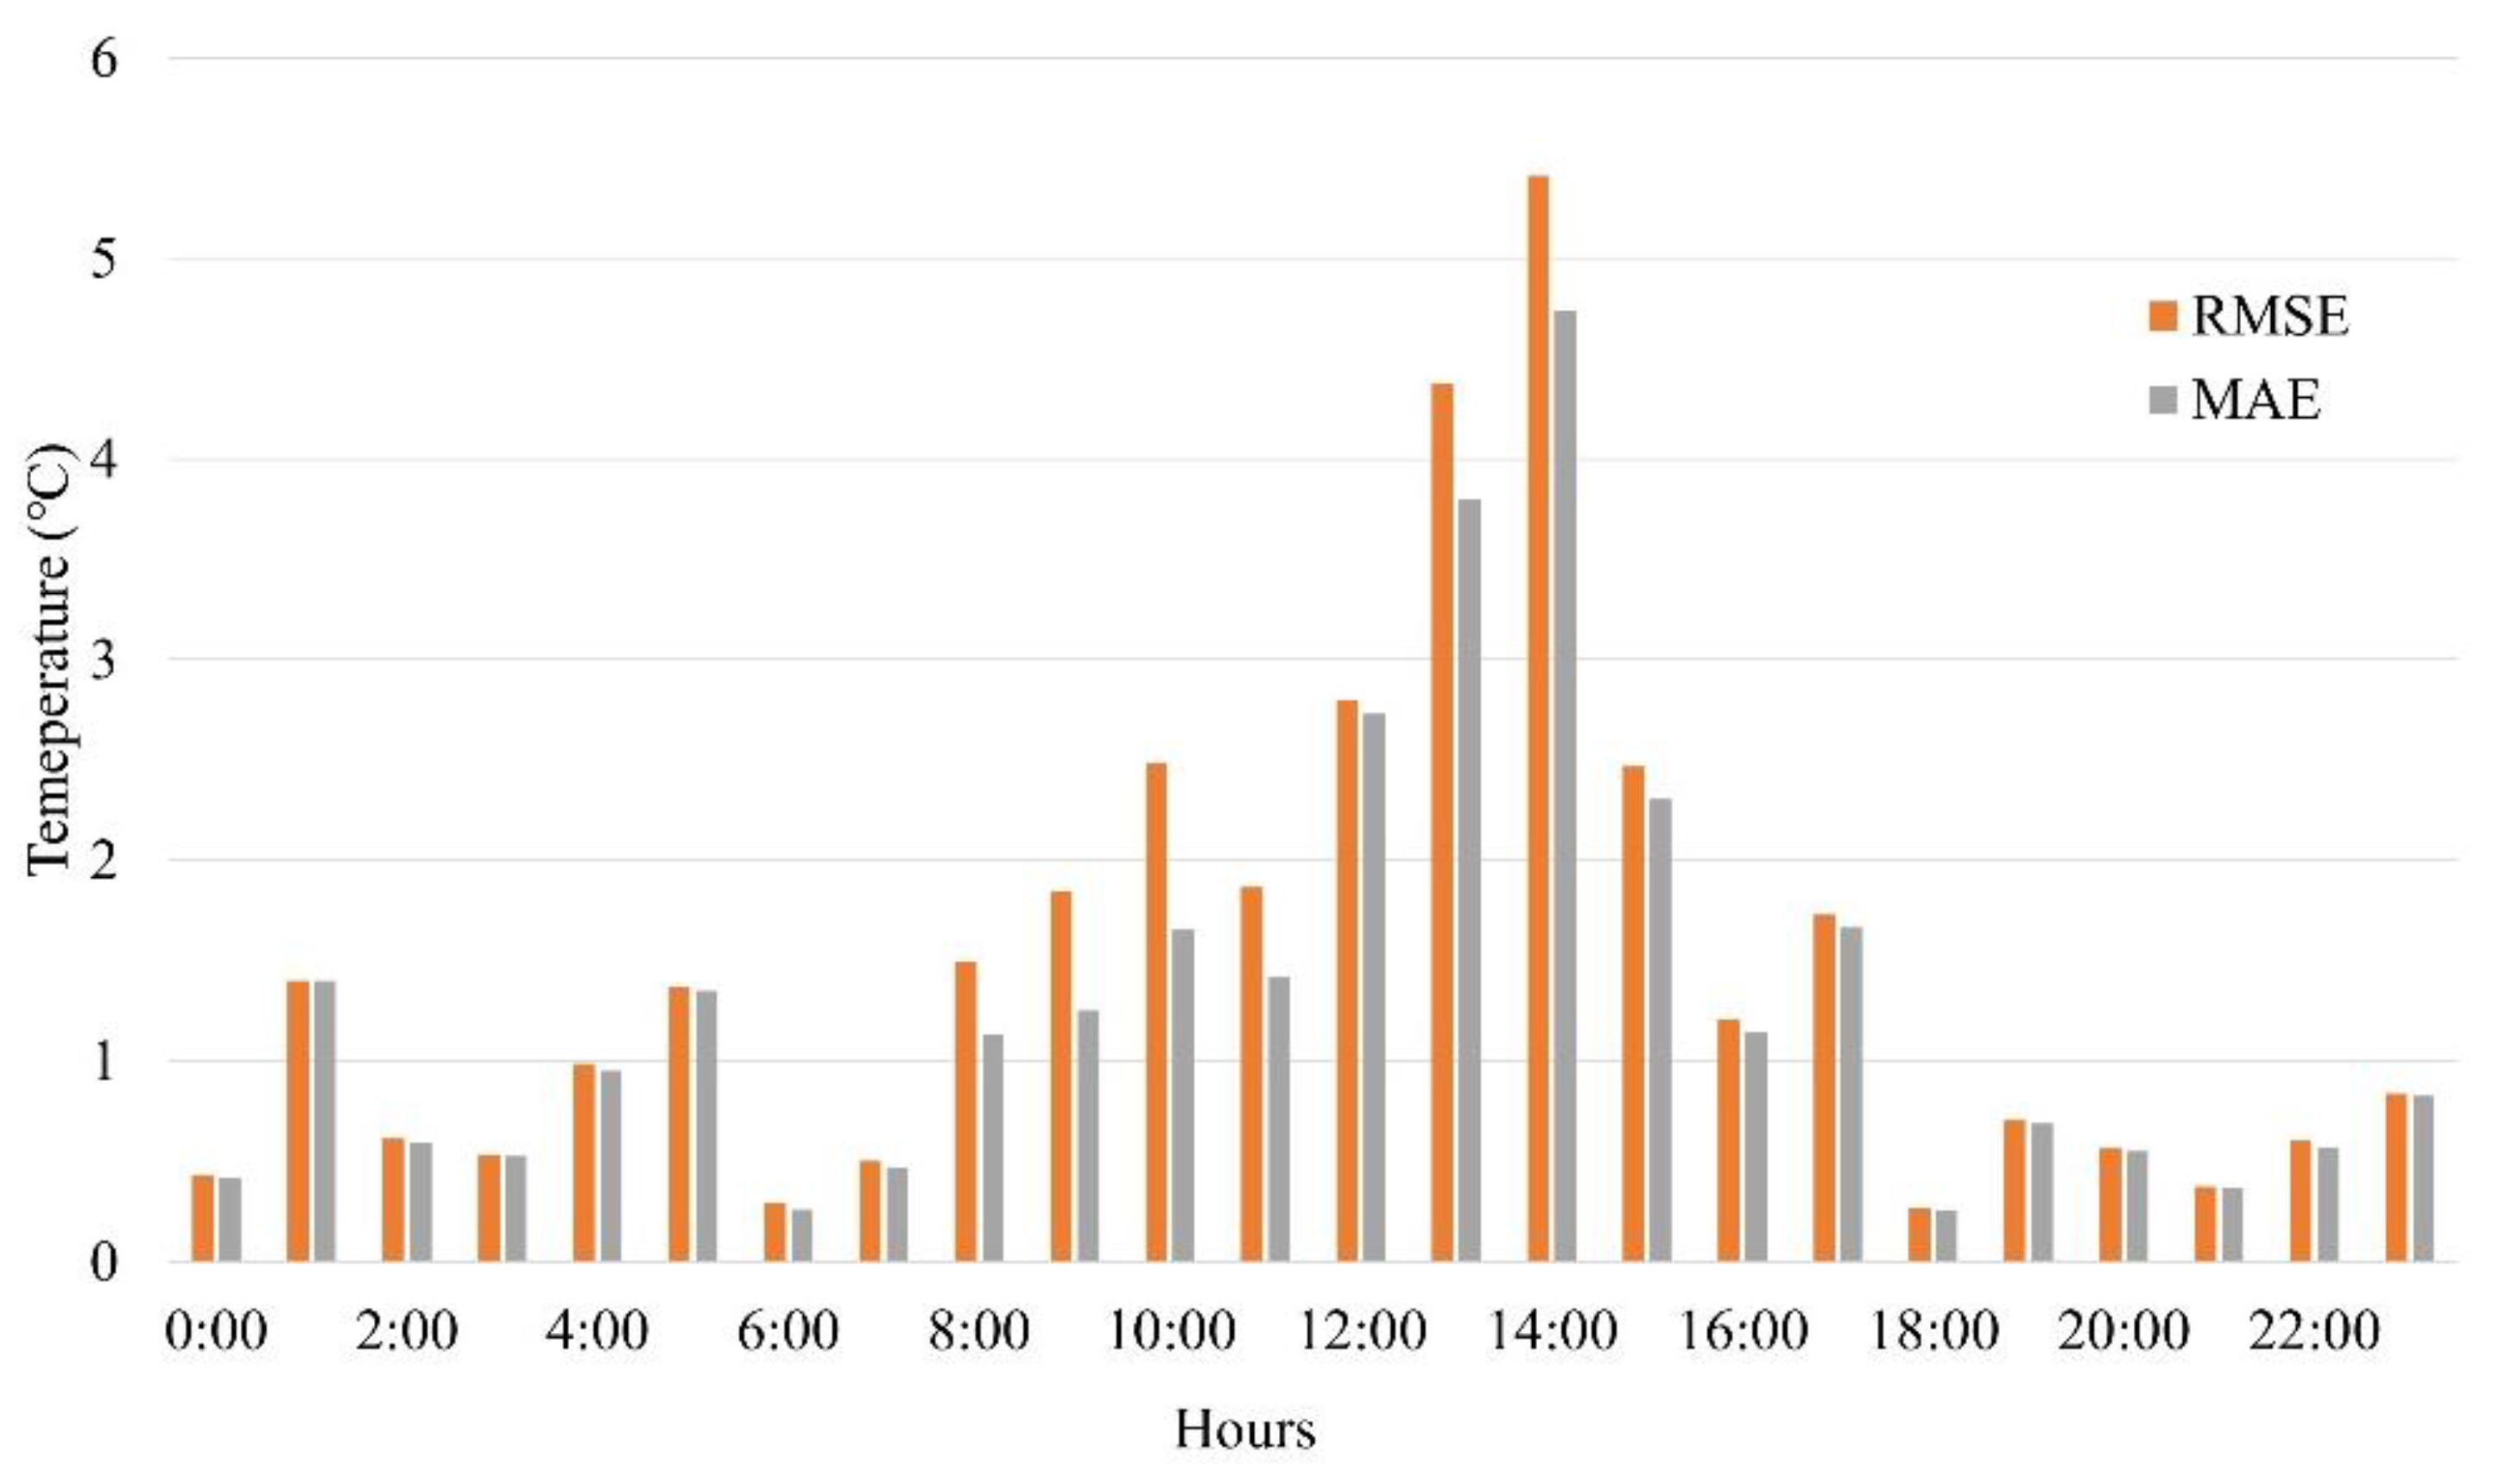
- The difference between MAE and RMSE results is minimal in the nighttime and maximum in the daytime, indicating the high UHI intensity during the daytime.
- The building cooling load obtained with the input of CityFFD results was higher than with weather station data. The difference clearly indicates the significance of considering the UHI impact in building energy simulation.
Author Contributions
Funding
Data Availability Statement
Conflicts of Interest
References
- Ranhagen, U.; Groth, K. The Symbiocity Approach: A Conceptual Framework for Sustainable Urban Development; SKL International: Pathumthani, Thailand, 2012. [Google Scholar]
- Ben Hassen, T.; El Bilali, H.; Al-Maadeed, M. Agri-Food Markets in Qatar: Drivers, Trends, and Policy Responses. Sustainability 2020, 12, 3643. [Google Scholar] [CrossRef]
- Zavrl, E.; Mankibi, M.E.; Dovjak, M.; Stritih, U. Experimental Investigation of Air-Based Active-Passive System for Cooling Application in Buildings. Sustain. Cities Soc. 2022, 104031. [Google Scholar] [CrossRef]
- Rathnam, P.M.; Ram, S. Imbibing Energy Efficiency in Buildings through Sustainable Materials—A Review. In Advances in Sustainable Materials and Resilient Infrastructure; Reddy, K.R., Pancharathi, R.K., Reddy, N.G., Arukala, S.R., Eds.; Springer Transactions in Civil and Environmental Engineering; Springer: Singapore, 2022; pp. 399–414. ISBN 9789811697449. [Google Scholar]
- Indraganti, M.; Boussaa, D.; Assadi, S.; Mostavi, E. User Satisfaction and Energy Use Behavior in Offices in Qatar. Build. Serv. Eng. Res. Technol. 2018, 39, 391–405. [Google Scholar] [CrossRef]
- Kim, S.W.; Brown, R.D. Urban Heat Island (UHI) Intensity and Magnitude Estimations: A Systematic Literature Review. Sci. Total Environ. 2021, 779, 146389. [Google Scholar] [CrossRef]
- Rotach, M.W.; Vogt, R.; Bernhofer, C.; Batchvarova, E.; Christen, A.; Clappier, A.; Feddersen, B.; Gryning, S.-E.; Martucci, G.; Mayer, H.; et al. BUBBLE—An Urban Boundary Layer Meteorology Project. Theor. Appl. Climatol. 2005, 81, 231–261. [Google Scholar] [CrossRef] [Green Version]
- Al-Marzooqi, M.I.A.S. The Impact of Urban Heat Island (UHI) Phenomenon on the Climate of Qatar. Master’s Thesis, Hamad Bin Khalifa University (Qatar), Doha, Qatar, 2019. [Google Scholar]
- Shi, L.; Luo, Z.; Matthews, W.; Wang, Z.; Li, Y.; Liu, J. Impacts of Urban Microclimate on Summertime Sensible and Latent Energy Demand for Cooling in Residential Buildings of Hong Kong. Energy 2019, 189, 116208. [Google Scholar] [CrossRef]
- Santamouris, M.; Kolokotsa, D. Urban Climate Mitigation Techniques; Routledge: Oxfordshire, UK, 2016; ISBN 978-1-317-65863-4. [Google Scholar]
- He, B.-J.; Wang, W.; Sharifi, A.; Liu, X. Progress, Knowledge Gap and Future Directions of Urban Heat Mitigation and Adaptation Research through a Bibliometric Review of History and Evolution. Energy Build. 2023, 287, 112976. [Google Scholar] [CrossRef]
- Yang, X.S.; Zhao, L.H.; Bruse, M.; Meng, Q.L. Assessing the Effect of Microclimate on Building Energy Performance by Co-Simulation. Appl. Mech. Mater. 2011, 121–126, 2860–2867. [Google Scholar] [CrossRef]
- Chan, A.L.S.; Chow, T.T.; Fong, S.K.F.; Lin, J.Z. Generation of a Typical Meteorological Year for Hong Kong. Energy Convers. Manag. 2006, 47, 87–96. [Google Scholar] [CrossRef]
- Yang, X.; Peng, L.L.H.; Jiang, Z.; Chen, Y.; Yao, L.; He, Y.; Xu, T. Impact of Urban Heat Island on Energy Demand in Buildings: Local Climate Zones in Nanjing. Appl. Energy 2020, 260, 114279. [Google Scholar] [CrossRef]
- Zhang, M.; Zhang, X.; Guo, S.; Xu, X.; Chen, J.; Wang, W. Urban Micro-Climate Prediction through Long Short-Term Memory Network with Long-Term Monitoring for on-Site Building Energy Estimation. Sustain. Cities Soc. 2021, 74, 103227. [Google Scholar] [CrossRef]
- Ma, Y.X.; Yu, C. Impact of Meteorological Factors on High-Rise Office Building Energy Consumption in Hong Kong: From a Spatiotemporal Perspective. Energy Build. 2020, 228, 110468. [Google Scholar] [CrossRef]
- Xu, L.; Tong, S.; He, W.; Zhu, W.; Mei, S.; Cao, K.; Yuan, C. Better Understanding on Impact of Microclimate Information on Building Energy Modelling Performance for Urban Resilience. Sustain. Cities Soc. 2022, 80, 103775. [Google Scholar] [CrossRef]
- Winkelmann, F.C.; Birdsall, B.E.; Buhl, W.F.; Ellington, K.L.; Erdem, A.E.; Hirsch, J.J.; Gates, S. DOE-2 Supplement: Version 2.1E; Lawrence Berkeley National Lab.: Berkeley, CA, USA, 1993. [Google Scholar]
- Crawley, D.B.; Hand, J.W.; Kummert, M.; Griffith, B.T. Contrasting the Capabilities of Building Energy Performance Simulation Programs. Build. Environ. 2008, 43, 661–673. [Google Scholar] [CrossRef] [Green Version]
- Allegrini, J.; Dorer, V.; Carmeliet, J. Influence of the Urban Microclimate in Street Canyons on the Energy Demand for Space Cooling and Heating of Buildings. Energy Build. 2012, 55, 823–832. [Google Scholar] [CrossRef]
- James, J.H. Associates Qequest Introductory Tutorial V3.63 and Beyond; 2009. Available online: https://doe2.com/Download/equest/eQ-v3-63_Introductory-Tutorial.pdf (accessed on 11 July 2023).
- Crawley, D.B.; Lawrie, L.K.; Winkelmann, F.C.; Buhl, W.F.; Huang, Y.J.; Pedersen, C.O.; Strand, R.K.; Liesen, R.J.; Fisher, D.E.; Witte, M.J.; et al. EnergyPlus: Creating a New-Generation Building Energy Simulation Program. Energy Build. 2001, 33, 319–331. [Google Scholar] [CrossRef]
- Alghamdi, S.; Tang, W.; Kanjanabootra, S.; Alterman, D. Effect of Architectural Building Design Parameters on Thermal Comfort and Energy Consumption in Higher Education Buildings. Buildings 2022, 12, 329. [Google Scholar] [CrossRef]
- Pandey, B.; Banerjee, R.; Sharma, A. Coupled EnergyPlus and CFD Analysis of PCM for Thermal Management of Buildings. Energy Build. 2021, 231, 110598. [Google Scholar] [CrossRef]
- Zhang, R.; Mirzaei, P.A. Fast and Dynamic Urban Neighbourhood Energy Simulation Using CFDf-CFDc-BES Coupling Method. Sustain. Cities Soc. 2021, 66, 102545. [Google Scholar] [CrossRef]
- Sabunas, A.; Kanapickas, A. Estimation of Climate Change Impact on Energy Consumption in a Residential Building in Kaunas, Lithuania, Using HEED Software. Energy Procedia 2017, 128, 92–99. [Google Scholar] [CrossRef]
- Tian, W. A Review of Sensitivity Analysis Methods in Building Energy Analysis. Renew. Sustain. Energy Rev. 2013, 20, 411–419. [Google Scholar] [CrossRef]
- Mao, J.; Yang, J.H.; Afshari, A.; Norford, L.K. Global Sensitivity Analysis of an Urban Microclimate System under Uncertainty: Design and Case Study. Build. Environ. 2017, 124, 153–170. [Google Scholar] [CrossRef]
- Manache, G.; Melching, C.S. Sensitivity Analysis of a Water-Quality Model Using Latin Hypercube Sampling. J. Water Resour. Plann. Manag. 2004, 130, 232–242. [Google Scholar] [CrossRef] [Green Version]
- Hou, D.; Hassan, I.G.; Wang, L. Review on Building Energy Model Calibration by Bayesian Inference. Renew. Sustain. Energy Rev. 2021, 143, 110930. [Google Scholar] [CrossRef]
- Jia, B.; Hou, D.; Kamal, A.; Hassan, I.G.; Wang, L. Developing Machine-Learning Meta-Models for High-Rise Residential District Cooling in Hot and Humid Climate. J. Build. Perform. Simul. 2022, 15, 553–573. [Google Scholar] [CrossRef]
- Rasouli, M.; Ge, G.; Simonson, C.J.; Besant, R.W. Uncertainties in Energy and Economic Performance of HVAC Systems and Energy Recovery Ventilators Due to Uncertainties in Building and HVAC Parameters. Appl. Therm. Eng. 2013, 50, 732–742. [Google Scholar] [CrossRef]
- Sun, Y. Sensitivity Analysis of Macro-Parameters in the System Design of Net Zero Energy Building. Energy Build. 2015, 86, 464–477. [Google Scholar] [CrossRef]
- Palme, M.; Salvati, A. UWG-TRNSYS Simulation Coupling for Urban Building Energy Modeling. In Proceedings of the Building Simulation and Optimization 2018—BSO18, Cambridge, UK, 11–12 September 2018. [Google Scholar]
- Perini, K.; Chokhachian, A.; Dong, S.; Auer, T. Modeling and Simulating Urban Outdoor Comfort: Coupling ENVI-Met and TRNSYS by Grasshopper. Energy Build. 2017, 152, 373–384. [Google Scholar] [CrossRef]
- Katal, A.; Mortezazadeh, M.; Wang, L.L. Modeling Building Resilience against Extreme Weather by Integrated CityFFD and CityBEM Simulations. Appl. Energy 2019, 250, 1402–1417. [Google Scholar] [CrossRef]
- Katal, A.; Mortezazadeh, M.; Wang, L.L.; Yu, H. Urban Building Energy and Microclimate Modeling—From 3D City Generation to Dynamic Simulations. Energy 2022, 251, 123817. [Google Scholar] [CrossRef]
- Mortezazadeh, M.; Wang, L.L.; Albettar, M.; Yang, S. CityFFD—City Fast Fluid Dynamics for Urban Microclimate Simulations on Graphics Processing Units. Urban Clim. 2022, 41, 101063. [Google Scholar] [CrossRef]
- Mortezazadeh, M.; Jandaghian, Z.; Wang, L.L. Integrating CityFFD and WRF for Modeling Urban Microclimate under Heatwaves. Sustain. Cities Soc. 2021, 66, 102670. [Google Scholar] [CrossRef]
- Luo, N.; Luo, X.; Mortezazadeh, M.; Albettar, M.; Zhang, W.; Zhan, D.; Wang, L.; Hong, T. A Data Schema for Exchanging Information between Urban Building Energy Models and Urban Microclimate Models in Coupled Simulations. J. Build. Perform. Simul. 2022, 1–18. [Google Scholar] [CrossRef]
- Mehaoued, K.; Lartigue, B. Influence of a Reflective Glass Façade on Surrounding Microclimate and Building Cooling Load: Case of an Office Building in Algiers. Sustain. Cities Soc. 2019, 46, 101443. [Google Scholar] [CrossRef]
- Toparlar, Y.; Blocken, B.; Maiheu, B.; van Heijst, G.J.F. Impact of Urban Microclimate on Summertime Building Cooling Demand: A Parametric Analysis for Antwerp, Belgium. Appl. Energy 2018, 228, 852–872. [Google Scholar] [CrossRef]
- Hong, T.; Xu, Y.; Sun, K.; Zhang, W.; Luo, X.; Hooper, B. Urban Microclimate and Its Impact on Building Performance: A Case Study of San Francisco. Urban Clim. 2021, 38, 100871. [Google Scholar] [CrossRef]
- Brozovsky, J.; Radivojevic, J.; Simonsen, A. Assessing the Impact of Urban Microclimate on Building Energy Demand by Coupling CFD and Building Performance Simulation. J. Build. Eng. 2022, 55, 104681. [Google Scholar] [CrossRef]
- Liu, J.; Heidarinejad, M.; Nikkho, S.K.; Mattise, N.W.; Srebric, J. Quantifying Impacts of Urban Microclimate on a Building Energy Consumption—A Case Study. Sustainability 2019, 11, 4921. [Google Scholar] [CrossRef] [Green Version]
- Vallati, A.; Vollaro, A.D.L.; Golasi, I.; Barchiesi, E.; Caranese, C. On the Impact of Urban Micro Climate on the Energy Consumption of Buildings. Energy Procedia 2015, 82, 506–511. [Google Scholar] [CrossRef] [Green Version]
- Boudali Errebai, F.; Strebel, D.; Carmeliet, J.; Derome, D. Impact of Urban Heat Island on Cooling Energy Demand for Residential Building in Montreal Using Meteorological Simulations and Weather Station Observations. Energy Build. 2022, 273, 112410. [Google Scholar] [CrossRef]
- Palme, M.; Inostroza, L.; Villacreses, G.; Lobato-Cordero, A.; Carrasco, C. From Urban Climate to Energy Consumption. Enhancing Building Performance Simulation by Including the Urban Heat Island Effect. Energy Build. 2017, 145, 107–120. [Google Scholar] [CrossRef]
- Lusail City GSAS 2 Star Rating Guidelines. Available online: https://www.lusail.com/wp-content/uploads/LCAC%20Files/Section%2003%20Building%20Permit%20Application%20Procedures/GSAS%20Toolkit%20and%20Calculator%20Pack%20for%202%20Star%20Rating/Lusail%20City%20GSAS%202%20Star%20Rating%20Guidelines.pdf (accessed on 11 February 2022).
- American Society of Heating, Refrigerating and Air-Conditioning Engineers, Inc. 2005 ASHRAE Handbook: Fundamentals; ASHRAE: Atlanta, GA, USA, 2005; ISBN 978-1-931862-70-7. [Google Scholar]
- Marthya, K.; Furlan, R.; Ellath, L.; Esmat, M.; Al-Matwi, R. Place-Making of Transit Towns in Qatar: The Case of Qatar National Museum-Souq Waqif Corridor. Designs 2021, 5, 18. [Google Scholar] [CrossRef]
- Ellath, L.A. Urban Form and Mobility Analysis in Sustainable Cities: Case of Marina District, Lusail City. Master’s Thesis, Qatar University, Doha, Qatar, 2022. [Google Scholar]
- Méndez, C.; Bicer, Y. Qatar’s Wind Energy Potential with Associated Financial and Environmental Benefits for the Natural Gas Industry. Energies 2019, 12, 3329. [Google Scholar] [CrossRef] [Green Version]
- Mohamed, M.M.; Almarshadi, M.H. Simulation of District Cooling Plant and Efficient Energy Air Cooled Condensers (Part I). J. Electron. Cool. Therm. Control 2017, 7, 45. [Google Scholar] [CrossRef] [Green Version]
- Shen, P.; Dai, M.; Xu, P.; Dong, W. Building Heating and Cooling Load under Different Neighbourhood Forms: Assessing the Effect of External Convective Heat Transfer. Energy 2019, 173, 75–91. [Google Scholar] [CrossRef]
- Czernecki, B.; Głogowski, A.; Nowosad, J. Climate: An R Package to Access Free In-Situ Meteorological and Hydrological Datasets for Environmental Assessment. Sustainability 2020, 12, 394. [Google Scholar] [CrossRef] [Green Version]
- Solving City and Building Microclimates by Fast Fluid Dynamics with Large Timesteps and Coarse Meshes—ScienceDirect. Available online: https://www.sciencedirect.com/science/article/pii/S0360132320303140 (accessed on 2 March 2023).
- Mortezazadeh Dorostkar, M. CityFFD—City Fast Fluid Dynamics Model for Urban Microclimate Simulations. Ph.D. Thesis, Concordia University, Montreal, QC, Canada, 2019. [Google Scholar]
- Atmosphere, US Standard. U.S. Standard Atmosphere, 1976; National Oceanic and Atmospheric Administration: Washington, DC, USA, 1976. [Google Scholar]
- Outside Surface Heat Balance: Engineering Reference—EnergyPlus 8.7. Available online: https://bigladdersoftware.com/epx/docs/8-7/engineering-reference/outside-surface-heat-balance.html (accessed on 12 May 2022).
- Ellis, P.G.; Torcellini, P.A. Simulating Tall Buildings Using EnergyPlus: Preprint. 12; National Renewable Energy Lab.: Golden, CO, USA, 2005. [Google Scholar]
- Jia, H.; Chong, A. Eplusr: A Framework for Integrating Building Energy Simulation and Data-Driven Analytics. Energy Build. 2021, 237, 110757. [Google Scholar] [CrossRef]
- ANSI/ASHRAE/IES Standard 90.1-2019—Energy Standard for Building Except Low-Rise Residential Buildings. Available online: https://www.ashrae.org/technical-resources/bookstore/standard-90-1 (accessed on 15 September 2022).
- EN 13363-2:2005/AC:2006—Solar Protection Devices Combined with Glazing—Calculation of Total Solar Energy Transmittance and Light Transmittance—Part 2: Detailed Calculation Method. Available online: https://standards.iteh.ai/catalog/standards/cen/88ae67b1-7af0-40d7-a368-59e44bbc5194/en-13363-2-2005-ac-2006 (accessed on 2 March 2023).
- Qatar Construction Specification. Available online: http://shared4.info/architecture/qcs/index.php?option=com_content&view=category&id=22%20 (accessed on 10 December 2022).
- Lim, H.; Zhai, Z.J. Comprehensive Evaluation of the Influence of Meta-Models on Bayesian Calibration. Energy Build. 2017, 155, 66–75. [Google Scholar] [CrossRef]
- Yang, J.; Fu, H.; Qin, M. Evaluation of Different Thermal Models in EnergyPlus for Calculating Moisture Effects on Building Energy Consumption in Different Climate Conditions. Procedia Eng. 2015, 121, 1635–1641. [Google Scholar] [CrossRef] [Green Version]
- Salam, A.; Kamran, S.; Bibi, R.; Korashy, H.M.; Parray, A.; Mannai, A.A.; Ansari, A.A.; Kanikicharla, K.K.; Gashi, A.Z.; Shuaib, A. Meteorological Factors and Seasonal Stroke Rates: A Four-Year Comprehensive Study. J. Stroke Cerebrovasc. Dis. 2019, 28, 2324–2331. [Google Scholar] [CrossRef]


| Archetype/Feature | Description |
|---|---|
| Location | The Marina district of Lusail City, Qatar. |
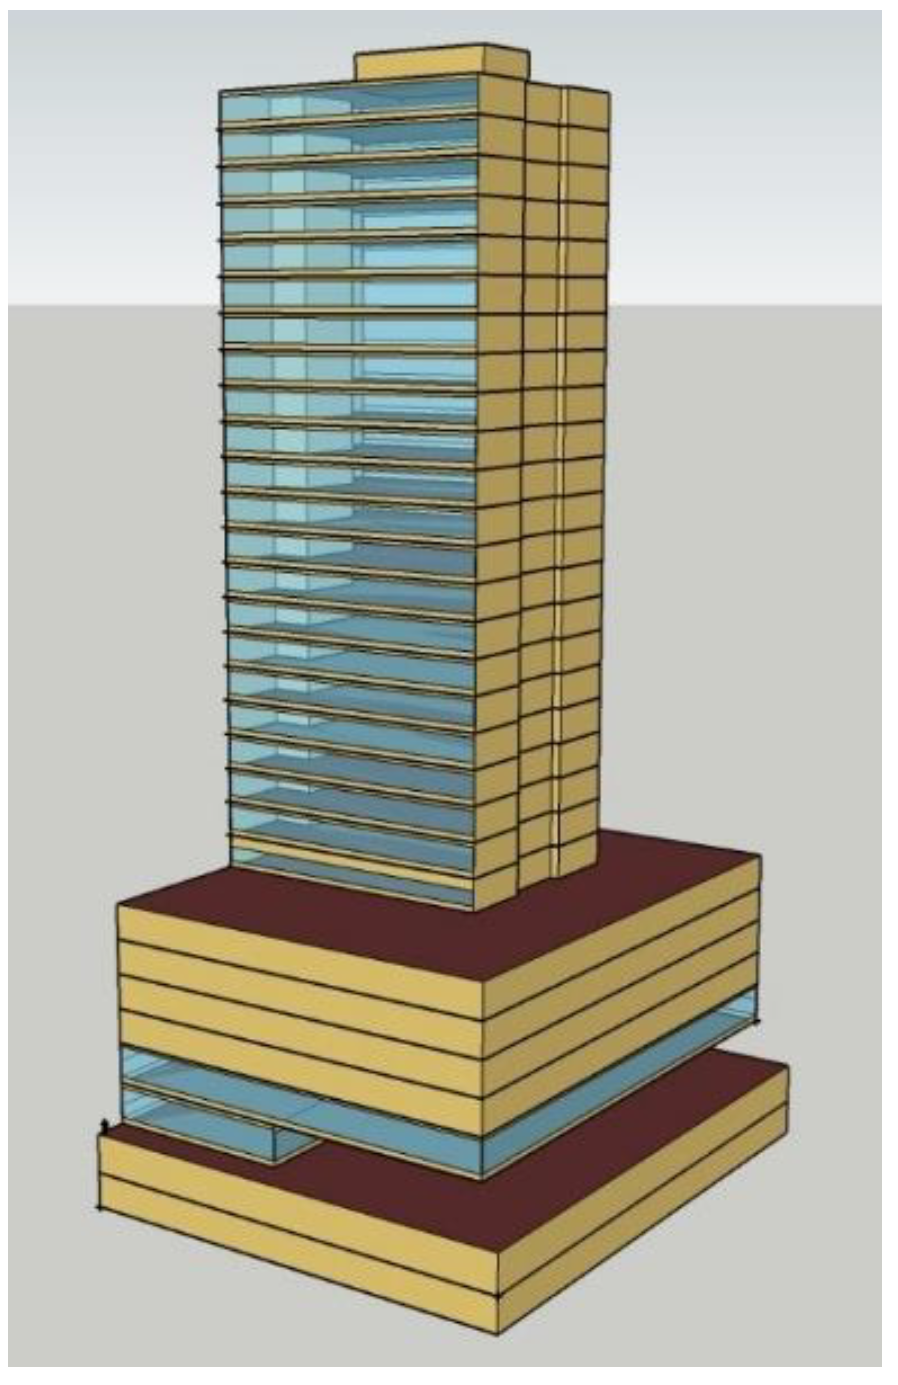
| Building type | Commercial building |
| Year of construction | 2017 |
| Number of floors | Two basements, 1 ground floor, 27 typical floors, and a penthouse. |
| Total building area | 41,619.09 m2 |
| Number of thermal zones | 31 |
| HVAC system | The four-pipe fan coil system |
| Thermostat setting | 24 from 6:00 to 22:00 and 26.7 for the rest of the day. |
| People density | 0.057 person/m2 |
| Lighting power density | 10.65 W/m2 |
| Electricity power density | 7.64 W/m2 |
| Number | Parameters | Unit | Range of Values | Source |
|---|---|---|---|---|
| 1 | Air temperature | °C | 8.9–46 | Doha TMY weather data |
| 2 | Wind direction | ° | 10–360 | Doha TMY weather data |
| 3 | Wind speed | m/s | 0–25.7 | Doha TMY weather data |
| 4 | Cooling set point | °C | 21–26 | [49] |
| 5 | Lighting power density | W/m2 | 0–9 | [49] |
| 6 | Relative humidity | % | 5–100 | Doha TMY weather data |
| 7 | Wall insulation U-value | W/(m2K) | 0–0.3 | [49,63] |
| 8 | Infiltration | ACH | 0.1–0.2 | [63] |
| 9 | Ventilation | m3/s/person | 0.00047–0.00247 | [63] |
| 10 | Occupancy density | m2/person | 19–24 | [63] |
| 11 | Solar reflectance of interior diffusing blinds roll | / | 0.4–0.8 | [64] |
| 12 | Roof insulation U-value | W/(m2K) | 0–0.25 | [65] |
| 13 | Window solar heat gain coefficient | / | 0–0.22 | [63] |
| 14 | Window U-value | W/(m2K) | 0–1.8 | [63] |
| Parameters | SRC | Random Forest | T-Value | SVI | Rank |
|---|---|---|---|---|---|
| Air temperature | 0.53 | 204.71 | 68.95 | 24.09 | 1 |
| Wind direction | 0.20 | 135.48 | 30.04 | 12.00 | 2 |
| Wind speed | 0.16 | 58.74 | 23.36 | 7.53 | 3 |
| Cooling set point | 0.13 | 60.93 | 20.97 | 6.85 | 4 |
| Lighting power density | 0.10 | 42.88 | 16.39 | 5.15 | 5 |
| Relative humidity | 0.01 | 58.41 | 0.66 | 2.56 | 6 |
| Wall insulation thickness | 0.02 | 7.08 | 3.67 | 1.05 | 7 |
| Infiltration | 0.02 | 6.50 | 3.74 | 1.04 | 8 |
| Ventilation | 0.01 | 3.97 | 1.33 | 0.44 | 9 |
| Occupant density | 0.01 | 6.06 | 0.90 | 0.43 | 10 |
| Solar reflectance of interior diffusing blinds rolls | 0.01 | 4.217 | 0.81 | 0.34 | 11 |
| Roof insulation thickness | 0.01 | 3.52 | 0.85 | 0.32 | 12 |
| Window solar heat gain coefficient | 0.003 | 2.694 | 0.52 | 0.22 | 13 |
| Window insulation | 0.0001 | 2.899 | 0.02 | 0.12 | 14 |
| AWS_1 | AWS_2 | AWS_3 | AWS_4 | AWS_5 | |
|---|---|---|---|---|---|
| Cold season | 5.67 | 7.87 | 8.17 | 7.93 | 9.65 |
| Hot season | 5.20 | 11.58 | 10.30 | 11.99 | 9.50 |
| Transition | 6.39 | 11.41 | 11.81 | 7.71 | 13.07 |
| All seasons | 6.39 | 11.58 | 11.81 | 11.99 | 13.07 |
| Temperature (°C) | UHI Intensity (°C) | |||||
|---|---|---|---|---|---|---|
| Time | max | avr max | Time | max | avr max | |
| Residential | 10:00 | 47.9 | 46.0 | 10:00 | 6.2 | 4.6 |
| Commercial | 13:00 | 44.3 | 43.8 | 14:00 | 5.4 | 4.5 |
| Target | 13:00 | 46.4 | 45.6 | 14:00 | 8.2 | 6.5 |
Disclaimer/Publisher’s Note: The statements, opinions and data contained in all publications are solely those of the individual author(s) and contributor(s) and not of MDPI and/or the editor(s). MDPI and/or the editor(s) disclaim responsibility for any injury to people or property resulting from any ideas, methods, instructions or products referred to in the content. |
© 2023 by the authors. Licensee MDPI, Basel, Switzerland. This article is an open access article distributed under the terms and conditions of the Creative Commons Attribution (CC BY) license (https://creativecommons.org/licenses/by/4.0/).
Share and Cite
Zhan, D.; Sezer, N.; Hou, D.; Wang, L.; Hassan, I.G. Integrating Urban Heat Island Impact into Building Energy Assessment in a Hot-Arid City. Buildings 2023, 13, 1818. https://doi.org/10.3390/buildings13071818
Zhan D, Sezer N, Hou D, Wang L, Hassan IG. Integrating Urban Heat Island Impact into Building Energy Assessment in a Hot-Arid City. Buildings. 2023; 13(7):1818. https://doi.org/10.3390/buildings13071818
Chicago/Turabian StyleZhan, Dongxue, Nurettin Sezer, Danlin Hou, Liangzhu Wang, and Ibrahim Galal Hassan. 2023. "Integrating Urban Heat Island Impact into Building Energy Assessment in a Hot-Arid City" Buildings 13, no. 7: 1818. https://doi.org/10.3390/buildings13071818