Abstract
The net shell is a widely utilized large-span space structure known for its aesthetically pleasing design and uniform load distribution, as well as serving as a prominent architectural landmark. In recent years, the impact resistance research of mesh and shell structures has garnered increased attention due to the accumulation of local conflicts. In this study, a parametric model of the spherical mesh shell was developed with Rhino software, and a numerical analysis model for a K8 mesh shell was established through the application of the ABAQUS finite element analysis software. Subsequently, the proposed numerical analysis method for the impact test was applied to validate its accuracy. The research also explored various dynamic constitutive models, such as Cowper-Symonds, Johnson-Cook, modified temperature term Johnson-Cook, and modified strain term and temperature term Johnson-Cook, with the assessment of their impact on the numerical simulation of impact resistance. Based on the impact dynamic response of the spherical net shell of different materials, the selection of an appropriate dynamic constitutive model for the numerical simulation of impact resistance in the spherical net shell was the MJ-C model. The comparative analysis of different materials, including Q235B, Q355B, Q460D, and 6061-T6, indicated that when the impact material failed to penetrate the structure instantly, the improvement of the material strength would enhance the impact resistance of the structure. On the other hand, when the impact material managed to penetrate the structure instantly, the material strength would not significantly help mitigate the damage. Notably, brittle materials, such as aluminum alloy, exhibited a distinct absence of a pronounced yield stage compared with low-carbon steel, which ultimately led to a relatively abrupt deformation.
1. Introduction
With the development of the economy and the continuous progress of society, the increasing demands for public entertainment venues have necessitated the emergence of large-span space structures [1]. Among these structures, the network and shell structure [2,3,4,5] has gained widespread application due to its numerous advantages, including its aesthetically pleasing design, uniform stress distribution, lightweight construction, high stiffness, and expansive coverage space.
In recent years, there has been a rise in local conflicts, turbulence, and global problems, accompanied by an increase in the number of terrorist attacks. One notable incident occurred on 11 September 2001, when four American flights were hijacked. Two of these flights crashed into the World Trade Center’s twin towers, resulting in their collapse and numerous casualties. Given the frequency of terrorist attacks and the potential impact on buildings, particularly those serving as national or regional landmarks, there is a pressing need to address the vulnerability of these structures to external shocks. The loss incurred from such events can be incalculable. Consequently, studying the resistance of large-scale structures to impact [6,7] is of paramount significance [8,9]. In 1977, scholars G.R. Cowper and P.S. Symonds proposed the Cowper-Symonds structural model for metal materials, commonly known as the C-S constitutive model. This model provides a relationship between material stress and strain rate, employing a segmented linear plastic model to represent the dynamic mechanical properties of metal materials. As a result, it has found widespread application in structural impact simulations. In 1983, Johnson and Cook proposed the Johnson-Cook constitutive model, the J-C constitutive model. This model considers the effects of large strains, high stress, and high temperatures on metal materials during high-speed impacts [10,11]. It is particularly suitable for predicting the dynamic mechanical behavior of metal materials under impact and facilitating numerical analysis.
In China, the research on dynamic constitutive models of materials has just started recently. Numerous scholars have been dedicated to revising and improving the classical constitutive models.
In 2014, Li Lin discovered a limitation in the original Johnson-Cook (J-C) constitutive model in accurately capturing the temperature softening behavior of Q235B steel. To address this, the temperature term of the original J-C constitutive model was corrected, resulting in the development of the J-C constitutive model with the modified temperature term, referred to as the MJ-C constitutive model. Subsequently, the MJ-C constitutive model was incorporated into the corresponding numerical simulation. The simulation results exhibited excellent agreement with the test results, thereby confirming their accuracies.
In 2020, a model based on the J-C constitutive model incorporated with the modified strain term proposed by Xinke Xiao [12,13,14,15], Li Lin [16], and Bo Huang modified the temperature term, which resulted in the development of the J-C constitutive model with the modified strain term and temperature term, referred to as the MxJ-C constitutive model. The parameters of the MxJ-C model of Q460D steel were calibrated through a series of tests. When studying the impact resistance of large-span space structures, the current research approach mainly relies on numerical simulation with supplementation with experiments. The accuracy of the numerical simulation depends on the noticeable characterization of the dynamic mechanical behavior under material impacts. The fundamental research on the dynamic mechanical properties of building materials has been fairly comprehensive. However, the constitutive models and materials utilized in structural impact [17,18] resistance simulations can be relatively limited, which restricts the scope and depth of the research on the impact resistance of large-span space structures.
Therefore, this study investigated the influence of various materials on the impact dynamic response of spherical surface net shells. The specific research objectives were outlined as follows.
- (1)
- Conducting the numerical analysis method for assessing the impact resistance of mesh shell structures [19,20]. The method involved the comparisons of different unit types, contact algorithms, and contact types to determine their effects. Subsequently, an open spherical shell parametric model was developed by applying Rhino 7 [21] software. In the meantime, an ABAQUS finite element analysis software was utilized to establish a K8 shell [22,23] numerical analysis model incorporating a purlin roof system. Finally, the proposed numerical simulation was employed to validate the accuracy of the numerical analysis method for ultimately assessing the impact resistance of the shell structure.
- (2)
- Studying the influence of dynamic constitutive models on the numerical simulation of impact resistance of spherical net shells [24,25,26,27]. The influence of dynamic constitutive models on shell impact resistance numerical simulation was analyzed, with the consideration of the Cowper-Symonds [28] (C-S), J-C [29], MJ-C [30], and MxJ-C failure mode distributions of the shell impact failure models. Moreover, the impact action, node vertical displacement, and vertical velocity were evaluated by applying different dynamic constitutive models for the numerical simulation of the shell impact resistance. Finally, suggestions were provided for the selection of suitable dynamic constitutive models to capture the material’s impact dynamic response accurately.
- (3)
- This paper mainly considered the ramifications of the monomeric high-speed impact on different materials, with the comparative analysis of the impact dynamic response of different materials, specifically focusing on the Kiewitt spherical net shell [31]. Through large-scale parametric analysis, we successfully obtained the impact failure mode distributions [32,33] of certain types of structural steel, including Q235B [34], Q355B, Q460D [35], as well as aluminum alloy 6061-T6 [36,37]. Furthermore, we summarized the change patterns of the failure modes of different structural steel [38] and compared the impact resistance of Q235B steel and 6061-T6 aluminum alloy, which eventually revealed the mechanism of impact dynamic response with typical examples, and provided a reference for the study of the shell structure under impacts.
2. Numerical Analysis Method for Assessing the Impact Resistance of Mesh and Shell Structures
2.1. Kiewitt Sphere Establishment [39,40]
This study presented a parameterization model based on the Grasshopper plugin of the Rhino platform. The spherical surface mesh shell was composed of n root diameter rods, which divided the sphere into n (n = 6, 8, 12, etc.) symmetrical fan surfaces. These fan surfaces consisted of ring and inclined rods, forming a uniform triangular grid, as depicted in Figure 1. The key components of the spherical surface net shell include diameter rods, ring rods, and inclined rods. Moreover, an open spherical net shell was created, which allowed control over the following four fundamental parameters: span, vector height, number of fans, and frequency number. Subsequently, the diameter rods and ring rods were generated, and the inclined rods were connected to complete the construction of the spherical net shell.
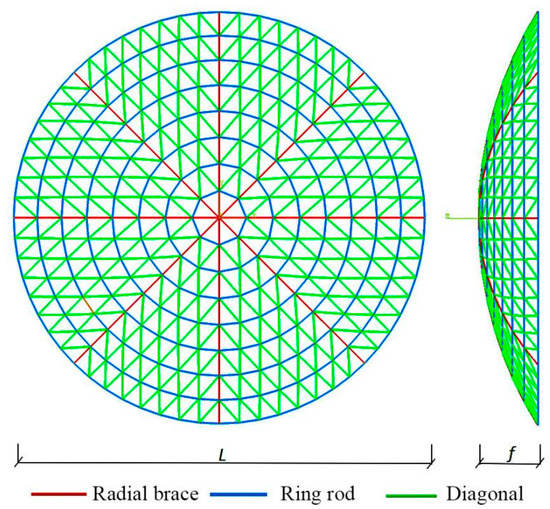
Figure 1.
Components of the Kiewitt reticulated shell.
The entire modeling process is illustrated in Figure 2. The parameter modeling process was outlined as follows.
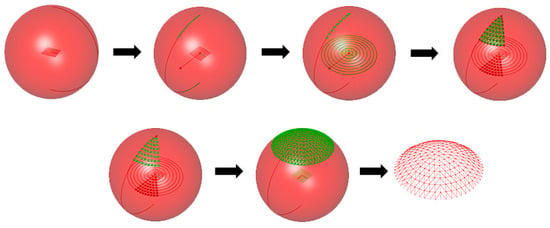
Figure 2.
Parametric modeling process of the Kiewitt spherical reticulated shell.
- (1)
- Sphere creation.
- (2)
- Diameter rod generation: A circle was centered on the sphere, with the diameter representing the span of the net shell. Intersect the circle with the surface of the sphere to obtain the diameter rods of the net shell.
- (3)
- Ring rod projection: The equidiameter rods were projected downward to generate the ring rod projections.
- (4)
- Equal subsection surface division: On the projection plane, the sectors were equally divided with the segmentation of the ring rods. Subsequently, these segments were mapped back onto the sphere’s surface.
- (5)
- Connect of the rods: All the rods within the same section were connected.
- (6)
- Ring array formation: A ring array was utilized to generate a complete mesh shell.
2.2. Consideration of Numerical Analysis Model for K8-Type Mesh Shell in a Purlin Roof System
According to the technical specification of Space Grid JGJ 7-2010, the vector span ratio of the spherical net shell should not be less than 1:7, and the span of a single-layer spherical net shell should not exceed 80 m. This study created a K8 spherical net shell with a span of 60 m, a vector span ratio of 1:7, and a frequency number of 8. The design also incorporated a purlin roof system, which included mesh shell rods, columns, purlins, rivets, and roof panels. The mesh shell rods were constructed with round steel pipes with standard section sizes commonly applied in engineering. The primary and ring rods presented a diameter of Φ152 × 5.5 mm, while the inclined rods had a diameter of Φ146 × 5 mm. The purlins measured 160 × 70 × 3 mm, the columns had a diameter of Φ108 × 4 mm, the rivets had a diameter of 12 mm, and the roof panels had a thickness of 2 mm. The size of the mesh shell purlins was determined by Formulas (1) and (2).
where , , , and respectively denote the span of the mesh rod, the purlin span, the height of the mesh rod, the height of the purlin, and the height of the column. Based on the geometric relationship between the shell rods and the purlins, the parametric models of the shell rods, purlins, and roof panel were generated as external models into the finite element analysis software ABAQUS 6.14 to obtain the column and rivets through the application of explicit beam unit B31 for the shell rods, purlin, column, and rivets, as well as the explicit shell unit S4R for the roof panel. Each component of the mesh shell is shown in Figure 3.
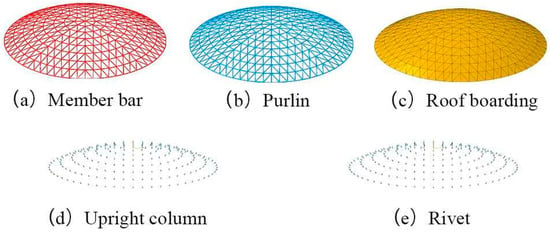
Figure 3.
Components of the numerical analysis model for the K8 mesh shell in the purlin roof system.
The assembly process of the model follows a bottom-to-top order, with the mesh case rods, columns, purlins, rivets, and roof panels being placed accordingly, as depicted in Figure 4. The connection between the shell rods and the columns was achieved through a just connection (MPC-Beam). Articulated connections (MPC-Pin) were employed between the columns, purlins, rivets, and roof panels. Additionally, a three-way fixed hinge support mechanism was utilized for the case support.
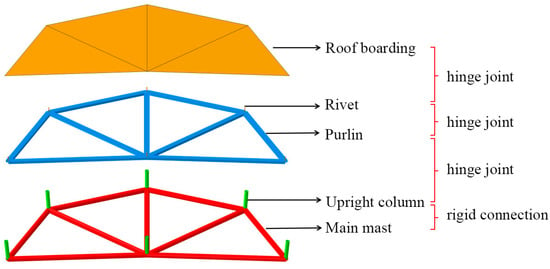
Figure 4.
Structure drawing of the K8 reticulated shell with consideration for the purlin roof system.
The roof load was specified as 60 kg/m2, and the BodyForce was uniformly distributed across the roof panels with the arrangement of the gravity field. The overall diagram of the net shell is depicted in Figure 5. The impacting object was modeled as a cylinder with a radius of 1.6 m and a height of 3 m. It was treated as a rigid body, and a reference point was defined. The reference point and the impacting object were coupled together, which ensured that they could share the same degrees of freedom. Mass and velocity parameters were assigned to the reference point, allowing for adjustment of the impact momentum by varying the mass and velocity. The penalty function method was employed for the contact algorithm between the impact object and the net shell, while the contact type was set to automatic contact. The impact material was a cylinder with a radius of 1.6 m and a height of 3 m in Figure 6. The contact type was the universal contact.
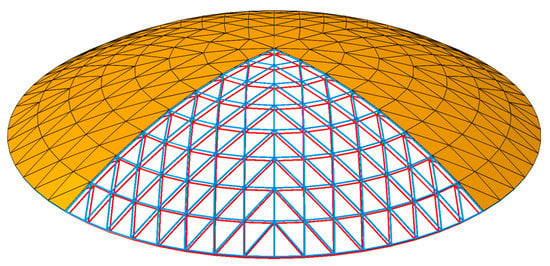
Figure 5.
Numerical analysis model of the K8 reticulated shell with consideration for the purlin roof system.
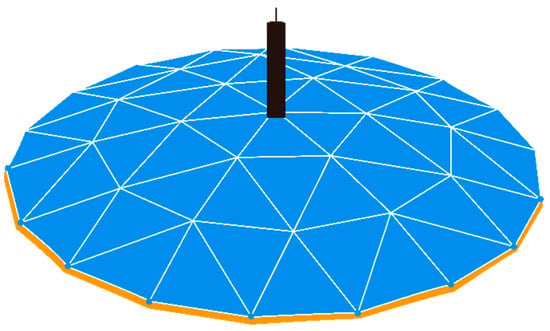
Figure 6.
Numerical analysis model of shock material and mesh shell.
3. Simulation Comparison of Impact Testing on Scale Model of Mesh Shell
3.1. Constitutive Model and Material Properties
3.1.1. C-S Constitutive Model
The C-S constitutive model considers the strain rate effect of the material, without the effect of the temperature, and the expression is shown in Equation (3).
where represents the yield stress of constant strain rate; represents effective strain rate; and denote the strain rate parameters, with the and values of structural steel being 5 and 40, respectively, as well as the and values of alufer being 4 and 6500, respectively; denotes the material yield strength; and represents the hardening function based on effective plastic strain.
3.1.2. J-C Constitutive Model
The J-C constitutive model is shown in Equation (4).
where represents the yield strength of the material at the reference temperature; represents the strain hardening coefficient of the material at the reference strain rate and reference temperature; represents the reference strain rate and the material at the reference temperature; represents the equivalent plastic strain; denotes the strain rate sensitivity coefficient; denotes the dimensionless equivalent shaping strain rate; , denotes the reference strain rate; represents the dimensionless temperature parameter. Moreover, , denotes the current material temperature; represents the reference temperature, which can be generally assigned as the room temperature; represents the melting point of the material; and represents the temperature softening index.
3.1.3. MJ-C Constitutive Model
The MJ-C constitutive model is shown in Equation (5):
where represents the correction coefficient of the temperature term.
The parameters of the MJ-C constitutive model for the three structural steels (Q235B, Q355B, and Q460D) and aluminum alloy 6061-T6 are summarized in Table 1.

Table 1.
MJ-C constitutive parameters of the three structural steels and 6061-T6 aluminum alloy.
3.2. Distribution of Impact Failure Modes in Different Materials
3.2.1. Elastic Impact Test of Shrink Scale Model with Roof Panel Mesh Shell C-S, J-C, and MJ-C
The C-S, J-C, and MJ-C constitutive models were employed to simulate the impact drop model at 8 mm and 10 mm, respectively, to obtain the stress–time curve for the different section axes, as shown in Figure 7 and Figure 8. The test results and corresponding simulation results are summarized in Table 2 and Table 3.

Figure 7.
Comparison of axial stress in model rod and roof slab under 8 mm impact.

Figure 8.
Comparison of axial stress in main members of reticulated shell and roof plate under 10 mm impact.

Table 2.
Comparison between destructive impact test and simulation results of 8 mm model with roof panel.

Table 3.
Comparison between destructive impact test and simulation results of 10 mm model with roof panel.
Evidently, the prediction error for the three constitutive models of the mesh shell with roof panel was minimal, falling within an acceptable range. The J-C and MJ-C constitutive models exhibited a higher prediction accuracy than the C-S constitutive model. Since the elastic shock test of the mesh shell with roof panel ignored temperature [40] changes, the simulation results for the MJ-C constitutive model and J-C constitutive model were identical, as the only difference lay in the temperature term parameters.
3.2.2. Destructive Impact Test of Scale Model with Roof Panel
Table 4 presents a comparison between the predicted and test heights of the constitutive model. The results in Table 4 demonstrate that numerical simulation errors can be commonly observed. However, considering the destructive nature of the impact, the height of the second ring node predicted with the most significant error had only a 16 mm difference from the test result, which can be acceptable. Hence, the proposed numerical simulation analysis method for shell structure impact resistance in this study was successfully validated. In addition, the overall prediction error of the J-C and MJ-C constitutive models was lower than that of the C-S constitutive model. Moreover, the MJ-C constitutive model exhibited a slightly higher prediction accuracy than the J-C constitutive model.

Table 4.
Comparison of impact test and simulation results for roof panel model.
3.3. Comparative Analysis and Study of the Impact Dynamic Response of the Spherical Net Shell with Different Materials
Impact Failure Mode Distribution of Different Materials
The application of the numerical analysis model of the system established in Section 2, MJ-C constitutive model, Q235B, Q355B, Q460D, and aluminum alloy 6061-T6, was common for large-scale parameter analysis to obtain the distribution map of failure modes of different materials, as shown in Figure 9. The number of depression rings corresponding to the shell is shown in Figure 10.
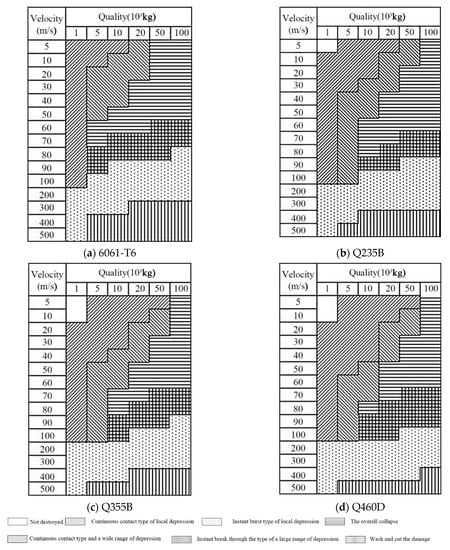
Figure 9.
Impact failure mode distribution of K8 reticulated shells with different materials.
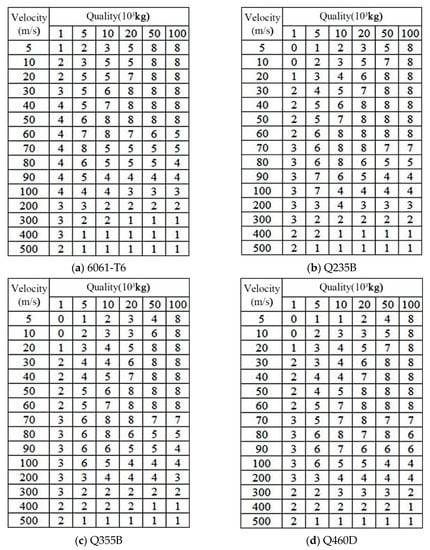
Figure 10.
Number of concave rings in K8-type reticulated shell with different materials.
Figure 9 reveals that the K8 network shell experienced four impact failure modes when employing Q235B, Q355B, Q460D, and 6061-T6 aluminum alloy. These modes included local depression of the shell, large-range depression of the shell, overall collapse of the shell, and cutting failure of the shell. The local depression and the depression of the network shell can be categorized into continuous contact types and instant break types. When the impact momentum was low, the impact was insufficient to penetrate the net shell. The net shell impact area remained in contact, resulting in continuous contact and depression of the net shell. This can ultimately contribute to continuous contact damage. As the impact momentum increased, the impact could instantaneously break through the net shell, leading to instant breakage. The specific failure types of the mesh shell, with increasing impact momentum, included continuous local depression, significant depression with continuous contact, wide depression with instant breakage, overall collapse, local depression, and mesh shell failure.
Table 5 presents the proportion of partial failure modes observed for different materials. Through combining with Figure 9 and Figure 10, as well as Table 5, it can be observed that, in cases where the shock does not penetrate the mesh shell under continuous contact, the application of structural steels, such as Q235B, Q355B, and Q460D, resulted in an overall collapse proportion of 21.1%, 17.8%, and 16.7%, respectively. The proportions of large-scale depressions with continuous contact involved 16.7%, 15.6%, and 14.4% for Q235B, Q355B, and Q460D. It was evident that, as the steel yield strength increased, there could be fewer instances of large-scale depression and the overall collapse of the mesh shell, which ultimately resulted in a smaller number of depression rings. In the case of instant burst, the proportions for Q235B, Q355B, and Q460D were 7.8%, 10%, and 12.2%, respectively. This indicated that, as the yield strength of the steel increased, there could be more examples of large-scale depression in the mesh shell, resulting in a more significant number of depression rings. The overall collapse of the net shell was the most detrimental. Therefore, when the impact on the shell was lower, the impact on the steel could be lower. However, with an increase in the impact energy, increasing the yield strength of the steel cannot reduce the damage to the net shell. The anomalies observed in the instant burst examples of different structural steel mesh shells will be further discussed through typical examples below.

Table 5.
Proportion of partial impact failure modes in K8 reticulated shell with different materials (%).
The yield strength of the 6061-T6 aluminum alloy was comparable to that of the Q235B steel, making them suitable candidates to be selected for comparing the impact resistance of the aluminum alloy and structural steel mesh shell. Referring to Table 5, the overall collapse proportion for the 6061-T6 aluminum alloy mesh shell was 22.2%, while for the Q235B steel mesh shell, it was 21.1%. Notably, the 6061-T6 aluminum alloy mesh shell experienced instantaneous breakage and impact damage earlier than the Q235B steel shell, which may be attributed to the brittle nature of the 6061-T6 aluminum alloy. The factors influencing the impact resistance of the mesh shell with the utilization of Q235B steel and 6061-T6 aluminum alloy will be further elucidated through the subsequent discussion of typical examples.
4. Comparative Analysis of Impact Dynamic Response in Spherical Net Shells of Different Materials
4.1. Failure Criterion
Most engineered metals exhibit high toughness. In this case, the progressive failure model of toughness damage is commonly adopted for the failure analysis of materials. This model can simulate the tensile failure process of metal materials, often accompanied by a plastic model. The metal-breaking process is shown in Figure 11.
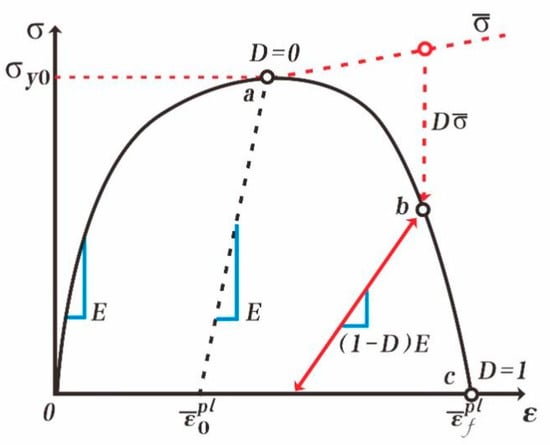
Figure 11.
Progressive failure model of material toughness damage.
This model comprehensively defines all the stages of the material, including the elastic stage, the plastic stage, and the injury initiation and injury evolution stage.
From the figure, when the material bearing went through the elastic–plastic stage, the cumulative damage parameter , and the material continued to carry, and the material strength was damaged. Conversely, the effect gradually decreased, and the stiffness also decreased with the increase in , and the material softened. When the material stiffness to 0, , and the unit fails to be deleted.
When utilizing the toughness damage progressive failure model in ABAQUS, it becomes imperative to ascertain the initial fracture strain and failure displacement parameters. The initial fracture strain was established as an equivalent plastic strain to characterize material damage. At the same time, the failure displacement served as a criterion for defining the ultimate failure of the material. Once these values were reached, the material stiffness underwent complete attenuation, which contributed to the removal of the affected unit. Both the initial fracture strain and failure displacement values were determined based on the material tests.
In the first stage of material stiffness degradation, the equivalent plastic strain was related to the unit characteristic size , and the relationship between the material failure displacement and the equivalent plastic strain is shown in Equation (6).
where represents the beginning of the material damage; for = representing the material fracture, the cell feature size depends on the cell geometry. However, for beams and trusses, the integration point size along the axis of the cell was adopted.
According to the previous test results, the initial damage equivalent to the plastic strain of the Q235B, Q355B, Q460D steel, and the 6061-T6 aluminum alloy included 0.23, 0.24, 0.25, and 0.14, respectively. The final failure and equivalent plastic strain of Q235B, Q355B, and Q460D steel involved 0.26, 0.31, and 0.31, respectively. The characteristic length of the mesh case model beam unit was 0.03 m, and the failure displacement of Q235B, Q355B, and Q460D were , , and , respectively.
The 6061-T6 aluminum alloy was a brittle material, and its failure displacement can be determined according to the test results.
In this study, the numerical simulation of the mesh shell structure adopted the progressive failure model of toughness damage, and the values of the initial injury and final failure of the material were taken as described above.
4.2. Typical Examples: Comparative Analysis of Impact Dynamic Response of Q235B Steel and Q460D Steel Mesh Shells
Impact mass m = 100 × kg and impact velocity v = 90 m/s.
Example 4-1 net shell adopted Q235B steel.
Example 4-2 mesh shell adopted Q460D steel.
4.2.1. Failure Mode
The deformation processes of the net shell and mesh shell in Examples 4-1 and 4-2 have been illustrated in Figure 12 and Figure 13, respectively. In Example 4-1, the impact broke through the net shell, leading to a continuous downward depression of the shell. The final number of depressions reached four, accompanied by localized instantaneous burst depression. In Example 4-2, the mesh shell underwent continuous expansion and depression following the impact that went through it. Ultimately, the number of depression rings stabilized at six, indicating an instant large-scale depression of the mesh shell.
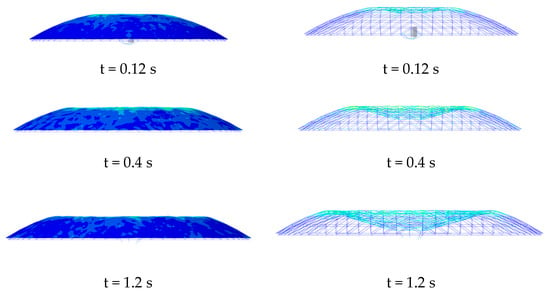
Figure 12.
Deformation history of reticulated shell structure (Q235B steel) (Example 4-1).
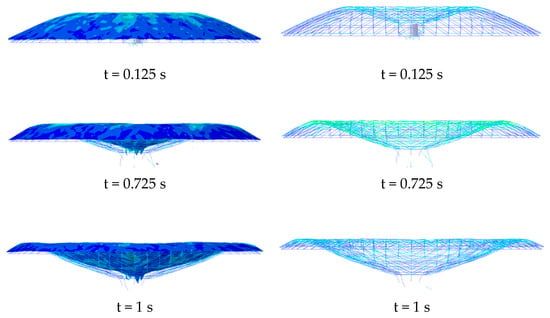
Figure 13.
Deformation history of reticulated shell structure (Q460D steel) (Example 4-2).
4.2.2. Impact Action
Figure 14 and Figure 15 illustrate Examples 4-1 and 4-2, respectively. The impact force–time curve of both examples exhibited a peak at the moment of the impacts with the mesh shell. Example 4-1 reached an impact peak of 77.22103 kN, while Example 4-2 exhibited a higher impact peak of 81.13103 kN, indicating a more substantial impact effect in Example 4-2.
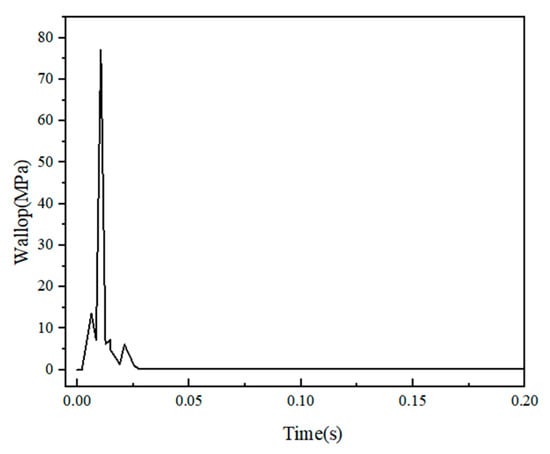
Figure 14.
Impact force (Example 4-1).
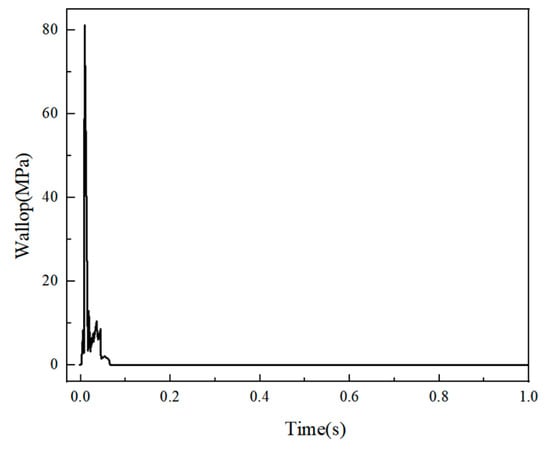
Figure 15.
Impact force (Example 4-2).
The impact duration of Example 4-1 was 26 ms, while that of Example 4-2 was 94 ms. The impact duration of Example 4-2 was 3.61 times larger than that of Example 4-1. This difference can be attributed to the higher strength of Q460D steel applied in Example 4-2 compared to Q235B steel applied in Example 4-1. More impact energy was required to reach the failure state. Consequently, Example 4-2 experienced a longer and more substantial impact, resulting in more significant shell deformation, increased downward depression, and more severe damage.
4.2.3. Vertical Node Displacement and Vertical Speed
Figure 16 and Figure 17 depict the vertical displacement curves of Examples 4-1 and 4-2, respectively. In both examples, the impact object penetrated through the highest point of the mesh shells, causing the subordinate rods to deviate rapidly from the overall structure of the shell. Consequently, the vertical motion of Node 1, representing the shell vertex, did not reflect the overall movement trend of the mesh shell. Therefore, the study focused only on the vertical motion of Nodes 2–8. It is evident that, in both examples, the vertical displacement of each node increased sequentially in numerical order. There was a time difference between each node’s initiation of downward motion. This phenomenon indicated that the ring rods of the shell experienced plastic deformation in the vicinity of the impact area, starting from the rods closer to the impact area and extending further away. In Example 4-1, all nodes (from Node 2 to Node 8) reached their maximum displacement at 0.447 s. The maximum vertical displacements for each node can be as follows: 4.87 m, 3.33 m, 1.49 m, 0.22 m, 0.006 m, 0.004 m, and 0.007 m. Notably, only nodes 2, 3, and 4 exhibited significant displacements, which indicated that the impact affected only the first four rings of the shell. In Example 4-2, Nodes 2–8 reached peak displacements at 0.67 s. The maximum vertical displacements included the following: 9.91 m, 8.41 m, 6.63 m, 4.27 m, 1.72 m, 0.12 m, and 0.02 m. Notably, Nodes 2–6 demonstrated relatively pronounced displacements, and the number of depression rings in the shell amounts to six.
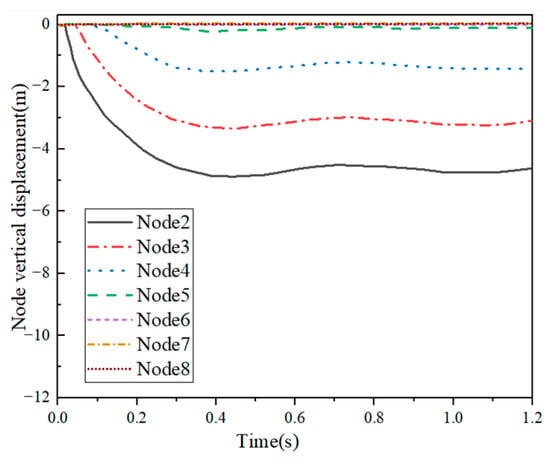
Figure 16.
Vertical displacement (Example 4-1).
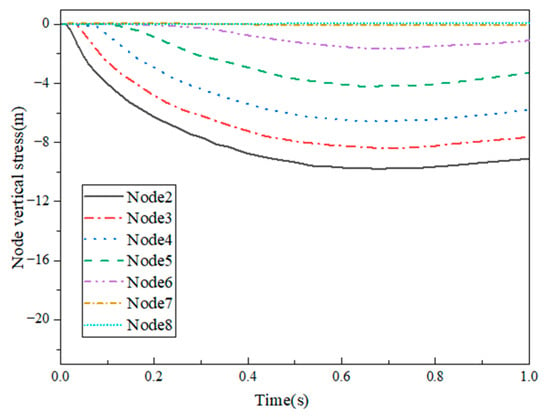
Figure 17.
Vertical displacement (Example 4-2).
Figure 18 and Figure 19 illustrate the vertical velocity time course curves of the nodes in the two examples. Figure 18 and Figure 19 present that, in both examples, the vertical velocity of Node 2 in the mesh shell rapidly reached its peak at the moment of impact. In Example 4-1, the vertical velocity of Node 1 reached 63.43 m/s, while in Example 4-2, it reached 65.95 m/s, indicating a close similarity. Subsequently, the node velocity rapidly decreased, and the vertical velocity of each node gradually increased from zero. Upon reaching their respective peak velocities, the velocity curve of Node 1 approached an asymptote, with the velocity of each node continuously decreasing and gradually converging. Eventually, the velocities stabilized around zero. In Example 4-1, the vertical velocities of all nodes approached zero at approximately 0.45 s. In Example 4-2, the velocity decay of each node started around 0.7 s, which coincided with the maximum vertical displacement of the corresponding node.
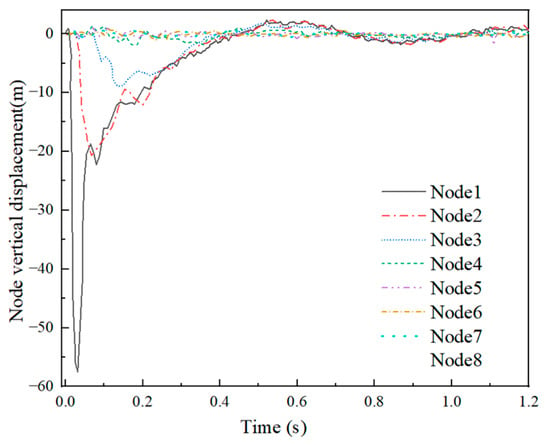
Figure 18.
Node vertical velocity (Example 4-1).
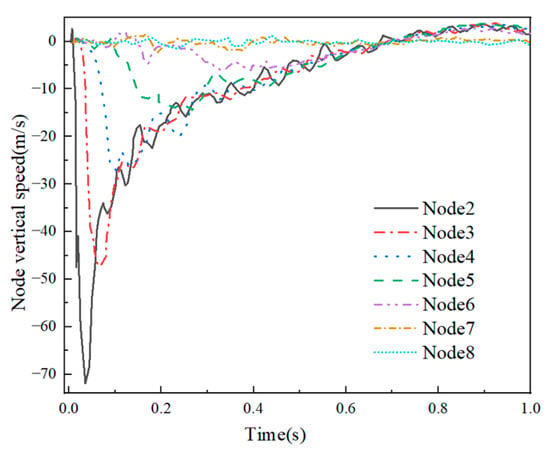
Figure 19.
Node vertical velocity (Example 4-2).
4.2.4. Bearing Force of the Rod Parts
Examples 4-1 and 4-2 are presented in Figure 20 and Figure 21, respectively. Figure 20 shows that N1 reached a peak axial force of 625 MPa and gradually decreased to zero at 0.026 s. Subsequently, the axial force of N2 began to rise rapidly, peaked, and gradually dropped. This pattern continued as each subsequent rod started to rise when the axial force of the preceding rod reached its peak. These findings indicated that the depression of the net shell spread gradually from the impact area to the support. In Example 4-1, the peak axial forces of N2–N8 were calculated as 272.40 MPa, 171.06 MPa, 75.35 MPa, 71.21 MPa, 43.77 MPa, 44.67 MPa, and 43.64 MPa, respectively. It can be observed that with the damage to the mesh shell structure, the rod absorbed the impact force layer by layer, and the peak axial force of each ring rod gradually decreased, which indicated a dissipation of impact energy from the vertex of the network shell towards the support. In Example 4-2, the peak axial forces of N1–N8 were, respectively, 923.17 MPa, 440.95 MPa, 221.41 MPa, 166.21 MPa, 132.14 MPa, 95.57 MPa, 54.10 MPa, and 44.07 MPa. Compared with the shaft force of the rods, it was evident that the peak axial force of each ring rod in Example 4-2 was higher than that in Example 4-1. This discrepancy can be attributed to the longer contact time between the impact and the net shell in Example 4-2, which can transfer more impact energy to the net shell, resulting in greater force on the web shell rods and higher stress levels.
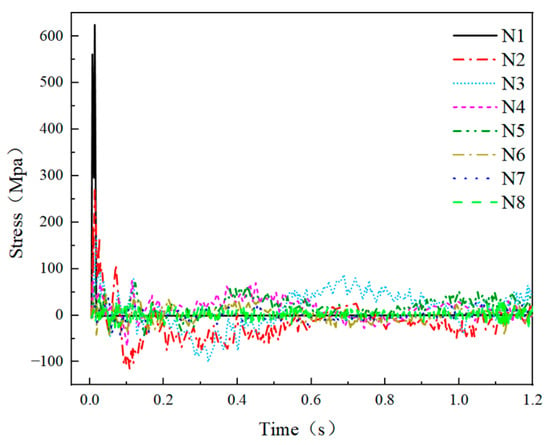
Figure 20.
Rod axial force (Example 4-1).
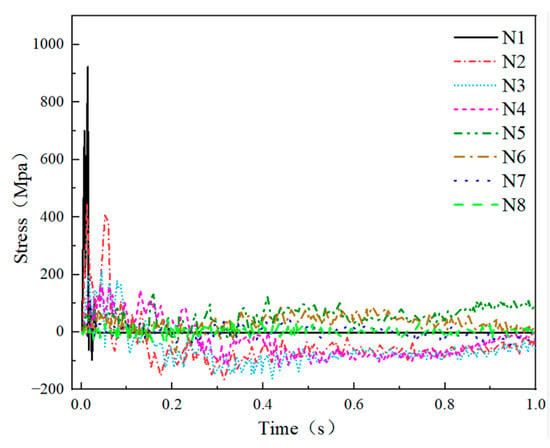
Figure 21.
Rod axial force (Example 4-2).
4.2.5. Energy Change of the Mesh and Shell Structure
The internal energy change curve of Example 4-1 is depicted in Figure 22, which illustrates the internal energy change curves of the network shell with three distinct stages. Initially, the curve experienced rapid growth, followed by a slower rise, and eventually stabilized. When the impact occurs, the energy can be transferred to the net shell, resulting in depression and increased deformation. The net shell also rose rapidly. After 0.02 s, the impact passed through the net shell, and the depression slowed down due to the gravitational force. Consequently, the deformation and internal energy growth became slow, eventually reaching a maximum deformation of 15.1 MJ at 0.45 s. Subsequently, the internal energy stabilized without further increase. Figure 23 presents the internal energy change curve of Example 4-2. It can be evident that the curve exhibited rapid growth within the first 0.05 s, and the growth rate in this early stage was higher compared to Example 4-1. This disparity arose because the impact in Example 4-2 was in contact with the net shell before breaking through, unlike Example 4-1. After 0.05 s, the growth rate of the internal energy curve in Example 4-2 slowed down. At 0.67 s, it reached the peak internal energy of 39.12 MJ, approximately 2.6 times higher than the peak internal energy of Example 4-1. This disparity can be compared with Example 4-1,the Q460D steel used in Example 4-2 exhibited more significant plastic strain and greater strength, with being able to withstand greater impact force. From Figure 23, the starting curve of the image was steeper, allowing for more excellent energy absorption by the net shell and resulting in more significant depression, deformation, and overall internal energy.
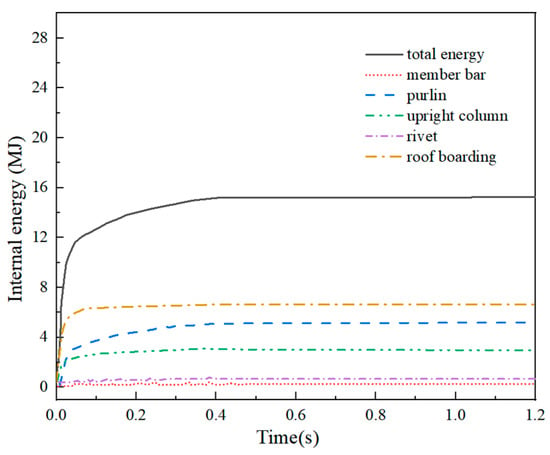
Figure 22.
Internal energy (Example 4-1).
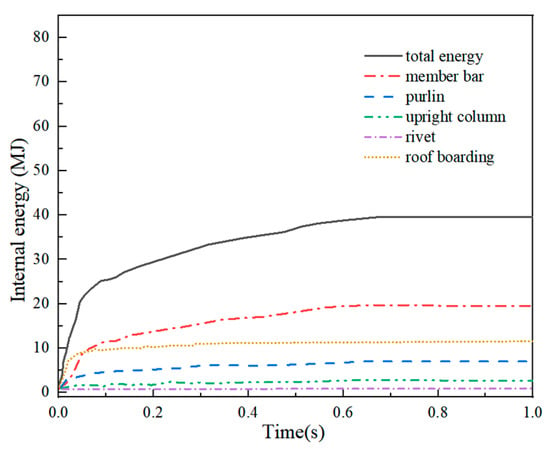
Figure 23.
Internal energy (Example 4-2).
4.3. Typical Examples: Comparative Analysis of Impact Dynamic Response of Steel and Aluminum Alloy Mesh Shells
The yield strength of 6061-T6 aluminum alloy was close to that of Q235B steel, making both materials suitable for evaluating their impact resistance. Considering the common collisions in real life, such as vehicles, for the safety of impact quality and impact speed, in this study, the impact mass was set to m = 5 tons, and the impact speed was v = 70 m/s.
Example 4-3 mesh shell adopted Q235B steel.
Example 4-4 mesh case adopted 6061-T6 aluminum alloy.
4.3.1. Failure Mode
The deformation process of the mesh shell is depicted in Figure 24 and Figure 25. In Example 4-3, upon contact between the impact material and the mesh shell, the structure of the mesh shell experienced continuous contact depression, ultimately resulting in six depression rings. Notably, during mesh shell deformation, the roof panels, purlins, and rods in the impact area remained intact. In contrast, Example 4-4 illustrates the instantaneous penetration of the net shell by the impact, directly contacting the roof panels and purlins. The impact resulted in the failure of the rods in the purlin impact area from the end (intersection of the first and second rings). Subsequently, the impact further interacted with the net shell rods, which led to their downward displacement and the overall collapse of the net shell. Despite the similar yield strength between the 6061-T6 aluminum alloy applied in Example 4-4 and the Q235B steel adopted in Example 4-3, it can be evident that the damage extent of the 6061-T6 aluminum alloy mesh shell surpassed that of the Q235B steel counterpart.
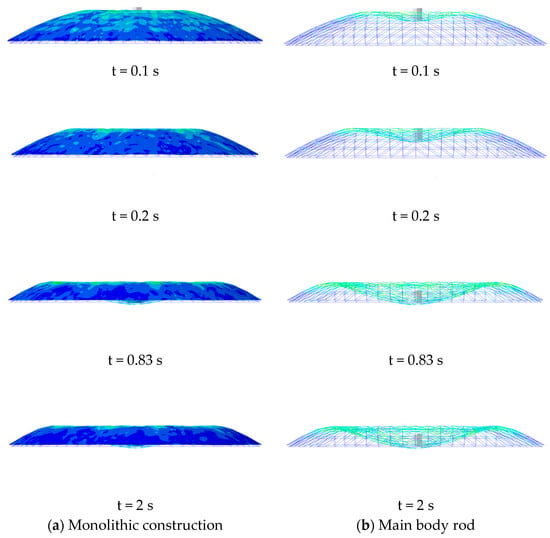
Figure 24.
Deformation development of reticulated shell structure (Q235B) (Example 4-3).
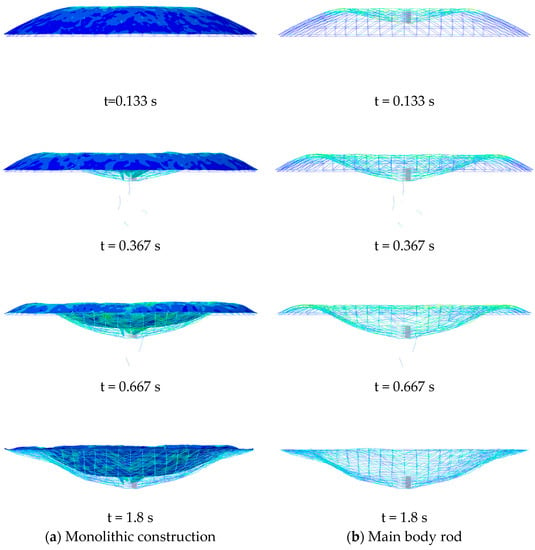
Figure 25.
Deformation development of reticulated shell structure (6061-T6) (Example 4-4).
4.3.2. Impact Action
Examples 4-3 and 4-4 are depicted in Figure 26 and Figure 27, respectively. It was evident that the impact curves of both cases reached their peaks at the moment of impact with the net shell. Example 4-3 exhibited a peak impact force of 7.79103 kN, followed by the presence and subsequent decline of the impact amplitude intervals. These fluctuations indicated multiple collisions between the impact material and the mesh shell, with the impact force eventually stabilizing around 49 kN from 0.81 s onwards. Accompanied by the gravity of the impact object, the impact force decreased to zero between 1.17 s and 1.61 s. This decrease corresponded to the net shell reaching its maximum deformation at 1.17 s, preparing to bottom out under the reaction of the net shell. Afterward, as the impact material rebounded, the impact force dropped to zero. Subsequently, the impact material descended under gravity and contacted again with the mesh shell at 1.61 s, which can lead to the impact force fluctuating around the gravitational force of the impact material. Figure 27 illustrates the impact force curve of Example 4-4. The peak impact force reached 9.92103 kN, 1.3 times higher than Example 4-3. Under the same impact conditions, Example 4-4 exhibited a more vital impact force, resulting in a greater number of depression rings in the mesh shell.
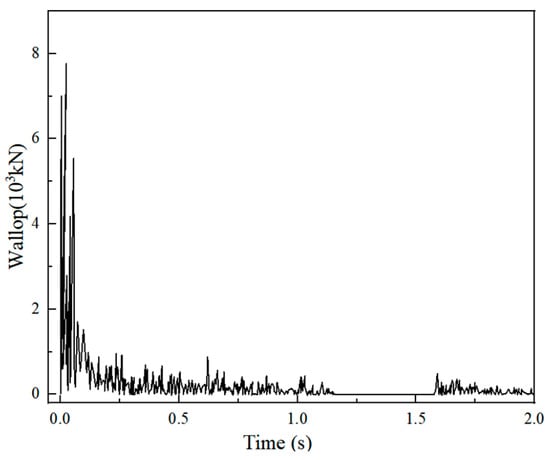
Figure 26.
Impact force (Example 4-3).
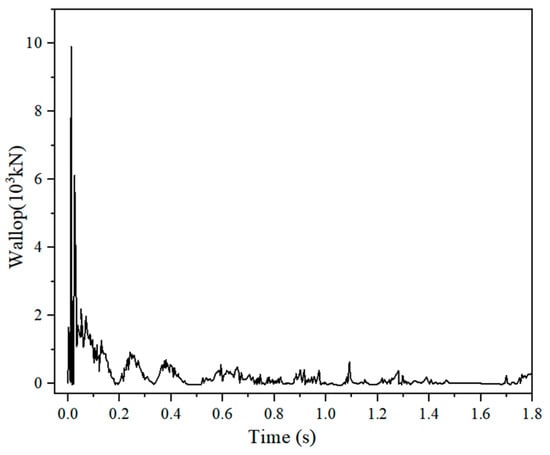
Figure 27.
Impact force (Example 4-4).
4.3.3. Vertical Node Displacement and Vertical Speed
Examples 4-3 and 4-4 are presented in Figure 28 and Figure 29, respectively. In Figure 28, it can be observed that, upon impact, the vertical displacement of the net shell vertex increased rapidly. Subsequently, it drove the adjacent nodes downward, initiating a corresponding effect on the surrounding rods, resulting in an overall downward movement of the mesh shell. The displacement of each node progressively increased, reaching maximum values at 0.88 s with vertical displacements of 9.23 m, 8.73 m, 7.39 m, 5.44 m, 2.97 m, 0.97 m, 0.16 m, and 0.05 m. Notably, Nodes 6, 7, and 8 exhibited negligible displacements. Furthermore, the number of depression rings in the mesh shell amounted to six rings. Turning our attention to Figure 29, it was evident that, in Example 4-4, all eight nodes of the mesh shell gradually experienced vertical displacements from the onset of impact. Eventually, significant displacements can be observed across all nodes, leading to the ultimate collapse of the mesh shell.
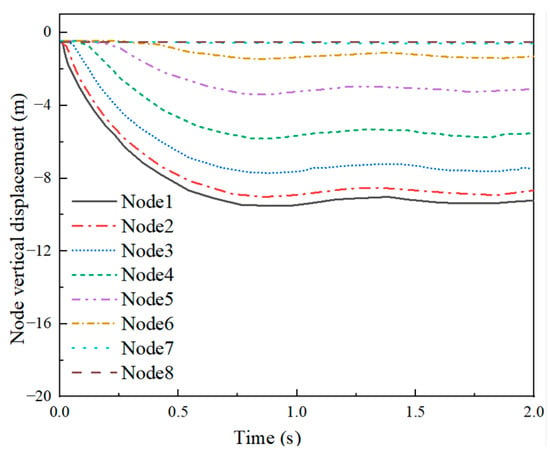
Figure 28.
Vertical displacement Example 4-3.
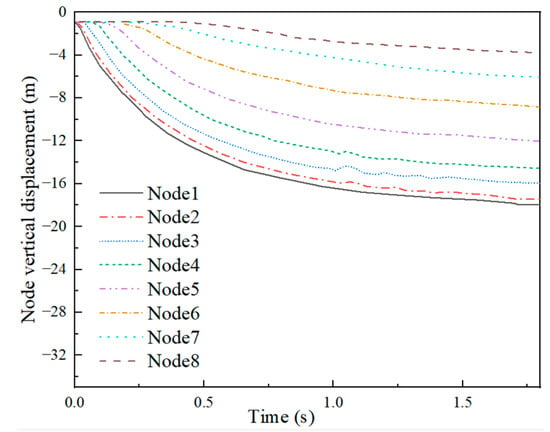
Figure 29.
Vertical displacement (Example 4-4).
Examples 4-3 and 4-4 are depicted in Figure 30 and Figure 31, respectively. The peak velocity is shown in Table 6. In Example 4-3, except for Nodes 6, 7, and 8, significant vertical velocities were observed across all other nodes, which aligned with the law of vertical displacement changes observed in the example. Subsequently, after reaching the peak, each node experienced a gradual decrease in velocity, fluctuating around zero. In Example 4-4, a similar trend was observed, with each node reaching its peak velocity upon contact with the shell during impact, followed by a gradual decline. Notably, the peak vertical velocities in Example 4-4 surpassed those observed in Example 4-3. Consequently, Example 4-4 exhibited a more intense dynamic response under the same impact conditions.
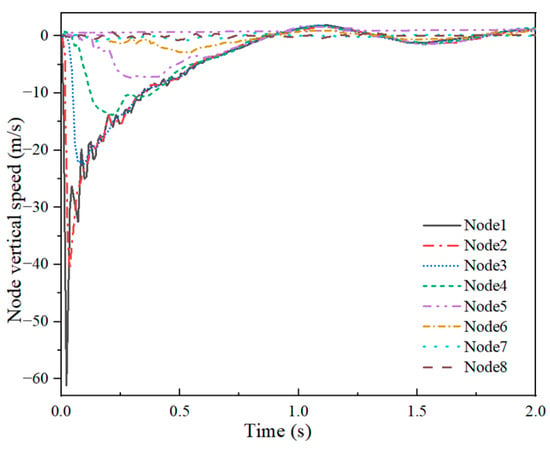
Figure 30.
Node vertical velocity (Example 4-3).
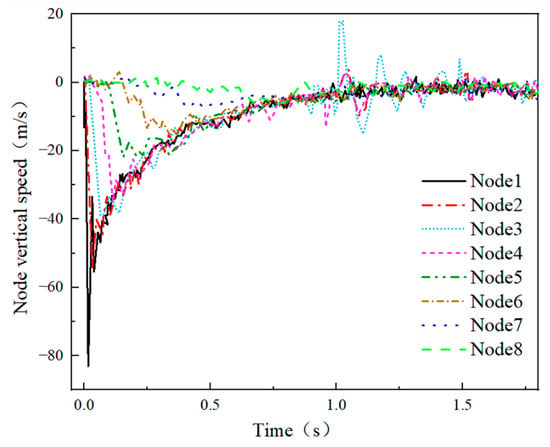
Figure 31.
Node vertical velocity (Example 4-4).

Table 6.
Peak velocities of Nodes 1 to 8.
4.3.4. Axial Force of the Rod and Parts
The axial force curves of Examples 4-3 and 4-4 are presented in Figure 32 and Figure 33, respectively. In Example 4-3, the axial force of N1 in the impact area reached its peak value of 523.48 MPa upon shell impact. Subsequently, the force exhibited fluctuations before gradually decreasing. Although the peak stress of N1 exceeded the static yield stress of 244.8 MPa determined from its test, the material’s strain rate effect prevented damage to the rods in the impact area. Following the peak stress, the peak stresses of rods N2–N8 were recorded as 357.75 MPa, 162.37 MPa, 112.05 MPa, 80.43 MPa, 53.51 MPa, 42.05 MPa, and 25.14 MPa, respectively. In Example 4-4, N1 broke after reaching its peak axial force of 357.33 MPa. Although a fracture occurred due to the strain rate effect of the 6061-T6 aluminum alloy, which exceeded the yield strength, the axial force at fracture was only 68.26% of the peak shaft force observed in Example 4-3. Therefore, despite the similar yield strength between the 6061-T6 aluminum alloy and Q235B steel, the strain rate effect and absence of evident yield and reinforcement phases resulted in the rods in the impact area of the mesh case being more susceptible to damage when adopting the 6061-T6 aluminum alloy compared to the Q235B steel. This led to an earlier instant breakage and impact damage to the net shell. The peak stresses of shafts N2–N8 in Example 4-4 were measured as 178.37 MPa, 123.71 MPa, 84.27 MPa, 49.02 MPa, 65.16 MPa, 52.19 MPa, and 16.74 MPa, respectively. Notably, the peak stresses of each ring rod were lower than those in Example 4-3. However, in Example 4-4, the impact material penetrated the purlins after contacting the rod, resulting in the downward displacement of the rods. Consequently, the rod became the main force-bearing object, transmitting the impact force to the column and subsequently to the ring rods of the purlins. Hence, the shaft forces of each ring rod can be relatively lower. In Example 4-3, the purlin in the impact area remained undamaged, sustaining high forces.
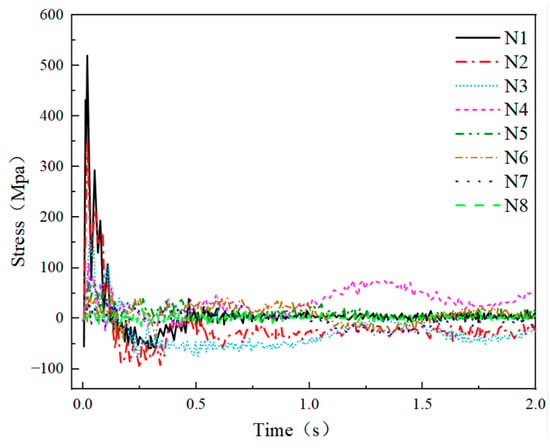
Figure 32.
Rod axial force (Example 4-3).
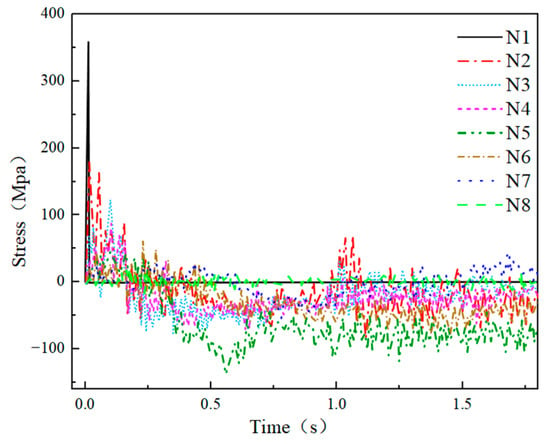
Figure 33.
Rod axial force (Example 4-4).
4.3.5. Energy Change of the Mesh and Shell Structures
Figure 34 illustrates the internal energy variation curve of Example 4-3. Following the impact, the mesh shell underwent downward depression and increased deformation. The dissipation of the energy from the impact material contributed to the deformation energy of the mesh shell, enabling the continuous increase in the shell deformation and overall internal energy. At 0.9 s, the mesh shell reached a termination, and the growth of deformation energy ceased, resulting in a peak internal energy of 14.83 MJ. The final internal energy values and internal energy ratio of each component for the rods, purlins, column, rivets, and roof panels of the mesh shell are shown in Table 7. Notably, the rods, purlins, and roof panels of the mesh shell experienced significant deformation during the impact, which led to higher internal energy values. Conversely, the columns and rivets exhibited less deformation, resulting in lower internal energy. Figure 35 illustrates the internal energy variation curve for the calculated Example 4-4. The final internal energy of the mesh shell reached 28.56 MJ, approximately 1.9 times the peak value of the internal energy observed in Example 4-3. This discrepancy can be attributed to the ultimate collapse of Example 4-4, resulting in more incredible deformation energy stored in the mesh shell and, subsequently, higher overall internal energy.
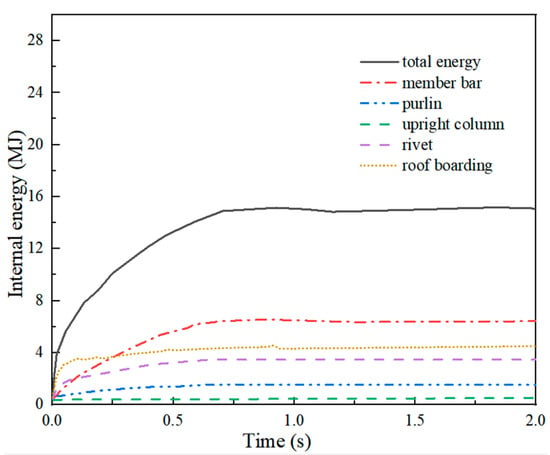
Figure 34.
Internal energy (Example 4-3).

Table 7.
Final internal energy value of each part in Example 4-3.
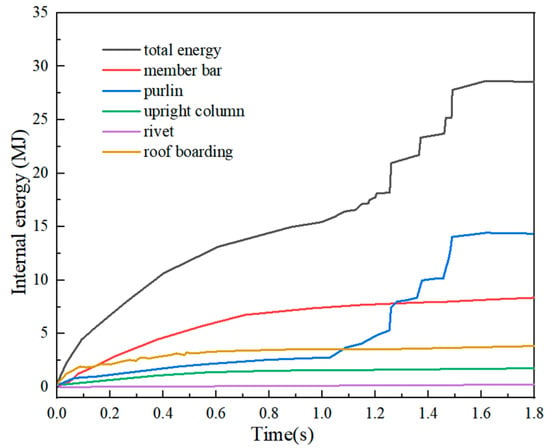
Figure 35.
Internal energy (Example 4-4).
5. Conclusions
This study investigated the influence of different materials on the impact of dynamic responses of spherical net shells. The main conclusions and research results are summarized as follows.
- (1)
- A numerical analysis method for evaluating the impact resistance of shell structures was proposed, utilizing the ABAQUS software and considering the K8 shell numerical analysis model with the purlin roof system. The proposed method was applied to simulate shell impact tests numerically, and the accuracy of different constitutive models was evaluated. The results indicated that the MJ-C constitutive model exhibited the highest prediction accuracy, while the J-C and C-S constitutive models performed less accurately.
- (2)
- The analysis revealed that the C-S constitutive model predicted a higher occurrence of an overall collapse of the net shell under vertex shock compared to the J-C, MJ-C, and MxJ-C constitutive models. Additionally, the C-S constitutive model provided a better prediction of the degree of net shell failure. The MJ-C and MxJ-C constitutive models accurately predicted the failure mode of the net shell, while the MxJ-C constitutive model indicated an earlier occurrence of instantaneous break-mode destruction than the J-C constitutive model. Based on the analysis of typical examples, it was observed that the C-S constitutive model predicted more significant impacts, higher shell energy, more considerable deformation, and a higher proportion of overall collapse. Therefore, the application of the C-S constitutive model is discouraged in scenarios with high impact intensity, while the MJ-C and MxJ-C constitutive models were recommended for numerical simulations of net shell impact resistance.
- (3)
- A comparison of the impact failure mode distributions of Q235B, Q355B, and Q460D steel revealed that, at lower impact momentums, when the structural steels Q235B and Q355B yielded percentages of 21.1% and 17.8%, respectively, the impact did not penetrate the net shell. The higher yield strength of the steel led to more significant damage. In the case of instantaneous burst shell, the respective proportions for Q235B, Q355B, and Q460D steels were 7.8%, 10%, and 12.2%. When the impact momentum was high, there was sufficient energy to penetrate the net shell instantaneously, and improving the yield strength of the steel did not reduce the degree of net shell damage.
- (4)
- Analysis of the impact dynamic response parameters of Q235B, Q355B, and Q460D steel mesh shells revealed the following law attributed to the influence of the material on the impact failure mode of the mesh shell structure. The higher the yield strength of the mesh shell steel, the enhanced its capacity to withstand ultimate stress. When the impact material possessed sufficient energy to instantly penetrate the mesh shell, improving the yield strength of the mesh shell steel did not reduce the damage degree. Furthermore, based on the analysis of typical examples, it was observed that the higher yield strength of the mesh shell steel resulted in a longer penetration time, increased absorption of impact energy by the mesh shell, and a higher number of hollow rings in the net shell structure.
- (5)
- Under the action of vertex impact, the proportion of the overall collapse of the net case constructed with the 6061-T6 aluminum alloy was higher than that of the Q235B steel. Moreover, the net case constructed with the 6061-T6 aluminum alloy experienced an instant fracture and punching damage earlier than that of the Q235B steel. The analysis of typical examples unveiled that because the 6061-T6 aluminum alloy was brittle material, there was no evident yield stage and strengthening stage, with the strain rate effect being less pronounced than that of the Q235B steel. Under the same impact action, the 6061-T6 aluminum alloy mesh shell was more prone to fracture than the Q235B steel, and breaking-through type damage and punching damage manifesting at earlier stages.
In this study, the influence of the material on the impact dynamic response of the spherical mesh shell was explored, and other types of mesh shells can be studied in the future. In addition, the loading mode of the mesh shell can be a single impact of the vertex, and future investigations can focus on the impact dynamic response of different materials during the multi-point continuous impact scenarios, such as those encountered in aircraft impacts.
Author Contributions
Conceptualization, Y.S.; methodology, L.L.; software, T.X.; validation, Y.S. and P.T.; formal analysis, Y.S.; investigation, P.T.; resources, L.L.; data curation, Y.S.; writing—original draft preparation, Y.S.; writing—review and editing, Y.S.; visualization, T.X.; supervision, T.X.; project administration, L.L.; funding acquisition, Y.S. All authors have read and agreed to the published version of the manuscript.
Funding
This project is funded by the key R & D guidance project of Heilongjiang Province “Tengyi Health City Key Project Excellence Key Technology Research and Development” (GZ20210046) and the Natural Science Foundation of Heilongjiang Province “Research on failure Mode and Mechanism of web Structure under the Impact of Aircraft” (E201438) and The APC was funded by [Harbin Institute of Technology].
Data Availability Statement
Data used to support the findings of this study are also included in this article.
Acknowledgments
The authors are very grateful to the editors and all anonymous reviewers for their insightful comments.
Conflicts of Interest
The authors declare that there are no conflict of interest.
References
- Shon, S.-D.; Lee, S.-J.; Lee, D.-W.; Kim, S.-D. Unstable Behaviour and Critical Buckling Load of Framed Large Spatial Structures in accordance with the Variation of Joint Rigidity. J. Korean Assoc. Spat. Struct. 2014, 14, 47–56. [Google Scholar] [CrossRef]
- Han, R.; Yin, T.Y.; Yang, X.D.; Zhang, Y.S.; Ju, J.S. Study on progressive collapse resistance of single-layer reticulated shells. J. Phys. Conf. Ser. 2021, 1777, 012037. [Google Scholar] [CrossRef]
- Ge, H.-B.; Wan, H.-P.; Zheng, Y.; Luo, Y. Experimental and numerical study on stability behavior of reticulated shell composed of plate members. J. Constr. Steel Res. 2020, 171, 106102. [Google Scholar] [CrossRef]
- Wu, C.; Wang, X.L.; Liang, Y.X.; Yin, Z.Z. Dynamic Response of Reticulated Domes under the Impact. Appl. Mech. Mater. 2014, 638–640, 58–61. [Google Scholar] [CrossRef]
- Zheng, L.; Chen, Z.H. Finite Element Analysis of a Single-Layer Reticulated Dome under Impact Loading. Adv. Mater. Res. 2010, 163–167, 327–331. [Google Scholar] [CrossRef]
- Zhou, Z.; Wang, Y.; Zhang, S.; Dimitri, R.; Tornabene, F.; Asemi, K. Numerical Study on the Buckling Behavior of FG Porous Spherical Caps Reinforced by Graphene Platelets. Nanomaterials 2023, 13, 1205. [Google Scholar] [CrossRef] [PubMed]
- Khatounabadi, M.; Jafari, M.; Asemi, K. Low-velocity impact analysis of functionally graded porous circular plate reinforced with graphene platelets. Waves Random Complex Media 2022, 1–27. [Google Scholar] [CrossRef]
- Xu, T.; Lin, L.; Zhi, X.; Fan, F. Experimental study on the impact resistance of single-layer spherical reticulated shell roof panels. Structures 2022, 45, 23–38. [Google Scholar] [CrossRef]
- Ruan, H.; Gao, Z.; Yu, T. Crushing of thin-walled spheres and sphere arrays. Int. J. Mech. Sci. 2005, 48, 117–133. [Google Scholar] [CrossRef]
- Yu, Z.; Liu, K.; Zhou, X.; Jing, L. Low-velocity impact response of aluminum alloy corrugated sandwich beams used for high-speed trains. Thin-Walled Struct. 2023, 183, 110375. [Google Scholar] [CrossRef]
- Ding, X.; Xiao, M.; Liu, W.; Liu, X.; Chen, Y.; Zhou, H.; Zhao, C.; Yang, L.; Song, Y. Macro–Micro–Nonuniform Deformation Behavior of 7B52 Laminated Aluminum Alloy under High-Speed Impact. J. Mater. Eng. Perform. 2022, 32, 1508–1514. [Google Scholar] [CrossRef]
- Xiao, X.; Zhang, W.; Wei, G.; Mu, Z.; Guo, Z. Experimental and numerical investigation on the deformation and failure behavior in the Taylor test. Mater. Des. 2011, 32, 2663–2674. [Google Scholar] [CrossRef]
- Xiao, X.; Zhang, W.; Wei, G.; Mu, Z. Effect of projectile hardness on deformation and fracture behavior in the Taylor impact test. Mater. Des. 2010, 31, 4913–4920. [Google Scholar] [CrossRef]
- Wang, Y.; Chen, X.; Xiao, X.; Vershinin, V.V.; Ge, R.; Li, D.-S. Effect of Lode angle incorporation into a fracture criterion in predicting the ballistic resistance of 2024-T351 aluminum alloy plates struck by cylindrical projectiles with different nose shapes. Int. J. Impact Eng. 2020, 139, 103498. [Google Scholar] [CrossRef]
- Asemi, K.; Salami, S.J. A study on low velocity impact response of FGM rectangular plates with 3D elasticity based graded finite element modeling. J. Theor. Appl. Mech. 2015, 53, 859–872. [Google Scholar] [CrossRef]
- Zafarmand, H.; Salehi, M.; Asemi, K. Three dimensional Free Vibration and Transient Analysis of Two Directional Functionally Graded Thick Cylindrical Panels Under Impact Loading. Lat. Am. J. Solids Struct. 2015, 12, 205–225. [Google Scholar] [CrossRef]
- Deng, Y.; Zhang, Y.; Xiao, X.; Hu, A.; Wu, H.; Xiong, J. Experimental and numerical study on the ballistic impact behavior of 6061-T651 aluminum alloy thick plates against blunt-nosed projectiles. Int. J. Impact Eng. 2020, 144, 103659. [Google Scholar] [CrossRef]
- Lin, L.; Huang, B.; Sun, Y.; Zhu, Y.; Wang, D. Dynamic Response of a Single-Layer Reticulated Dome during Aircraft Impact Based on S-J Modeling Method. Shock Vib. 2019, 2019, 9056810. [Google Scholar] [CrossRef]
- Gupta, N.; Sheriff, N.M.; Velmurugan, R. Experimental and numerical investigations into collapse behaviour of thin spherical shells under drop hammer impact. Int. J. Solids Struct. 2007, 44, 3136–3155. [Google Scholar] [CrossRef]
- Gupta, N.; Sheriff, N.M.; Velmurugan, R. Analysis of collapse behaviour of combined geometry metallic shells under axial impact. Int. J. Impact Eng. 2008, 35, 731–741. [Google Scholar] [CrossRef]
- Qi, H.; Wang, X.R.; Huang, Z.Y.; Dai, X.Y.; Zhuang, J.Z. Parametric modeling program of single-layer spherical reticulated shell structure and prediction program of global stability ultimate bearing capacity. J. Phys. Conf. Ser. 2021, 1777, 012034. [Google Scholar] [CrossRef]
- Zhai, X.; Wang, Y.; Sun, Z. Damage model and damage assessment for single-layer reticulated domes under exterior blast load. Mech. Based Des. Struct. Mach. 2019, 47, 319–338. [Google Scholar] [CrossRef]
- Du, W.F.; Yu, F.D.; Zhou, Z.Y. Dynamic Stability Analysis of K8 Single-Layer Latticed Shell Structures Suffered from Earthquakes. Appl. Mech. Mater. 2011, 94–96, 52–56. [Google Scholar] [CrossRef]
- Liu, H.; Li, F.; Yuan, H.; Ai, D.; Xu, C. A Spiral Single-Layer Reticulated Shell Structure: Imperfection and Damage Tolerance Analysis and Stability Capacity Formulation for Conceptual Design. Buildings 2021, 11, 280. [Google Scholar] [CrossRef]
- Liu, X.; Zhang, P.; Jia, Z.; Chen, Y.; Li, S.; Wang, R. High-Speed Videogrammetry for Seismic Performance of the Spherical Reticulated Shell Structure on the Shaking Table. Buildings 2023, 13, 553. [Google Scholar] [CrossRef]
- He, S.; Huang, X.; Yu, P.; Yun, W. The Investigation on Static Stability Analysis for Reticulated Shell with Initial Defect Value Using Stochastic Defect Mode Method. Buildings 2022, 12, 615. [Google Scholar] [CrossRef]
- Alves, M. Material Constitutive Law for Large Strains and Strain Rates. J. Eng. Mech. 2000, 126, 215–218. [Google Scholar] [CrossRef]
- Huang, Z.; Gao, L.; Wang, Y.; Wang, F. Determination of the Johnson-Cook Constitutive Model Parameters of Materials by Cluster Global Optimization Algorithm. J. Mater. Eng. Perform. 2016, 25, 4099–4107. [Google Scholar] [CrossRef]
- Lin, L.; Sun, Y.H.; Huang, M.Y.; Li, J.; Song, X.Q.; Duan, Z.X.; Huang, X.F. FE model of reticulated dome under impact based on the MJ-C. In Proceedings of the 2016 5th International Conference on Civil, Architectural and Hydraulic Engineering (ICCAHE 2016), Zhuhai, China, 30–31 July 2016; Atlantis Press: Amsterdam, The Netherlands, 2016. [Google Scholar]
- Hu, J.; Lu, G.; Yang, H.; Yu, T.; Xu, J. Dynamic response of internally nested hemispherical shell system to impact loading. Thin-Walled Struct. 2017, 120, 29–37. [Google Scholar] [CrossRef]
- Fan, F.; Wang, D.; Zhi, X.; Shen, S. Failure modes of reticulated domes subjected to impact and the judgment. Thin-Walled Struct. 2010, 48, 143–149. [Google Scholar] [CrossRef]
- Wang, D.; Zhi, X.; Fan, F.; Lin, L. The energy-based failure mechanism of reticulated domes subjected to impact. Thin-Walled Struct. 2017, 119, 356–370. [Google Scholar] [CrossRef]
- Wang, S.; Li, W.; Wang, X.; Ai, R.; Yang, Q.; Shan, Z. Impact tensile cracking behavior of oxide scale in Q235 strip iron. MATEC Web Conf. 2018, 189, 08002. [Google Scholar] [CrossRef]
- Wang, Y.; Lin, Y.; Shi, Y. Research on Impact Toughness of Q460C High-Strength Steel at Low Temperature. In Proceedings of the Twelfth International Symposium on Structural Engineering, Beijing, China, 17 November 2012; Zhu, H., Huang, B., Ru, J., Eds.; Science Press: Beijing, China, 2012; Volume I, pp. 316–320. [Google Scholar]
- Singh, R.K.; Guraja, S.; Ajide, O.; Owolabi, G.; Kumar, N. Investigation of initial metallurgical factors on the dynamic impact response and adiabatic shear bands formation of the 6061 Al alloy. Mater. Sci. Eng. A 2023, 865, 144636. [Google Scholar] [CrossRef]
- Kosedag, E.; Ekici, R. Low-velocity impact performance of B4C particle-reinforced Al 6061 metal matrix composites. Mater. Res. Express 2019, 6, 126556. [Google Scholar] [CrossRef]
- Fan, F.; Wang, D.; Zhi, X.; Shen, S. Failure modes for single-layer reticulated domes under impact loads. Trans. Tianjin Univ. 2008, 14, 545–550. [Google Scholar] [CrossRef]
- Wu, C.; Yang, Y.; Gou, B.; Wu, J. Research on a multi-point impact test of single-layer spherical reticulated shell. J. Constr. Steel Res. 2021, 186, 106897. [Google Scholar] [CrossRef]
- Lin, L.; Fan, F.; Zhi, X.; Yin, H. Size Effect and Material Property Effect of the Impactor on the Damage Modes of the Single-Layer Kiewitt-8 Reticulated Dome. Sci. World J. 2013, 2013, 848347. [Google Scholar] [CrossRef]
- Paul, S.K. Predicting the flow behavior of metals under different strain rate and temperature through phenomenological modeling. Comput. Mater. Sci. 2012, 65, 91–99. [Google Scholar] [CrossRef]
Disclaimer/Publisher’s Note: The statements, opinions and data contained in all publications are solely those of the individual author(s) and contributor(s) and not of MDPI and/or the editor(s). MDPI and/or the editor(s) disclaim responsibility for any injury to people or property resulting from any ideas, methods, instructions or products referred to in the content. |
© 2023 by the authors. Licensee MDPI, Basel, Switzerland. This article is an open access article distributed under the terms and conditions of the Creative Commons Attribution (CC BY) license (https://creativecommons.org/licenses/by/4.0/).