Article

Ground and Pile Vibrations Induced by Pile Driving

1
Key Laboratory of Far-Shore Wind Power Technology of Zhejiang Province, Hangzhou 311122, China
2
State Key Laboratory of Hydraulic Engineering Simulation and Safety, Tianjin University, Tianjin 300072, China
*
Author to whom correspondence should be addressed.
Buildings 2023, 13(8), 1884; https://doi.org/10.3390/buildings13081884
Submission received: 8 June 2023 / Revised: 2 July 2023 / Accepted: 11 July 2023 / Published: 25 July 2023
(This article belongs to the Section Building Structures)

Abstract

:
Pile driving in marine engineering causes a vibration response in the surrounding soil and adjacent piles, which may affect the safety of adjacent structures supported by the pile foundation and the internal equipment of the adjacent structures. Therefore, for the safe completion of a project, it is of great significance to study the ground and the pile vibrations induced by pile driving. Based on measurement data from a Rudong wind farm engineering in Jiangsu Province, a numerical model of the vibration response induced by pile driving was established. Based on various methods of calculating pile driving loading, the influence of pile driving loading characteristics on the vibration response was analyzed. Furthermore, the influence of pile driving on the acceleration of the ground and adjacent piles was studied, including the impacts of the distance between the driving pile, the existing pile and the driving depth. The results show that the acceleration of the ground has a good linear relationship with the distance in the logarithmic coordinate system, and the acceleration of the existing pile attenuates with an increasing driving depth of the driving pile. A simplified evaluation method for the peak acceleration response of adjacent sites impacted by pile driving was proposed, which provides a reference for ocean engineering construction in the Huangsha Ocean area of China.

1. Introduction

Piles are a type of foundation that are widely used in engineering. They can be divided into driving piles and grouting piles according to the construction type. Driving piles have the advantage of shortening the construction period compared with grouting piles. This advantage mitigates the problem of the short window of the construction period in ocean engineering, and driving piles are therefore widely used in ocean engineering. However, in marine engineering, pile driving causes a vibration response in the surrounding soil and adjacent piles, which may affect the safety of adjacent structures supported by the pile foundation and the internal equipment of the adjacent structures [1,2,3]. For example, pile driving for an auxiliary platform in the engineering of a marine converter station at the Rudong Offshore Wind Farm in Jiangsu Province, China (shown in Figure 1) may cause an obvious vibration response in the marine converter station. Therefore, the influence of pile driving on the surrounding soil and adjacent piles is key in the study of the pile–soil dynamic response.
Vibration is an important field that has been widely studied by scholars in civil engineering [4,5]. In studies of vibration, the research on vibration induced by pile driving mainly comprises three aspects: model or prototype tests [6,7,8], theoretical analyses [9,10], and numerical simulations [11,12,13,14]. Early studies mainly focused on model (prototype) tests and theoretical analyses. Bement and Selby [6] performed model tests on the settlement of soil around piles induced by pile driving and found that saturated soil is more prone to vertical settlement than dry soil and unsaturated soil. On this basis, Hwang [15] analyzed the influence of pile driving on surrounding soil vibration through a large number of field tests and noted the correlation between pile driving forces and soil types. In [16], meanwhile, a series of centrifuge model tests was performed to study the development of pile stress under different pile-driving construction conditions, and it was found that the vibration induced by pile driving significantly decreased the lateral soil stress around the pile, which was similar to results from the study by Klotz [17]. Based on field tests of soil vibration induced by pile driving, Fang [18] studied the propagation and attenuation of vibration and proposed an empirical formula for the amplitude of a vibration in the surrounding soil that is induced via pile driving. Through theoretical analysis studies, Jongmans [9] proposed a linear oscillator calculation method for determining the influence of the surrounding soil vibration induced by pile driving on the supposition of the lateral stratum structure. Based on wave theory and pile–soil dynamic characteristics, Massarsch and Fellenius [10] analyzed the influences of single parameters such as the pile buried depth, pile resistance, and pile–soil dynamic damping on the surrounding soil vibration induced by pile driving.
With the increasing complexity of engineering, more studies on the influence of pile driving on surrounding soil and adjacent structures were conducted via numerical simulations. White [11], Degrande [19], and Hanazato [12] performed early explorations of numerical models for analyses of soil dynamic characteristics that simulated the soil vibration induced by pile driving via the incident wave weighting method, absorption boundary method, and simulation method by setting a thin soil layer around piles. Based on FLAC3D, Wei et al. [20] established a numerical model to predict the vibration influence radius of vibratory pile driving. Based on PLAXIS, Noori [21] found that the peak vibration velocity of the soil around piles attenuates exponentially with distance. To study the influence of pile driving on adjacent structures, Wu [22] and Yang [23] analyzed the influence of pile driving on the settlement of adjacent buildings via numerical simulation and model tests. Based on a large deformation numerical model and a numerical model with an elastomer artificial boundary, Jiang [24] and Chen [25] conducted a quantitative analysis on the vibrations of the surrounding soil and adjacent buildings induced by pile driving and the beneficial effect of vibration isolation ditches. Colaco et al. [26] proposed an axisymmetric FEM-PML model to simulate the hammer-pile-ground-building system. It was found that the building’s dynamic characteristics and the distance from the building to the vibration source are two key factors to study the building vibration induced by pile driving.
The above analysis showed that the vibration response was significantly affected by the soil properties and site area, and the difference in soil properties made the vibration response regularity have poor applicability. In addition, most of the existing studies focused on land engineering, which means that the applicability remains to be studied under the action of offshore pile driving. In recent years, with the vigorous development of offshore wind power in China, the vibration induced by pile driving on the surrounding soil and structure has become an important research topic. Based on measurement data from Rudong wind farm engineering in Jiangsu Province, this paper analyzed the influence of offshore pile driving on the surrounding soil and adjacent piles of a jacket platform and studied the influence of different modes of pile loading on the vibration response. The influence of vibration induced by pile driving on the acceleration response of the surrounding soil and adjacent piles was analyzed, and a simplified evaluation method for the peak value of the acceleration response of the surrounding soil was proposed, which provides a reference for ocean engineering construction in the Huangsha Ocean area of China.

2. Numerical Analysis Method

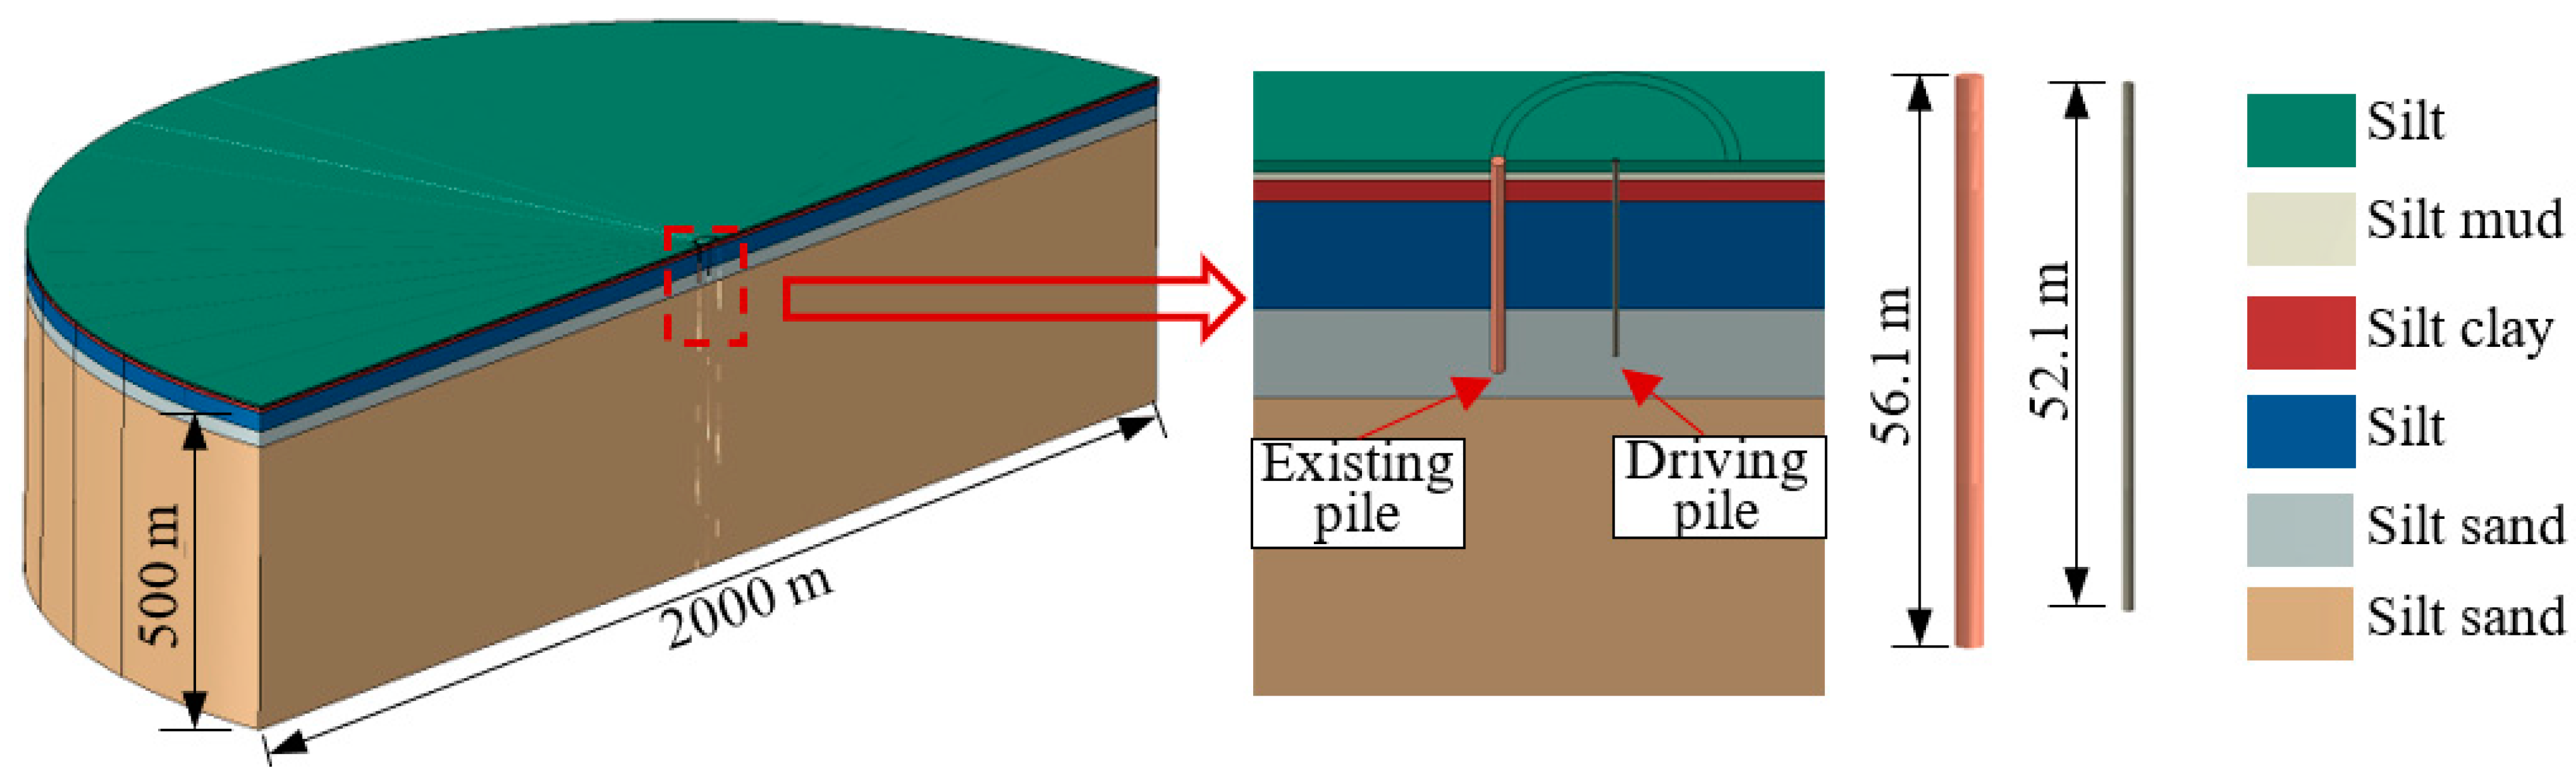
2.1. Numerical Model

The numerical model of vibration of surrounding soil and adjacent piles induced by pile driving, including soil, the driving pile and the existing pile was established via ABAQUS. The driving pile was located in the center of the soil, as shown in Figure 2.
Stress waves of soil induced by pile driving experience wave reflection at the boundary of the soil model. Wave reflection has a great influence on the accuracy of the simulation results. Therefore, the dimension of the soil model should be expanded as much as possible to eliminate the boundary effect. Hence, considering calculation efficiency and the boundary effect, the soil model was set with a diameter of D = 2000 m and a height of H = 500 m (shown in Figure 2). The mesh of the soil model was the solid element C3D8R, the constitutive model of the soil model was the Mohr–Coulomb model, and the damping of the soil was considered by Rayleigh damping. Noori [21] proved that the Mohr–Coulomb model is feasible for simulating vibrations of piles driving in clay. The lateral boundary of the soil model was set as the lateral constraint, and the bottom boundary was set as the full constraint.
Meshes of the driving pile and the existing pile were solid elements C3D8R for the consideration of model meshing and computational convergence, as shown in Figure 2. The soil surrounding the existing pile and the driving pile was grid encrypted. The mesh number of the soil model was 130,000, the mesh number of the driving pile model was 2600, and the mesh number of the existing pile model was 8400. The density and elastic modulus of the piles were determined by equivalence. The pile–soil contact was set as friction contact. The friction coefficient was 0.35. The reference point was coupled in the center of the pile upper surface.
Before the analysis of vibration, the geostatic step was conducted. The analysis step of vibration was a dynamic implicit analysis step, and simple harmonic loading was applied at the reference point by the loading control method. In the vibration analysis step, the part of the soil that overlaps with the pile was “model changed”.

2.2. Numerical Simulation Validation

(1)
Introduction of field measurement
The results of the numerical simulation were verified by the measurement data of the marine converter station engineering in Rudong Offshore Wind Farm, as shown in Figure 1. The lateral distance between the existing piles of the adjacent jacket platform and the driving pile foundation of the auxiliary platform was between 22.5 m and 136.1 m. The parameters of the existing piles and driving piles are shown in Table 1. The piles of the auxiliary platform had a length of 83.6 m and a burial depth of 52.36 m. During installation, the pile penetrated 10 m under its own gravity. In the initial stage of pile driving, the pile was driven into 10 m under a hammer energy of 234 kJ. Then, the pile was driven into the design buried depth under a hammer energy of 600 kJ.
The project was performed in the Rudong Sea area, and the geology of the project area belongs to the coastal facies sedimentary geomorphic unit of the Yellow Sea. The project site was approximately 50 km offshore. The elevation of the seabed at the site was between −16.00 m and −17.00 m, and the terrain was relatively gentle. The soil layers at the site were mainly silty mud, silt and silty sand. The depth of the geological survey was 100 m and there were six soil layers. The physical and mechanical parameters of the undisturbed soil obtained by drilling were determined by geotechnical tests, as shown in Table 2.
Before the initial stage of pile driving, acceleration sensors were arranged on site. The distances between the acceleration measurement points and the pile were 22.5 m, 45.0 m and 85.3 m, respectively. During the process of pile driving of the auxiliary platform, real-time monitoring of the acceleration was conducted. The monitoring data were selected in the case in which the vibration source was only pile driving. The monitoring duration was 1 h, and the measured data are shown in Figure 3.
Peak accelerations in the x direction (A1), y direction (A2) and z direction (A3) were obtained from Figure 3, as shown in Table 3. In the subsequent analysis, the larger peak acceleration (AL) in the x and y directions was taken as the lateral acceleration, and the peak acceleration (AV) in the z direction was taken as the vertical acceleration.
(2)
Numerical model validation
For the convergence of the numerical simulation, the model piles were established as solid piles. The parameters of the model piles were equivalent to the parameters of the prototype piles, as shown in Table 4.
To eliminate the boundary limit of the soil bottom, the thickness of the No. 6 soil (shown in Table 2) was set at 436 m, as shown in Figure 2, to make the total thickness of the soil model (H) 500 m, which was six times the length of the driving pile. The damping ratio of soil ε was empirically selected as 0.05 in the numerical model.
The lateral acceleration (AL) and the vertical acceleration (AV) of the existing pile are shown in Figure 4.
Peak accelerations of the simulation results are obtained in Figure 4. The comparison between the measured data of the marine converter station engineering in the Rudong Offshore Wind Farm (Figure 3) and the simulation results with different distances (s) are shown in Figure 5.
Figure 5 shows that the simulation results had good agreement with the measured data of marine converter station engineering, which verifies the rationality of the numerical simulation. It should be noted that the average differences between the simulation results and the measured data were within 20%, which was caused by the simplification of parameters in the numerical simulation and measured errors in the field. However, for a dynamic problem, this gap is considered acceptable.

3. Vibration of the Surrounding Soil Induced by Pile Driving

3.1. Influence of Pile Driving Loading Characteristics

(1)
Pile driving loading
Studies of driving loading of the existing pile can be summarized as the hammer–pile direct collision method and hammer–pile indirect collision method. In the direct collision method, the influence of the capblock between the hammer and the pile was not considered. The pile was regarded as a one-dimensional slender rod, and the collision loading between the hammer and the pile was studied by one-dimensional wave theory. The collision stress at the pile head was as follows [27]:
σ = 2 E z ρ z g H max 1 + A z E z ρ z / A c E c ρ c
In Formula (1), Ez is the elastic modulus of the pile, ρz is the density of the pile, Az is the sectional area of the pile, Ec is the elastic modulus of the hammer, ρc is the density of the hammer, Ac is the sectional area of the hammer, and Hmax is the maximum driving height of the hammer.
Hammer–pile indirect collision methods have been extensively studied. Deeks and Randolph [28], Take [29] and Zhu [30] successively established the hammer collision system considering the effects of the pile hammer and capblock. Based on previous studies, Gu [31] proposed the modified indirect collision method. When the hammer collides on the pile head at the speed of Vh, the collision loading can be expressed as follows [31]:
F t = k V h ω d e ξ ω t sin ω d t
ω d = ω 1 ξ 2
ω = k m
ξ = k c 2 ω E A
where Vh is the collision velocity of the pile hammer on the pile head, k is the spring stiffness coefficient of the capblock, EA is the compressive stiffness of the pile, c is the stress wave propagating velocity in the pile, and m is the mass of the collision block.
We take the variable diameter steel pile with a length of 84.9 m, a diameter of 1.25 m and a thickness of 24–32 mm (shown in Table 1) as an example. For the pile driving energy of 234 kJ, the maximum collision loading of the direct collision method was calculated by Formula (1), and the maximum collision loading of the indirect collision method was calculated by Formulas (2)–(5). The results were compared with the calculation results obtained by GRLWEAP, as shown in Table 5. The maximum collision loading obtained by GRLWEAP was achieved by the maximum collision loading of the pile head output by the pile driving ability analysis.
Table 5 shows that the maximum collision loads calculated by different methods were the same order of magnitude, but the maximum collision forces calculated by the theoretical method were smaller. There were two main factors that caused the difference: the first was that the theoretical method ignores the influence of the surrounding soil; the second was that the spring stiffness coefficient of cap block k in indirect collision method was set as the value of the pile spring stiffness. The maximum collision force calculated by GRLWEAP was close to the measured engineering data, which was used in the following simulation.
(2)
Influence of loading distribution
According to the existing studies, the distribution of collision loading had various forms as shown in Figure 6. This paper takes triangular and rectangular distributions of collision loading as examples (Figure 6b,d) to study the influence of the distribution of collision loading on the vibration response. The peak collision loading was determined via data shown in Table 5. Both collision loadings of the triangular distribution and the rectangular distribution were Fmax = 15.9 MN. The loading time was determined by the impulse value. The loading time of the rectangular distribution was 0.006 s, and that of the triangular distribution was 0.012 s.
Acceleration time history curves of the ground with distances of 10d, 20d, 50d, 100d and 150d (d is the pile diameter, which is 1.25 m) away from the driving pile were obtained. The results of rectangular collision loading are shown in Figure 7. In Figure 7, A1, A2 and A3 represent the acceleration in the x, y, and z directions, respectively.
Figure 7 shows that compared with the acceleration in the x and z directions, the acceleration response in the y direction was not obvious. The acceleration in all directions decreased with increasing distance. When the distance increased from 10d to 150d, the acceleration decreased by two orders of magnitude.
The acceleration time history curves of the free field under triangular collision loading are shown in Figure 8.
Figure 8 shows that time history curves of acceleration in the free field under triangular collision loading were the same as those under rectangular collision loading. That is, compared with the acceleration in the x and z directions, the acceleration response in the y direction was not obvious. The acceleration in all directions decreased with increasing distance.
A comparison of the calculation results between rectangular loading and triangular loading is shown in Figure 9. To more clearly show the change in peak acceleration with distance, Figure 9 adopts a logarithmic coordinate system.
Figure 9 shows that at the same position, the peak acceleration induced by pile driving under triangular loading was basically equal to that under rectangular loading. This indicated that the loading distribution had little influence on the acceleration response of the free field.
(3)
Influence of loading time
The peak acceleration and loading time of the impact load vary with the pile driving energy, the size of the hammer and pile and the soil parameters. Taking rectangular loading as an example, the influence of loading time on the acceleration response induced by pile driving was studied by keeping the impulse unchanged and changing Fmax and t. The results in conditions of t = 0.002 s, 0.006 s, 0.03 s, 0.15 s, 0.6 s and 0.68 s were calculated. The acceleration time history curves of the ground with a distance of 10d away from the driving pile are shown in Figure 10.
Figure 10 shows that as the rectangular loading time increases (Fmax decreases), accelerations of the free field showed an obvious decreasing trend. Peak accelerations under different conditions were obtained, as shown in Figure 11, to analyze the influence of loading time.
Figure 11 shows that the peak acceleration decreased with the increase in loading time. When t increased from 0.002 s to 0.68 s, the acceleration decreased to 12–25% of the maximum value. The acceleration attenuation rate gradually decreased with an increase in loading time. The acceleration in the x direction (A1) decreased with time more significantly than the acceleration in the z direction (A3). This indicated that the peak acceleration and loading time of rectangular loading had a significant effect on lateral acceleration.

3.2. Influence of Distance between Driving Piles and Existing Piles

Results under distances between driving piles and existing piles of s = 10d, 20d, 50d, 100d and 150d (d is the driving pile diameter, which is 1.25 m) were calculated. The influence of the distance (s) between the driving piles and existing piles on the time history curves of acceleration in the free field was analyzed, as shown in Figure 12.
Figure 12 shows that the acceleration of the free field in the x, y and z directions decreased with the increase in distance between the driving piles and the existing piles, and the acceleration attenuation rate increased significantly with the increase in distance. Taking t = 0.006 s and 0.6 s as examples, the changes in the lateral and vertical acceleration of the free field with distance were given in the logarithmic coordinate system, as shown in Figure 13.
Figure 13 shows that the accelerations of the free field had a good linear relationship with the distance in the logarithmic coordinate system. This indicated that the acceleration of the free field increased as a power function with distance. The relationship was expressed as follows:
a = β x b
In Formula (6), a is the acceleration of the free field, x is the distance between the calculating point and the driving pile, β and b are the empirical coefficients, and the value range of b is [−1.5, −2.0]. Therefore, the peak acceleration of free field induced by pile driving can be expressed as a power function with a negative index, where the value of the index ranges from −1.5 to −2.0.

4. Influence of Pile Driving on Adjacent Existing Piles

4.1. Influence of Distance between Driving Piles and Existing Piles

Numerical models, as shown in Figure 2, were established to study the influence of the distance between driving piles and existing piles. In the numerical models, distances were 10d, 20d, 50d, 100d and 150d (d is the pile diameter, which is 1.25 m). Time history curves of acceleration of existing piles in the x and z directions with different distances are shown in Figure 14.
Figure 14 shows that as the distance between the existing pile and driving pile increased, the acceleration of the existing pile had an obvious decreasing trend. According to Figure 14, the peak acceleration in the x and z directions can be obtained. The relationship between the peak acceleration and the distance is shown in Figure 15.
Figure 15 shows that within the range of diameters of 20d (25 m) from the driving pile, the peak acceleration of the existing pile decreased significantly, especially the lateral acceleration. With a further increase in the distance between the existing pile and the driving pile, the peak acceleration still decreased, but the attenuation rate tended to be gentle. Compared with the acceleration response of the free field (shown in Figure 12), the following two differences were found: the difference between the lateral and vertical peak accelerations of the existing pile was less than that of the free field; in the range of 20d to further distances, the acceleration of the existing pile decreased linearly with distance.

4.2. Influence of Buried Depth

Pile driving is a process of gradually driving toward the buried depth. Therefore, the accelerations of the existing pile under different driving depths of the driving pile, which were 20 m, 30 m, 40 m and 50 m, were studied. Taking lateral acceleration as an example, the influence of the driving depth of the driving pile on the acceleration of the existing pile was analyzed, as shown in Figure 16.
Figure 16 shows that both the pile driving depth and the distance between the existing pile and driving pile influenced the acceleration of the existing pile. The larger the driving depth of the driving pile, the smaller the acceleration of the existing pile. The closer the distance between the driving pile and the existing pile, the greater the difference in the acceleration of the existing pile. Therefore, the influence of the pile driving depth on the pile vibration was more obvious when the distance between the pile driving and the existing pile was relatively closer.

5. Conclusions

Based on measurement data from Rudong wind farm engineering in Jiangsu Province, this study focused on the influence of pile driving on the vibration response of surrounding soil and adjacent existing piles. Specific conclusions and discussions were as follows.
(1) Both triangular and rectangular distributions of driving loading can be used to simulate pile driving. The distribution of driving loading had little influence on the acceleration of the free field induced by pile driving.
(2) The peak acceleration decreased with the increase in loading time under the same impulse. When the loading time increased from 0.002 s to 0.68 s, the acceleration decreased to 12–25% of the maximum value. The acceleration attenuation rate gradually decreased with the increase in loading time. The acceleration in the lateral direction with loading time decreased more significantly than the acceleration in the vertical direction. The acceleration of the free field decreased with the increase in distance between the driving piles and existing piles and had a good linear relationship with the distance in the logarithmic coordinate system. A simplified evaluation method for the peak acceleration response of adjacent sites impacted by the pile driving was proposed, which provided a reference for ocean engineering construction in the Huangsha Ocean area of China.
(3) The peak acceleration of the existing pile gradually decreased with the increase in the distance between the existing pile and the driving pile. When the distance was larger than 20d, the acceleration was approximately linear with the distance. The influence regularity of the pile driving depth was that the smaller the driving depth of the driving pile was, the more intense the acceleration response of the existing pile became.
In this paper, a numerical model was established based on the measured data of a specific engineering project. The study of the influence on the vibration can be referenced to a certain extent. However, this should be checked when the study is applied to other ocean engineering applications. In addition, it should be noted that the peak acceleration estimation method described in Formula (1) is applicable for distances of more than 10d. When the distance is less than 10d, further study is needed.

Author Contributions

Conceptualization, C.L. and R.L.; methodology, C.L. and R.L.; software, Q.L. and C.S.; validation, C.L., Q.L. and C.S.; formal analysis, C.L., Q.L. and C.S.; investigation, Q.L.; resources, Z.S.; data curation, Z.S. and H.Y.; writing—original draft preparation, C.L., Q.L. and C.S.; writing—review and editing, C.L.; visualization, C.L.; supervision, R.L.; project administration, R.L. and Z.S.; funding acquisition, R.L. and Z.S. All authors have read and agreed to the published version of the manuscript.

Funding

This research was funded by the Natural Science Foundation of Zhejiang province, China (Grant no. LQ21E090010) and the Natural Science Foundation for Distinguished Young Scholars of China (Grant No. 51825904).

Data Availability Statement

The data used to support the findings of this study are included within the article.

Conflicts of Interest

The authors declare no conflict of interest.

References

  1. Balaje, T.T. Instrumentation to measure structural response and ground vibration—A review. J. Inst. Engineers. India. Civ. Eng. Div. 2004, 85, 55–61. [Google Scholar]
  2. Bement, R.; Selby, A.R. Compaction of granular soils by uniform vibration equivalent to vibrodriving of piles. Geotech. Geol. Eng. 1997, 15, 121–143. [Google Scholar] [CrossRef]
  3. Chen, Y.M.; Ling, D.S.; Zhou, C.T. Numerical analysis and test of pile driving vibration. J. Vib. Eng. 2002, 15, 178–184. [Google Scholar]
  4. Colaco, A.; Costa, P.A.; Parente, M.A.; Cardoso, A.S. Ground-borne noise and vibrations in buildings induced by pile driving: An integrated approach. Appl. Acoust. 2021, 179, 108059. [Google Scholar] [CrossRef]
  5. Deeks, A.J.; Randolph, M.F. Analytical modelling of hammer impact for pile driving. Int. J. Numer. Anal. Methods Geomech. 2010, 17, 279–302. [Google Scholar] [CrossRef]
  6. Degrande, G.; Roeck, G.D. An absorbing boundary condition for wave propagation in saturated poroelastic media—Part I: Formulation and efficiency evaluation. Soil Dyn. Earthq. Eng. 1993, 12, 411–421. [Google Scholar] [CrossRef]
  7. Fang, H.L.; Beppu, S. Ground vibrations from pile driving and their impacts on vibration-sensitive facilities. In Proceedings of the International Seminar on Environmental Vibration 2003, Hangzhou, China, 16–18 October 2003; pp. 175–185. [Google Scholar]
  8. Ge, Y.; Liu, J.; Zhang, X.; Tang, H.; Xia, X. Automated Detection and Characterization of Cracks on Concrete Using Laser Scanning. J. Infrastruct. Syst. 2023, 29, 04023005. [Google Scholar] [CrossRef]
  9. Gu, Z.H. Study on Hammering Performance of Double-Process Hydraulic Hammer. Ph.D. Dissertation, Central South University, Changsha, China, 2014. [Google Scholar]
  10. Guinchard, M.; Cabon, M.; Charrondière, C.; Develle, K.; Fessia, P.; Lacny, L.; Osborne, J.; Scislo, L.; Wenninger, J. Investigation and Estimation of the LHC Magnet Vibrations Induced by HL-LHC Civil Engineering Activities. In Proceedings of the 9th International Particle Accelerator Conference, Vancouver, BC, Canada, 29 April–4 May 2018; p.wemf080. [Google Scholar]
  11. Guinchard, M. Source Based Measurements and Monitoring of Ground Motion Conditions during Civil Engineering Works for High Luminosity Upgrade of the LHC. In Proceedings of the 26th International Congress on Sound and Vibration, Montreal, QC, Canada, 7–11 July 2019; pp. 1–8. [Google Scholar]
  12. Hanazato, T. Ground vibrations produced during construction of pile foundations. In Proceedings of the International Seminar on Environmental Vibration 2003, Hangzhou, China, 16–18 October 2003; pp. 186–201. [Google Scholar]
  13. Hwang, J.H.; Liang, N.; Chen, C.H. Ground response during pile driving. J. Geotech. Geoenvironmental Eng. 2001, 127, 939–949. [Google Scholar] [CrossRef]
  14. Jongmans, D. Prediction of ground vibrations caused by pile driving: A new methodology. Eng. Geol. 1996, 42, 25–36. [Google Scholar] [CrossRef]
  15. Klotz, E.U.; Coop, M.R. An investigation of the effect of soil state on the capacity of driven piles in sands. Géotechnique 2001, 51, 733–751. [Google Scholar] [CrossRef]
  16. Lukpanov, R.; Tsigulyov, D.; Yenkebayev, S.; Zhantlessova, Z. Vibration monitoring as a method for assessing the pile driving-induced impact in restrained urban conditions. E3S Web Conf. 2023, 371, 02028. [Google Scholar] [CrossRef]
  17. Machacek, J.; Staubach, P.; Tafili, M.; Zachert, H.; Wichtmann, T. Investigation of three sophisticated constitutive soil models: From numerical formulations to element tests and the analysis of vibratory pile driving tests. Comput. Geotech. 2021, 138, 104276. [Google Scholar] [CrossRef]
  18. Massarsch, K.R.; Fellenius, B.H. Engineering assessment of ground vibrations caused by impact pile driving. Geotech. Eng. J. Southeast Asian Geotech. Soc. 2015, 46, 54–63. [Google Scholar]
  19. Noori, H.S.; Shirinabadi, R.; Moosavi, E.; Gholinejad, M. Effect of pile driving on ground vibration in clay soil: Numerical and experimental study. Geotech. Geol. Eng. 2022, 40, 2051–2062. [Google Scholar] [CrossRef]
  20. Novak, M.; Sheta, M. Approximate approach to contact effects of piles. Spec. Tech. Publ. Dyn. Response Pile Found. Anal. Asp. 1980, 53–79. [Google Scholar]
  21. Jiang, P.; Li, R.Q.; Kong, D.F. Numerical analysis of large deformation impact and collision properties during dynamic compaction. Chin. J. Geotech. Eng. 2000, 22, 222–226. [Google Scholar]
  22. Sofiste, T.V.; Godinho, L.; Costa, P.A.; Soares, D.; Colaço, A. Numerical modelling for prediction of ground-borne vibrations induced by pile driving. Eng. Struct. 2021, 242, 112533. [Google Scholar] [CrossRef]
  23. Staubach, P.; Machacek, J.; Skowronek, J.; Wichtmann, T. Vibratory pile driving in water-saturated sand: Back-analysis of model tests using a hydro-mechanically coupled CEL method. Soils Found. 2020, 61, 144–159. [Google Scholar] [CrossRef]
  24. Take, W.A.; Valsangkar, A.J.; Randolph, M.F. Analytical solution for pile hammer impact. Comput. Geotech. 1999, 25, 57–74. [Google Scholar] [CrossRef]
  25. Wang, S.; Zhu, Z.; Zhu, S. Monitoring and Assessment of Vibration Impact on Ultraprecision Equipment in a Hospital throughout a Whole Construction Period. J. Perform. Constr. Facil. 2023, 37, 04023021. [Google Scholar] [CrossRef]
  26. Wei, J.B.; Wang, W.D.; Wu, J.B. Numerical investigation of inside peak particle velocities for predicting the vibration influence radius of vibratory pile driving. Soil Dyn. Earthq. Eng. 2022, 153, 107103. [Google Scholar] [CrossRef]
  27. White, D.J.; Lehane, B.M. Friction fatigue on displacement piles in sand. Géotechnique 2004, 54, 645–658. [Google Scholar] [CrossRef]
  28. White, W.; Valliappan, S.; Lee, I.K. Unified boundary finite dynamic models. J. Eng. Mech. Div. 1977, 103, 949–964. [Google Scholar] [CrossRef]
  29. Wu, M.X. Analysis of the influence of pile foundation settlement of high-rise buildings on surrounding buildings. Arab. J. Geosci. 2020, 13, 822. [Google Scholar] [CrossRef]
  30. Yang, Y.; Gan, T. Research on the influence of variable stiffness levelling piles on differential settlement of high-rise buildings. IOP Conf. Ser. Mater. Sci. Eng. 2020, 829, 012025. [Google Scholar] [CrossRef]
  31. Zhu, H.H.; Xie, Y.J.; Wang, H.Z. Analytical solution for pile hammer impact and application of optimum design technique for determining cushion parameters. J. Tongji Univ. Nat. Sci. 2004, 32, 5. [Google Scholar]
Figure 1. Engineering a marine converter station at the Rudong Offshore Wind Farm.
Buildings 13 01884 g001
Figure 2. Numerical vibration model.
Buildings 13 01884 g002
Figure 3. Measurement data of acceleration. (a) Acceleration in the x/y/z direction of #1 (22.5 m); (b) Acceleration in the x/y/z direction of #2 (45.0 m); (c) Acceleration in the x/y/z direction of #3 (85.3 m).
Buildings 13 01884 g003
Figure 4. Simulation results. (a) #1 (22.5 m) (b) #2 (45.0 m) (c) #3 (86.3 m).
Buildings 13 01884 g004
Figure 5. Simulation results vs. measured data of field tests. (a) Peak lateral acceleration AL; (b) Peak vertical acceleration AV.
Buildings 13 01884 g005
Figure 6. Distribution of collision loading. (a) Staircase distribution; (b) Rectangular distribution; (c) Nonlinear distribution; (d) Triangular distribution.
Buildings 13 01884 g006
Figure 7. Acceleration time history curves of the free field under rectangular collision loading. (a) Rec—10d; (b) Rec—20d; (c) Rec—50d; (d) Rec—100d; (e) Rec—150d.
Buildings 13 01884 g007aBuildings 13 01884 g007b
Figure 8. Acceleration time history curves of the free field under triangular collision loading. (a) Tri—10d; (b) Tri—20d; (c) Tri—50d; (d) Tri—100d; (e) Tri—150d.
Buildings 13 01884 g008
Figure 9. Peak acceleration with distance under rectangular loading and triangular loading.
Buildings 13 01884 g009
Figure 10. Acceleration time history curves of the free field 10d away from the driving pile. (a) t = 0.002 s; (b) t = 0.006 s; (c) t = 0.03 s; (d) t = 0.15 s; (e) t = 0.6 s; (f) t = 0.68 s.
Buildings 13 01884 g010
Figure 11. Peak accelerations of the free field under different loading times. (a) s = 10d; (b) s = 50d; (c) s = 100d.
Buildings 13 01884 g011
Figure 12. Influence of the distance between the driving piles and existing piles. (a) t = 0.002 s; (b) t = 0.006 s; (c) t = 0.03 s; (d) t = 0.15 s; (e) t = 0.6 s (f) t = 0.68 s.
Buildings 13 01884 g012
Figure 13. Changes in the lateral and vertical acceleration of the free field with distance. (a) t = 0.006 s; (b) t = 0.6 s.
Buildings 13 01884 g013
Figure 14. Acceleration time history curves of existing piles with distance. (a) s = 10d; (b) s = 20d; (c) s = 50d; (d) s = 100d; (e) s = 150d.
Buildings 13 01884 g014aBuildings 13 01884 g014b
Figure 15. Peak accelerations of existing piles.
Buildings 13 01884 g015
Figure 16. Acceleration of the existing pile under different driving depths of the driving pile.
Buildings 13 01884 g016
Table 1. Parameters of existing piles and driving piles.
Pile TypeLength/mSegment Length/mDiameter/mThickness/mm
Driving piles of auxiliary platform84.99.51.2532
351.2528
38.91.2524
1.51.2532
Existing piles of converter station84.258.652.765
452.760
24.62.750
62.760
Table 2. Parameters of soil.
No.Soil Thickness/mPropertyUnit Weight/kN·m−3Compression Modulus/MPaInternal Friction Angle/°Cohesion/kPa
13.2Silt17.5102614
21.9Silty mud17.26.51818
35.8Silty clay17.882116
429.1Silt19.4103014
524Silty sand19.8123410
636Silty sand20.5123510
Table 3. Peak acceleration measured by field test.
No.DistancePeak Acceleration/m·s−2Peak Acceleration/m·s−2
A1A2A3ALAV
1#22.50.0570.0380.0410.0570.041
2#45.00.0340.0340.040.0340.04
3#85.30.0320.030.0250.0320.025
Table 4. Parameters of model piles and prototype piles.
Driving PileExisting Pile
Numerical PilePrototype PileNumerical PilePrototype Pile
Density/kg·m−353778505967850
Elasticity modulus/GPa31.6021034.92210
Poisson ratio0.30.30.30.3
Table 5. Comparison of maximum collision loading.
MethodDirect Collision MethodIndirect Collision MethodGRLWEAP
Fmax/MN14.213.015.9
Disclaimer/Publisher’s Note: The statements, opinions and data contained in all publications are solely those of the individual author(s) and contributor(s) and not of MDPI and/or the editor(s). MDPI and/or the editor(s) disclaim responsibility for any injury to people or property resulting from any ideas, methods, instructions or products referred to in the content.

