Abstract
The purpose of this study is to propose optimal actions to improve the energy efficiency of large office buildings in tropical regions with cooling systems, while ensuring the users’ comfort at a reasonable cost. In tropical climates, the building envelope plays a crucial role in saving thermal energy as buildings are exposed to significant climatic impacts and require a significant amount of energy to achieve optimal indoor comfort conditions. In this context, BIM-3D simulation is considered to be effective since it can provide results very similar to those of its physical counterpart, which can be useful for decision making. For this purpose, a public building in Costa Rica is used as a case study, which is modeled in Revit 2019 to obtain a BIM-3D model and simulate its thermal behavior using the BIM tools of the referred software. The architectural characteristics are evaluated in the climatic context of the building, and results are simulated with different configured materials. The obtained results lead to the conclusion that simulation together the previous economic analysis is a valuable decision-making tool for design, enabling significant savings during construction and subsequent building use.
1. Introduction
One of the objectives of modern architecture is the adaptation of buildings to their surroundings. This involves rethinking the interaction between a building and the environment, seeking enhanced harmony and reduced energy consumption. However, knowledge of architecture and urban planning is often exported as if they were consumer products. Consequently, modern buildings share numerous common characteristics regardless of their location as they are designed to isolate themselves from natural phenomena and rely heavily on mechanical installations for interior comfort [1].
In tropical regions, there is a significant increase in energy demand, particularly in office buildings [2]. Specifically in Costa Rica, approximately 50% of the electrical energy consumed in the service sector is allocated mainly to lighting fixtures (12.2%), computing equipment (20.8%), and air conditioning units (19.4%) [3]. Hence, in hot and humid climates, a key challenge is to reduce energy consumption for cooling without compromising the comfort of the interior environment, which is essential for the personnel to work under suitable conditions. Studies have demonstrated that the design of the building envelope is the most crucial factor influencing energy use in high-rise buildings equipped with cooling systems in tropical zones [4].
The adaptation of buildings to the environment should be a primary objective of architecture and urban planning, once optimal comfort and well-being conditions for the users have been defined, along with an analysis of the influencing mechanisms and relevant climatic variables [5,6,7].
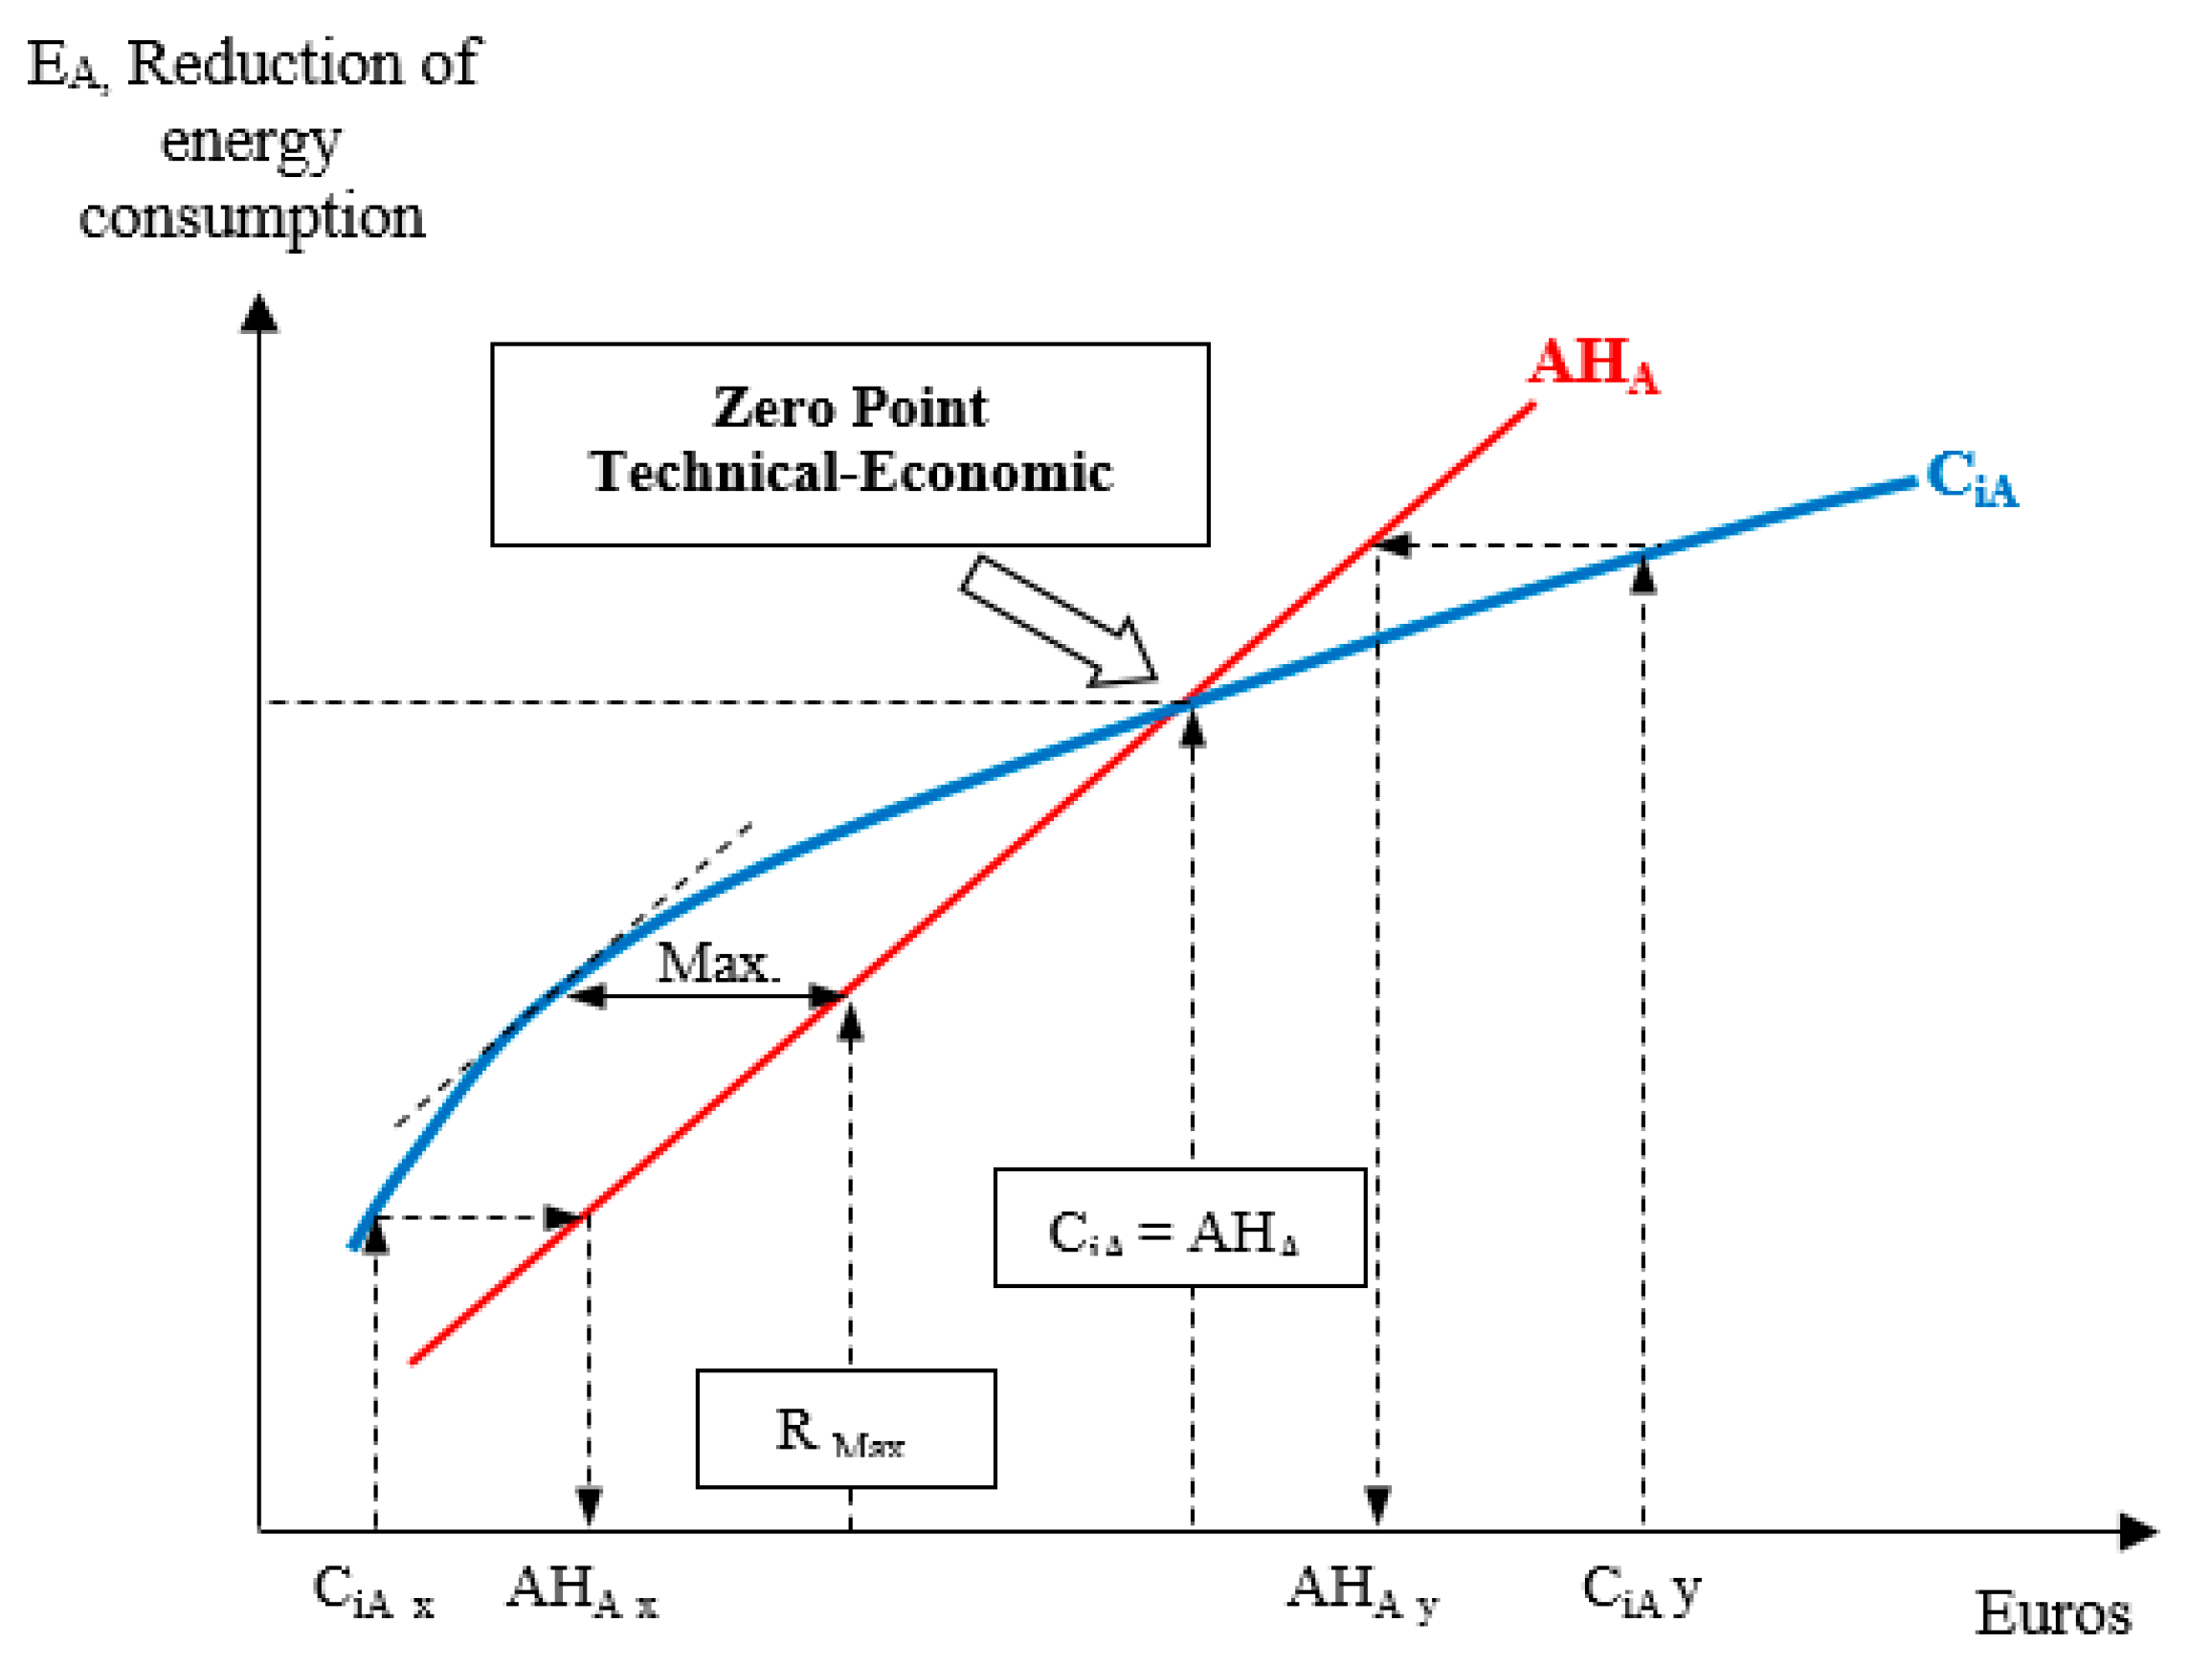
Although there are research studies related to building simulation for assessing energy efficiency in tropical residential buildings [8], the literature review conducted did not identify the use of simulation tools applied to office buildings in those regions. Moreover, energy efficiency actions should strive for cost-effectiveness. Consistent with previous studies [9,10,11,12], the profitability of these actions is measured in terms of their investment and annual energy savings over their useful life (Figure 1).
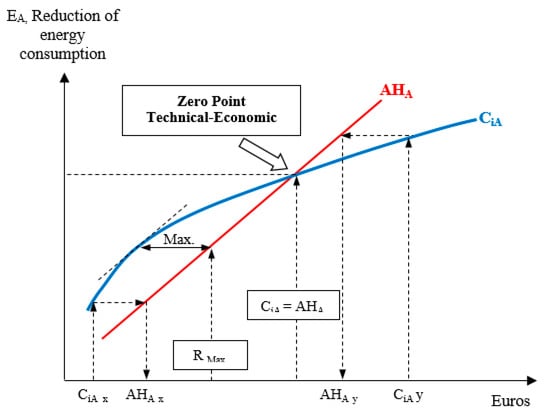
Figure 1.
Amounts of annual investment and economic savings vs. energy not consumed [10].
In this context, a reference useful life is considered to compare various actions or sets of actions, providing an indication of their profitability. Thus, the annual energy savings, denoted as ‘AHA’, are compared to the annual investment cost, denoted as ‘CiA’, associated with the presented actions. This comparison determines whether high savings can be achieved with minimal investments and vice versa, thereby indicating the potential maximum profitability of the investment. A threshold or boundary point is taken into consideration, referred to as the ‘Technical-Economic Zero Point’, where the achieved savings from the implemented actions equal the initial investment. Investments to the right of this point have limited potential for cost recovery [10].
As a result, this work aims to optimize the energy efficiency performance of the building envelope of an office building in the tropical zone, considering the potential profitability in case of implementing a series of improvement proposals. The research primarily focuses on the roofs and facades as the most significant components. To accomplish this objective, the thermal behavior of a public office building in San José, Costa Rica, situated at 10° North latitude, is simulated using a BIM model, which determines that the sun’s rays fall very vertically on the facade surface.
Logically, parameters related to external conditions, such as wind speed, solar radiation, ambient temperature, and ground temperature, along with factors within the building’s interior, including thermal loads, and the thermal transmittance (‘U’) of the building envelope systems, are the factors that affect the comfort of the building. According to Pinazo Ojer [13], the calculation of thermal loads should be conducted during peak demand periods, which can vary depending on the building’s usage, orientation, and considering the thermal inertia of the building envelope materials; so, the evolution of these variables over time should be foreseen. To achieve this objective, the building envelope and the material requirements are analyzed based on the standards specified for air conditioning system design.
2. Methodology
The methodology is based on generating a 3D BIM model that is similar to the existing building in order to identify and assign materials to its different elements, such as facades, roofs, doors, windows, floors, furniture, etc. This allows for simulating the modifications required for the building analysis. The methodology consists of three main steps:
Step 1: Creation of the BIM model. In this step, a 3D model of the building is generated using BIM software Revit V.2019. This model simulates energy consumption considering the current composition of the enclosures, as well as the new walls and materials proposed for the proposed solutions. For this reason, the elements of the model must be previously fed with all the information related to the materials and their physical and thermal parameters. This is because, in addition to the geometry, the BIM software will consider these parameters for the energy simulation.
Step 2: Simulation of thermal load. This step consists of determining the maximum values of the building’s thermal loads. To accomplish this, BIM modeling software equipped with the appropriate energy simulation plugin is utilized. In this study, Autodesk Revit 2019 [14] is utilized, which is a software that not only facilitates the geometric modeling of the building and the input of parameters for its various elements, but also serves for conducting energy simulations. The energy simulation is carried out using a plugin that leverages the Autodesk Insight cloud [15], a robust tool with reliable engines for simulating energy consumption, heating, cooling, natural lighting, and solar radiation in buildings.
Step 3: Proposal of cost-effective solutions. In this step, the level of welfare/comfort provided by the configured and generated enclosures in the BIM model is determined. The analysis considers the influencing mechanisms and the climatic variables involved, allowing for the rejection of proposals that are not profitable according to the ‘Technical-Economic Zero Point’ procedure’s philosophy.
3. Case Study
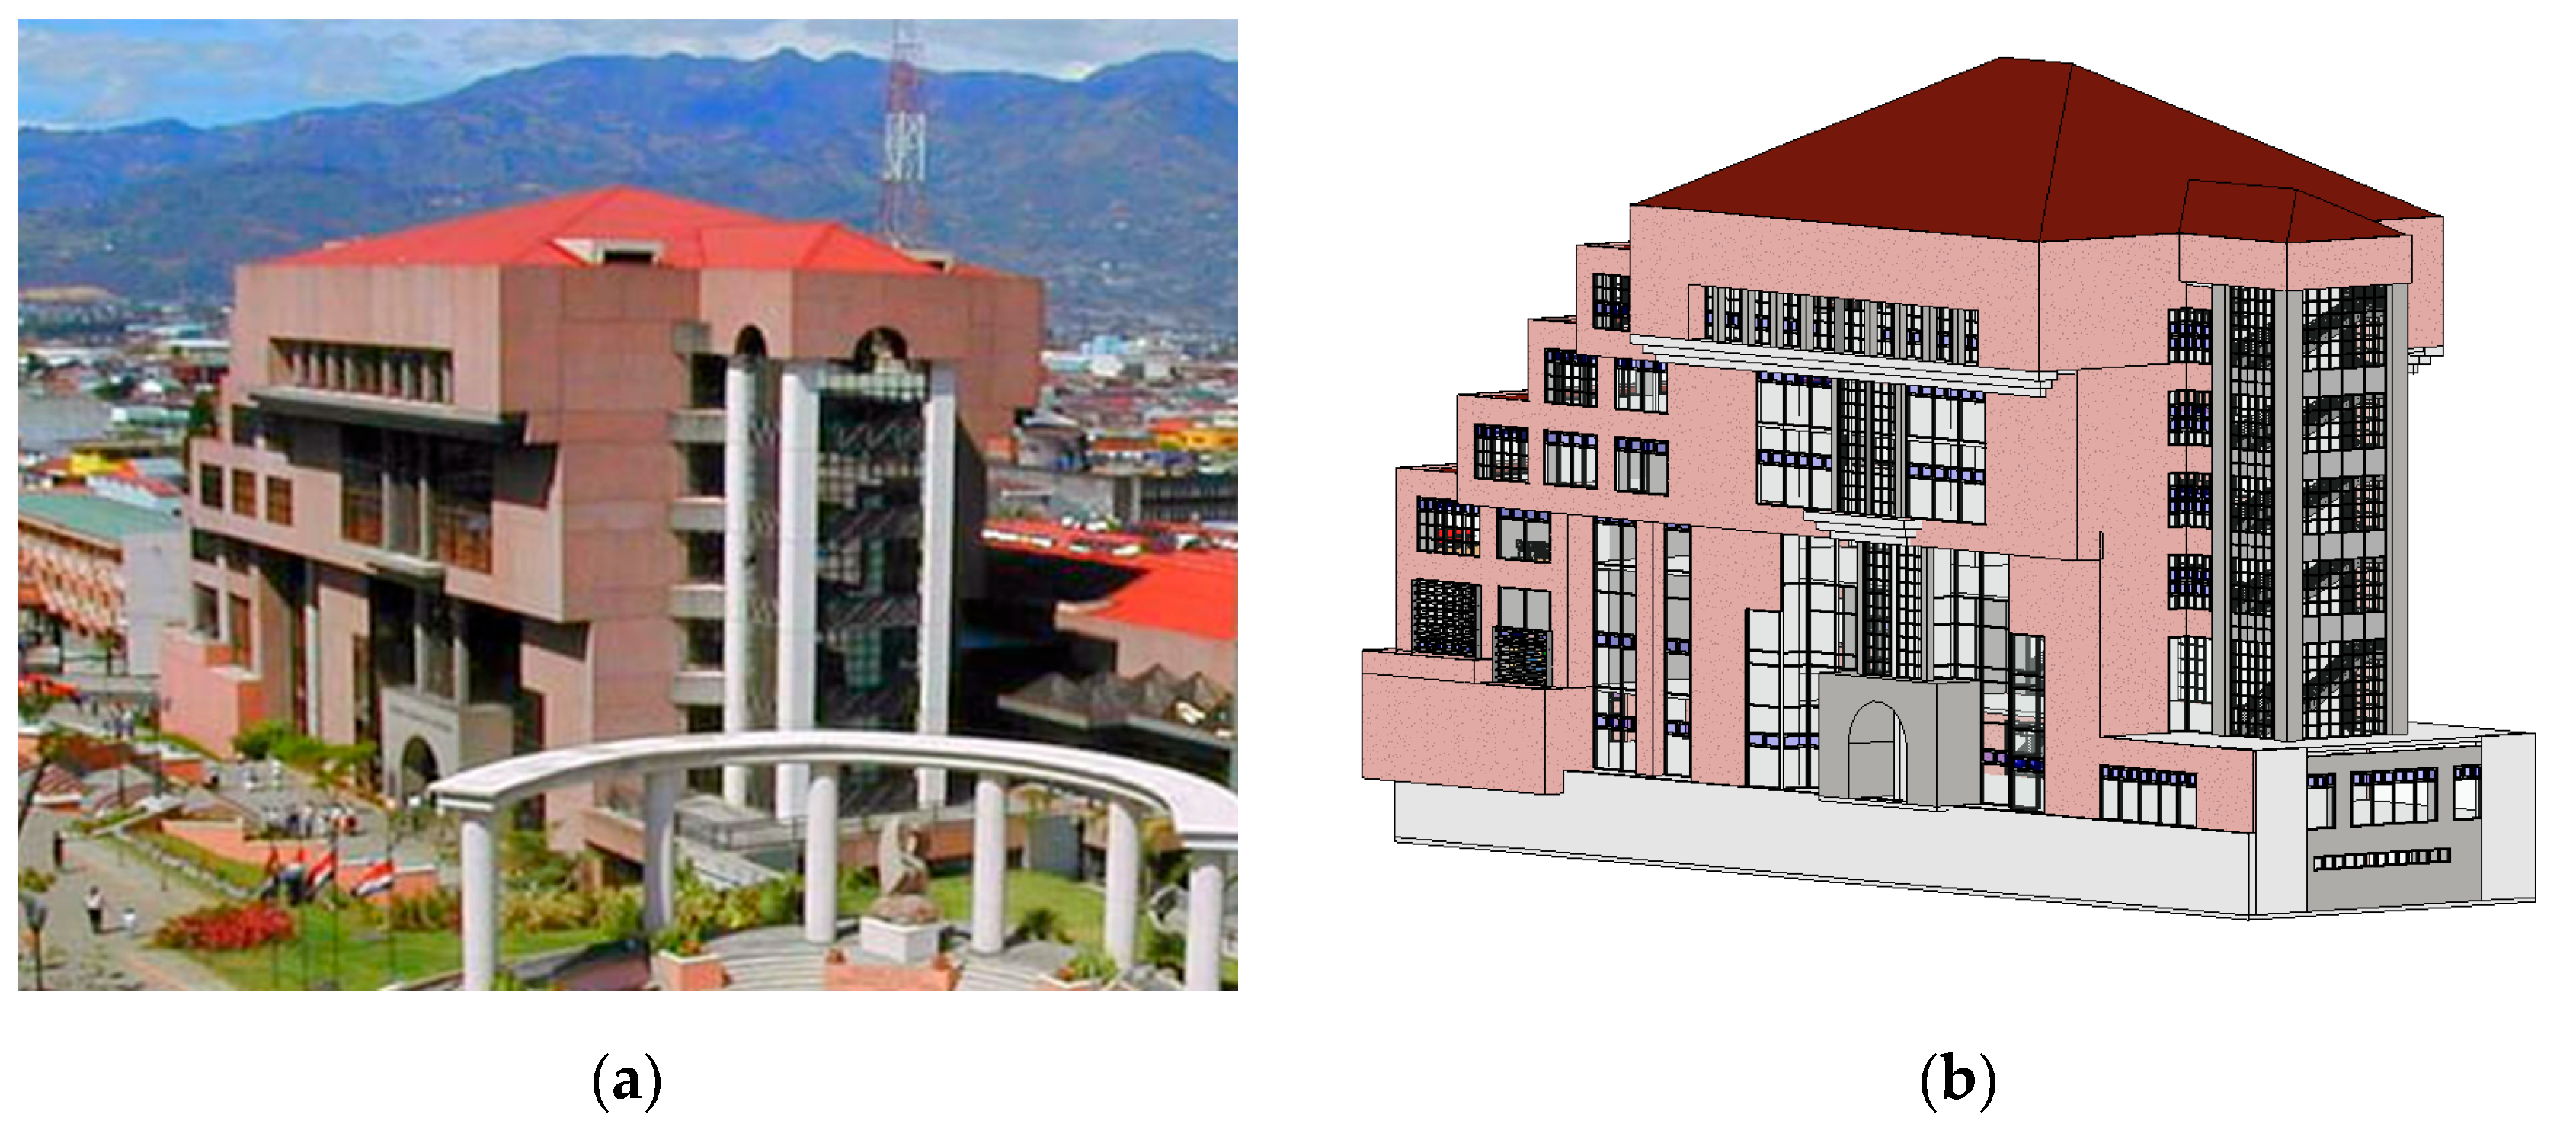
This work was carried out in the Tower Building of the Supreme Electoral Tribunal (TSE) of Costa Rica, located in San José, Costa Rica. The building was constructed in the early 1990s (Figure 2a).
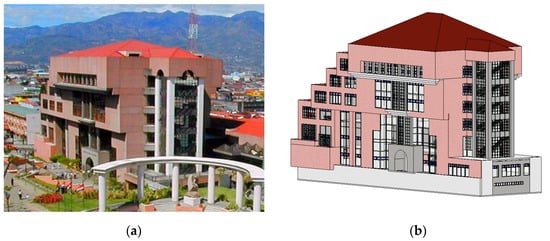
Figure 2.
(a) TSE building in Costa Rica (adaptation of the source: [16]). (b) BIM model of the building (Source: own preparation).
The site, situated in the Central Valley, experiences a warm and humid climate [17]. Based on studies regarding the climatic requirements of buildings in San José [18] and the climatic data provided by the Mahoney tables [19], it can be concluded that ventilation is crucial in this geographic area during the months of May, September, and October [20].
The building’s facade consists of 9 cm thick precast concrete panels, which are attached to the structure using a steel support system. Although the panels themselves are in good condition, the building has been affected by soiling over the years due to the accumulation of dust and the impact of rain. This has resulted in an unattractive and aged appearance, requiring regular maintenance. Additionally, signs of cracking have started to appear in the joint sealing material between the panels, which can lead to leaks.
From a thermal performance perspective, the facade incorporates air chambers and interior plaster or fiber cement cladding in certain areas. However, this solution fails to provide the necessary comfort in spaces located on the east and west sides of the building due to the intense radiation they receive during morning and afternoon hours.
3.1. Step 1: Creating/Obtaining the BIM Model
To create the BIM model, existing drawings and on-site measurements were utilized, employing Autodesk Revit V.2019 software (Figure 2b) [14]. This software serves as a valuable tool for developing precise and high-quality model designs.
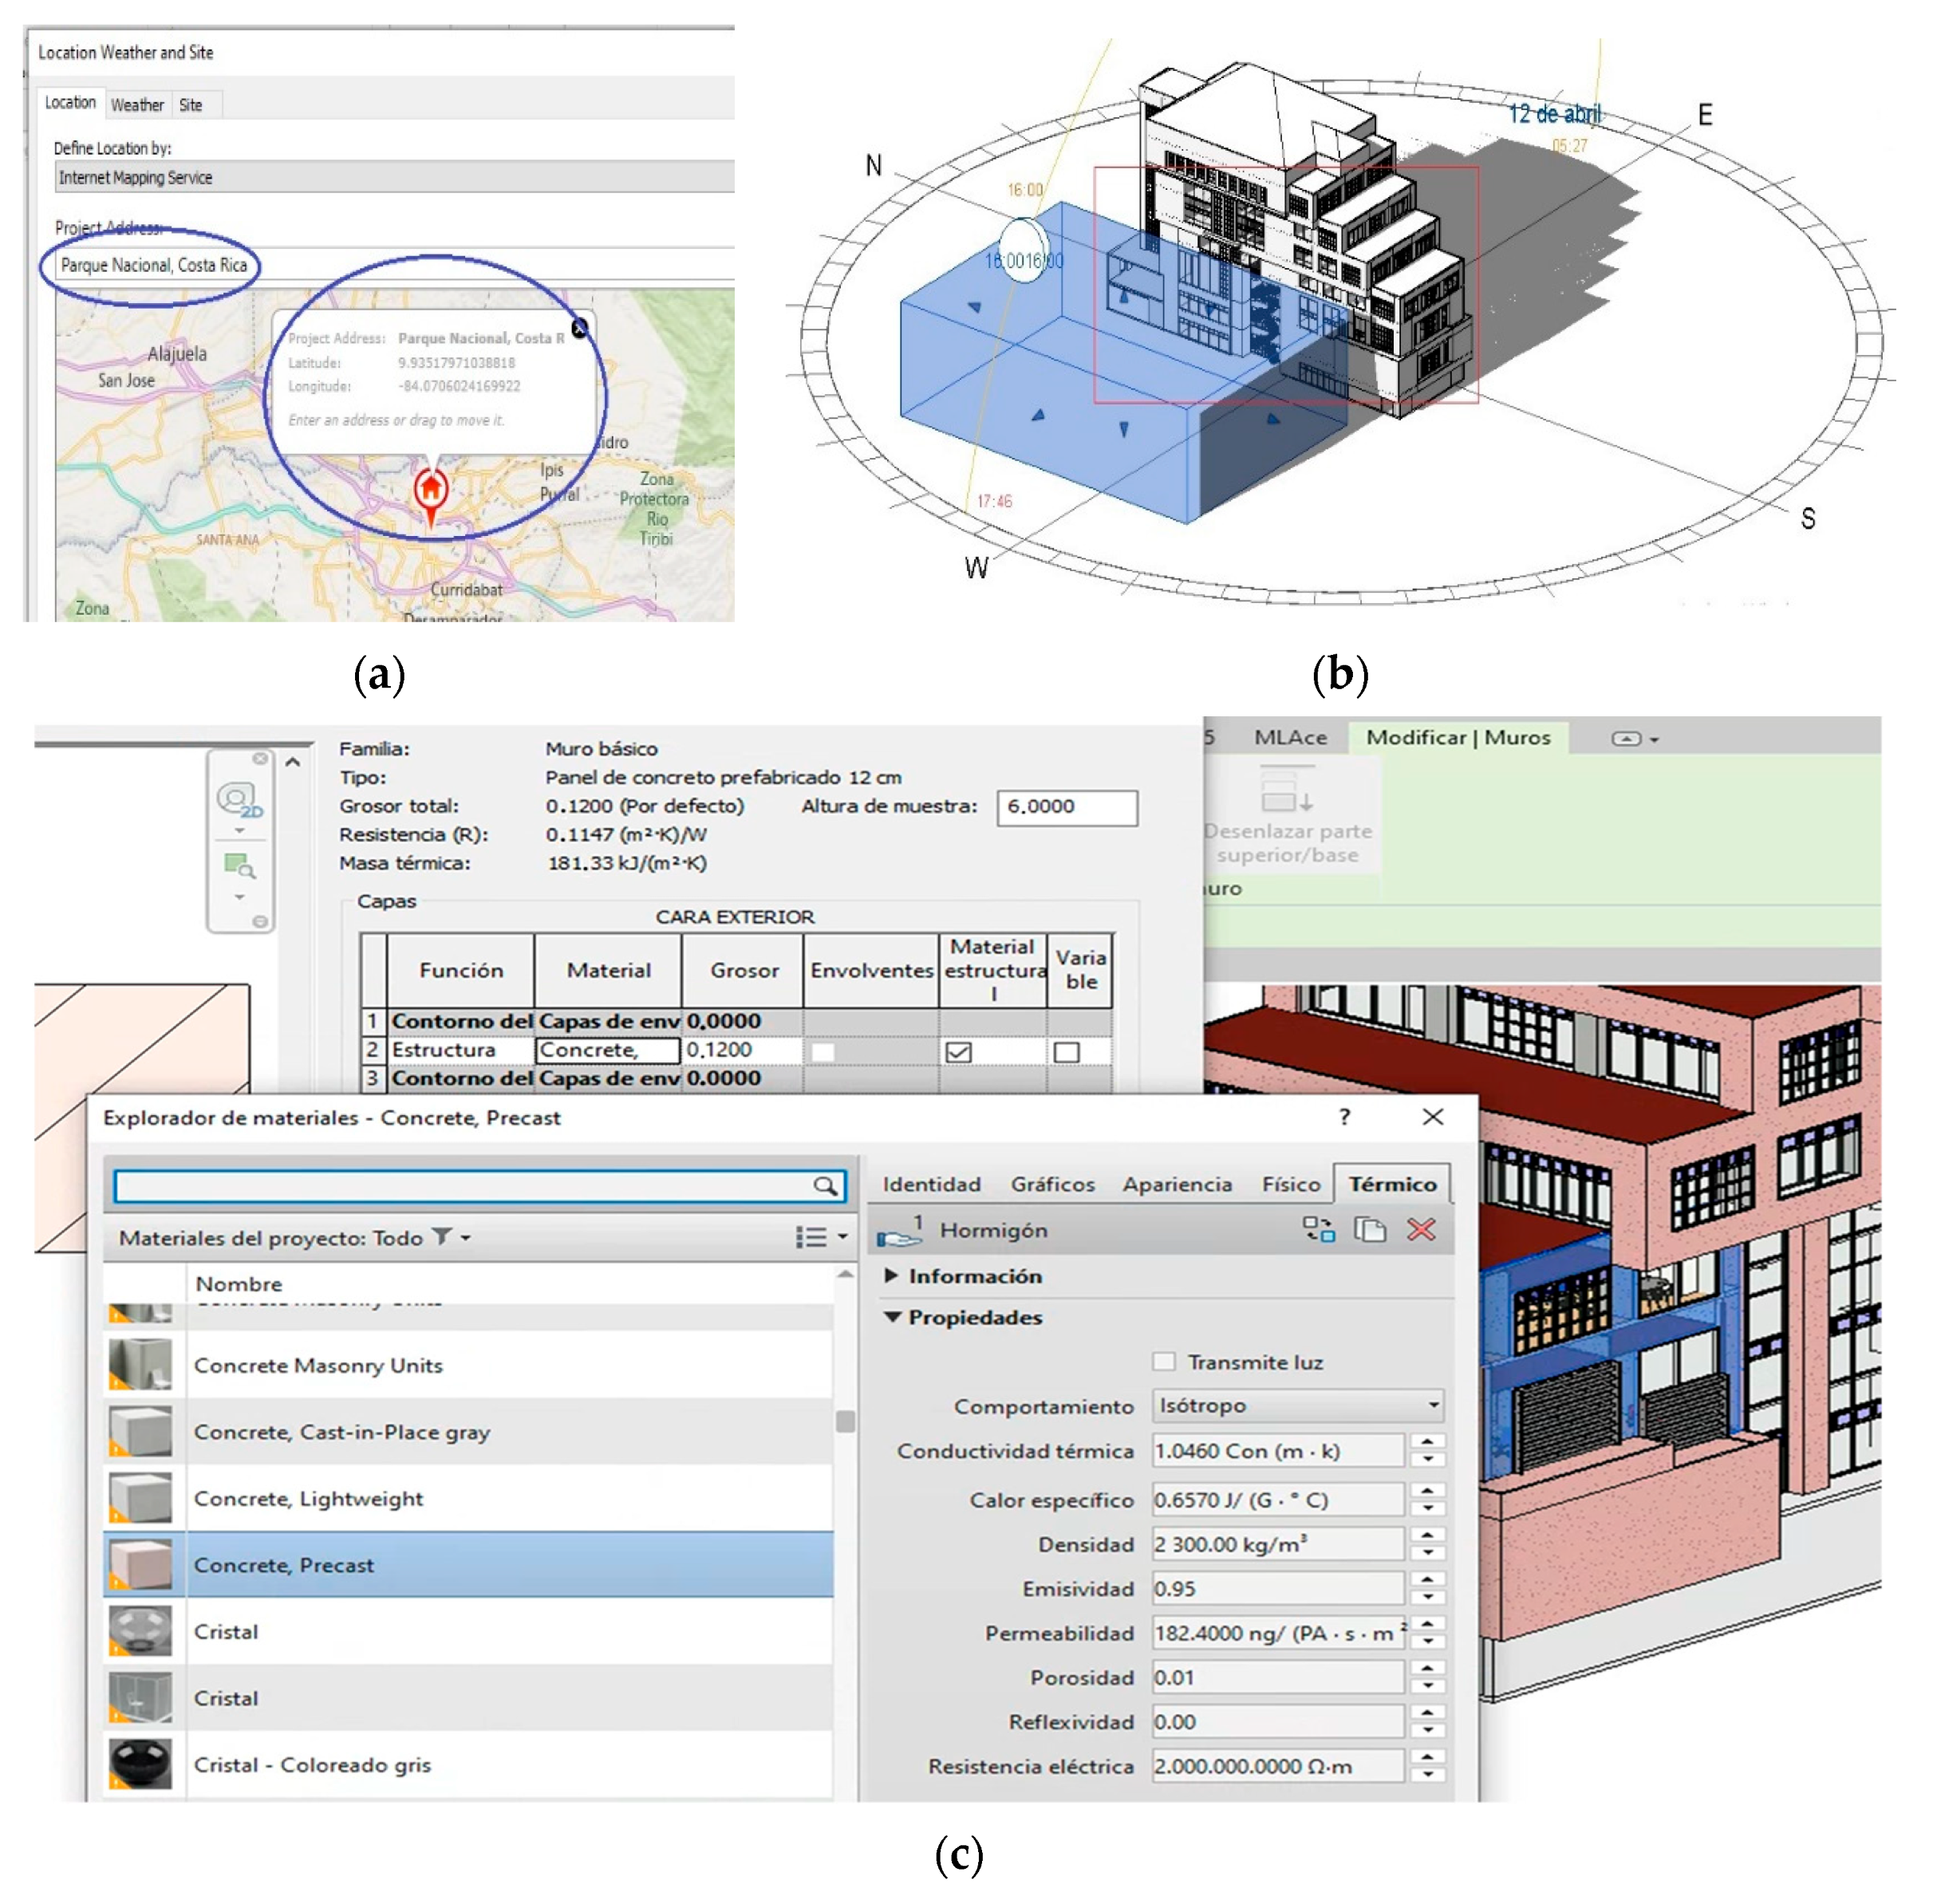
Before initiating the modeling process, certain essential information was configured in the software to ensure accurate simulation. This included inputting the precise location (Figure 3a) and orientation (Figure 3b) of the building, as its proper implementation significantly influences the validity of the obtained results.
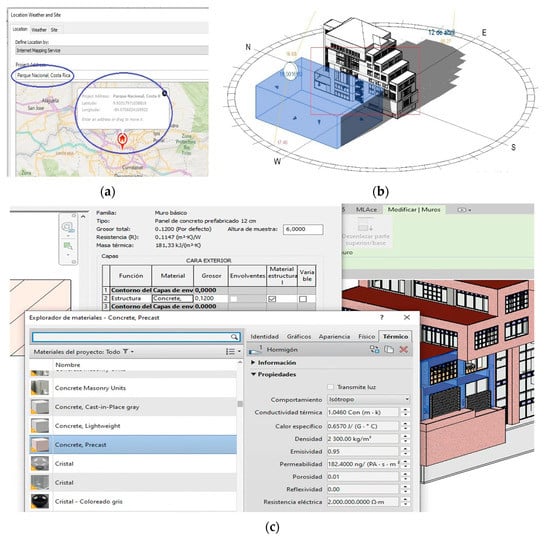
Figure 3.
(a) Location and (b) orientation and sun path of the Revit model with ‘Revit mass’ volume to simulate adjoining shading buildings. (c) Model material properties configuration process model of the TSE building in Costa Rica. Source: own preparation.
Next, the climatic data are configured based on the location (Figure 4a) and the building’s specific usage. As can be seen in (Figure 3b), volumes have been created with the ‘Revit mass tool’ to simulate the surrounding buildings whose shadow may influence the building, affecting the simulation. Following that, the properties of the materials, including dimensional, thermal, and physical properties, are defined through the ‘Revit Type parameters’ editing menu (Figure 3c). It is important to note that the appropriate definition of materials has a significant impact on the results of energy performance and cost simulation. The generated 3D model closely resembles the actual building, both externally (Figure 2b) and internally (Figure 4b). This similarity enables proposing and implementing the necessary modifications or adjustments required to conduct the analysis.

Figure 4.
(a) Climatic variables according to project location. (b) Modeling of building interior. Source: own preparation.
3.2. Step 2: Simulation of Thermal Load
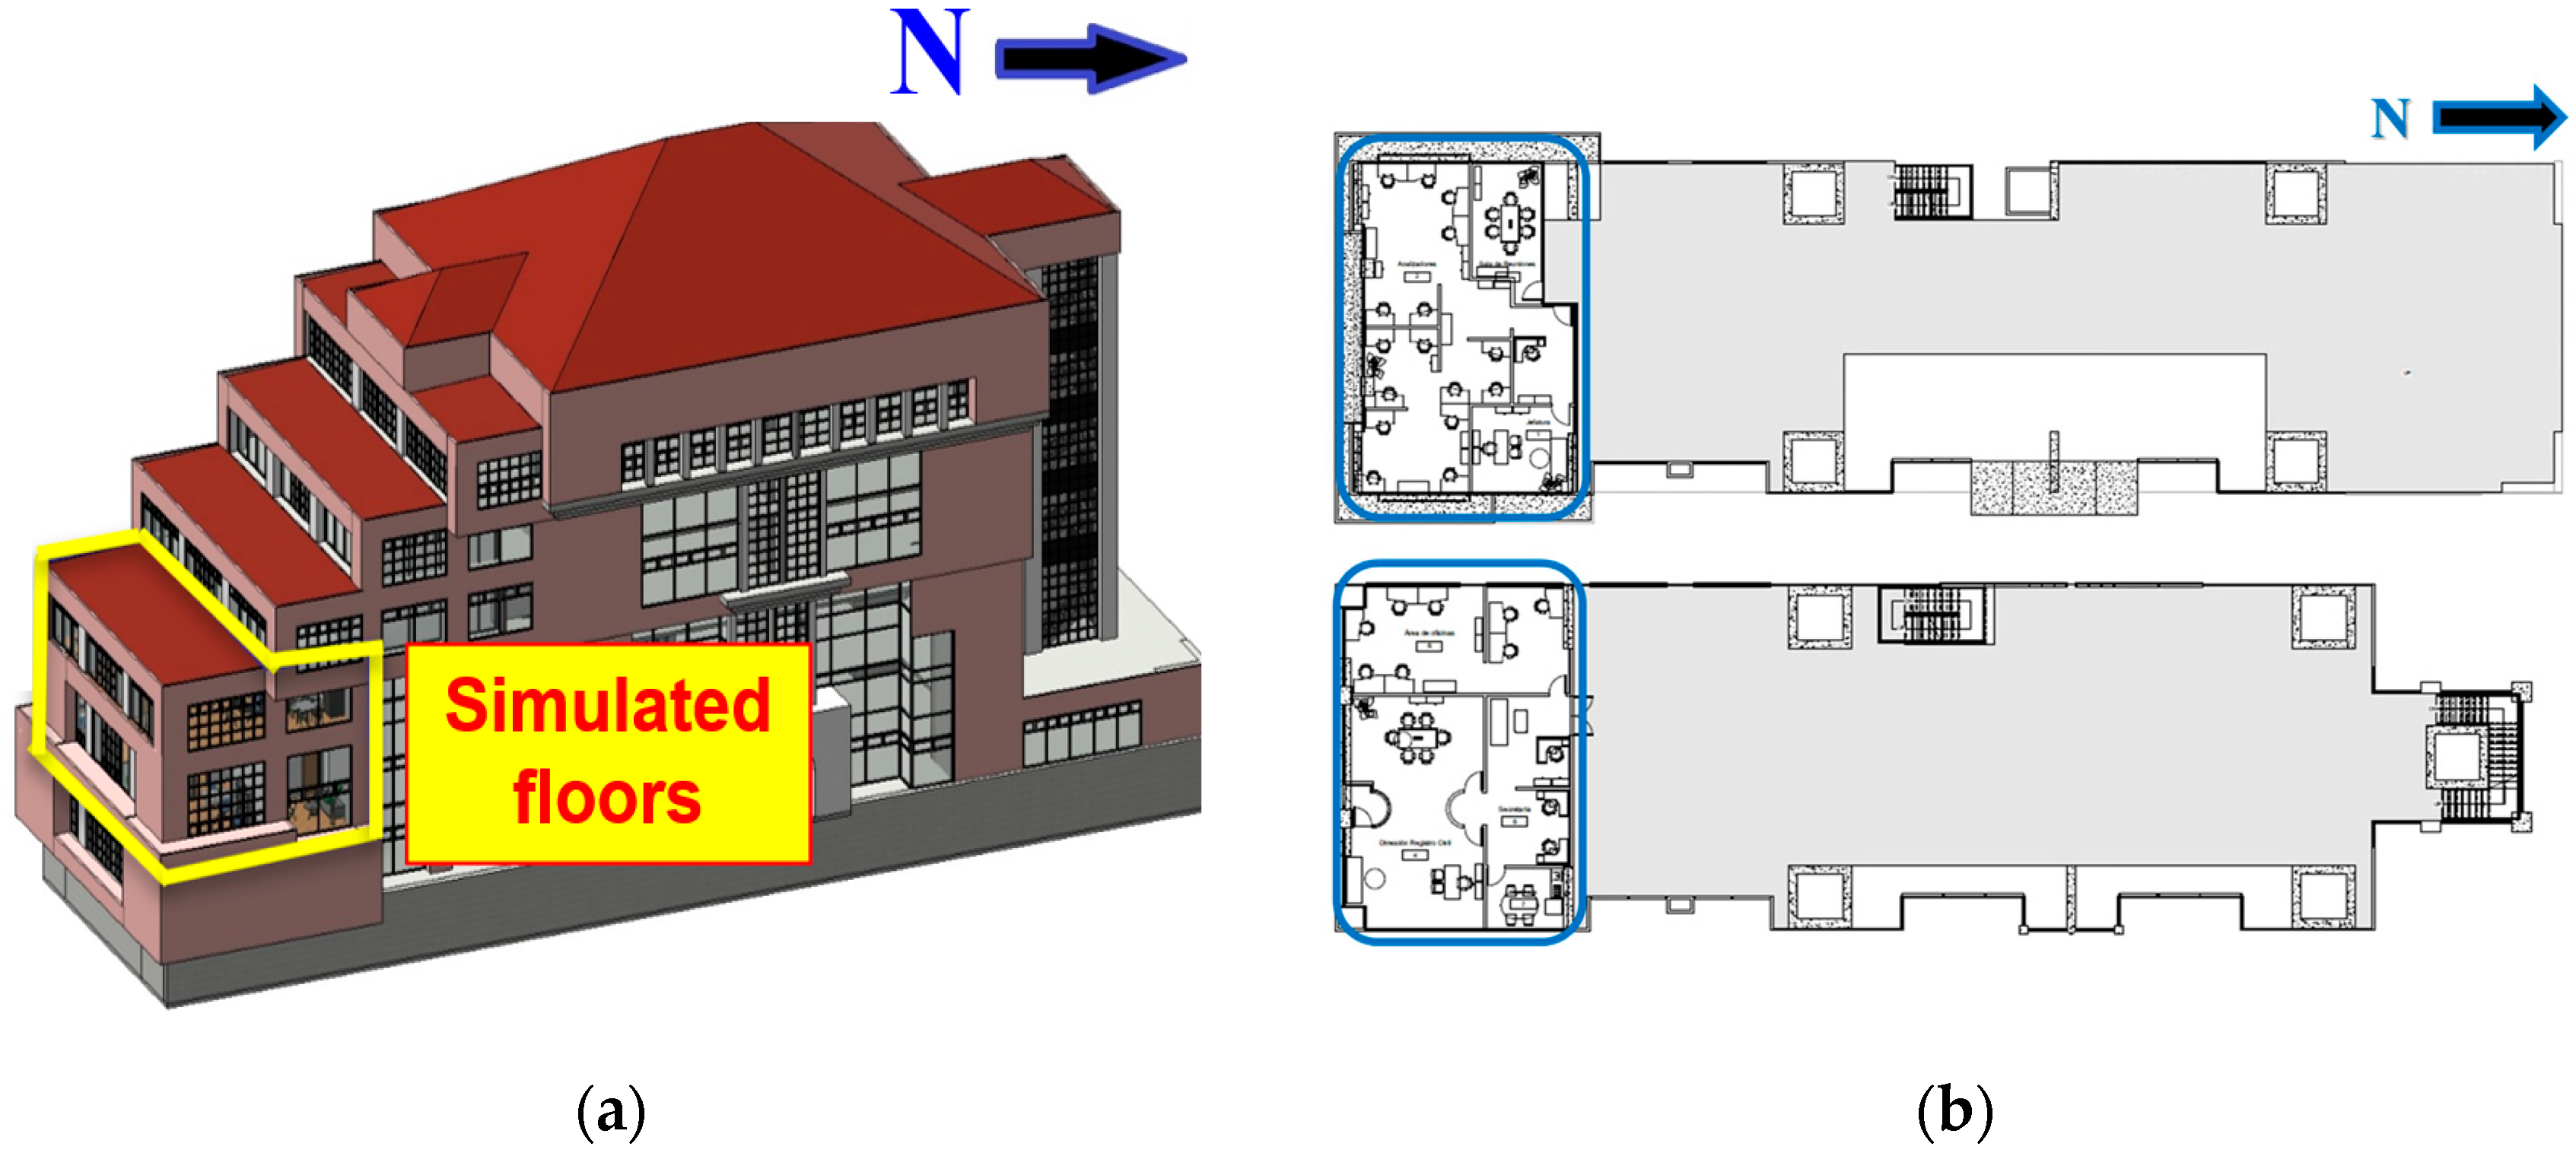
Two zones situated on the second and third floors of the building have been selected for the thermal load simulation (Figure 5a,b). These areas, located on the south side of the building, exhibit a specific thermal comfort issue, namely overheating. Moreover, the enclosures surrounding these zones on all three sides (south, east, and west) consist of extensive glazed areas.
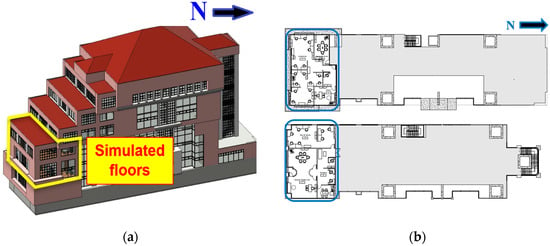
Figure 5.
(a) Three-dimensional and (b) as-built drawings of the 2nd and 3rd floors of the building. Source: own preparation.
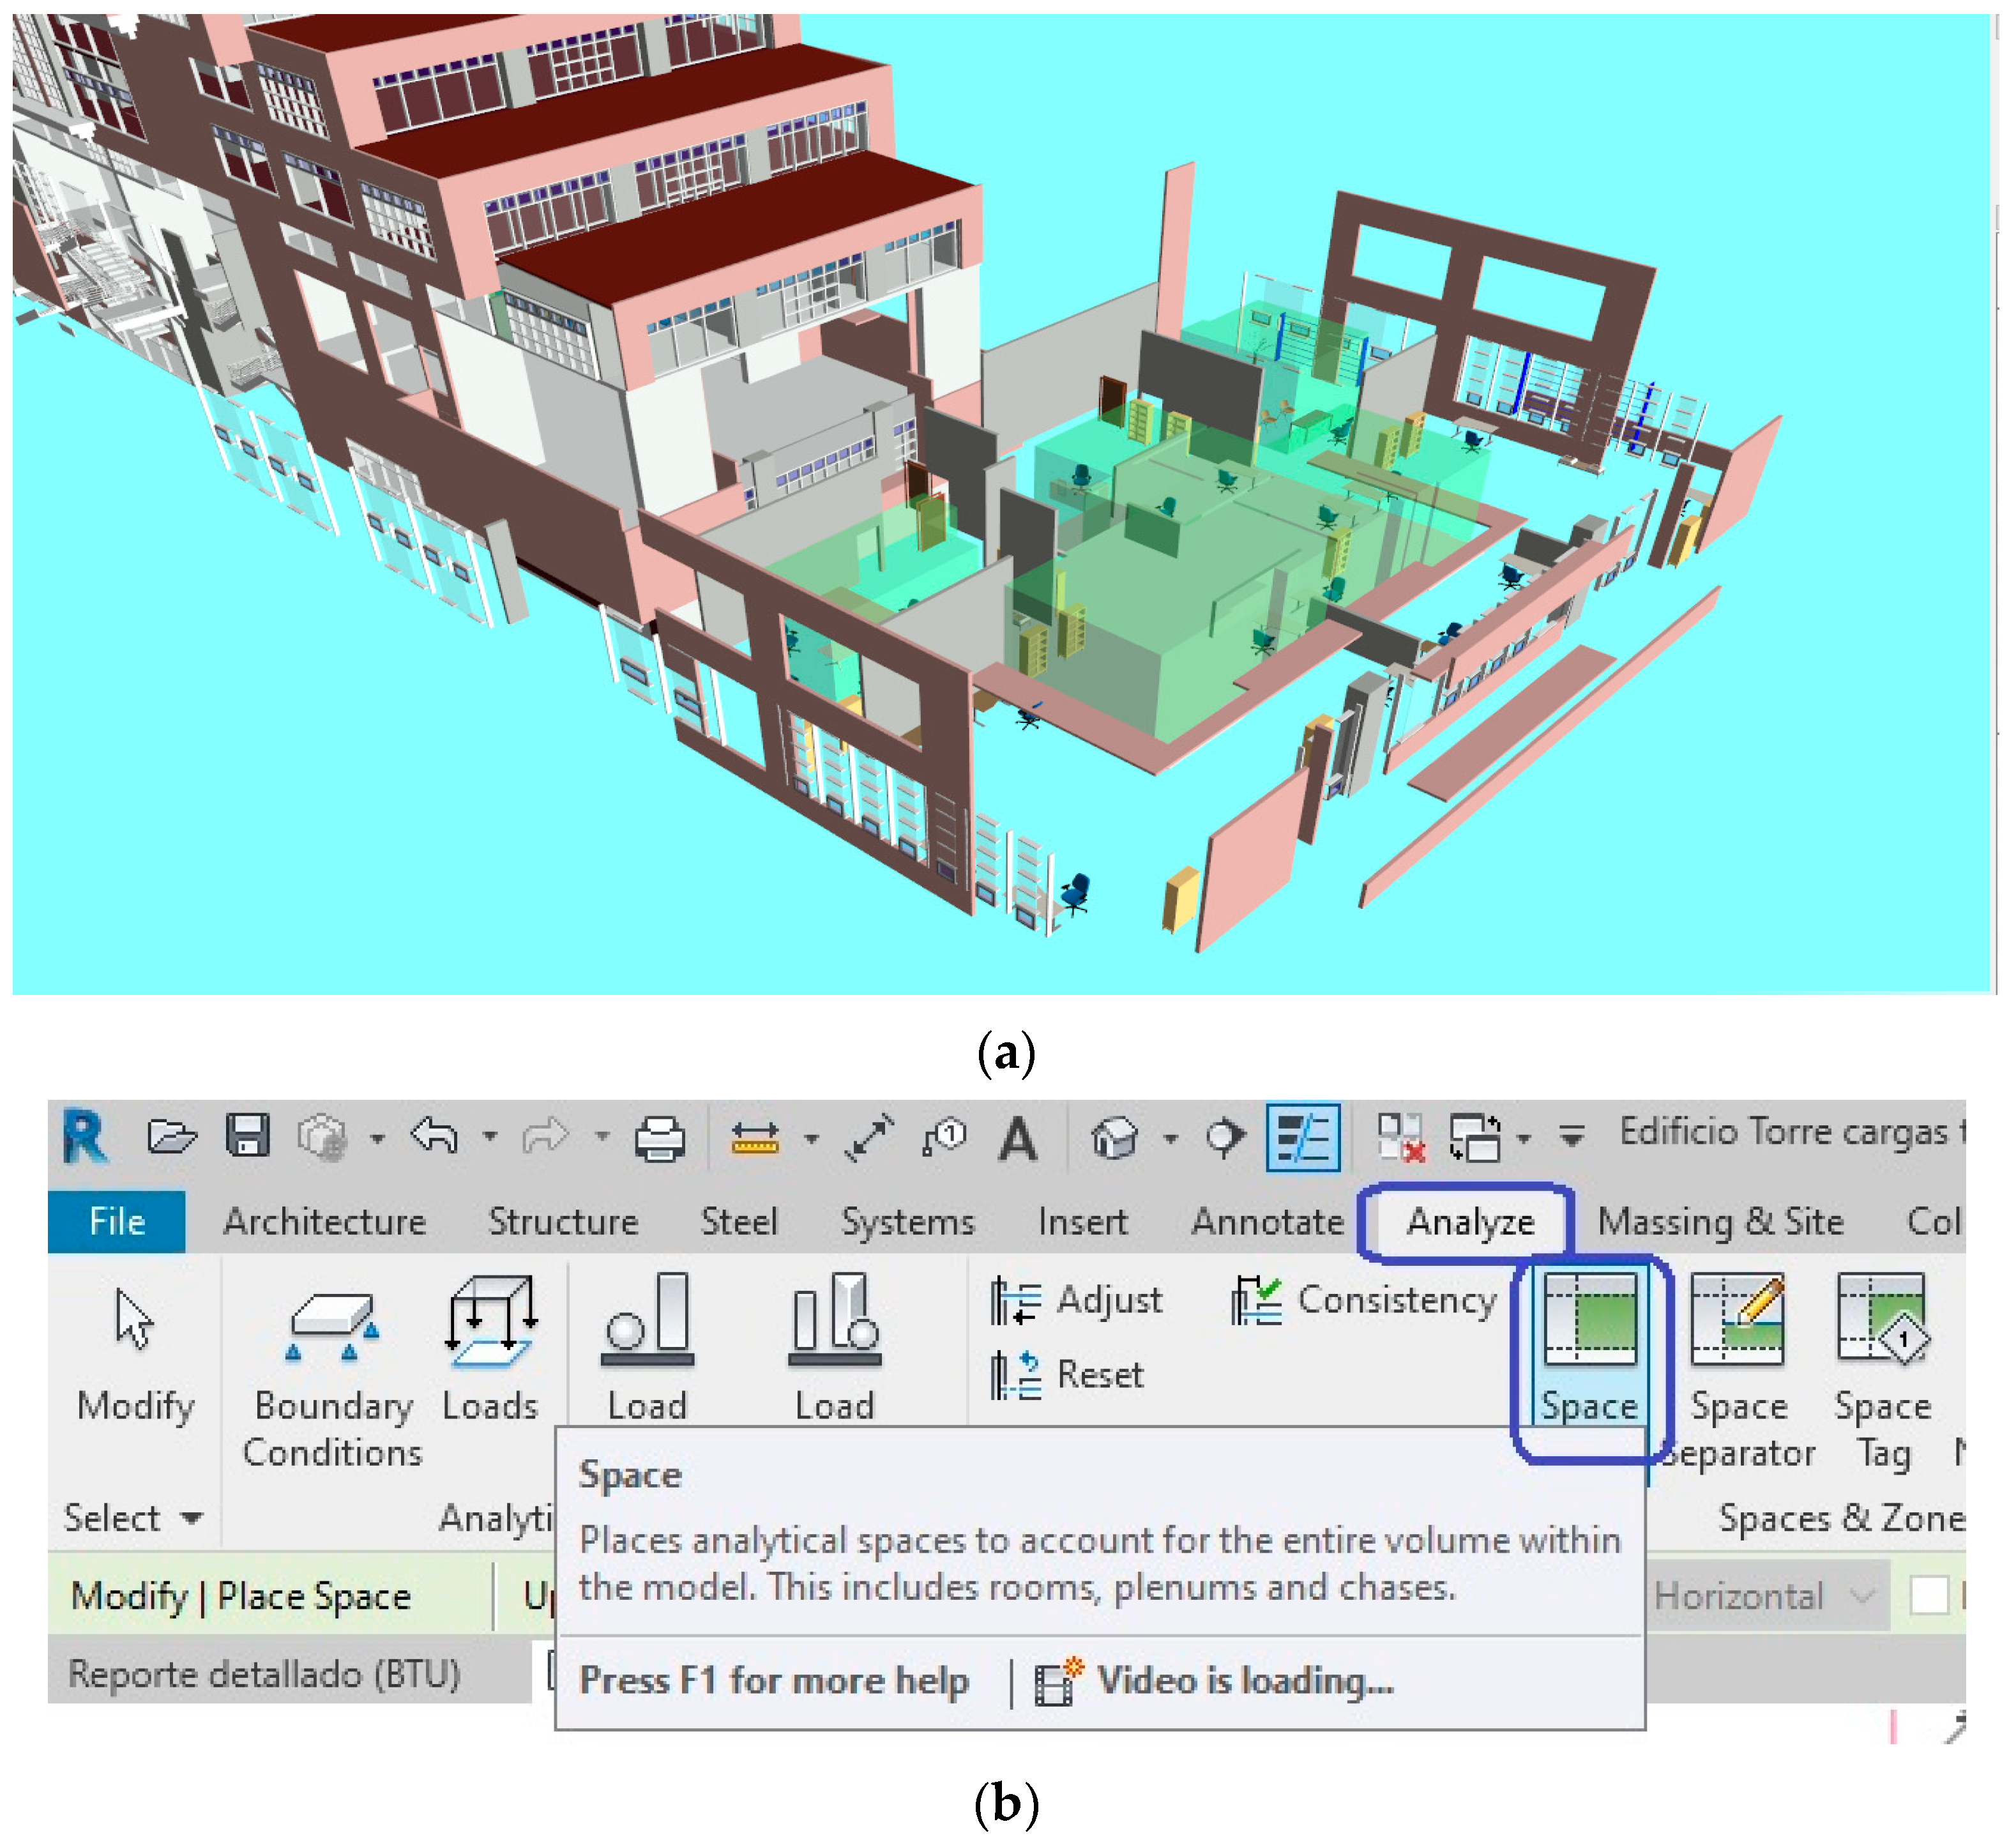
The configuration of the thermal load analysis begins with the creation or selection of areas or spaces within the BIM model (Figure 6a). These spaces are manually delimited and can be created or selected using the ‘Analyze→Space’ menu in Revit (Figure 6b). This procedure involves defining the boundaries of the spaces to be analyzed (as outlined in Table 1).
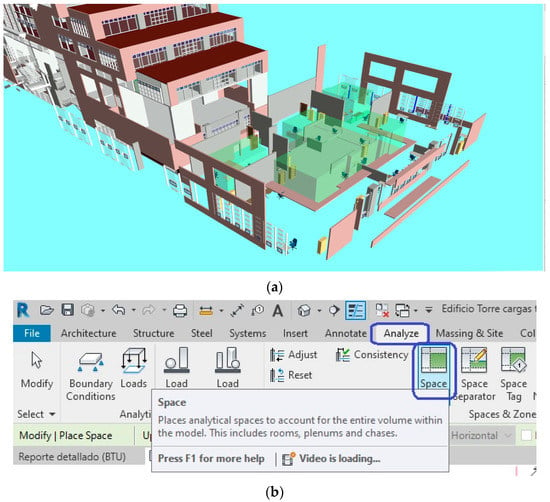
Figure 6.
(a) Display of spaces (volumes in green) configured on the 2nd level (Source: own elaboration with eveBIM software V.3.2.2.395 [21]). (b) Creation of spaces for thermal load analysis (Source: own preparation whit Revit V.2019 software).

Table 1.
Distribution and dimensions of spaces created for the calculation of heat loads.
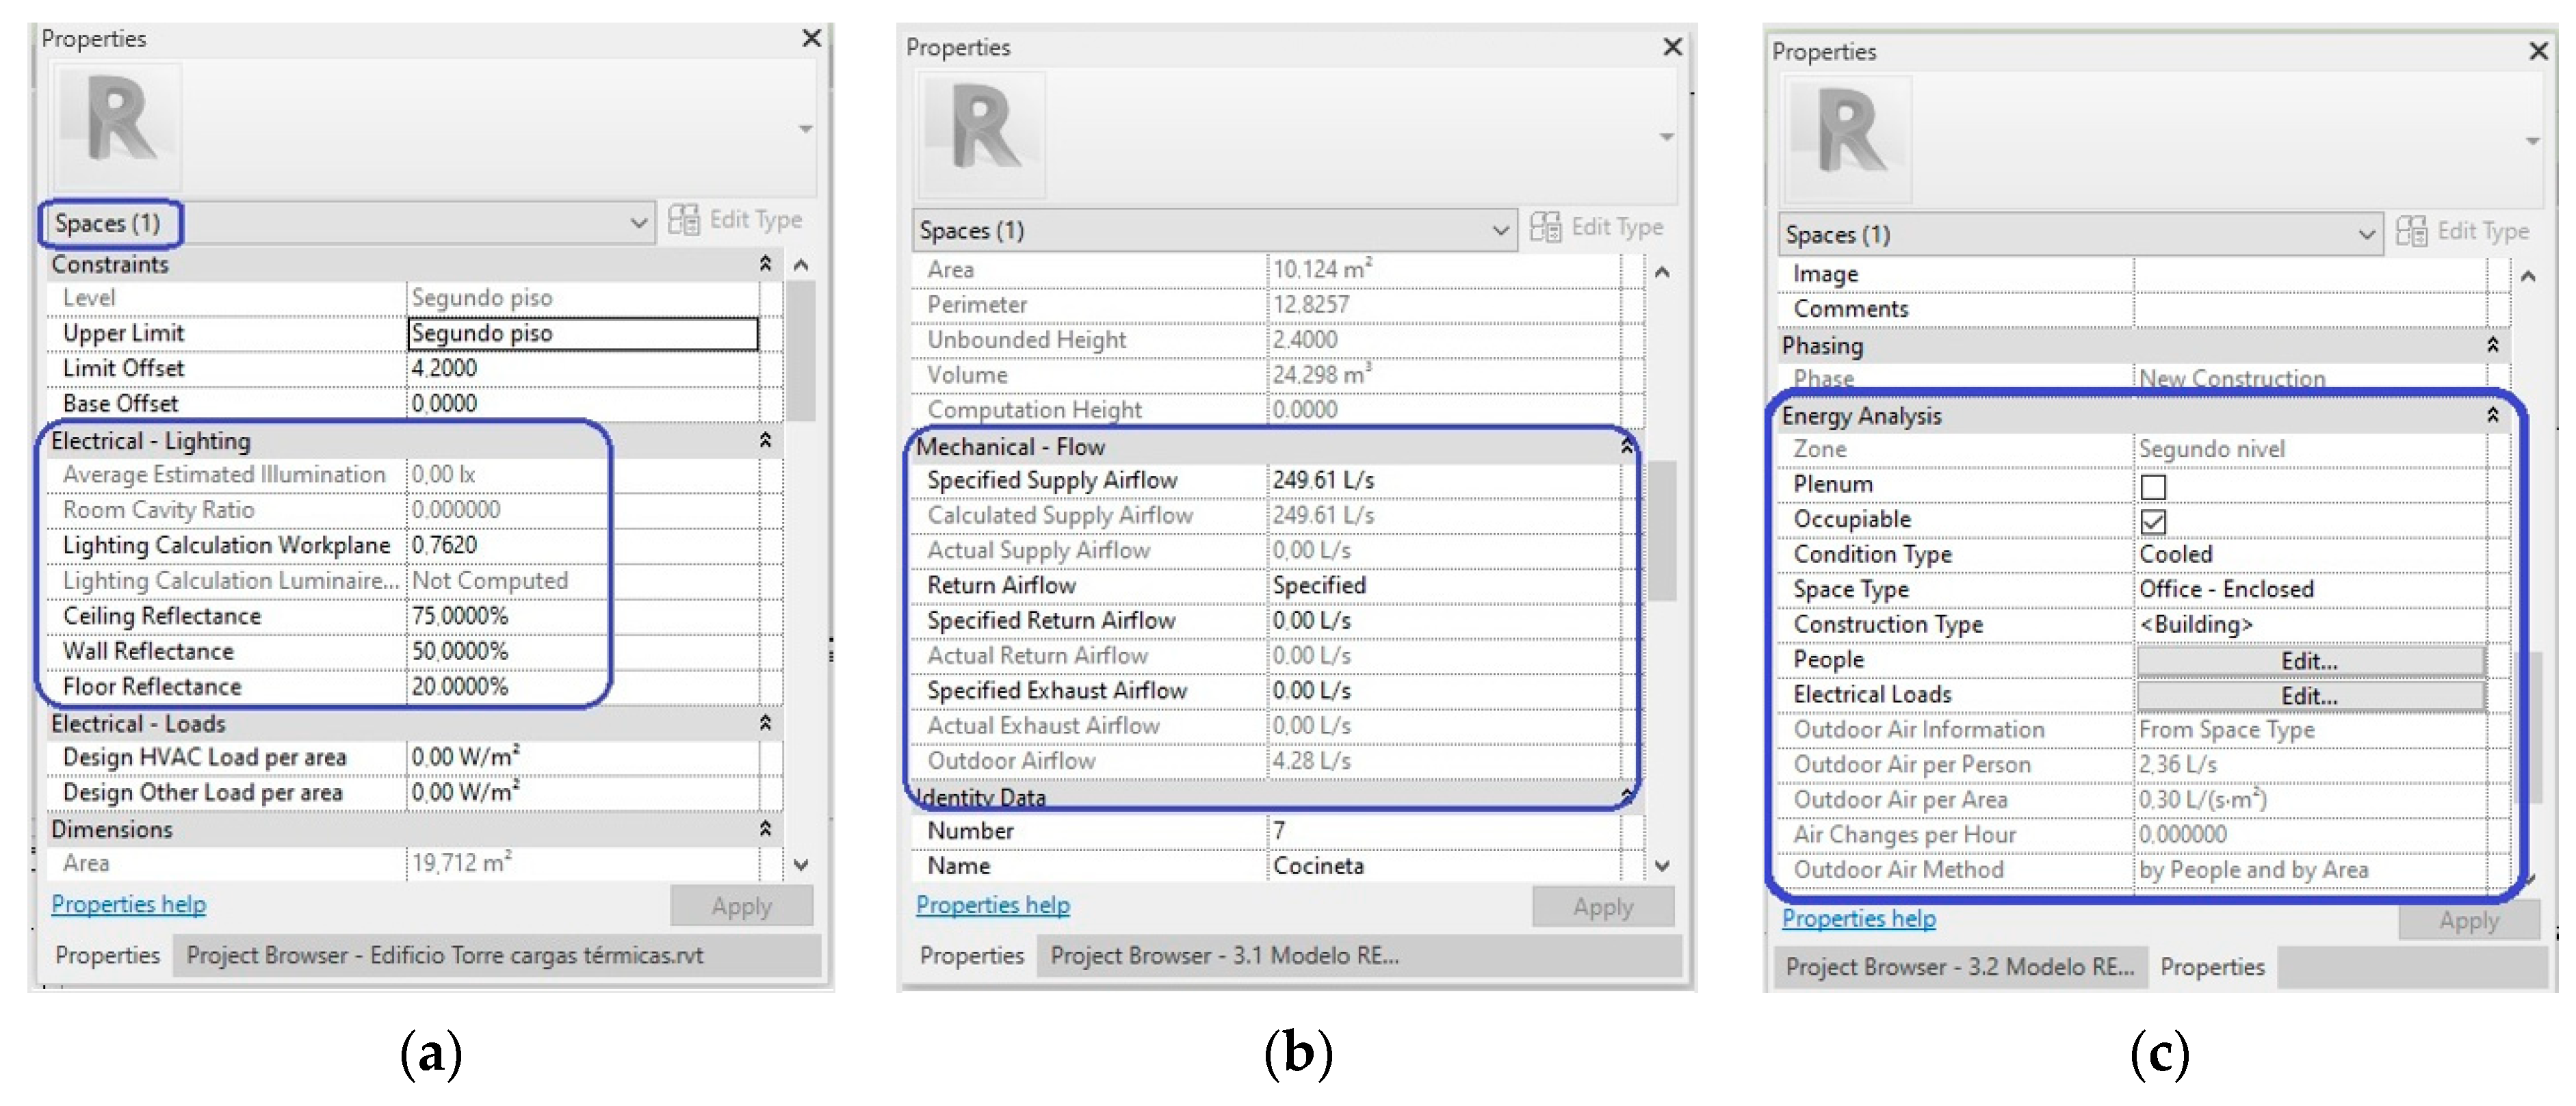
Once the spaces have been created or selected, they need to be configured in the Revit software’s ‘Properties’ Table. This configuration involves specifying electrical data for lighting (Electrical-Lighting), mechanical flows (Mechanical-Flow), and energy analysis (Energy Analysis), as shown in Figure 7a–c. Some parameter configurations are limited to specific options. For instance, the ‘Return Airflow’ parameter offers three choices: ‘Specified flow’, ‘Calculated flow’, or ‘Real flow’. In our case, we have chosen ‘Specified Flow’ as the option. This parameter value is then used in the remaining configurations of the Revit energy simulation plugin. These options enable a more accurate approximation of the model to the real building, enhancing the precision of the analysis.
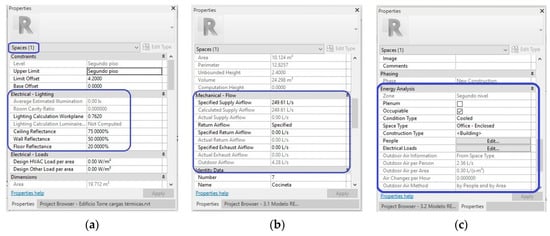
Figure 7.
Configuration of the properties of the areas/spaces to be simulated in the model (a) electrical-lighting. (b) Mechanical flow. (c) Energy analysis. Source: own preparation.
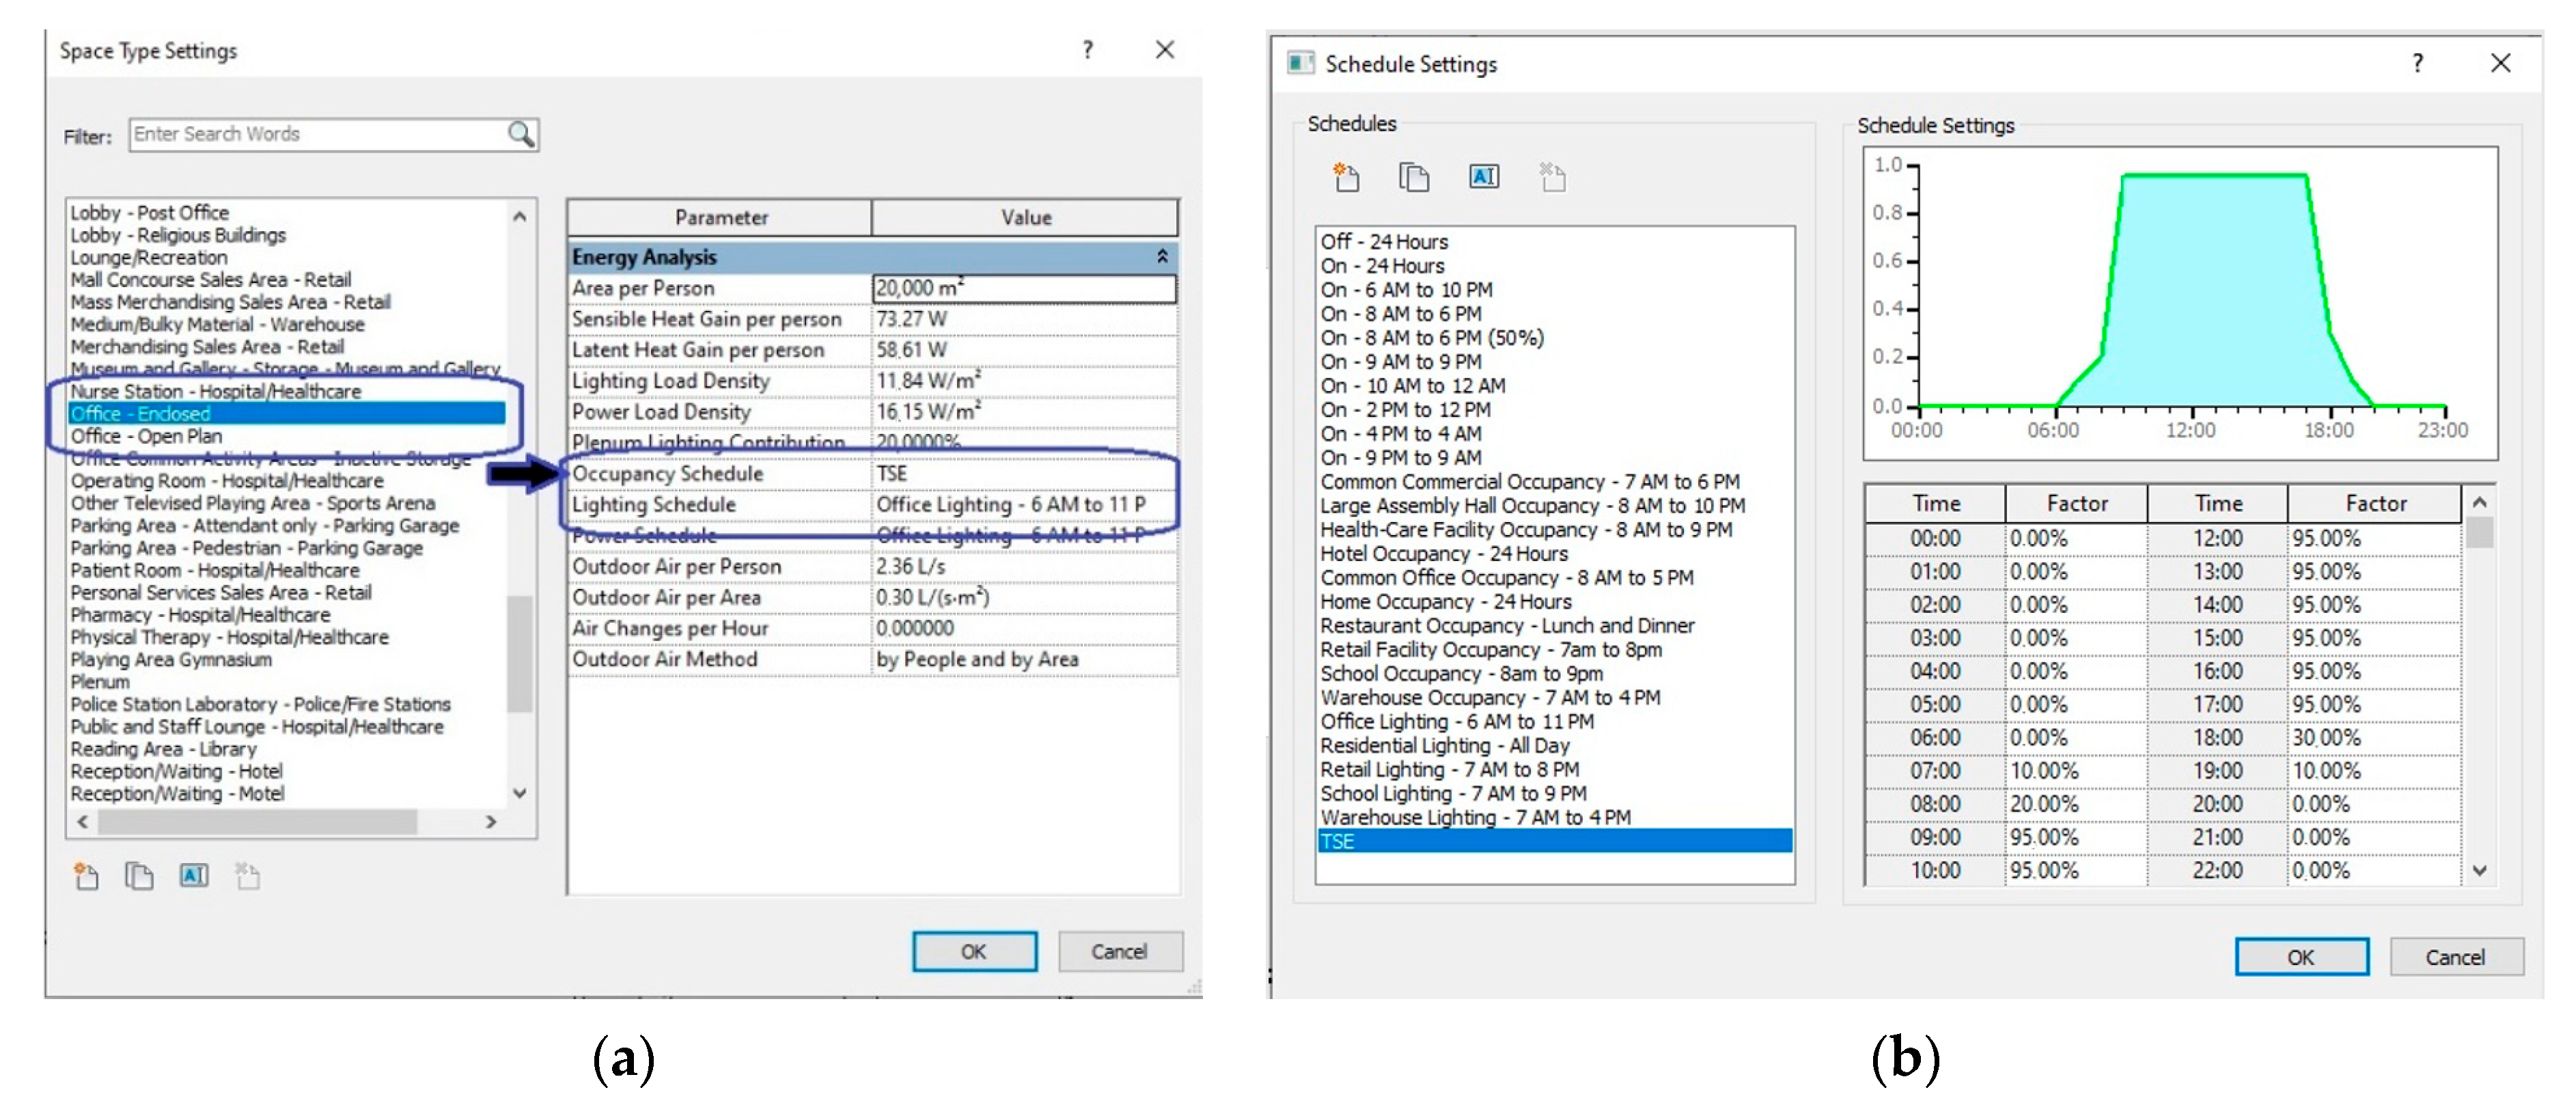
Once the properties of the spaces are configured, the next step is to classify them. In the ‘Space Type’ menu of Revit, the appropriate space type is selected that best matches the actual building (Figure 8a). In this case, the selected space type is ‘Office-Enclosed’.
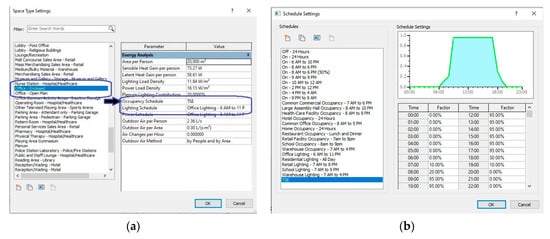
Figure 8.
(a) Space type settings for space type settings. (b) Schedule settings; building occupancy schedule. Source: own preparation.
Following that, the ‘Occupancy Schedule’ is set in the software. This schedule defines the operating hours of the air conditioning units currently in use in the building (Figure 8b). The configured schedule includes starting the equipment one hour before staff entry (from 07:00 h) and shutting it off at 19:00 h. This schedule is synchronized with the building’s location and the ‘sun path’ feature in Revit.
Lastly, the lighting schedule is adjusted according to the building’s current functional requirements. To ensure that the software utilizes the previously configured parameters, the ‘Construction Type’ parameter is maintained with the ‘<Building>’ option without modifying any data.
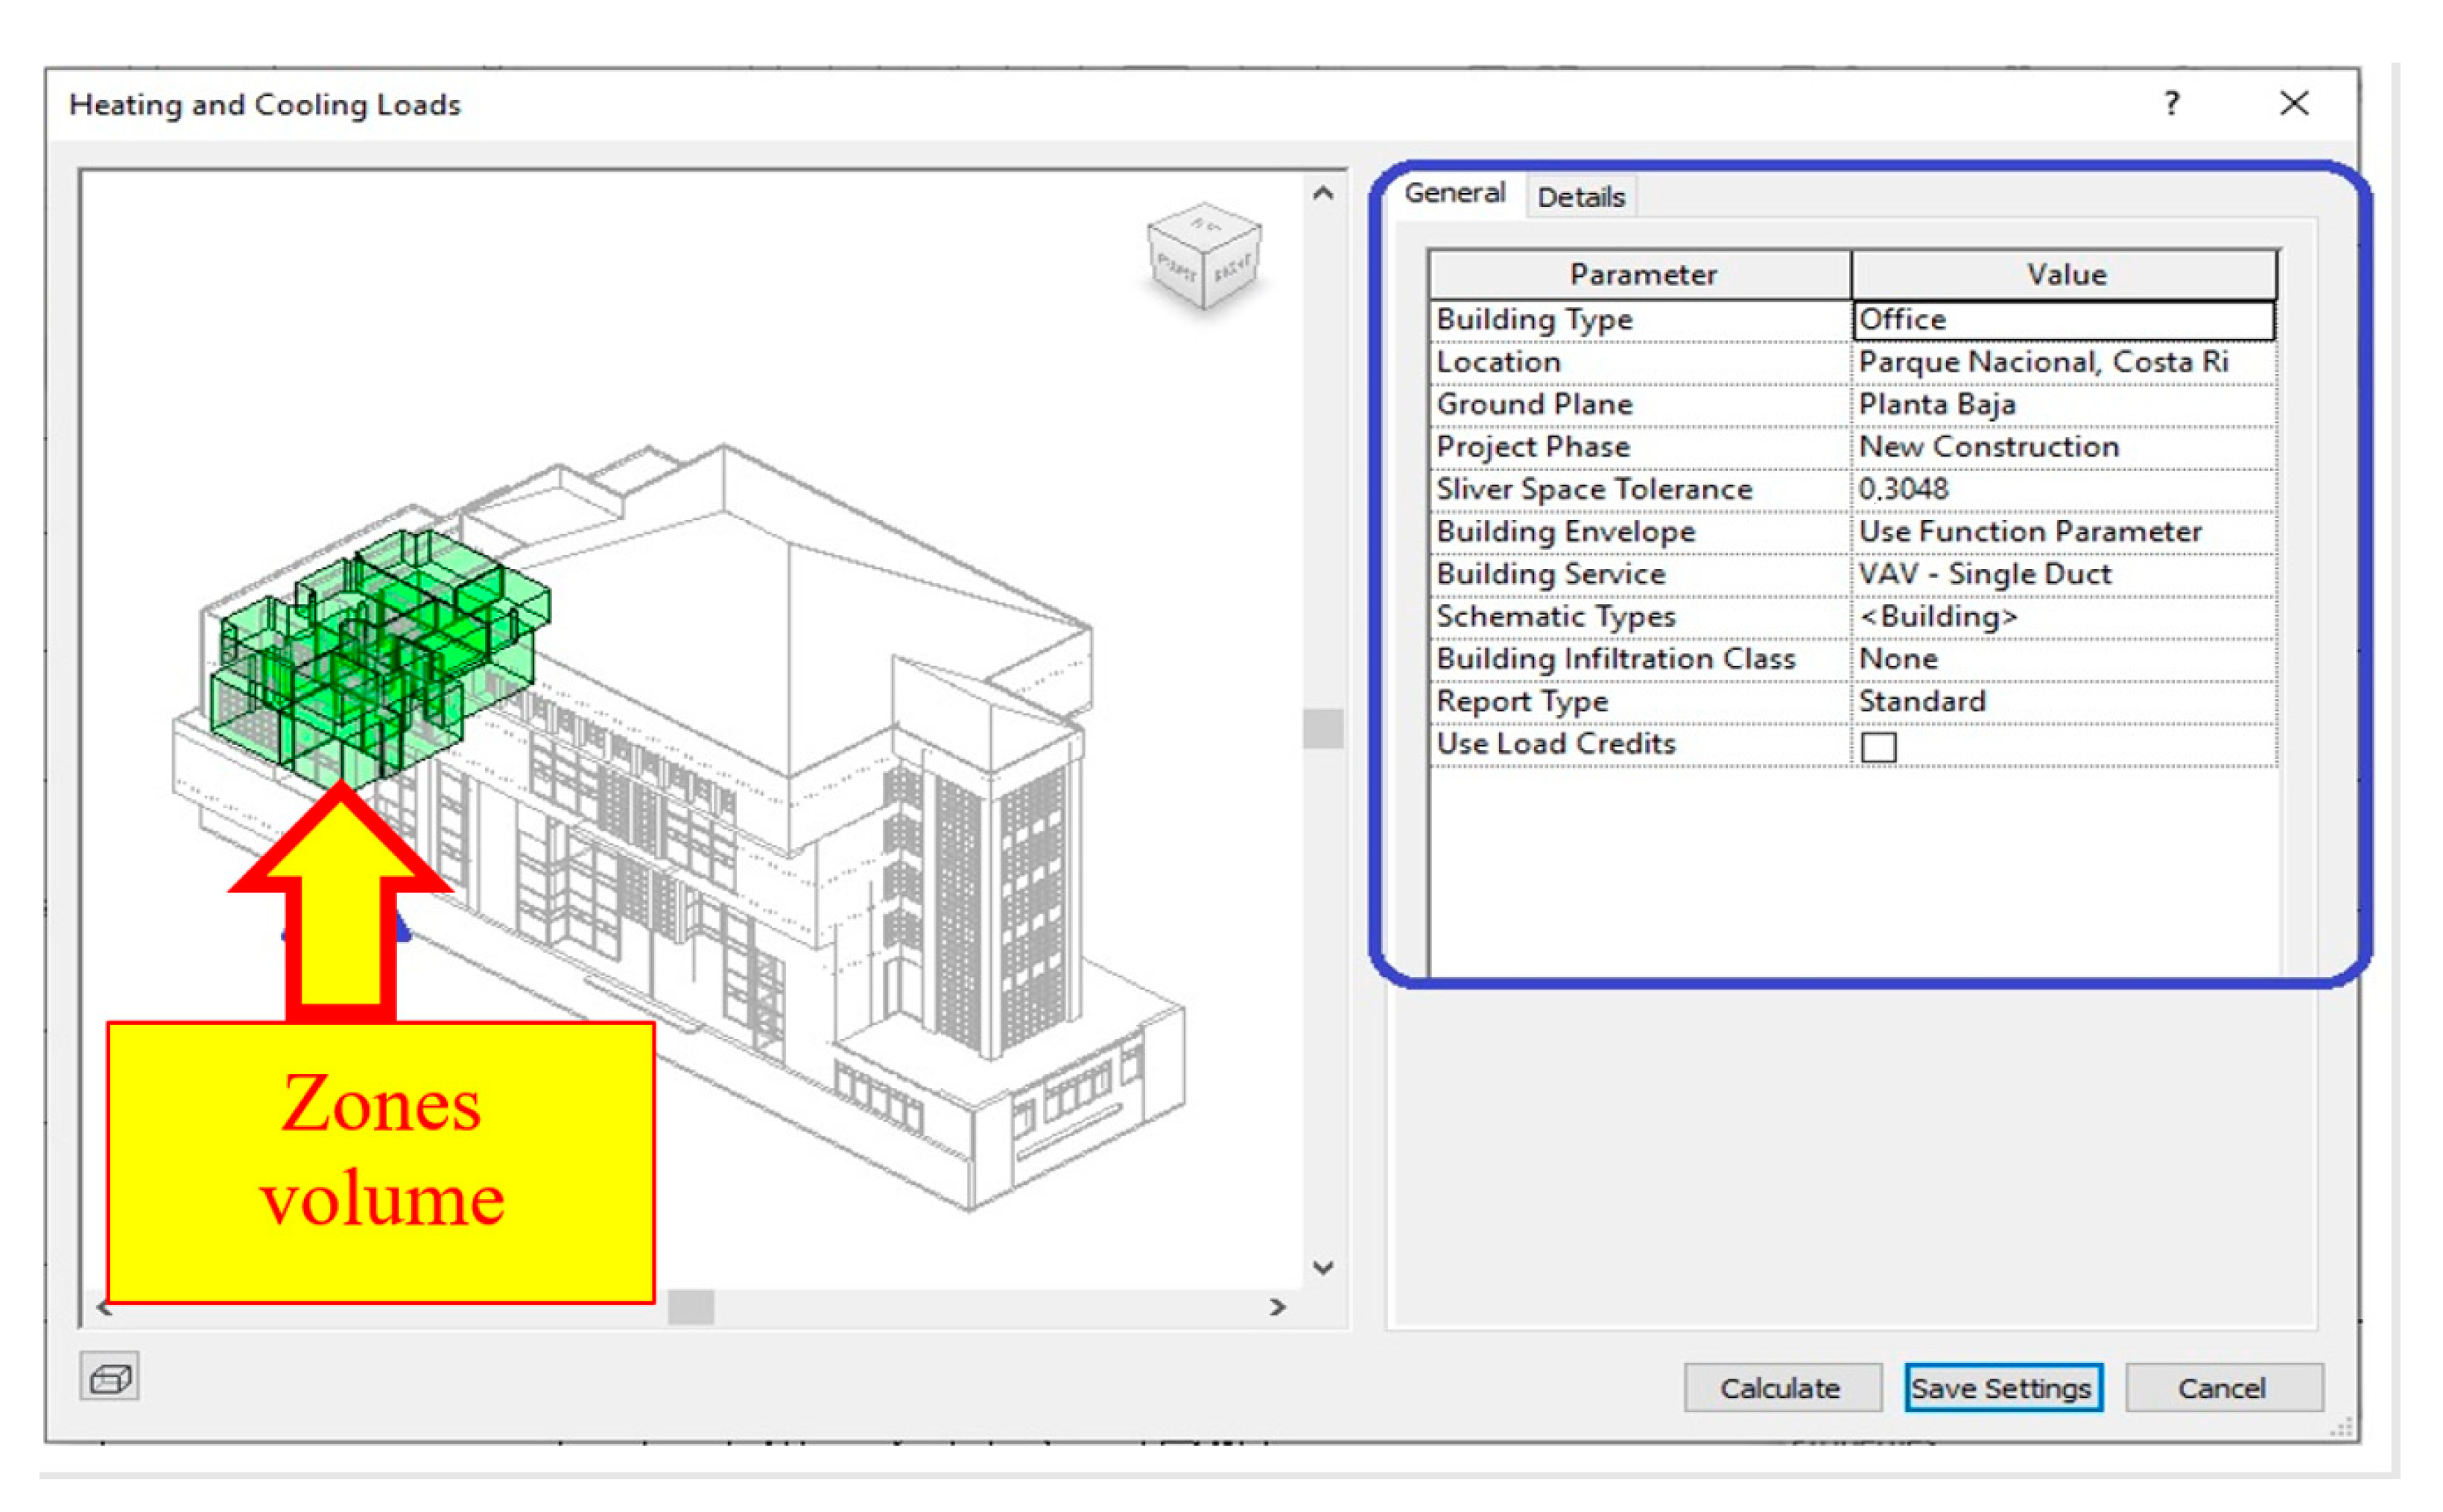
It is crucial to provide the software with the characteristics of people and electrical loads as well as specify the parameters for heating and cooling loads (Figure 9). By default, the remaining parameters can be maintained as they are, except for the building service parameter, where the cooling and heating systems of the building need to be specified. In the case of this study, the building is equipped with a variable air volume HVAC system—single duct, referred to as ‘VAV-Single Duct’.
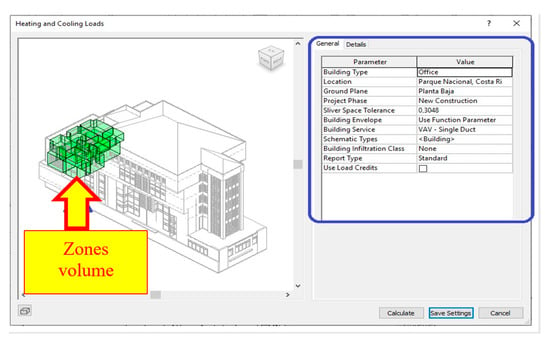
Figure 9.
Configuration of the heating and cooling loads. Source: own preparation.
The software generates reports showcasing the results of the simulation for the cooling thermal loads of the building, as presented in Table 2. The units utilized in these reports are BTU/h (where 10,000 BTU/h is equivalent to 2.9307 kW). It is important to highlight that the accuracy and interpretation of the analysis results obtained rely on experience and proficiency in utilizing the BIM tool [22].

Table 2.
Summary of cooling thermal loads of the building.
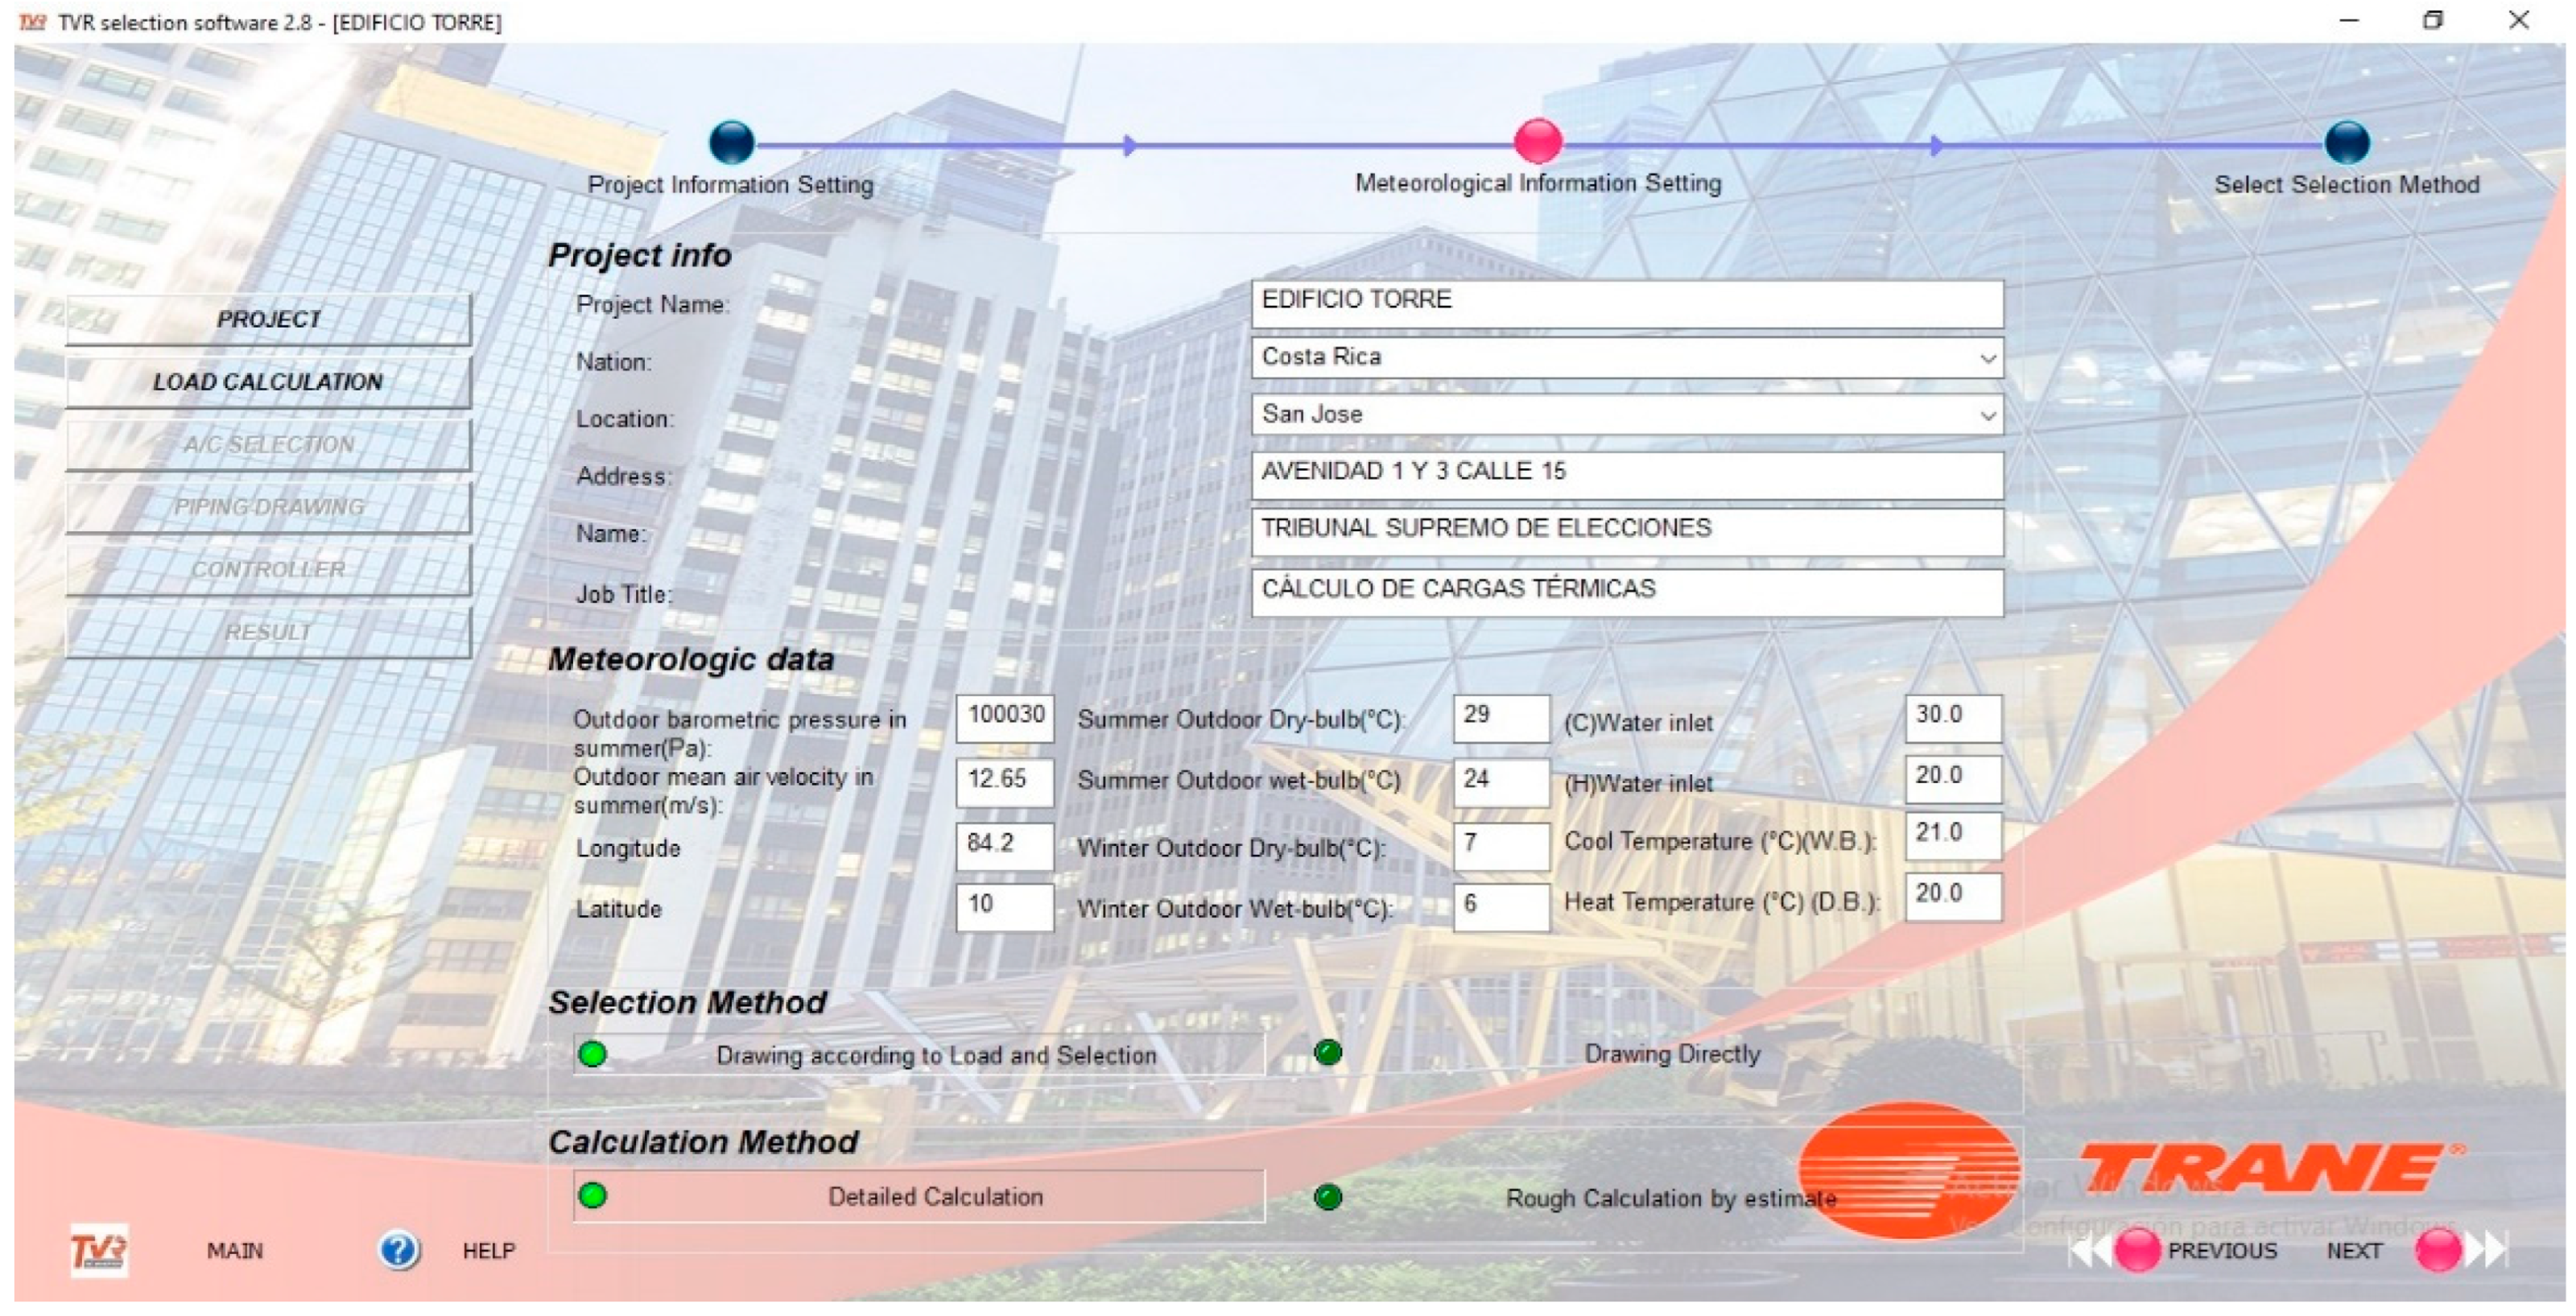
As an alternative calculation method to compare the data obtained in Revit, the ‘TVR Selection’ software from TRANE® was utilized (Figure 10).
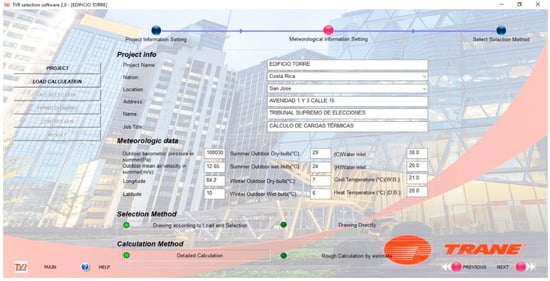
Figure 10.
Calculation of thermal loads with TVR software V.2.0 (TRANE®). Source: own preparation.
The results obtained indicate that the error between the usage of Revit and TVR is no more than 15.40%, as shown in Table 3.

Table 3.
Comparative results (Revit/TVR) of thermal load calculation.
Additionally, Table 4 provides a breakdown of the maximum values of the total cooling load for both the building and its zones, as obtained from Revit and detailed by components.

Table 4.
Heat load tables (cooling) by components for zones 2nd Level and 3rd Level (Revit).
3.3. Step 3: Proposal of Cost-Effective Solutions
To propose a viable solution to the problem, various combinations of components were simulated in Revit. These simulations considered changes to the roof, the exterior facade element, the glazing, and the installation of louvers, as presented in Table 5.

Table 5.
Different proposals, based on the combination of components, for the improvement of the thermal performance.
To analyze and compare the 33 proposals, solution 31 (representing the current state) is taken as a reference, and the following guidelines are followed:
- The useful life of all proposals is standardized to ensure comparability [5,9,10,11,12];
- A correction factor is applied to account for excessive deterioration caused by weather conditions for actions with a significant impact, following ISO 15686 [6];
- Different values are considered in the increase in the cost of energy in the market (the data presented have an annual increase of 2.5%).
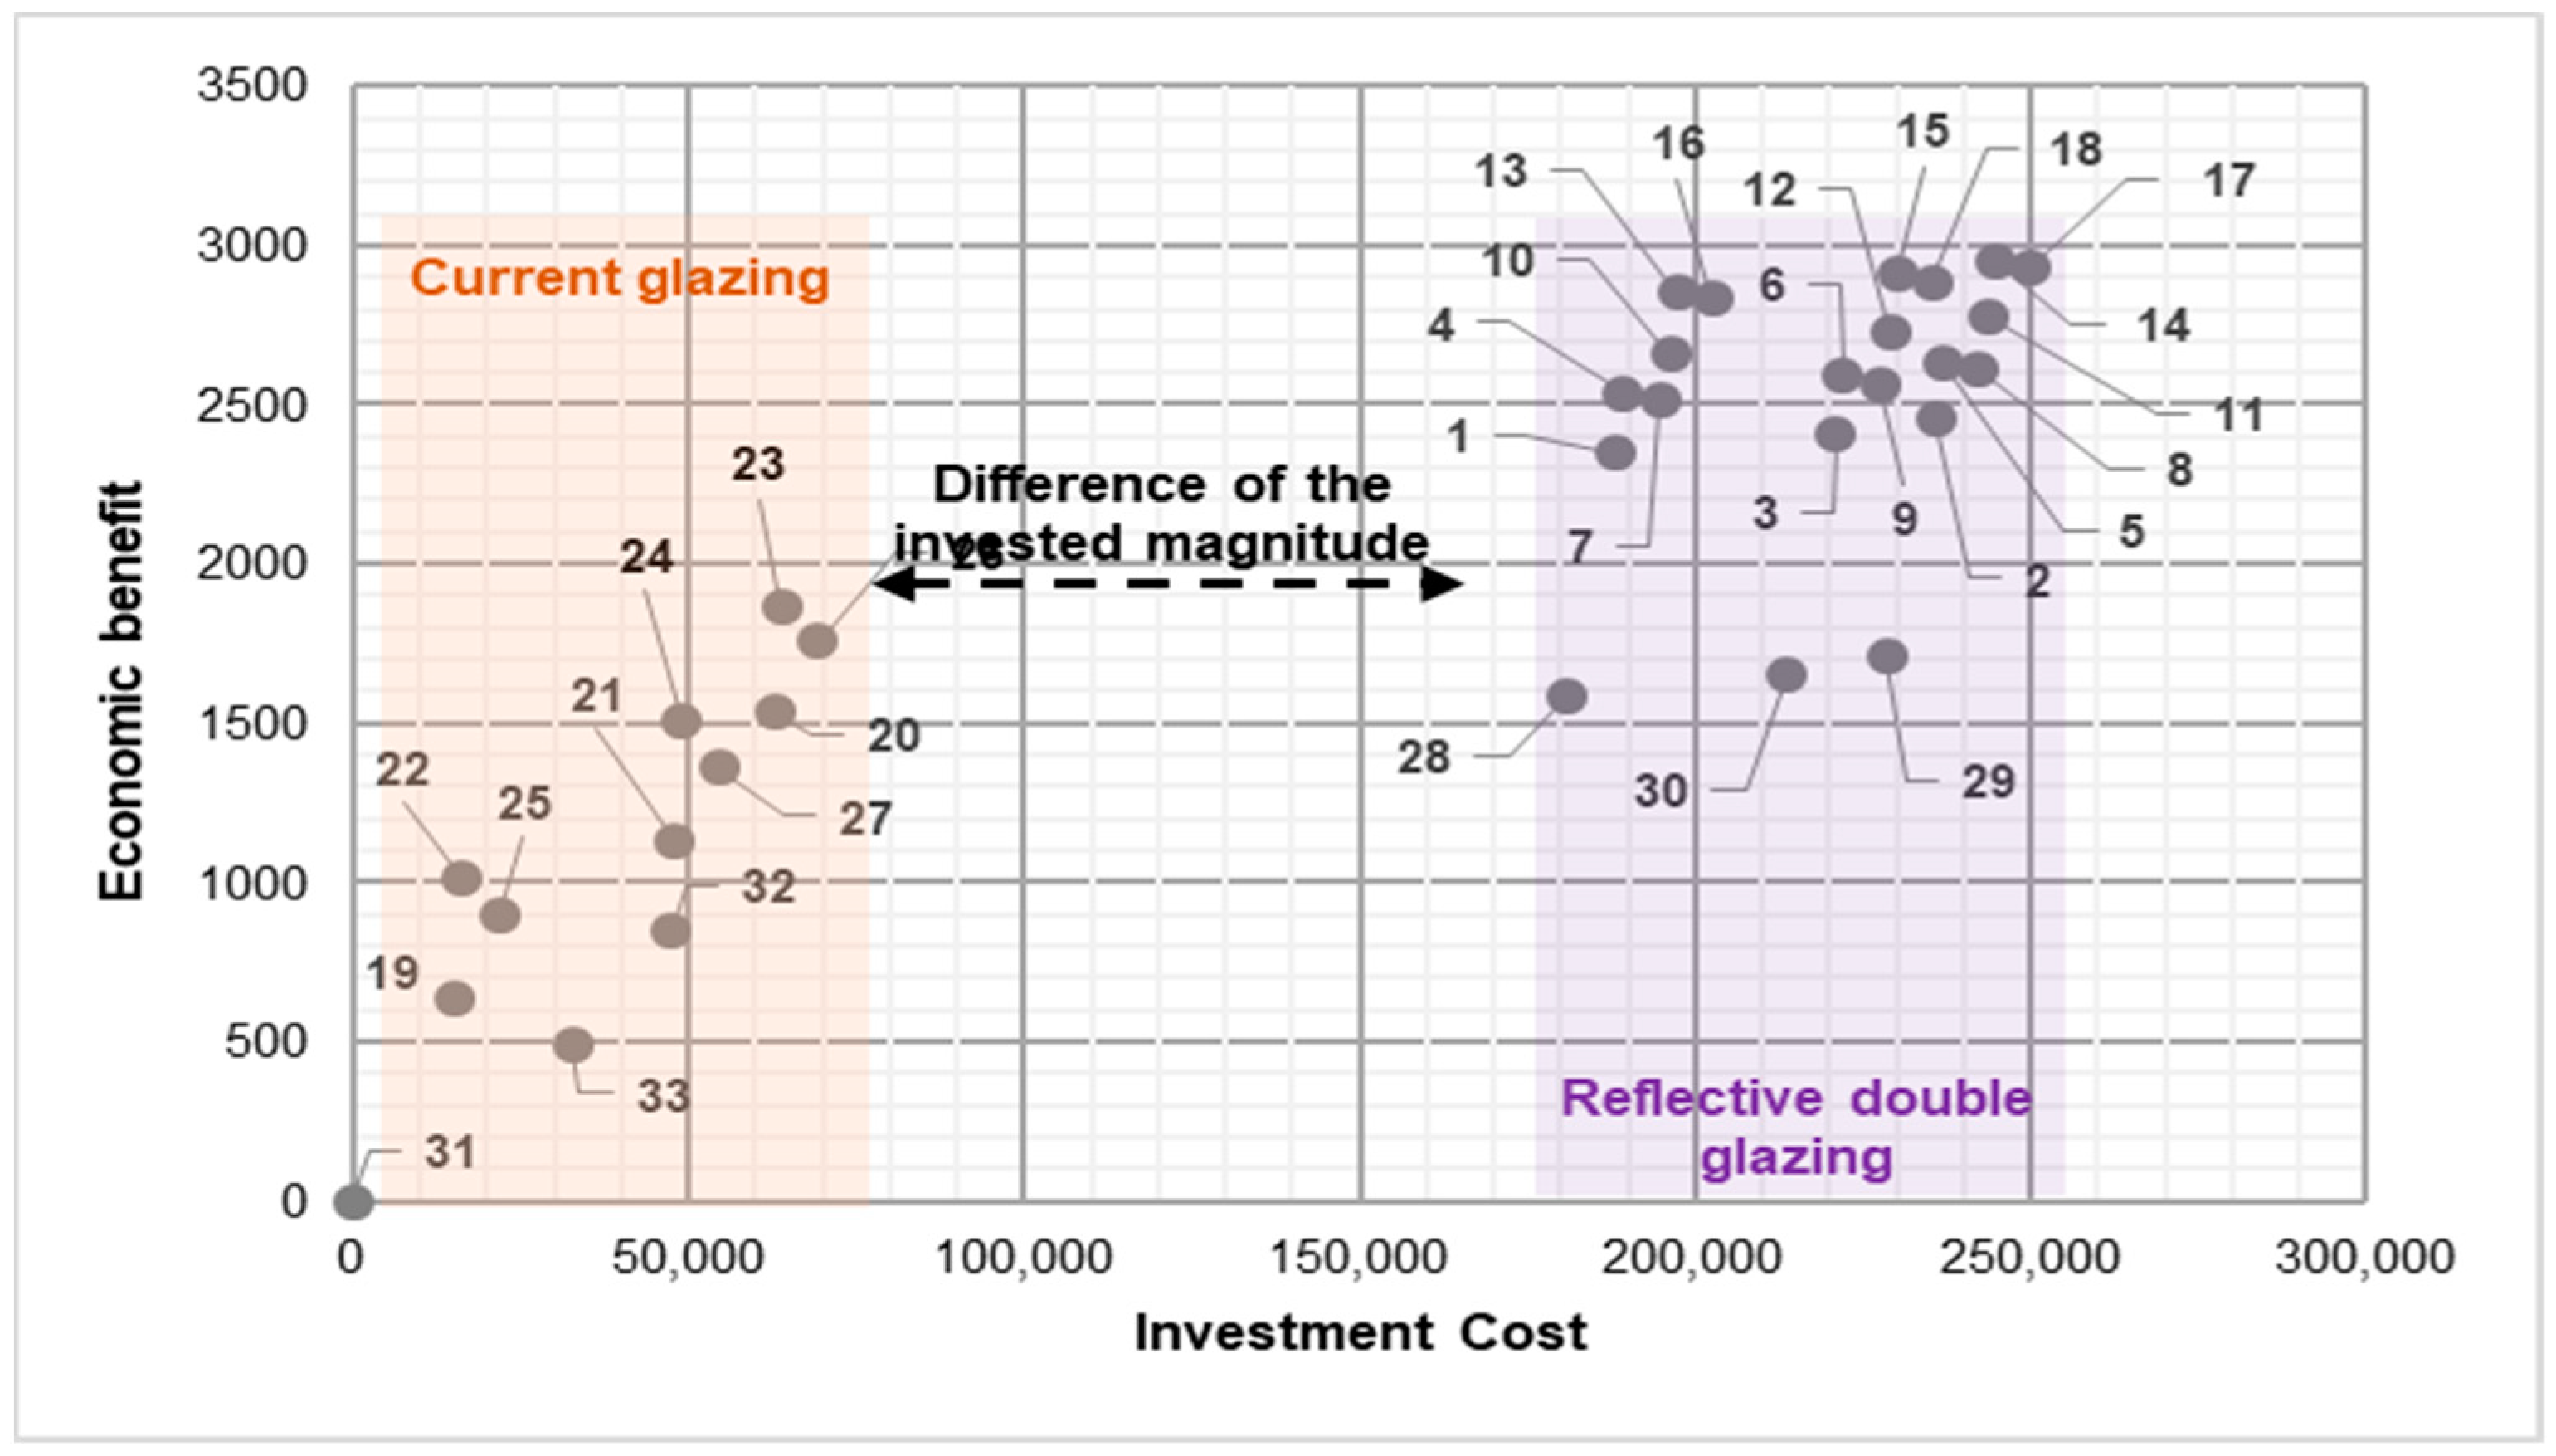
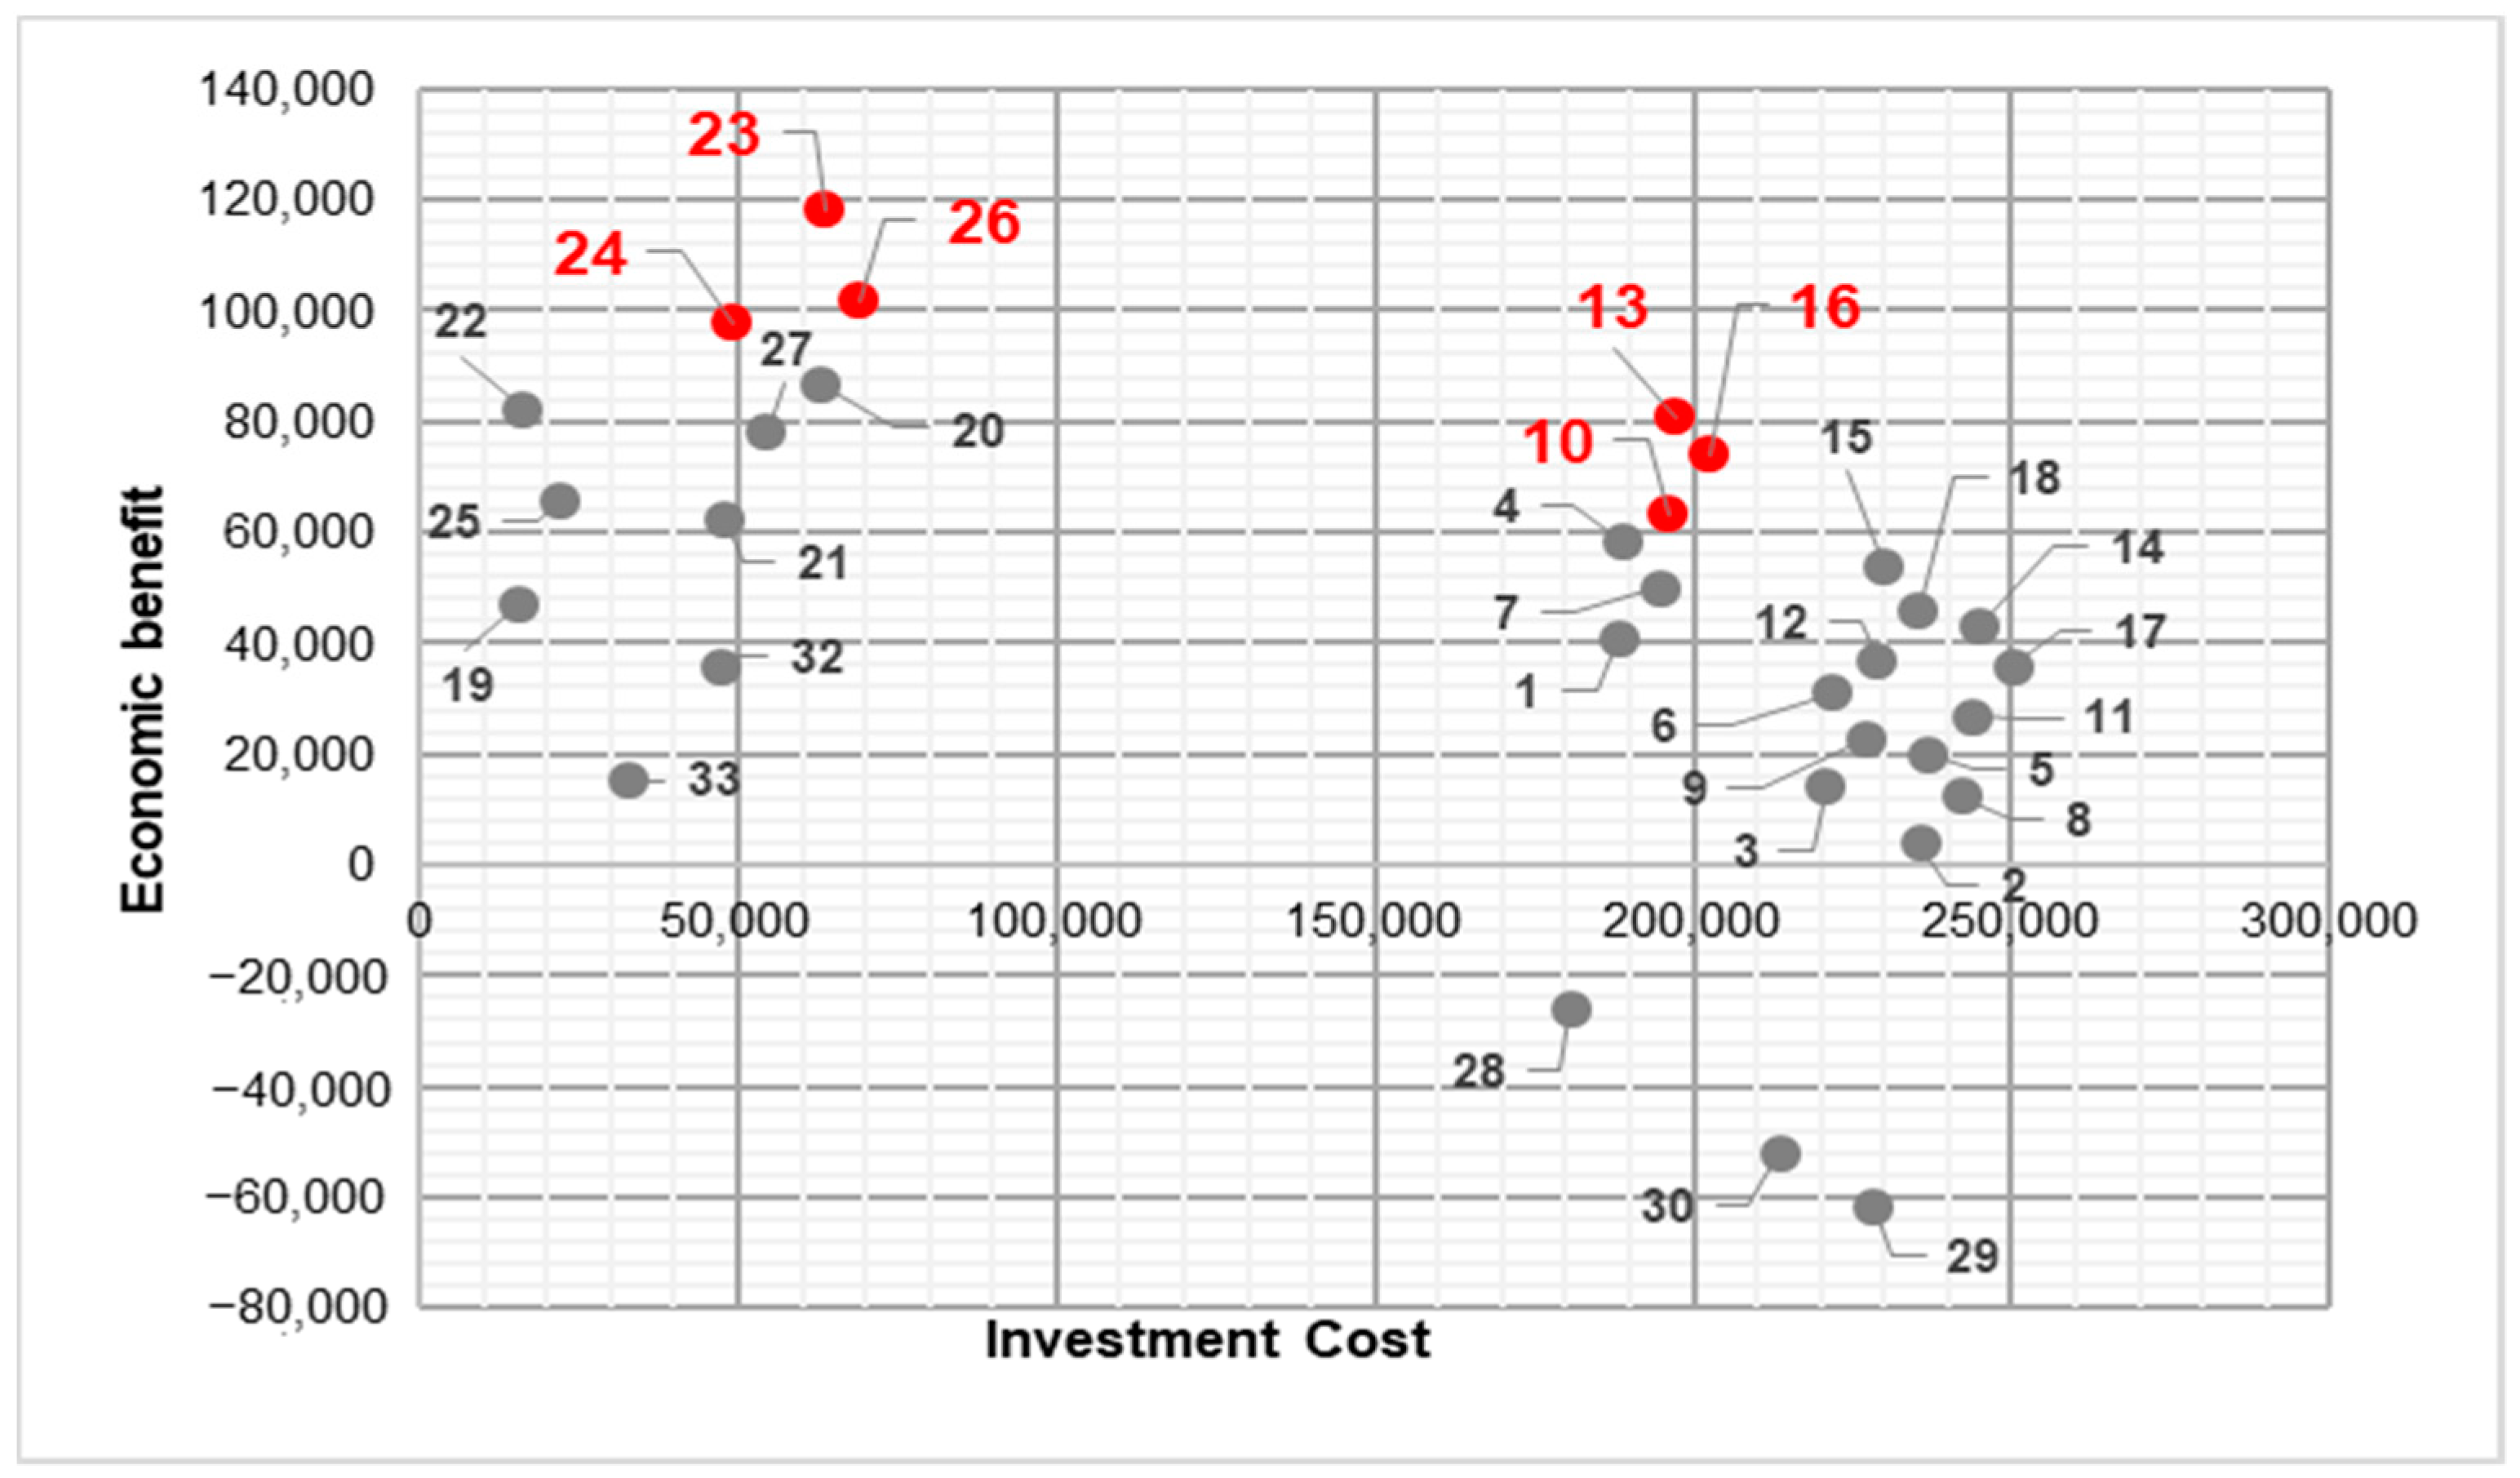
The comparative variables used are investment cost, annual energy savings, and end-of-life energy savings. Figure 11 and Figure 12 display the graphs obtained based on these variables.
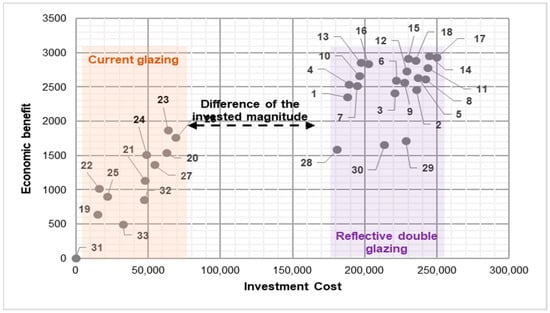
Figure 11.
Annual economic energy savings (EUR). Source: own preparation.
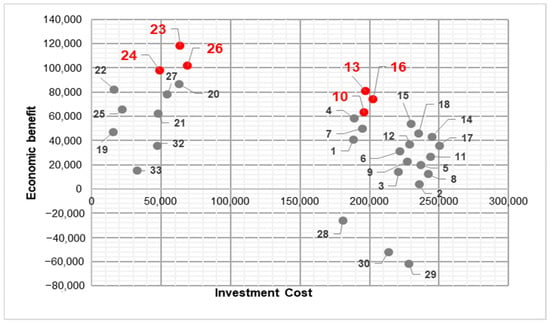
Figure 12.
Economic profit at end-of-life (EUR). Source: own preparation.
Figure 11 illustrates that the proposals with the highest investment costs also offer the greatest annual energy savings, which is highly significant from an environmental standpoint. Furthermore, there are two distinct groups of actions separated by a significant difference in investment, primarily corresponding to the treatment of the building’s glazing.
In contrast, Figure 12 displays significant investments (10, 13, and 16) that involve treating the roof, facade, and glazing, as well as smaller investments (23, 24, and 26) where the glazing is not treated but the protections are addressed. Prioritizing economic benefit, six proposals were selected, and their results are presented in Table 6.

Table 6.
Cost/Savings of 6 proposals selected as possible cost-effective solutions to be applied.
The two most interesting actions are 13 and 23, being, respectively, of high and low investment, and finding in 23 the highest profitability.
It should be noted that if the increase in energy is lower or higher than the 2.5% considered, it mainly affects those actions with significant energy savings, extending or reducing, respectively, the amortization period of the aforementioned investment.
4. Conclusions
Office buildings consume significant amounts of energy and incur high operation and maintenance costs throughout their lifespan. Therefore, simulations like the ones presented in this study are crucial for validating design concepts, optimizing available resources, and achieving substantial savings during the operational phase.
The investigation focused on exploring the capabilities and potential of an environmental performance prediction tool in assessing the impact of architectural features, such as solar shading, on energy performance within the building’s specific climatic context. The proposed solutions aimed to enhance energy performance and thermal comfort in a building with high cooling demands.
Moreover, the study highlights the importance of various variables in the decision-making process. Factors such as the useful life of actions, influenced by weather conditions, play a significant role. Additionally, considerations of risk and profitability from the investor’s perspective and construction conditions set by the builder influence the attractiveness of specific investments. All these aspects should be thoroughly evaluated in a technical–economic study to be carried out before the start of the works.
Based on the study, the following conclusions can be drawn:
- •
- Annual energy savings are inversely proportional to the total load;
- •
- The highest return on investment does not necessarily correspond to the highest initial investment;
- •
- Modifying the roof and the external elements of the facades are the most efficient actions, especially when considering internal facade modifications due to their lower exposure to climatic agents;
- •
- Glazing modifications entail a significant increase in investment;
- •
- Incorporating shading factor protection as an additional action yields good results when the glazing itself has not been modified, making it suitable for smaller investments.
- ○
- The greater the energy savings, the more impact there is on the investment’s amortization;
- ○
- If an annual increase of 1% is not reached, only investments with low initial costs prove to be profitable.
Therefore, the final decision depends on factors such as the investment risk tolerance, the desired immediate return, the projected lifespan of the action, and the reduction in emissions released into the atmosphere.
Finally, it can be concluded that, compared to other similar studies conducted using different techniques, the results obtained in this simulation, along with the findings from the economic analysis, demonstrate an advantage. The obtained results represent the conditions and direct effects that the adopted solutions would have on the model, as they would behave in their real physical counterpart, without the need to wait for implementation to evaluate their effectiveness. As for potential limitations of the method, it should be considered that a BIM model of the building is not always available, which would limit the use of this proposed methodology.
Author Contributions
The contributions to this document by each author are listed below. C.A.C.: data curation, formal analysis, methodology, investigation, writing—original draft. I.L.: conceptualization, formal analysis, methodology, resources, supervision, validation, writing—review and editing. J.R.A.: validation, writing—review and editing. F.J.B.: formal analysis, validation, writing—review and editing. K.V.: Data curation, Investigation. All authors have read and agreed to the published version of the manuscript.
Funding
This research received no external funding.
Data Availability Statement
Main data are contained within the article.
Conflicts of Interest
The authors declare no conflict of interest.
References
- Fernández, F.G. Clima y Confortabilidad Humana. Aspectos Metodológicos. Ser. Geográfica 1994, 4, 109–125. Available online: https://www.divulgameteo.es/fotos/meteoroteca/Clima-Confortabilidad.pdf (accessed on 25 May 2022).
- Ministerio de Ambiente y Energía. Instituto Meteorológico Nacional de Costa Rica. 2019. Available online: https://www.imn.ac.cr/web/imn/inicio/ (accessed on 18 April 2022).
- Compañía Nacional de Fuerza y Luz. 2022. Available online: https://www.cnfl.go.cr/ (accessed on 12 May 2022).
- Eusuf, M.A.; Kassim, S.J. Optimizing Tropical Sun Shading Systems Using Thermal Analysis. Inst. Arquit. Trop. 2017, 1, 8–16. [Google Scholar]
- Madrigal, L.O. Optimization and Proposal of a Method for the Estimation of the Durability of the Characteristic Construction Systems of the Valencian Community; Polytechnic University of Valencia: Valencia, Spain, 2013. [Google Scholar]
- Hernández Moreno, S. ¿Cómo se mide la vida útil de los edificios? Cienc. Acad. Mex. Cienc. 2016, 67, 68–73. Available online: https://biblat.unam.mx/es/revista/ciencia-academia-mexicana-de-ciencias/articulo/como-se-mide-la-vida-util-de-los-edificios (accessed on 15 May 2022).
- Ruedas Pérez, L. Envolvente Térmica. La Certificación Energética de Edificios: Experiencia y Perspectivas; Fundación Gas Natural Fenosa: Madrid, Spain, 2013. [Google Scholar]
- Sadeghifam, A.N.; Zahraee, S.M.; Meynagh, M.M.; Kiani, I. Combined use of design of experiment and dynamic building simulation in assessment of energy efficiency in tropical residential buildings. Energy Build. 2015, 86, 525–533. [Google Scholar] [CrossRef]
- Balbás, F.J.; Aranda, J.R.; Carrasco, C.; Ceña, A.; García, J. Energy Efficiency and Cost of Energy (Possible Scenarios). REHABEND 2022, 1, 1760–1767. [Google Scholar]
- Garcia, F.J.B.; Sierra, J.R.A.; Vozmediano, I.L.; Cabredo, L.V. Metodología Aplicada a la Eficiencia Energética Basada en un anterior Estudio Técnico-Económico Relacionado con el ciclo de vida de las Tecnologías. DYNA 2015, 90, 468–468. [Google Scholar] [CrossRef] [PubMed]
- Ferrara, M.; Monetti, V.; Fabrizio, E. Cost-Optimal Analysis for Nearly Zero Energy Buildings Design and Optimization: A Critical Review. Energies 2018, 11, 1478. [Google Scholar] [CrossRef]
- de la Rica, B.B.; Sasia, J.Z.; Aguilar, P.S.; Arriaran, L.G.; del Portillo Valdés, L.A. Desarrollo y puesta en práctica de una metodología hacia el diseño de ZEB coste-óptimo. Smart Communities 2018, 13, 13–22. [Google Scholar]
- Ojer, J.M.P.; Frances, V.S.; Lastra, A.G. Documentos Técnicos de Instalaciones en la Edificación (DTIE) 7.05 Cálculo de Cargas Térmicas; Asociación Técnica Española de Climatización y Refrigeración (ATECYR): Madrid, Spain, 2011; Volume 1, pp. 15–17. [Google Scholar]
- Autodesk. Software Autodesk Revit. 2023. Available online: https://www.autodesk.es/products/revit/overview?term=1-YEAR&tab=subscription (accessed on 13 July 2023).
- Insight—High Performance and Sustainable Building Design Analysis. Available online: https://insight.autodesk.com/oneenergy (accessed on 13 July 2023).
- Noticias Electorales. Tribunal TSE Acuerda Medida Para Recorte de Gastos. 2018. Available online: https://www.noticiaselectorales.com/costa-rica-tse-acuerda-medida-para-recorte-de-gastos/ (accessed on 20 July 2023).
- Sanou Alfaro, O. Guía de Arquitectura y Paisaje de Costa Rica; Junta de Andalucía: Sevilla, Spain, 2010; p. 400. [Google Scholar]
- Rodrigo, B.G.; Sanabria, J.C.; Marchamalo, M.; Umana, M. Análisis del confort y el comportamiento higrotérmico de sistemas constructivos tradicionales y actuales en viviendas de Santa Ana-Ciudad Colón (Costa Rica). Inf. Construcción 2012, 64, 75–84. [Google Scholar] [CrossRef][Green Version]
- Gonzalo, G.E.; Nota, V.M. Manual de Arquitectura Bioclimática Sustentable, 5th ed.; 2015. Available online: https://www.academia.edu/41191010/GEGonzalo_Manual_Arquitectura_Bioclimatica (accessed on 21 December 2022).
- Jaime, G.W. Estudio del potencial solar en Costa Rica. Uniciencia 2009, 23, 19–40. [Google Scholar]
- CSTB.Fr. “eveBIM—CSTB” eveBIM-Centro Científico y Técnico de la Edificación. 2020. Available online: https://www.evebim.fr/ (accessed on 4 May 2023).
- Shahsavari, F.; Koosha, R.; Yan, W. Uncertainty and Sensitivity Analysis Using Building Information Modeling—(An Energy Analysis Test Case). In Proceedings of the 24th Conference on Computer Aided Architectural Design Research in Asia (CAADRIA), Wellington, New Zealand, 15–18 April 2019; Volume 1, pp. 615–624. [Google Scholar] [CrossRef]
Disclaimer/Publisher’s Note: The statements, opinions and data contained in all publications are solely those of the individual author(s) and contributor(s) and not of MDPI and/or the editor(s). MDPI and/or the editor(s) disclaim responsibility for any injury to people or property resulting from any ideas, methods, instructions or products referred to in the content. |
© 2023 by the authors. Licensee MDPI, Basel, Switzerland. This article is an open access article distributed under the terms and conditions of the Creative Commons Attribution (CC BY) license (https://creativecommons.org/licenses/by/4.0/).

