Article

The Influence of GGBFS as an Additive Replacement on the Kinetics of Cement Hydration and the Mechanical Properties of Cement Mortars

1
Department of Inorganic Technology, Faculty of Chemistry and Technology, University of Split, R. Boškovića 35, 21000 Split, Croatia
2
CEMEX Hrvatska d.d., F. Tuđmana 45, 21212 Kastel Sucurac, Croatia
3
Department of Materials, Faculty of Civil Engineering, Architecture and Geodesy, University of Split, Matice Hrvatske 15, 21000 Split, Croatia
*
Author to whom correspondence should be addressed.
Buildings 2023, 13(8), 1960; https://doi.org/10.3390/buildings13081960
Submission received: 8 July 2023 / Revised: 28 July 2023 / Accepted: 29 July 2023 / Published: 1 August 2023
(This article belongs to the Special Issue Novelties in the Production of Mineral Binders and Concrete)

Abstract

:
Granulated blast furnace slag (GBFS) is a byproduct of the iron production process. The objective of this study is to determine the effects of ground granulated blast furnace slag (GGBFS), used as a replacement admixture (0–40 wt.%) for ordinary Portland cement (OPC), on the setting time, the heat of hydration, and the mechanical properties of cement mortar. The influence of GGBFS as a replacement additive on the setting time shows that it has an accelerating effect on cement hydration. Calorimetric measurements were performed on the cement paste system to determine the effects of GGBFS on the hydration of OPC. Calorimetric measurements carried out show that the replacement of GGBFS in an amount up to 40 wt.% reduces the total heat of hydration by up to 26.36% compared to the reference specimen. The kinetic analysis performed on the calorimetric data confirms the role of GGBFS as an accelerator by shortening the time during which the process of nucleation and growth (NG), as the most active part of hydration, is reduced up to 2.5 h. The value of the Avrami–Erofee constant indicates polydispersity and heterogeneous crystallization. Mechanical tests of cement mortars were performed after 3, 7, 14, 28, 70, and 90 days of hydration and showed that replacement addition of GGBFS slightly reduced the mechanical properties in the early phase of hydration, while in the later phase of hydration it contributed to an increase in the mechanical properties.

1. Introduction

Global industrialization, urbanization, and the development of society have brought cement production to the forefront as the most important building material. Global cement demand and production has increased compared to that in 1995, when the total volume of global cement production was 1.39 billion tons, and it is estimated to reach 4.1 billion tons in 2022 [1]. Cement production requires a large amount of energy, and the process itself is associated with high greenhouse gas emissions, mainly carbon dioxide (CO2), which have a significant impact on global warming [2]. To reduce CO2 emissions during cement production, various waste materials that are byproducts of different industries, such as blast furnace slag (BFS), fly ash (FA), and silica fume (SF), are used as clinker substitutes. The use of these waste materials during the recycling and recovery process in the cement industry has significant economic and environmental benefits for industry, society, and the environment. From an environmental point of view, reusing waste materials, especially in the cement industry, has significant impacts by reducing waste materials, preserving natural resources, as well as prolonging the lifetime of concrete structures [3,4,5,6,7,8,9,10].
BFS is a byproduct of iron production. Iron ore (a mixture of iron oxides, silica, and alumina), fluxing agents (limestone and dolomite), and coke as fuel and a reducing agent are used for charging a blast furnace. Blast furnace slag is formed through reactions with fluxes, combustion residues, and impurities, and it is separated from iron ore during iron production. Blast furnace slag is formed as a liquid at 1350–1550 °C. Depending on the cooling method, three types of BF slag are produced: air cooled, expanded, and granulated. Granulated slag is produced by quenching the molten slag into glass granules using high pressure water jets. Quenching is very important because it prevents crystallization of minerals leading to a granular and glassy aggregate. In the cement industry, GBFS is crushed and pulverized (ground granulated blast furnace slag, GGBFS) [11,12].
GGBFS has been used in the cement industry as a clinker substitute material in the amount of 35–95 wt.%. According to the European standard, the cement produced using GGBFS belongs to the CEM III type A–C [13,14,15]. The main properties of this type of blended cement are low heat of hydration, low compressive strength in the early phase of hydration, and very good resistance to aggressive sulphate environment [16,17]. This type of cement is suitable for preparing concrete which can be used in warm climates, for structures in humid and especially aggressive environments rich in sulphates, for maritime and littoral objects, etc. By changing the blast furnace slag ratio and/or fineness appropriately, it is possible to manufacture cements suitable for specific uses or purposes [3]. The physicochemical properties of GGBFS from the iron industry largely depend on the technology, the quality of the raw materials used for iron production, and the cooling method. Moreover, active amorphous aluminosilicate compounds obtained by quenching play a positive role in promoting the reaction between GGBFS and cement, especially in the performance of the developed mechanical properties of cement paste and mortar and their microstructures [18]. It is known that GGBFS, as a supplementary cementitious material, affects the hydration of cements in different ways, depending on its chemical and mineralogical composition, specific surface area, particle size distribution, and other factors. Due to the different physicochemical properties of GGBFS, there is a need to systematically study the reactivity characteristics of GGBFS and their influences on the mechanism of cement hydration and hardening. A study by Y. Balim et al. confirmed that increasing the amount of GGBFS in a cement composite reduced the peak hydration rate. The contribution of GGBFS by the soluble compounds contained in GGBFS to the total heat released during hydration was 0.23 W/kg, which was too low a value to be interpreted as a separate peak rate [19]. Increased replacement of GGBFS in OPC has been shown to reduce the total heat released during the hydration of cement [4,20]. Many cementitious additives, such as GGBFS, are hydraulically active, i.e., they are capable of generating additional hydration products through pozzolanic reactions similar to OPC hydration products. Pozzolanic reactions occur much more slowly and are not expected during the early phase of hydration. During the early hydration phase of a cement substitute, the addition of GGBFS provides an active surface for the nucleation of hydration products, which may accelerate the early hydration of the cement itself [21,22,23] The effects of adding GGBFS on the mechanical properties of cement mortars, up to 28 days of hydration, were studied by Abdul S. et al. They found that a small addition of GGBFS, up to 10 wt.%, increased the compressive strength, and a larger addition decreased the compressive strength. They found that sand behaved as an inert filler with a weak interfacial zone between the cement paste and sand. GGBFS as a replacement additive improved the bond between the binder and the sand, and resulted in a denser microstructure and higher strength of the mortar [23]. A study by Ahmad, J. et al. showed that GGBFS as a replacement additive, although it reduced the compressive strength in the early phase of hydration, increased the compressive strength during the later phase of hydration due to its pozzolanic reactivity [22].
Therefore, the aim of this study was to determine the effects of GGBFS on the hydration kinetics of cement and cement mortar properties. The GGBFS used in this study was produced at ArcelorMittal, Zenica, Federation of Bosnia and Herzegovina. GGBFS was used as a replacement additive in the amount 5–40 wt.% on the mass of OPC (CEM I 42.5 R). Its influence on the early phase of hydration was determined by following the setting time using the Vicat method and applying PXRD as in situ, time-resolved measurements, for the purpose of following the hydration process. Calorimetric measurements were used for determining total heat released during hydration, up to 48 h. The heat released during the early phase of hydration was used for an analysis of the kinetics of cement hydration. In addition, the influence of GGBFS on the developing mechanical properties of cement mortars was investigated in cement mortar systems. For the preparation of mortars, GGBFS was used as a replacement additive, up to 40 wt.% on the mass of OPC. Mechanical properties, i.e., compressive and flexural strength, were tested after 3, 7, 14, 28, 70, and 90 days of hydration.

2. Materials and Methods

2.1. Cement

The ordinary Portland cement type CEM I 42.5 R (OPC) was prepared at a semi-industrial laboratory ball mill at CEMEX Hrvatska d.d., factory Sv. Kajo, Kaštel Sućurac, Croatia. The capacity of the ball mill was 6 kg. The grinding media in the ball mill were steel balls (total weight 68.5 kg) composed of different sizes (from 20–90 mm) to obtain maximal grinding efficiency. During the milling process, the rotation speed of the mill body was optimized at 50 rpm. The mineral mixture used in the cement preparation consisted of an industrially produced clinker (97–99 wt.%), gypsum (1–3 wt.%), and an additive for improving the milling properties. The additive was commercially available under the trade name HEA 213 HEA2®, a product of GCP Applied Technologies, Inc., and was applied on the mass of the clinker in the amount of 0.032 wt.%. Gypsum addition was limited by the total amount of SO3 which was limited to a maximum value of 3 wt.%. In order to control the addition of gypsum, the content of SO3 was measured in the clinker (before addition of gypsum) and after producing the cement. The physical and chemical composition of CEM I 42.5 R are shown in Table 1.
The contents of Cr6+ and Cl were determined according to the standards HRN EN 196-10:2016 and HRN EN 196-2:2013. The results showed that the Cr6+ and Cl contents were 16.35 ppm and 0.007 wt.%, respectively. The mineral composition of the produced OPC was determined by using powder X-ray diffraction (PXRD). The powder X-ray diffraction (PXRD) measurements were performed using a 3rd generation Malvern Panalytical Empyrean diffractometer. The X-ray source used a tube with a Cu anode and the generator settings were 45 kV and 40 mA. The detector was a PIXcel3D Detector with Medipix3. The diffraction pattern of the cement was collected using gonio scan with a step size of 0.013° and a scanning angle (°2Theta) from 2 to 80°. For data treatment, the collected patterns were corrected for systematic errors (external Si standard). The qualitative interpretation of the PXRD pattern was compared to standard patterns contained in the database PDF2 (ICDD, PDF2 Released 2020) using HighScore Plus. A semi-quantitative analysis of the mineralogical composition was calculated based on the Rietveld method and using a Crystallographic Information File (CIF) from the ICSD FIZ Karlsruhe database. The results of the analysis of the PXRD powder pattern of the polycrystalline cement specimen are shown in Figure 1.
The results of the semi-quantitative analysis of the OPC specimen are shown in Figure 1. The results of the mineralogical composition of OPC show that the main mineral phases are alite (C3S, 64.3 wt.%), belite (C2S, 10.1 wt.%), tricalcium aluminate (C3A, 2.5 wt.%) and tetracalcium aluminoferrite (C4AF, 16.0 wt.%) [24,25,26,27].

2.2. Ground-Granulated Blast Furnace Slag

The GBFS used in the preparation of the cement mixture originated from the iron production plant ArcelorMittal, Zenica, Federation of Bosnia and Herzegovina. The GBFS is a byproduct in the production of iron, produced by cooling the blast furnace slag in large volumes of water [8]. The GGBFS was prepared by milling GBFS in a semi-industrial ball mill. The chemical composition of the GGBFS was determined using X-ray fluorescence (XRF) (Table 2) and structural characterization was performed by powder X-ray diffraction (PXRD) (Figure 2).
The requirements for GGBFS that can be used in the preparation of cement mortar are described in EN 197-1:2012. The requirements for GGBFS that can be used in the preparation of concrete are described in EN 15167-1:2006. These norms relating to the quality of GGBFS require that the sum of the oxides, i.e., CaO + MgO + SiO2 should be greater than 2/3 of the total mass and the ratio of the oxides ((CaO + MgO)/SiO2) > 1. The results of the chemical analysis of GGBFS are presented in Table 2 and show that the sum of the oxides (CaO + MgO + SiO2) is 83.38% (Table 2), i.e., more than 2/3, while the ratio of the oxides ((CaO + MgO)/SiO2) = 1.14, which indicates that GGBFS is suitable for the preparation of the cement composite.
All mineral admixtures such as GGBFS, with chemical compositions based on amorphous aluminosilicate, are suitable for use in the production process of cement or concrete/mortar. GGBFS is suitable as a mineral admixture because it can play two main roles during the hydration of cement. The first role is related to its specific surface area. During the early phase of hydration, the GBFS particles play a physical role, also known as the filler effect, where they serve as a place for nucleation and growth products of hydration. The second role of GBFS is associated with its chemical reactivity in an alkali environment, known as pozzolanic reactions, in which amorphous aluminosilicate reacts with portlandite and produces additional C-S-H phases [28,29,30]. Additional C-S-H phases formed by the pozzolanic reactions in the pores of the hardened cement composite have a significant influence on the increase in mechanical properties and, consequently, on the decrease in porosity and permeability.
The PXRD pattern of GGBFS is shown in Figure 2. The dominant diffraction maximum in the pattern is a very diffuse diffraction maximum in the range of 2Theta from 20 to 38°, indicating an amorphous structure of GGBFS. The very high intensity of the background in the diffraction pattern of GGBFS is due to the residual iron.
SEM/EDS analyses of GGBFS were performed in low vacuum scanning electron microscopy using a Jeol JEM-7610F Plus equipped with an Oxford Ultim Max 65 SDD X-ray analyzer for the EDS analysis. The accelerating voltage and pressure were up to 1 kV and 4.4 × 10⁻⁴ Pa, respectively, for secondary electron image acquisition (SEI) and the voltage ranged from 15 to 20 kV for the elemental analysis. Figure 3 shows SEM images and energy-dispersive spectroscopy (EDS) mapping of a 11.25 × 8.12 μm surface of GGBFS, which confirm the presence of spherical particles of iron as well as trace presence elements such as Ti, P, Zn, K, Mg, Mn, Cu (Table 3).

2.3. The Setting Time and the Heat of Hydration of OPC in the System of Cement Pastes and Their Mixtures Prepared with GGBFS as a Replacement Additive

Cement mixtures were prepared to determine the effect of GGBFS on setting time and heat of hydration. The cement mixtures were prepared without GGBFS and with GGBFS as a replacement additive in the amounts of 5, 15, 20, 25, 30, and 40 wt.% of the cement mass (OPC). The specimens were labeled as follows: PB0, PB5T, PB15T, PB20T, PB25T, PB30T, and PB40T, where the number refers to the wt.% of GGBFS and T indicates the addition of GGBFS. The specimen prepared without the addition of GGBFS was labeled as PB0 and represented a reference specimen. Distilled water was used for the preparation of the cement paste. The addition of water to achieve normal consistency as well as the beginning and end of the setting time were determined on the prepared specimens using the Vicat method according to HRN EN 196-3:2016.
The influence of GGBFS on the heat released during the cement hydration process was analyzed by differential microcalorimetry (DMC) [31]. The specimen for calorimetry was prepared by placing a mass of 4 g of mixed cement (separately for each mixture) in a calorimetry cell that was filled with 2 mL of distilled water (the ratio of water to cement must be 0.5 (w/c = 0.5)). At least 24 h before starting the hydration reaction, the cement and water specimens were placed in thermostated basins at a temperature of 20 ± 0.01 °C, and the hydration process was started by adding water to the cement. During 48 h, the thermoelectric voltage (mV) was measured with a data logger, recorded, and stored. The heat released by the process of hydration is calculated using the following equation:
Q t = C p g m U t + β t 0 t U t d t · 1000
where Cp is the heat capacity of the microcalorimeter (43.4368 J/°C), g is the proportionality constant (303 μV/°C), β is the cooling constant (0.022∙60 s−1), m is the mass of the specimen (4.0000 g), and  U  is the voltage difference between the referent and specimen cell into differential micro calorimetry (mV). Based on the measurement data obtained by the DMC method in cement systems without and with GGBFS addition during 48 h of hydration, the heat of hydration was determined at specific time intervals. The heat released during cement hydration is the result of hydration of cement clinker minerals, gypsum, free lime (CaO), MgO, and other constituents present in the cement as well as into GGBFS, and represents the total heat of hydration for a given hydration time, i.e., from the released heat of hydration at time t and the total released heat of hydration after 90 days of hydration, Qmax (determined by the dissolution method). The degree of hydration in precisely defined times can be determined according to the following equation:
α t = Q t Q max
where Q(t) is heat released in time t (J) measured by DMC. In the hydration of a pure mineral, α(t) represents the degree of hydration (degree of reactivity) of the mineral. However, in cement hydration, α(t) is a consequence of the combined action of all cement constituents present and it represents the degree of cement hydration.

2.4. Developing the Model of Cement Hydration

The kinetic analysis of cement hydration can be based on studying the time variations of the observed effects such as released heat of hydration, content of portlandite Ca(OH)2, content of chemically bound water, chemical composition of pore water, etc. [9,10,12,32,33,34]. The mathematical models of cement hydration kinetics have been developed on the basis of the basic idea of mechanisms in solid state reactions which include the mechanisms of nucleation and growth of hydration products (NG), the interaction at the phase boundary (I), and the diffusion mechanism through the solid phase (D) [33,35]. The process of cement hydration, according to the models, proceeds via three basic mechanisms for controlling the rate of hydration reactions of anhydrous cement particles with water or aqueous solution, so that each of these mechanisms proceeds according to a specific kinetic law, while the overall rate of hydration reactions is determined by the slowest process. Bezjak and Jelenić proposed models of the hydration kinetics of cement as a heterogeneous polydisperse system, using the method of mathematical splitting of overlapping rate-determining processes [35]. The basic assumption of the model of hydration reaction on the surface of a solid particle is the simultaneous occurrence of three processes (NG, I, and D), where the overall hydration reaction rate is determined by the slowest of the three mentioned processes. They concluded that the reaction rate determined by the process of nucleation and growth of the product (NG) follows the Avrami–Erofee Equation (3), the reaction rate determined by the process of the interaction at the phase boundary (I) follows Equation (4), and the process governed by the process of diffusion (D) follows the Janders Equation (5), and all reactions are represented by the kinetic differential function /dt = f(T,t) which has been derived from the basic α-t functions:
F N G ( α ) = d α d t = n k NR n t n 1 e ( k NR t ) n
F I ( α ) = d α d t = 3 k I ( 1 k I t ) 2
F D ( α ) = d α d t = 3 2 k D 1 ( k D t ) 1 2 2 ( k D t ) 1 2
where α is the degree of hydration,  k N G  is the nucleation and growth constant (h−1), t is the hydration time (h),  k I  is the interaction constant at the phase boundary (μmh−1), and  k D  is the diffusion constant (μm2h−1). The value of the exponent n in Equation (3) describes the geometry of crystal growth and is usually between 1 and 3 [12,33]. A value of the parameter n greater than 3 indicates three-dimensional growth and multiple nucleation [36,37]. According to the assumed model, the slowest process at the beginning of cement hydration, which determines the hydration rate, is the NG process. The second process that determines the hydration rate is the interaction at the phase boundary (I), and the third and last process that determines the hydration rate is diffusion (D). The transition times when the processes I or D begin to control the hydration process are defined by the transition times  t N G - I  and  t I - D ,  respectively. The transition time is the time when the rates of the controlling processes are equal, for example, transition time from NR into I is a time ( t N G - I ) when it satisfies equation  d α / d t N R = d α / d t I  or transition time from I into D (period of hydration when the diffusion process is the overall controlling process of the hydration of cement) is a time ( t I - D ) when it satisfies equation  d α / d t I = d α / d t D .

2.5. Preparation Cement Mortars

In order to determine the influence of GGBFS on the mechanical properties, the cement mortar was produced with and without the addition of GGBFS according to the standard HRN EN 196-1 and commercially available CEN norms, and standard sand according to DIN EN 196-1 was used as the aggregate. The ratio between sand and cement (or mixture of cement and GGBFS where it is used as an additive) was constant for all mixtures and it was 3:1 by mass. The addition of water in the preparation of the mortar was optimized (Table 4) so that the mortar specimens had the same consistency within the limits of 197 ± 20 mm. The consistency was measured by spreading the mortar on a flow table. Two reference mortars were prepared in the preparation mortars, and both were prepared without the addition of GGBFS. One reference specimen was prepared without the addition of GGBFS and superplasticizer and labeled as PB0; the second reference mortar was prepared with the addition of superplasticizer and labeled as PB0S. The mortars containing GGBFS were prepared by replacing the cement with 5, 15, 20, 25, 30, and 40 wt.% GGBFS and adding a superplasticizer additive and, as shown in Table 4, they were labeled as follows: PBT5S, PBT15S, PBT20S, PBT25S, PBT30S, and PBT40S, respectively. The superplasticizer was based on a polycarboxylic ether from the manufacturer BASF, available on the market under the trade name MasterGlenium ACE 430. Superplasticizer was added in an amount of 0.87 wt.% (3.9 g) to the mass of mineral mixture (cement + GGBFS). The addition of superplasticizer in mortars with the addition of GGBFS has the function of preventing agglomeration of GGBFS, increasing homogeneity, and reducing water demand. The influence of adding superplasticizer was also tested based on the setting time of the cement paste, and the results showed that adding superplasticizer up to 0.87 wt.% did not have an effect on the setting time. The freshly prepared mortar mixture was poured into a mold with space for three prisms with dimensions 4 × 4 × 16 cm, and then it was left in a curing chamber for 24 h at a temperature of 20 °C and a relative humidity more than 95%. Subsequently, the specimens were removed from the mold and cured in thermostated basins filled with tap water at a temperature of 20 ± 1 °C until the mechanical properties were investigated.
The mechanical properties were investigated by determining compressive strength and flexural strength in three-point according to the EN 196-1 after 3, 7, 14, 28, 70, and 90 days of hydration. The mechanical tests were carried out using a Zwick Roell hydraulic press system. For the compressive strength test, the rate of increase of the compressive load was 1.50 Nmm−2s−1, and for flexural test, the rate of increase of load was 0.5 Nmm−2s−1.

3. Results and Discussion

3.1. Influence of the Addition of GGBFS on Setting Time

Cement paste was prepared with the replacement additive GGBFS (0–40 wt.%) on the mass of OPC and with the addition of water to the amount that the cement paste satisfied normal consistency. The effect of GGBFS on the setting time is shown in Figure 4. The beginning of the setting time is considered to be the time when the needle of the Vicat device stops at 3–5 mm from the bottom, and the end of the setting time is when the needle does not penetrate more than 1 mm into the cement paste. The setting time of the cement paste prepared with OPC (PB0) started after 140 min of hydration and ended after 240 min. The setting time results show that the cement mixture prepared with the replacement additive GGBFS in amounts of 5–20 wt.% postpones the beginning of the setting time for 20 min comparing to that of PB0. The end of the setting time in the case of the replacement additive GGBFS in the amount of 5 wt.% is also postponed for 5 min longer than that of PB0. In the specimens where GGBFS was added in amounts of 15 and 20 wt.%, the end of the setting time shifted 10 min (PB15T) and 24 min (PB20T) earlier than that of PB0. Increasing the amount of the replacement additive GGBFS in the range of 25–40 wt.% has the effect of shifting the setting time to an earlier time of hydration. The beginning of the setting time for specimens PB25T, PB30T, and PB40T is shortened by 20, 35, and 50 min, respectively, compared to that of PB0, which is consistent with previous studies [4]. This influence shows that GGBFS added above 25 wt.% plays a role as an accelerator of setting time. The observed shift in setting time due to the addition of GGBFS is due to its physical role. Namely, in the early phase of hydration, the replacement additive GGBFS plays a physical role (filler effect) [29,38], where the GGBFS particles serve as additional places for nucleation and growth of hydration products, which relieves the surface of clinker minerals, and thus, increases the degree of hydration as well as prolongs the hydration activity. This effect of delayed onset of setting is visible in cement mixtures to which GGBFS is added in amounts up to 20 wt.%. When GGBFS is added in the range of 25–40 wt.%, it plays the same role, but the resulting effect in terms of setting time is measured as a reduction in the time to start setting due to a lower amount of cement available for hydration. The larger available surface area of the GGBFS particles has an effect on promoting the hydration reaction, which is reflected in a faster setting time.

3.2. Structure Changes during Cement Hydration Followed by Using In Situ X-ray Diffraction

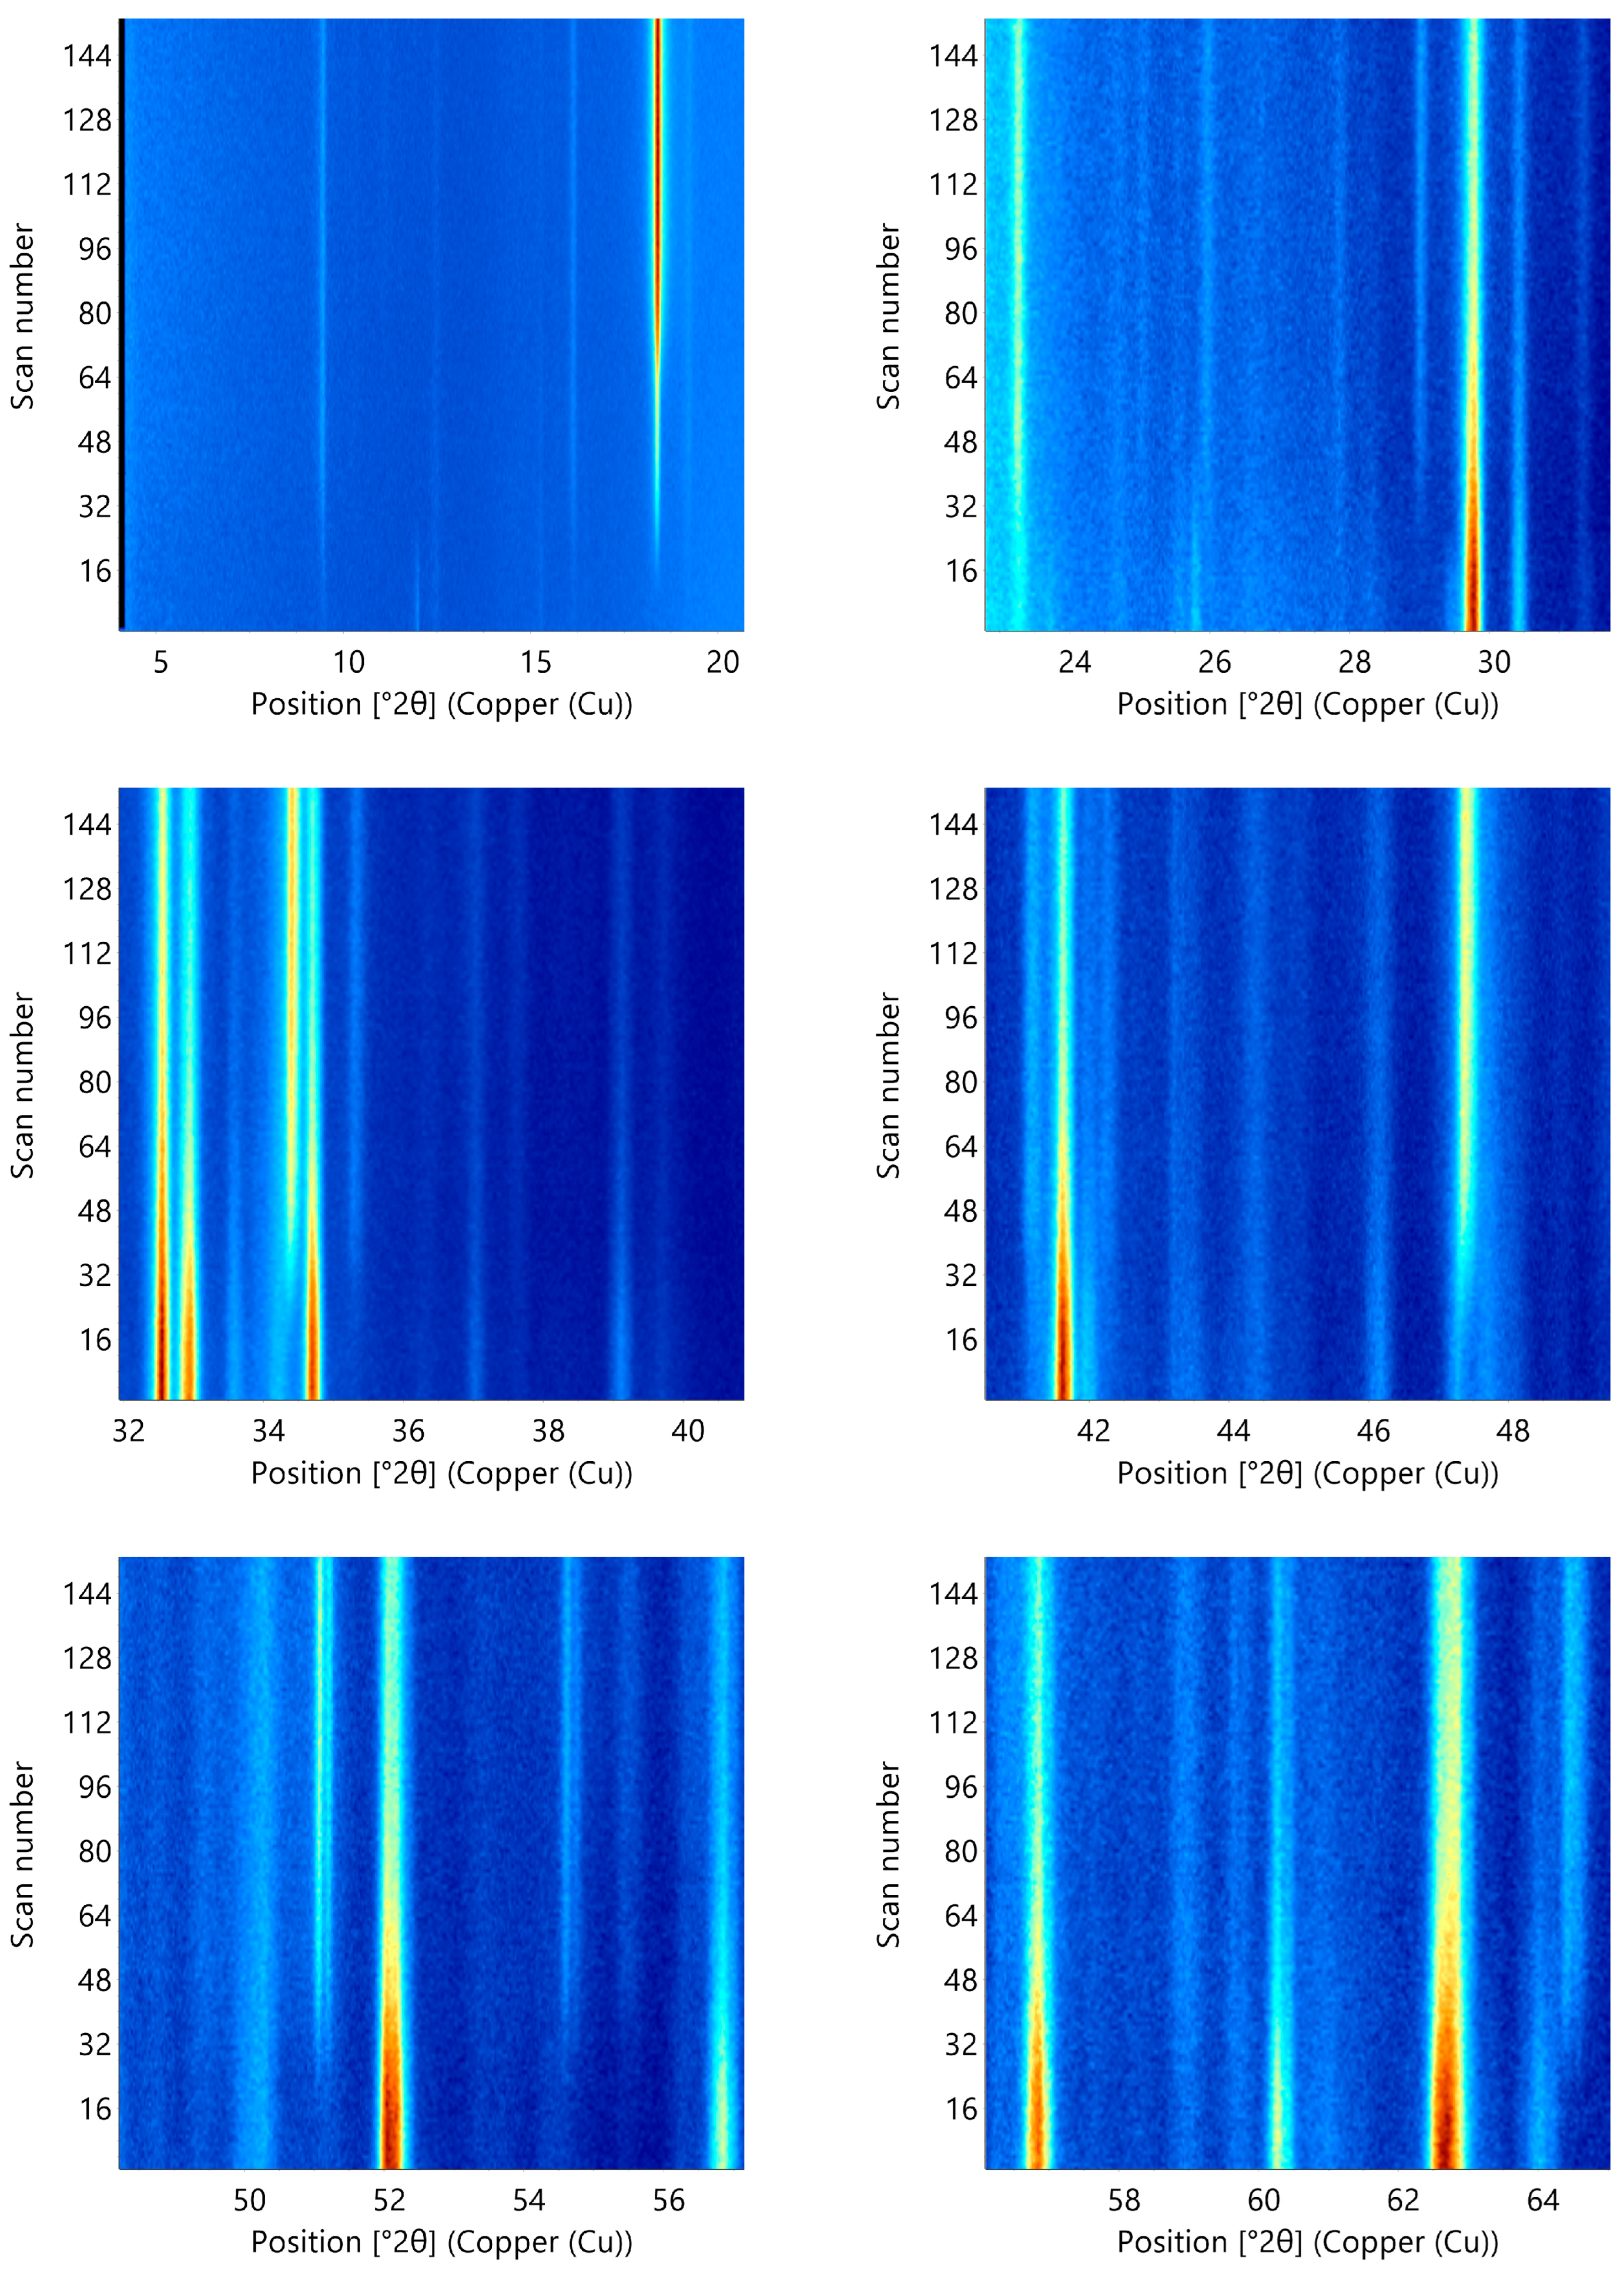
In order to estimate the structural changes that occurred during hydration, in situ X-ray diffraction measurements were carried out on hydrated cement specimens of OPC. The progress of hydration was followed using in situ, time-resolved measurements by X-ray diffraction on specimens of cement paste placed on a support between two sheets of Kapton foil. The application of Kapton foil prevents evaporation of reactive water during experiments and it prevents specimen carbonization [39]. Diffraction patterns were collected using gonio scan with a step size of 0.0263° and a scanning angle (°2Theta) from 4 to 70°. The time required for each scan was 15 min and 55 s with a break of 44 s in duration between scans. Measurements were performed using an automatic divergent slit (ADS) at a constant value of 4 mm. Cement hydration was monitored up to 48 h. All patterns were corrected for systematic errors by using the Si external standard, and all patterns were corrected for divergent slit (converted from ADS to FDS). Figure 5 shows the isoline scans in the characteristic areas where a change in the diffraction patterns is visible. The hydration reactions of clinker minerals are a series of very complex reactions that occur simultaneously and involve the dissolution of soluble components in water with simultaneous hydration of clinker minerals and their precipitation and crystallization as hydration products. Due to the very complex structure of minerals in cement–water reaction systems, diffraction techniques can be used to monitor changes in the formation of new structurally ordered phases or the disappearance of existing structurally ordered phases. Moreover, the problem related to better characterizing cement systems is that, during hydration, even when new structurally ordered phases are separated, there is an overlap of diffraction maxima originating from the hydration products formed and the non-hydrated minerals, making their identification difficult. The diffraction patterns of the cement hydration specimens are characterized by a diffuse diffraction maximum which appears in a very wide angular range 2Theta from 4 to 40°. This amorphous phase originates from the amorphous hydration products formed during the hydration of the mineral clinker such as the structurally disordered C-S-H phase. The poorly crystallized C-S-H phase is not detected as a structurally ordered phase during the 48-h hydration of the cement. From the beginning of hydration to 48-h cement hydration, it can be seen from the decreasing intensity of the diffraction maximum, which belongs to the structurally ordered phases of clinker minerals, that their amount decreases during hydration. The presence of diffraction maxima belonging to clinker minerals in the hydrated specimen after 48 h of hydration is a consequence of the hydration reaction not yet completed. The first noticeable change in the PXRD pattern occurs after 2 h and 46 min, where the diffraction maximum occurs at 9.2°. This diffraction maximum is characterized as the strongest diffraction maximum for Ettringite as a structurally ordered phase [40]. The mineral C3A is a highly reactive phase that reacts immediately with water and forms an Ettringite phase in the presence of gypsum. According to previous studies, the formation of Ettringite as a structurally ordered phase during hydration in cement paste occurs as hexagonal rods after only 5 min [38]. The reason why the structurally ordered phase of Ettringite cannot be detected by PXRD in the early phase of hydration is probably that it has a low mass fraction. The second noticeable change occurs after 3 h and 57 min of hydration of OPC. In this period of hydration, portlandite as the hydration product can be detected in the hydration system. Portlandite is characterized by the appearance of a diffraction maximum at 2Theta = 18.2, 28.9, 34.2, 47.3, 50.9 and 54.5°.
From the intensity of the diffraction maximum characteristic for portlandite, a constant growth of portlandite during 48 h of hydration is visible. After 5 h and 33 min of cement hydration, the structurally ordered phase characterized by a diffraction maximum at 11.8° which arises from potassium aluminum sulfate hydrate disappears from the hydration system. After 19 h of hydration of the original mineral composition, the mineral phase sodium aluminum silicate hydrate, characterized by a diffraction maximum at 7.95, 8.35, 8.86, and 10.91°, appears as a new structurally ordered phase in the hydration system. The application of X-ray diffraction during cement hydration allows a qualitative analysis to determine the time of appearance or disappearance of certain structurally ordered phases. However, the long measurement time of individual scans during the phase of most intense hydration makes quantitative mineralogical analysis impossible. Quantitative PXRD analyses in the early phase of hydration can only be performed on data collected by synchrotron X-ray powder diffraction for two reasons: the brightness of the beam is much higher and the measurement time for a quality sample can be optimized to a few seconds [30].

3.3. Developed Microstructure of Cement Composite Determined by SEM

The developed microstructures of cement composites after 48 h of cement hydration are shown in Figure 6. The SEM images show the developed microstructures of the reference specimens PB0 and PB30T after 48 h of hydration at different magnifications; both specimens have a large quantity of different shapes of hydration products. The dominant shapes of the hydration product are hexagonal rods representing Ettringite, needles representing the C-S-H phase, and hexagonal plates representing the characteristic shape of portlandite [38]. The differences between the SEM images of PB0 and PB30T are in the content of hydration products in the shape of hexagonal rods and needles, which are more present in the PB30T specimen images. This observation confirms the physical role of GGBFS (site of nucleation and growth of hydration products) and its influence on increasing the degree of hydration of the cement.

3.4. The Heat Released during Hydration in the System of Cement Paste

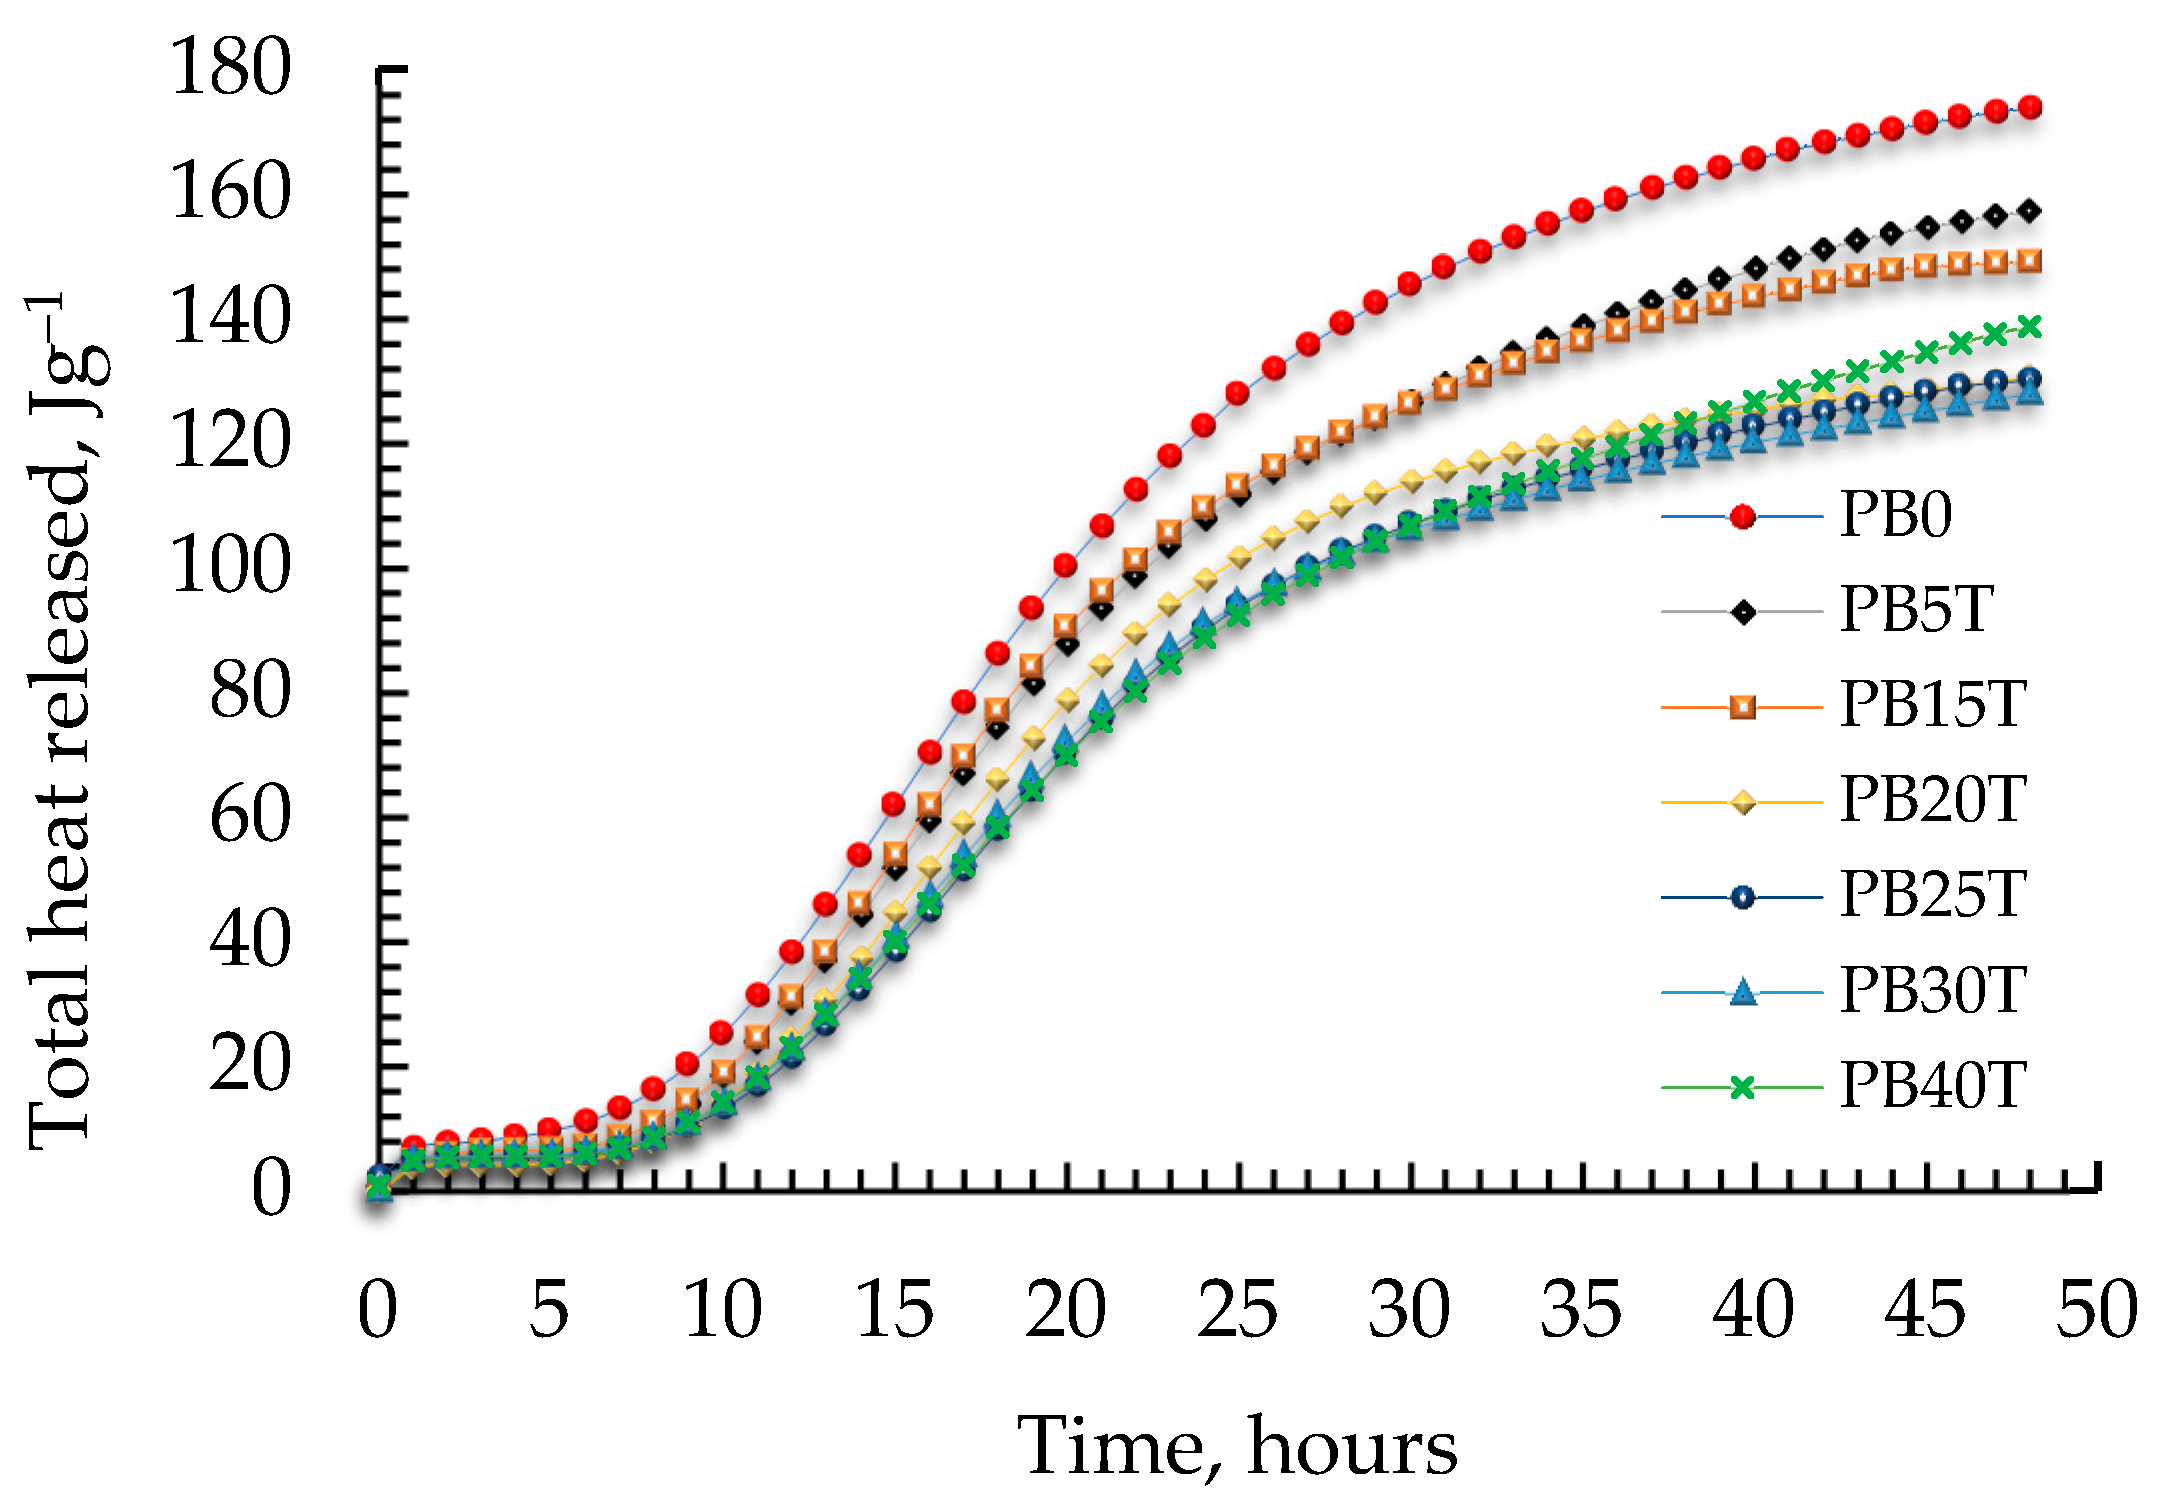
The heat of hydration released during the 48-hour hydration of the mixed cement is shown in Figure 7, and the total heat release is shown in Table 5. Based on the measured data obtained by the method of DMC and using cement mixture without and with the replacement additive GGBFS during 48 h of hydration, the released heat of hydration was determined at specific time intervals. The heat released during cement hydration is the result of hydration of cement clinker minerals, gypsum, free lime (CaO), MgO, and other constituents present in the cement, and represents the total heat of hydration for a given hydration time [31]. The highest value of total heat released during hydration in the period up to 48 h is measured for OPC, which releases heat in the amount of 173.84 J/g. The lowest addition of GGBFS in the amount of 5 wt.% results in a reduction in the heat released (149.10 J/g), which is 14.23% lower than that for specimen PB0. The results show that the addition of GGBFS at 15, 20, 25, 30, and 40 wt.% reduces the heat released by 15.28, 20.22, 24.82, 25.13, and 26.36%, respectively, compared to that of PB0. The lowest measured value of heat released is 128.01 J/g (PB40T), which is 26.36% lower than that for specimen PB0. The observed reduction in total heat in the early phase of hydration of OPC blended with 40 wt.% of GGBFS is in agreement with a previous study by P. Munjal et al. which found that total heat was reduced by 26% [41].

3.5. Kinetics Analysis of the Hydration of Cement

The data collected by DMC were used to analyze the hydration kinetics of the cement. The first step in the analysis of hydration kinetics refers to the determination of the dependence of the heat of hydration released in a given hydration time, as shown in Figure 8.
The mathematical model assumes that three processes (NG, I, and D) occur simultaneously on the surface of a solid cement particle, the slowest of which determines the overall hydration rate. According to the model, the processes alternate as follows: nucleation and growth (NG) interaction at the phase boundary (I) diffusion (D) [31,32,33,35].
The transition times from one controlling process to another are defined by Equations (6) and (7):
d α d t N G = d α d t I
d α d t I = d α d t D
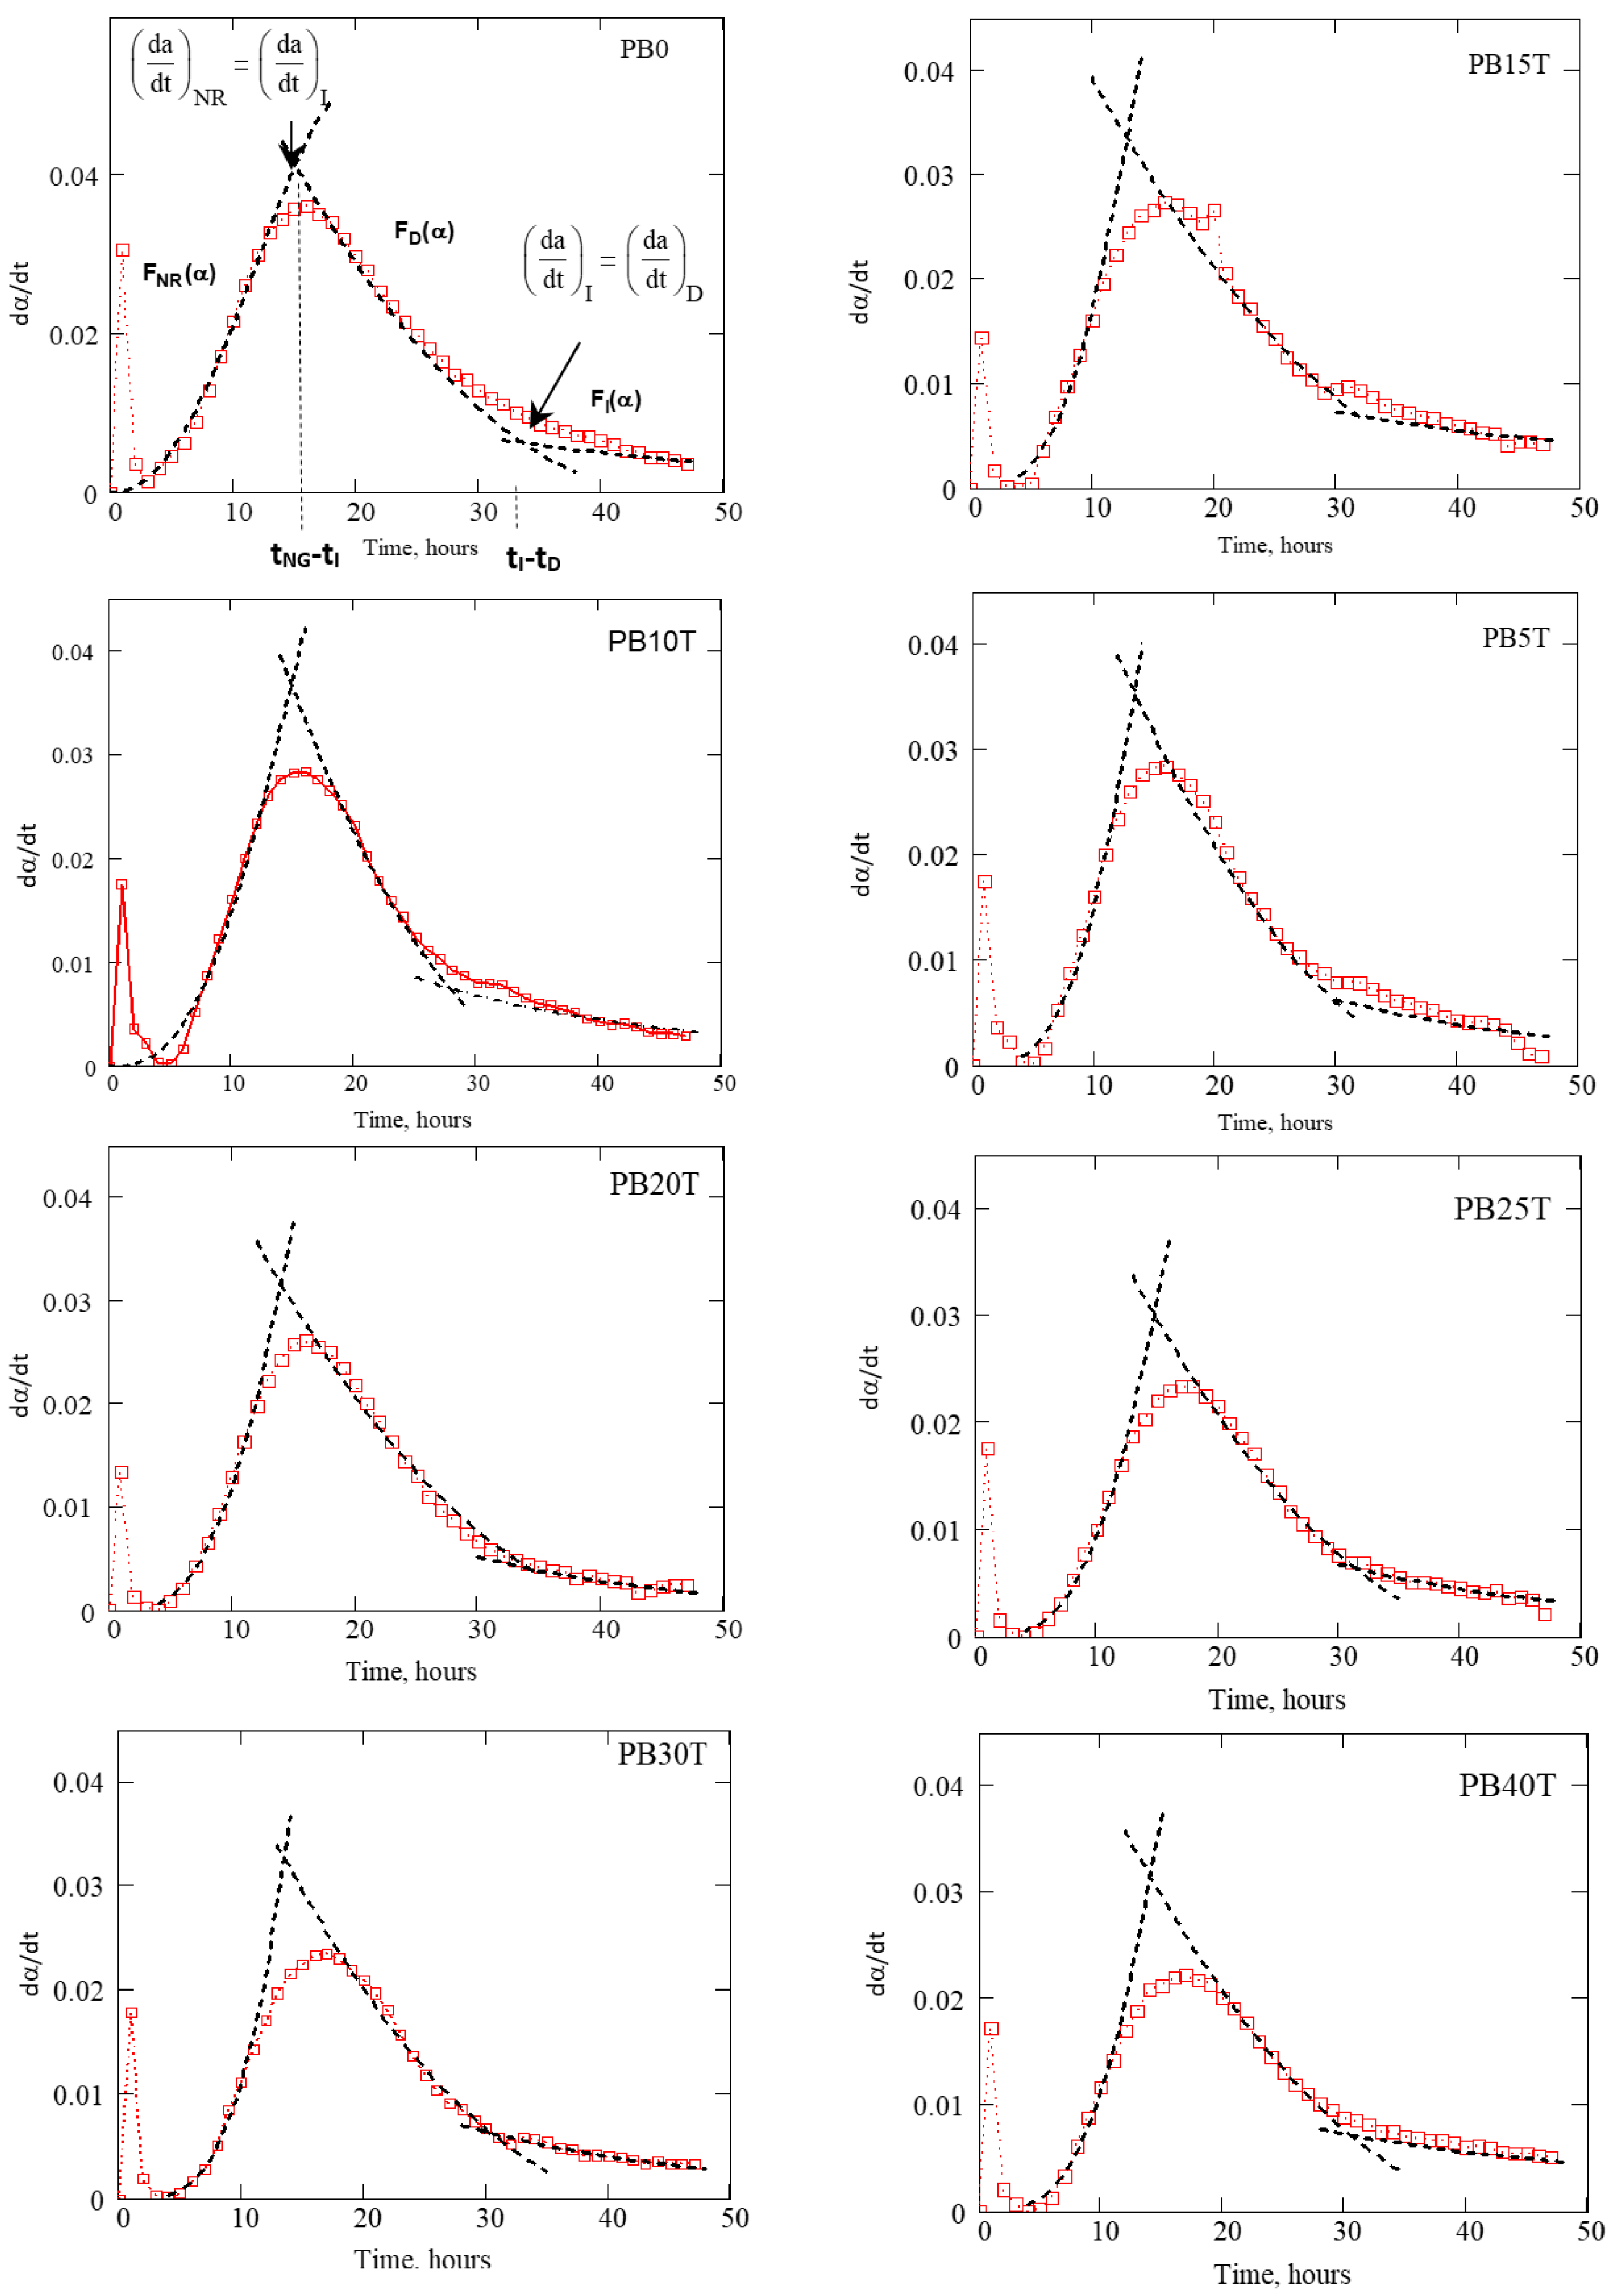
Figure 9 show the fitting of functions  F N G F I , and  F D  (Equations (3)–(5)) on the intervals of hydration according to the alternate model, where each supposed process is controlling the process of cement hydration. The estimated values of the kinetic parameters n,  k N G k I  and  k D  as well as the transition times  t N G - I  and  t I - D  are given in Table 6.
The kinetics parameters n,  k N G k I k D ,   t N G - I , and  t I - D  are given in the Table 6. The nucleation and growth constant,  k N G , is in the range 0.041–0.046 h−1, the interaction on boundary phase constant,  k I , is in the range 0.022–0.024 μmh−1, and the diffusion constant,  k D , constant is in the range 0.0026–0.0083 μm2h−1. The highest calculated value of the constants is for the  k N G  constant. This value of  k N G  as compared with the calculated values of the  k I  and  k D  constants for PB0 and specimens with the replacement additive GGBFS up to 40 wt.% confirm that the process of nucleation and growth is the fastest process of hydration in all specimens. Small variations in the calculated values of  k N G  and  k I  among the different GGBFS additions indicate that the replacement additive GGBFS has a very small influence on the heat rate of hydration. An increase in the value of  k D  for the cement mixture where GGBFS is added in the amounts of 5 and 10 wt.% compared to the specimen PB0 indicates the higher porosity of the microstructure formed during the process of hydration. Moreover, the value of  k D  for specimens with GGBFS addition above 10 wt.% affects the decrease in porosity of the microstructure formed during the process of hydration. The value of the exponent n in the Avrami–Erofeev equation describes the geometrical crystal growth. The calculated value is in the range from 3.083 to 4.798, which suggests the three-dimensional growth of hydration products as well as hetero nucleation and growth in a poly disperse system. The transition time ( t N G - I ) indicates the period when the process of NG as a limiting process of the total hydration is substituted by the second limiting process I. The value of transition time ( t N G - I ) is reduced for all specimens where GGBFS is used as replacement additive compared to that of the specimen PB0. The transition time is reduced in the range from 1 h (PB25T) to 2.9 h (PB10T). This shortening of the time in which the process of nucleation and growth, as the slowest process of cement hydration, limits the overall process of hydration, confirms the role of GGBFS as an accelerator of cement hydration.

3.6. Mechanical Properties of Cement Mortars

In the preparation cement mortars, replacing a portion of the cement mass with GGBFS in the range of 5–20 wt.% does not change the amount of water required to achieve normal consistency compared to the PB0S specimen, but increasing the amount of GGBFS beyond 20 wt.% results in a further reduction in the water requirement, which is 26.67 wt.% less for the PBT40S specimen compared to PB0, i.e., 5.71 wt.% less than PB0S. The cement mortars were cured in basins filled with thermostatic water at a temperature of 20 °C until the time of mechanical properties testing. All prepared batches of mortar prisms were subjected to mechanical properties testing, i.e., developed compressive and flexural strength, after 3, 7, 14, 28, 70, and 90 days. The results of the mechanical testing are shown in Figure 10. From the test results it can be seen that, for all prepared specimens, the developed compressive and flexural strengths increase with the duration of the hydration time.
From the obtained values of the developed compressive strengths, it can be seen that the PB0 series show an increase in mechanical properties up to 90 days of hydration. However, the developed compressive strengths up to 90 days of hydration are the lowest compared to all other mortars. By comparing the developed compressive strength for the PB0 series with the PB0S series, it is observed that values of compressive strength are higher for the PB0S specimen. The observed effect can be attributed to the influence of the superplasticizer, which prevents the agglomeration of the cement particles and, in this way, ensures a larger surface area of the cement particles available for hydration. As a result of this influence, the degree of cement hydration is higher and, consequently, the proportion of C-S-H phases responsible for the mechanical properties is also higher.
In the early phase of hydration, after 3 days of hydration, the measured values of compressive strength between the reference specimens PB0S (44.94 MPa) and PB0 (35.77 MPa) show that the developed compressive strength is 125.63% higher for the PB0S specimen. By comparing the results of developed flexural strength between PB0S (10 MPa) and PB0 (6.70 MPa), it can be seen that the flexural strength is 149.25% higher for PB0S. The higher values of developed compressive and flexural strength for the PB0S specimen compared to PB0 are due to the addition of superplasticizer. At the same time of hydration, the developed compressive strength values in the specimens prepared with the replacement additive GGBFS in amounts of 5, 15, 20, and 25 wt.% are 53.39, 49.91, 46.91, and 48.6, respectively. These values are higher than those for the PB0S specimen, which can be attributed to the superimposed effects of superplasticizer and the physical role of GGBFS, whose particles serve as nucleation sites [42]. For the mortar systems with replacement additives at 30 and 40 wt.%, the developed strength values are 44.94 MPa and 39.23 MPa, respectively, which are consistent with or slightly lower than those of PB0S. This effect on the mechanical properties is probably due to the dilution effect, i.e., the lower amount of cement available for hydration [43]. After 7 days of hydration, the highest value of developed compressive strength was measured for the PB0S specimen (58.03 MPa). For the specimens prepared after 7 days of hydration with the replacement additive GGBFS, the measured values of compressive strength are increased, and they are in the range from 57.81 to 50.17 MPa (they decrease with an increase in GGBFS content from 5 to 40 wt.%). After the 14-day hydration, the developed compressive strength for the PB0S specimen is higher than for the samples to which GGBFS was added in amounts of 5, 15, 20, and 40 wt.%, but the compressive strength values for the PBT25S (67.75 MPa) and PBT30S (70.09 MPa) specimens are higher than for that for PB0S (66.25 MPa). The same ratios of developed compressive strength are also visible after 28 days of hydration, again with the highest developed compressive strength measured for specimens PBT25S (76.23 MPa) and PBT30S (79.25 MPa). After 28 days of hydration, the developed compressive strength was 73.52 MPa for the PB0S specimen and 71.3, 68.11, 70.94, and 66.54 MPa for the samples prepared with the addition of 5, 15, 20 and 40 wt.% GGBFS, respectively. The increased values of mechanical properties after 14 and 28 days for PBT25S and PBT30S, suggest the early pozzolanic activity of GGBFS. The occurrence of pozzolanic reactions due to GGBFS in the early phase of hydration is consistent with previous studies [23,44]. With increasing hydration time, the developed compressive strength values after 70 and 90 days of hydration are higher for all specimens prepared with the replacement additive GGBFS than for the PB0S specimen. After 90 days of hydration, the reference specimens have a compressive strength of 78.53 MPa, and for the specimens prepared with the replacement additive GGBFS in amounts of 5, 15, 20, 25, 30, and 40 wt.%, the measured values of compressive strength are 78.63, 80.14, 82.67, 87.45, 88.14, and 80.33 MPa, respectively. The observed increase in compressive strength after 70 days of hydration in specimens prepared with the replacement additive GGBFS is most likely a result of pozzolanic reactions due to GGBFS.

4. Conclusions

In this work, the cement CEM I 42.5 R was produced, to which the replacement additive GGBFS was added in amounts ranging from 0 to 40 wt.% of the cement, and investigations were carried out on cement paste and mortar systems. Based on the obtained research results, the following conclusions can be drawn:
  • The delayed setting of cement with the replacement additive GGBFS in amounts of 5–15 wt.% and the accelerated setting of cement with the addition of 20–40 wt.% GGBFS originates from the physical role of GGBFS as a nucleation site.
  • The total heat of hydration released during the 48 h shows that the value of total heat released is reduced up to 26.36% by increasing the amount of replacement additive GGBFS up to 40 wt.%.
  • Calorimetric measurements can be used for the kinetic analysis. The calculated value of the exponent n is in the range 3.083–4.798, suggesting three-dimensional growth of hydration products as well as hetero nucleation and growth in polydisperse systems.
  • Shortening the transition time ( t N G - I ), the time when the process of nucleation and growth as the fastest process of cement hydration limits the overall process of hydration, confirms the role of GGBFS as an accelerator of cement.
  • The developed mechanical properties show that the replacement additive GGBFS slightly decreases the mechanical properties in the early phase of hydration until it contributes to increase the mechanical properties in the later phase of cement hydration. This influence is due not only to the physical role, but also to the pozzolanic reactivity of GGBFS.

Author Contributions

Conceptualization, D.J., A.P. and B.L.; methodology, D.J., A.P., B.L. and S.J.; validation, D.J., A.P., B.L., S.J. and A.Č.; formal analysis, D.J., A.P., B.L., S.J. and A.Č.; investigation, D.J., A.P., B.L., S.J. and A.Č.; resources, D.J. and B.L.; data curation, D.J., A.P., S.J. and A.Č.; writing—original draft preparation, D.J. and S.J.; writing—review and editing, D.J., S.J., B.L. and A.Č.; visualization, D.J. and A.Č.; supervision, D.J., B.L. and S.J.; funding acquisition, D.J. All authors have read and agreed to the published version of the manuscript.

Funding

This research received no external funding.

Data Availability Statement

The data presented in this study are available from the corresponding author upon request.

Acknowledgments

This research was partially supported through project Functional integration of the University of Split, PMF-ST, PF-ST, and KTF-ST through the development of scientific research infrastructure in the building of three faculties (KK.01.1.1.02.0018); the project was co-financed by the European Union from the European Regional Development Fund and project KK.01.1.1.02.0027, a project co-financed by the Croatian Government and the European Union through the European Regional Development Fund—the Competitiveness and Cohesion Operational Programme.

Conflicts of Interest

The authors declare no conflict of interest.

Abbreviations

αDegree of hydration
BFSBlast furnace slag
CpHeat capacity
C3SAlite
C2SBelite
C3ATricalcium aluminate
C4AFTetracalcium aluminoferrite
DDiffusion
DMCDifferential microcalorimetry
FAFly ash
GBFSGranulated blast furnace slag
GGBFSGround granulated blast furnace slag
IInteraction at the phase boundary
  k N G Nucleation and growth constant
  k I Interaction at the phase boundary constant
  k D Diffusion constant
NGNucleation and growth
OPCOrdinary Portland cement
PXRDPowder X-ray diffraction
Q(t)Heat released in time
QmaxTotal released heat of hydration after 90 days
SEISecondary electron image
SEM/EDSScanning electron microscopy/energy-dispersive spectroscopy
SFSilica fume
  t N G - I Transition time
  t I - D Transition time
XRFX-ray fluorescence

References

  1. Garside, M. Global Cement Production 1995–2022. Available online: https://www.statista.com/statistics/1087115/global-cement-production-volume/ (accessed on 12 June 2023).
  2. Chen, C.; Xu, R.; Tong, D.; Qin, X.; Cheng, J.; Liu, J.; Zheng, B.; Yan, L.; Zhang, Q. A Striking Growth of CO2 emissions from the Global Cement Industry Driven by New Facilities in Emerging Countries. Environ. Res. Lett. 2022, 17, 044007. [Google Scholar] [CrossRef]
  3. Ueki, Y. History and Utilization of Portland Blast Furnace Slag Cement. Nippon. Steel Sumitomo Met. Tech. Rep. 2015, 109, 109–113. [Google Scholar]
  4. Tao, J.; Wei, X. Effect of Ground Granulated Blast-Furnace Slag on the Hydration and Properties of Cement Paste. Adv. Cem. Res. 2019, 31, 251–260. [Google Scholar] [CrossRef]
  5. Norrarat, P.; Tangchirapat, W.; Songpiriyakij, S.; Jaturapitakkul, C. Evaluation of Strengths from Cement Hydration and Slag Reaction of Mortars Containing High Volume of Ground River Sand and GGBF Slag. Adv. Civ. Eng. 2019, 2019, 4892015. [Google Scholar] [CrossRef] [Green Version]
  6. Paris, J.M.; Roessler, J.G.; Ferraro, C.C.; Deford, H.D.; Townsend, T.G. A Review of Waste Products Utilized as Supplements to Portland Cement in Concrete. J. Clean. Prod. 2016, 121, 1–18. [Google Scholar] [CrossRef]
  7. Jozić, D.; Zelić, J. The Effect of Fly Ash on Cement Hydration in Aqueous Suspensions. Ceramics–Silikáty 2006, 50, 98–105. [Google Scholar]
  8. Shariq, M.; Prasad, J.; Masood, A. Effect of GGBFS on Time Dependent Compressive Strength of Concrete. Constr. Build. Mater. 2010, 24, 1469–1478. [Google Scholar] [CrossRef]
  9. Zelić, J.; Rušić, D.; Krstulović, R. A Mathematical Model for Prediction of Compressive Strength in Cement-Silica Fume Blends. Cem. Concr. Res. 2004, 34, 2319–2328. [Google Scholar] [CrossRef]
  10. Jozić, D. A Study on the Effect of Fly Ash from the Thermo-Electric Power Plant on the Physical and Chemical Properties and on the Behaviour of the Cement Composite. Ph.D. Thesis, University of Split, Faculty of Chemistry and Technology, Split, Croatia, 2007. [Google Scholar]
  11. Crossin, E. The Greenhouse Gas Implications of Using Ground Granulated Blast Furnace Slag as a Cement Substitute. J. Clean. Prod. 2015, 95, 101–108. [Google Scholar] [CrossRef]
  12. Gruskovnjak, A. Hydration Mechanisms of Activated Blast Furnace Slag. Ph.D. Thesis, University Bern, Bern, Switzerland, 2006; pp. 1–123. [Google Scholar]
  13. Václavík, V.; Dirner, V.; Dvorský, T.; Daxner, J. The Use of Blast Furnace Slag. Metalurgija 2012, 51, 461–464. [Google Scholar]
  14. Tsakiridis, P.E.; Papadimitriou, G.D.; Tsivilis, S.; Koroneos, C. Utilization of Steel Slag for Portland Cement Clinker Production. J. Hazard. Mater. 2008, 152, 805–811. [Google Scholar] [CrossRef] [PubMed]
  15. Huang, X.; Wang, Z.; Liu, Y.; Hu, W.; Ni, W. On the Use of Blast Furnace Slag and Steel Slag in the Preparation of Green Artificial Reef Concrete. Constr. Build. Mater. 2016, 112, 241–246. [Google Scholar] [CrossRef]
  16. Divsholi, B.S.; Lim, D.T.Y.; Teng, S. Evaluation of heat of hydration for high performance concrete incorporating normal and ultra fine ground granulated blast furnace slag. In Proceedings of the 37th Conference on Our World in Concrete & Structures, Singapore, 29–31 August 2012; pp. 1–13. [Google Scholar]
  17. Ogawa, S.; Hyodo, H.; Hirao, H.; Yamada, K.; Matsui, A.; Hooton, D. Sulfate resistance improvement of blended cement based on ground granulated blast furnace slag. In Proceedings of the 3rd ACF International Conference—ACF/VCA 2008, Ho Chi Minh City, Vietnam, 11–13 November 2008; pp. 499–506. [Google Scholar]
  18. Fang, K.; Wang, D.; Gu, Y. Utilization of Gasification Coarse Slag Powder as Cement Partial Replacement: Hydration Kinetics Characteristics, Microstructure and Hardening Properties. Materials 2023, 16, 1922. [Google Scholar] [CrossRef]
  19. Ballim, Y.; Graham, P.C. The Effects of Supplementary Cementing Materials in Modifying the Heat of Hydration of Concrete. Mater. Struct. 2008, 42, 803–811. [Google Scholar] [CrossRef]
  20. Yalçınkaya, Ç.; Çopuroğlu, O. Hydration Heat, Strength and Microstructure Characteristics of UHPC Containing Blast Furnace Slag. J. Build. Eng. 2021, 34, 101915–101935. [Google Scholar] [CrossRef]
  21. Thomas, J.J.; Biernacki, J.J.; Bullard, J.W.; Bishnoi, S.; Dolado, J.S.; Scherer, G.W.; Luttge, A. Modeling and Simulation of Cement Hydration Kinetics and Microstructure Development Cement and Concrete Research Modeling and Simulation of Cement Hydration Kinetics and Microstructure Development. Cem. Concr. Res. 2011, 41, 1257–1278. [Google Scholar] [CrossRef]
  22. Ahmad, J.; Kontoleon, K.J.; Majdi, A.; Naqash, M.T.; Deifalla, A.F.; Kahla, N.B.; Isleem, H.F.; Qaidi, S.M.A. A Comprehensive Review on the Ground Granulated Blast Furnace Slag (GGBS) in Concrete Production. Sustainability 2022, 14, 8783. [Google Scholar] [CrossRef]
  23. Sandhu, A.R.; Rind, T.A.; Kalhoro, S.A.; Lohano, R.; Laghari, F.H. Effect on the compressive strength of mortars using ground granulated blast furnace slag as a partial replacement of cement. J. Appl. Eng. Sci. 2019, 9, 183–186. [Google Scholar] [CrossRef] [Green Version]
  24. Jeffery, J.W. The Crystal Structure of Tricalcium Silicate. Acta Crystallogr. 1952, 5, 26–35. [Google Scholar] [CrossRef] [Green Version]
  25. Izadifar, M.; Ukrainczyk, N.; Salah Uddin, K.M.; Middendorf, B.; Koenders, E. Dissolution of β-C2S Cement Clinker: Part 2 Atomistic Kinetic Monte Carlo (KMC) Upscaling Approach. Materials 2022, 15, 6716. [Google Scholar] [CrossRef]
  26. Mishra, R.K.; Fernández-Carrasco, L.; Flatt, R.J.; Heinz, H. A Force Field for Tricalcium Aluminate to Characterize Surface Properties, Initial Hydration, and Organically Modified Interfaces in Atomic Resolution. Dalt. Trans. 2014, 43, 10602–10616. [Google Scholar] [CrossRef] [PubMed] [Green Version]
  27. Zhang, G.; Ren, Q.; He, J.; Jiang, S.; Cheng, X.; Yu, Y.; Huang, S.; Zhang, C.; Zhou, M. New Understanding of Early Hydration of C4AF under Surface Vitrification. Powder Technol. 2021, 377, 372–378. [Google Scholar] [CrossRef]
  28. Zhou, Y.; Zhang, Z. Effect of Fineness on the Pozzolanic Reaction Kinetics of Slag in Composite Binders: Experiment and Modelling. Constr. Build. Mater. 2021, 273, 121695. [Google Scholar] [CrossRef]
  29. Jozić, D.; Zelić, J.; Janjatović, I. Influence of the Coarse Fly Ash on the Mechanical Properties of the Cement Mortars. Ceram.–Silikáty 2010, 54, 144–151. [Google Scholar]
  30. Brachaczek, W.; Chleboś, A.; Kupczak, M.; Spisak, S.; Stybak, M.; Żyrek, K. Influence of the Addition of Ground Granulated Blast Furnace Slag, Fly Silica Ash and Limestone on Selected Properties of Cement Mortars. Mater. Proc. 2023, 13, 32. [Google Scholar] [CrossRef]
  31. Krstulović, R.; Dabić, P. A Conceptual Model of the Cement Hydration Process. Cem. Concr. Res. 2000, 30, 693–698. [Google Scholar] [CrossRef]
  32. Dabić, P.; Krstulović, R.; Rušić, D. New Approach in Mathematical Modelling of Cement Hydration Development. Cem. Concr. Res. 2000, 30, 1017–1021. [Google Scholar] [CrossRef]
  33. Bezjak, A. Nuclei Growth Model in Kinetic Analysis of Cement Hydration. Cem. Concr. Res. 1986, 16, 605–609. [Google Scholar] [CrossRef]
  34. Zelic, J.; Rusic, D.; Veza, D.; Krstulovic, R. The Role of Silica Fume in the Kinetics and Mechanisms during the Early Stage of Cement Hydration. Cem. Concr. Res. 2000, 30, 1655–1662. [Google Scholar] [CrossRef]
  35. Bezjak, A.; Jelenic, I. On the Determination of Rate Constants for Hydration. Cem. Concr. Res. 1980, 10, 553–563. [Google Scholar] [CrossRef]
  36. Wei, Z.; Zhang, Q.; Li, X. Crystallization Kinetics of α-Hemihydrate Gypsum Prepared by Hydrothermal Method in Atmospheric Salt Solution Medium. Crystals 2021, 11, 843. [Google Scholar] [CrossRef]
  37. Gutzow, I.; Todorova, S.; Jordanov, N. Kinetics of Chemical Reactions and Phase Transitions at Changing Temperature: General Reconsiderations and a New Approach. Bulg. Chem. Commun. 2010, 42, 79–102. [Google Scholar]
  38. Berodier, E.; Scrivener, K. Understanding the Filler Effect on the Nucleation and Growth of C-S-H. J. Am. Ceram. Soc. 2014, 97, 3764–3773. [Google Scholar] [CrossRef]
  39. de Matos, P.R.; Andrade Neto, J.S.; Jansen, D.; De la Torre, A.G.; Kirchheim, A.P.; Campos, C.E.M. In-Situ Laboratory X-ray Diffraction Applied to Assess Cement Hydration. Cem. Concr. Res. 2022, 162, 106988. [Google Scholar] [CrossRef]
  40. Neubauer, J. Refined Ettringite (Ca6Al(SO4)3(OH)12·26H2O) Structure for Quantitative X-Ray Diffraction Analysis. Powder Diffr. 2006, 1, 4–11. [Google Scholar] [CrossRef]
  41. Munjal, P.; Hau, K.K.; Aheng Ahun Hon, A. Journal of Building Engineering Ef Fe Ct of GGBS and Curing Conditions on Strength and Microstructure Properties of Oil Well Cement Slurry. J. Build. Eng. 2021, 40, 102331. [Google Scholar] [CrossRef]
  42. Kozlova, I.; Samchenko, S.; Zemskova, O. Physico-Chemical Substantiation of Obtaining an Effective Cement Composite with Ultrafine GGBS Admixture. Buildings 2023, 13, 925. [Google Scholar] [CrossRef]
  43. Ahmad, J.; Martínez-García, R.; Szelag, M.; de-Prado-Gil, J.; Marzouki, R.; Alqurashi, M.; Hussein, E.E. Effects of Steel Fibers (SF) and Ground Granulated Blast Furnace Slag (GGBS) on Recycled Aggregate Concrete. Materials 2021, 14, 7497. [Google Scholar] [CrossRef]
  44. Escalante-Garcıa, J.I.; Sharp, J.H. Effect of Temperature on the Hydration of the Main Clinker. Cem. Concr. Res. 1998, 28, 1259–1274. [Google Scholar] [CrossRef]
Figure 1. PXRD pattern of the Portland cement type CEM I 42.5 R and its mineralogical composition.
Buildings 13 01960 g001
Figure 2. XRD powder pattern of the GGBFS.
Buildings 13 01960 g002
Figure 3. SEM images of GGBFS (a,b) energy-dispersive spectroscopy (EDS) mapping of GGBFS with distribution of most dominant elements.
Buildings 13 01960 g003
Figure 4. Influence of the replacement additive GGBFS on the setting time of the OPC.
Buildings 13 01960 g004
Figure 5. Isoline XRD diffraction patterns collected during 48 h of hydration specimens PB0.
Buildings 13 01960 g005
Figure 6. SEM images of developed microstructure of PB0 at magnification 5500× and 10,000× (a,b) and PB30T at magnification 5000× and 20,000× (c,d).
Buildings 13 01960 g006
Figure 7. Total heat released during hydration of the OPC and specimens with the replacement additive GGBFS.
Buildings 13 01960 g007
Figure 8. Hydration heat released rate of the Portland cement specimens with and without the replacement additive GGBFS.
Buildings 13 01960 g008
Figure 9. Hydration rate curves of specimen PB0, with the fit of  F N G F I , and  F D  to the intervals of the dα/dt-t curves in which they control the process of cement hydration.
Buildings 13 01960 g009
Figure 10. Development of compressive and flexural strength in mortars with the replacement additive GGBFS (0–40 mass %) relative to hydration time.
Buildings 13 01960 g010
Table 1. Physical and chemical composition of CEM I 42.5 R.
Chemical and Mineralogical Composition
wt.%
SiO219.68
Al2O34.92
Fe2O33.12
CaO63.86
MgO2.09
SO33.14
Na2O0.20
K2O1.40
Loss of ignition (LOI), %0.18
Physical Characteristics
Specific mass, kg/m33.13
Specific surface area, Blain, m2/kg368.9
Consistency, %26
Start setting2 h 20 min
End setting4 h 0 min
Table 2. Physical and chemical composition of the GGBFS.
wt.%
SiO238.95
Al2O39.79
Fe2O30.68
CaO39.83
MgO4.60
SO32.24
Na2O0.33
K2O0.86
Loss of ignition (LOI), %0.77
Physical characteristic
Specific mass, kg/m32.8
Specific surface area, Blain, m2/kg398.56
Table 3. Chemical composition of GGBFS.
Map Sum Spectrumwt.%Map Sum Spectrumwt.%
O36.3Mg1.6
Ca20.2Zn1.2
Fe15.7K0.8
Si14.0S0.5
Al3.9P0.4
Cu2.9Ti0.2
Mn2.3Total100
Table 4. Composition of the mixture and denotations of specimens of prepared cement mortars.
SpecimenSand, gCement, gGGBFS, gMaster Glenium ACE 430, gConsistency, mmWater, mLw/cw/(GGBFS + c)
PB01350450002072250.5000.500
PB0S135045003.92001750.3890.389
PBT5S1350427.522.53.91901750.4090.389
PBT15S1350382.567.53.91951750.4580.389
PBT20S1350360903.92101750.4860.389
PBT25S1350337.5112.53.91901650.4890.367
PBT30S13503151353.91821670.5300.371
PBT40S13502701803.92001650.6110.367
Table 5. Total heat released by the process of hydration in the cement paste prepared with the w/c = 0.5 and t = 20.0 ± 0.1 °C, during the first 48 h.
SpecimensTotal Heat Release during the First 48 h, J/g
PB0173.84
PB5T149.10
PB15T147.28
PB20T138.69
PB25T130.69
PB30T130.16
PB40T128.01
Table 6. Kinetic parameters of hydration in the OPC-GGBFS cement paste.
SpecimenKinetic Parameters
n   k N G ,   h 1   t N G I ,   h   k I ,   μ mh 1   t I D ,   h   k D ,   μ m 2 h 1
PB03.0830.04315.0680.02230.6090.0053
PB5T3.9300.04412.7010.02429.0830.0083
PB10T4.4730.04812.1010.02227.760.0083
PB15T3.7640.04412.4080.02131.760.0032
PB20T4.1570.04313.2320.02034.2520.0029
PB25T4.2340.04313.9890.02231.300.0068
PB30T4.7980.04612.9860.02330.3240.0079
PB40T4.2660.04313.3540.02230.4830.0026
Disclaimer/Publisher’s Note: The statements, opinions and data contained in all publications are solely those of the individual author(s) and contributor(s) and not of MDPI and/or the editor(s). MDPI and/or the editor(s) disclaim responsibility for any injury to people or property resulting from any ideas, methods, instructions or products referred to in the content.