Article

Impact of Polypropylene Fiber on the Mechanical and Physical Properties of Pervious Concrete: An Experimental Investigation

1
Shaanxi Key Laboratory of Safety and Durability of Concrete Structures, Xijing University, Xi’an 710123, China
2
The Youth Innovation Teen of Shaanxi Universities, Xi’an 710123, China
3
Northwest Engineering Corporation Limited, Xi’an 710065, China
4
College of Science, Xi’an University of Architecture and Technology, Xi’an 710055, China
*
Author to whom correspondence should be addressed.
Buildings 2023, 13(8), 1966; https://doi.org/10.3390/buildings13081966
Submission received: 29 June 2023 / Revised: 29 July 2023 / Accepted: 30 July 2023 / Published: 1 August 2023

Abstract

:
It is important to balance the characteristics of pervious concrete, such as mechanical, physical, and durability properties. To obtain a better performance, adding fibers is very effective. In this study, samples with different polypropylene fiber content (0 kg/m3, 3 kg/m3, 6 kg/m3, and 9 kg/m3) were designed to test the strength, porosity, permeability, acid corrosion behavior, and low-temperature performance of pervious concrete. It can be found from the experimental results that, compared to the control samples (without the addition of fibers), when the mixing amount of fiber is 6 kg/m3, the cubic compressive strength, axial compressive strength, and flexural tensile strength increase by 35.32%, 37.16%, and 13.04%, respectively; the porosity and permeability coefficient decrease by 36.32 % and 49.30%, respectively; the strength of samples with acidic corrosion times of 0 d, 20 d, 40 d, and 60 d increased by 30.96%, 17.41%, 15.47%, and 20.87%, respectively; and the strength of samples at temperatures of −20 °C, −10 °C, 0 °C, and 25 °C decrease by 14.17%, 15.45%, 22.97%, and 30.96%, respectively. The meso-structure of pervious concrete is studied using industrial computed tomography (ICT) to investigate the relationships between the characteristics. It could be seen that the optimal dosage of polypropylene fiber is 6 kg/m3, which is more suitable for application in engineering.

1. Introduction

Pervious concrete, which can be identified as lightweight concrete and whose surface is honeycombed, is a sustainable composite mix with a density of 1600–2000 kg/m3 [1]. Pervious concrete can be used as a floor decoration in the community and pavement of landscape garden to reduce the runoff of the stormwater and recharge the groundwater [2]. In order to permit the water to run through rather than run off, it is necessary to ensure that pervious concrete has sufficient porosity and permeability [3,4]; thus, the pervious concrete usually has lower mechanical strength [5]. The coarse aggregate type and particle size, cement–aggregate ratio, method of manufacture, and mix proportion are the main factors affecting the performance of the pervious concrete [6,7,8,9,10,11].
Some of the works in the literature have studied the performance of pervious mixes with different aggregate types and particle sizes for decades. However, single-size aggregates are usually used in engineering applications due to their ability to simplify the production process [12]. Liu et al. [13] investigated the characteristics of pervious concrete with different particle aggregate sizes, and the conclusion was that the void distribution was mainly affected by the aggregate size. Meng et al. [14] presented the idea that aggregate with a particle diameter of 5–10 mm could obtain a better post-cracking performance. Other studies showed that the optimum size of the aggregate was 9.5 mm for pervious concrete, using Portland cement [15]. Besides the particle size, it is also found that the porosity and compressive strength were affected by the aggregate size [16]. Dolerite, granite, limestone, quartzite, and river gravel were the most common aggregates [17], and taking into account the stability of performance and the universality of distribution, limestone is chosen was the aggregate in this study.
Meanwhile, the water–cement ratio (w/c ratio) also affects the performance of pervious concrete. When the w/c ratio is relatively small, the aggregate could not be completely covered by cement slurry, while a higher w/c ratio means that the liquidity of cement is too strong to cover the aggregate effectively [17]. Due to the fluidity of cement slurry, the decreasing of the w/c ratio usually leads to an increase in permeability and porosity [18,19]. The porosity must be considered in the design of pervious concrete, and some of the literature indicated that the compressive strength and porosity are negatively correlated due to the weak connection effect of aggregate and cement slurry [2,20]. Rangelov et al. [21] investigated the influence of the w/c ratio on the performance of pervious concrete. It could be concluded that the best mechanical properties could be obtained when the w/c ratio was 0.25~0.35. Therefore, the w/c ratio was established to be 0.3 in this study.
Furthermore, supplementary cementitious materials are widely adopted to obtain a better performance of pervious concrete through the effect of pore size refinement and matrix densification [22]. Seeni et al. [23] partly replaced the cement with silica to manufacture a new type of pervious concrete, so as to obtain better characteristics for the pervious mix. Supit et al. [24] used metakaolin as an addition to a pervious mix to analyze its effect. The results presented that the best early stage strength would be obtained when the metakaolin content was 10%. Among these materials, silica fume, which is a powder generated during the high-temperature melting of industrial silicon and ferrosilicon in industrial electric furnaces, is often used to enhance the interfacial transition zone [25,26]. Thus, the silica fume was used as an additive to replace the cement in this study.
Fiber reinforcement is another effective method that has gradually been widely used to improve the characteristics of pervious mixes for decades [27]. Due to the bonding of cement slurry and aggregate through the bridging action of fibers, the strength will increase significantly [28,29,30]. In the commonly used fibers, polypropylene fiber has gradually become a research hotspot due to its properties of high strength, small specific gravity, and corrosion resistance [31,32]. Akand et al. [28] treated the surface roughness of short polypropylene fibers, using a chemical method, and investigated its reinforcement effect on the pervious mix. The results indicated that the bonding effect between fibers and cement paste was obviously affected by the surface roughness and, thus, could effectively improve the strength of pervious mix. Oni et al. [3] analyzed the strength of a pervious mix with different polyethylene fiber proportions. It could be concluded that, with the increase in fiber proportion, the compressive and splitting tensile strength decreased, while the change in the flexural strength was relatively small, indicating that the influence of fiber content on the flexural strength was not significant. Ozel et al. [33] studied the strength and physical properties of pervious concrete with different fiber proportions. It could be seen that the fibers were helpful to achieve superior strength and permeability. Ozturk et al. [34] discussed the characteristics of the pervious mix with different polypropylene fiber proportions. According to the research findings, the inclusion of fibers had a minimal impact on the strength, deformability, and physical characteristics of the pervious mixture. However, the durability of the mixture was ensured as a result of the bridging effect of the fibers. Based on the analysis of the aforementioned literature, it could be concluded that the fibers do have an effect on the characteristics of pervious concrete. Therefore, a different content of polypropylene fiber is added to the pervious mix to promote its engineering application.
Based on the above description, it can be seen that the current research on pervious concrete mainly focuses on mechanical and physical properties, and little work has been performed on durability. There is still much work to be performed, particularly in the areas of acid corrosion and temperature effects. Therefore, the focus of this paper is to examine how the addition of polypropylene fibers affects the characteristics of pervious concrete. According to the preliminary tests, the fiber content was determined to be 0 kg/m3, 3 kg/m3, 6 kg/m3, and 9 kg/m3. The porosity, permeability coefficient, compressive strength, flexural tensile strength, acidic corrosion behavior, and low-temperature properties were subsequently subjected to the testing. Additionally, the mesostructure of the pervious mix was obtained using ICT to investigate the mechanism of fiber action. Finally, based on the results and analysis from these tests, an optimal polypropylene fiber content was determined to enhance the practical application of pervious concrete.

2. Materials and Testing Parameters

2.1. Materials

The cement type used in this study was P O 42.5, whose 28-day compressive strength was not less than 42.5 MPa, and other parameters are given in Table 1. Table 2 shows the performance parameters of silica fume used as a supplementary cementitious material. A polycarboxylate high-performance water reducer was chosen as an additive to reduce the quantity of water. According to the Chinese Code CJJ/T 135-2009, tap water at room temperature (25 ± 4 °C) was used when mixing the pervious concrete [35]. The length of the polypropylene fibers used in the cement paste was 20 mm, and Table 3 shows other characteristics of the fiber. The parameters of the materials listed in Table 1, Table 2 and Table 3 were provided by the manufacturer.

2.2. Mix Ratio and Curing Method

Based on the regulation of specification, the compressive strength was essential to determine the mix proportion of the mixture [35]. Table 4 gives the mixture ratio through preliminary tests. The weight of fiber was measured, and the test sample was made using an electronic scale and concrete mixer, respectively. The internal surface of the mixer was wetted before the mixing of the pervious concrete, and then we added half of the weighted water and aggregate to the mixer and stirred for 60 s. Subsequently, we added the cement and silica fume to the machine and stirred for 60 s, until the materials were mixed evenly. When the mixer reached the set time and stopped, we put the remaining materials into the machine and stirred for 120 s to ensure the uniform distribution of the raw materials. The testing samples were compacted by a shaking table, whose rotational frequency and amplitude were 2850 rpm and 2 mm, respectively. A large number of vibration tests with vibrating times of 15 s, 20 s, 25 s, and 30 s were carried out, and it was determined that the best compaction effect was obtained when the vibration time was 25 s. After that, the previous concrete samples were kept in a curing box at a temperature of 22 °C and 95% humidity for a duration of 28 days. In order to fully investigate the characteristics of the pervious mix, different types of samples were produced. The dimensions of specimens for testing the axial compressive strength, flexural tensile strength, and permeability were 100 mm × 100 mm × 300 mm, 100 mm × 100 mm × 400 mm, and Φ100 mm × 50 mm, respectively. The side length of the cube samples for testing other parameters of the pervious concrete was 100 mm, as shown in Figure 1.

2.3. Experiment Methods

In this paper, 52 groups of samples (each group included 3 samples) were designed to obtain the corresponding performance parameters of pervious concrete. The parameters and testing methods are given as follows.

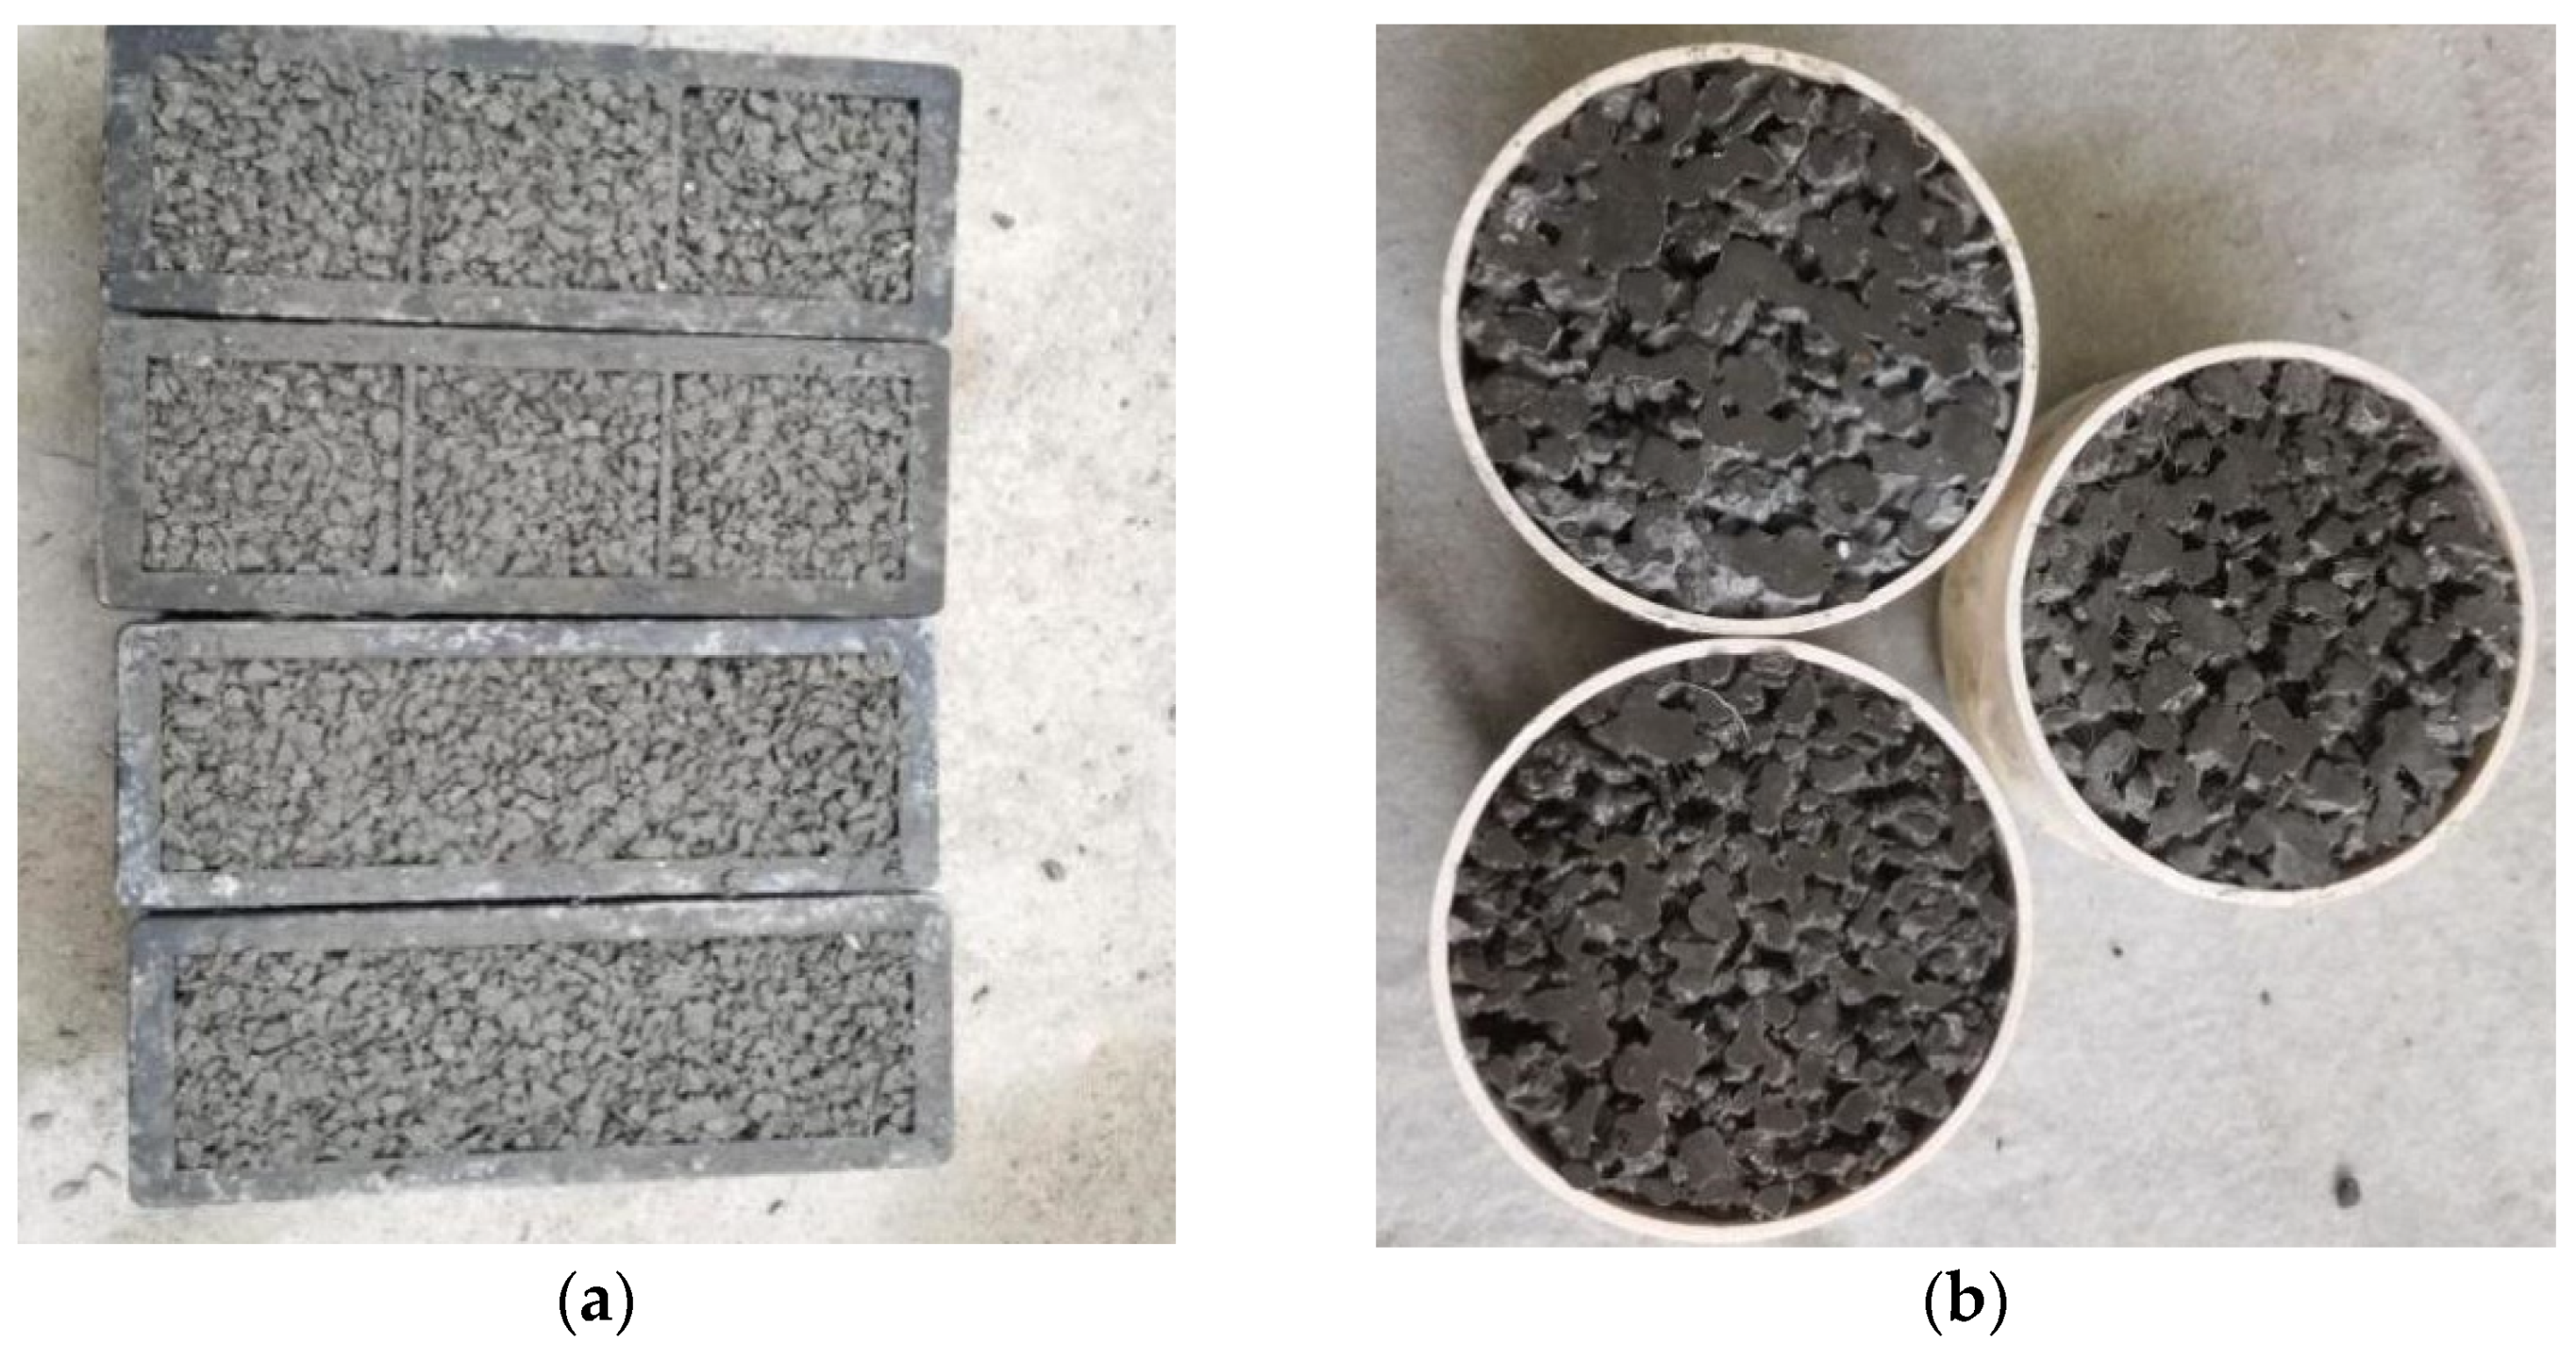
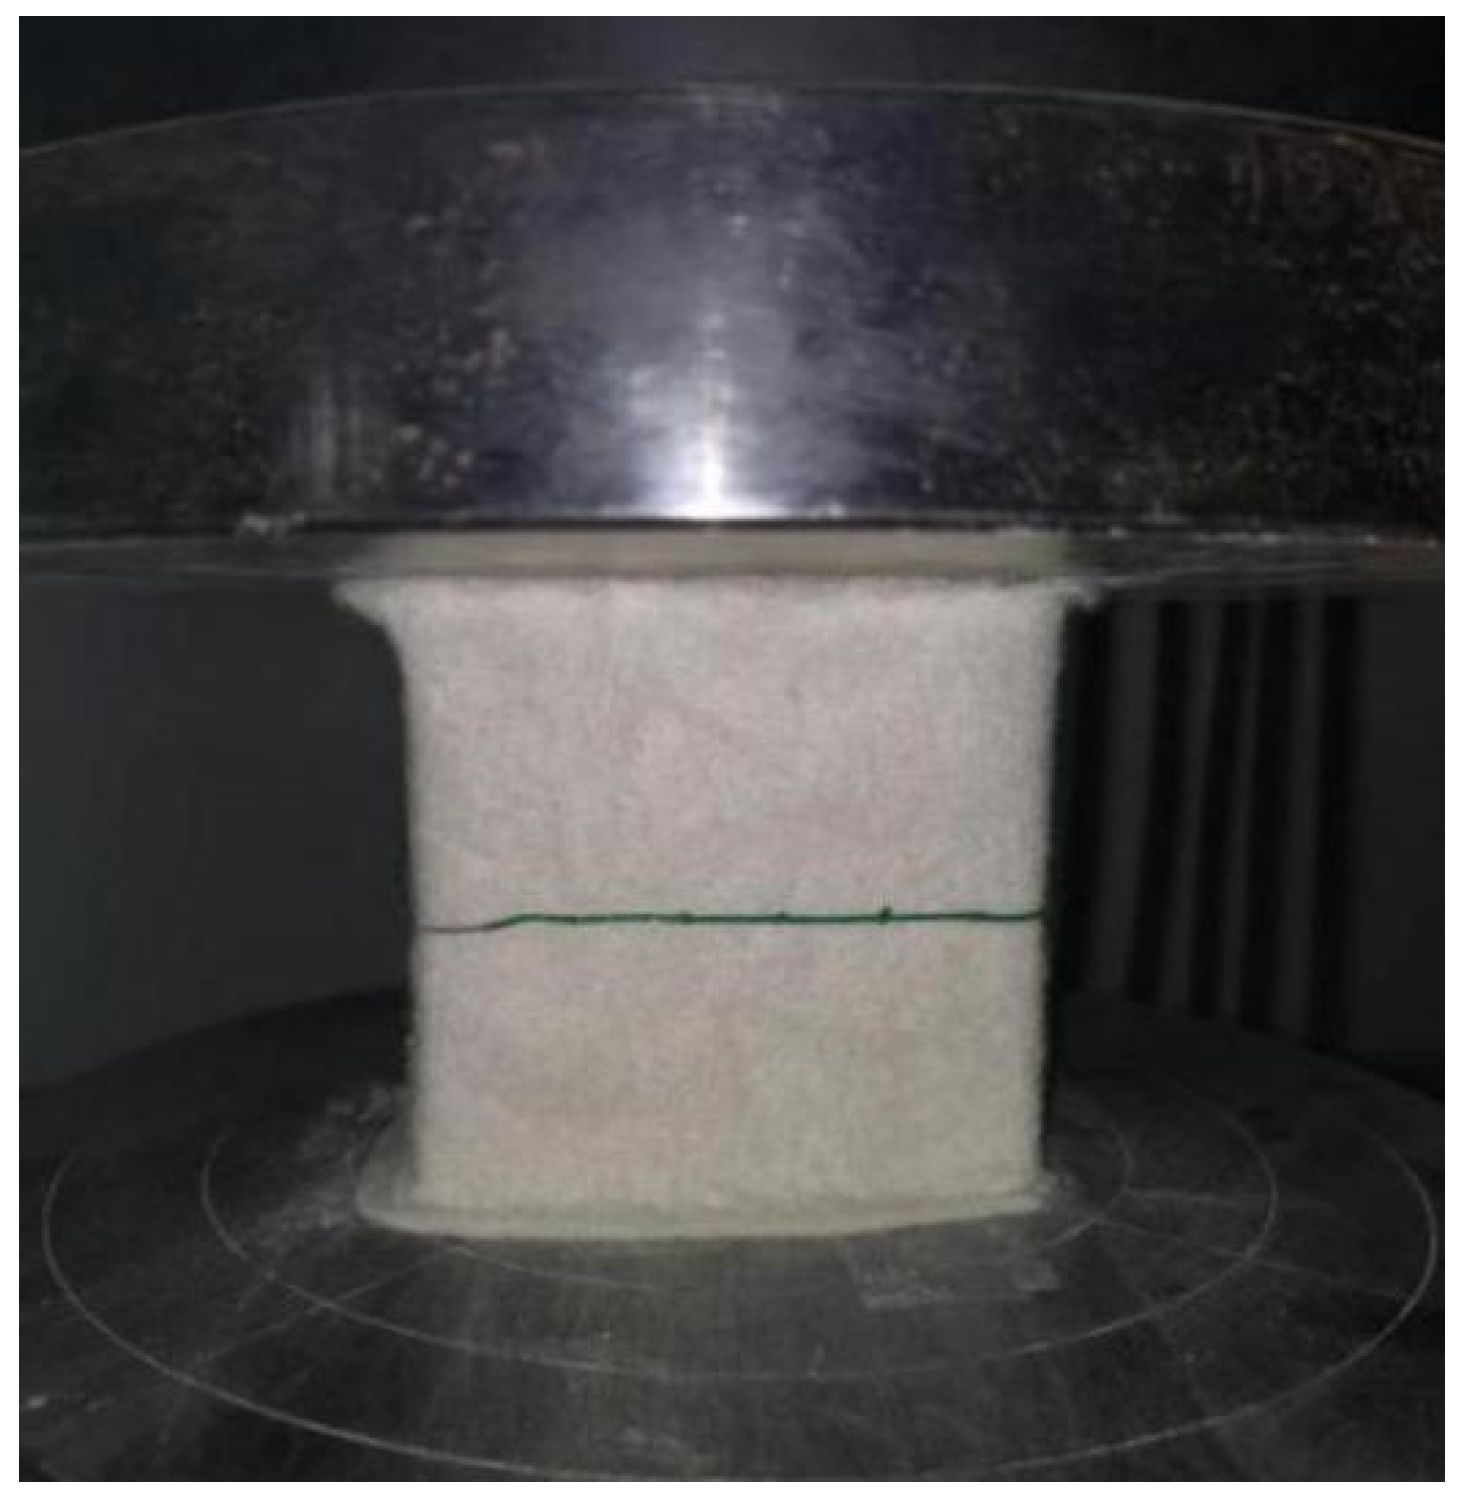
2.3.1. Compressive Strength

To establish the strength grade of pervious mixture, a cubic compressive strength test was carried out according to [36]. The strength referred to in this paper is the strength after 28 days of curing. The loading rate is 0.3 MPa/s, and the result is calculated according to Equation (1).
f c c = F A
where F is the bearing capacity (N), and A is the loading area calculated by the average width and length of the sample (mm2).
The axial compressive strength is another important parameter that reflects mechanical properties. The axial compressive strength, relative to the cube sample’s strength, serves as a crucial indicator for assessing the material’s robustness at construction sites. Therefore, axial compressive strength was tested according to [36] in this paper. The strength of the prism sample could also be calculated by Equation (1).

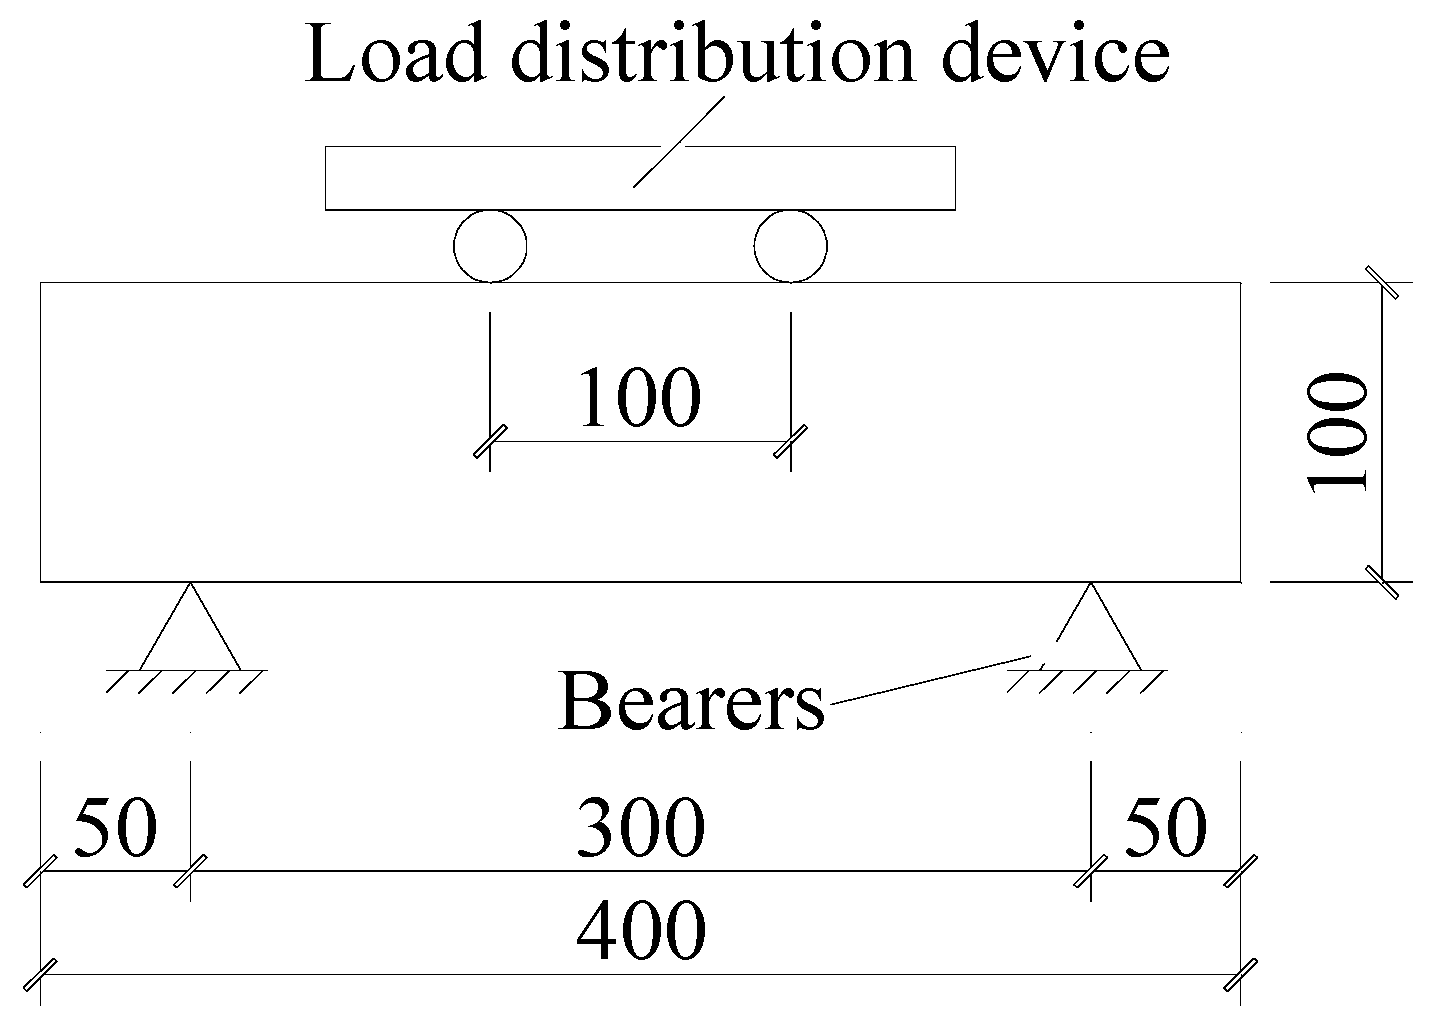
2.3.2. Flexural Tensile Strength
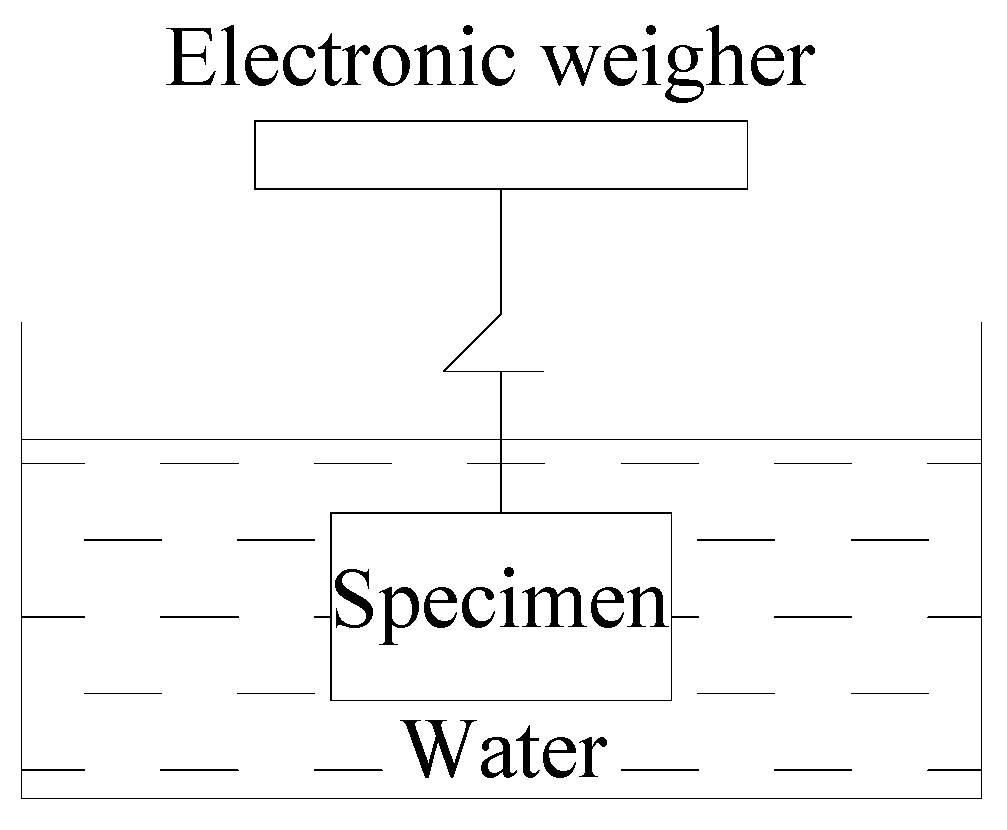
The flexural tensile strength, which is mainly used to obtain the strength of brittle materials, refers to the ability of materials to resist bending without breaking. According to [36], the four-point bending test method was chosen for this study. Figure 2 shows the setup of the flexural test, in which the specimen is divided into three equal parts by rigid bearers and a loading device, and the distance between the bearer and the two ends of the specimen is 50 mm. The flexural strength tests were conducted with a loading rate of 0.03 MPa/s, as specified in [36]. The flexural strength can be calculated by Equation (2).
f f = F l b h 2
where ff is the strength value (MPa); F represents the maximum loadings during the test (N); l represents the distance between the two bearers (mm); and b and h represent the width and height at the cross-section of the specimen (mm), respectively.

2.3.3. Porosity

The pores of pervious concrete are continuous and interconnected. When water comes into contact with the surface of pervious concrete, it permeates through these pores under the force of gravity, reaching the lower part of the material. Before the testing of the porosity, the specimens had to be oven-dried until the measured mass did not change. Then, the specimens were immersed in the running water for 24 h, through which the immersed weight could be obtained, as shown in Figure 3. Finally, the weight of the specimens after completely drying was tested (dry weight). The porosity was calculated using Equation (3) [37].
P = [ 1 ( m 2 m 1 ρ w V 0 ) ] × 100 %
where m1 and m2 represent the immersed and dry weight (g) respectively, ρw represents the water density (g/cm3), V0 represents the volume of sample (cm3).

2.3.4. Permeability

The permeability coefficient is a parameter that characterizes the permeability of concrete, referring to the water flowing through the permeable cement concrete per unit of time. The constant head permeability is often used to obtain the permeability coefficient due to its shorter test time and small deviations [38,39]. Figure 4 shows the experimental setup used in this study, which is consistent with the requirements of the specification [35].
Firstly, the samples were connected to the cylinder, using a sealant. Secondly, the faucet, overflow outlet of the cylinder, and overflow water tank were used to obtain the steady water head. Finally, the volume of water in the graduated cylinder was measured to represent the water drained from the specimens. After that, Equation (4) could be used to calculate the permeability.
K T = D h 0 × Q A 0 × t
where D represents the height of the sample (mm), Q represents the volume of water in a graduated cylinder (mm3), h0 represents the water head (mm), t represents the time interval (s), and A0 represents the cross-section area of the sample (mm2).

2.3.5. Acid Corrosion

Acid rain is the most direct form of acid corrosion on pervious concrete, and it can cause surface erosion, the dissolution of hydration products, and the exposure of aggregates. Therefore, this study investigated the changes of strength of specimens under the action of acid corrosion. During the testing process, the pH value was maintained at 1, and the specimen was fully immersed in an acidic solution, as given in Figure 5. In order to prevent the consumption of hydrochloric acid solution during the test, which leads to the increase in pH value, the hydrochloric acid solution was measured every two days to ensure the stability of the pH value. When the acidity decreased, hydrochloric acid needed to be added to the liquid until the pH value reached the testing requirement.
According to the regulations of the specification [40], the acid corrosion time was established as 20 days, 40 days, and 60 days.

2.3.6. Frost Resistance

In cold regions, lower temperatures will affect the strength of pervious concrete. Referring to the relevant regulations of the ordinary concrete specification [40], this paper studies the effect of low temperatures (−20 °C, −10 °C, 0 °C, and 25 °C) on the strength of pervious concrete. The samples were soaked in running water for 24 h, removed and replaced until there was no more water dripping, and then cooled to the specified temperature in a refrigerator for 24 h. The samples were wrapped with a foam plate after taking them out to ensure the stability of temperature during the testing process, as shown in Figure 6.

2.3.7. Industrial CT Scanning

The mechanism of industrial CT (ICT) is ray detection, and ICT is considered the best non-destructive technology in the detection of engineering and materials. In this study, the samples were put into the instrument and scanned by the rotation of the probe. After that, a thin layer of the cross-section of the workpiece without image overlap could be obtained, and a 3D image was built by thin layers. The parameters of ICT used in this study are given in Table 5.

3. Experiment Results and Discussion

3.1. Physical Properties

3.1.1. Porosity

Figure 7 shows the changes of porosity in accordance with the changes in the amount of fiber doping. With the increase in the mixing amount of fiber, the porosity of the pervious mixture decreased rapidly, and then the speed of decrease slowed down: compared to the control specimen (i.e., 0 kg/m3 fiber content), the growth rate of porosity changes from −26.7% to −36.32% and −38.89% when the mixing amounts of fiber are 3 kg/m3, 6 kg/m3, and 9 kg/m3, respectively. The minimum porosity of pervious concrete specified in [35] is also shown in Figure 7 (10%, red dashed line). It is clear that the porosity of all the samples with or without the addition of fibers can meet the requirement of specification.

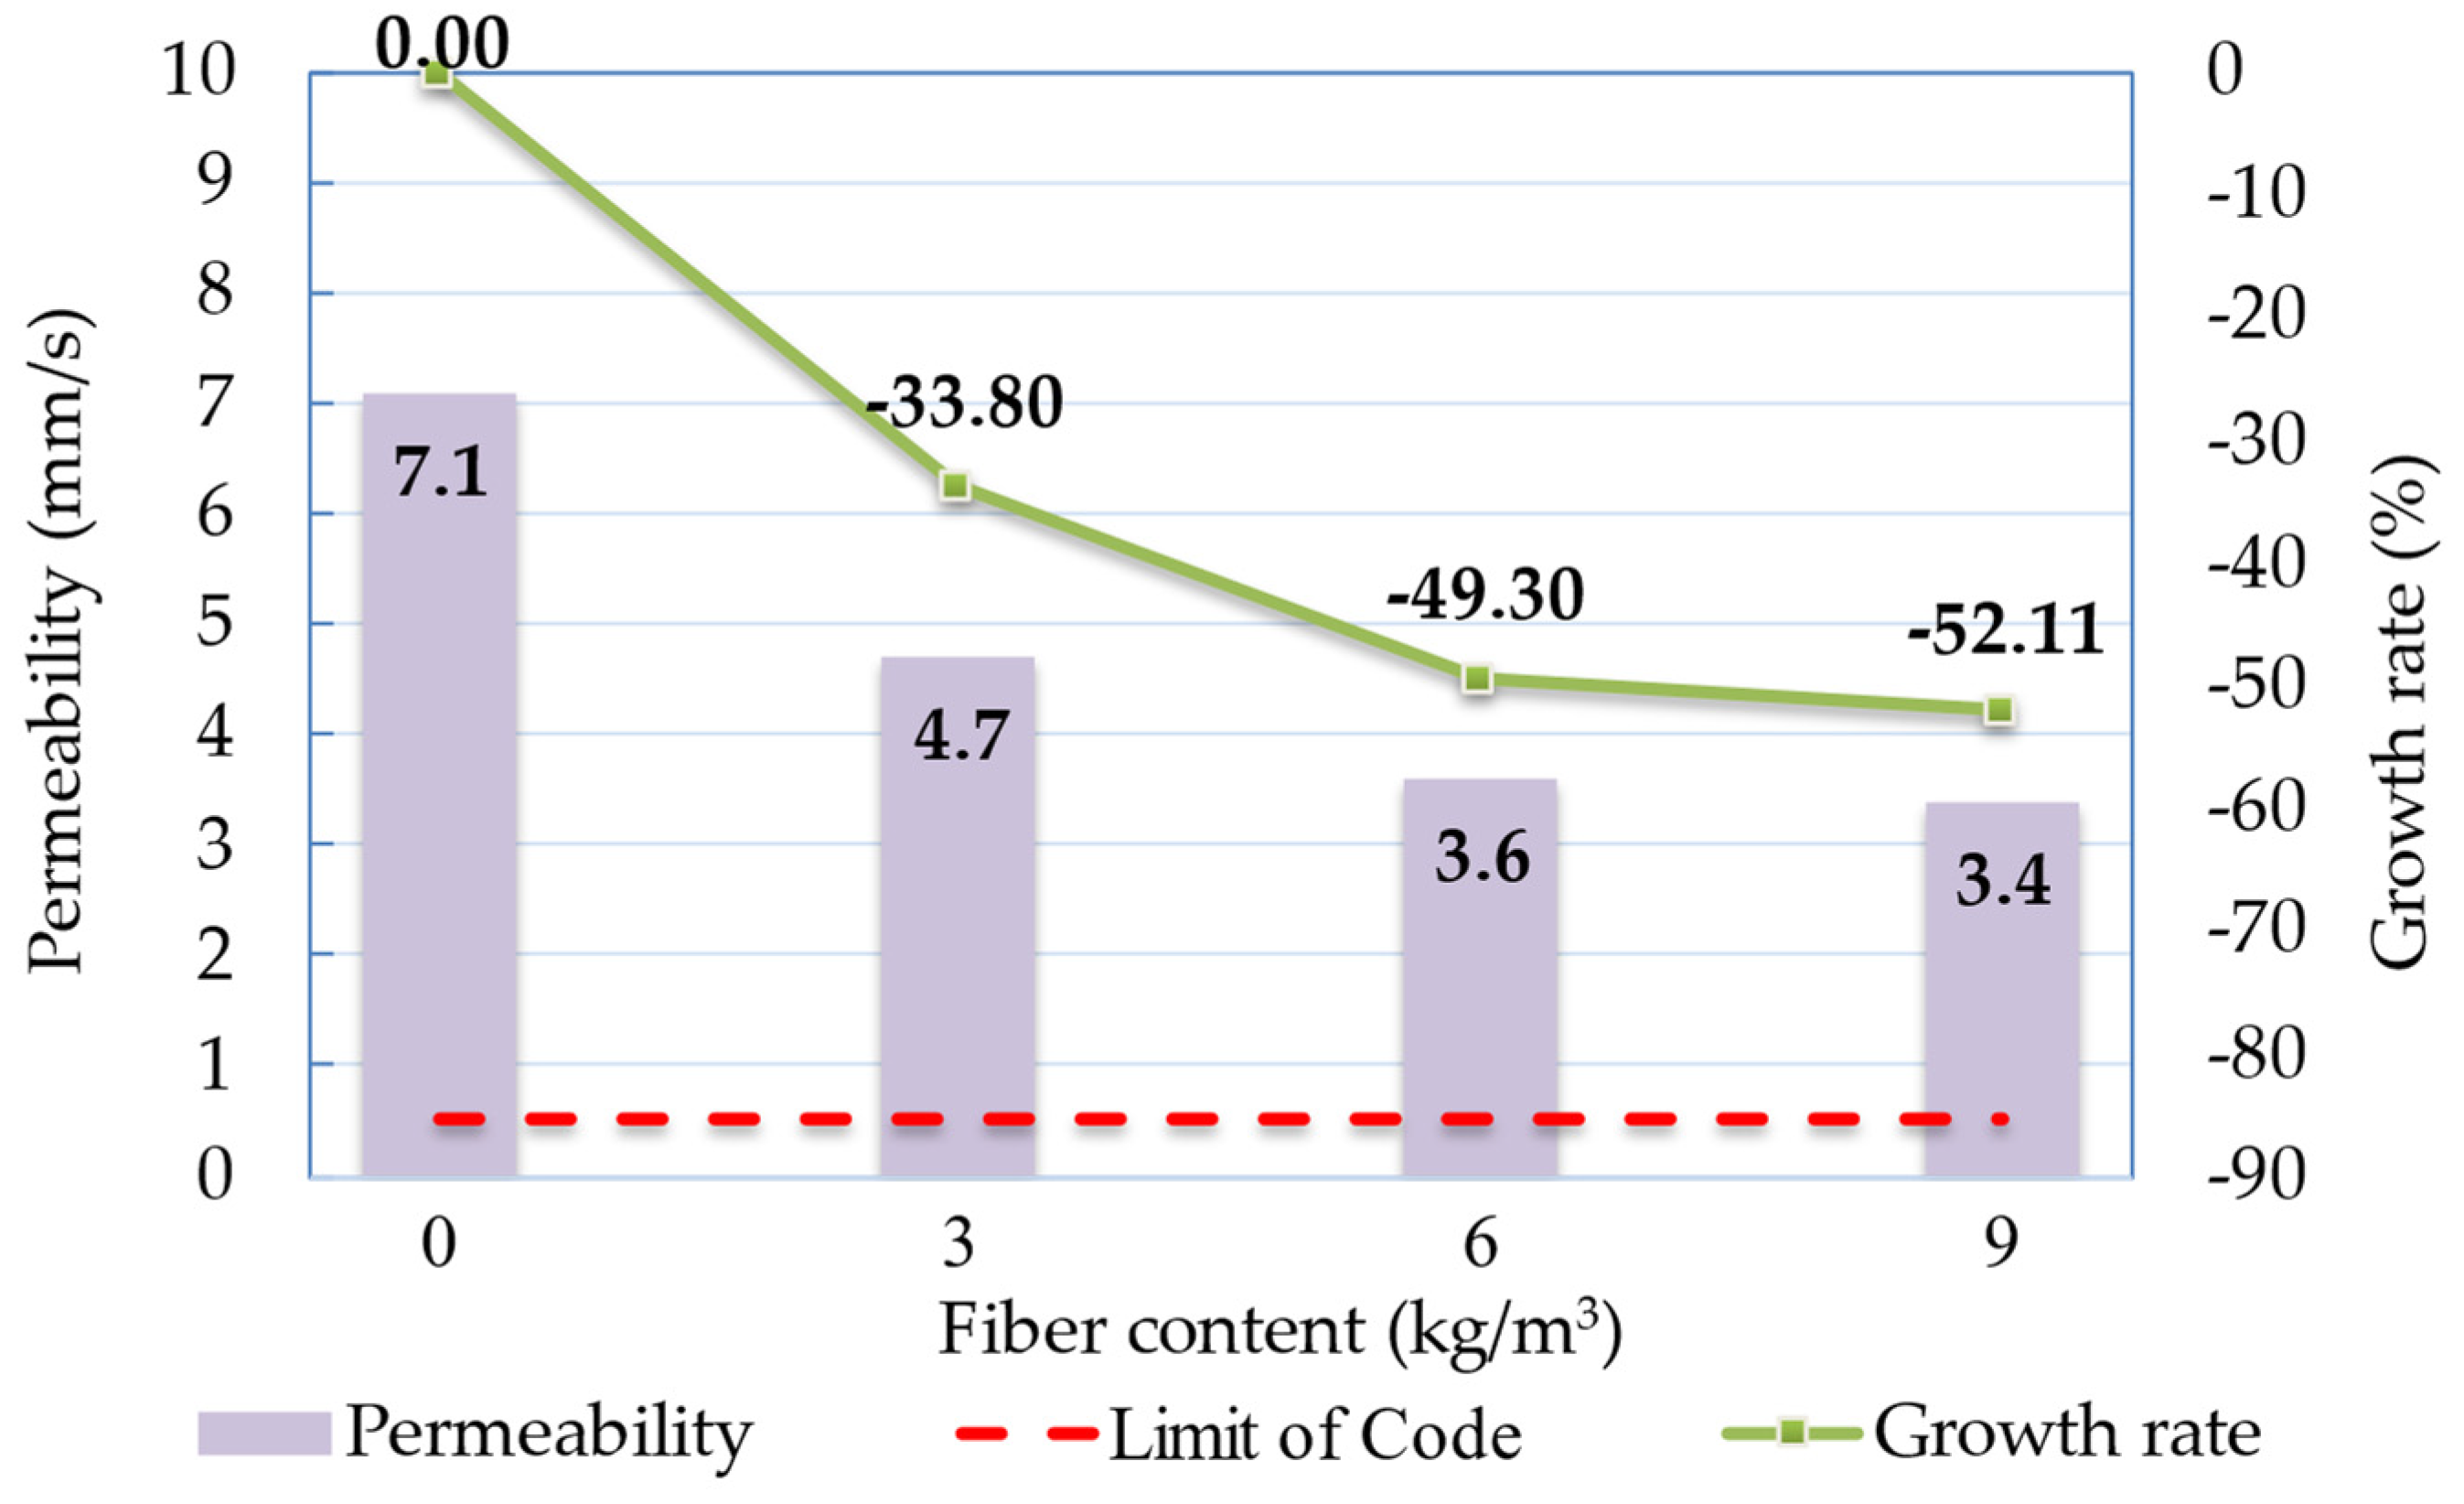
3.1.2. Permeability Coefficient

Figure 8 shows the relationship between the fiber content and permeability coefficient. The changes of this value are the same as for the porosity: the value of the permeability coefficient decreases as the mixing amount of fiber increases. Compared with the control specimen, the lowest permeability coefficient (3.4 mm/s) is obtained with a fiber content of 9 kg/m3. The growth rate decreases rapidly from 0.00% for control samples to 49.30% for mixing the amount of fiber of 6 kg/m3, and then it slowly decreases to 52.11% when the fiber content is 9 kg/m3. Therefore, it could be obtained that the permeability coefficient and porosity are positively correlated. Based on the regulation of [35], the pervious concrete must have a certain permeability coefficient (0.5 mm/s) to ensure its normal use. In Figure 8, the red dashed line represents the minimum value specified in the specification.

3.2. Mechanical Properties

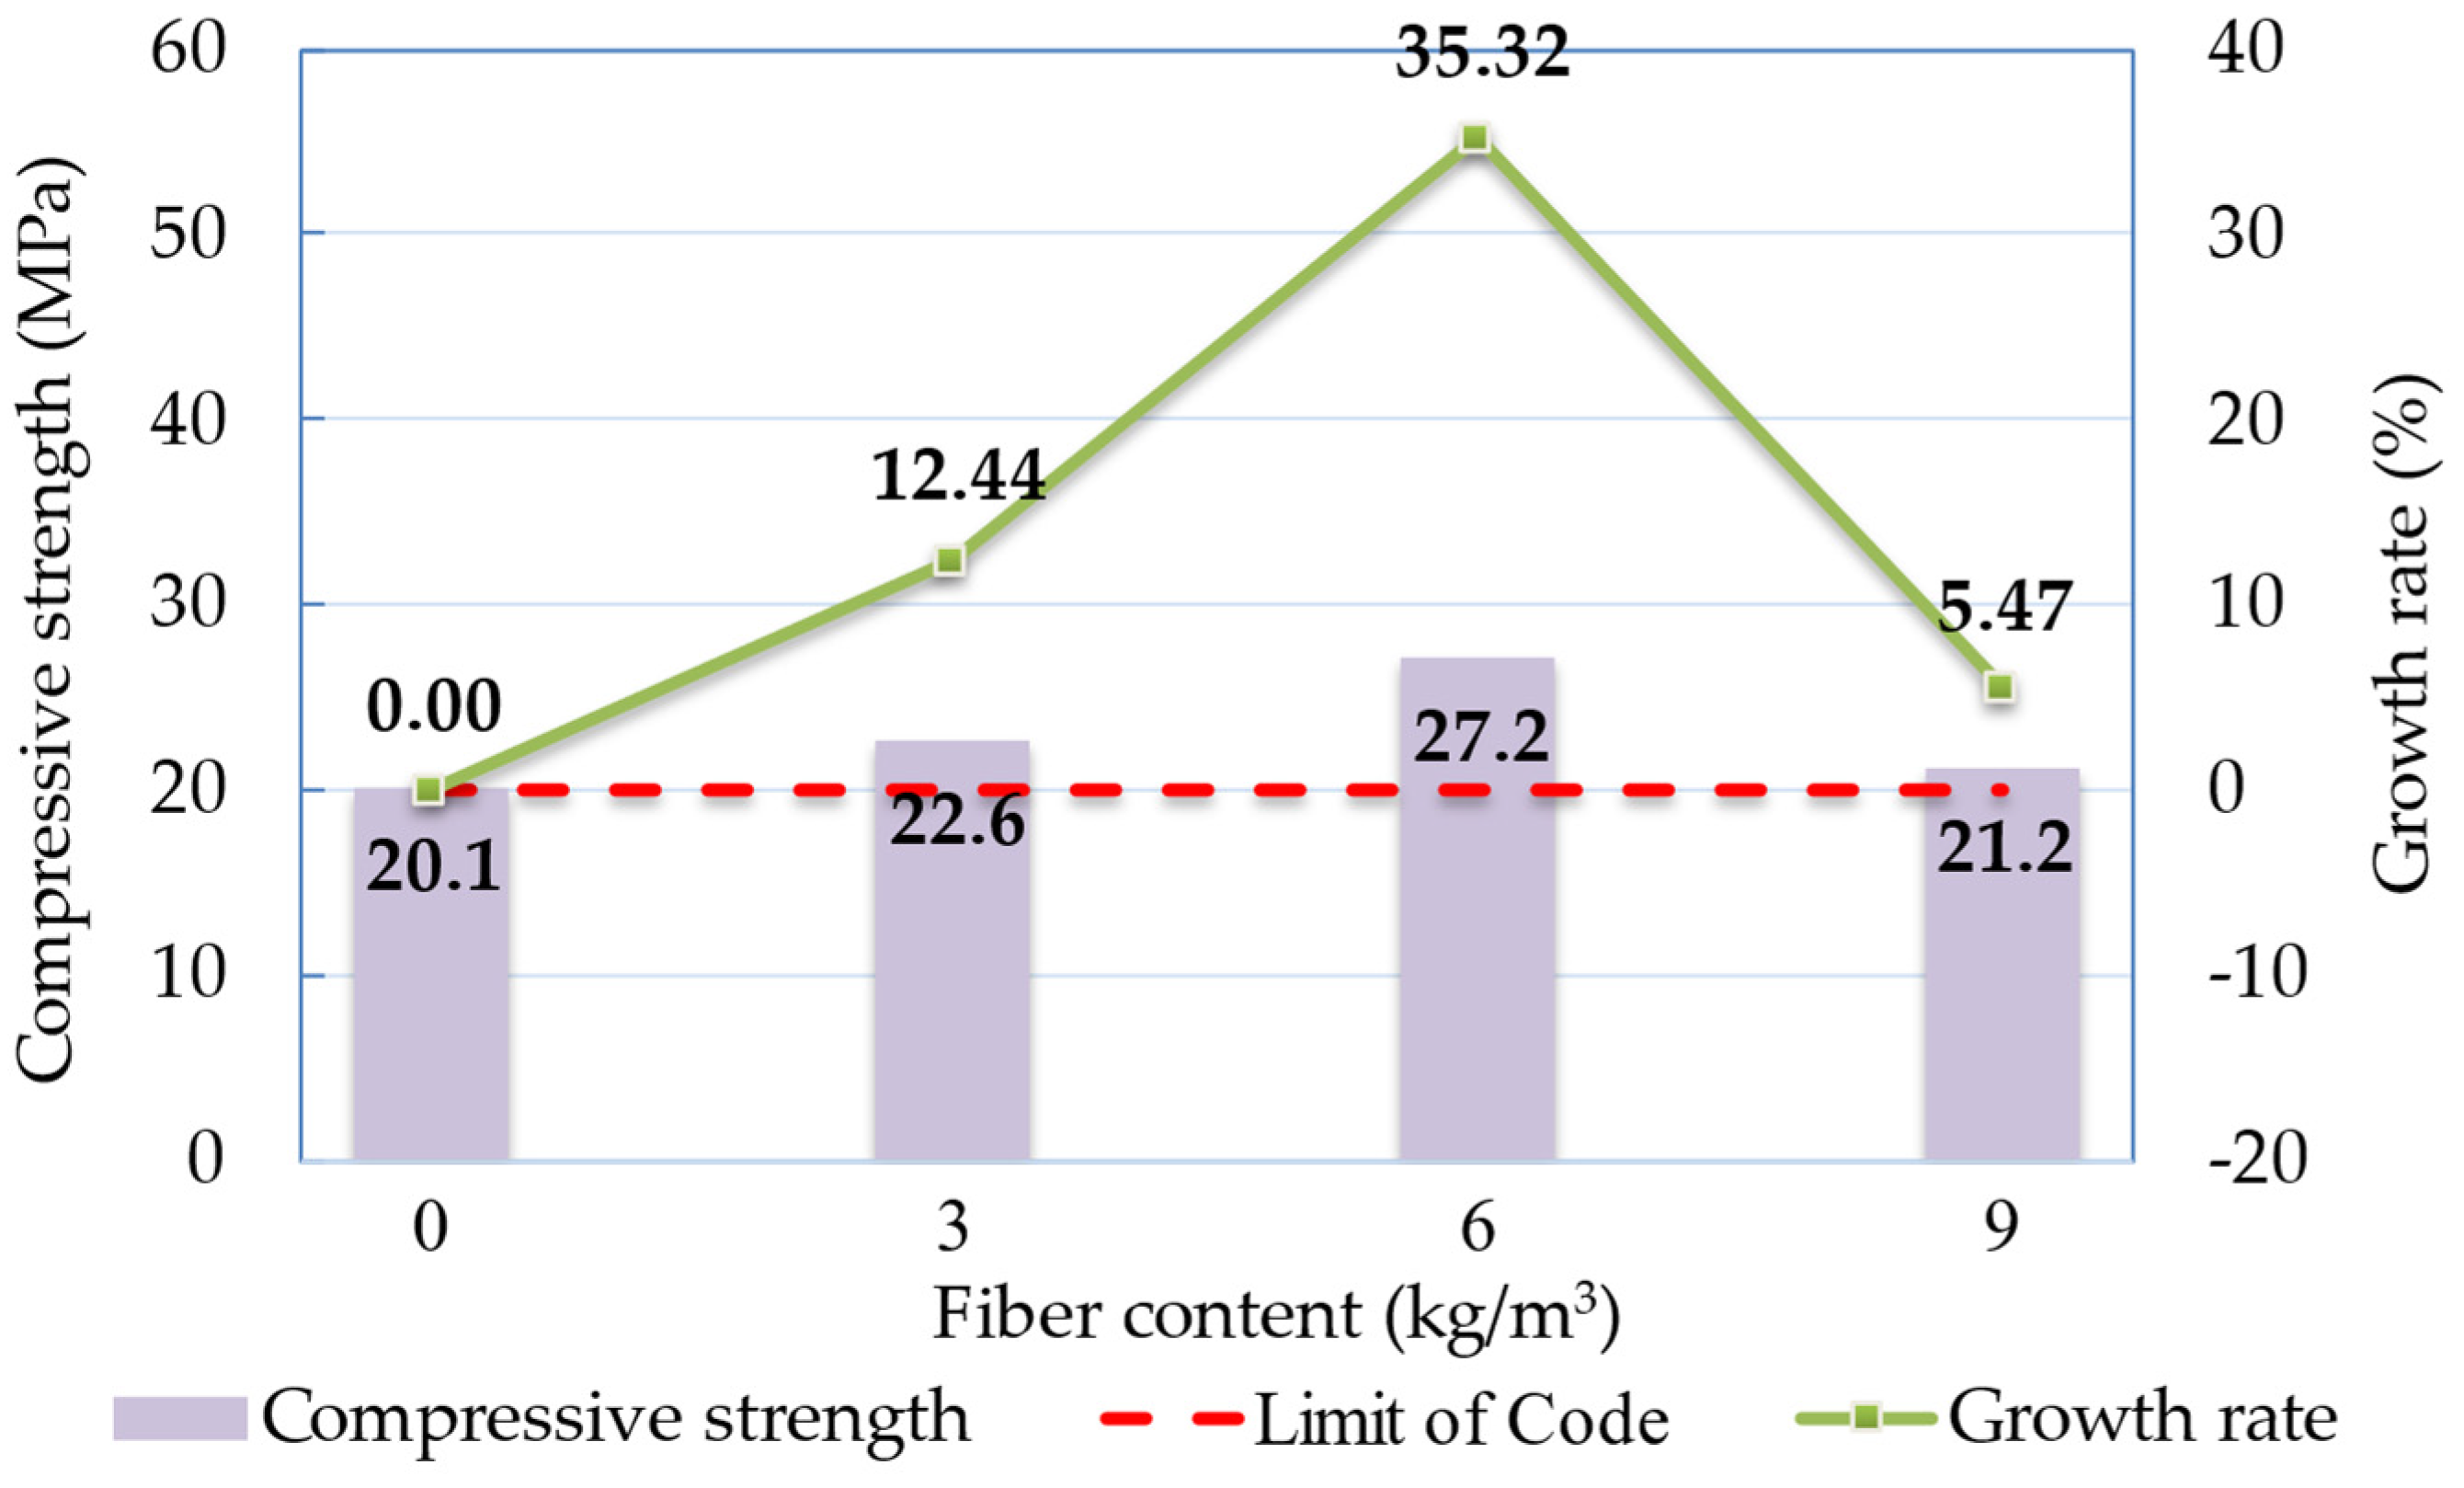
3.2.1. Compressive Strength

Figure 9 presents the relationship between the fiber content and cubic compressive strength. The strength increases and then decreases when the mixing amount of fiber increases. Compared to the control samples (20.1 MPa), the strength increases to 27.2 MPa when the fiber content is 6 kg/m3 (with a growth rate of 35.32%), and the increase is basically linear. When the mixing amount of fiber is higher than 6 kg/m3, the strength decreases rapidly. According to the regulation of [35], this strength value should be higher than 20.0 MPa, which is represented by the red dashed line in Figure 9. All the testing results of the cubic samples are higher than 20.0 MPa, indicating that the strength of pervious concrete meets the requirements regardless of whether the fiber is added.
Moreover, Figure 10 presents the failure modes during the cube strength test. When the mixing amount of fiber is 3 or 6 kg/m3, the failure modes are not much different. Therefore, only the failure phenomenon of the fiber content of 3 kg/m3 is given in the figure, and the same expression is used in other strength tests. For the control samples, the block is almost completely destroyed once the load reaches the maximum bearing capacity of the specimens. Although some fragments fall off from the corner of the samples when using fiber as reinforcement, the integrity of the samples is maintained well due to the effect of the fibers.
The relationship between the fiber content and axial compressive strength is given in Figure 11. The variation of the strength curve is similar to those of cubic samples: The strength value increases slowly, followed by rapidly, while the strength curve decreases rapidly if the mixing amount of fiber is higher than 6 kg/m3. The maximum strength value of fiber-reinforced pervious concrete is 20.3 MPa for the fiber content of 6 kg/m3, which is 37.16% higher than that of the control specimen.
Figure 12 gives the failure modes of prism samples with different mixing amounts of fiber. Based on the data, regardless of whether polypropylene fibers are present or not, there will be primary cracks running through the specimen upon failure. The key distinction lies in the fact that, without the bridging effect of polypropylene fibers, a significant amount of aggregate detachment occurs from samples, whereas specimens with fiber additions exhibit superior integrity.

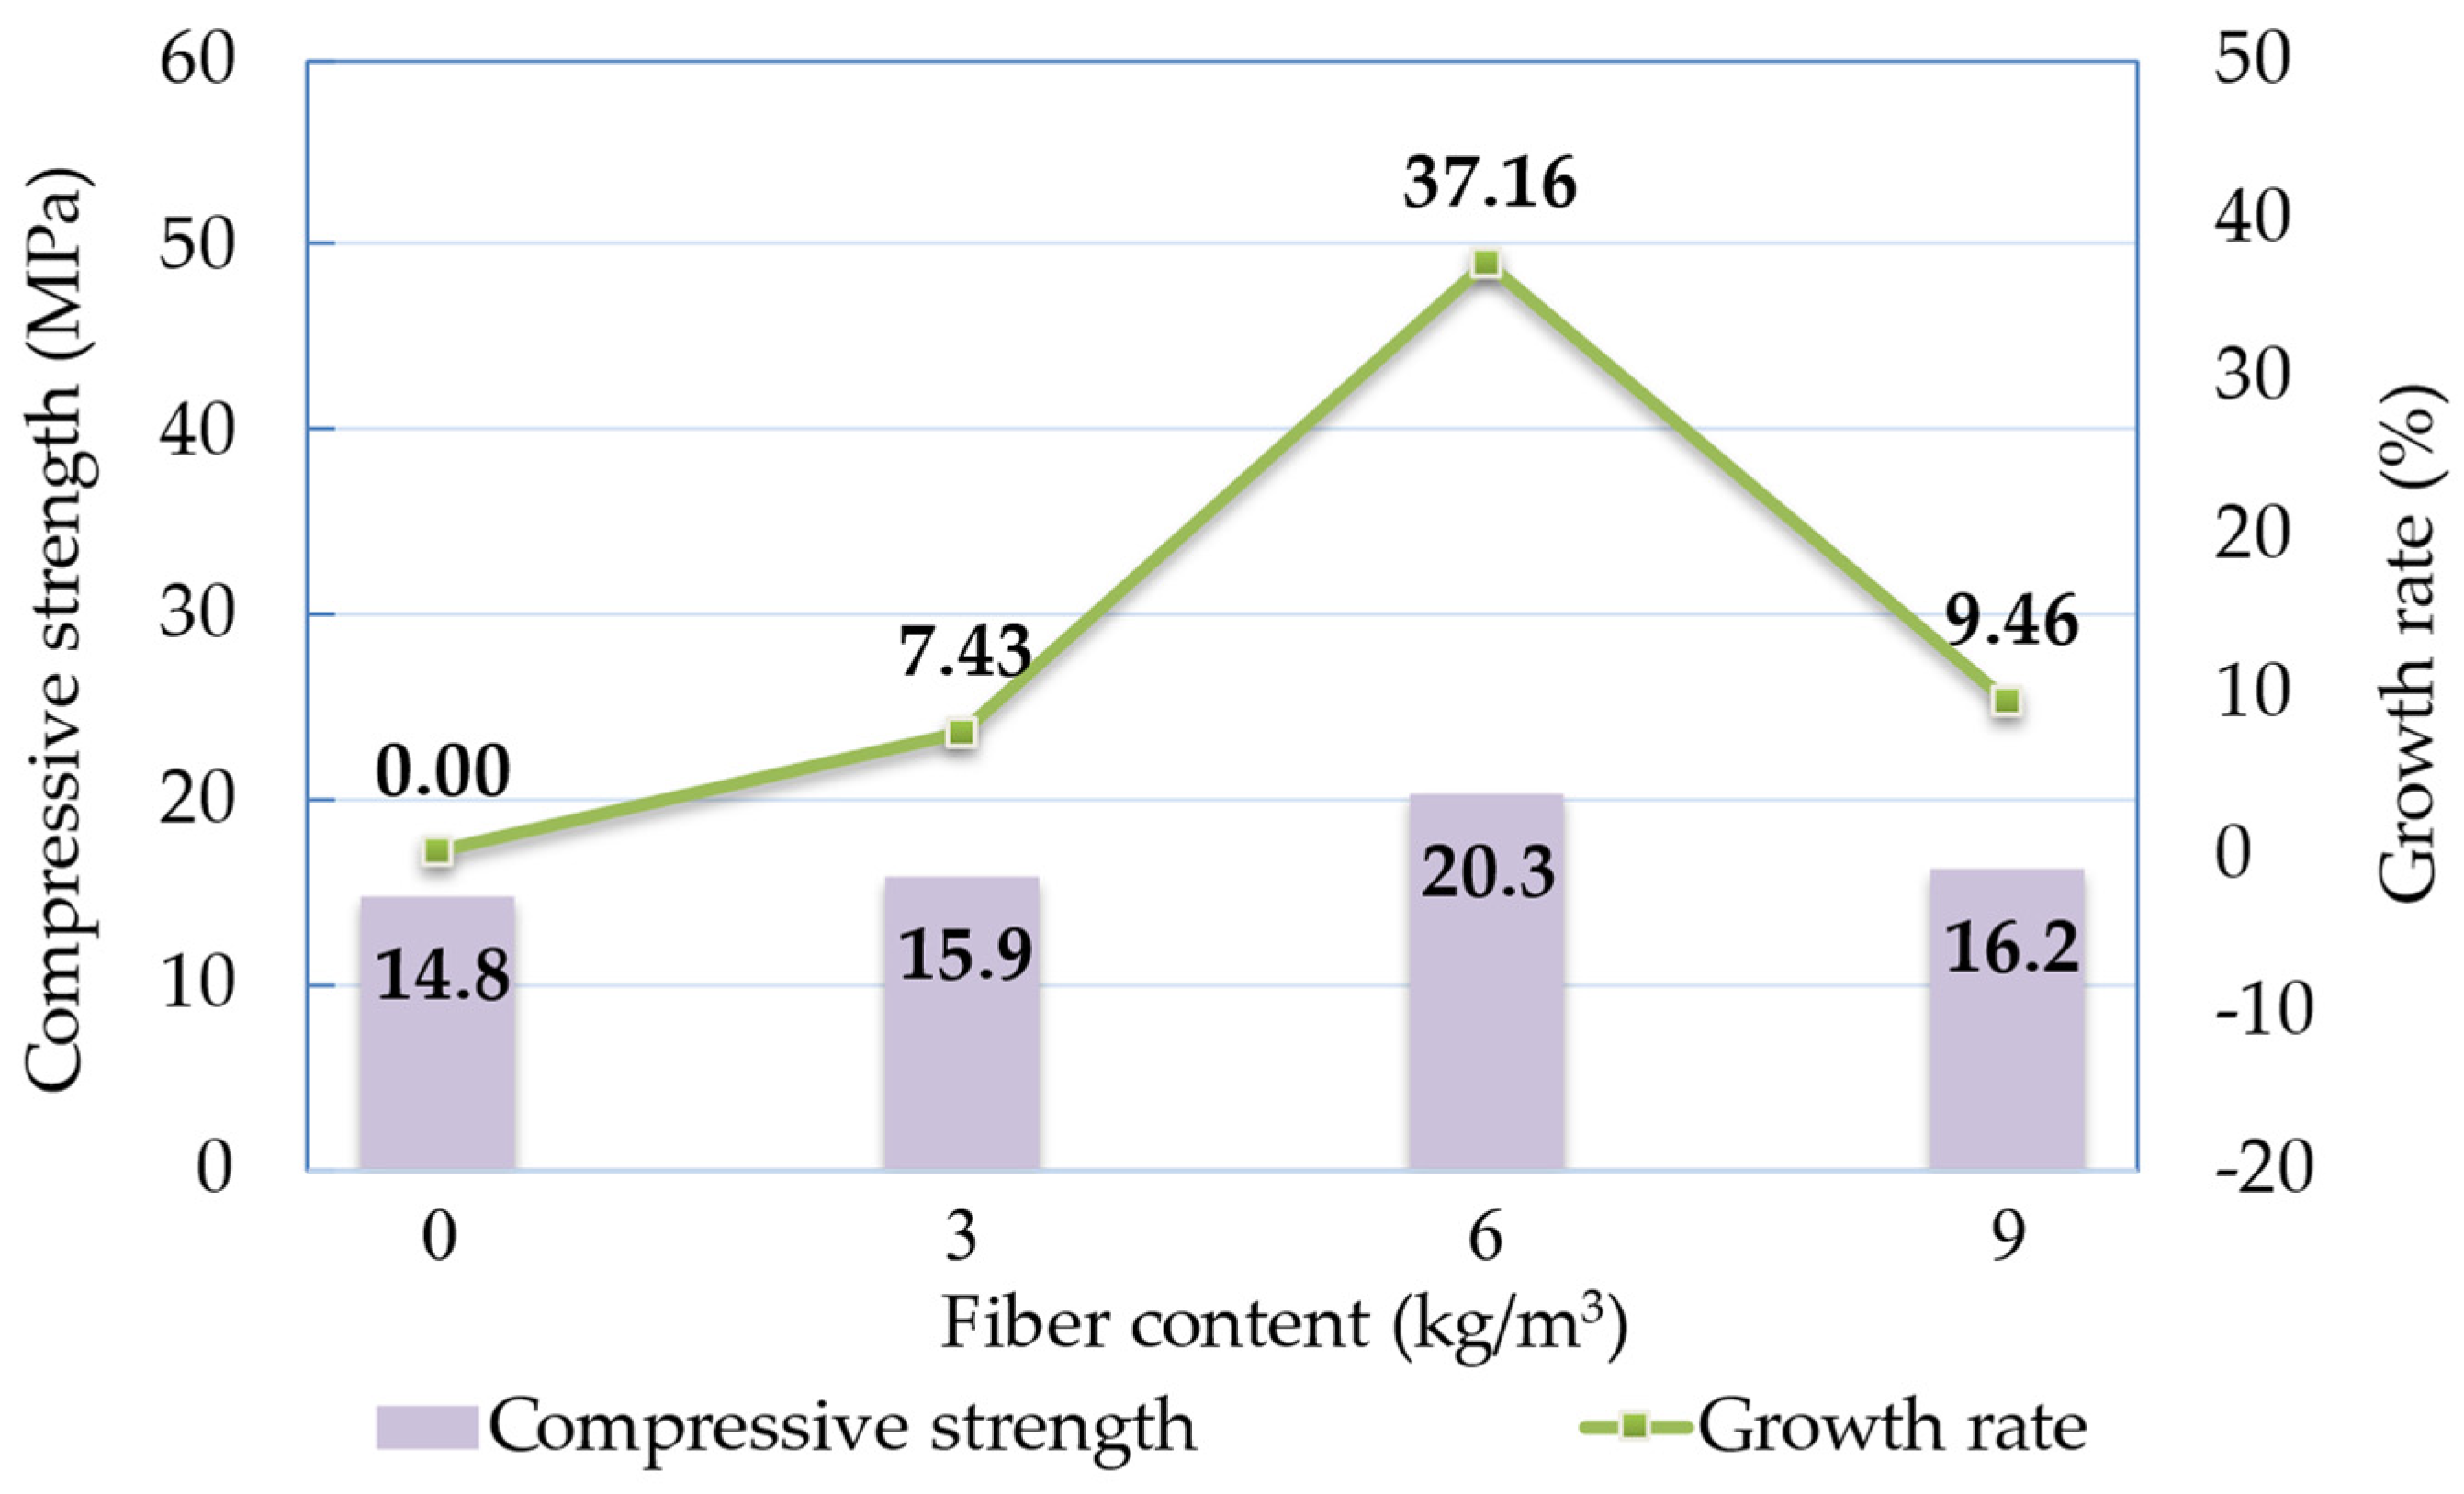
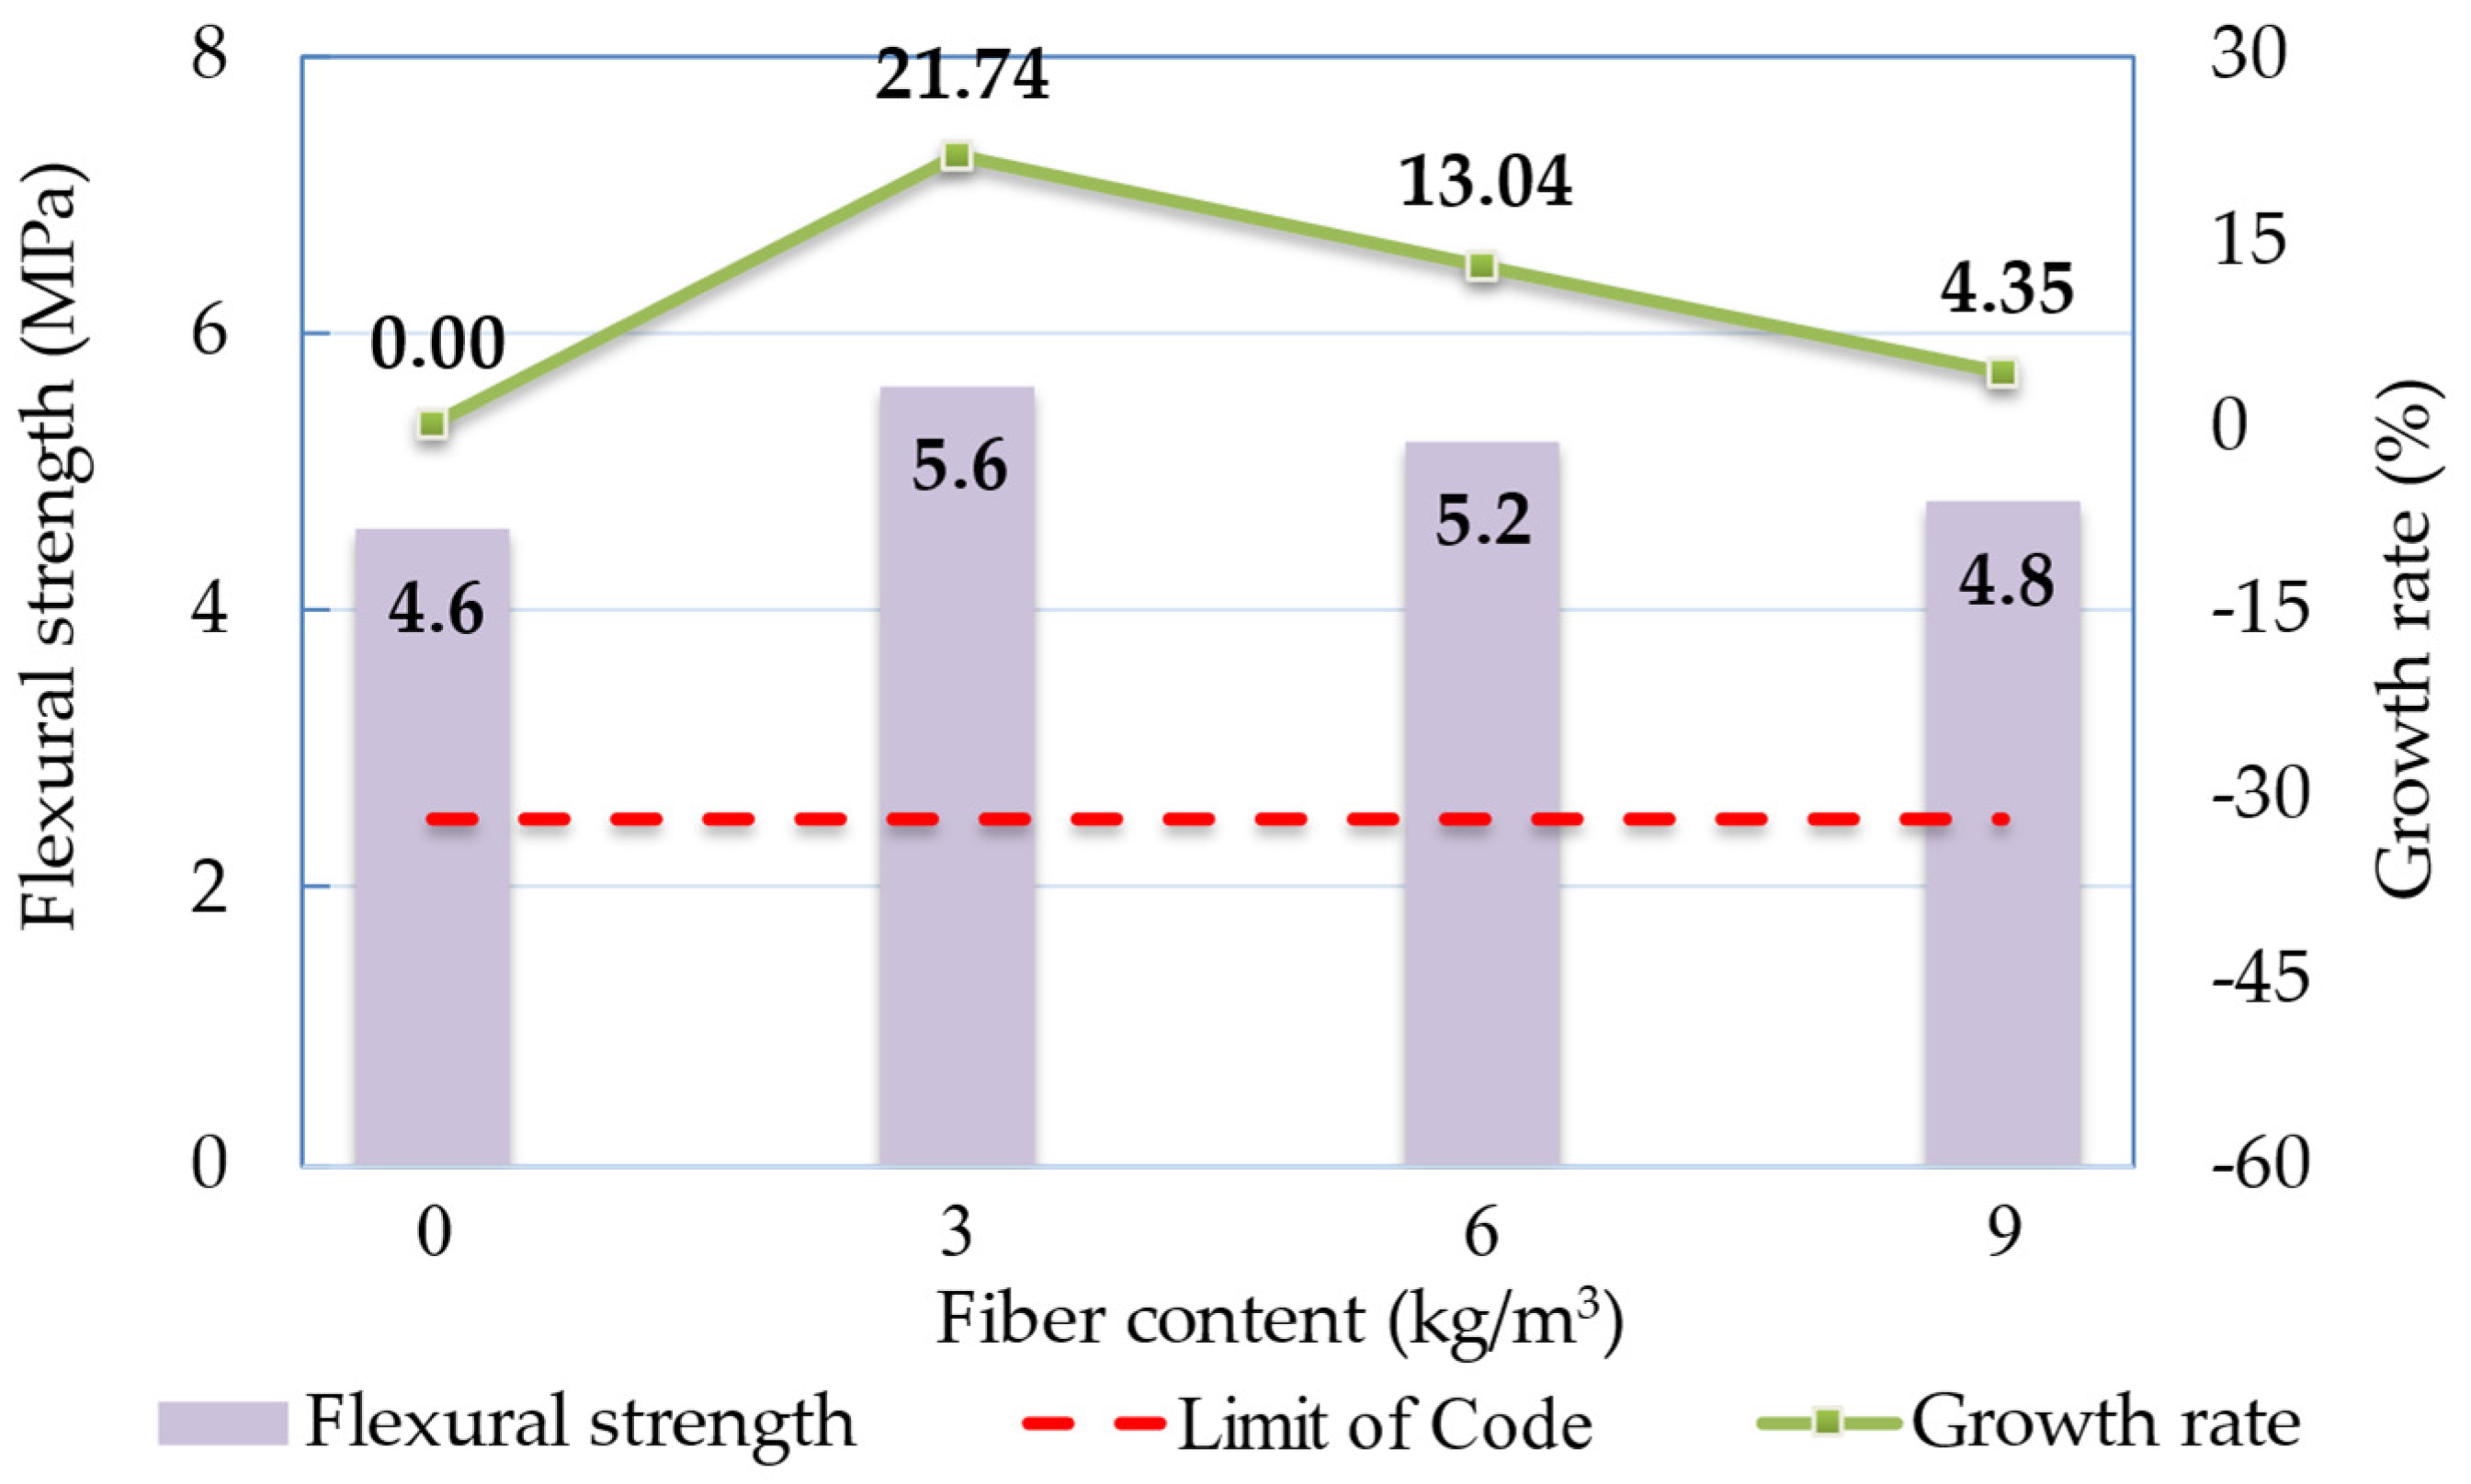
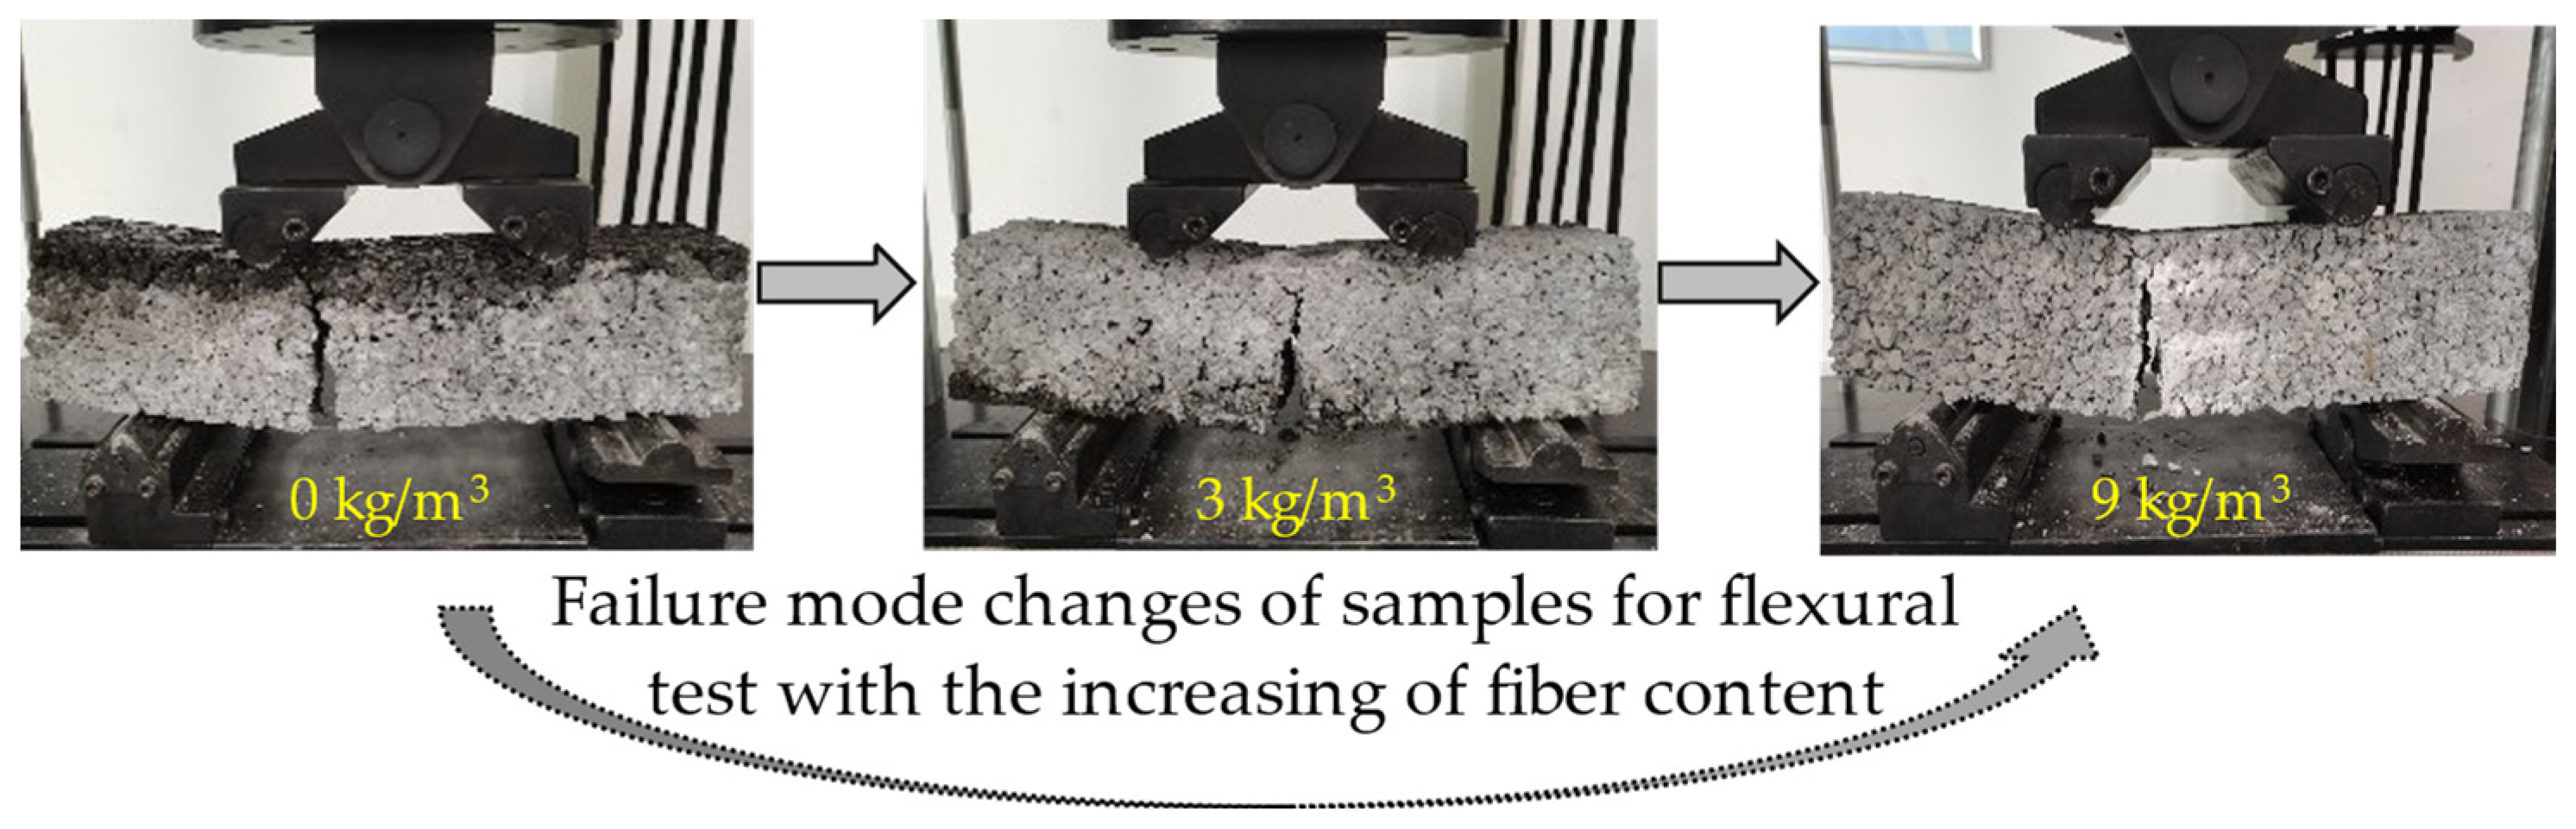
3.2.2. Flexural Tensile Strength

Figure 13 shows the changes in flexural tensile strength with the variation of the mixing amount of fiber. The strength value of the control sample is 4.6 MPa; the strength curve increases rapidly and decreases slowly with an increase in the mixing amount of fiber. The strengths of fiber-reinforced samples are 5.6 MPa, 5.2 MPa, and 4.8 MPa for the fiber contents of 3 kg/m3, 6 kg/m3, and 9 kg/m3, respectively. The flexural tensile strength of the specimen with a mixing amount of fiber of 3 kg/m3 increases by 21.74%, and then the growth rate of strength values decreases slowly from 13.04% to 4.35%. To promote the application in engineering, the minimum strength value is determined to be 2.5 MPa [35]. In Figure 13, this value is represented by the red dashed line, thus, it can be seen that all the samples could satisfy the regulation of the specification.
Figure 14 displays the flexural failure modes of prisms with different mixing amounts of fiber. The control sample is completely disconnected at the pure bending section, while the upper surface of the fiber-reinforced sample is not completely cracked when the ultimate bearing capacity is reached.

3.3. Durability

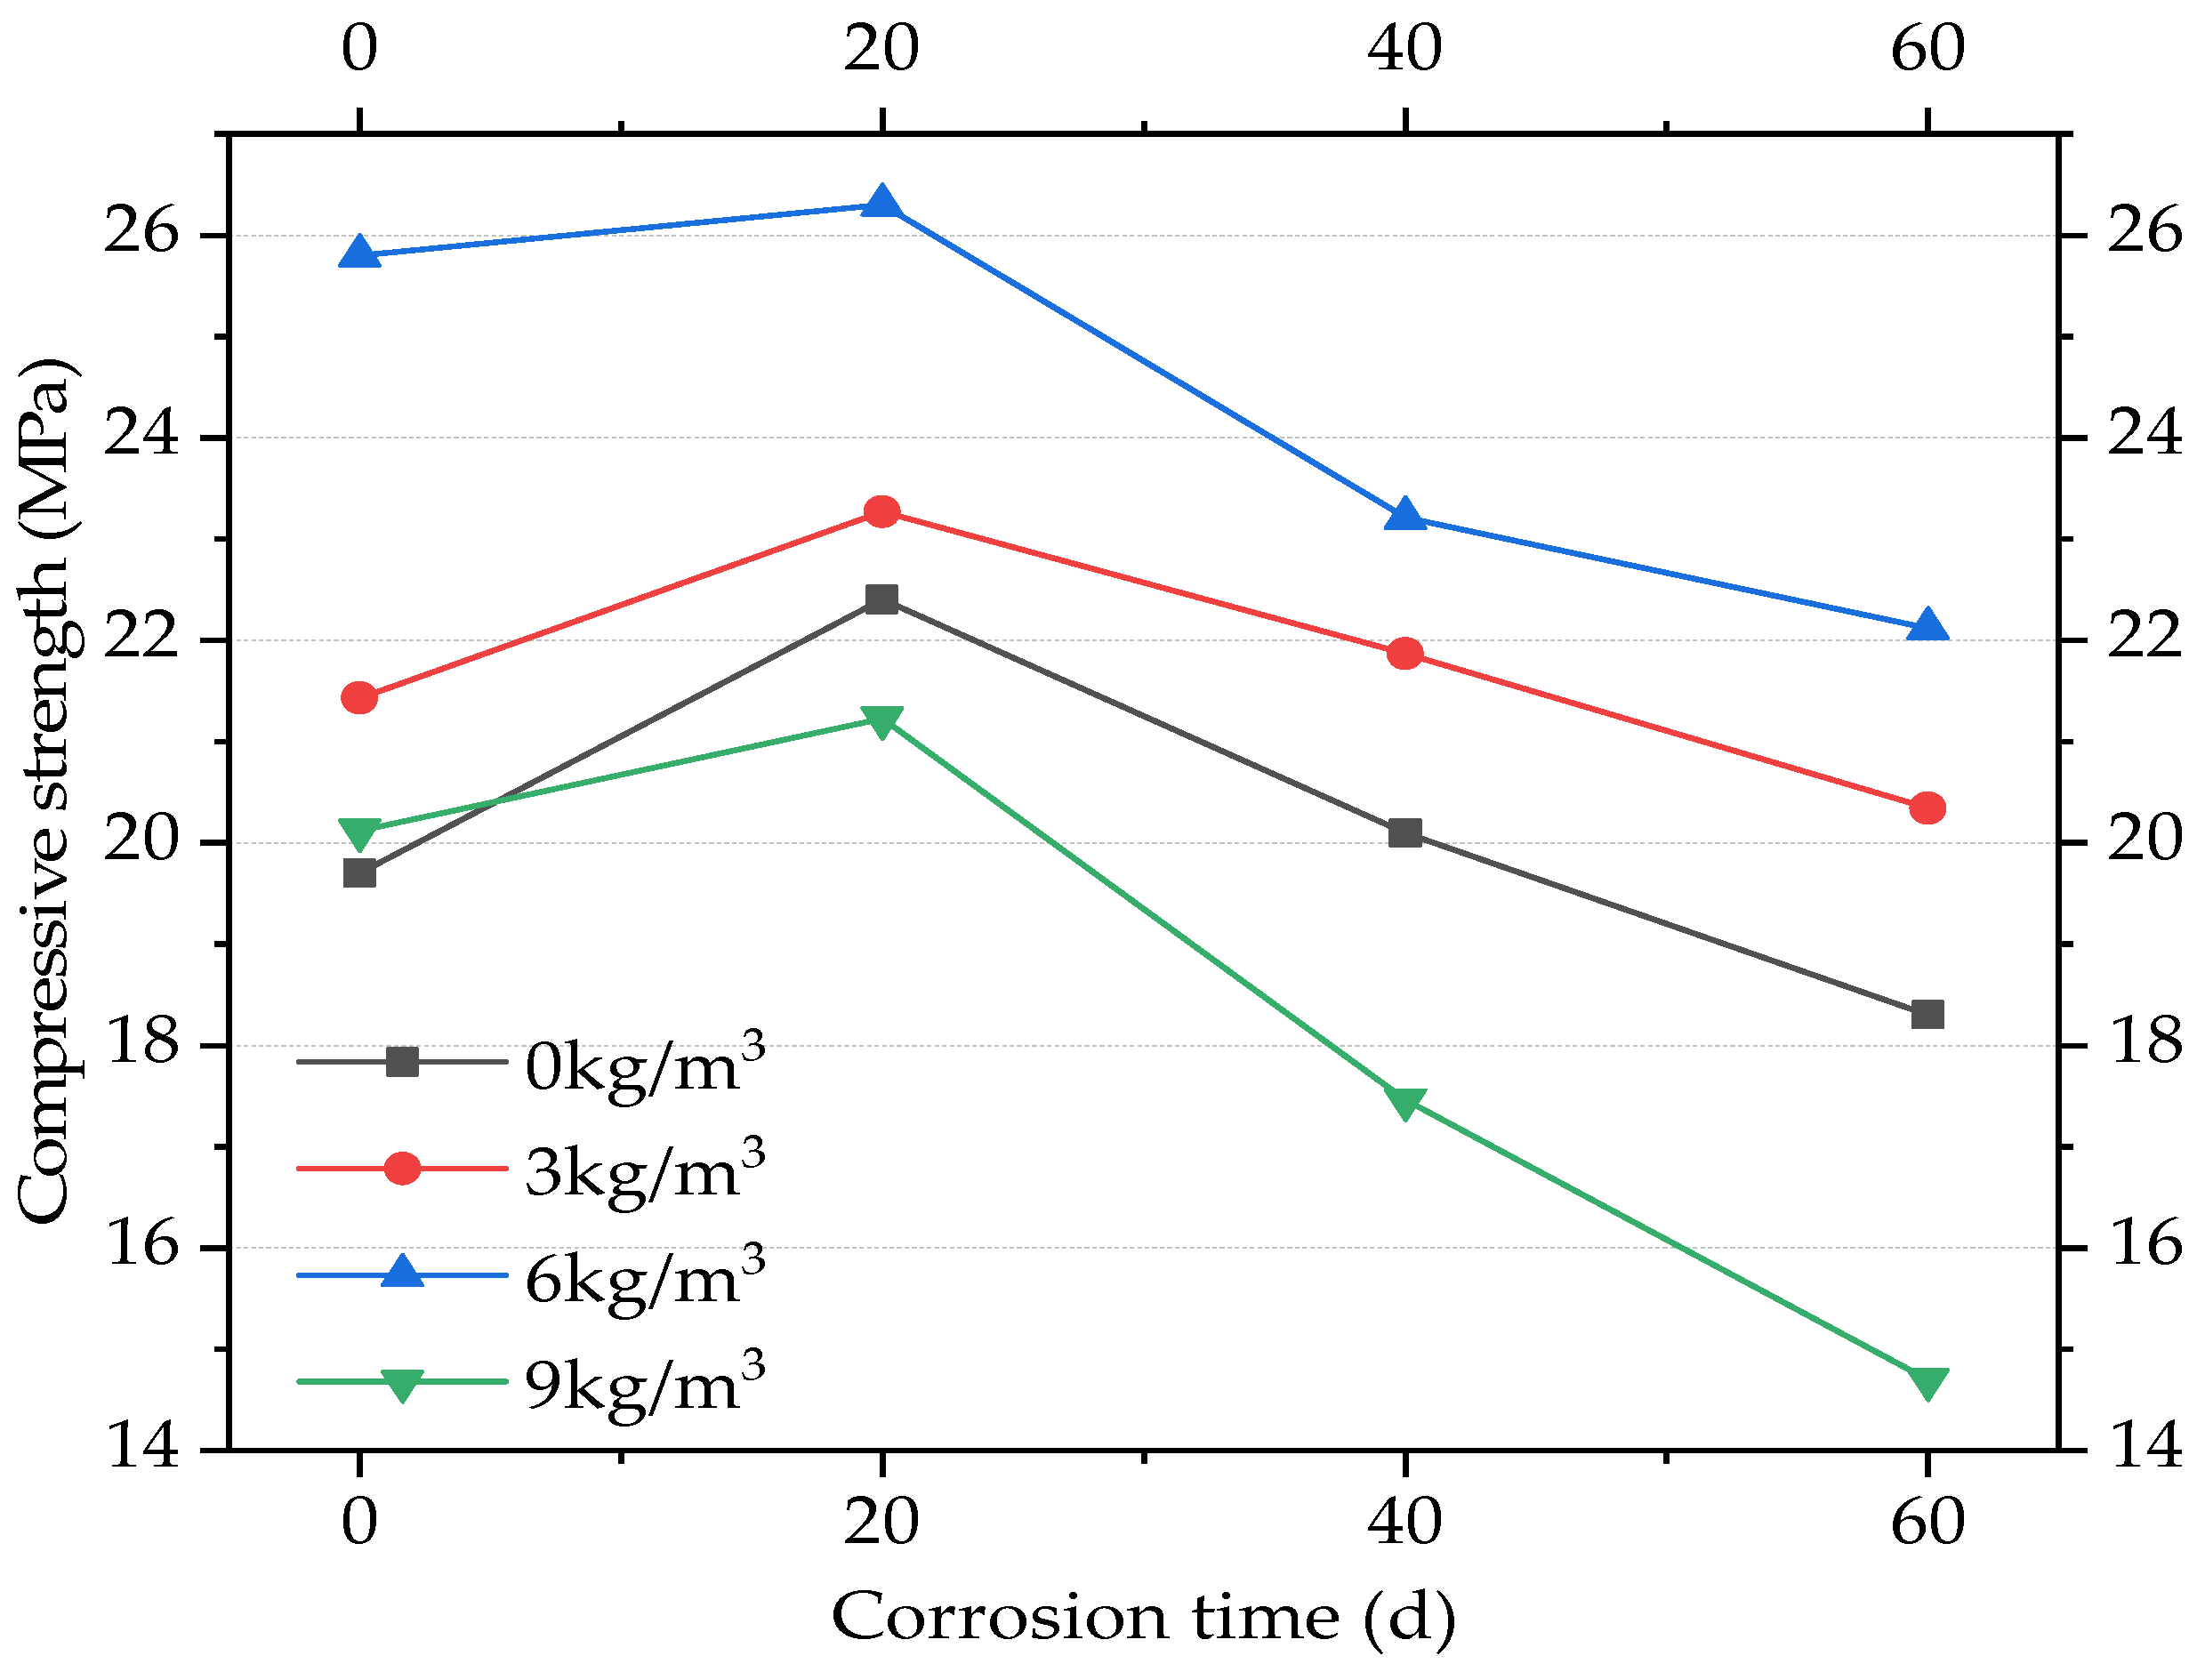
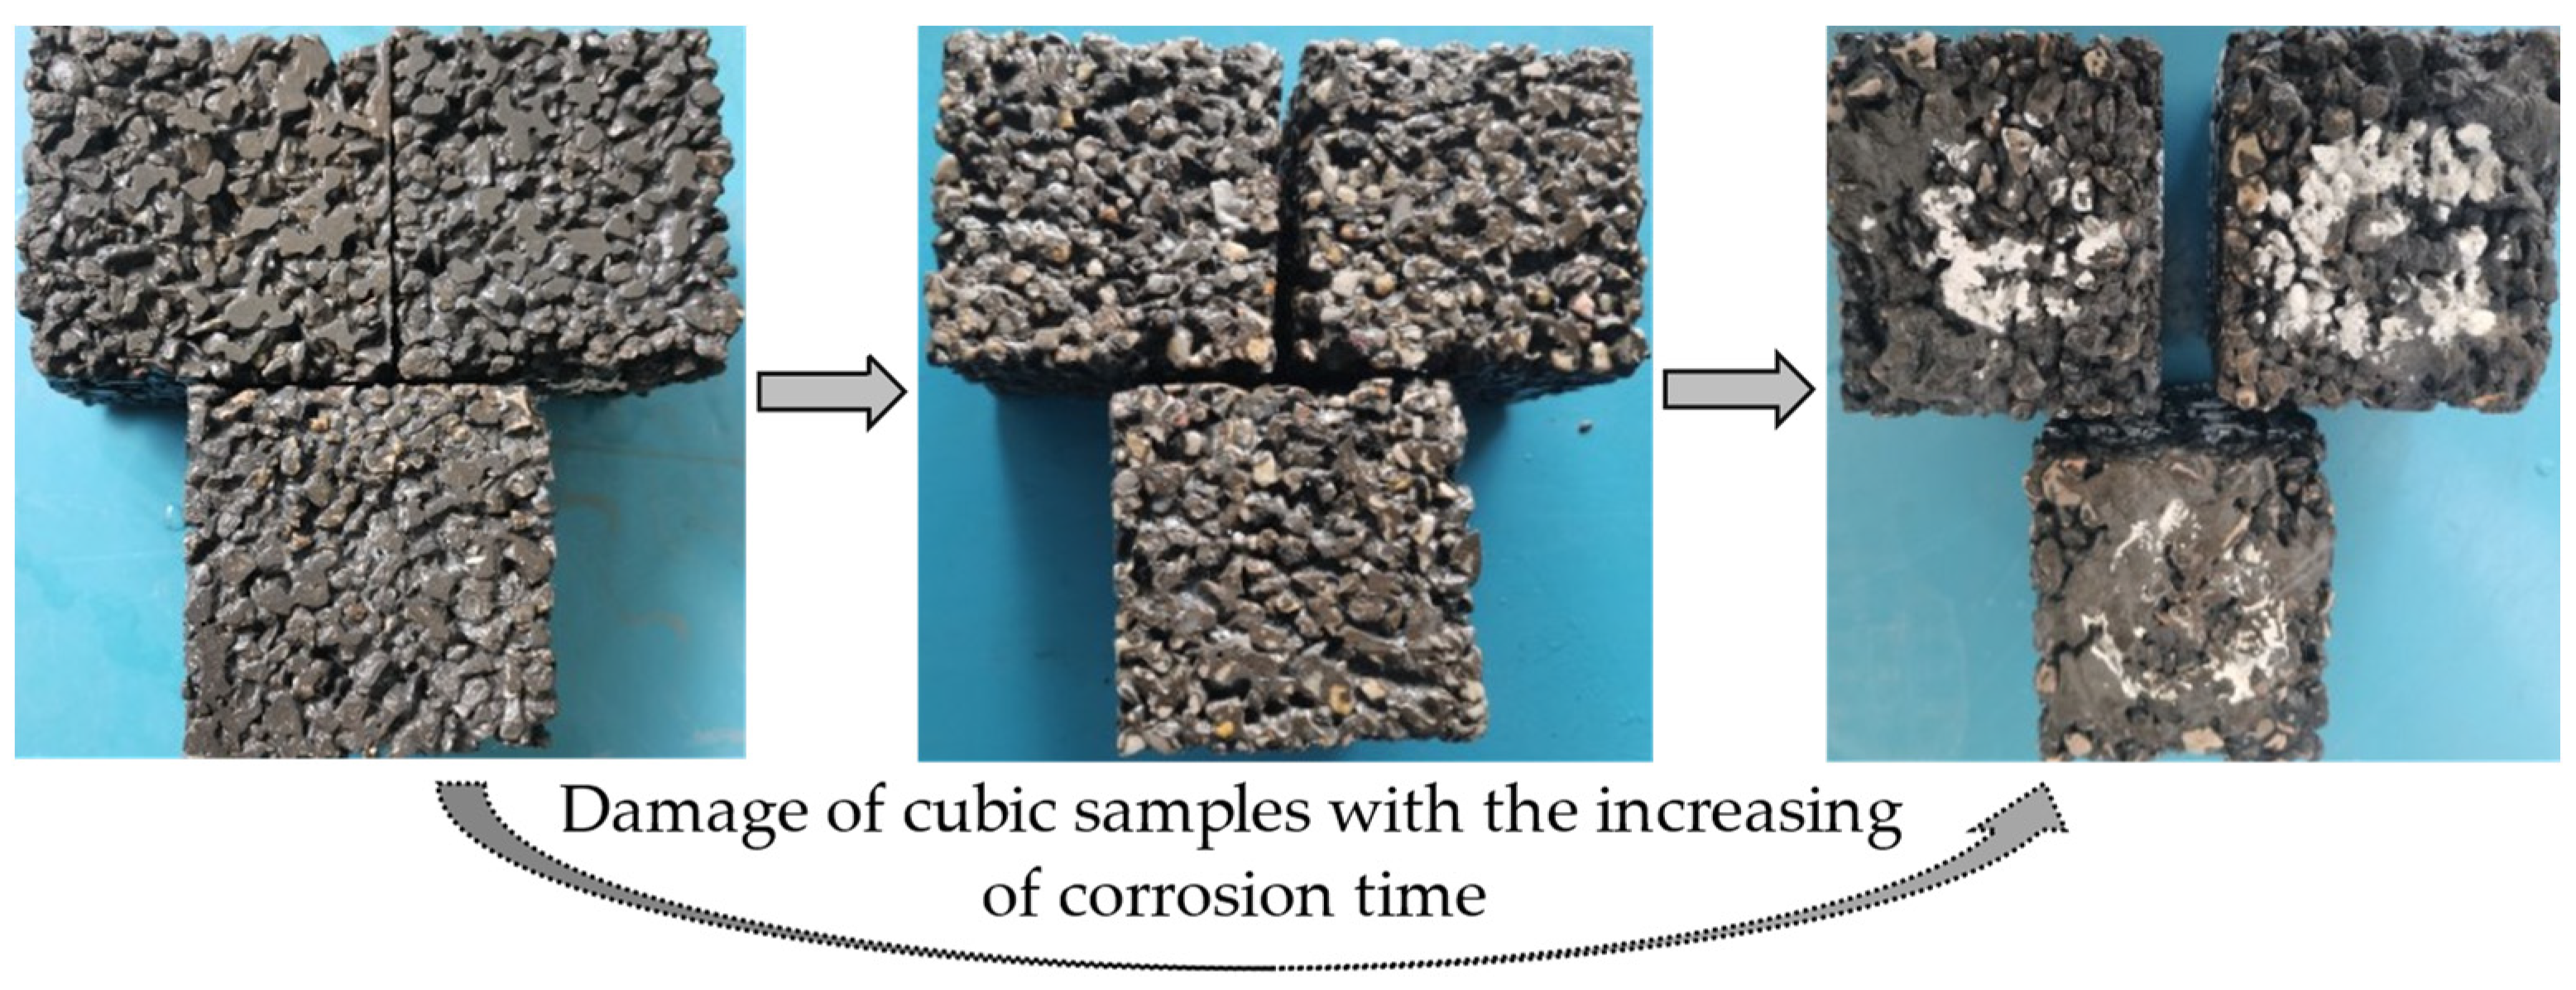
3.3.1. Influence of Acidic Corrosion on the Cubic Compressive Strength

Figure 15 shows the relationship between the compressive strength and fiber content/corrosion time. When the mixing amount of fiber is constant, the strength increases (0–20 d) and then decreases (20–60 d) with the increase in the corrosion time. In Figure 15, it should be noted that the strength of samples immersed in an acidic solution increases first if the immersion time is short, which may be due to the reason that the hardening speed of concrete is faster than that of the corrosion. Whereas long-term corrosion will reduce the compressive strength due to the continuous consumption of hydrochloric acid on concrete components, for the samples with the same corrosion time, the strength increases (0~6 kg/m3) and decreases (6~9 kg/m3) with the increase in the mixing amount of fiber. Considering the influence of corrosion time and fiber content, the optimum mixing amount of polypropylene fiber is 6 kg/m3.
Figure 16 shows the damage of samples (mixing amount of fiber is 3 kg/m3) with different corrosion times. The coarse aggregate of the specimen is not exposed obviously, as the corrosion lasts for 20 d, and there is little white colloid appearing on the surface of the specimen. With an increase in immersion time, the surface of the samples undergoes significant erosion, resulting in a clear exposure of coarse aggregates and exacerbating aggregate shedding.

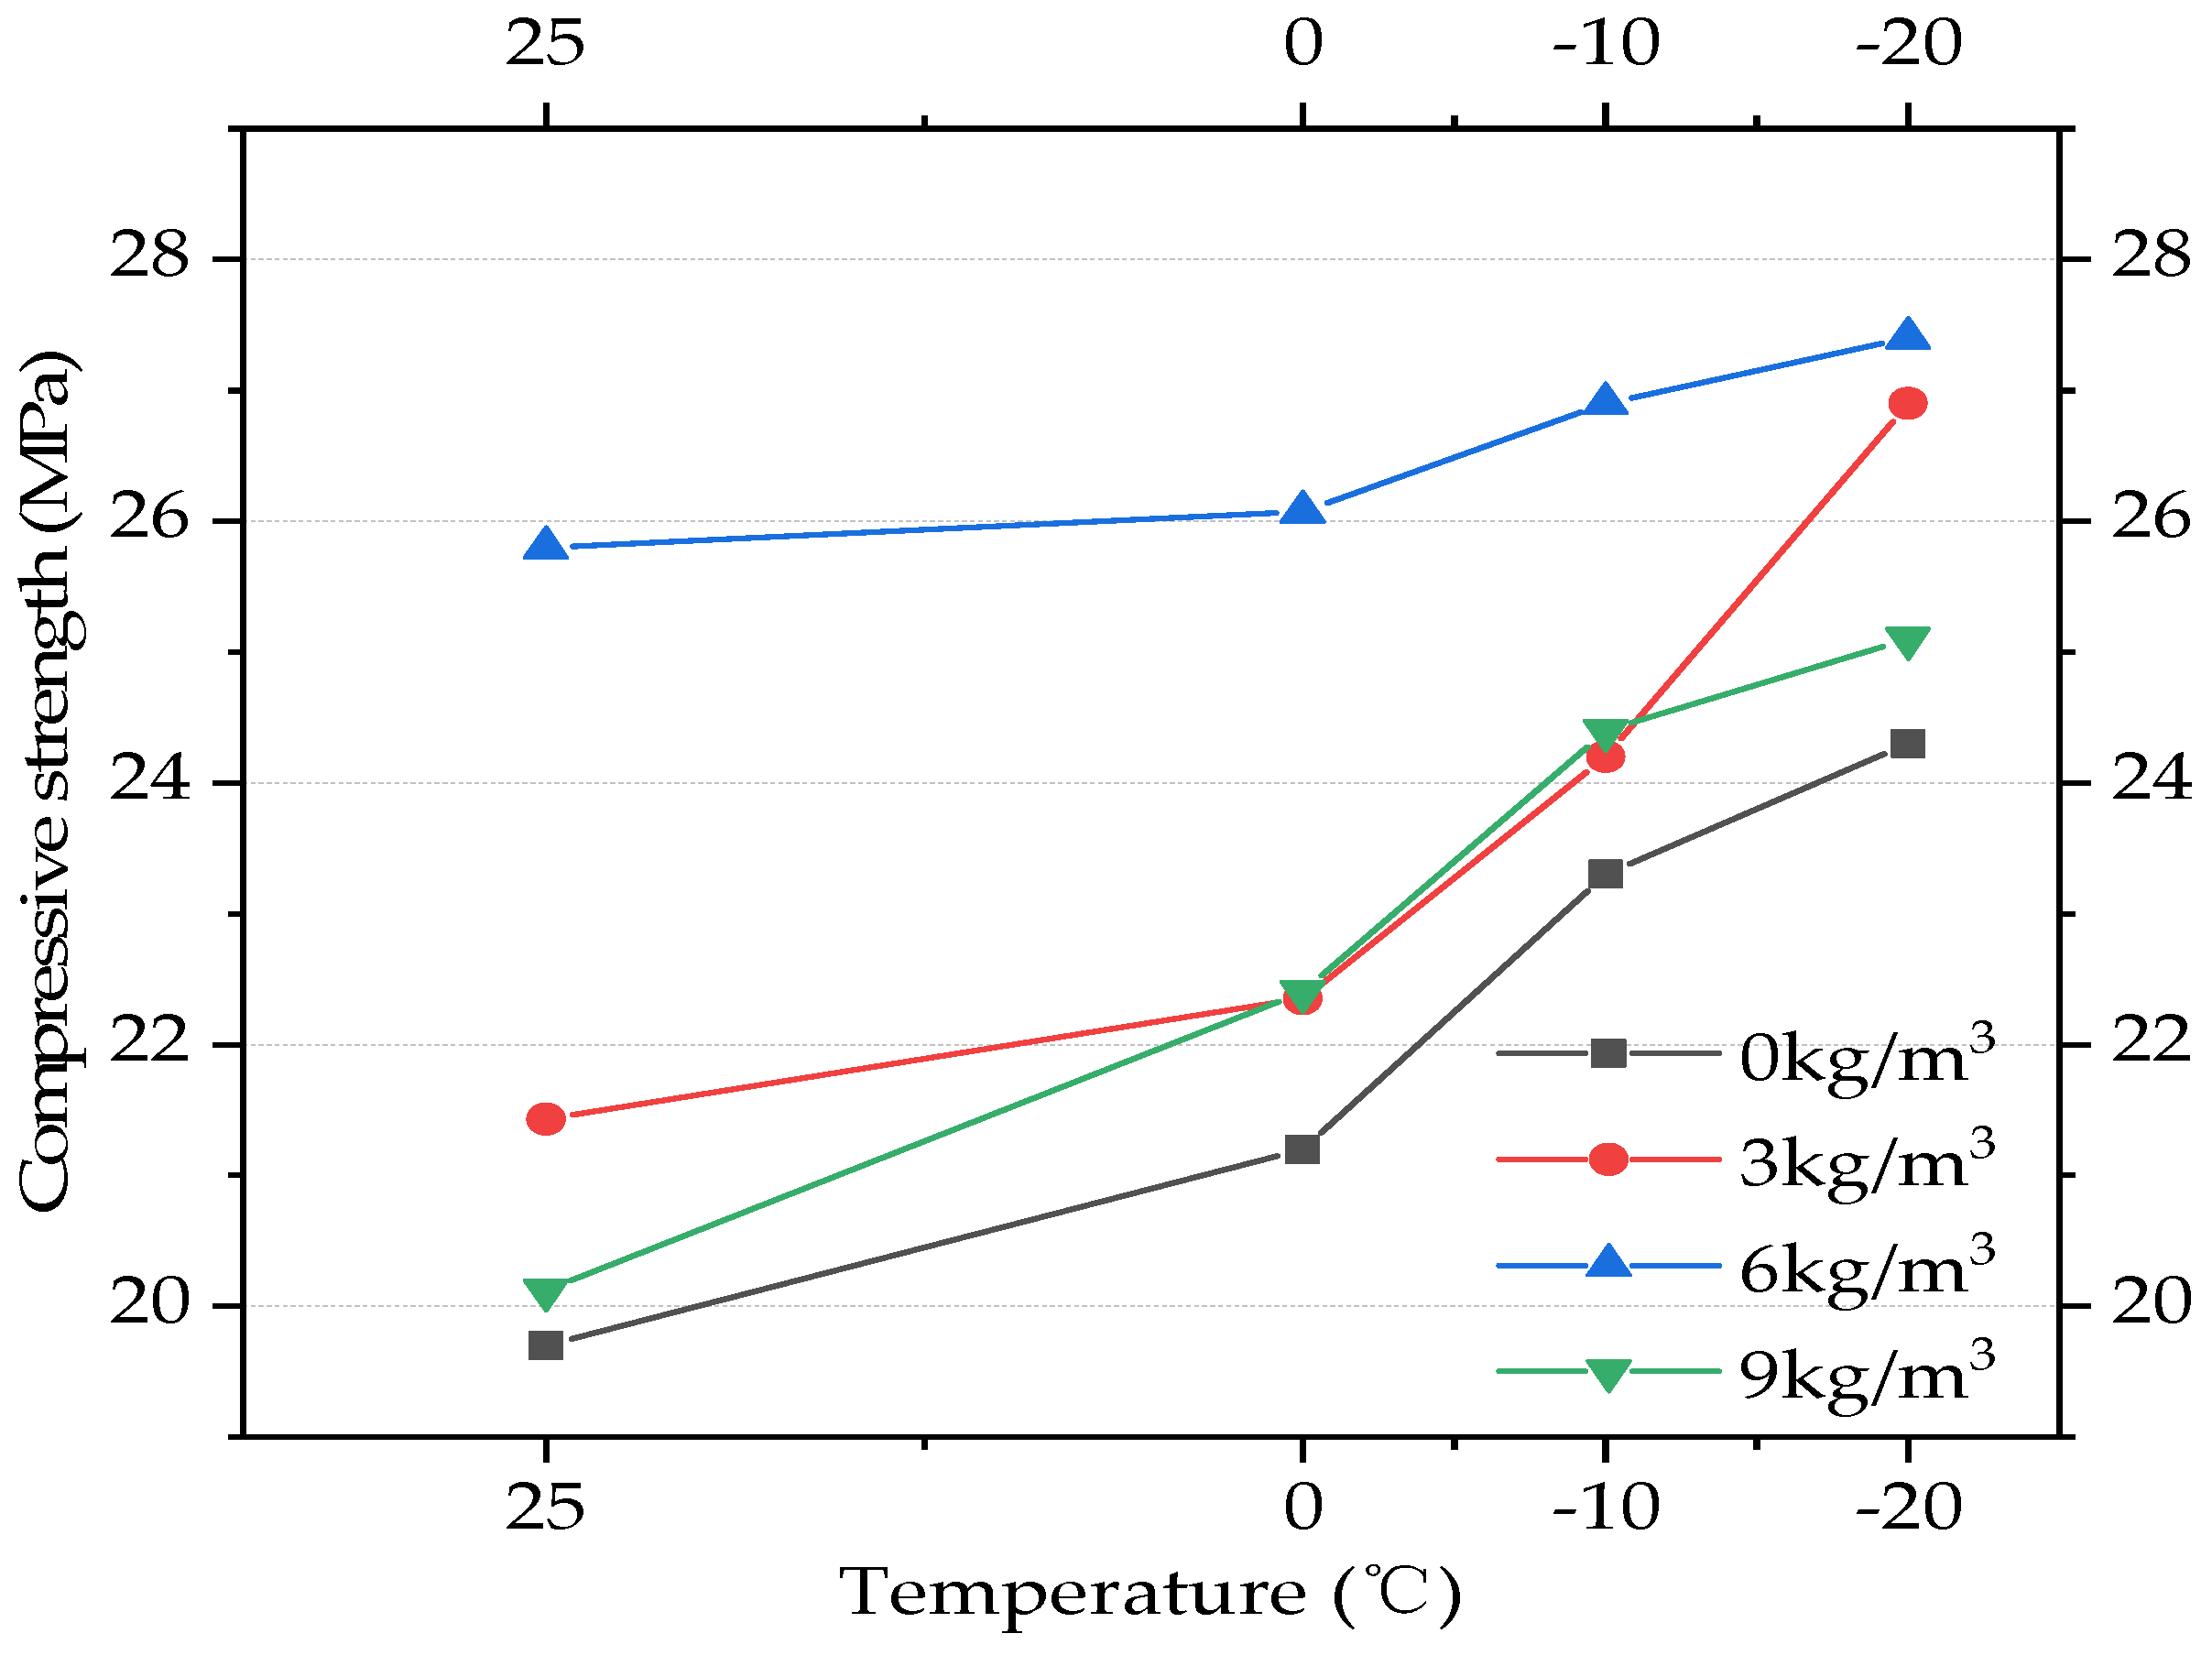
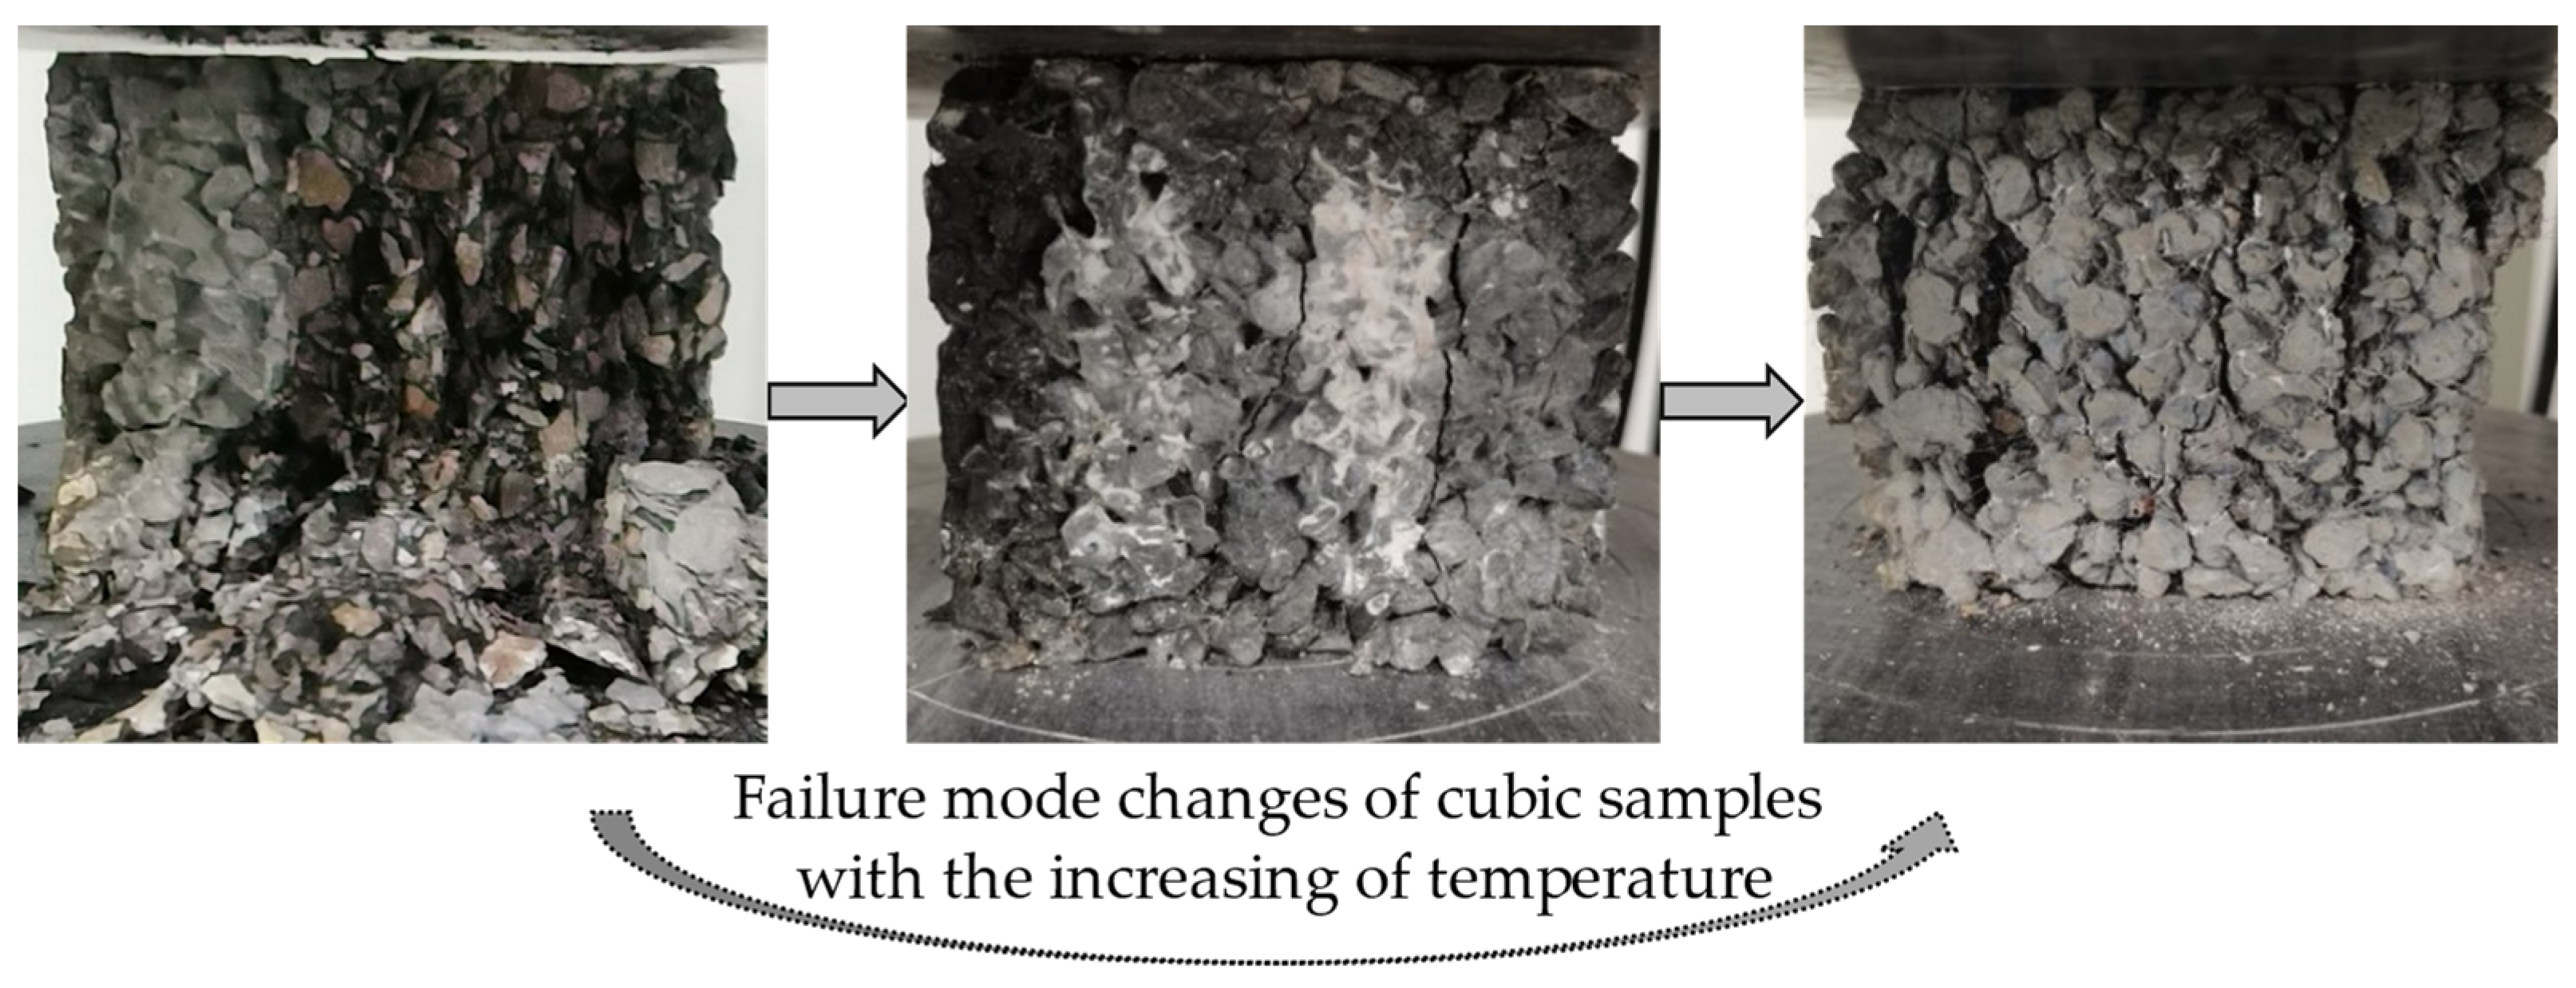
3.3.2. Influence of Low Temperature on the Cubic Compressive Strength

Figure 17 shows the relationship between the compressive strength and fiber content/temperature. Similar to the experimental results of ordinary concrete [41,42], the testing results of strength increase with the decrease in temperature. The enhancement of the concrete strength at low temperatures is attributed to two factors: firstly, the freezing of water fills the voids in concrete, thereby increasing the bearing area of samples; secondly, the strength of ice at low temperatures also increases. Meanwhile, for the samples with the same temperature, the strength increases (0~6 kg/m3) and decreases (6~9 kg/m3) with the increase in the mixing amount of fiber. Considering the influence of low temperature and fiber content, the optimum mixing amount of polypropylene fiber is 6 kg/m3.
Figure 18 shows the damage of samples (the mixing amount of fiber is 3 kg/m3) at different temperatures. Under the action of low temperatures, the brittleness of various raw materials is enhanced, and the aggregate will fall off when the specimen is destroyed. With the increase in temperature, the main crack will appear when the ultimate bearing capacity is reached, and there is basically no aggregate falling off.

3.4. The Mesostructure of Pervious Mix

The mesostructure of cubic samples with or without polypropylene fibers is obtained through the scanning of ICT technology, as shown in Figure 19 and Figure 20, which represent the 3D images and 2D tomographic images of the cross-section processed by Avizo software 2019.1, respectively.
In Figure 19, the blue parts represent the aggregate and cement paste. Without the constraint effect of fibers, cement paste is easier to bond to the aggregate (Figure 19a). With an increase in the mixing amount of fiber (3~6 kg/m3), although the dispersion of aggregate and cement paste is almost uniform, the fibers affected the thickness of the cement paste due to their bridge-bonding effect (Figure 19b,c). When the fiber content was 9 kg/m3, a large amount of cement paste bonded to the fibers, thus reducing the sizes of the voids (Figure 19d).
The same trend of changes could also be obtained in Figure 20, in which the white and grey parts represent the aggregate and cement paste, respectively. Due to the bonding of cement paste to the fibers, the voids are blocked by cement paste, which will reduce the number and volume of the voids (Figure 20a–d).

3.5. Analysis on the Relation of Mechanical Properties and Physical Performance

It is widely accepted that pervious concrete consists of three important components: coarse aggregate, cement paste, and interfacial transition zone (ITZ). ITZ is a thin area around the aggregate particles with a typical thickness of 20~40 μm [3]. Based on the location where yielding occurs, the failure modes usually include the following types: aggregate failure, cement-paste failure, and failure along the ITZ. The changes in the failure mode are given in Figure 21 (cubic samples for the compressive strength test), in which the shape and characteristics of the cracks are marked. For the control specimens, all the failure types could be seen. With the increase in the mixing amount of polypropylene fiber (3~6 kg/m3), the aggregate and cement paste failure are the main reason why specimens are destroyed. When the mixing amount of fiber reached 9 kg/m3, no aggregate or cement-paste failure could be observed, and the cracks only developed along the ITZ. Considering the distribution of components, which can be seen in Figure 19 and Figure 20, it could be seen that fibers have a significant influence on the compressive strength: the incorporation of fibers will increase the volume of cement paste; it will also reduce the cement-paste content attached to the aggregate and weaken the bonding strength between the cement paste and aggregates. Thus, the failure modes of the samples changed from the failure of three components (control samples) to cement-paste failure and failure along the ITZ (3~6 kg/m3). Meanwhile, the failure modes of samples with a mixing amount of fiber of 9 kg/m3 are mainly failure along the ITZ. The same phenomenon is also observed in other tests of strength, thus indicating a trend of initial increase followed by subsequent decrease in the strength exhibited by samples.
The mechanical properties of pervious concrete are inversely related to its porosity and permeability coefficient. When considering the bridge-bonding effect of fibers, an increase in the volume of cement paste leads to a decrease in the number of voids, resulting in a reduction in both porosity and permeability coefficient values. Porosity has a positive correlation with the permeability coefficient, which is consistent with the distribution of the three components within pervious concrete.
Based on the above analysis, the research findings of this study and other works from the literature are compared. It can be seen that the decrease in porosity is consistent with that of Ozturk et al. [34]; the change trend of compressive strength is the same as that of Al-Hadithi et al. [29], Ozel et al. [33], and Ozturk et al. [34]; and the variation of the flexural tensile strength is in agreement with that of Al-Hadithi et al. [29]. However, compared with the results of this study, the research findings of Oni et al. [3] exhibit different characteristics in terms of the compressive strength, permeability coefficient, and porosity, which may be due to the fact that the length of the fiber used is too short to give full play to the bridging effect of the fiber. In summary, these comparisons indicate that the research results of this study are reliable.
The optimal dosage of polypropylene fiber content should be determined to promote the application of pervious concrete in practical engineering. Compared to the control samples, the cubic compressive strength, axial compressive strength, and flexural tensile strength of the samples with a fiber content of 6 kg/m3 increased by 35.32%, 37.16%, and 13.45%, respectively, while the porosity and permeability coefficient decreased by 36.32% and 49.30%, respectively. Considering the effect of acid corrosion, the cubic compressive strength of the specimens with a mixing amount of fiber of 6 kg/m3 is 30.96%, 17.41%, 15.47%, and 20.87% higher tha21n those of control samples when the corrosion time is 0 d, 20 d, 40 d, and 60 d, respectively. When the mixing amount of fiber is 6 kg/m3, the strength values of specimens at temperatures of −20 °C, −10 °C, 0 °C, and 25 °C increase by 14.17%, 15.45%, 22.97%, and 30.96% compared to the control samples, respectively.
For pervious concrete, the primary concern is to meet the compressive-strength requirements that ensure its suitability for use in engineering applications. In addition to satisfying these strength criteria, other parameters must also conform to the relevant specifications and regulations. Through the analysis of the results of the physical and mechanical performance of pervious concrete, it can be observed that the optimum mixing amount of polypropylene fiber is 6 kg/m3.

4. Conclusions

Aiming to investigate the characteristics of the polypropylene-fiber-reinforced pervious mix, the testing of the mechanical properties, physical performance, and durability was carried out in this study. The parameters of strength, porosity, permeability, acid corrosion behavior, and low-temperature performance were obtained to ensure the optimum fiber proportion. The conclusions are given as follows:
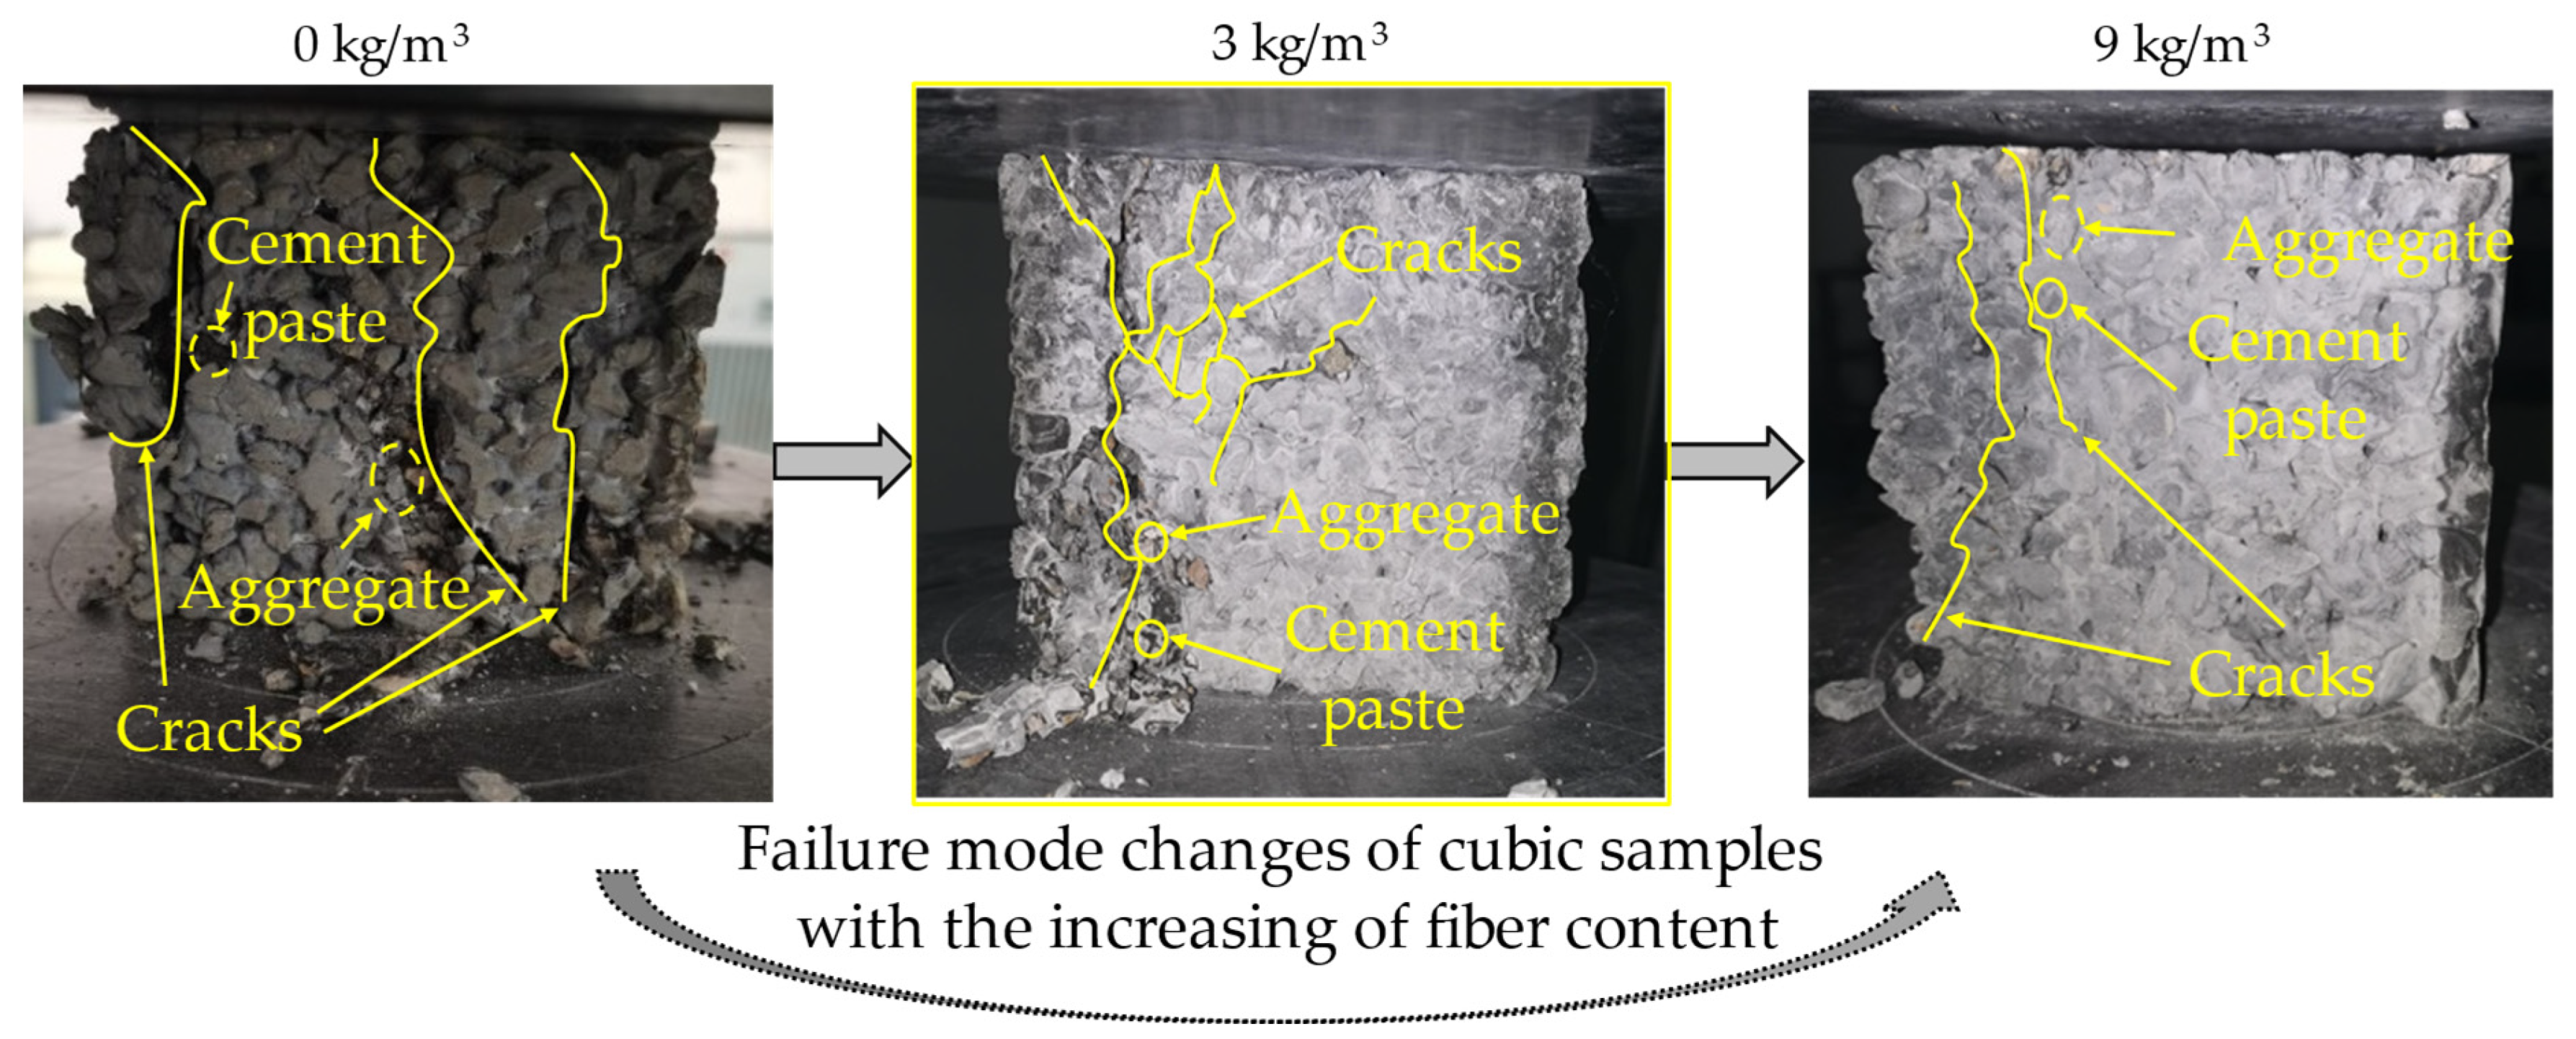
  • The addition of polypropylene fiber improved the strength performance of the mixtures. Compared to the specimens without polypropylene fiber, the three strength values of samples with a mixing amount of polypropylene of 6 kg/m3 increased by 35.32%, 37.16%, and 13.04%, respectively, indicating that the improvement of strength by fiber is within a certain range.
  • The porosity and permeability coefficient decreased with the increase in the mixing amount of polypropylene fiber. These two physical values with a mixing amount of polypropylene of 6 kg/m3 decreased by 36.32 % and 49.30%, respectively. Hence, the physical performance had an inverse relation with the mechanical properties.
  • When the acidic corrosion times were 0 d, 20 d, 40 d, and 60 d, the cubic compressive strength with the mixing amount of polypropylene fiber of 6 kg/m3 increased by 30.96%, 17.41%, 15.47%, and 20.87% compared to the control samples, respectively. The change trend of the strength was not related to the addition of fiber.
  • For the mixing amount of fiber of 6 kg/m3, the cubic compressive strength specimens at temperatures of −20 °C, −10 °C, 0 °C, and 25 °C decreased by 14.17%, 15.45%, 22.97%, and 30.96% compared to the control specimens, respectively. The strength values decreased with the increase in temperature, and the added polypropylene fiber had no effect on the change in trend of strength.
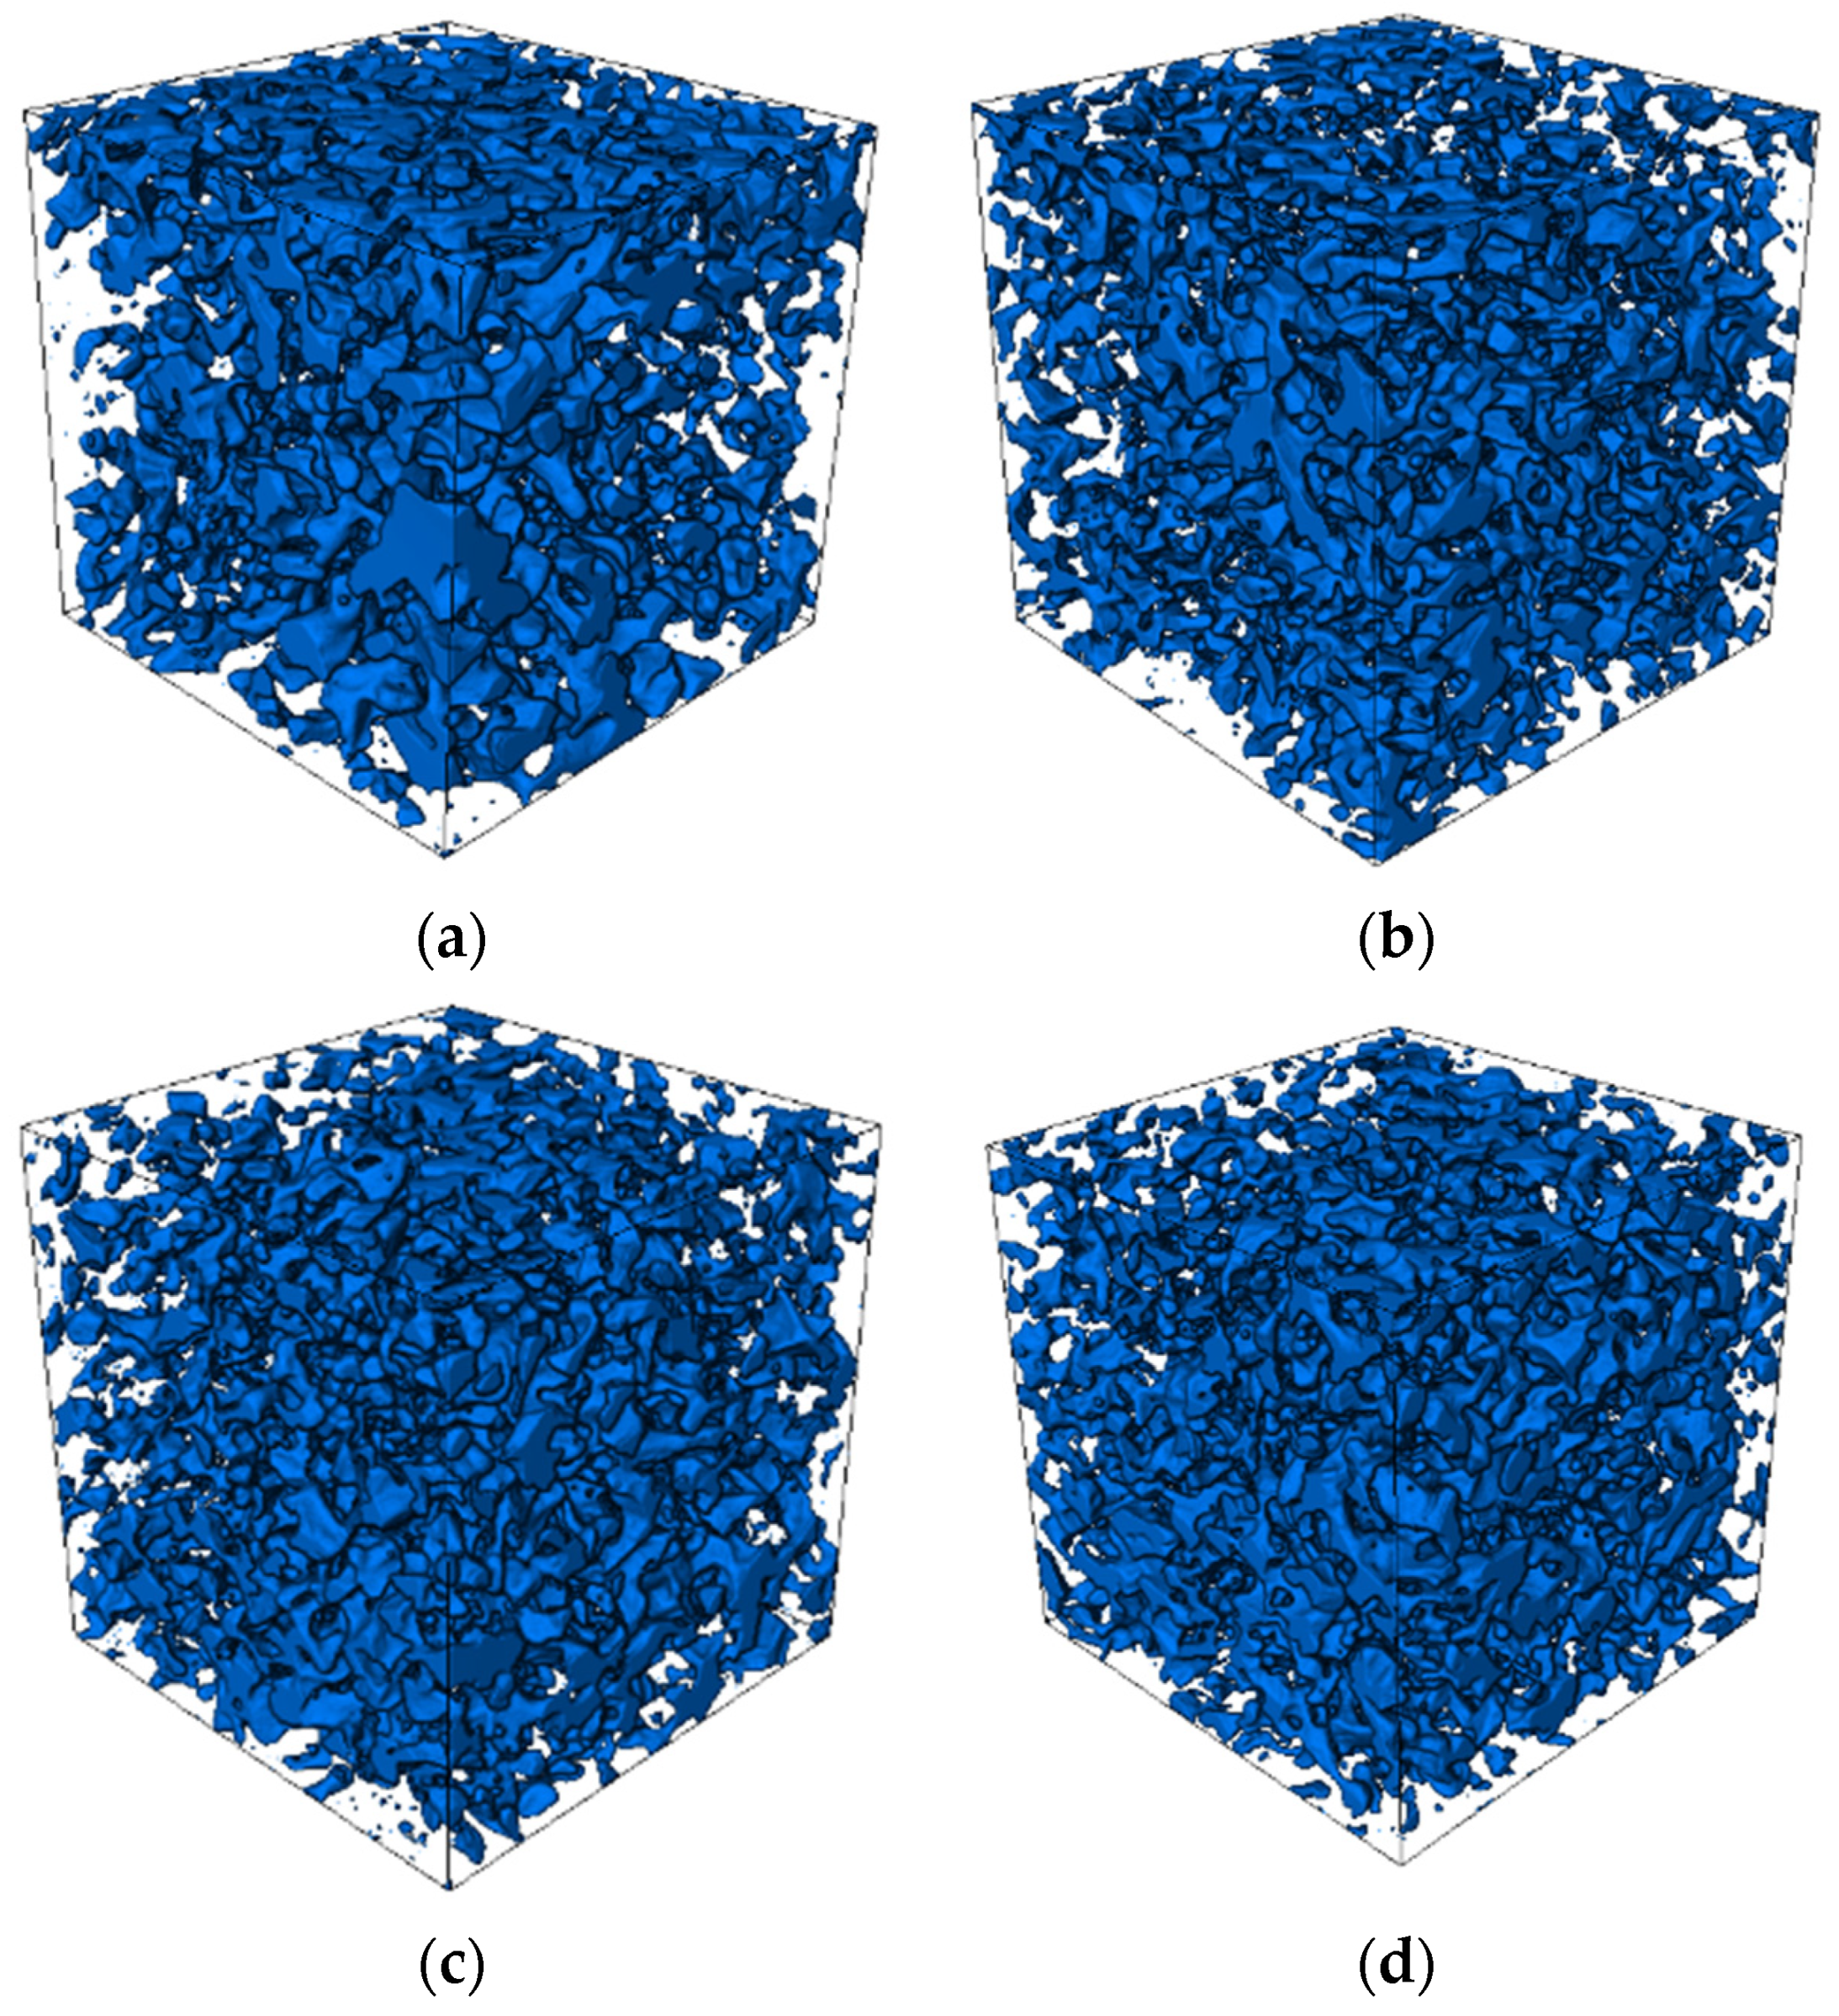
  • The mesostructure obtained through the scanning of ICT showed that the polypropylene fiber obviously affected the internal structure of the pervious concrete, thus reducing the porosity and, hence, affecting the characteristics of the pervious mix.
The research findings of this study regarding the strength properties and physical performance are consistent with those of the other literature works, thus helping to verify the results of this study. At present, durability tests are not very common; thus, the acid-corrosion behavior and low-temperature performance were investigated in this study, which is helpful to the development of pervious concrete in engineering. However, this study analyzed only the effect of fiber content, without considering parameters such as the fiber length, aggregate types, and supplementary cementitious materials. These parameters can serve as variables for further research and provide a more comprehensive analysis of the mechanism of polypropylene fiber.

Author Contributions

Conceptualization, J.W.; methodology, X.L.; software, C.H., L.H. and Y.W.; validation, C.H. and L.H.; formal analysis, Y.W.; investigation, J.W.; resources, J.Z.; data curation, C.H., L.H. and Y.W.; writing—original draft preparation, J.W. and X.L.; writing—review and editing, J.W.; visualization, J.Z.; supervision, J.W.; project administration, J.W. and J.Z.; funding acquisition, J.W. All authors have read and agreed to the published version of the manuscript.

Funding

This research was supported by the Natural Science Foundation of Shaanxi Province (2021JQ-876) and Scientific Research Foundation for High-level Talents (XJ17T08).

Institutional Review Board Statement

Not applicable.

Informed Consent Statement

Not applicable.

Data Availability Statement

Data sharing is not applicable to this article.

Acknowledgments

The authors would like to thank Shaanxi Key Laboratory of Safety and Durability of Concrete Structures for the project testing.

Conflicts of Interest

The authors declare no conflict of interest.

References

  1. Kiranmaye, B.R.; Tarangini, D.; Reddy, K.R. Effect of glass fiber on properties of pervious concrete. Int. J. Civ. Eng. Technol. 2018, 9, 1344–1355. [Google Scholar]
  2. Deo, O.; Neithalath, N. Compressive behavior of pervious concretes and a quantification of the influence of random pore structure features. Mater. Sci. Eng. A 2010, 528, 402–412. [Google Scholar] [CrossRef]
  3. Oni, B.C.; Xia, J.; Liu, M. Mechanical properties of pressure moulded fibre reinforced pervious concrete pavement brick. Case Stud. Constr. Mater. 2020, 13, e00431. [Google Scholar] [CrossRef]
  4. Zhong, R.; Xu, M.; Netto, R.V.; Wille, K. Influence of pore tortuosity on hydraulic conductivity of Pervious Concrete: Characterization and modeling. Constr. Build. Mater. 2016, 125, 1158–1168. [Google Scholar] [CrossRef]
  5. Hari, R.; Mini, K. Mechanical and durability properties of basalt-steel wool hybrid fibre reinforced pervious concrete—A Box Behnken approach. J. Build. Eng. 2023, 70, 106307. [Google Scholar] [CrossRef]
  6. Tang, B.; Fan, M.; Yang, Z.; Sun, Y.; Yuan, L. A comparison study of aggregate carbonation and concrete carbonation for the enhancement of recycled aggregate pervious concrete. Constr. Build. Mater. 2023, 371, 130797. [Google Scholar] [CrossRef]
  7. Chockalingam, T.; Vijayaprabha, C.; Raj, J.L. Experimental study on size of aggregates, size and shape of specimens on strength characteristics of pervious concrete. Constr. Build. Mater. 2023, 385, 131320. [Google Scholar] [CrossRef]
  8. Yogesh, R.V.; Santha, G.K.; Ganesh, K.S. Synergistic effect of aggregate gradation band and cement to aggregate ratio on the performance of pervious concrete. J. Build. Eng. 2023, 73, 106718. [Google Scholar]
  9. Pieralisi, R.; Cavalaro, S.H.P.; Aguado, A. Evolutionary lattice model for the compaction of pervious concrete in the fresh state. Constr. Build. Mater. 2015, 99, 11–25. [Google Scholar] [CrossRef] [Green Version]
  10. Yu, F.; Guo, J.; Liu, J.; Cai, H.; Huang, Y. A review of the pore structure of pervious concrete: Analyzing method, characterization parameters and the effect on performance. Constr. Build. Mater. 2023, 365, 129971. [Google Scholar] [CrossRef]
  11. Yogesh, R.V.; Santha, G.K.; Ganesh, K.S. Mixture proportion design of pervious concrete based on the relationships between fundamental properties and skeleton structures. Cem. Concr. Comp. 2020, 113, 103693. [Google Scholar]
  12. Zhong, R.; Leng, Z.; Poon, C.-S. Research and application of pervious concrete as a sustainable pavement material: A state-of-the-art and state-of-the-practice review. Constr. Build. Mater. 2018, 183, 544–553. [Google Scholar] [CrossRef]
  13. Liu, R.T.; Sha, H.J.; Yang, F.; Zhang, H.L.; Shi, Q.S. Investigation of the porosity distribution, permeability, and mechanical performance of pervious concretes. Processes 2018, 6, 78. [Google Scholar] [CrossRef] [Green Version]
  14. Meng, X.Y.; Jiang, Q.H.; Liu, R.Y. Flexural Performance and Toughness Characteristics of Geogrid-Reinforced Pervious Concrete with Different Aggregate Sizes. Materials 2021, 14, 2295. [Google Scholar] [CrossRef]
  15. Yu, F.; Sun, D.; Wang, J.; Hu, M. Influence of aggregate size on compressive strength of pervious concrete. Constr. Build. Mater. 2019, 209, 463–475. [Google Scholar] [CrossRef]
  16. Ćosić, K.; Korat, L.; Ducman, V.; Netinger, I. Influence of aggregate type and size on properties of pervious concrete. Constr. Build. Mater. 2015, 78, 69–76. [Google Scholar] [CrossRef]
  17. Huang, J.L.; Luo, Z.B.; Khan, M.B.E. Impact of aggregate type and size and mineral admixtures on the properties of pervious concrete: An experimental investigation. Constr. Build. Mater. 2020, 265, 120759. [Google Scholar] [CrossRef]
  18. Neamitha, M.; Supraja, T. Influence of water cement ratio and the size of aggregate on the properties of pervious concrete. Int. Ref. J. Eng. Sci. 2017, 6, 9–16. [Google Scholar]
  19. Nguyen, D.H.; Sebaibi, N.; Boutouil, M.; Leleyter, L.; Baraud, F. A modified method for the design of pervious concrete mix. Constr. Build. Mater. 2014, 73, 271–282. [Google Scholar] [CrossRef]
  20. Deo, O.; Neithalath, N. Compressive response of pervious concretes proportioned for desired porosities. Constr. Build. Mater. 2011, 25, 4181–4189. [Google Scholar] [CrossRef]
  21. Rangelov, M.; Nassiri, S.; Chen, Z.; Russell, M.; Uhlmeyer, J. Quality evaluation tests for pervious concrete pavements’ placement. Int. J. Pavement Res. Technol. 2017, 10, 245–253. [Google Scholar] [CrossRef]
  22. Song, H.-W.; Pack, S.-W.; Nam, S.-H.; Jang, J.-C.; Saraswathy, V. Estimation of the permeability of silica fume cement concrete. Constr. Build. Mater. 2010, 24, 315–321. [Google Scholar] [CrossRef]
  23. Seeni, B.S.; Madasamy, M.; Chellapandian, M.; Arunachelam, N. Effect of silica fume on the physical, hydrological and mechanical properties of pervious concrete. Mater. Today 2023, in press. [Google Scholar] [CrossRef]
  24. Supit, S.W.M.; Pandei, R.W. Effects of metakaolin on compressive strength and permeability properties of pervious cement concrete. J. Teknol. 2019, 81, 33–39. [Google Scholar]
  25. Zhong, R.; Wille, K. Material design and characterization of high performance pervious concrete. Constr. Build. Mater. 2015, 98, 51–60. [Google Scholar] [CrossRef]
  26. Adil, G.; Kevern, J.T.; Mann, D. Influence of silica fume on mechanical and durability of pervious concrete. Constr. Build. Mater. 2020, 247, 118453. [Google Scholar] [CrossRef]
  27. Elavarasan, S.; Priya, A.K.; Bharath, S.; Satheeshkanna, R.; Arunraj, D. Experimental studies on pervious concrete reinforced with polypropylene fiber. Mater. Today 2022, 68, 2280–2283. [Google Scholar] [CrossRef]
  28. Akand, L.; Yang, M.J.; Wang, X.N. Effectiveness of chemical treatment on polypropylene fibers as reinforcement in pervious concrete. Constr. Build. Mater. 2018, 163, 32–39. [Google Scholar] [CrossRef]
  29. Al-Hadithi, A.I.; Noaman, A.T.; Mosleh, W.K. Mechanical properties and impact behavior of PET fiber reinforced self-compacting concrete (SCC). Compos. Struct. 2019, 224, 111021. [Google Scholar] [CrossRef]
  30. Mastali, M.; Dalvand, A. Use of silica fume and recycled steel fibers in self-compacting concrete (SCC). Constr. Build. Mater. 2016, 125, 196–209. [Google Scholar] [CrossRef]
  31. Liu, J.; Jia, Y.; Wang, J. Experimental study on mechanical and durability properties of glass and polypropylene fiber reinforced concrete. Fiber Polym. 2019, 20, 1900–1908. [Google Scholar] [CrossRef]
  32. Yuan, Z.; Jia, Y.M. Mechanical properties and microstructure of glass fiber and polypropylene fiber reinforced concrete: An experimental study. Constr. Build. Mater. 2020, 266, 121048. [Google Scholar] [CrossRef]
  33. Ozel, B.F.; Sakallı, Ş.; Şahin, Y. The effects of aggregate and fiber characteristics on the properties of pervious concrete. Constr. Build. Mater. 2022, 356, 129294. [Google Scholar] [CrossRef]
  34. Ozturk, O.; Ozyurt, N. Sustainability and cost-effectiveness of steel and polypropylene fiber reinforced concrete pavement mixtures. J. Clean. Prod. 2022, 363, 132582. [Google Scholar] [CrossRef]
  35. CJJ/T 135-2009; Technical Specification for Pervious Cement Concrete Pavement. China Construction Industry Press: Beijing, China, 2009.
  36. GB/T 50081-2016; Standard for Test Method of Mechanical Properties on Ordinary Concrete. China Construction Industry Press: Beijing, China, 2016.
  37. CJJ/T 253-2016; Technical Specification for Application of Pervious Recycled Aggregate Concrete. China Construction Industry Press: Beijing, China, 2016.
  38. Sandoval, G.F.B.; Galobardes, I.; Teixeira, R.S.; Toralles, B.M. Comparison between the falling head and the constant head permeability tests to assess the permeability coefficient of sustainable Pervious Concretes. Case Stud. Constr. Mater. 2017, 7, 317–328. [Google Scholar] [CrossRef]
  39. Qin, Y.; Yang, H.; Deng, Z.; He, J. Water permeability of pervious concrete is dependent on the applied pressure and testing methods. Adv. Mater. Sci. Eng. Int. J. 2015, 2015, 404136. [Google Scholar] [CrossRef] [Green Version]
  40. GB/T 50476-2019; Standard for Design of Concrete Structure Durability. China Construction Industry Press: Beijing, China, 2019.
  41. Kogbara, R.B.; Iyengar, S.R.; Grasley, Z.C.; Masad, E.A.; Zollinger, D.G. A review of concrete properties at cryogenic temperatures: Towards direct LNG containment. Constr. Build. Mater. 2013, 47, 760–770. [Google Scholar] [CrossRef]
  42. Lee, G.C.; Shih, T.S.; Chang, K.C. Mechanical properties of concrete at low temperature. J. Cold Reg. Eng. 1988, 2, 13–24. [Google Scholar] [CrossRef]
Figure 1. Dimensions of the specimens: (a) cube and prism specimens and (b) cylinder specimens.
Buildings 13 01966 g001
Figure 2. Experimental setup of flexural test.
Buildings 13 01966 g002
Figure 3. Experimental setup of immersed weight.
Buildings 13 01966 g003
Figure 4. Experimental setup of permeability.
Buildings 13 01966 g004
Figure 5. The acid corrosion of specimen.
Buildings 13 01966 g005
Figure 6. The loading of a specimen at different temperatures.
Buildings 13 01966 g006
Figure 7. Porosity of fiber-reinforced pervious mixture.
Buildings 13 01966 g007
Figure 8. Permeability coefficient of mixture.
Buildings 13 01966 g008
Figure 9. Cubic compressive strength of fiber-reinforced pervious concrete.
Buildings 13 01966 g009
Figure 10. Failure mode of cubic samples with different fiber contents.
Buildings 13 01966 g010
Figure 11. Compressive strength of prism samples.
Buildings 13 01966 g011
Figure 12. Failure mode of prism samples with different fiber contents.
Buildings 13 01966 g012
Figure 13. Flexural tensile strength of pervious mixture.
Buildings 13 01966 g013
Figure 14. Failure mode of prism samples for flexural test with different fiber contents.
Buildings 13 01966 g014
Figure 15. Cubic compressive strength of samples with different fiber contents and corrosion times.
Buildings 13 01966 g015
Figure 16. Apparent damage of cubic samples with different corrosion time.
Buildings 13 01966 g016
Figure 17. Cubic compressive strength of samples with different fiber content and temperatures.
Buildings 13 01966 g017
Figure 18. Failure mode of cubic samples at different temperatures.
Buildings 13 01966 g018
Figure 19. The 3D images of the samples: (a) 0 kg/m3, (b) 3 kg/m3, (c) 6 kg/m3, and (d) 9 kg/m3.
Buildings 13 01966 g019
Figure 20. The 2D images of the cross-section of the samples: (a) 0 kg/m3, (b) 3 kg/m3, (c) 6 kg/m3, and (d) 9 kg/m3.
Buildings 13 01966 g020
Figure 21. Failure modes of the samples.
Buildings 13 01966 g021
Table 1. Characteristics of cement.
Initial Setting Time
(min)
Final Setting Time
(min)
Flexural Strength
(MPa)
Compressive Strength
(MPa)
3 d28 d3 d28 d
2552905.28.8524.648.4
Table 2. Performance parameter of silica fume.
Fire-Resistance Temperature
(°C)
Volumetric Weight
(kg/m3)
Mean Diameter
(µm)
Specific Surface Area
(m)
160016500.224
Table 3. The technical indexes of polypropylene fibers.
Density
(kg/m3)
Tensile Strength
(MPa)
Elastic Modulus
(GPa)
Length
(mm)
Elongation
(%)
9102802902017
Table 4. Mixture ratio of pervious concrete.
Aggregate
(kg/m3)
Cement
(kg/m3)
Water
(kg/m3)
Silica Fume
(kg/m3)
Water Reducer
(kg/m3)
Fiber Content
(kg/m3)
1617388121254.13-
1617388121254.133
1617388121254.136
1617388121254.139
Table 5. The parameters of ICT.
Sectional Dimension of Samples
(mm)
Height of Samples
(mm)
Pixel Size
(μm)
Effective Imaging Area
(mm)
≤300≤50052427 mm × 427 mm
Disclaimer/Publisher’s Note: The statements, opinions and data contained in all publications are solely those of the individual author(s) and contributor(s) and not of MDPI and/or the editor(s). MDPI and/or the editor(s) disclaim responsibility for any injury to people or property resulting from any ideas, methods, instructions or products referred to in the content.

