Article

Effect of Graphene Oxide as a Nanomaterial on the Durability Behaviors of Engineered Cementitious Composites by Applying RSM Modelling and Optimization

by
Naraindas Bheel
,
Bashar S. Mohammed
*,
M. S. Liew
and
Noor Amila Wan Abdullah Zawawi
Civil and Environmental Engineering Department, Universiti Teknologi PETRONAS, Seri Iskandar 32610, Perak, Malaysia
*
Author to whom correspondence should be addressed.
Buildings 2023, 13(8), 2026; https://doi.org/10.3390/buildings13082026
Submission received: 29 May 2023 / Revised: 15 June 2023 / Accepted: 21 June 2023 / Published: 9 August 2023
(This article belongs to the Section Building Materials, and Repair & Renovation)

Abstract

:
Engineered Cementitious Composites (ECC) are widely used in various structures due to their high strength, durability, and ductility. However, they are still vulnerable to environmental factors such as sulphate and acid attack. These attacks damage the concrete matrix, which leads to cracking and corrosion of the reinforcing steel. To mitigate these issues, various techniques have been developed, including the addition of graphene oxide to the ECC mix. Graphene oxide has shown potential in improving the mechanical properties and durability of ECC. The purpose of this study was to use multi-objective optimization to identify an appropriate GO by the weight of the cement and polyvinyl alcohol (PVA) fiber volume fraction in an ECC mixture. Using RSM’s central composite design (CCD), thirteen mixtures of various possible combinations of variables (GO: 0.05 percent to 0.08 percent, PVA: 1–2 percent) were established, and eight response responses (compressive strength, change in length, weight loss, pH test, weight gain, expansion, rapid chloride permeability test and water absorption) were examined. However, analysis of variance was used to effectively design and evaluate eight (six quadratic and two linear) response models. All the models had extremely high R2 values, ranging from 84 percent to 99 percent. The multi-objective optimization produced ideal variable values (GO: 0.05 percent and PVA: 1%) and projected optimum response values. The predicted values were verified experimentally and found to correlate extremely well with the experimental data, with less than a 5% error. The outcome showed that the maximum increase of 30% in the compressive strength was recorded at 0.05% of GO as a nanomaterial in ECC. In addition, the expansion due to sulfate resistance and change in length due to acid attack were decreased by 0.0023% and 0.28%, respectively, when the use of 0.08% of GO as a nanomaterial in the ECC matrix was reinforced with 1% PVA fiber for 28 days. Moreover, the weight loss and weight gain of ECC combined with 1% of PVA fiber due to chemical attack decreased by 66.70% and 77.80%, respectively, at 0.08% of GO as a nanoscale particle than that of the reference mix for 28 days. In addition, the pH value due to acid attack, rapid chloride permeability test value, water absorption, and slump flow of the fresh mixture were decreased as the concentration of GO rose in ECC. The results indicated that the incorporation of 0.05% GO as a nanomaterial and 1 to 1.5% of PVA fiber will provide the best outcomes for the construction industry.

1. Introduction

Engineered cementitious composites (ECC) are a kind of high-performance fiber-reinforced cementitious composite (HPFRCC) characterized by a distinctive combination of high ductility and an intermediate fiber-volume fraction. Utilizing theoretical approaches relying on microstructures [1,2], ECCs are constructed to incorporate good hardening and toughness properties even in normal or extreme situations. ECCs are composite materials considered to assist the concrete sector in maximizing appropriate product utilization and decreasing waste, in addition to providing economic and eco-friendly benefits, and improved structural durability [3,4]. In addition to exhibiting high resistance to cracking, good ductility, and the capacity to control crack width, an ECC is a suitable composite for enhancing the durability of infrastructure projects [5]. This is due to the fact that ECCs are capable of forming stable and numerous microcracks that significantly enhance their service life in terms of tensile strength and ductility [6]. An ECC is approximately 3–5% more efficient than control concrete in terms of high tensile strength [7]. According to research findings, its crushing strength ranges from 20.00 MPa to 95.00 MPa; its compressive strain varies from 0.40% to 0.65%; and its tensile strength ranges from 4.00 MPa to 12.00 MPa [8].
Despite the fact that ECC provides a number of benefits over regular concrete, there are a number of downsides connected with its usage. Initially, the ECC mixture’s drying shrinkage was greater than that of regular concrete, resulting in less eigenstrain in the matrix when restricted. Since ECC lacks coarse particles, its Young’s modulus is lower than that of standard concrete, resulting in higher strain when the material reaches its compressive strength [9]. In addition, concrete constructions are frequently exposed to corrosive environmental surroundings caused by a variation of naturally happening and synthetic chemicals. Sulfate serves as one of the most significant features contributing to the degradation of concrete and mortar constructions [10]. The impacts of sulfate are a result of the reaction between sulfate particles and the calcium aluminate hydrate and calcium hydroxide existing in Portland cement (PC) [11,12]. These materials, ettringite and gypsum, cause concrete to expand and fracture, resulting in a surface that is consequently brittle and less durable [13,14].
Sulfate also reduces the adhesion forces of the concrete by deteriorating the primary components of hydrate Portland cement, i.e., calcium hydroxide and calcium silicate, thereby decreasing the concrete’s durability. This leads to a decline in concrete strength and durability [15]. The exposure of concrete to acid is typically a second potential risk factor. There are various ways in which acid can attack concrete. Acids in groundwater or soil can corrode deep underground concrete structures, whether they are produced naturally or as a result of the disposal of industrial wastes. Acid leakage and accidental spills may also happen in industrial applications [16]. The method of acid attack differs depending on the kind of acid, with carbonic, hydrochloric, sulfuric, and nitric acids being the most frequently occurring acids in concrete. The end outcome is the dissolution of cement hydrates and calcium hydroxide into calcium salts that deteriorate the exposed concrete. Moreover, the acid attacks differ from sulfate attacks in that acid-attack degradation is not accompanied by considerable expansion. Particularly in comparison to cement hydration products, the carbonaceous material is vulnerable to acid attack [17]. In contrast to other acids, sulfuric acid (H2SO4) can dissolve and swell concrete. Numerous scientists have discovered that concrete subjected to sulfuric acid loses weight. As sulfuric acid reacts with calcium hydroxide and calcium silicate hydrate gel, it generates gypsum. This mechanism, which results in the dissolving and expansion of concrete, is known as gypsum corrosion. The alkalinity of concrete reduces as a consequence of gypsum corrosion, leading to microbiological corrosion. Corrosion generates a poor compound devoid of cementitious qualities, resulting in fast degradation, loss of strength, and, in severe situations, the total disintegration and collapse of the concrete structure. In the second phase of the corrosion of concrete by sulfuric acid, gypsum may undergo a second cycle of the reactions defined in the section on sulfate attack to form ettringite and/or thaumasite. Nevertheless, ettringite and thaumasite are not reliable in an acidic situation [18,19], so, the primary reaction result of a sulfuric acid attack will be gypsum.
Reducing the permeability of concrete or using different mineral fillers to lessen the quantity of calcium hydroxide developed throughout the hydration of PC are two of the many techniques studied by researchers to enhance the protection of concrete against acid attack [20]. The substitution of specific weight ratios of cement with additives, special mortars, and concrete have been made to ensure the implementation of the aforementioned important approaches; these have shown promising results against sulfate attacks [21,22]. Nanoparticles are utilized in some mineral admixtures that are added to concrete to lessen the effects of sulfate and acid attacks [23,24]. The performance of a pozzolanic reaction is clear because it is inversely correlated with the surface area of amorphous nanoparticles. In general, incorporating pozzolan improves concrete’s density and resistance to sulfate and acid attack, but it also lowers or completely removes the free, leachable calcium hydroxide [25]. Therefore, graphene oxide (GO) [26] is identified as being among the principal beneficial graphene derivatives for PC-based mixtures due to its solid connection to several oxygen functional groups (FG), resulting in greater reactivity with PC as a result of its high surface area [27,28]. The availability of hydrophilic FG in GO indicates that dispersion is still the optimal method for preparing composites [9]. Graphene is an outstanding nanoscale filler and durable in the production of PC matrix; according to earlier studies, GO-PC composites have much better compressive and flexural properties than traditional cementitious composites with the same amount of ingredients [29,30]. This is because the incorporation of GO as a nanomaterial increases the toughness of ECC by optimizing the micropore’s structure, stopping the initiation and proliferation of crack formation at the initial phase, improving transport properties (gas permeability, water permeability, and chloride penetration tolerance), and continuing to increase freezing and tanning process tolerance [9]. It was also revealed that the overall porosity of cementitious composites comprising 1% of GO decreased from 25.21% to 10.61% [31]. GO is anticipated to raise the ultimate percentage of C-S-H, decrease the microstructure’s porosity, and stabilize the composite materials [32].
The introduction of GO provides a practical alternative to conventional fibers because it develops amendments and performs well at the nanoscale owing to its larger specific surface area and accessibility to major FGs [33]. Strong covalent bonds are formed when GO is added, forming pathways for the interaction of PC hydration products [34]. As a consequence, the structural interaction and functioning of nanocomposites are improved [9]. In order to increase the cementitious material’s hydration and develop denser, longer-lasting concrete, graphene oxide (GO) has been utilized [35]. GO serves as a highly soluble reinforcing agent in cementitious materials when contrasted to other carbon-based nanomaterials which readily agglomerate in the PC matrix [36,37]. As stated in the literature [38], GO incorporation improved the porous structure of GO-reinforced cement-based composite materials, increasing their resistance to chloride-ion infiltration and decreasing their sorptivity value. Previous research has demonstrated that adding GO helps to accelerate the cement’s hydration process. This could be attributed to the oxygenated FGs bonded to GO nanomaterials, which contribute to making them supplementarily hospitable to the PC matrix and enhancing the cement-water reaction by serving as the cement phases’ nuclei [39]. The accumulation of GO in concrete, therefore, appears to be an interesting nanoparticle for improving the PC-based matrix and it is a graphene derivative that may be considered a graphene texture with implanted oxygen FGs [40]. The interfacial connectivity between these active functional groups and the host materials can be strengthened by their preference for engaging in chemical or physical interactions. Pan et al. [41] conducted studies to demonstrate the benefits of GO in cement-based matrixes, and their findings showed that just 0.05% GO is enough to significantly increase the compressive strength by between 25% to 33%. Fan et al. [42] found that the utilization of 0.06% GO improved the compressive strength by 72.7% compared to that of the reference mix. Additionally, Lee et al. [43] revealed that the air concentration in GO-reinforced cementitious is 10.7% smaller than that of the plain mixture, showing that GO reduces the pore arrangement and significantly increases gel porosity. This is because GO acts as a surfactant that promotes the formation of voids. Lin et al. [34] stated that the presence of GO promotes the interaction of PC hydrates and the development of significant covalent bonds. In addition, Zheng et al. [9] discovered that GO improved the structural functionality and enhanced the characteristics of composite materials. By strengthening the weak bond of the cementitious materials’ matrix, the incorporation of GO has the ability to mitigate the challenges related to the implementation of an ECC on a large scale as well as the harmful impacts of sulphate and acid attacks.
Furthermore, there has been only a very limited study done on the use of GO as a nanoscale ingredient in ECC using RSM modelling for determining the durability properties of ECC. The independent variables and concrete characteristics exhibited either linear or quadratic relationships, according to the RSM model. In addition, this study maximized or minimized the expected results by maximizing or minimizing the overall influence of these criteria. GO as a nanoscale particle in an effective mixture design for ECC that incorporates RSM and improves the toughness and durability characteristics. RSM can predict properties such as compressive strength and durability behavior under sulphate and acid assault, cutting down on the time and tedium of endless laboratory experiments. The duration of construction is reduced when these attributes are accurately and quickly assessed, especially when they are required for quick project execution. By using RSM in this inventive way, it is possible to adjust the mixing proportions of concrete components as needed to achieve design objectives. In addition, using such a technique prevents the production of concrete with an abnormally high strength or the failure to meet the necessary design strength. This approach always results in the economical exploitation of raw resources, fewer construction breakdowns, and reduced construction costs [44,45]. RSM has developed changeable, mathematically confirmed modelling techniques that may be used to determine the ideal design of processes [46]. When many factors influence one or more performances or response attributes, RSM is frequently employed. Additionally, it could potentially be applied to optimize one or many responses to meet a certain set of conditions. The nonlinear response surfaces of the data obtained from experiments are also well interpreted experimentally by RSM [47]. The response surface methodology (RSM) is a powerful statistical approach for constructing models, analyzing the impacts of factors, and finding the best conditions for experiments [48,49,50]. A quadratic function is fitted to a set of simultaneously fluctuating elements in RSM [51]. RSM provides a number of advantages for optimization compared to the time-consuming one of the substances-at—a-time technique, which does not take into consideration the link between variables [52,53]. A a model that use mathematics to predict the necessary qualities, RSM analyses each of the components to obtain the ideal mix proportion [54]. The primary objective of the present study was to evaluate the compressive strength, water absorption, rapid chloride permeability test, and durability properties due to resistance to acid and sulphate attacks of an ECC containing varying amounts of PVA fibers and a GO nanomaterial by applying RSM modelling and optimization.

2. Research Significance

Engineered Cementitious Composites (ECC) are widely used in various structures due to their high strength, durability, and ductility. However, they are still vulnerable to environmental factors such as sulphate and acid attack. These attacks damage the concrete matrix, which leads to cracking and corrosion of the reinforcing steel. To mitigate these issues, various techniques have been developed including the addition of graphene oxide to the concrete mix. Graphene oxide has shown potential in improving the mechanical properties and durability of concrete. However, there is a gap in the literature regarding the effectiveness of graphene oxide in enhancing the durability of ECC against sulphate and acid attacks. Therefore, this study aimed to investigate the effect of graphene oxide on the durability of ECC subjected to sulfates and acids, and to evaluate its potential to mitigate the deterioration of concrete caused by these environmental factors. This study will also contribute to the growing body of literature on the use of nanotechnology in the construction industry and will provide a foundation for further research in this area. Overall, this research has significant potential to advance the field of civil engineering and improve the longevity of concrete structures.

3. Materials and Methods

3.1. Materials

Portland cement (PC) was utilized as a binding agent in the production of the ECC, which met the ASTM C150 [55] requirement. The fly ash (FA) utilized in the experiments was classified as class F fly ash and fulfils ASTM C618 standards [56]. X-ray fluorescence spectroscopy (XRF), Blaine fineness, and specific gravity of PC and FA data are provided in Table 1. Graphene oxide (GO) was employed as a nanomaterial in various amounts in the ECC and river sand was used in this study as fine aggregates that had passed through a #4 sieve (less than 4.75 mm in size). Additionally, the polyvinyl alcohol (PVA) fiber manufactured in Japan by Kuraray was utilized as fiber content in the ECC mixture by the volume fraction of the ECC mixture. To modify the fiber/matrix interface properties, the surface of the fiber was coated with 1,2% oil by mass. The fiber’s characteristics are listed in Table 2. Moreover, a modified polycarboxylate-based high-range water reducer was used as a superplasticizer (SP) in the ECC mixture, which had a pH value and specific gravity of about 6.2 and 1.08, respectively. It was added as 0.99% by the weight of PC in the mixture of the ECC. In addition, potable water was used for blending and curing purposes in the ongoing research study.

3.2. Mix Proportions of GO-ECC

The RSM approach was applied to meet the goal of this study; the two independent variables (input factors) that were investigated were GO and PVA at three levels of 0.05, 0.065, and 0.08% by weight of PC and 1%, 1.5%, and 2% of PVA fiber by volume fraction, respectively. However, the fly ash-to-PC ratio, water-to-binder ratio, and sand-to-binder ratios for all ECC mixes were 1.2, 0.3, and 0.36, correspondingly, depending on the percentages for the most widely applied ECC in the majority of studies (ECC-M45) [57,58], and a plasticizer of 1.0% by weight of PC were used in this experimental work. Moreover, the thirteen experimental runs were developed by utilizing the central composite design (CCD) method of RSM. As indicated in Table 3, the mixtures comprised various combinations and concentrations of the input variables, as well as five random repetitions of each parameter. The purpose of the duplicate mixtures was to validate the experiment’s competence and protect against any potential variations. In addition, the RSM was used to assess the impact of the relationship between input elements on responses. The compressive strength, water absorption, sulfate attack, acid attack and a rapid chloride permeability test (RCPT) were investigated as responses.

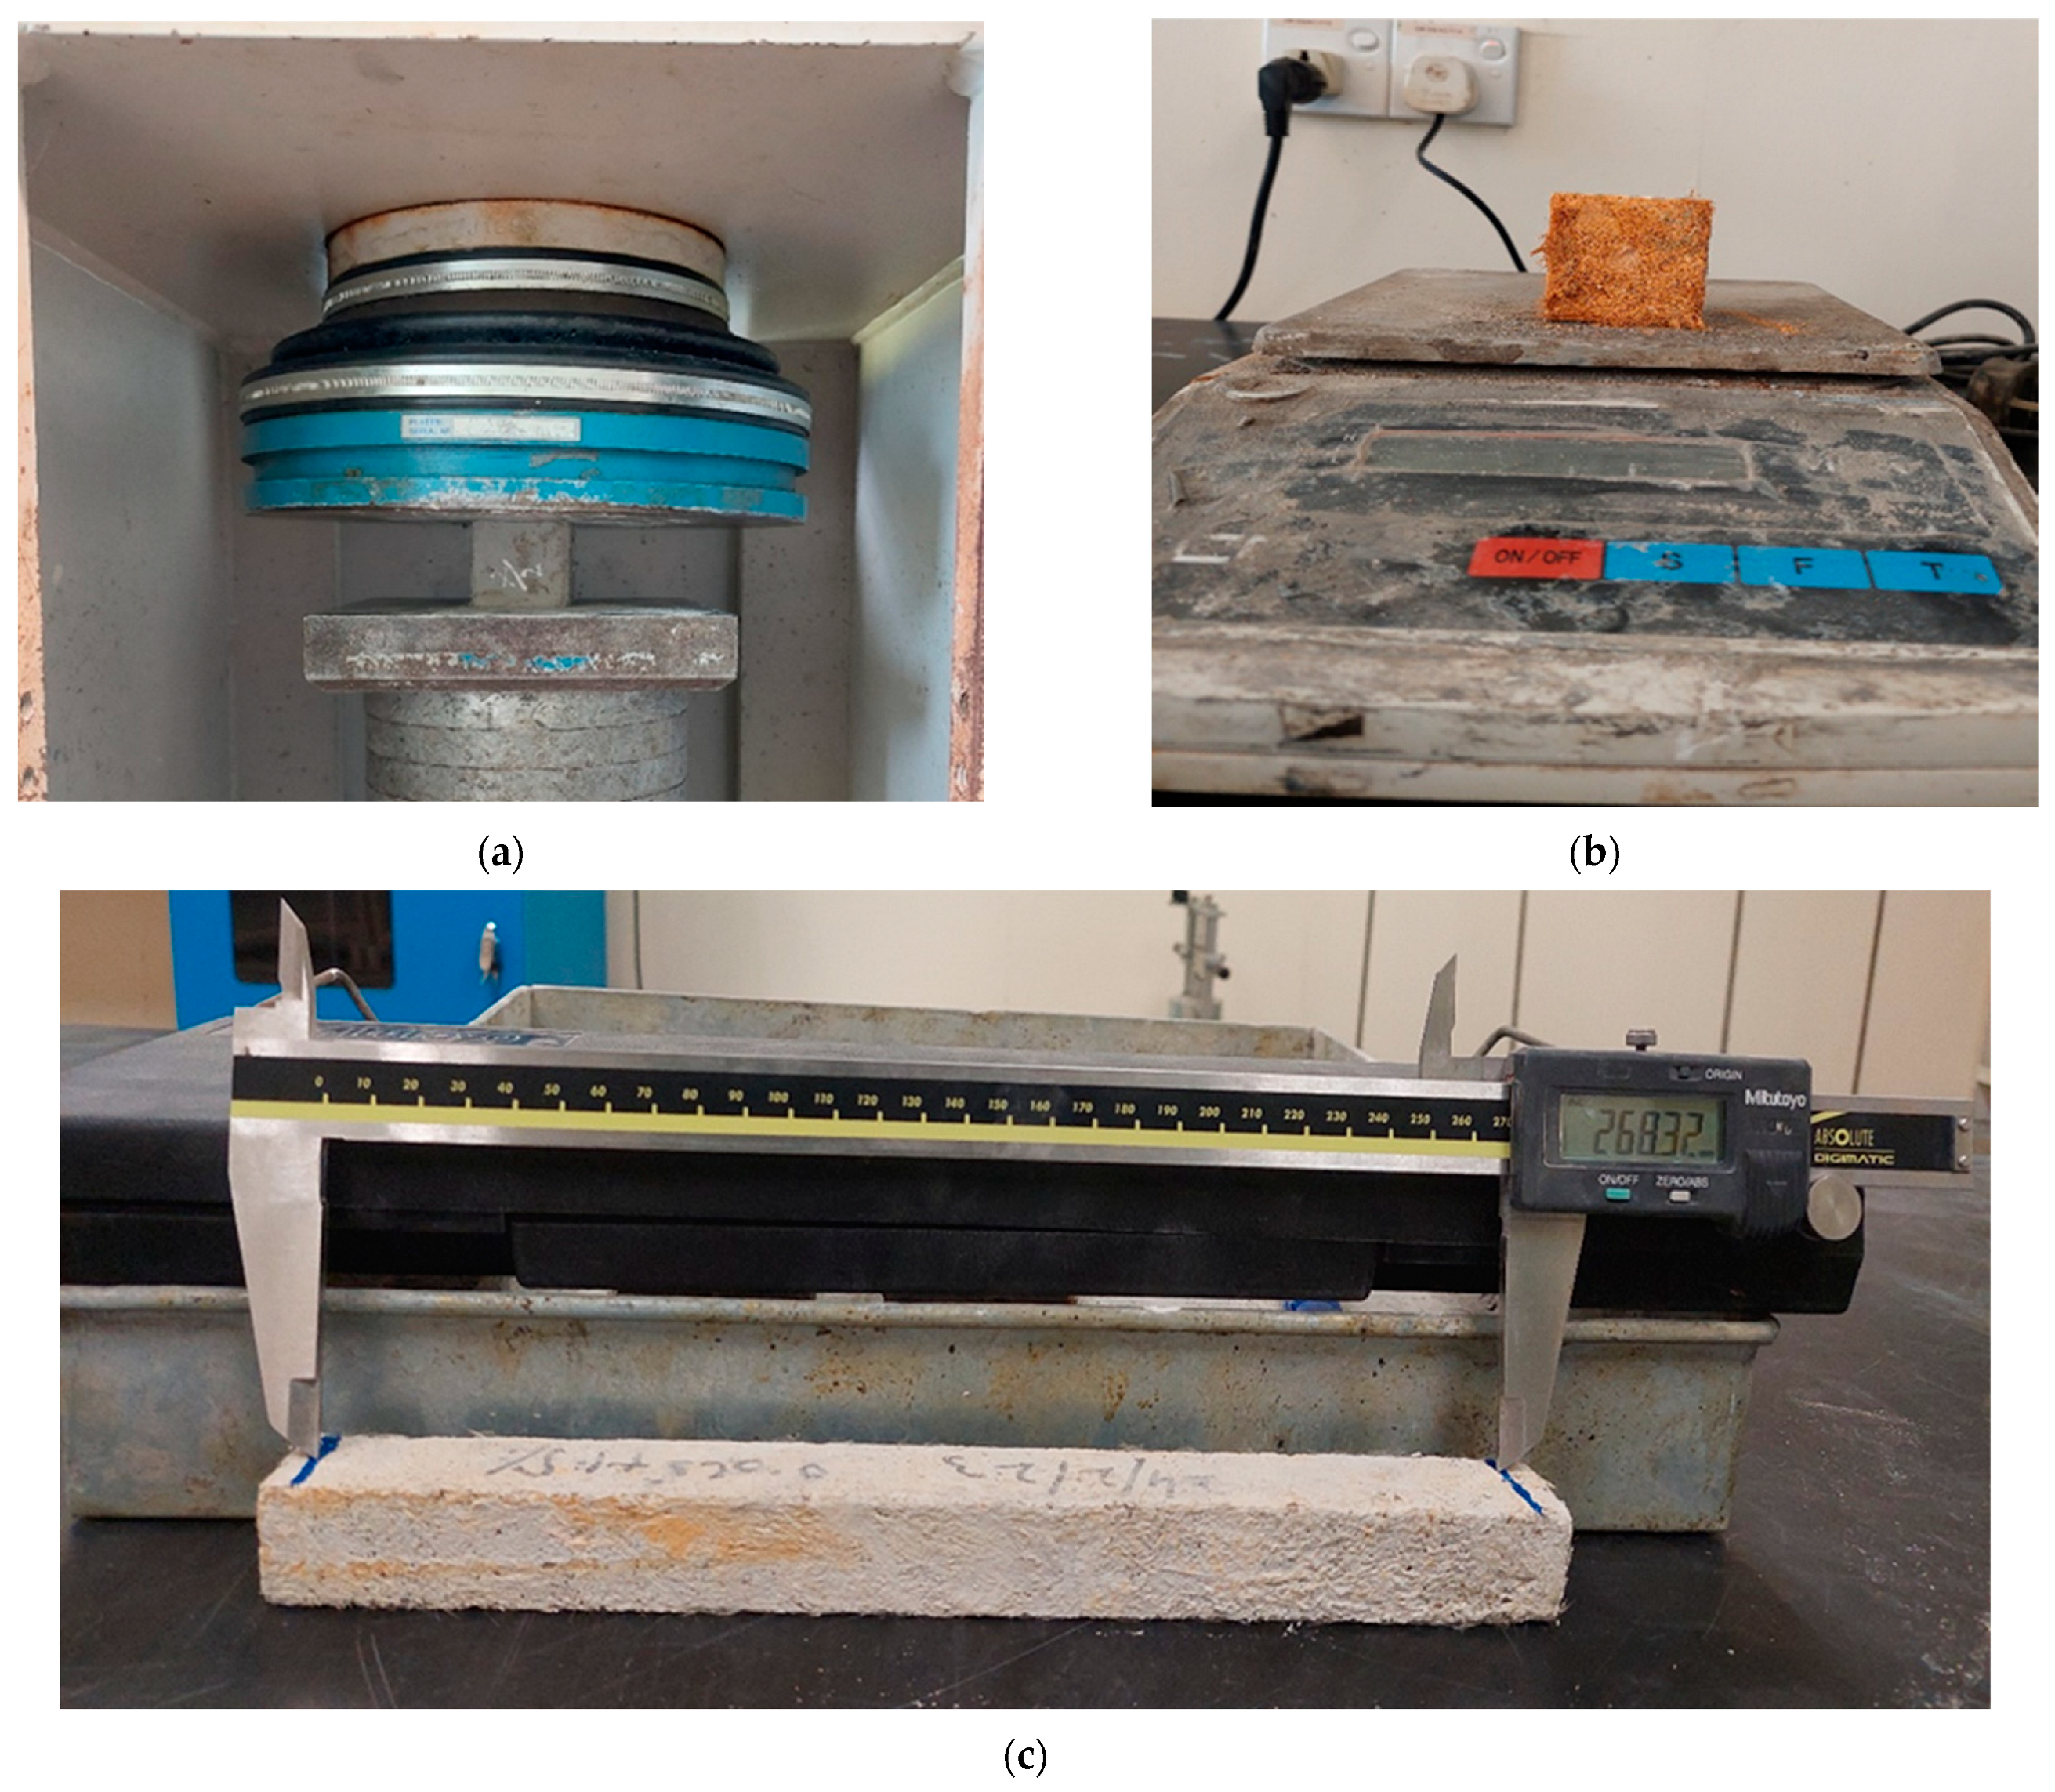
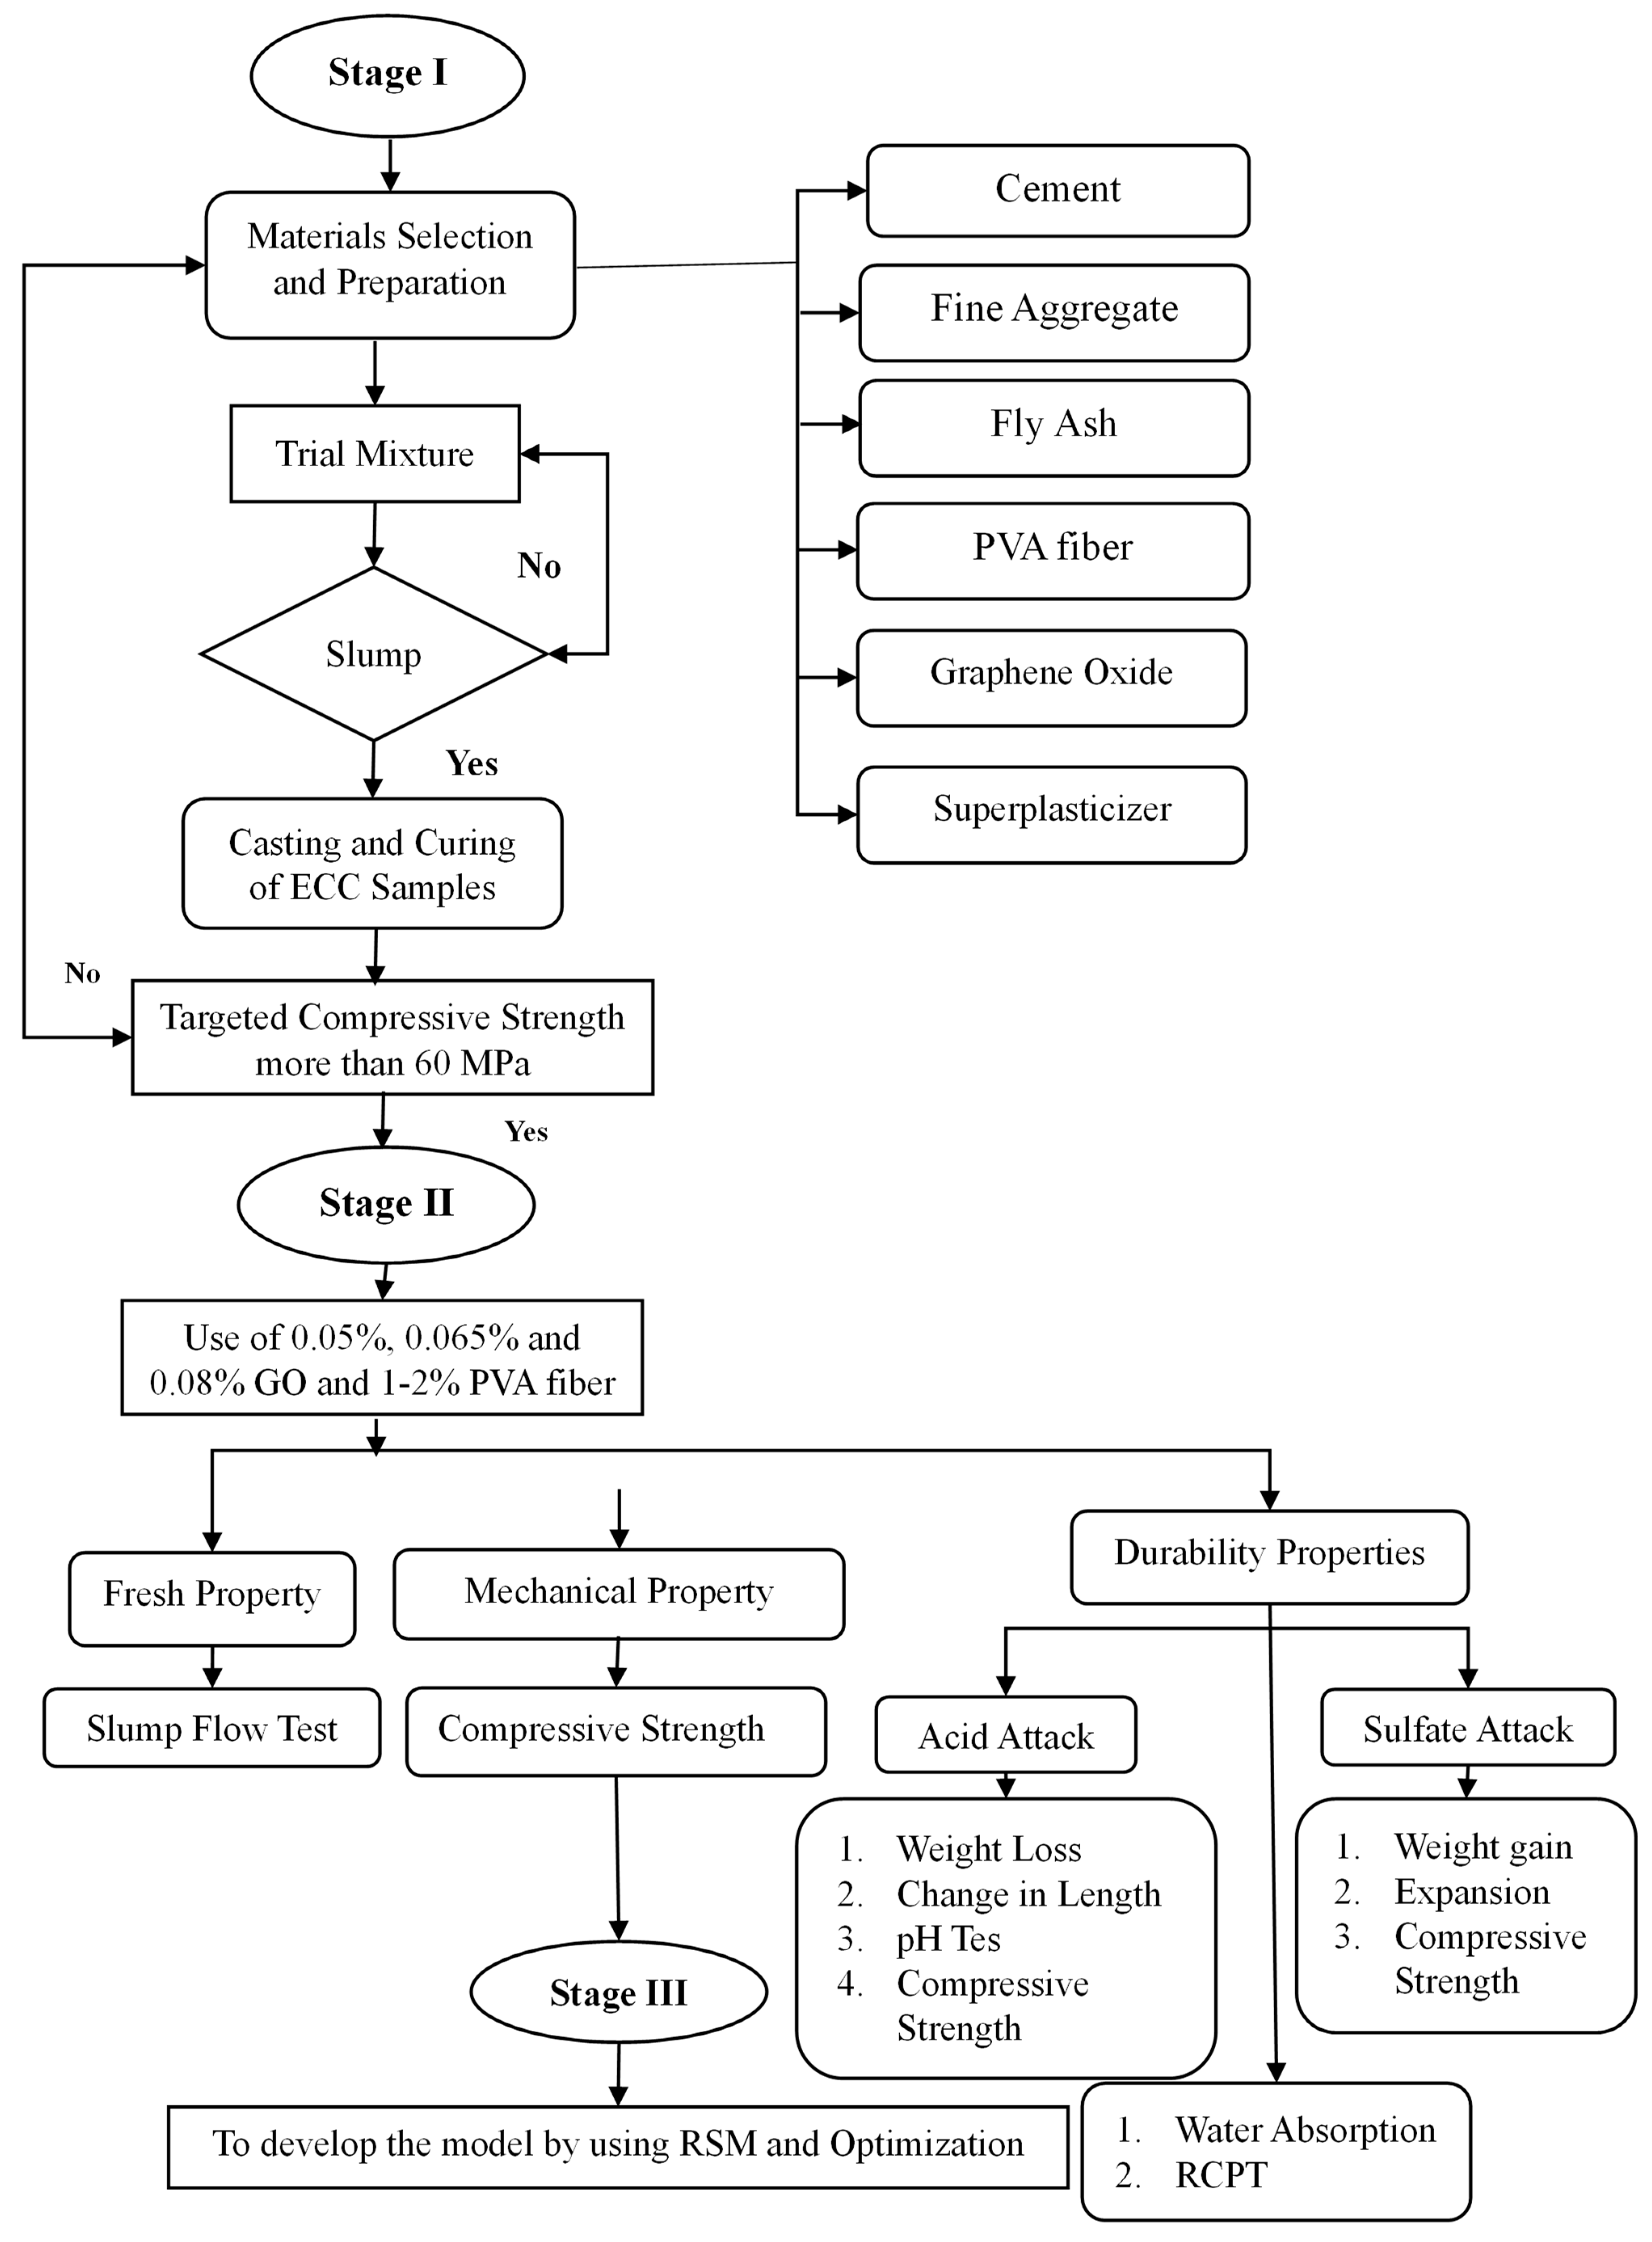
3.3. Sample Preparation and Testing Methods

The mixing arrangement of the GO-ECC mixtures was utilized in this experimental work. In a dry condition, the sand, PC, and FA were simultaneously added to the concrete mixer and mixed for almost two minutes. Afterward, the determined amount of water combined with GO and 1% of SP were added while the mixer continued to rotate; this procedure took an additional 2–3 min until the mixture was homogeneous. As proposed by prior studies, GO was mixed with polycarboxylate-based SP to aid nanoplatelet dispersion without sonication. Finally, the PVA fiber was added carefully to the revolving mixer for another 2–3 min, until the fibers were dispersed throughout the mixture. To achieve a workable mixture, SP was added to the mixtures with a high GO concentration to make up for the reduction of flowability. The fresh concrete mixture was made into a variety of specimens for compressive strength, sulfate attack, acid attack, water absorption, and RCPT testing.
Cube specimens (50 mm × 50 mm × 50 mm) were made of GO-ECC for determining the compressive strength of the GO-ECC after 3, 7, 14, and 28 days by following the BS EN 12390-3 [59] specifications. In addition, the cubical samples (50 mm × 50 mm × 50 mm) were examined for weight loss and compressive strength as a result of acid attack while prism samples were cast for change in length as a result of acid attack. These specimens were submerged in a 5.0% sulfuric acid (H2SO4) solution for weight loss, loss in compressive strength and change in length, and their monthly reduction was monitored. In addition, the external humidity on the concrete sample was dried and wiped away after 28 days of standard curing. The pH values of three ECC specimens combined with varying amounts of the GO nanomaterial were determined by analyzing the samples’ pH levels. The concrete specimens were ground into a powder, and then 10 grams of the powder were dissolved in 100 milliliters of distilled water, stirred for 10 min. The pH of the solutions was then measured using a pH meter. Moreover, cubical samples, and Bar (prism) specimens (285 mm × 25 mm × 25 mm) were made and dipped in a 5% sodium sulfate (Na2SO4) solution to assess the weight gain, compressive strength, and expansion, respectively. On a monthly basis, the weight gain, compressive strength, and length change of the samples were recorded. In addition, the water absorption was performed on the cubical samples prepared with GO-ECC by confirming the BS 1881–122:1983 [60] code standard at 28 days. Furthermore, to perform the RCPT test, cylindrical concrete disc samples of 100 × 50 mm were originally wet-cured for 28 days. The experiments were conducted using the rapid chloride permeability test procedures described in AASHTO T277-15 [61] and ASTM C1202-19 [62]. The edges of the concrete sections were first covered with quick-setting epoxy. The cylindrical sample was put in a vacuum chamber for 3 h after the sealant coating had been allowed to cure until it was no longer sticky when touched. The cylinder was then placed in the testing apparatus with two distinct cells in interaction with the disc’s two uncoated surfaces. The cell containing 3% (by weight) sodium chloride (NaCl) mixture in distilled water served as the anode, whereas the cell containing 0.3 N sodium hydroxide (NaOH) concentration in distilled water served as the cathode. The monitoring apparatus was then attached to a potential differential of 60 volts DC, which was measured and sustained for a duration of six hours. During the six-hour test, the total charge transported, as assessed in coulombs, was monitored every thirty minutes. The apparatus calculates or records the overall quantity of electric charge (in coulombs) that travel through the disc specimen. This total charge indicates the quantity of chloride ions that permeate the examined concrete specimen, as stated in the researchers’ earlier article [63]. The experimental testing setup is shown in Figure 1. Furthermore, the schematic diagram of this research work is shown in Figure 2.

4. Results and Discussion

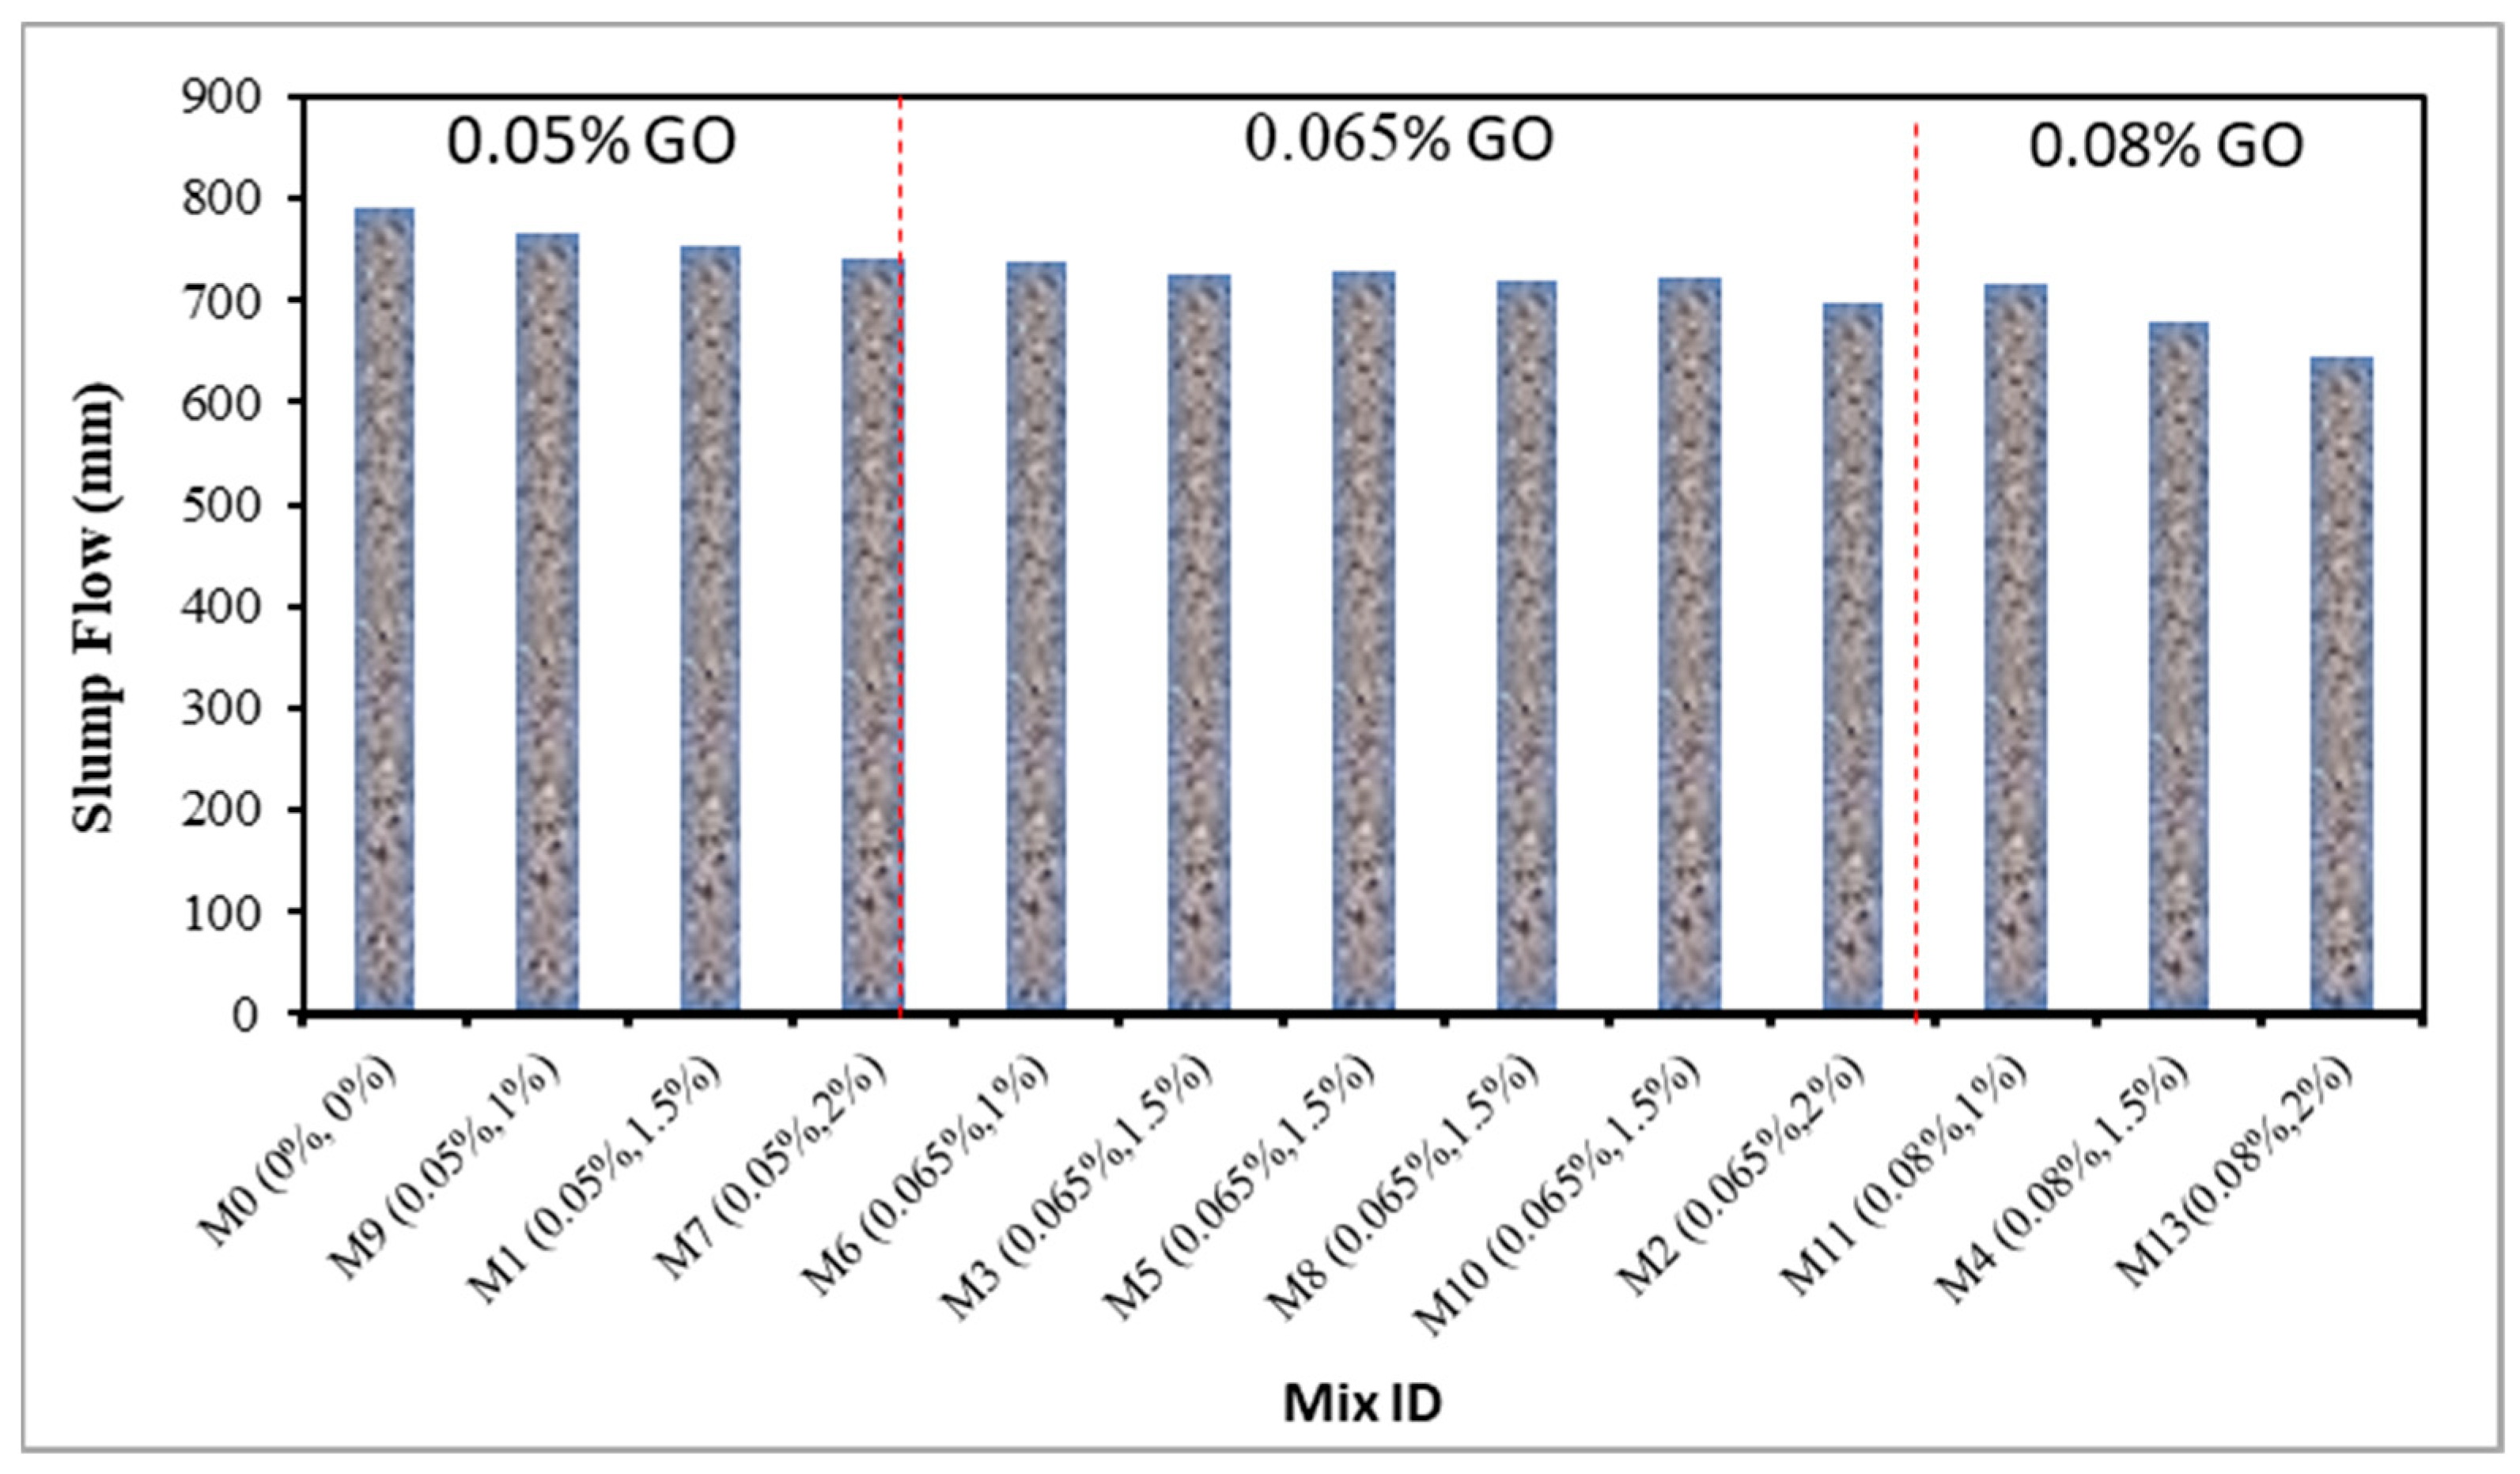
4.1. Slump Flow of Fresh GO-ECC

This test evaluated the workability of the freshly produced ECC accumulating PVA fiber and the 0.05, 0.065, and 0.08% GO nanoparticles, as illustrated in Figure 3. For all fresh combinations of concrete, the slump flow was between 650 and 850 mm, according to the EFNARC [64]. Nevertheless, the least value was observed at 645 mm when 0.08% of the GO was combined with 2% of PVA fiber in the manufacturing of the ECC, while the largest slump flow was recorded at 792 mm at the control combination of ECC. It has been shown that the slump flow decreases as the quantity of GO increases as nanoscale particles in ECC. This result is consistent with Arun et al.’s [65] observation that when MK rises, the fresh mixture’s workability declines. Same observation was found by Bheel et al. [66,67]. It is evident that a rise in GO resulted in a fall in the slump flow of the fresh mixture. A control mixture with 0% of GO showed a high slump flow. The lowest slump flow values, however, were seen in mixtures with 0.06 and 0.08% GO, respectively. The mix’s capacity to flow freely is decreased when the GO rises because less gravitational shearing force is needed to compensate for the mix’s yield stress [68]. In order to hydrate its huge surface area, the GO reduces the quantity of free water in the mixture, which is the cause of the phenomenon. Additionally, it has been illustrated that the negatively charged particles of GO are drawn to the negatively charged PC particles by electrostatic force, which causes flocculation and aggregation, which trap water and decrease the fluidity of the mixture [40,68]. As the viscosity rises, this stops the mixture from flowing. Abdulkadir et al. [69] reported that the use of GO as a nano-additive component resulted in self-compacting ECC, which then resulted in reducing the slump flow of fresh concrete. According to Wei et al. [70], the flow rate of cement matrixes comprising 0.01, 0.02, and 0.03% of GO, decreased by 7.9%, 10.0%, and 13.1%, respectively. In a similar vein, Lee et al. [71] observed that the inclusion of GO in cementitious composites reduced slump by 22.7–45.5%. The same observations were made by Zhao et al. [40].

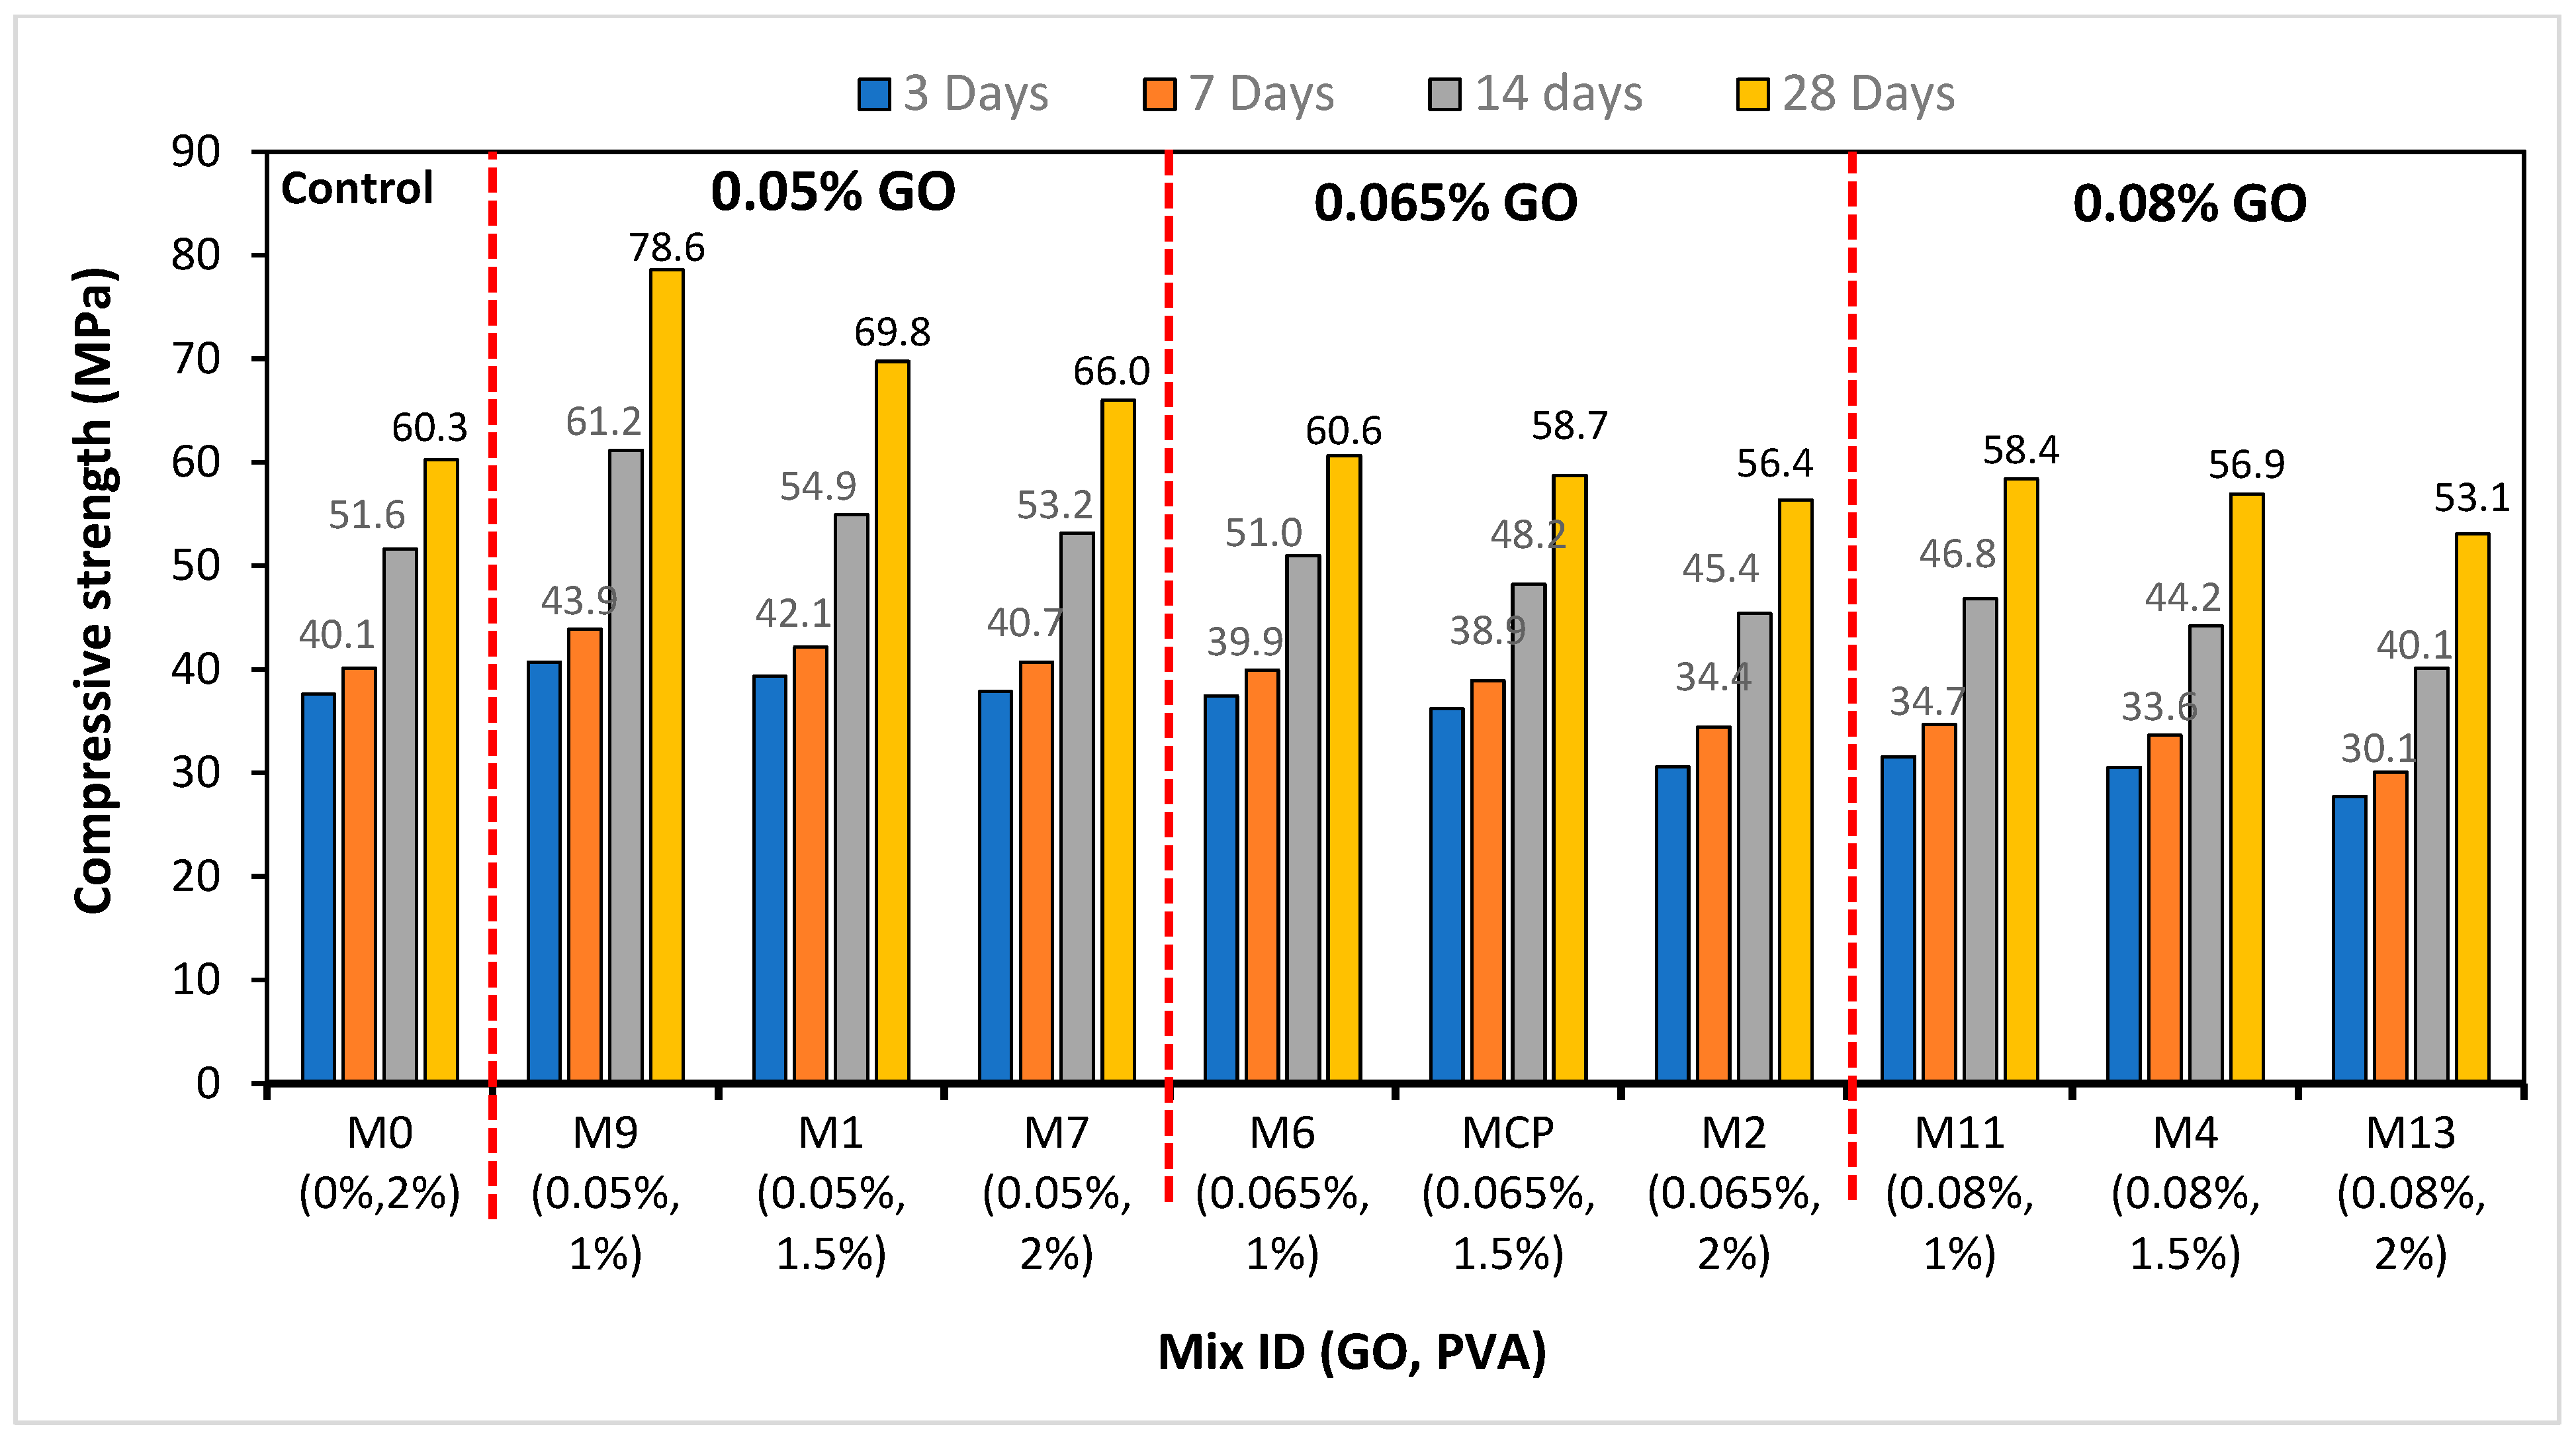
4.2. Compressive Strength of GO-ECC

Figure 4 depicts the compressive strength of ECC mixtures including varying percentages of GO as nanoparticles and 1–2% PVA fiber by volume fraction at 3, 7, 14, and 28 days. The maximum strength was calculated by 40.70 MPa, 43.90 MPa, 61.20 MPa, and 78.60 MPa at 0.05% of GO as a nanomaterial, whereas the lowest strength was 31.60 MPa, 34.70 MPa, 46.80 MPa, and 58.40 MPa at 0.08% of GO as a nanoparticle at 3, 7, 14, and 28 days, consistently. It has been argued that the introduction of 0.05% GO by weight of PC to the ECC mixture provides the best compressive strength and that with further additions of GO to the ECC mixture, the strength begins to decrease with each subsequent curing age. The optimal strength of ECC combined with 0.05% GO as a nanoparticle is attained as a result of the following variables: (i) Function of GO: the good mechanical properties of GO contribute significantly to the strengthening of the cement matrix. The wrinkled GO may interconnect several phases in the cement matrix, increasing the fracture surface hardness; and (ii) Pore-filling impact: because GO is a nanosized material, it easily and frequently fills the pore spaces of the cementitious matrix, resulting in increased densification; the densified matrix has improved mechanical properties [38,41,72,73]. As a result, it is clear that GO plays a significant role in boosting the mechanical assets of the ECC mixture. Moreover, high GO inclusion may cause GO aggregation in the cementitious matrix; thus, insufficient GO dispersion decreases the compressive strength of the ECC mixture. In the same way, the highest compressive strengths are anticipated to be 39.30 MPa, 42.10 MPa, 54.90 MPa, and 69.80 MPa at 0.05% of GO, whereas the lowest strengths are assessed to be 30.50 MPa, 33.60 MPa, 44.20 MPa, and 56.90 MPa at 0.08% of GO as nanoparticles in the ECC reinforced with 1.5% PVA fiber after 3, 7, 14, and 28 days, respectively. It was indicated that the compressive strength of the ECC mixture reinforced with 1% of PVA fiber and various proportions of GO is greater than that of the ECC blended with 1.5% of PVA fiber and various proportions of GO by the weight of PC at each curing time. Moreover, the highest compressive strength of the ECC mixture reinforced with 2% of PVA fiber by volume fraction was documented as 37.90 MPa, 40.70 MPa, 53.20 MPa, and 66 MPa at 0.05% of GO, and the lowest strength was noted as 27.70 MPa, 30.10 MPa, 40.10 MPa, 53.10 MPa at 0.08% of GO as a nanomaterial on 3, 7, 14 and 28 days, correspondingly. The outcome showed that the compressive strength of the ECC mixture inclusion with 1.5% of PVA fiber was observed to be greater as compared to the compressive strength of that blended with 2% of PVA fiber along with various percentages of GO while the compressive strength of ECC reinforced with 1% of PVA fiber along with different percentages of GO is noted to have greater value than that of compressive strength of the ECC blended with 1.5% and 2% of PVA fiber along with several proportions of GO. Based on the research findings, the compressive strength of ECC mixtures containing varying proportions of GO decreases as the proportion of PVA fibers in the mixture increases. This decrease in the compressive strength of the ECC mixture is due to the incorporation of more PVA fiber, which stiffens the mixture and creates more spaces, thereby decreasing its compressive strength. In fact, the decrease in strength at higher fiber concentrations is due to the clumping action of fiber, which causes weak spots inside the mixture where there is a limited quantity of the cementitious matrix. Several investigations have demonstrated that flocculated GO nanoparticles are much less efficient than well-distributed GO sheets in enhancing the mechanical characteristics of the cementitious matrix, owing to the latter’s larger surface area utilization in enhancing hydration through nuclei action [40]. These findings are consistent with the results obtained by Kang et al. [74] and Wang et al. [75]. Bheel et al. [76] reported that the use of GO as nanoscale particles up to 0.05% is provided the highest compressive strength for a 28-day period.

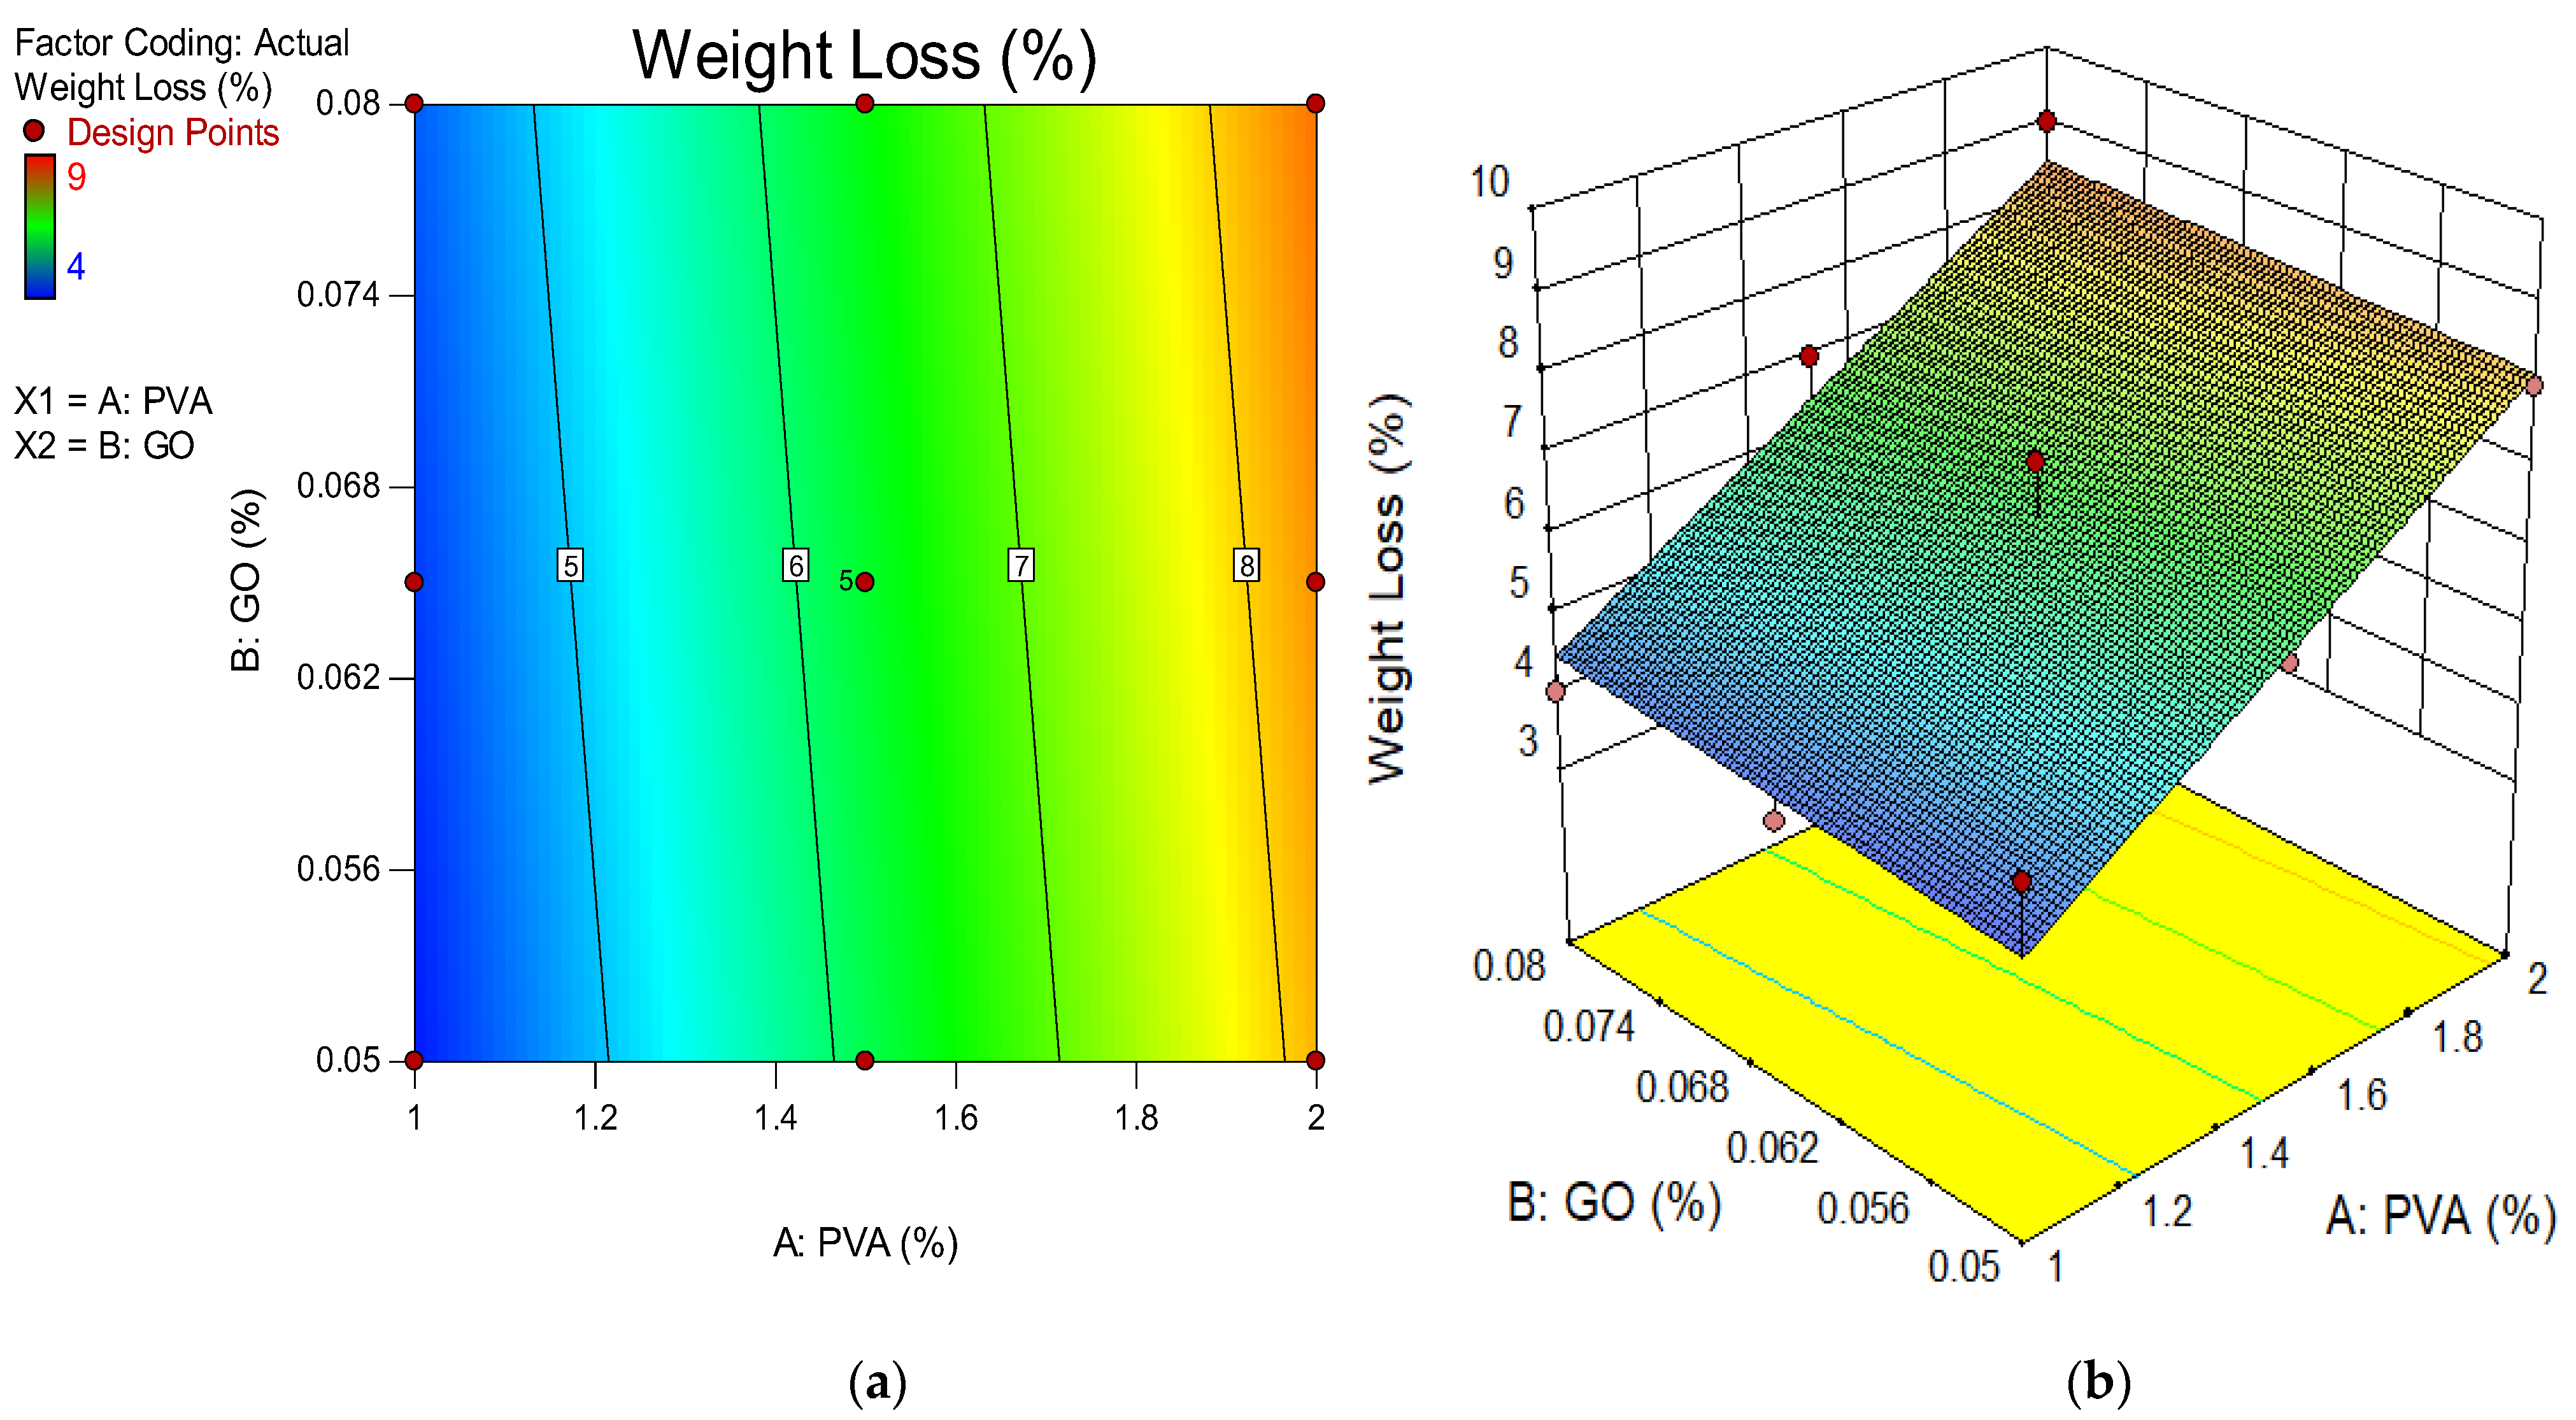
4.3. Weight Loss Due Acid Attack

Cubical samples made of GO-ECC were used to evaluate weight loss due to acid attacks. The weight loss of each specimen was measured for one month, and the findings are depicted in Figure 5. However, the maximum weight loss of GO-ECC blended with 2% of PVA fiber was recorded as 9% at 0.08% of GO, while the minimum weight loss of GO-ECC reinforced with 1% of PVA fiber was observed to be 4% at 0.08% of the nanoparticle over 28 days, consistently. The use of 1% PVA fiber by volume fraction in GO-ECC provided the minimum weight loss due to acid attack as compared to the weight loss of GO-ECC blended with 1.5% and 2% of PVA fibers in the production of GO-ECC. In addition, the trial mixes M2, M4, M7, M8, and M13 had comparatively more weight loss than the other trial mix proportions. Because it is alkaline, GO-ECC is susceptible to acid attacks. In the interaction between calcareous materials and acid, calcium salts are produced. The salts produce a decrease in ECC density and cement matrix cohesiveness. Moreover, calcium-silicate-hydrate (C-S-H) gels react with sulfuric acid to produce a fragile gel, thereby decreasing the GO-ECC’s strength. In addition, the composition of dissolved calcium salts (i.e., calcium sulfate) will result in the generation of reaction products including gypsum and ettringite. In the presence of these reaction products, the density of the ECC increased, which augmented the hydration reaction of the ECC mixture. Ettringite and gypsum lowered the ECC’s porosity even more. In other words, the ECC gained a little weight when subjected to an acidic environment [77]. The reaction that occurs when ECC is subjected to a sulphuric acid solution is represented by Equations (1) and (2) [78].
C a ( O H ) 2 + H 2 S O 4 C a S O 4 2 H 2
3 C a O 2 S i O 2 3 H 2 O + H 2 S O 4 C a S O 4 2 H 2 O + S i O H 4
The outcomes of this experiment may be attributed to how the concentrations of the two parameters, PVA and GO, fluctuate. The presence of more PVA particles in the ECC produced microcracking in the specimens, allowing acidic media to penetrate deeper. However, in the ECC reinforced with a lower proportion of PVA mixture, fewer fractures appeared and the component elements were less readily separated, resulting in a lower proportion of weight loss, owing to deterioration. The GO in the mixture also helped to improve the ECC’s durability performance whenever exposed to extreme conditions such as acidic environments. The mixtures with less GO exhibited larger proportions of weight loss owing to ECC degradation, while those with more GO were more durable. By assessing mixtures with the 1% PVA concentration but differing GO levels, the higher GO level generated superior weight loss outcomes.

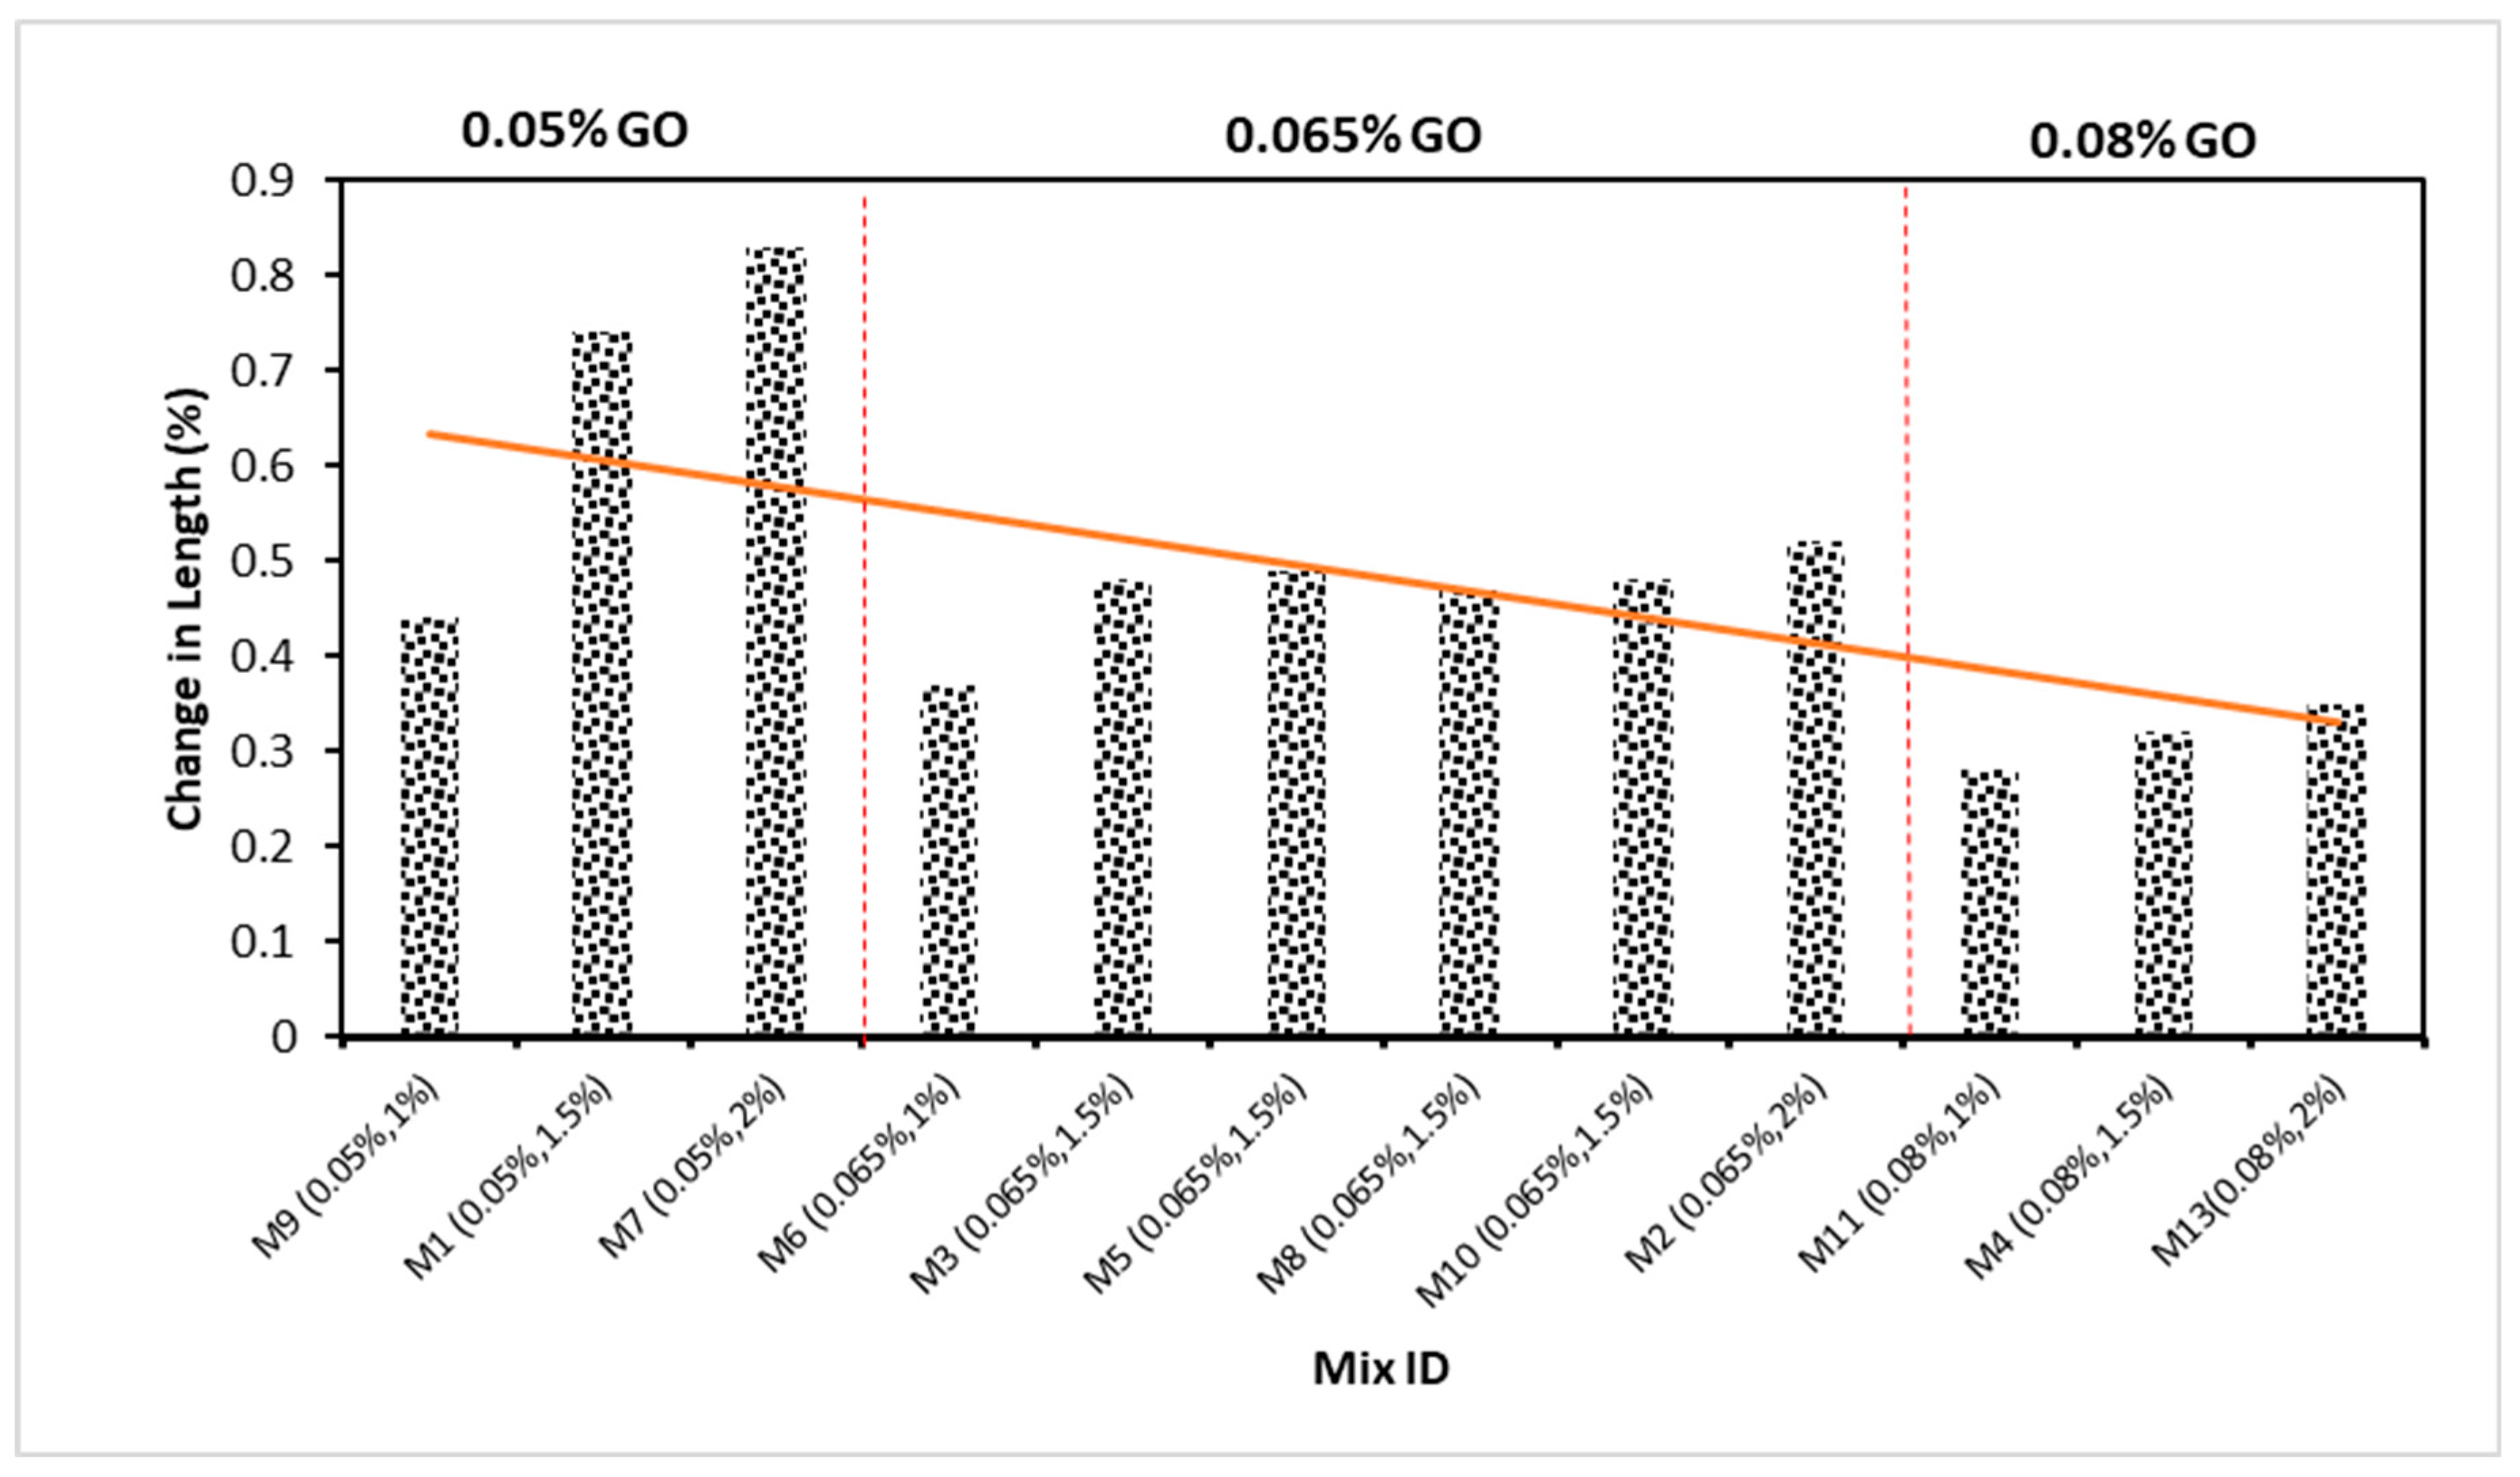
4.4. Change in Length Due to Acid Attack

The acid attack test was conducted on ECC prisms reinforced with various amounts of GO as a nanoparticle. The length change after 28 days was measured. The length change of samples exposed to acid assault at various intervals was reported. Variations in the length of the samples is a strong indicator of degradation. Samples submerged in the acid solution for 28 days were extracted, dried, and excess loose material was scraped from the surface using a wire brush. The length variation of the surface-cleaned samples was assessed using vernier calipers. Before being immersed in the acid solution, the length of the specimens was measured using digital vernier calipers, as seen in Figure 6. The acid resistance was evaluated based on variations in the physical aspects and change in dimension after 28 days of being subjected to exposure. However, the average change in length was measured by comparing the length of the prism samples before and after immersion in a 5% sulfuric acid solution dispersion after 28 days, respectively. Next, the percentage increase/decrease was computed. According to the findings, M11 (0.08% GO and 1% PVA) had the smallest average percentage of change in length at 0.28% while M7 (0.05% GO and 2% PVA) exhibited the greatest expansion, as measured by a change in length percentage of 0.83%. Moreover, M1 (0.065% GO and 1.5% PVA fiber), M2 (0.065% GO and 2% PVA), M3 (0.65% GO and 1.5% PVA fiber) and M7 (0.05% and 2% PVA fiber) exhibited the greatest change in length but these all-mixture values were lower than the control mixture after 28 days in the production of ECC, respectively. Similar trends were observed for ECC blends containing varying amounts of GO and crumb rubber as fine replacement ingredients. Nonetheless, the GO reduced the length change significantly [79]. These outcomes can be explained by the existence of PVA fiber at concentrations of 1%, 1.5%, and 2%, as well as the percentage of GO present in the range of 0.05% to 0.08%. Because of the presence of micropores around the sample surface, which allow for greater absorption of immersed media, mixtures with a greater PVA content exhibited a greater change in length. The greater the amount of PVA in a mixture, the greater the number of micro-voids, leading to more length change. This is consistent with the study’s conclusion that the change in length of ECC mixes containing more than 1% PVA was greater than that of the control sample. Moreover, the GO concentration had positive effects on lowering the length change of the ECC because it was resistant to the media’s infiltration by the acidic solution in ECC. Moreover, when acid was thrown at ECC composites with GO reinforcement, they were more resistant to breaking down. After 28 days, the GO-ECC demonstrated superior performance in terms of acid resistance. Gu, Bennett, and Visintin [80] made comparable observations, as did Chintalapudi and Pannem [81].

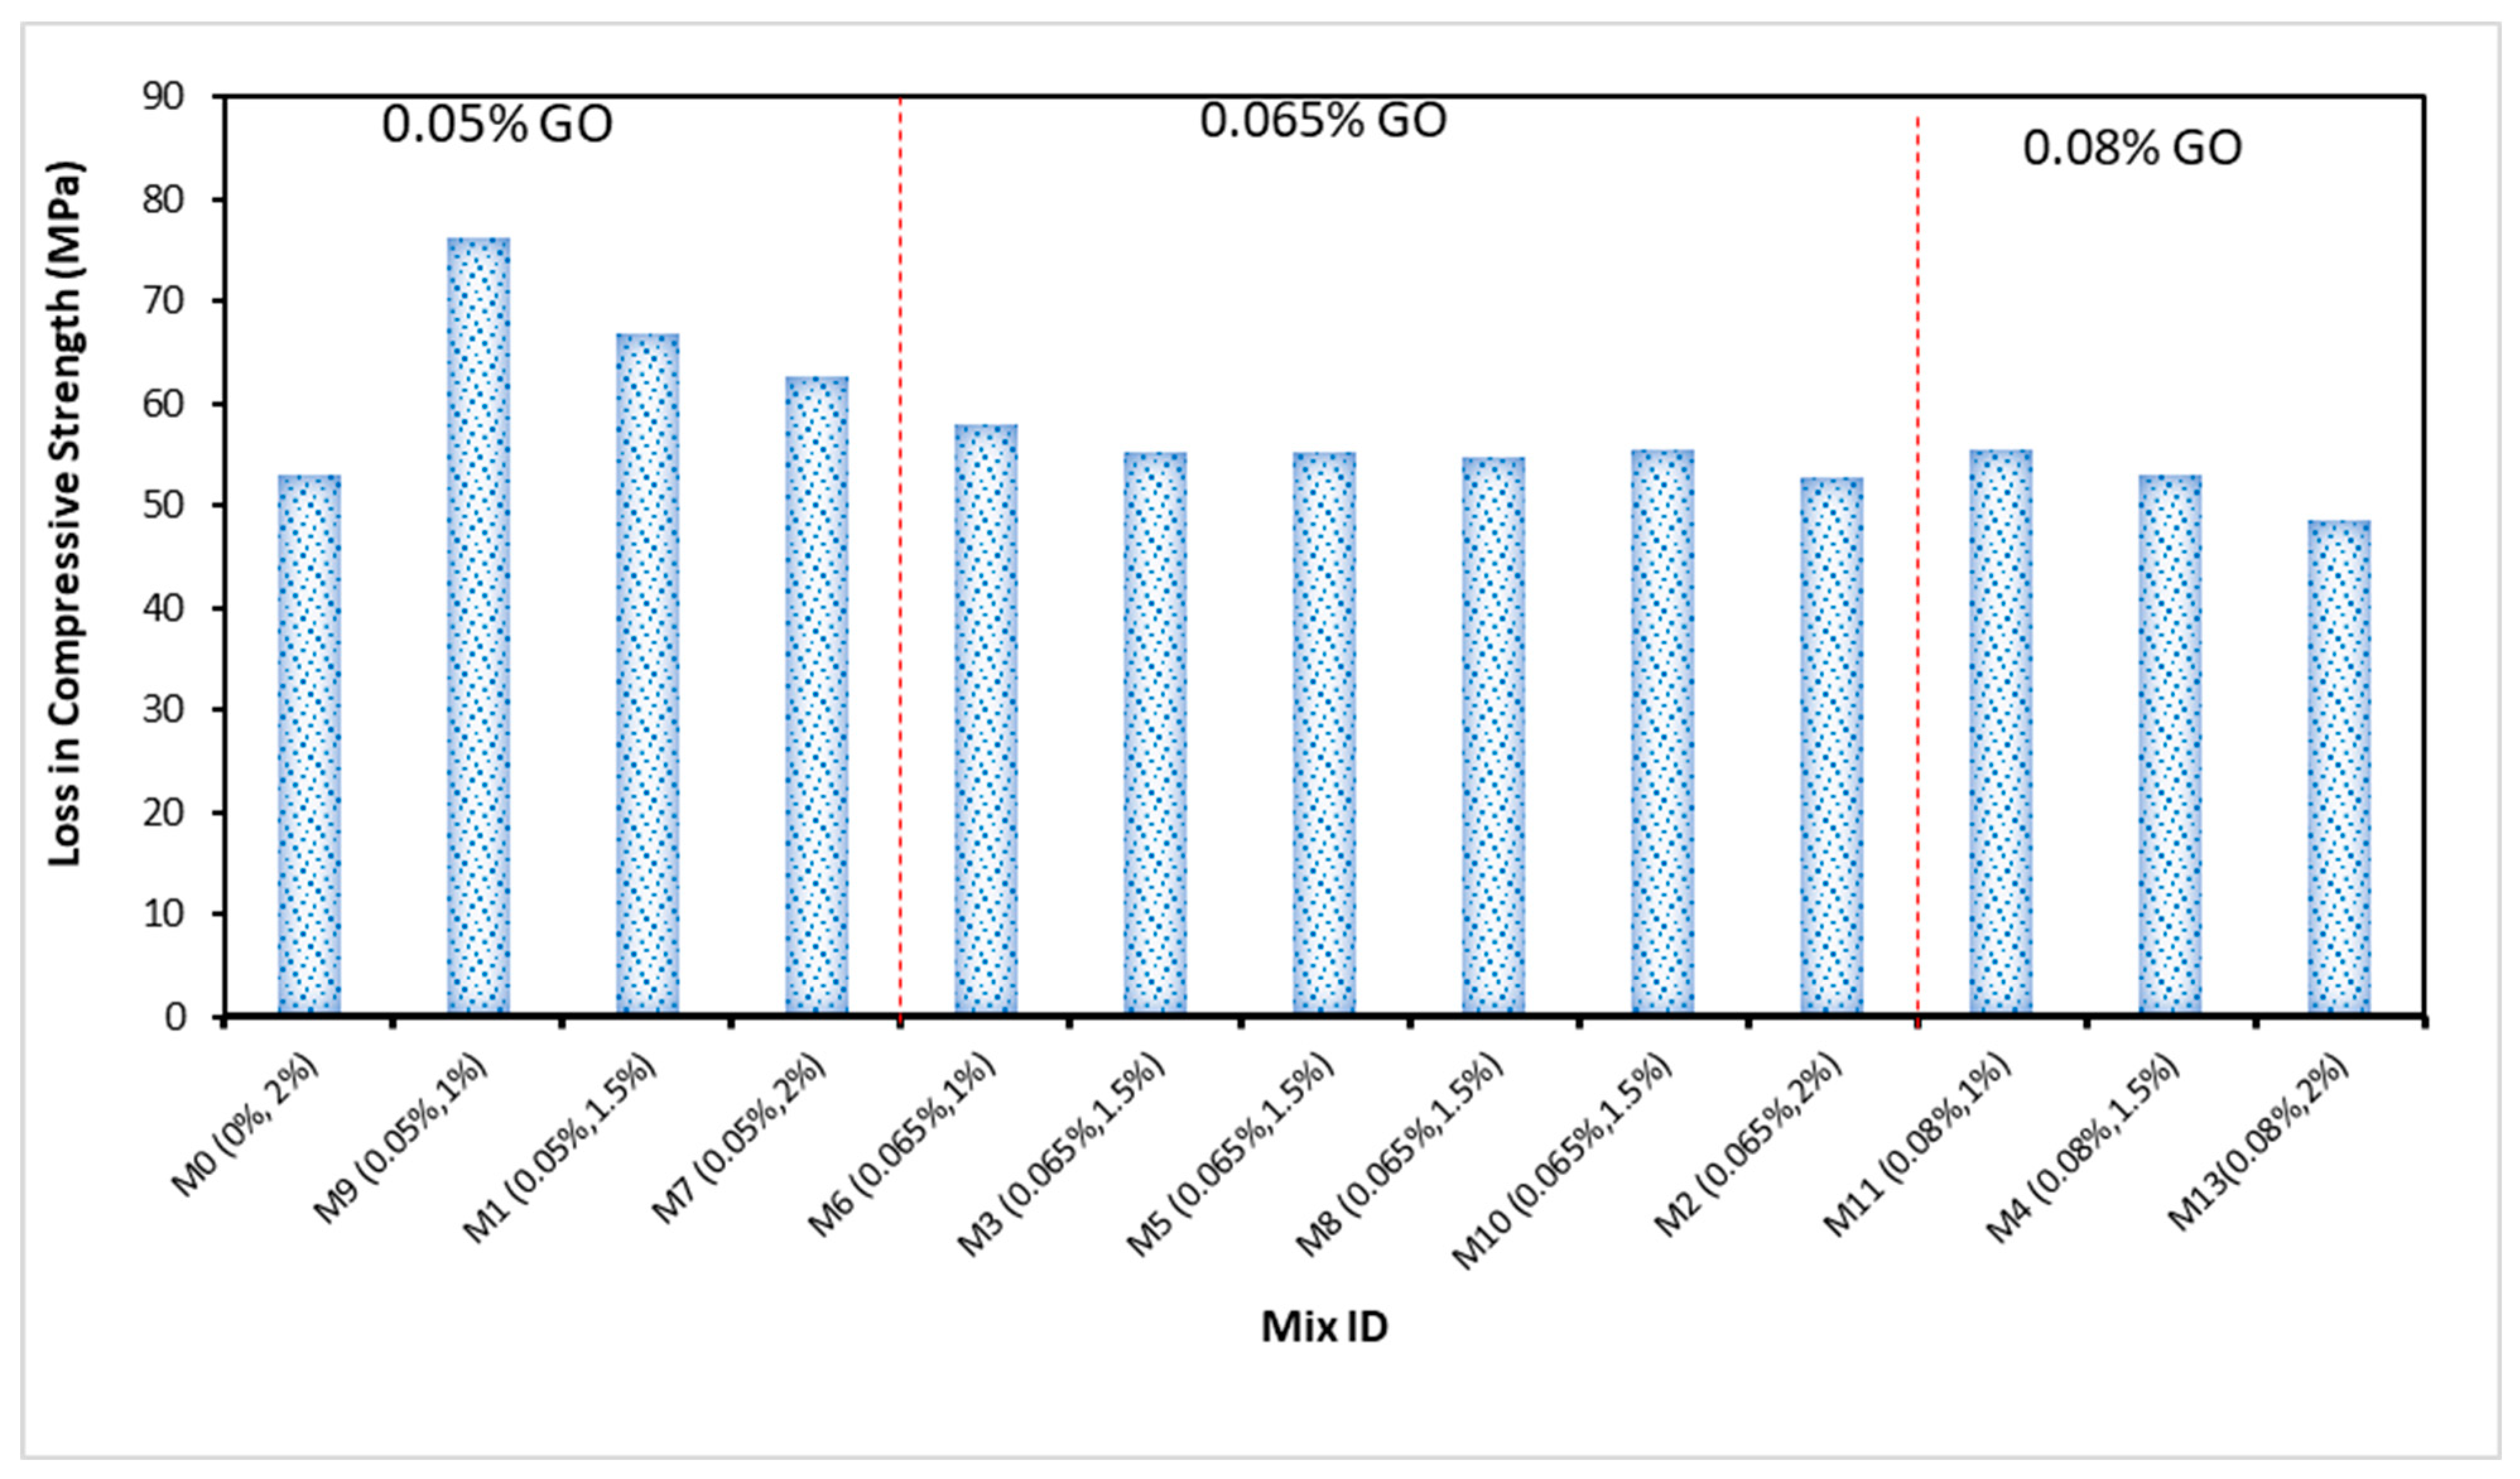
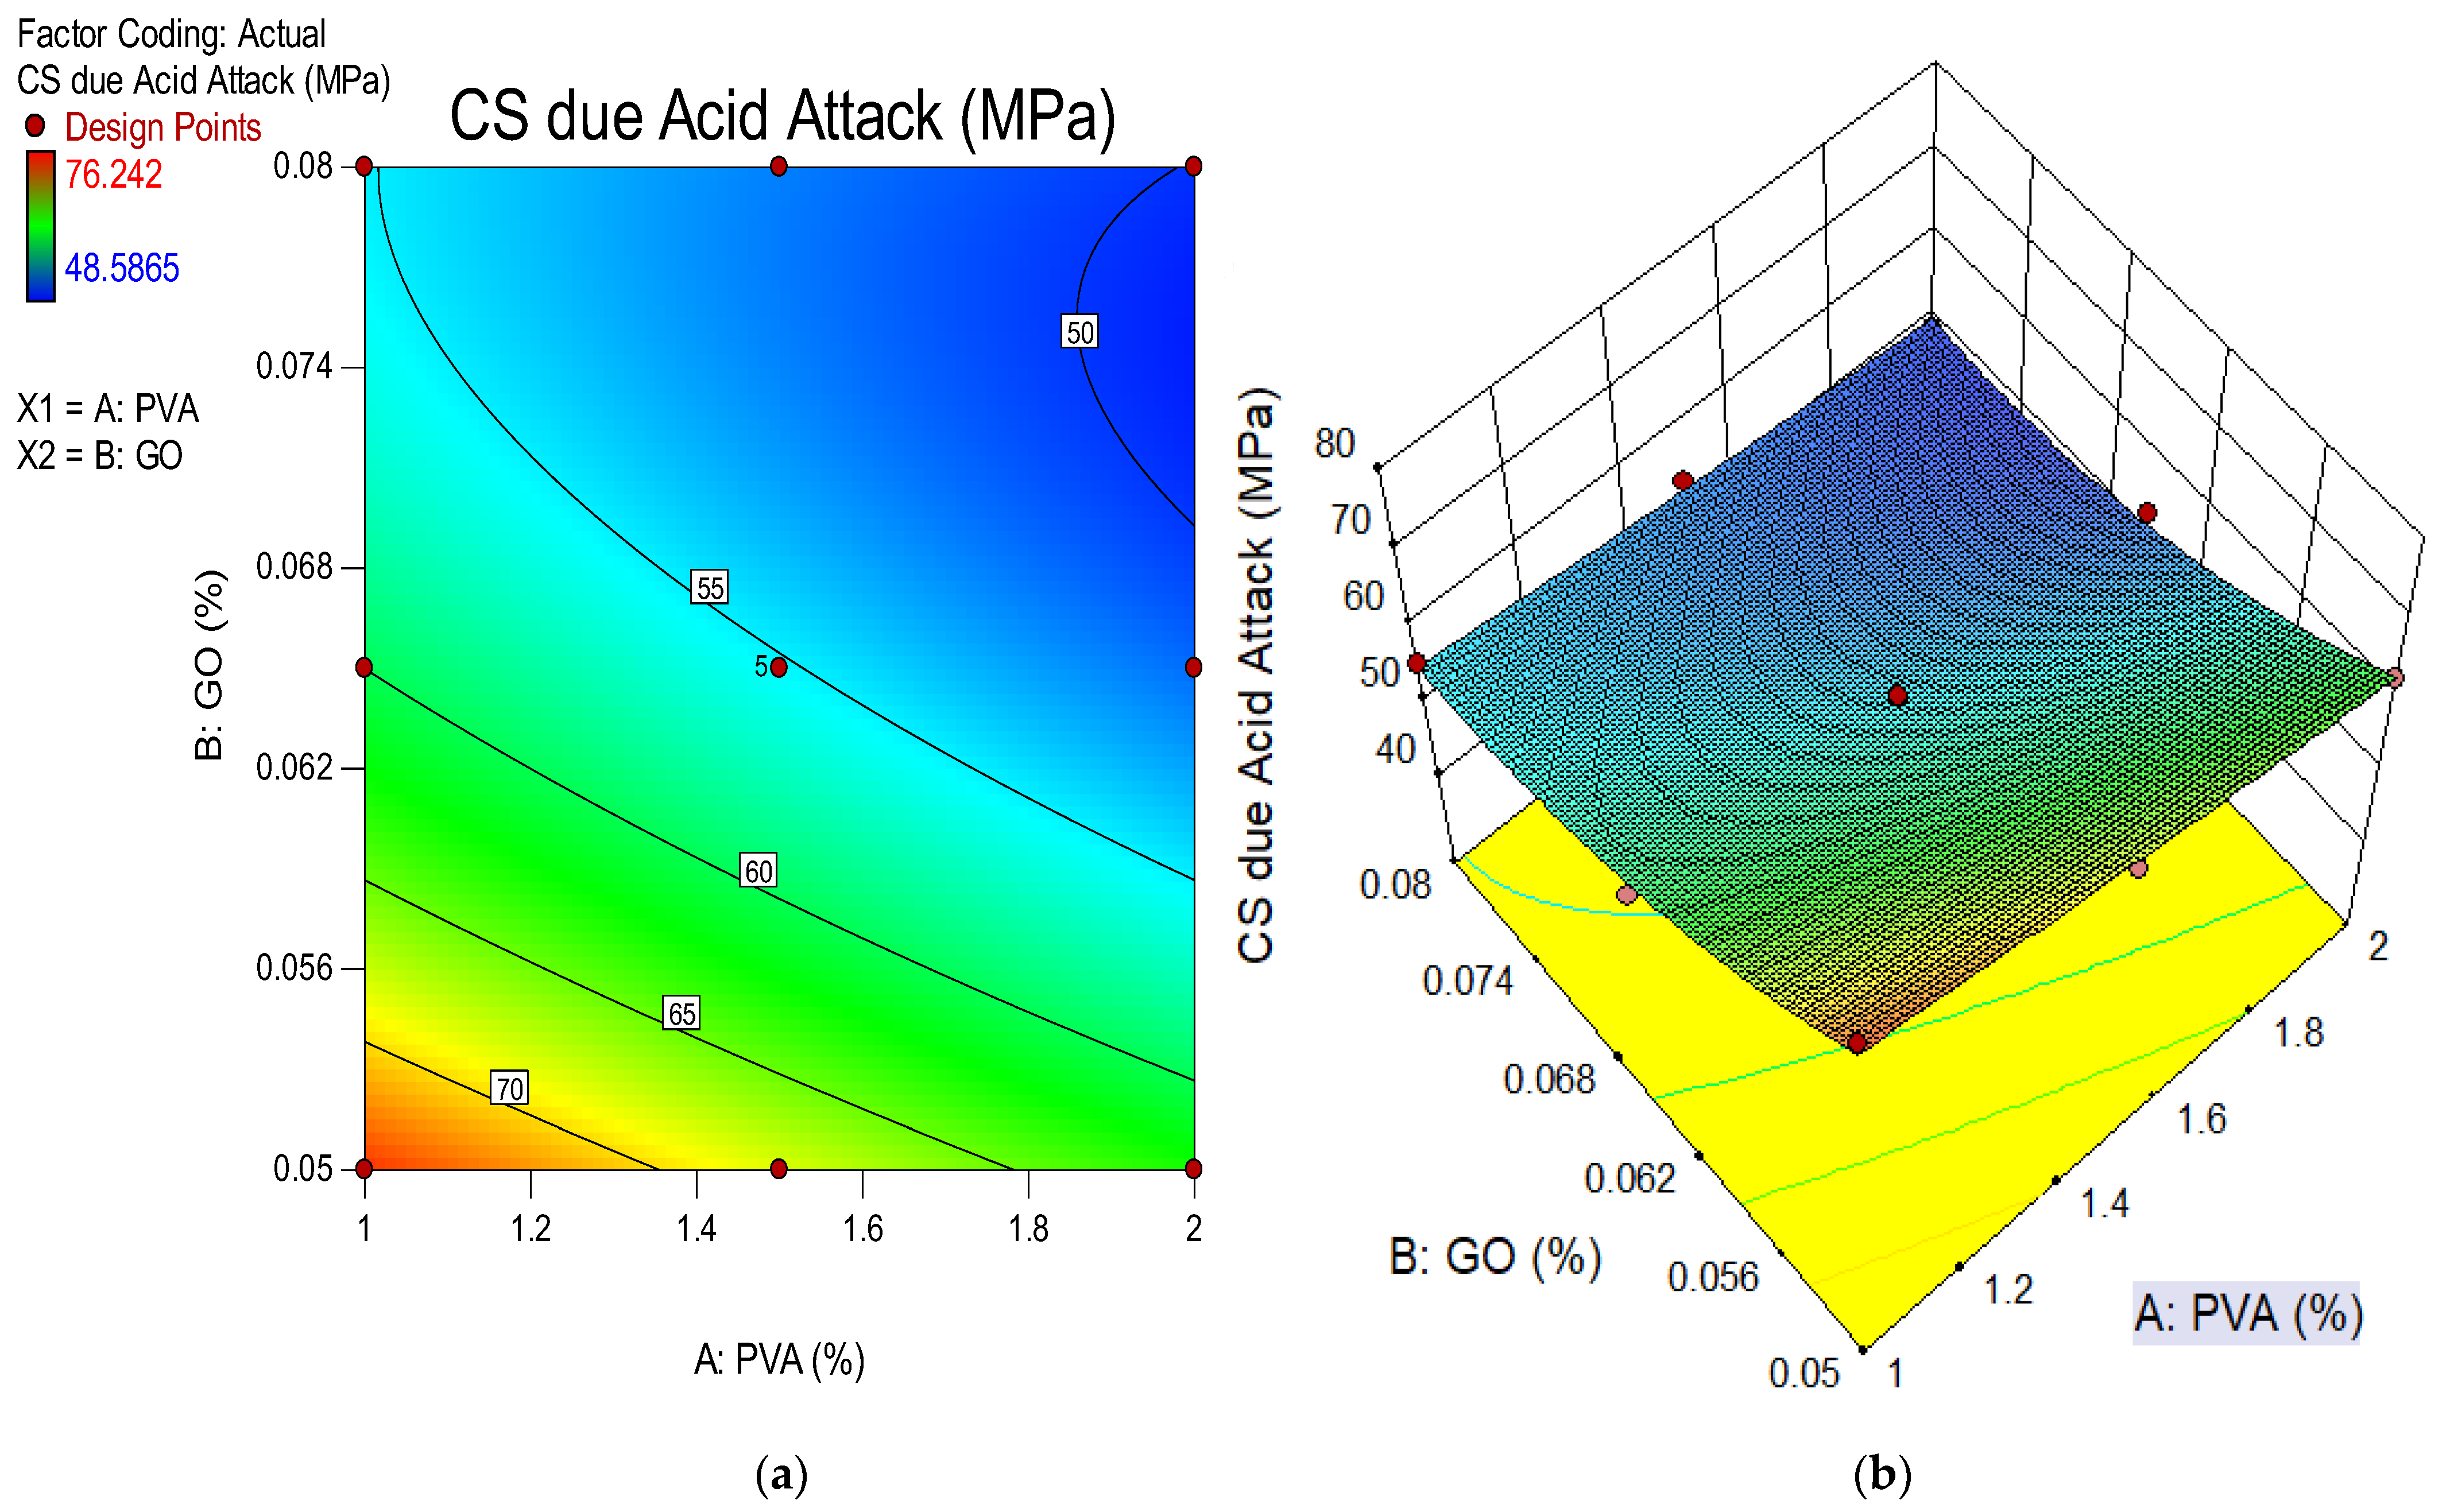
4.5. Compressive Strength Due to Acid Attack
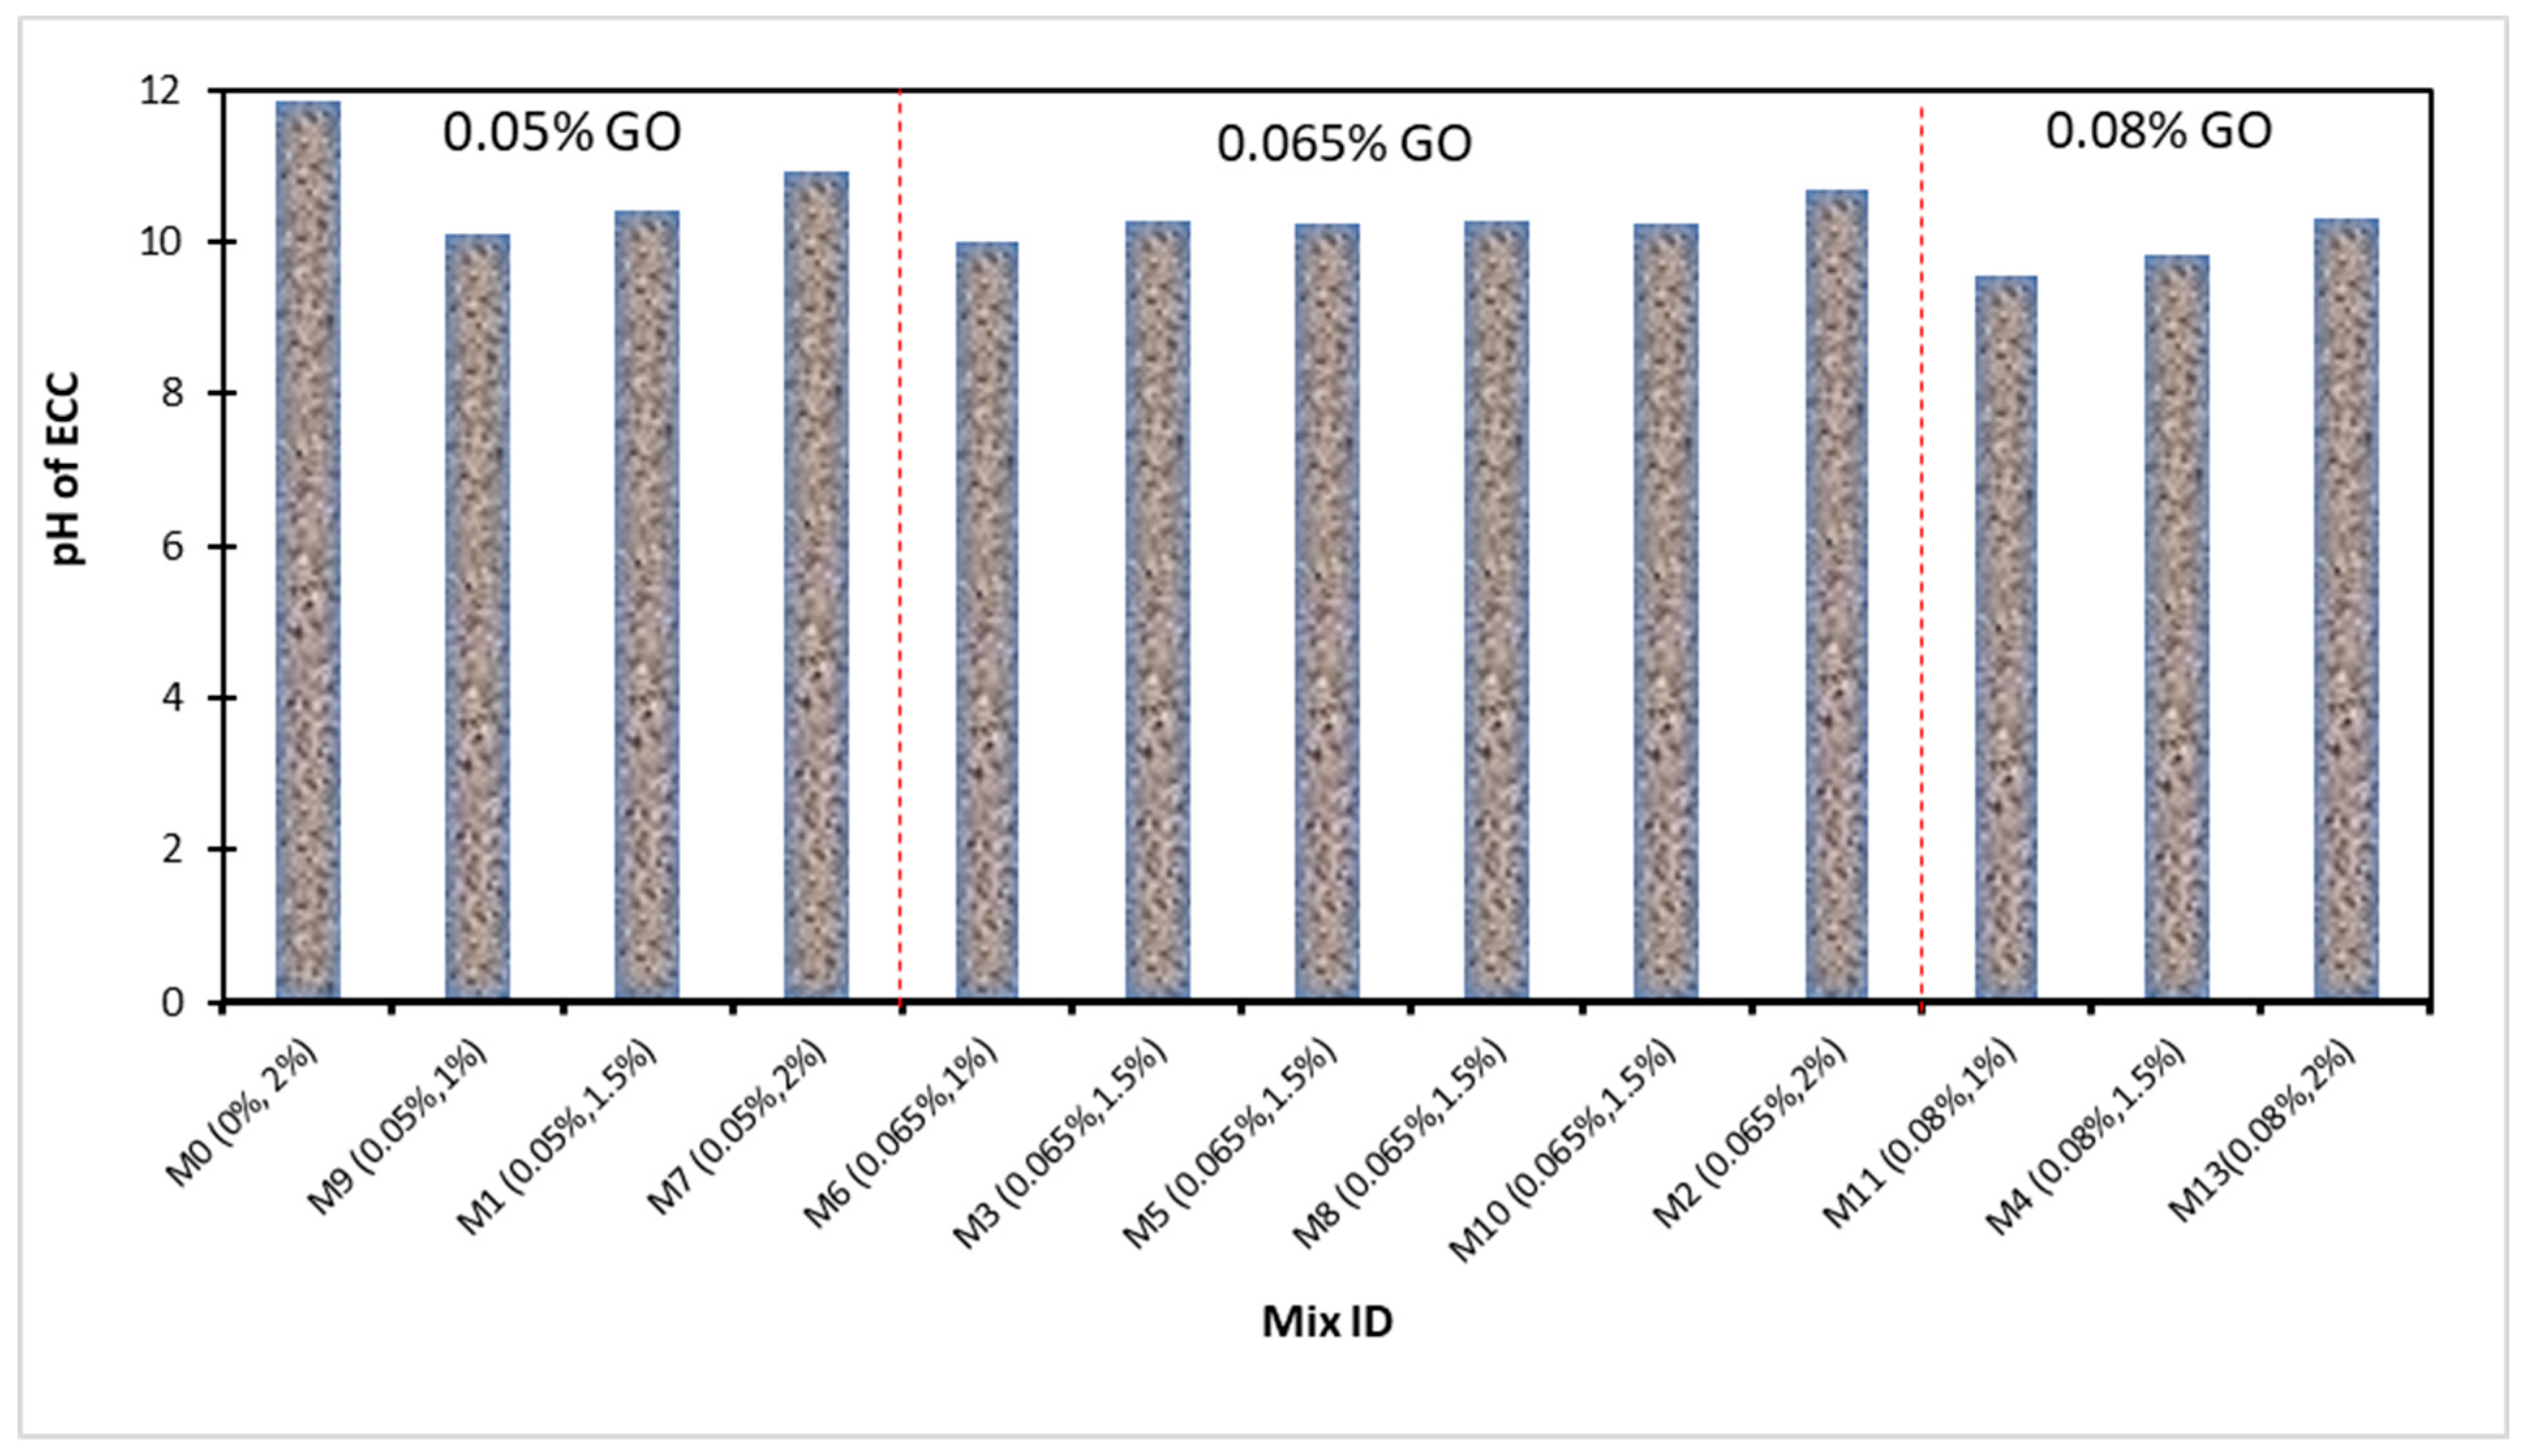
Figure 7 depicts the outcome of a compressive strength analysis conducted on ECC samples treated to acidic attack for 28 days. For the prepared GO-ECC samples, a measurement for strength properties after an acid attack was extremely important for determining the harshness of the acid attack’s impact and the degradation rate. Samples submerged in a 5% solution of sulfuric acid for 28 days were subjected to compressive strength testing. Figure 7 displays the mean compressive strength of the control samples as well as samples exposed to a 28-day acid assault and their percentage reduction in compressive strength. A standard control sample lost up to 12% of its compressive strength. After 28 days, the acid assault caused the compressive strength loss of ECC reinforced with 1% PVA to be decreased for 0.05% of GO nanoparticles to as low as 3%. After being exposed to an acid attack for 28 days, the compressive strength loss in the GO-ECC sample, which contained 0.05% GO by weight of cement, decreased. Also, the usage of GO as a nanoparticle increased in the ECC combination offered less strength loss from acidic assault than the reference mixture’s compressive strength. In addition, the accumulation of 0.05 percent GO in the ECC mixture increased hydration in its mechanical characteristics, including compressive strength. In addition, when exposed to 28 days of acid attack, the GO-ECC sample exhibited superior resistance to degradation and compressive force resistance. The GO-ECC samples with a 0.05 percent GO concentration exhibited a 3% reduction in compressive strength loss. The incorporation of composite GO as a nanomaterial in ECC formulations resulted in a significant decrease in degradation and an improvement in sulfuric acid resistance. The loss of compressive strength is attributed to a rise in micro-voids and porosity in the acid-attacked concrete samples [82]. Similar findings were reported by Aiken et al. [83] and Chintalapudi and Pannem [81]. Figure 8 illustrates the strong correlation between compressive strength and compressive strength due to acid attack at day 28. If a single one of these parameters exists, the formulas displayed in Figure 8 may be used to predict compressive strength or compressive strength due to acid attack.

4.6. pH Test

The measurement of the pH value of ECC is crucial for the evaluation of acidic assaults that might lead to severe harm to reinforced concrete, since embedded steel displays long-term durability only at pH values of 9 or above. Data from the concrete samples made of ECC incorporating 0.05% to 0.08% of GO as a nanoparticle for monitoring the pH value after 28 days consistently are shown in Figure 9. The pH values of ECC reinforced with 1% of PVA fiber were recorded as 10.10, 10.01 and 9.55 with 0.05%, 0.065% and 0.08% of GO as a nanomaterial, respectively, which were lower than that of control mixture over 28 days consistently. Similarly, the pH outcome was 10.40, 10.24, and 9.82 with 0.05%, 0.065% and 0.08% of GO as nanoparticle, respectively, in the ECC reinforced with 1.5% of PVA fiber, which was a lower pH value compared to control mixture at 28 days consistently. It was shown that the use of 1% of PVA fiber in ECC accumulation with several different amounts of GO as a nanoparticle provided a lower pH value as compared to the 1.5% of PVA fiber in the production of ECC with the addition of several different amounts of GO as a nanoparticle. Moreover, the pH values of ECC blended with 2% of PVA fiber were 10.91, 10.68, and 10.32 while using 0.05%, 0.065% and 0.08% of GO as a nanoparticle, respectively, and the pH values for all mixtures were lower than that of the control mixture on 28 days consistently. The findings showed that the accumulation of PVA fibers increases in the production of ECC incorporating various amounts of GO as a nanoparticle increased the pH value but these all-pH values were observed to be lower than the pH value of the control mixture. Moreover, the pH value of ECC reinforced with several amounts of PVA fiber was reduced when the quantity of GO as a nanoparticle increased in the mixture. This reduction in the pH value of ECC reinforced with various amounts of PVA fiber was due to the filling effect of GO as a nanomaterial, which seals the pores of ECC to prevent the acid attack and environmental impacts on the ECC, which results in reducing the pH value. According to Wan et al. [84], carbonation reduces the pH value from approximately 13.2 to as low as 8.0. The conclusion is that carbonation not only decreases the pH value but also releases bound chloride. This is one of the most evident reasons why the combined effect of chloride ingress and carbonation speeds the corrosion of steel and reduces the operational life of buildings constructed of reinforced concrete. Kumari et al. [85] showed that when the fraction replacement of nanomaterials increased by up to 2%, the pH value of concrete climbed and then progressively dropped. A similar kind of observation was made by Zeng et al. [86]. Figure 10 illustrates the strong correlation between weight loss and pH tests due to acid attacks at day 28. If a single one of these parameters exists, the formulas displayed in Figure 10 may be used to predict weight loss or pH tests due to acid attacks.

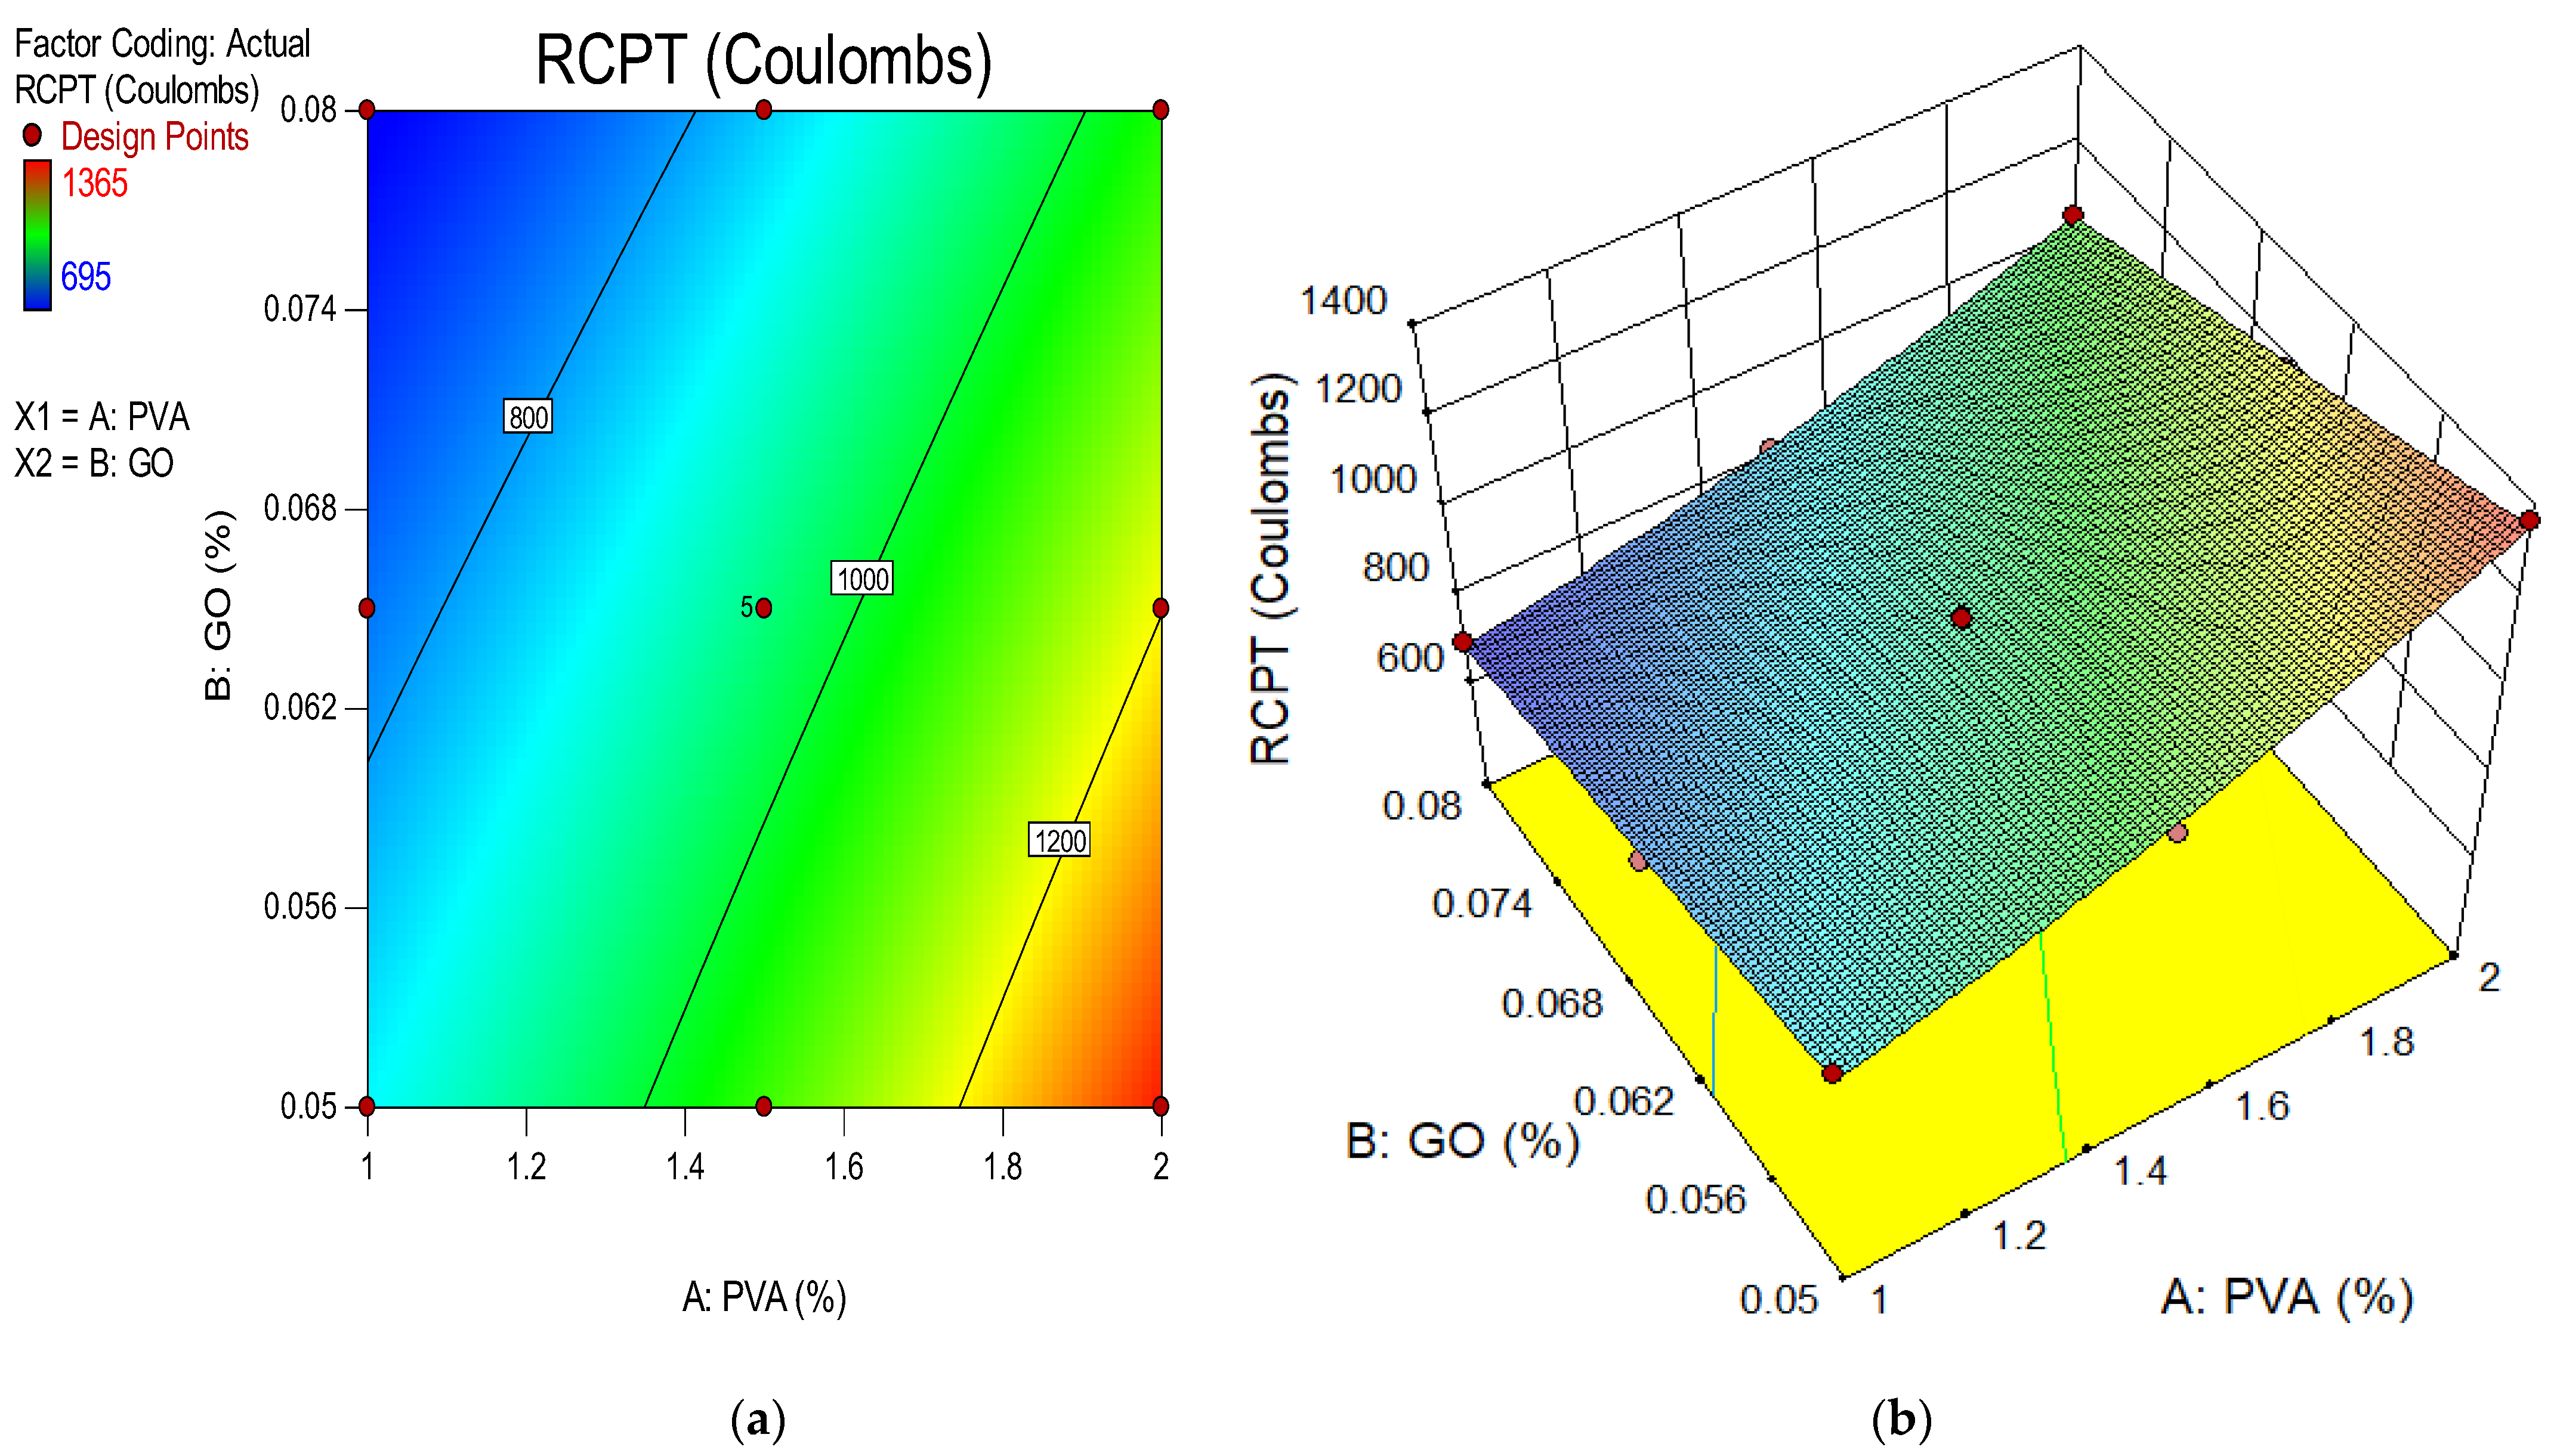
4.7. Rapid Chloride Penetration Test (RCPT)

This study’s objectives included investigating the effect of nanomaterials on the water transport characteristics of ECC. Thus, the impact of water transport on the diffusion coefficients was studied and compared. When chloride ions permeate mortar or ECC, they should bind to various hydration products. Consequently, total chloride ions entering the ECC mixture are composed of both free chloride ion concentration in the pore spaces and bound chloride ions. Free chloride ions moving through ECC pores and penetrating rebar start the rusting process. In the present study, the chloride permeability, which is reliant on two variables, such as the w/c ratio and the chemical characteristics of the concrete [87], was determined as acid-soluble chloride (total chloride) in conformity with ASTM C1202 [62].
In this investigation, the applied current discharged over 6 h was recorded as a measurement of chloride permeability. Figure 11 demonstrates the RCPT measurements of 28-day-hydrated ECC mortars in terms of the charge discharged. At 28 days, the RCPT values for the control mixture and a composition comprising GO nanoparticles with low chloride permeability according to ASTM C1202 [62] ranged from 695 to 1650 coulombs. In addition, the inclusion of GO nanoparticles significantly decreased the charge on the ECC mixture. Furthermore, the synthesis of ECC with a higher GO concentration reduced the chloride ion permeability. The RCPT values of ECC mixture blended with 1% of PVA fiber was recorded as 880 Coulombs, 748 Coulombs and 695 Coulombs at 0.05%, 0.065% and 0.08% of GO as a nanomaterial, which is lower than control mixture of ECC after 28 days, respectively. Similarly, the RCPT value of ECC reinforced with 1.5% of PVA fiber at 0.05%, 0.065% and 0.08% of GO as a nanoparticle were recorded as 1042 Coulombs, 955 Coulombs and 820 Coulombs, respectively, which were lower values when compared to the control mix at 28 days.
The RCPT value of ECC mixture blended with 2% of PVA fiber for 0.05%, 0.065% and 0.08% were lowered by 17.27%, 28.24% and 36.36%, respectively, concerning the control specimen after a period of 28 days. The researchers found that the making of ECC involving increasing amounts of GO nanomaterials caused a reduction in the RCPT of the ECC mixture. This reduction in RCPT values is attributable to the microstructural densification and decreased microporous interconnectivity of ECC. It was anticipated that GO, as nanoparticles with nanoscale dimensions, would be capable of developing a packed and compact microstructure that exhibited greater chloride penetration resistance. Khotbehsara et al. [87] wrote about how nanomaterials such as SnO2, ZrO2, and CaCO3 can be used to determine the RCPT in self-compacting mortar. Yet, the RCPT value decreased with increasing nanomaterial concentrations up to a specific limit. As stated earlier, nanomaterials work as fillers to fill the holes and increase the density of the structure. Moreover, they aid in accelerating hydration. Thus, a more developed pore structure is attained sooner, resulting in less chloride ion transport. These findings demonstrate the need for adding nanoparticles to cement mortars in order to increase their resistance to chloride ion infiltration. A part of the chloride ions interacts with the cementitious matrix and binds, resulting in a decrease in the rate of diffusion. Schwarz and Neithalath [88] observed that the chloride permeability of concrete mixes with glass powder was lower than that of the control sample. Miyandehi et al. [89] reported that the addition of copper oxide nanoparticles significantly reduced the amount of the transmitted charge.

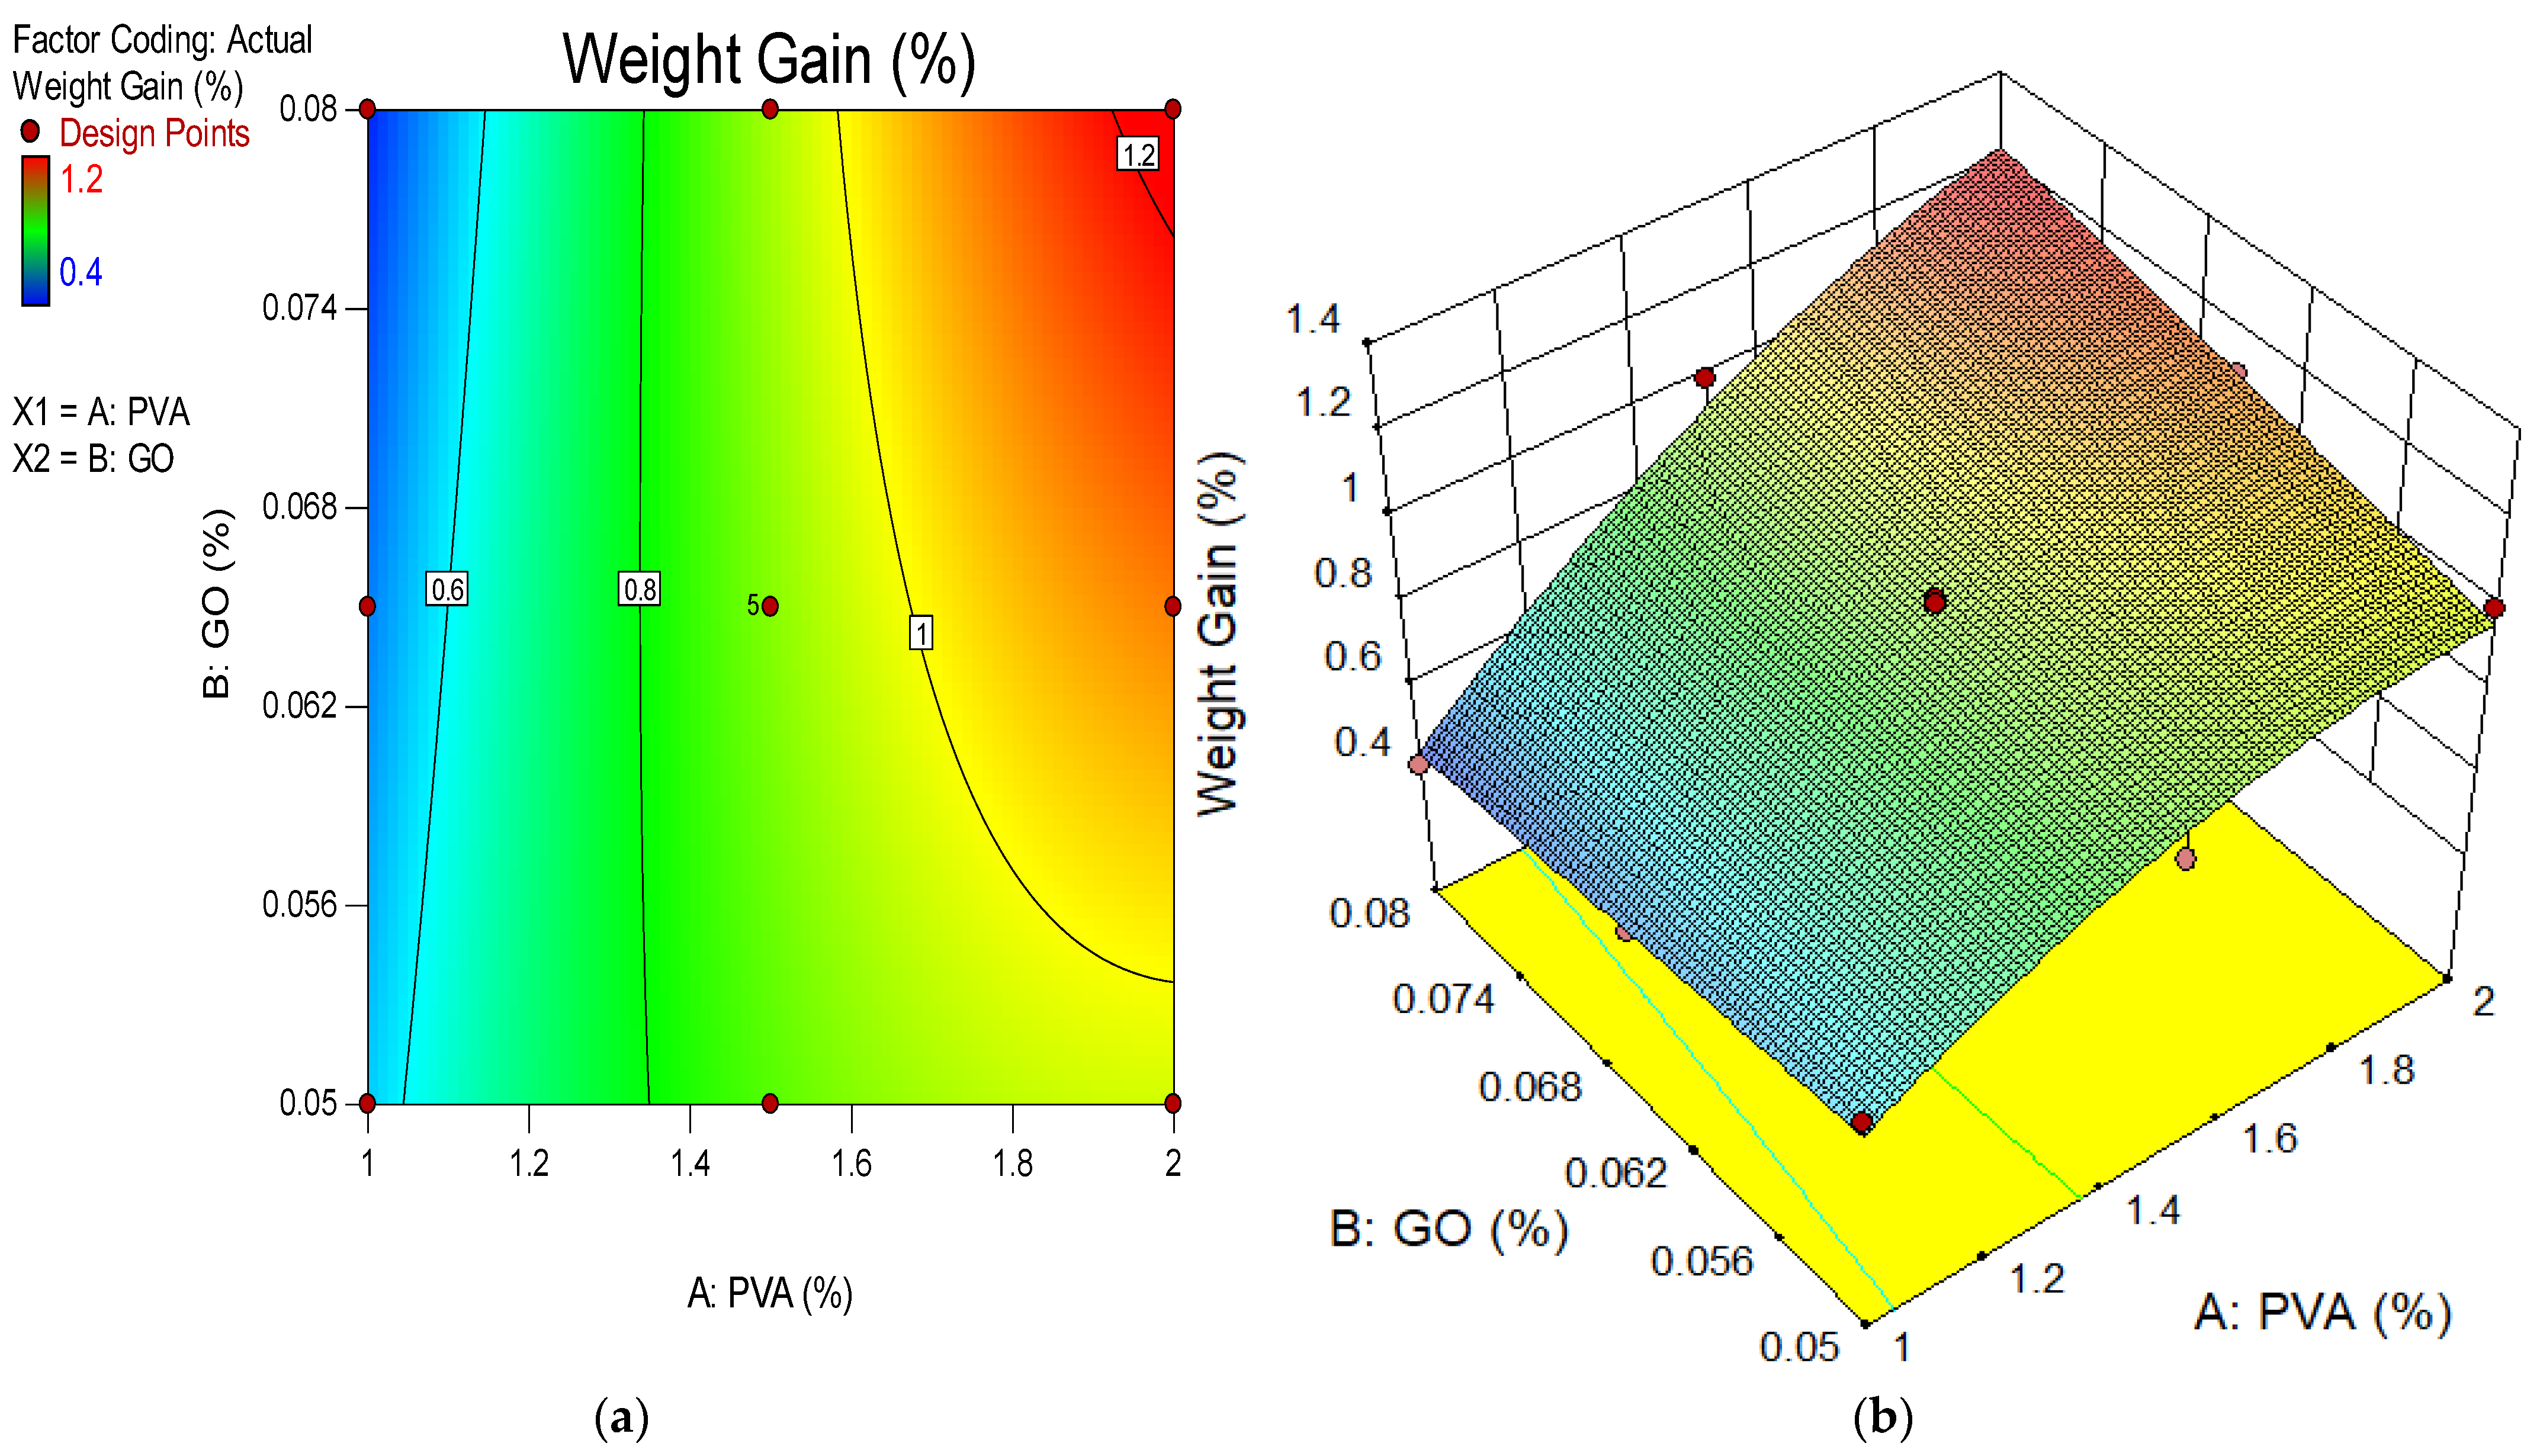
4.8. Weight Gain Due to Sulphate Attack

The sulphate resistance test was conducted on ECC specimens reinforced with 1, 1.5%, and 2% PVA fiber, with varying amounts of GO nanomaterial. The study was performed using samples immersed in a 5% sodium sulphate (Na2SO4) mixture. The sulphate resistance was evaluated based on variations in physical aspects and weight after 28 days of being subjected to exposure. For reference, specimens were also submerged in distilled water. After 28 days of exposure to sodium sulphates, minute changes were seen in the GO-ECC specimens. The weight change of GO-ECC specimens exposed to sodium sulphate for up to 28 days is shown in Figure 12. Figure 12 shows the results of the sulphate assault on the proportional change in mass of the samples of the reference mix of ECC and the ECC mixture integrating varied contents of GO as nanomaterials compared to the original weight of the samples at 28 days of curing. The percentage gain in mass was comparatively high for the ECC mixture without the addition of GO. However, the mass gain of the ECC mixture incorporated with 1% of PVA fiber was reduced when the content of the GO was increased in the mixture by up to 0.08% at 28 days. This reduction in the weight change of ECC blended with 1% of PVA fiber is due to the fine particles of GO, which fills the pore spaces and harden the ECC, which resulted in a reduction the penetration of the sulfate attack in the GO-ECC specimen. On the other hand, the reduction in the percentage change in mass may be attributed to the activity of the wick, which permits the sulphate solution to penetrate the concrete through diffusion and capillary action. It reveals and degrades the surface by evaporating the sulphate ion crystallized on the concrete’s outermost layer. In addition, the mass gain of ECC mixture blended with 1.5% and 2% of PVA fiber increased as the quantity of GO as a nanoparticle was increased in ECC but the weight gain for all GO-ECC mixtures were decreased when compared with the control mixture after 28 days. This increment in weight change is due to the increase in the content of the PVA fiber in ECC which produced microcracking in the specimens, allowing sulfate media to penetrate deeper. However, in the ECC reinforced with a lower proportion of the PVA mixture, fewer fractures appeared and the component elements were less readily separated, resulting in a lower proportion of weight change owing to deterioration. The GO in the mixture also helped to improve the ECC’s durability performance whenever exposed to extreme conditions. Furthermore, the mixtures with less GO exhibited larger proportions of weight gain in the GO-ECC reinforced with 1% of PVA fiber owing to ECC degradation, while those with more GO were more durable. By assessing mixtures with a 1% PVA concentration but differing GO levels, the greater GO level generated superior weight change outcomes. Similar kind of investigations were performed by Devi et al. [35] and Luhar et al. [90].

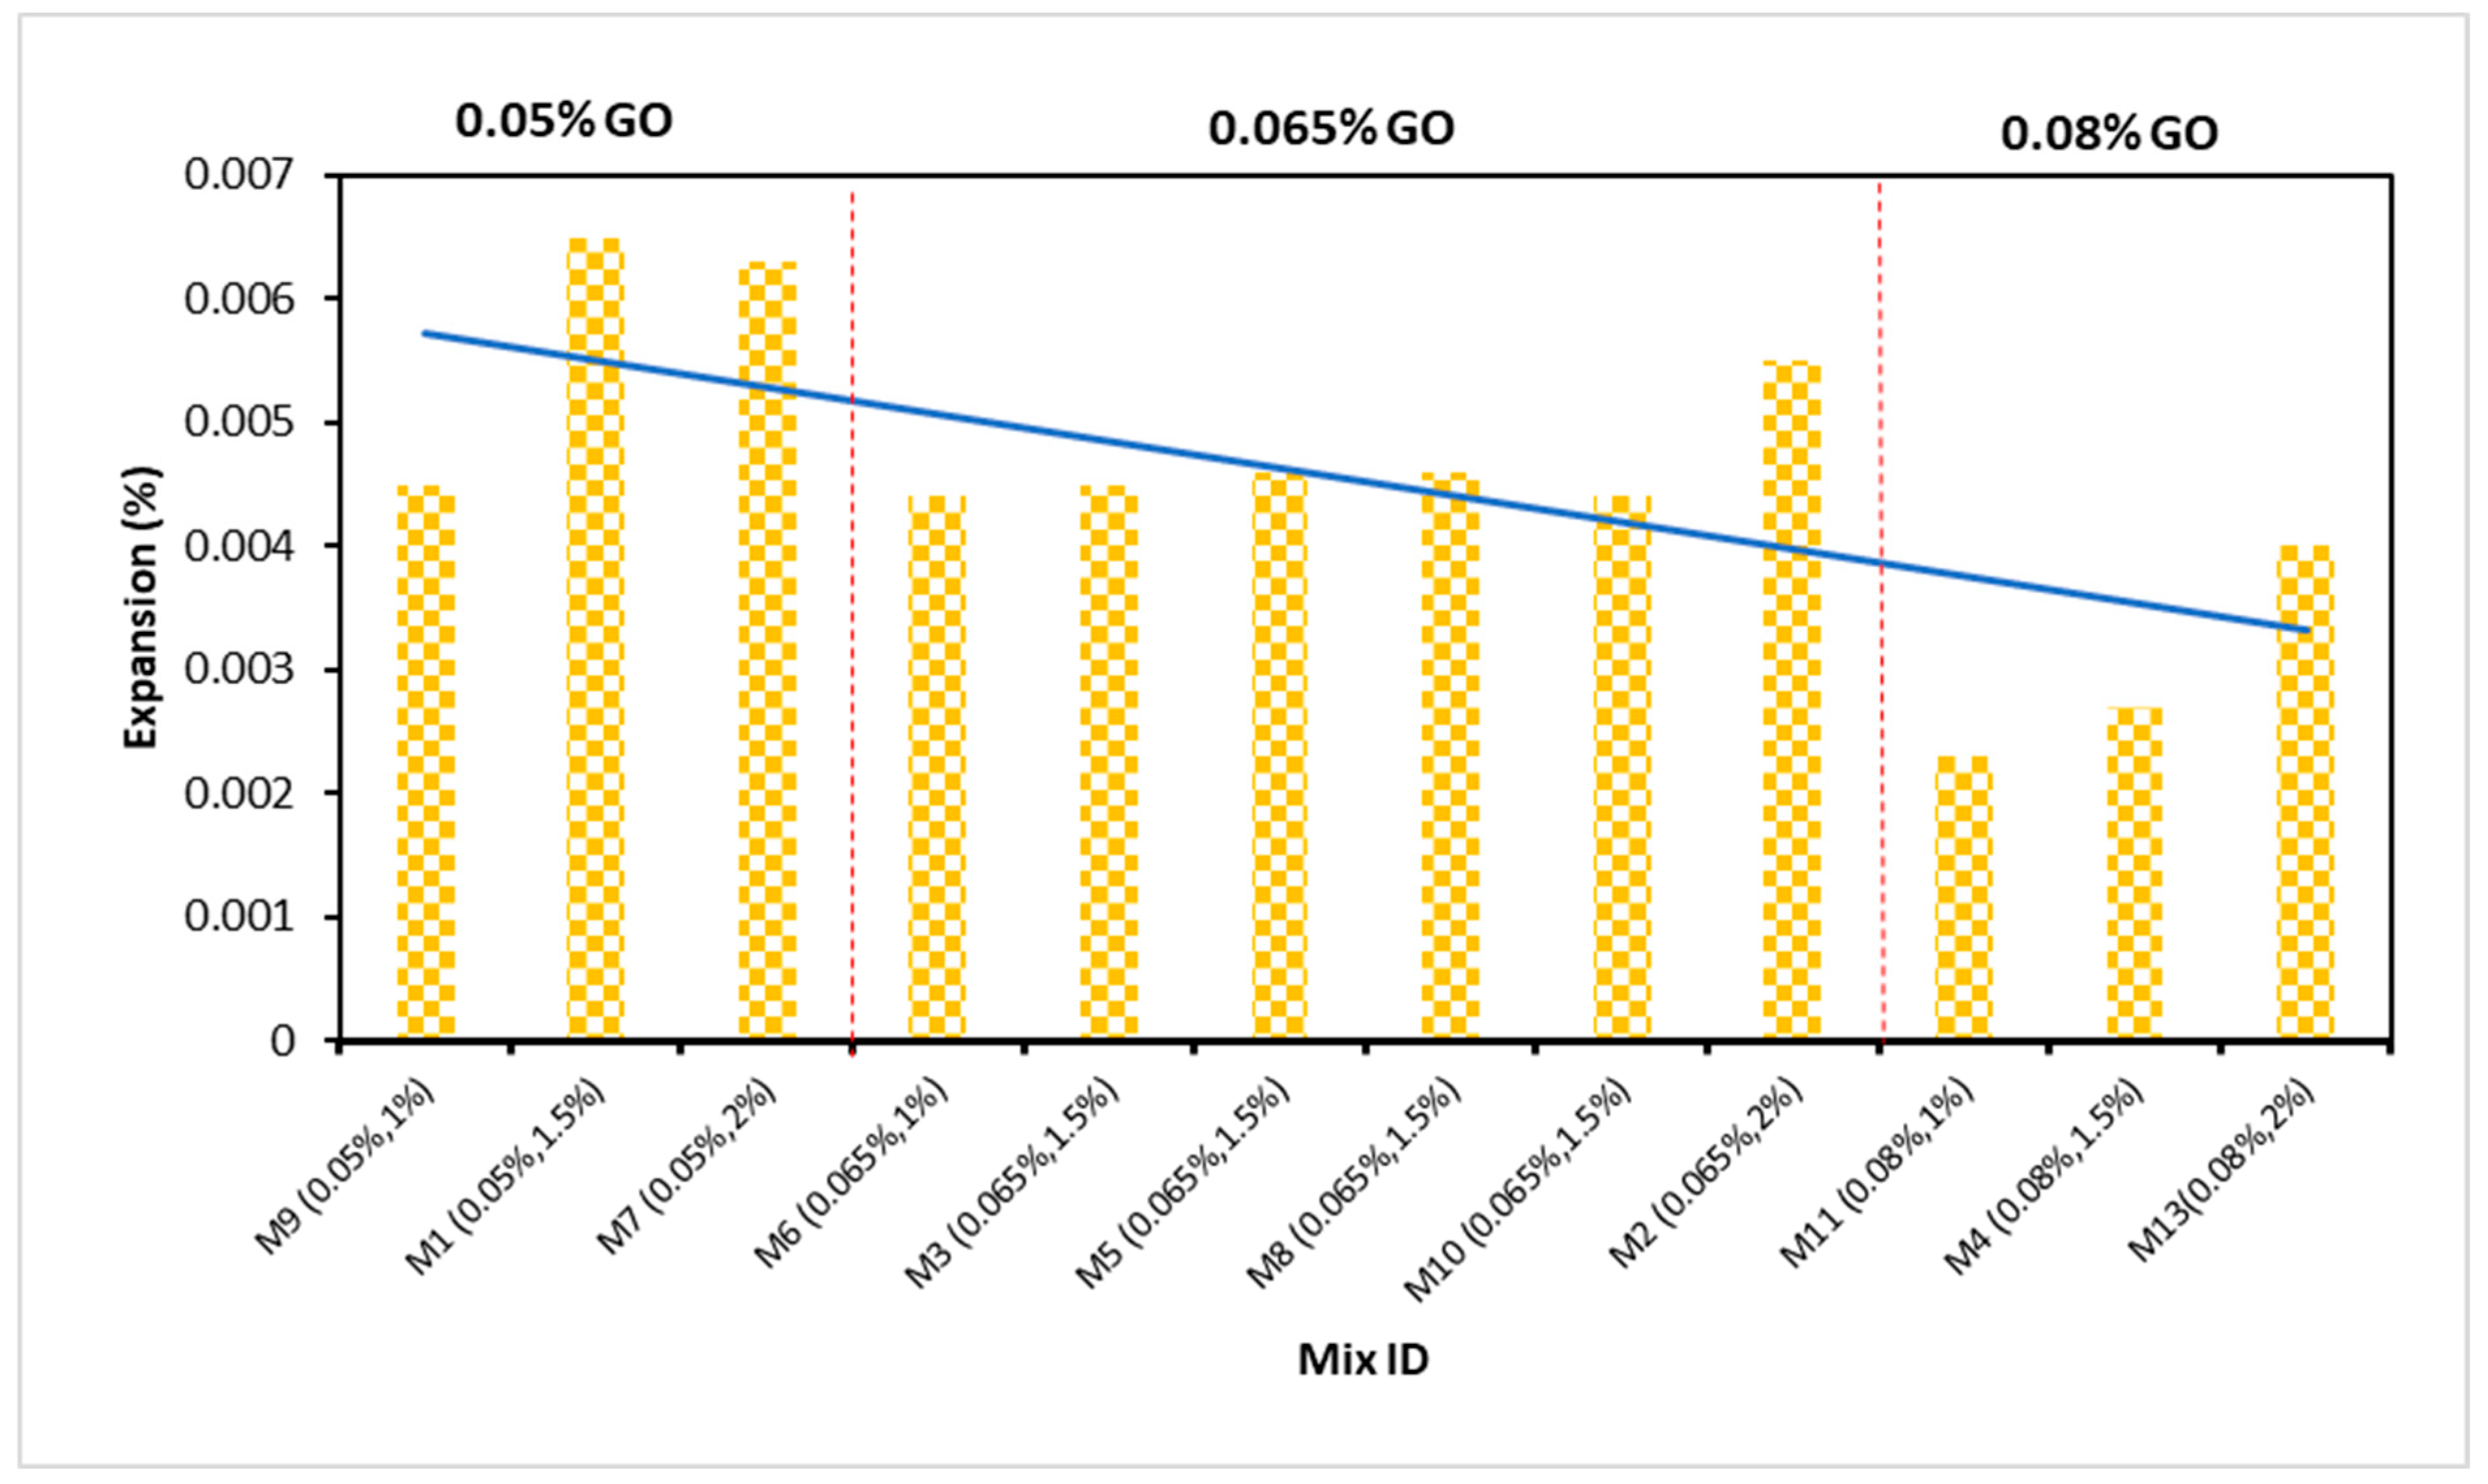
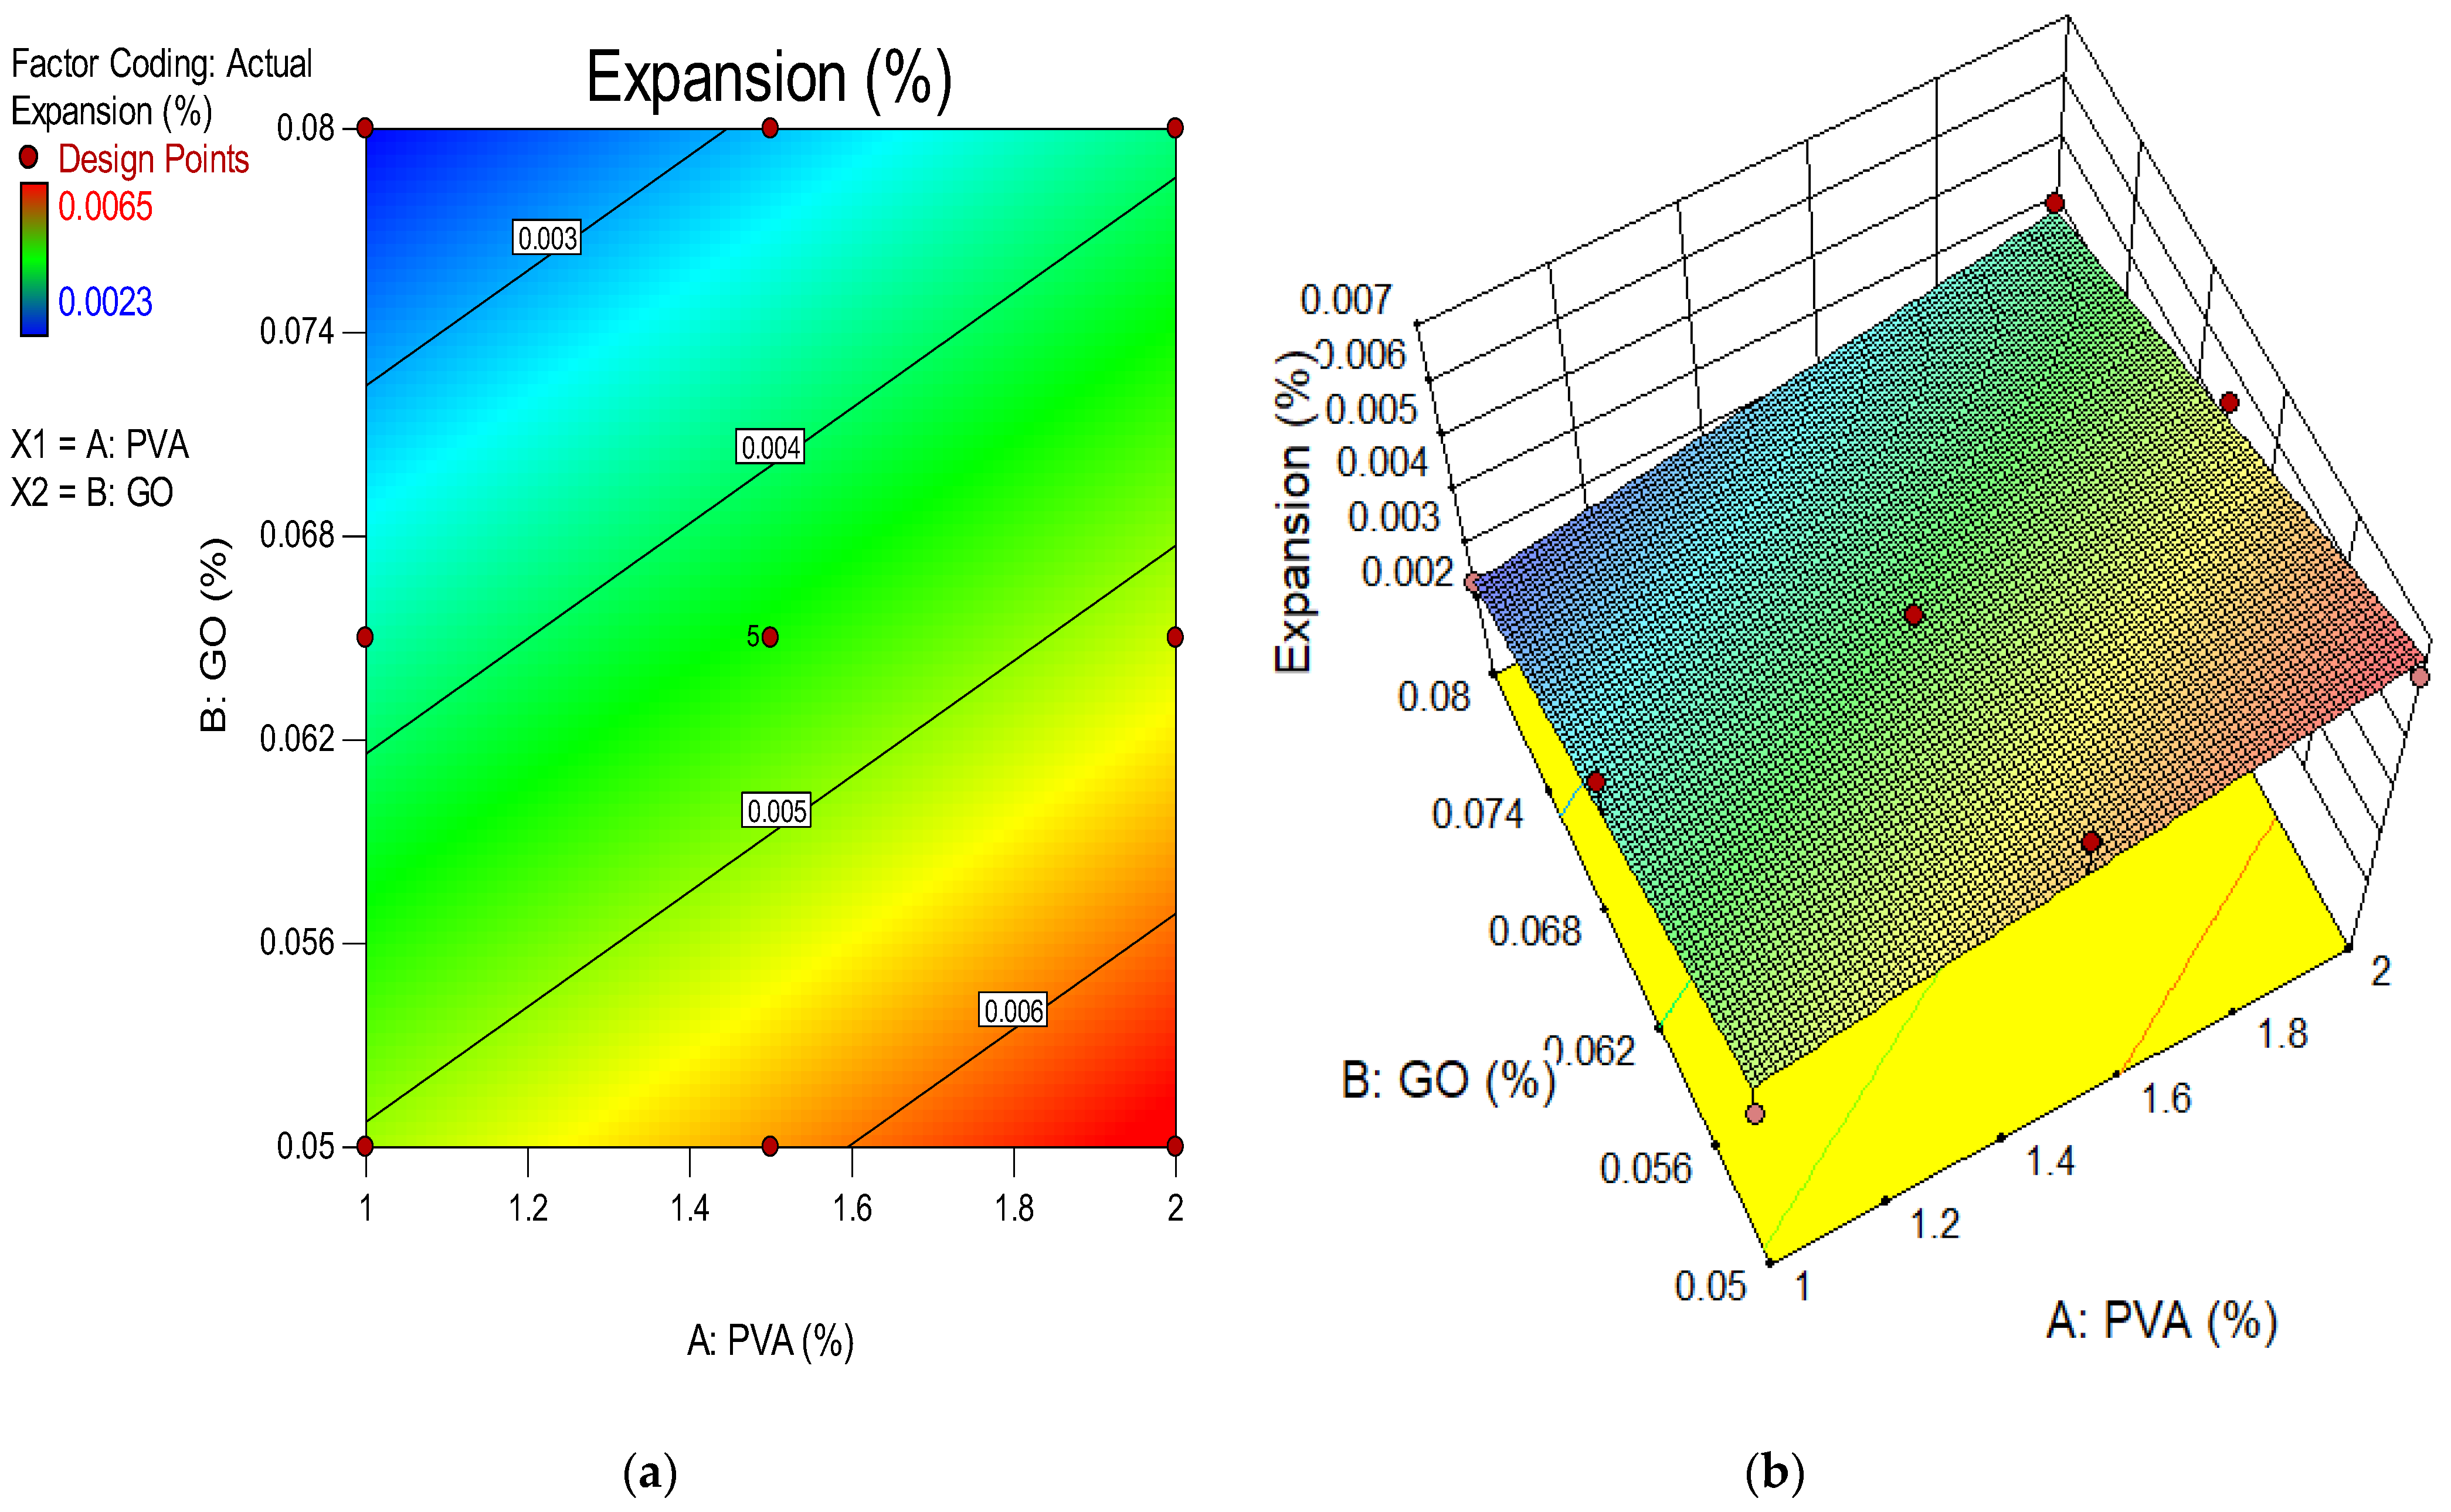
4.9. Expansion Due to Sulphate Attack

Figure 13 displays the outcomes of the expansion due to the sulfate attack of ECC matrix accumulation with several content of GO as nanomaterials. The average expansion was measured by comparing the length of prism samples before and after immersion in a 5% sodium sulfate (Na2SO4) solution dispersion after 28 days. Next, the percentage increase was computed. According to the findings, M11 (0.08% GO and 1% PVA) had the smallest average percentage of expansion at 0.0023% while M1 (0.05% GO and 1.5% PVA) exhibited the greatest expansion, as measured by an expansion percentage of 0.0065%. Moreover, M1 (0.05% and 1.5% PVA fiber), M2 (0.065% GO and 2% PVA fiber), and M7 (0.05% GO and 2% PVA fiber) exhibited the greatest expansion after 28 days in the production of ECC. Similar trends were observed for ECC blends containing varying amounts of GO and crumb rubber as fine replacement ingredients. Nonetheless, the GO reduced the length change significantly [79]. These outcomes can be explained by the existence of PVA fiber at concentrations of 1%, 1.5%, and 2%, as well as the percentages of GO present in the range of 0.05% to 0.08%. Because of the presence of micropores around the sample surface, which allow for greater absorption of immersed media, mixtures with a greater PVA content exhibit a greater expansion. The greater the amount of PVA in a mixture, the greater the number of micro-voids, leading to more expansion. This is consistent with the study’s conclusion that the expansion of concrete mixes containing more than 1% PVA was greater than that of the control sample. Moreover, the GO concentration had positive effects on lowering the expansion of the concrete because it was resistant to the media’s infiltration by the sulfate solution in ECC. The electrical resistivity of ECC introducing GO improved during the dissolution and establishment phases due to a reduction in free water, which was due to the superior adsorption capability of GO over large surface areas. During hydration, the increase in solid hydration by-products and the decrease in porosity tended to impede the ions’ conducting routes in the GO paste-containing ECC, hence the increase in resistance. Due to the penetration of sulfate suspension, a higher GO content can lessen the effects of concrete expansion. The development of cracks and holes filled with ettringite on the cement composite’s surface was another factor contributing to the increase in length change [91,92]. Furthermore, the expansion and cracking behavior of ECC is caused by the formation of ettringites, which use a larger area [93]. This is consistent with prior findings on the impact of sulfate on cement and concrete [77,94].

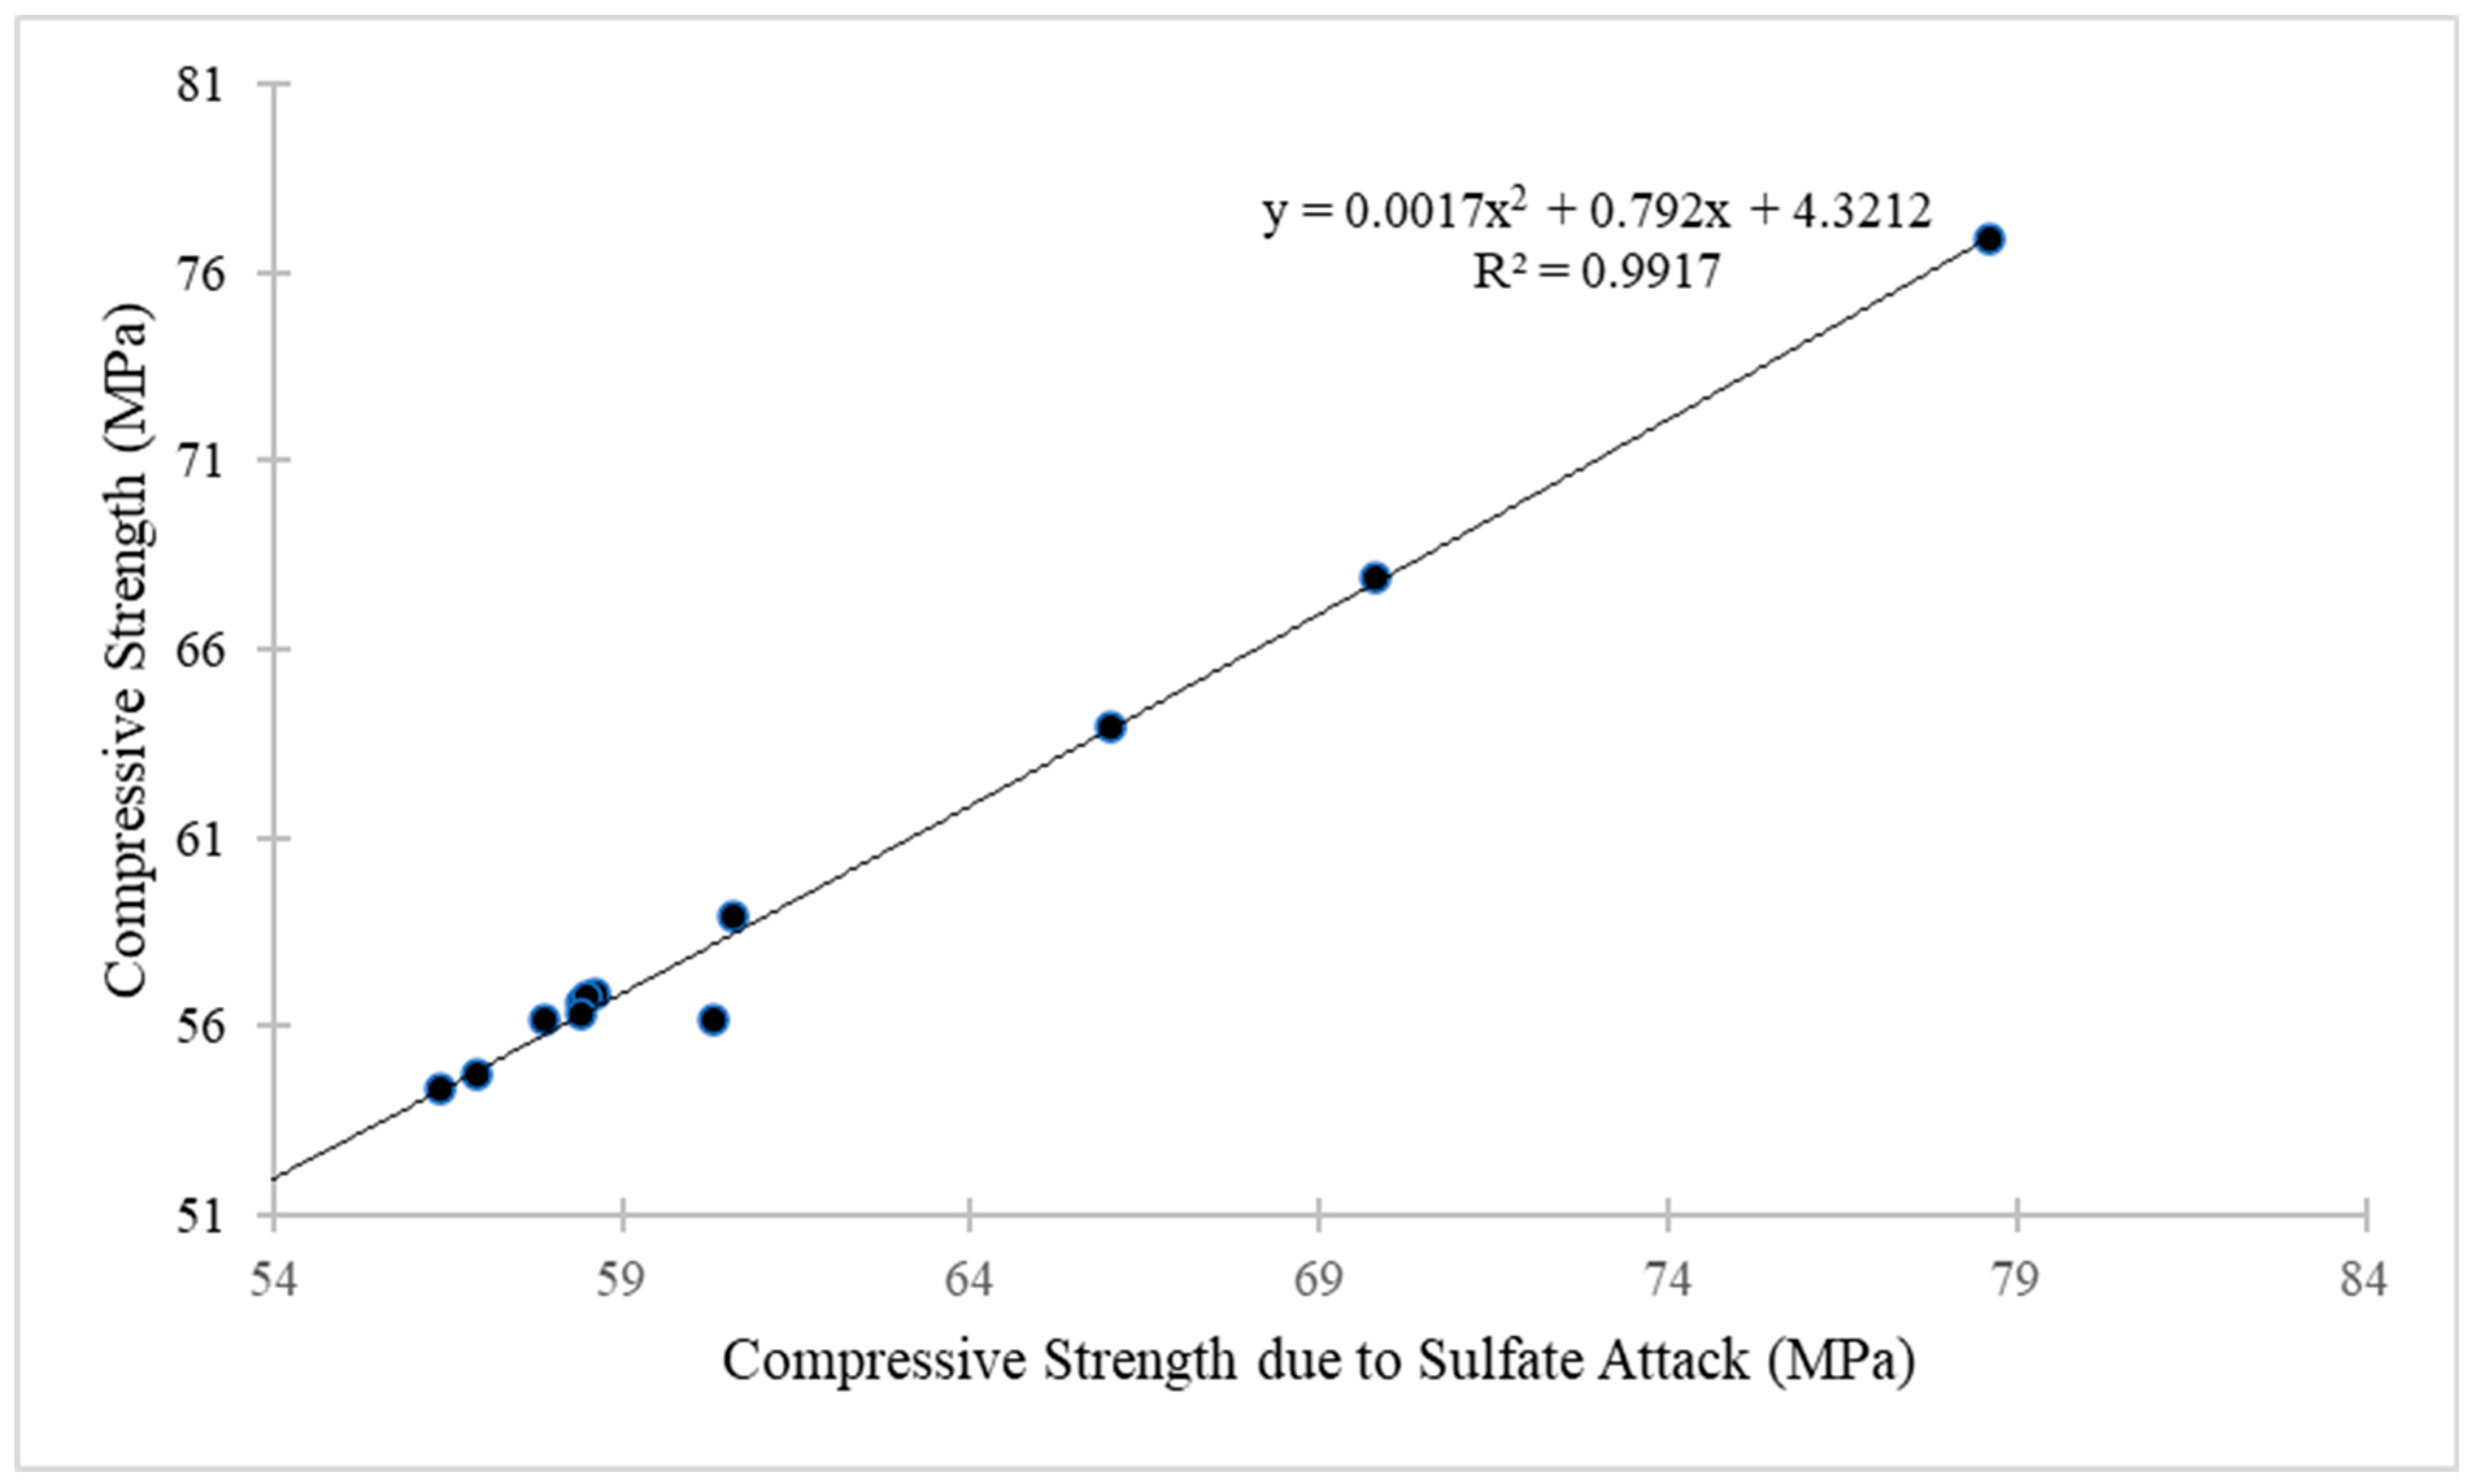
4.10. Compressive Strength of GO-ECC Due to Sulphate Attack

The loss in compressive strength of sulphate-attacked concrete was measured and compared to that of non-attacked sulphate samples that were water-cured for 28 days. Figure 14 depicts the end outcome. The decrease was fairly small with up to 0.05% GO as nanoparticles in comparison to the control mix, but there was a significant drop of 6.80% in the control mix after 28 days. The loss in compressive strength of the ECC mixture blended with 1% was 2.20%, 2.80% and 3.50% at 0.05%, 0.065% and 0.08% of GO as nanoparticle after 28 days consistently. In the same way, the loss in strength of the ECC blended with 1.5% of PVA was shown to be 2.70%, 3% and 3.82% when using 0.05%, 0.065% and 0.08% of the GO as a nanoparticle in ECC at 28 days, respectively. The same pattern was observed in GO-ECC reinforced with 2% of the PVA fiber. According to the findings, 0.05% of GO may provide significant resistance against sulphate assaults. In addition, when subjected to a chemical assault, ECC performance often declines, and the immersion duration is extended due to physical damage and the unwanted chemical breakdown of the mixture. Figure 10 shows how the addition of GO increased resistance to sulphate attacks. The compressive strength of concrete mixes subjected to sulphate assaults was measured after 28 days of being subjected to them, and the results were related to water-cured mixtures. The strength loss was defined as the difference in strength between water-cured and sulphate-treated mixtures. The findings shown in Figure 10 show that all the mixes had lost strength. The loss was shown to be larger whenever the control ECC mix was coupled with those of the GO-ECC mixtures. Additionally, the sulphate assault triggers the release of calcium components from C-S-H gels, lowering composite stiffness, causing the samples to deteriorate [95]. Honglei et al. [96] discovered two layers of gypsum on the surface of concrete specimens, with just a trace of ettringite and monosulfate. Sulfate attack is distinguished by a loss of strength and adherence as opposed to cracks and swelling [97]. Sulfate reactions changed all the mixtures, resulting in a loss of strength. The findings are comparable to those reported by Behfarnia and Farshadfar [98] and Khan et al. [99]. Figure 15 illustrates the strong correlation between compressive strength and compressive strength due to sulfate attack at day 28. If a single of these parameters exists, the formulas displayed in Figure 15 may be used to predict compressive strength or compressive strength due to sulfate attack.

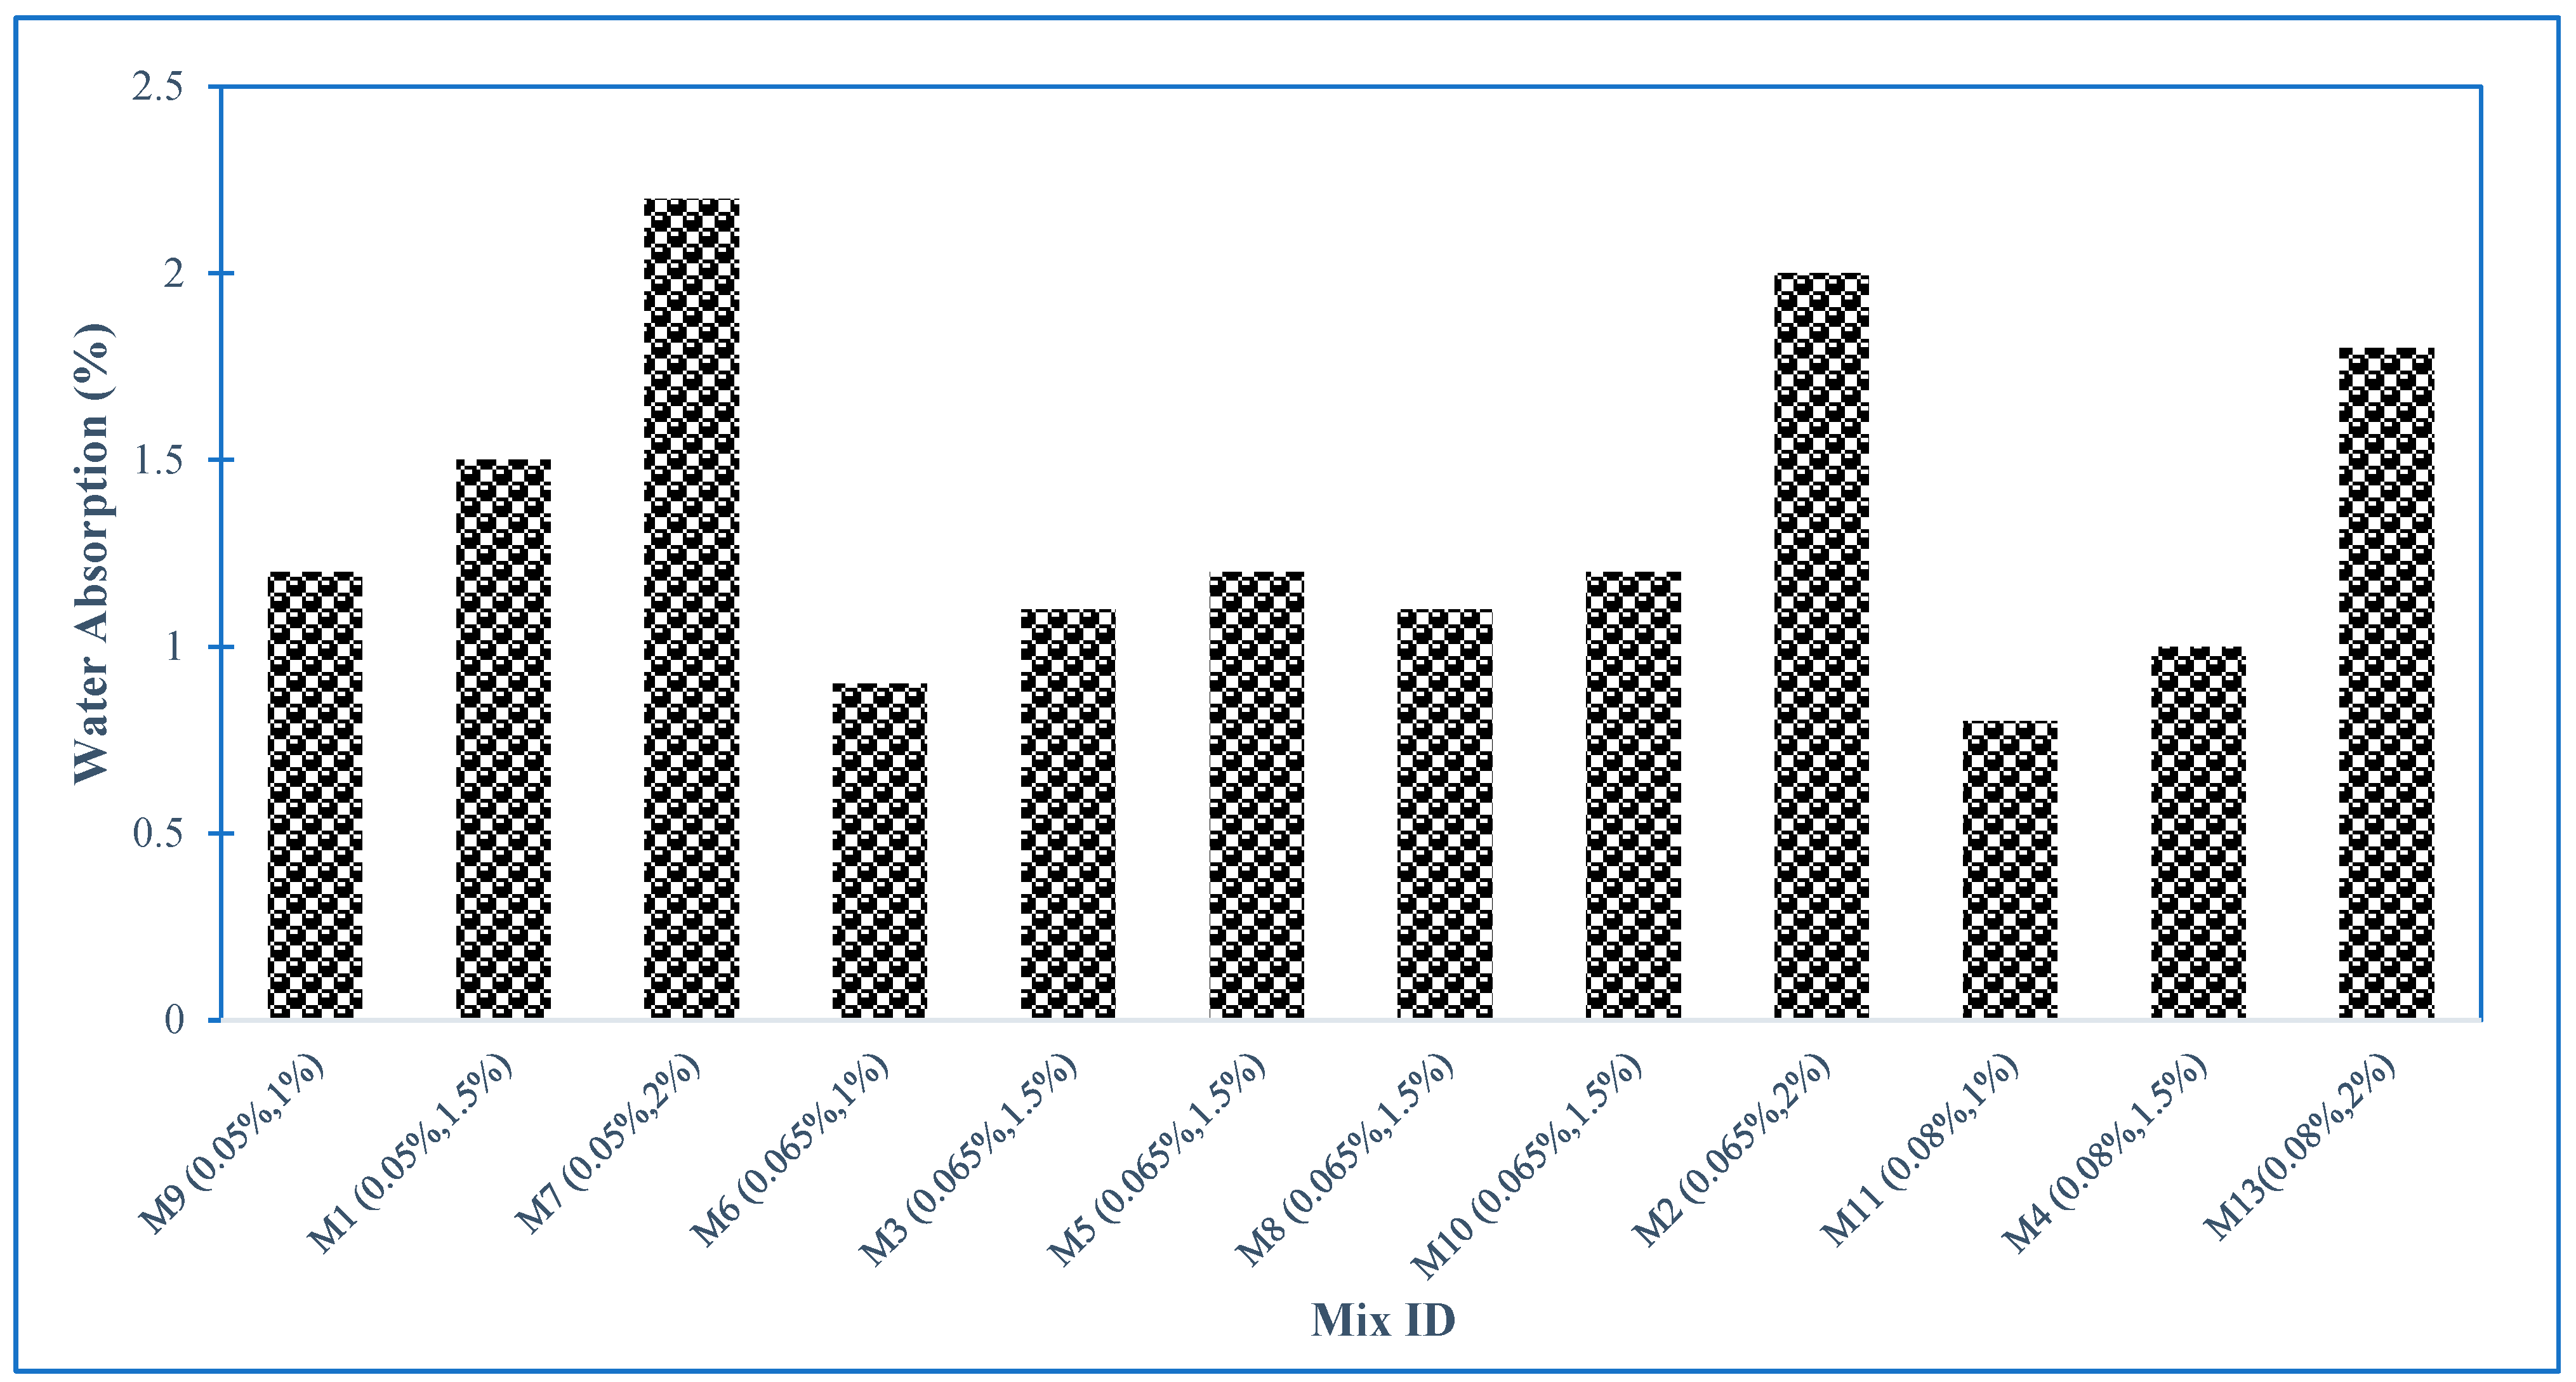
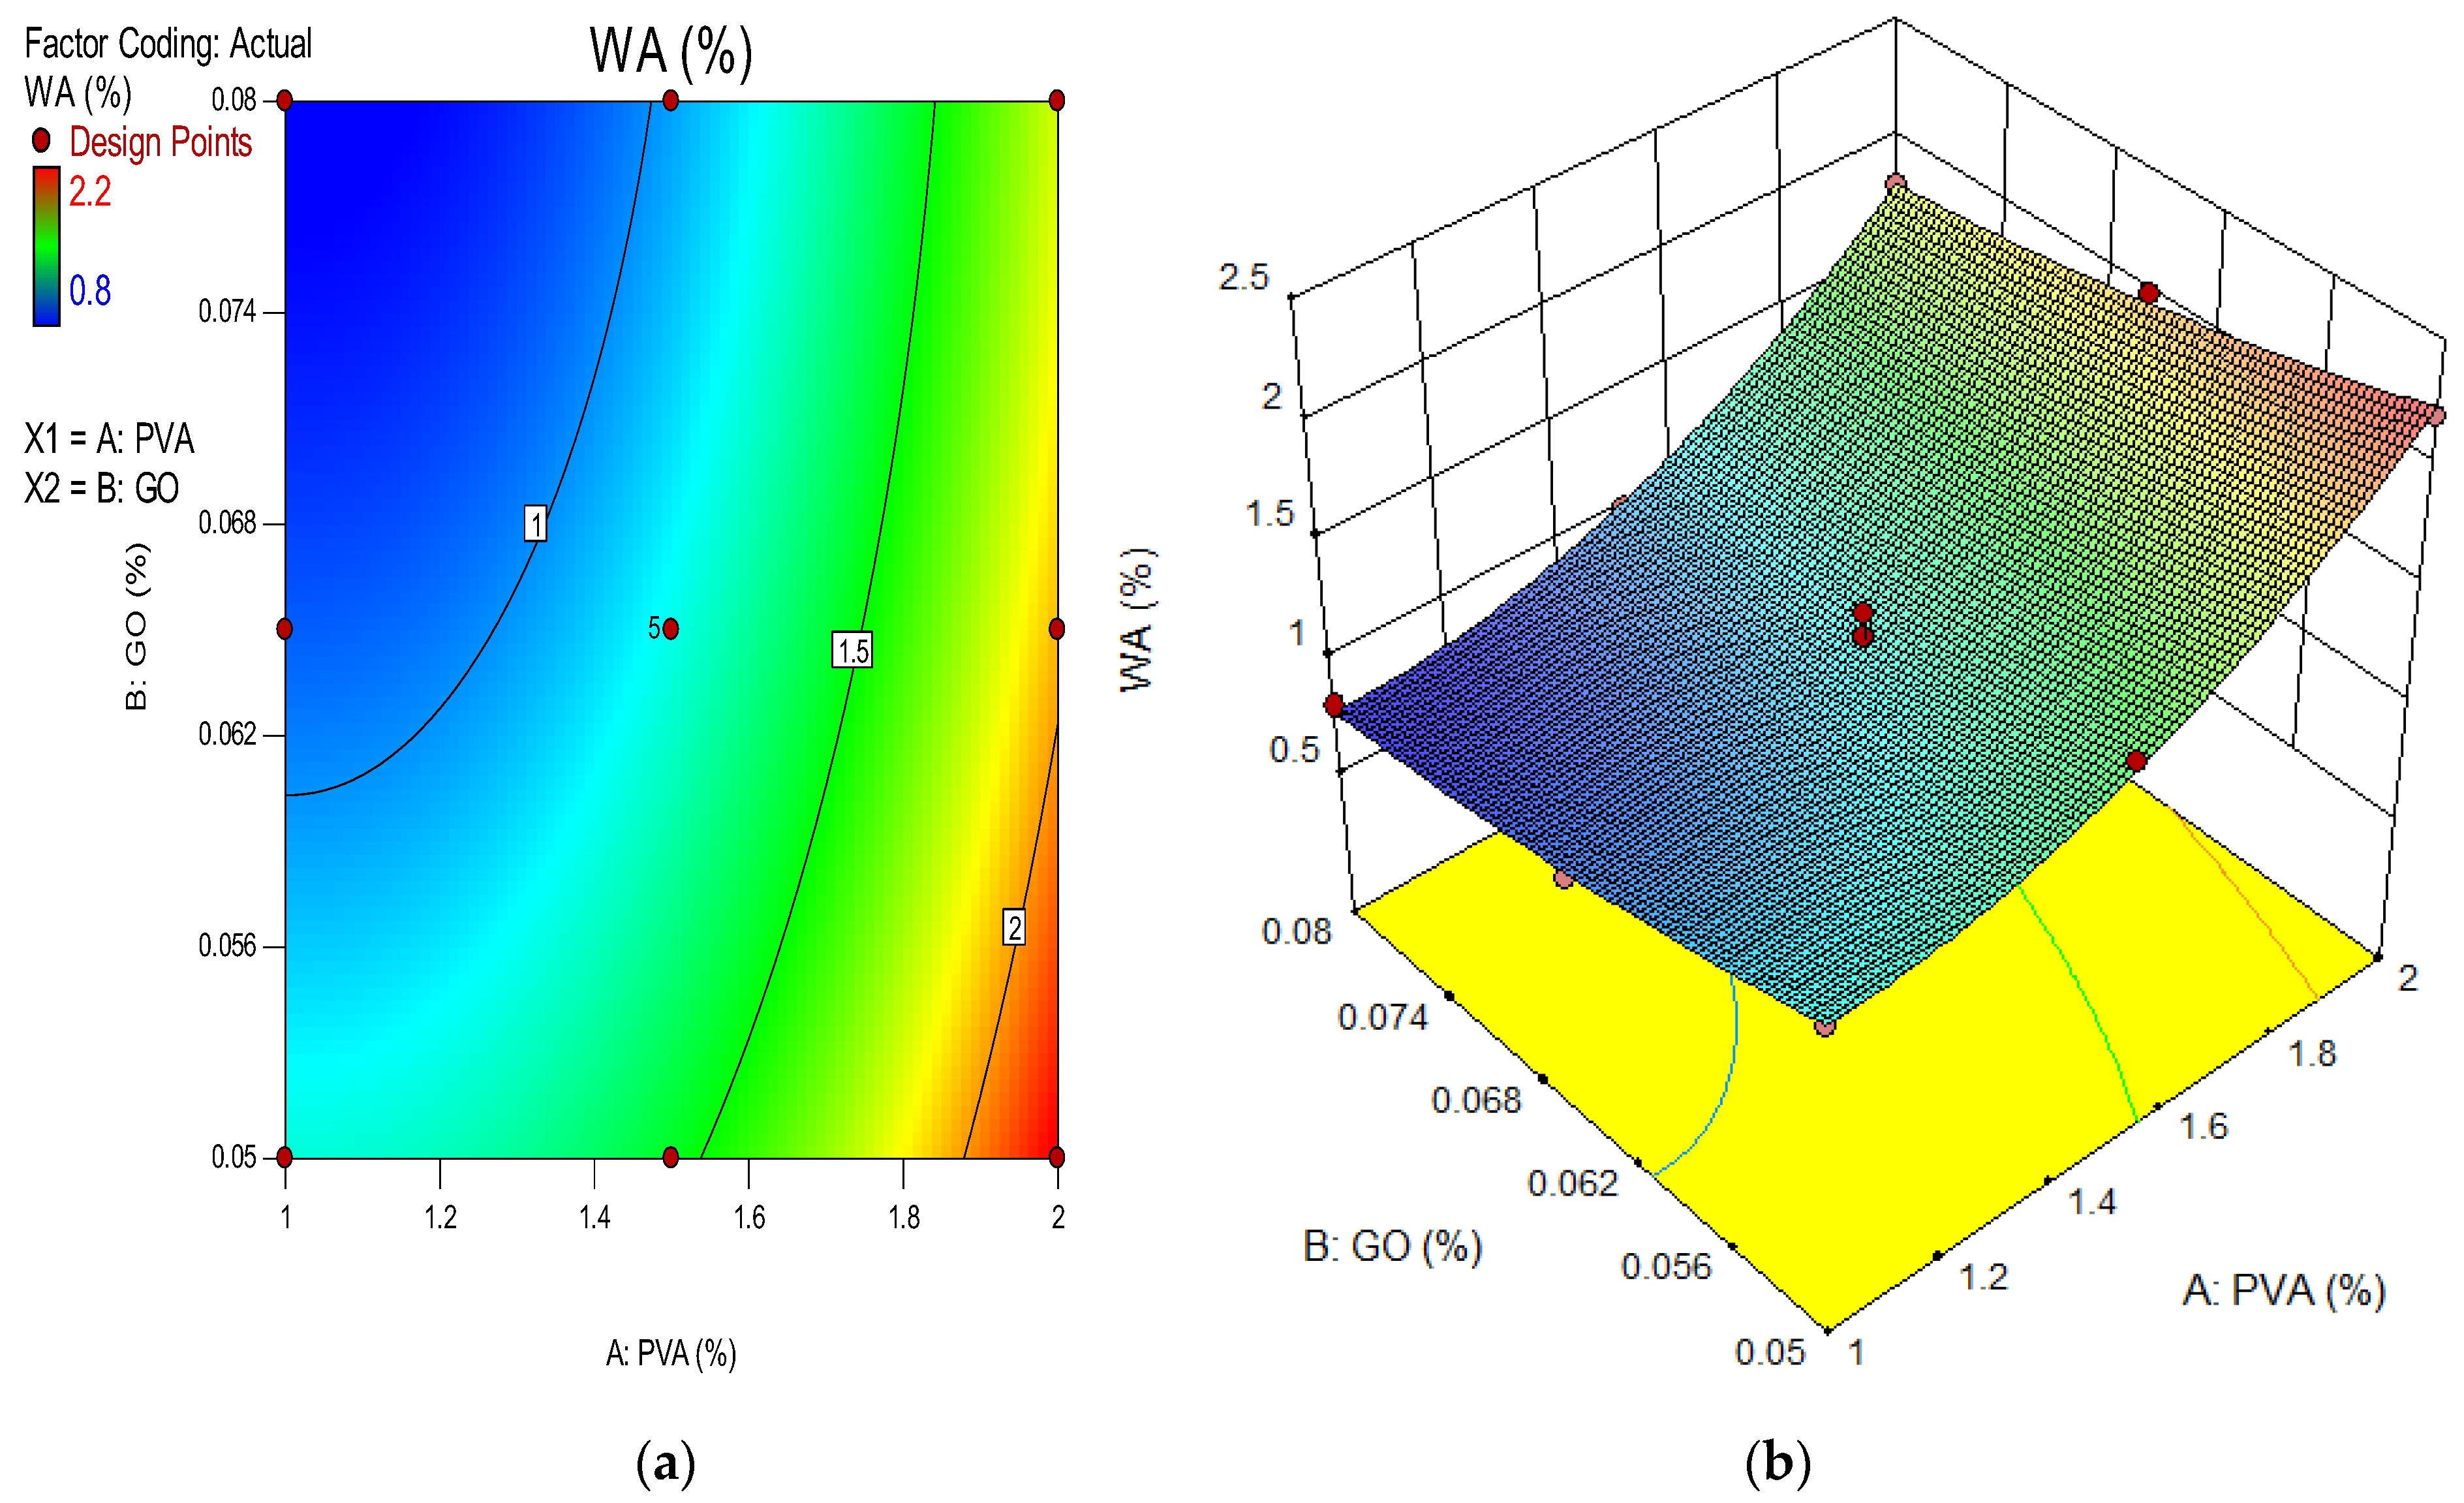
4.11. Water Absorption of GO-ECC

Figure 16 illustrates the water absorption of samples comprised of an ECC mixture incorporated with varying proportions of PVA fibers and 0.05% to 0.08% of GO as nanoparticles and cured for 28 days. The water absorption of ECC blended with 1% PVA fiber was calculated by 1.2%, 0.90%, 0.80% at 0.05%, 0.065%, and 0.08% of GO as nanoparticle at 28 days consistently. In the same way, the water absorption of ECC accumulation with 1.5% PVA fiber was recorded by 1.5%, 1.2%, 1% at 0.05%, 0.065%, and 0.08% of GO as nanoparticles for 28 days, respectively. The findings showed that the water absorption of the ECC mixture blended with 1% of PVA fiber provided good results as compared to the water absorption of ECC accumulation with 1.5% of PVA fiber along with 0.05% to 0.08% of the GO as nanoparticles. Moreover, the water absorption of the ECC mixture reinforced with 2% PVA fiber was shown to be 2.2%, 2.0%, 1.80% at 0.05%, 0.065%, and 0.08% of the GO as nanoparticles in ECC after 28 days, respectively. The findings showed that increases of PVA fiber in the ECC mixture resulted in enhanced water absorption. This enhancement in water absorption of the ECC mixture with the accumulation of PVA fiber may be a result of more water being absorbed by the PVA fiber when the amount of PVA fiber was increased in ECC. In addition, the water absorption of the ECC mixture reinforced with 1%, 1.5% and 2% of PVA fiber was reduced when the accumulation of GO as a nanoparticle increased in ECC. This enhancement in water absorption is attributable to the GO as nanoparticles that occupy the voids left by the remaining ECC components. Similar observation was done by Bheel et al. [76] showing that the water absorption of ECC is reduced as the concentration of GO rises.

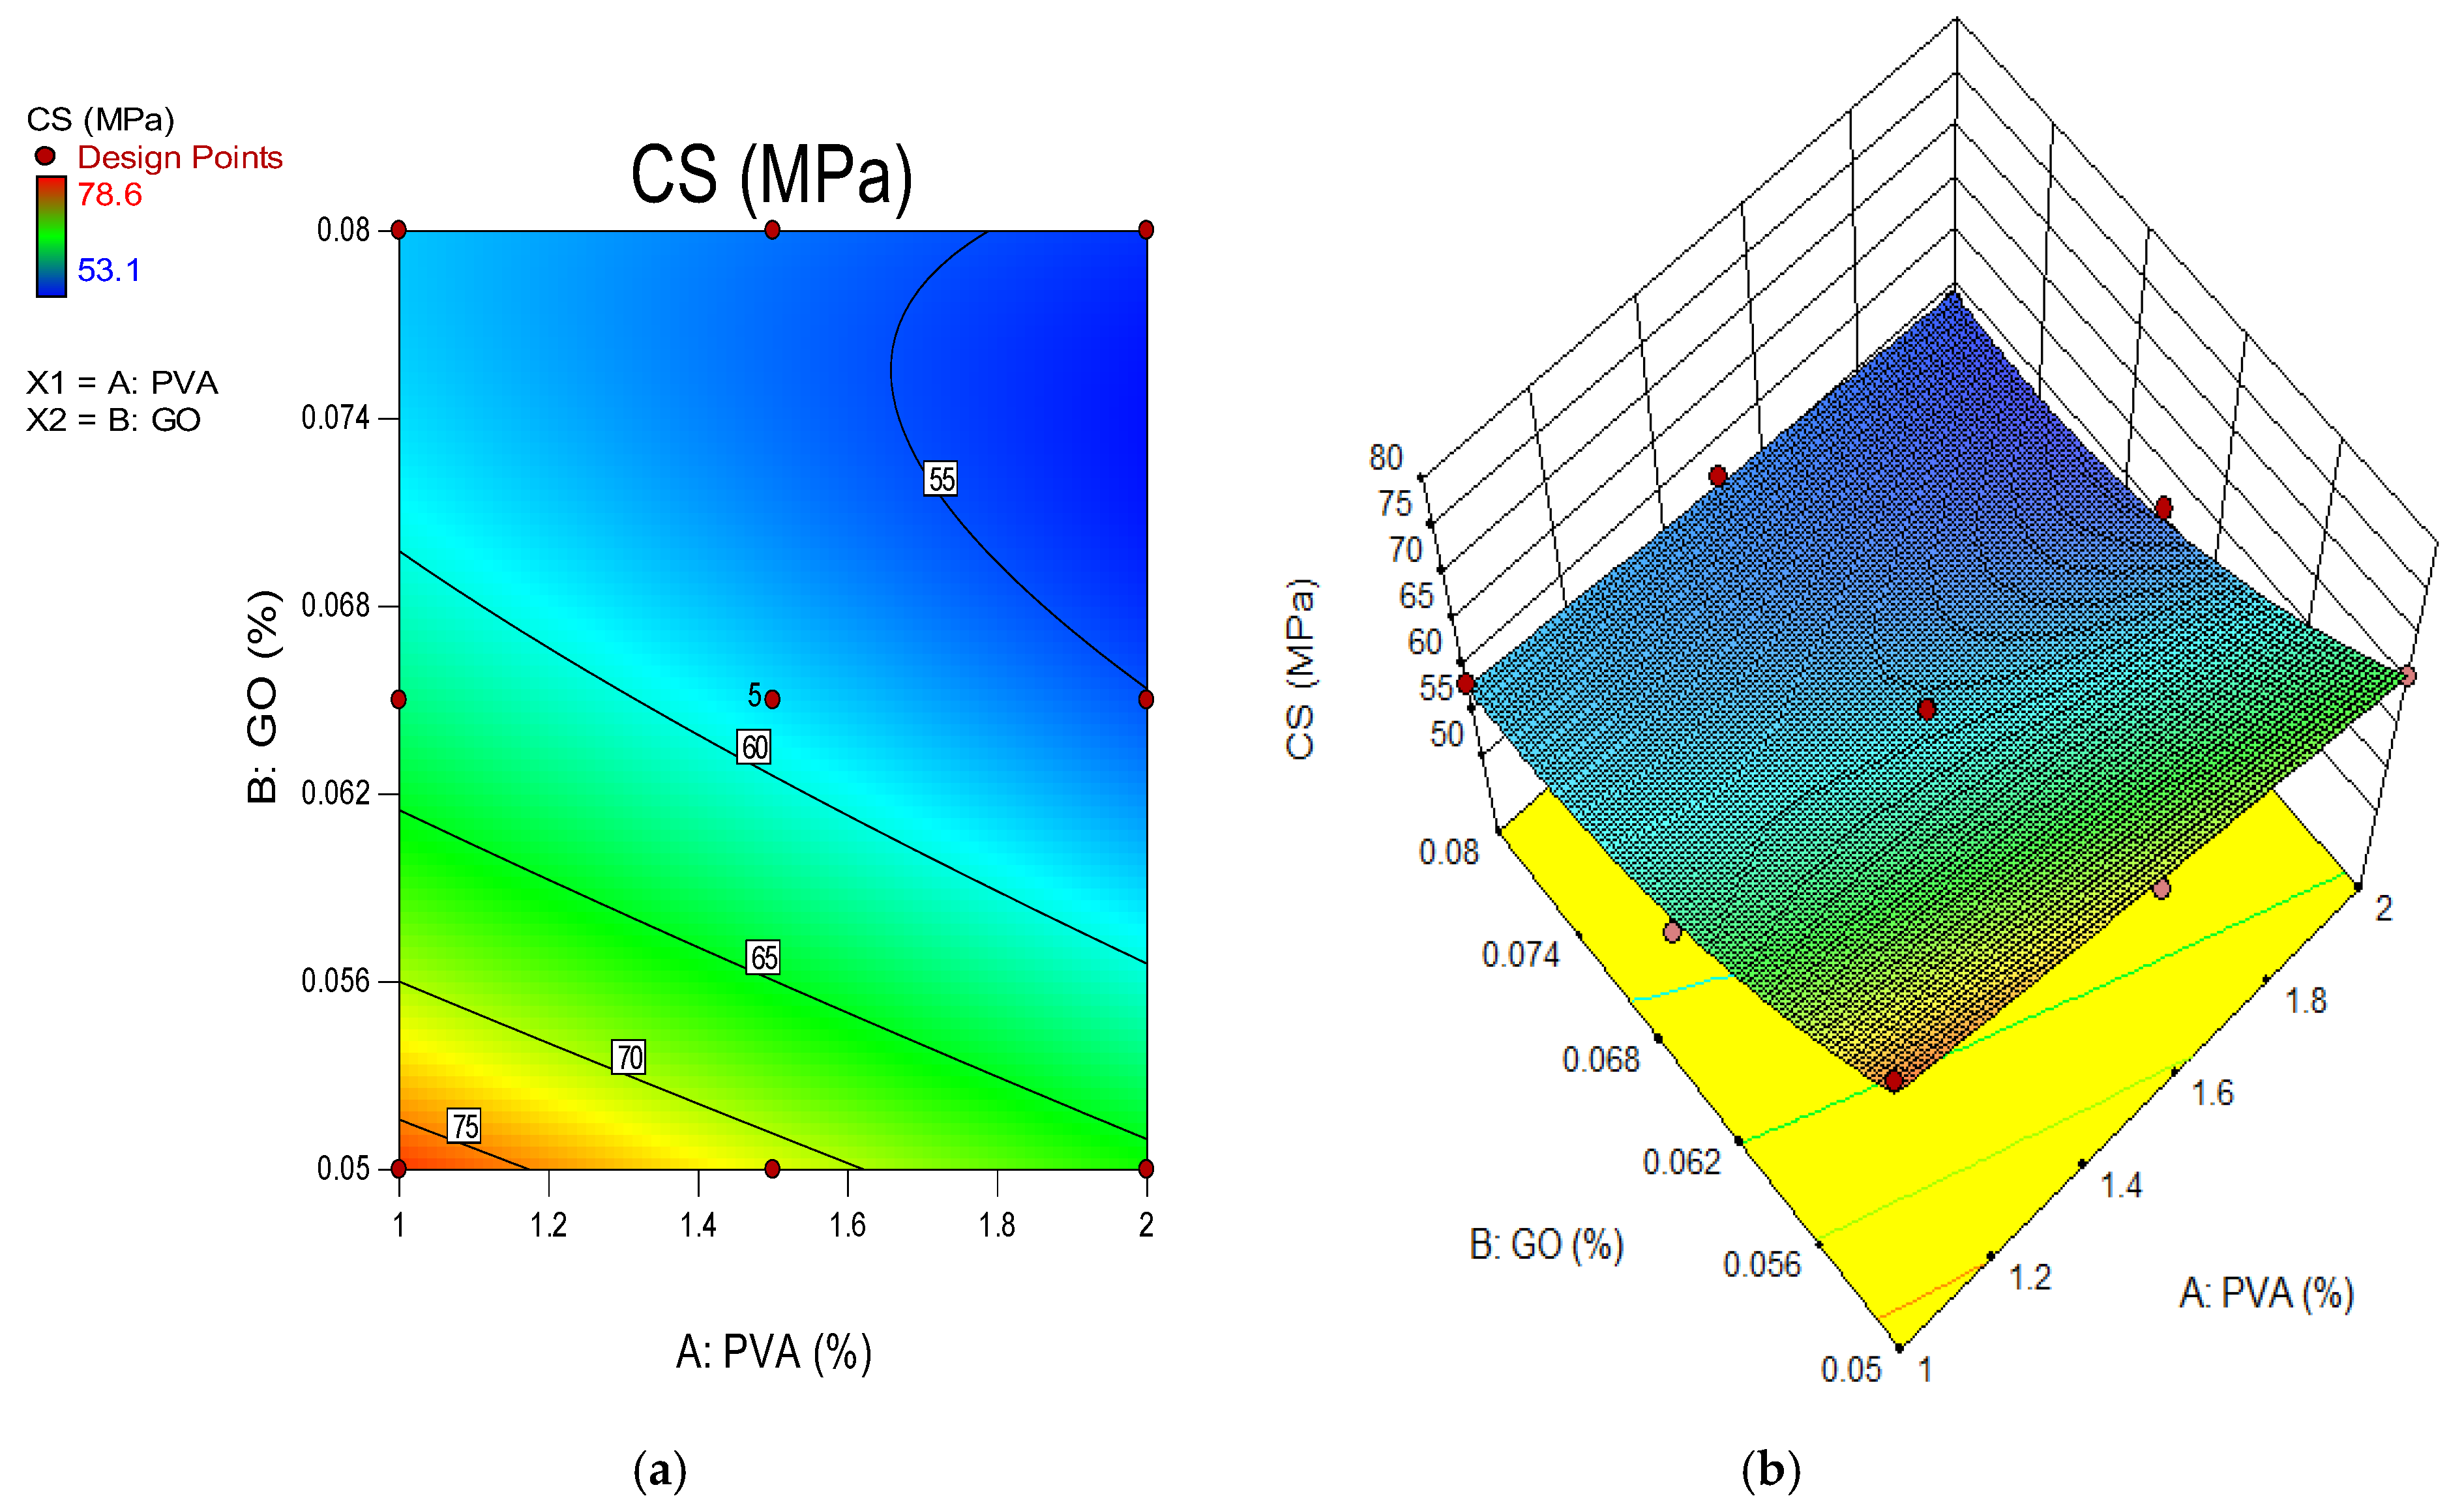
5. Predictive Model Developments Using Response Surface Methodology (RSM) and Optimization

The response surface approach is a set of mathematics and statistical tools for developing an analytical model that uses a response (an output) that is associated with numerous independent input parameters [100]. The approach can be employed to analyse the impact of each variable and the correlation between them on the response [101,102]. RSM was utilized in this study to generate prediction models and optimize the compressive strength, sulfate attack, weight loss, water absorption and drying shrinkage, and the amount of GO and PVA (as independent variables) in the GO-ECC. For the RSM analysis, the Design of Experiment (DOE) program was employed. The most frequently utilized design methodologies in building construction are Box-Behnken design (BBD) and central composite design (CCD). The design approaches and optimizations were generated using design expert software 13. The optimization procedure consists of three primary steps: (1) performing a statistically designed experimental investigation; (2) estimating the parameters in a mathematical model; and (3) forecasting the model’s responses and validating its suitability [103,104]. The established statistical models might assume either a linear or higher-degree polynomial relationship between independent factors and responses. Equation (3) depicts a first-order solution representing the linear model. Equation (4) presents the polynomial equations. The y sign symbolizes response models; xi and xj are the coded values of the input parameters; i and j are the linear and quadratic parameters; βo denotes the intercept on the y-axis; k denotes the number of independent variables utilized in the model; and is the error in the produced model.
y = β 0 + β 1 x 2 + β 2 x 2 + β n x n + ϵ
y = β 0 + i = 1 k β i x i + i = 1 k β i i x i 2 + j = 2 k i = 1 j = 1 β i j x i x j + ϵ
After calculating the statistical significance of the variables using a p-value of 0.05, a variance analysis was conducted. The fundamental and interacting features of the parameters with p-values less than 0.05 were considered important in influencing the model responses, whereas those with p-values more than 0.05 were deemed unimportant [105,106]. Except for words required to maintain the model’s structure, only relevant terms are considered in prediction models. A face-cantered central composite design (FCCD) with two distinct variables was employed to develop the mixture design formulas for the GO-ECC. In this experiment, GO and PVA were the two parameters considered. Compressive strength, weight loss, length change, CS due to acid attack, pH test, rapid chloride penetration test (RCPT), weight gain, expansion, CS due to sulfate attack and water absorption were the variables investigated in this investigation. The software developed thirteen random mixtures with five duplicates for each response. The five duplicates are the primary benchmarks the computer employs to enhance the experiment’s response to any potential deviations.

5.1. Analysis of Variance (ANOVA)
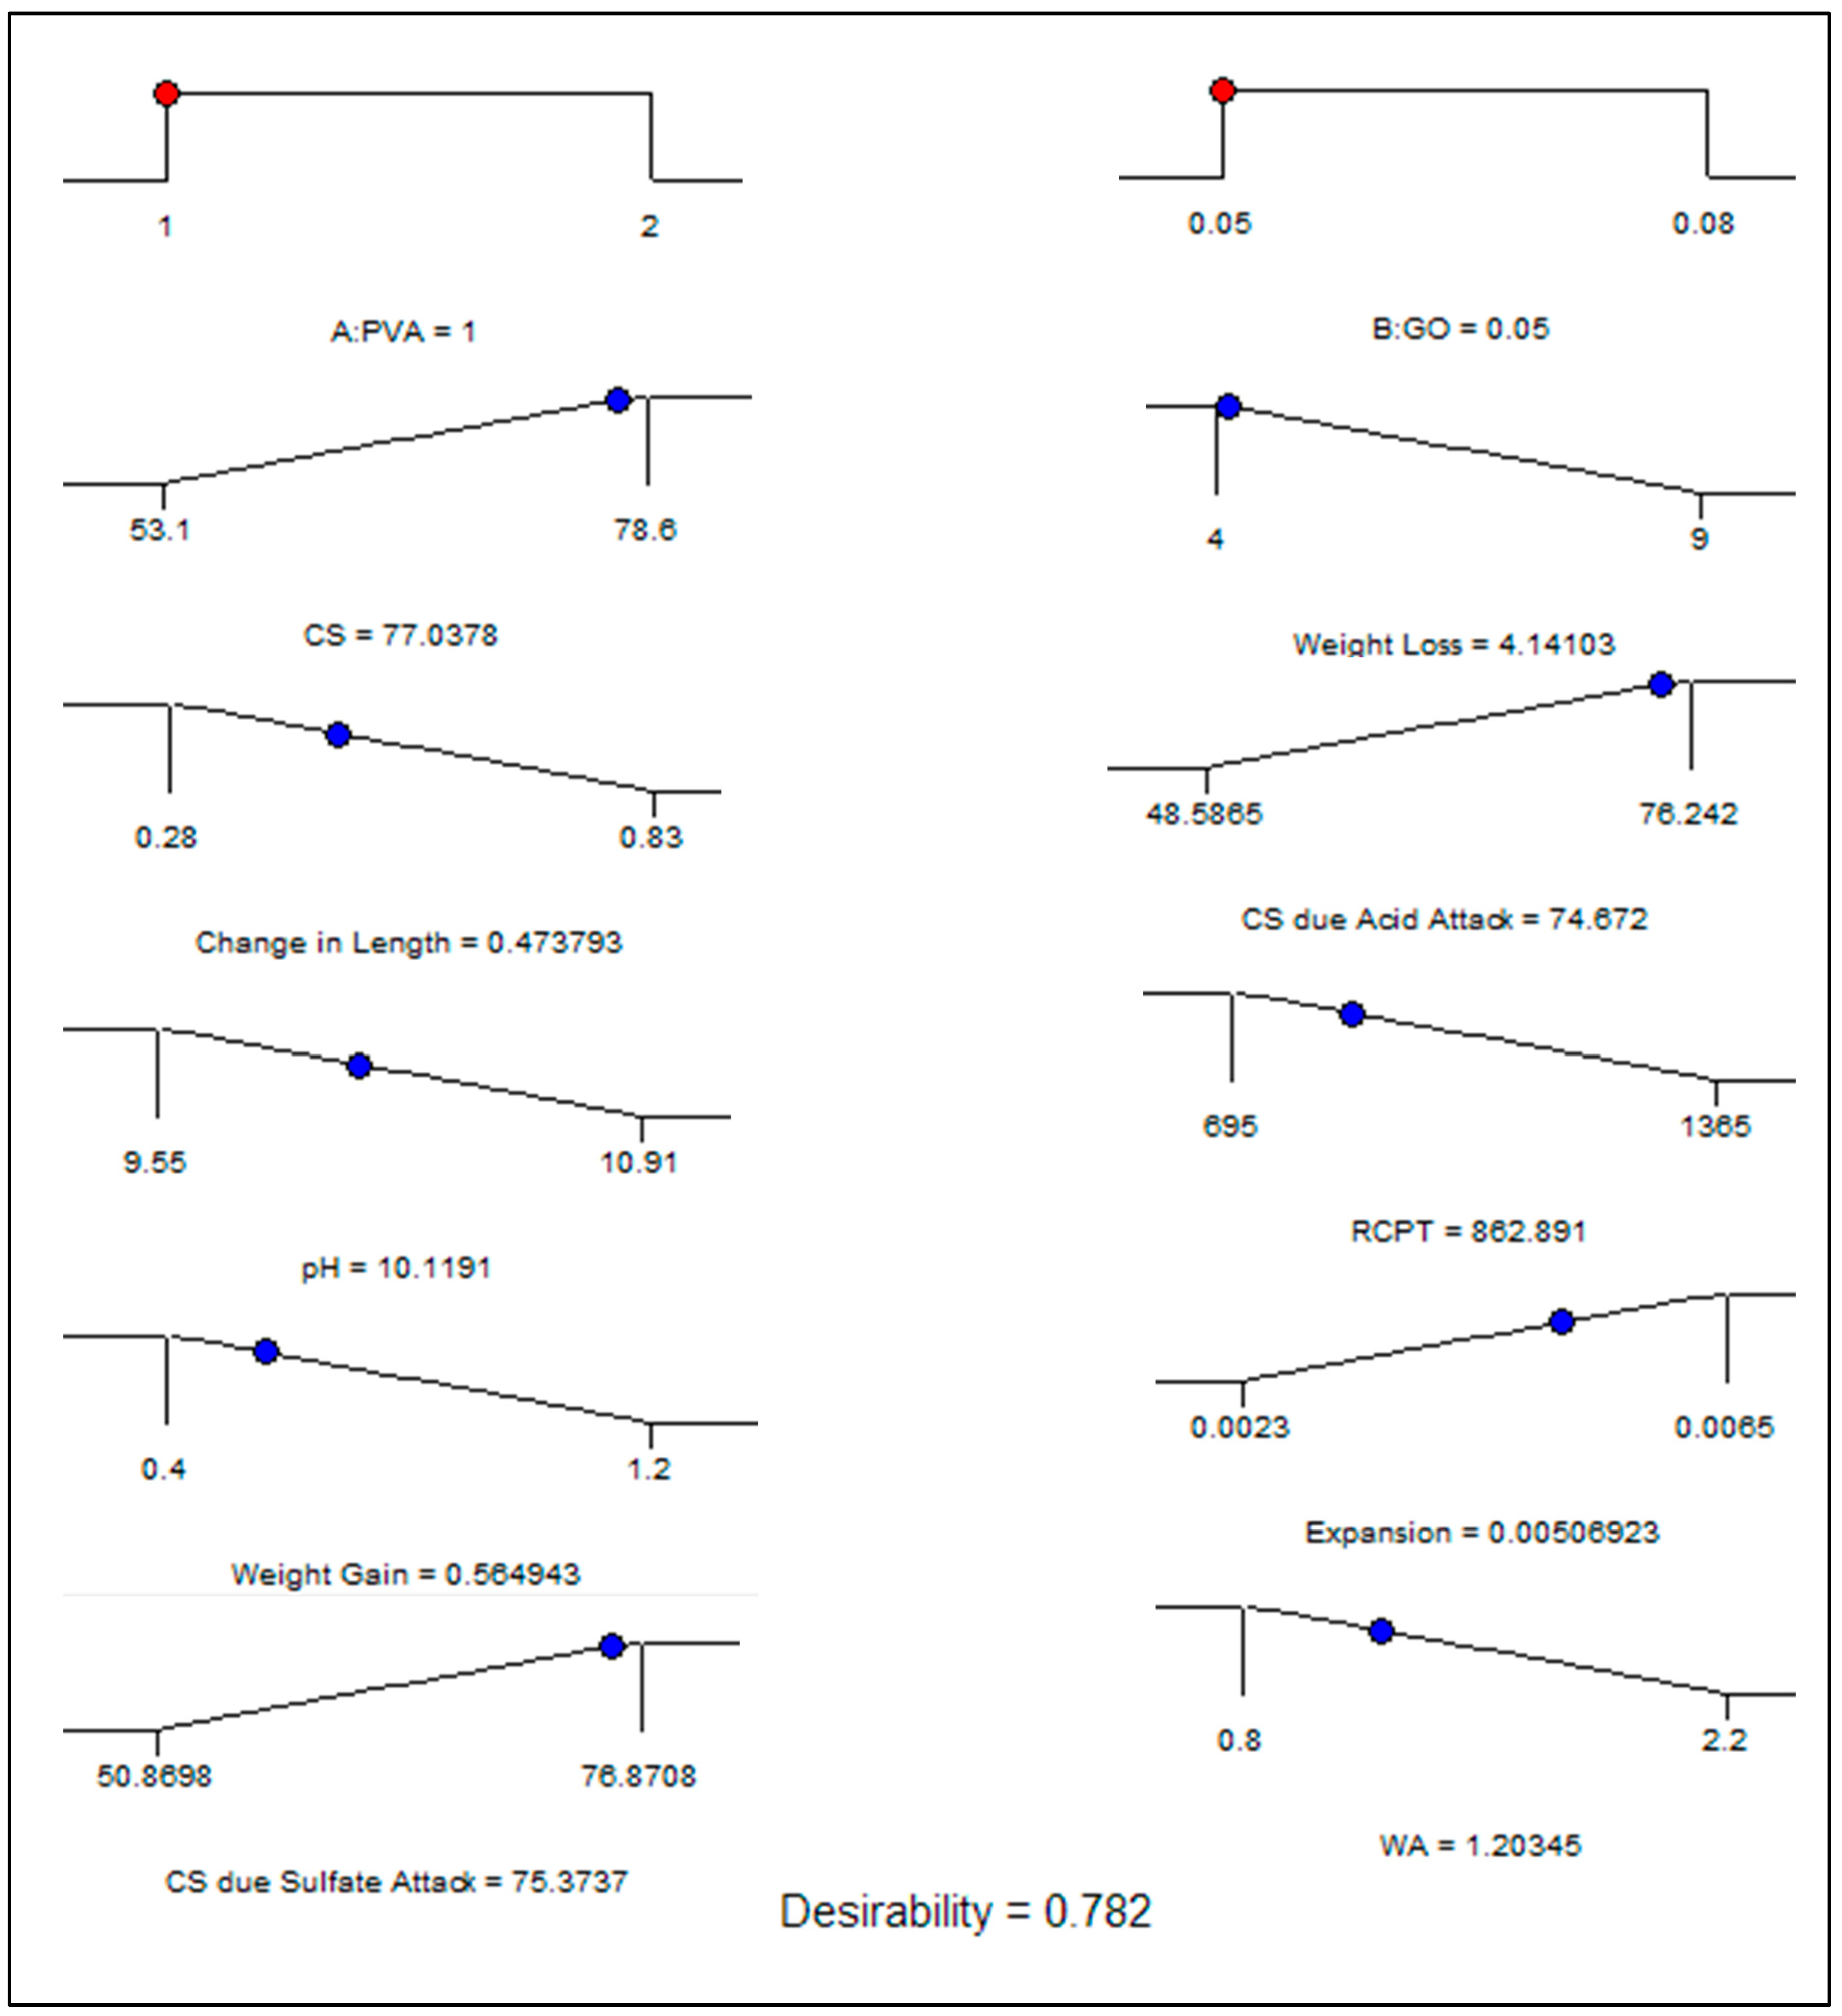
RSM’s objective is to develop response surface models and analyse them using analysis of variance (ANOVA). For RSM modeling and optimization in this study, the compressive strength and durability characteristics of ECC mixes containing between 0.05 and 0.08 percent GO nanoparticles and different levels of PVA fiber were studied. In addition, quadratic models were deemed most suitable for compressive strength (CS), length change, CS due to acid attack, pH test, rapid chloride penetration test, weight gain, CS due to sulfate attack and water absorption whilst linear models were deemed more suited for expansion, and weight loss response. Furthermore, each of these responses is encoded in Equations (5)–(14). Equations defined in terms of coded components can be used to forecast the effect of varying parameter quantities. The maximum levels of the components are displayed as +1 by default, while the minimum values are shown as −1. Using the factor variables, the coded equations may be utilized to evaluate the parameters’ relative importance by applying their respective weighting. A and B are input variables (GO and PVA). The results of the ANOVA are summarized in Table 4.
Any prototype or model factor with a frequency below 5% is deemed significant. In this regard, all generated models are statistically crucial because their probability is lower than 0.05. The various model terms A, B, AB, A2, and B2 for the compressive strength model have statistical significance. Consequently, the important model terms for the length change, CS due to acid attack, pH test, RCPT, weight gain, CS due to sulfate attack and WA models are A, B, AB, A2, and B2. A and B are therefore the most significant model terms for the expansion, and weight loss models, respectively.
The determination coefficient is a significant performance indicator (R2). The R2 coefficient, which ranges from 0 to 1 or is expressed as a percentage, evaluates the model’s fit with empirical data (0 to 100 percent). The higher the value, the better the fit, and vice versa. Table 5 presents R2 and additional model evaluation variables. R2 values for CS, weight loss, length change, CS due to acid attack, pH test, RCPT, weight gain, expansion, CS due to sulfate attack and WA were 97.69%, 84%, 97.89%, 97.76%, 99.62%, 99.30%, 97.84%, 89.16%, 97.83%, 98.40% for each model, respectively. In addition, “Adeq. Precision” calculates the signal-to-noise ratio. A ratio larger than four is desired. According to Table 5, the Adeq precision values for the CS, weight loss, length change, CS due to acid attack, pH test, RCPT, weight gain, expansion, CS due to sulfate attack and WA are 24.90, 13.29, 27.80, 26, 70.20, 51.09, 26.51, 21, 25.89, 30.55, respectively. These findings suggest that the models are competent and can be used to accurately anticipate reactions.
C S = + 58.64 3.68 × A 7.67 × B + 1.82 × A B + 0.19 × A 2 + 5.04 × B 2
W e i g h t   L o s s = + 6.31 + 2.00 × A + 0.17 × B
C h a n g e   i n   L e n g t h = + 0.48 + 0.10 × A 0.18 × B 0.080 × A B 0.044 × A 2 + 0.041 × B 2
C S   d u e   t o   A c i d   A t t a c k = + 55.24 4.28 × A 8.09 × B + 1.69 × A B + 0.47 × A 2 + 4.90 × B 2
p H = + 10.25 + 0.38 × A 0.29 × B 0.010 × A B + 0.10 × A 2 0.13 × B 2
R C P T = + 948.38 + 212.67 × A 120.33 × B 32.50 × A B + 37.17 × A 2 + 2.17 × B 2
W e i g h t   G a i n = + 0.91 + 0.30 × A + 0.033 × B + 0.10 × A B 0.11 × A 2 ( 5.17 × 10 3 ) × B 2
E x p a n s i o n = ( + 4.469 × 10 3 + 7.833 × 10 4 ) × A ( 1.383 × 10 3 ) × B
C S   d u e   t o   S u l f a t e   A t t a c k = + 56.53 3.82 × A 7.80 × B + 1.86 × A B + 0.34 × A 2 + 5.02 × B 2
W A = + 1.18 + 0.52 × A 0.22 × B + 0.000 × A B + 0.26 × A 2 0.060 × B 2
Here, A and B indicate the PVA fiber and GO while the CS, RCPT and WA represent compressive strength, rapid chloride penetration test and water absorption respectively.
The “actual vs. predicted” plots, as shown in Figure 17a–j for the four variables (CS, weight loss, length change, CS due to acid attack, pH test, RCPT, weight gain, expansion, CS due to sulfate attack and water absorption), were used as effective model diagnostic tools for assessing the quality and appropriateness of the generated response models (CS, weight loss, length change, CS due to acid attack, pH test, RCPT, weight gain, expansion, CS due to sulfate attack and WA). In every graph, the linearity of the datasets along the fit line demonstrates the precision of the constructed models.
Using 2D contour plots and 3D response surface graphs, the influence of input parameter interactions on outputs was illustrated. Figure 18, Figure 19, Figure 20, Figure 21, Figure 22, Figure 23, Figure 24, Figure 25, Figure 26 and Figure 27 depict the response surface graphs for the CS, weight loss, length change, CS due to acid attack, pH test, RCPT, weight gain, expansion, CS due to sulfate attack and WA models, respectively. For instance, given two input parameters, such as in the present study, the interaction between the variables is represented. In this instance, 2D contour plots and 3D response graphs for the PVA and GO interface are displayed. The graphs’ color-coding indicates the size of the reaction as well as the various values of the input elements under consideration. Figure 18a,b show the 2D contour and 3D response graphs for CS, correspondingly. The graphs show that a high concentration of CS was detected at 0.05% of GO as a nanomaterial among all concentrations of GO, and the strength value was greatly increased by utilizing up to 0.05 percent GO in the ECC mixture. This is owing to the previously stated pore-filling and densification impact of GO as a nanomaterial in an ECC combination. The remaining response surface graphs for length change, weight loss, and water absorption show a similar pattern.

5.2. Optimization

Optimization was conducted to obtain the optimal values of the independent factors to produce the best level of the desired outcome. This was conducted by setting objectives for the characteristics (input parameters and output) with changing conditions and degrees of relevance towards attaining the target function. The optimization was evaluated using the desirability value (0 ≤ dj ≤ 1). The closer the value was to one, the better the result [107].
The objectives and criteria for this instance’s optimization are described in Table 6. As stated in Table 6, the optimization aimed to maximize four responses and reduce one output. However, the use of GO was restricted to a range of 0.05 to 0.08 percent, and the usage of 1%, 1.5%, and 2% PVA fiber was restricted, hence the mechanism may determine the optimal amount to fulfil the stated goal. The findings of the optimization indicated that the highest values of 77.03 MPa, 4.14%, 0.47%, 74.67 MPa, 10.11, 862.89 Coulombs, 0.56%, 0.0050%, 75.37 MPa and 1.20% could be reached for the CS, weight loss, length change, CS due to acid attack, pH test, RCPT, weight gain, expansion, CS due to sulfate attack and WA, respectively, by combining 0.5% GO and 1% PVA fiber in the ECC mixture. The criteria for desirability are determined by the degree of similarity between the suggested solution and the actual outcome. It is advised to have a desirability closer to one for optimal outcomes. The desirability value of 0.782 indicated that response optimization was achievable. Figure 28 and Figure 29 depict the optimum outcome and the 3D diagram for desirability, correspondingly.

6. Conclusions

The purpose of this research was to determine the effect of GO as a nanoparticle on the compressive strength as well as the durability of ECC mixes accumulating with 1–2% PVA by volume fraction of ECC. After the research, the following conclusions were obtained:
  • The optimum slump flow is recorded as 792 mm at control mixture while the minimum slump flow was 645 mm at 0.08% of GO along with 25 of the PVA fiber in the ECC. The slump flow of fresh ECC mixture was reduced as the concentration of the GO as a nanoscale particle increased;
  • The optimum compressive strength of the ECC accumulation with 1% of PVA fiber was shown to be 0.05% of GO while the minimum strength of the ECC accumulation with 1% of PVA as fiber was recorded as 0.08% of GO as a nanoparticle in ECC. This indicates that the addition of 0.05% GO by the weight of PC in the ECC provides the best strength, and with additional accumulations of GO in ECC, the strength starts to reduce in every curing period;
  • The weight loss and change in length of ECC were shown to decrease when the concentration of GO as a nanoscale particle increased for 28 days. The finding showed that the accumulation of more GO in ECC resulted in more durable ECC. By assessing mixtures with the same 1% PVA concentration but differing GO levels, the higher GO level generated superior weight loss outcomes. The GO in the mixture also helped to improve the ECC’s durability whenever exposed to extreme conditions such as acidic environments;
  • The maximum pH value was recorded as 11.86 in the control mixture, while the minimum pH value was noted as 9.55 at 0.08% of GO as a nanoscale particle, along with 1% of PVA fiber in ECC. The use of PVA fibers in the production of ECC increased the pH value, but the all-pH values were lower than that of the control mixture. When the quantity of GO increased, the pH value decreased;
  • The weight gain and expansion of ECC due to sulfate attack was reduced when the concentration of GO as a nanomaterial increased in the ECC. The resistance impact response to a sulfate attack is attributable to the pozzolanic properties and filling influence of GO as nanoparticles, which occupy the pore spaces and further prevent sulfate ion infiltration. Their depleting efficiency may be due to the aggregation of nanomaterials at high concentrations;
  • The water absorption of the ECC mixture was reduced when the concentration of GO as nanomaterials increased in the ECC mixture, after 28 days. This reduction in water absorption is due to the fineness of GO particles which seals the micropores left by other components of the ECC mixture;
  • The optimum RCPT was observed to be 1650 Coulombs for the control mixture while the minimum RCPT was shown to be 695 Coulombs at 0.08% of GO along with 1% of PVA fiber in ECC for 28 days. Higher resistance against chloride ion penetration was achieved with the use of GO as nanoparticles. The chloride permeability values reduced with the addition of GO as nanoparticles. All mixes were classified as being in the very low chloride-permeability range except for the control mixture, M1, M7, M2 and M13, which were classified in the low permeability group;
  • RSM models were designed to predict the compressive strength, water absorption, acid resistance, and sulfate resistance at 28 days, depending on the proportions of the PVA fibers and GO as nanomaterials in the production of ECC. Each model adjusted R-squared to the predicted R-squared difference was less than 0.2, and had at least a 95% confidence level.

7. Limitations

The following difficulties have been pointed out based on the experimental investigations:
  • Developing a suitable mixing strategy for efficient GO dispersion in large-scale field applications might result in high GO sheet doses and unsatisfactory performance;
  • The usage of GO as a nanoscale particle in the construction industry is problematic due to its significantly higher cost when compared to conventional concrete.

8. Future Recommendations:

It is necessary to do more research in the following suggested areas in order to completely develop the GO-ECC.
  • The characteristics of the mixtures developed for this research were evaluated after 28 days of curing. Therefore, it is important to research how GO affects the long-term durability behavior and time-dependent deformations such as fatigue and creep behavior of ECC;
  • It is important to look at how GO affects concrete and the steel reinforced ECC’s structural performance;
  • Additionally, it is possible to conduct research on the chemical connections and behavior of GO mixed with other additives, including millet husk ash, wheat straw ash, silica fume, and other nanoparticles;
  • The utilization of 0.05% GO as a nanoparticle in an ECC mixture reinforced with 1% of PVA fiber by volume fraction has the potential to reduce the difficulties associated with the large-scale application of ECC as well as the harmful impacts of sulfate attacks and acid attacks. Therefore, it is recommended for practical applications in the construction industry.

Author Contributions

N.B.: software, validation, investigation, data curation, writing—original draft preparation, writing—review and editing. B.S.M.: Conceptualization, Supervision, methodology, funding acquisition, writing—review and editing. M.S.L.: Conceptualization, Supervision, methodology, funding acquisition. N.A.W.A.Z.: Conceptualization, Supervision, methodology, funding acquisition. All authors have read and agreed to the published version of the manuscript.

Funding

The Authors are thankful to Universiti Teknologi PETRONAS (UTP) Malaysia for funding the work under the grants with number: 015PBC-009 and 015LC0-391.

Institutional Review Board Statement

Not applicable.

Informed Consent Statement

Not applicable.

Data Availability Statement

Not applicable.

Acknowledgments

The Authors wish to acknowledge the support of Universiti Teknologi PETRONAS (UTP) Malaysia for funding the work under the grants with number: 015PBC-009 and 015LC0-391.

Conflicts of Interest

The authors declare no conflict of interest.

Abbreviations

ECCEngineered Cementitious Composites
GOGraphene Oxide
RSMResponse Surface Methodology
CCDCentral composite design
PVA FiberPolyvinyl Alcohol fiber
HPFRCCof high-performance fiber-reinforced cementitious composite
MPaMega Pascal
PCPortland cement
FGfunctional groups
FAFly Ash
XRFX-ray fluorescence spectroscopy
SPSuperplasticizer
RCPTrapid chloride permeability test
H2SO4sulfuric acid
Na2SO4sodium sulphate
NaClsodium chloride
NaOHsodium hydroxide
DCDirect Current
MKMetakaolin
C-S-Hcalcium-silicate-hydrates
ASTMAmerican Society for Testing and Materials
BSBritish Standard
DOEDesign of Experiment
FCCDface-cantered central composite design
CSCompressive Strength
ANOVAAnalysis of variance
WAWater Absorption

References

  1. An, C.; Duan, M.; Toledo Filho, R.D.; Estefen, S.F. Collapse of sandwich pipes with PVA fiber reinforced cementitious composites core under external pressure. Ocean Eng. 2014, 82, 1–13. [Google Scholar] [CrossRef]
  2. Sahmaran, M.; Li, M.; Li, V.C. Transport Properties of Engineered Cementitious Composites under Chloride Exposure. ACI Mater. J. 2007, 104, 604–611. [Google Scholar]
  3. Khed, V.C.; Mohammed, B.S.; Liew, M.S.; Zawawi, N.A.W.A. Development of response surface models for self-compacting hybrid fibre reinforced rubberized cementitious composite. Constr. Build. Mater. 2020, 232, 117191. [Google Scholar] [CrossRef]
  4. Mohammed, B.S.; Khed, V.C.; Liew, M.S. Optimization of hybrid fibres in engineered cementitious composites. Constr. Build. Mater. 2018, 190, 24–37. [Google Scholar] [CrossRef]
  5. Zhang, Z.; Ma, H.; Qian, S. Investigation on Properties of ECC Incorporating Crumb Rubber of Different Sizes. J. Adv. Concr. Technol. 2015, 13, 241–251. [Google Scholar] [CrossRef]
  6. Singh, M.; Saini, B.; Chalak, H. Performance and composition analysis of engineered cementitious composite (ECC)—A review. J. Build. Eng. 2019, 26, 100851. [Google Scholar] [CrossRef]
  7. Wille, K.; Naaman, A.E.; El-Tawil, S.; Parra-Montesinos, G.J. Ultra-high performance concrete and fiber reinforced concrete: Achieving strength and ductility without heat curing. Mater. Struct. Constr. 2012, 45, 309–324. [Google Scholar] [CrossRef]
  8. Li, V.C. Engineered Cementitious Composite (Ecc): Material, Structural, and Durability Performance, 2nd ed.; CRC Press: Boca Raton, FL, USA, 2008; pp. 1001–1048. [Google Scholar]
  9. Zheng, Q.; Han, B.; Cui, X.; Yu, X.; Ou, J. Graphene-Engineered Cementitious Composites: Small Makes a Big Impact. Nanomater. Nanotechnol. 2017, 7, 1847980417742304. [Google Scholar] [CrossRef]
  10. Bassuoni, M.; Nehdi, M. Durability of self-consolidating concrete to sulfate attack under combined cyclic environments and flexural loading. Cem. Concr. Res. 2009, 39, 206–226. [Google Scholar] [CrossRef]
  11. Grengg, C.; Mittermayr, F.; Baldermann, A.; Böttcher, M.; Leis, A.; Koraimann, G.; Grunert, P.; Dietzel, M. Microbiologically induced concrete corrosion: A case study from a combined sewer network. Cem. Concr. Res. 2015, 77, 16–25. [Google Scholar] [CrossRef]
  12. Diab, A.M.; Elyamany, H.E.; Abd Elmoaty, A.E.M.; Shalan, A.H. Prediction of concrete compressive strength due to long term sulfate attack using neural network. Alex. Eng. J. 2014, 53, 627–642. [Google Scholar] [CrossRef]
  13. Arel, H.Ş.; Thomas, B.S. The effects of nano- and micro-particle additives on the durability and mechanical properties of mortars exposed to internal and external sulfate attacks. Results Phys. 2017, 7, 843–851. [Google Scholar] [CrossRef]
  14. Mehta, P. Mechanism of sulfate attack on portland cement concrete—Another look. Cem. Concr. Res. 1983, 13, 401–406. [Google Scholar] [CrossRef]
  15. Tchamba, A.; Sofack, J.; Yongue, R.; Melo, U. Formulation of calcium dialuminate (CaO·2Al2O3) refractory cement from local bauxite. J. Asian Ceram. Soc. 2015, 3, 164–172. [Google Scholar] [CrossRef]
  16. Harrison, W.H. Durability of Concrete in Acidic Soils and Waters. Concrete 1987, 21, 18–24. [Google Scholar]
  17. Soutsos, M. Concrete Durability: A Practical Guide to the Design of Durable Concrete Structures; Thomas Telford Ltd.: London, UK, 2009; p. 314. [Google Scholar]
  18. Gaze, M.; Crammond, N. The formation of thaumasite in a cement: Lime: Sand mortar exposed to cold magnesium and potassium sulfate solutions. Cem. Concr. Compos. 2000, 22, 209–222. [Google Scholar] [CrossRef]
  19. Stanton, T.E. Expansion of Concrete through Reaction between Cement and Aggregate. Trans. Am. Soc. Civ. Eng. 1942, 107, 54–84. [Google Scholar] [CrossRef]
  20. Diab, A.M.; Elyamany, H.E.; Elmoaty, A.E.M.A.; Sreh, M.M. Effect of nanomaterials additives on performance of concrete resistance against magnesium sulfate and acids. Constr. Build. Mater. 2019, 210, 210–231. [Google Scholar] [CrossRef]
  21. Diab, A.M.; Awad, A.E.M.; Elyamany, H.E.; Elmoaty, A.E.M.A. Guidelines in compressive strength assessment of concrete modified with silica fume due to magnesium sulfate attack. Constr. Build. Mater. 2012, 36, 311–318. [Google Scholar] [CrossRef]
  22. Yang, D.-Y.; Luo, J.-J. The damage of concrete under flexural loading and salt solution. Constr. Build. Mater. 2012, 36, 129–134. [Google Scholar] [CrossRef]
  23. Essawy, A.A.; El Aleem, S.A. Physico-mechanical properties, potent adsorptive and photocatalytic efficacies of sulfate resisting cement blends containing micro silica and nano-TiO2. Constr. Build. Mater. 2014, 52, 1–8. [Google Scholar] [CrossRef]
  24. Atahan, H.N.; Arslan, K.M. Improved durability of cement mortars exposed to external sulfate attack: The role of nano & micro additives. Sustain. Cities Soc. 2016, 22, 40–48. [Google Scholar] [CrossRef]
  25. Pavlík, V.; Unčík, S. The rate of corrosion of hardened cement pastes and mortars with additive of silica fume in acids. Cem. Concr. Res. 1997, 27, 1731–1745. [Google Scholar] [CrossRef]
  26. Dreyer, D.R.; Park, S.; Bielawski, C.W.; Ruoff, R.S. The chemistry of graphene oxide. Chem. Soc. Rev. 2010, 39, 228–240. [Google Scholar] [CrossRef]
  27. Compton, O.C.; Nguyen, S. Graphene Oxide, Highly Reduced Graphene Oxide, and Graphene: Versatile Building Blocks for Carbon-Based Materials. Small 2010, 6, 711–723. [Google Scholar] [CrossRef]
  28. McAllister, M.J.; Li, J.-L.; Adamson, D.H.; Schniepp, H.C.; Abdala, A.A.; Liu, J.; Herrera-Alonso, M.; Milius, D.L.; Car, R.; Prud’Homme, R.K.; et al. Single Sheet Functionalized Graphene by Oxidation and Thermal Expansion of Graphite. Chem. Mater. 2007, 19, 4396–4404. [Google Scholar] [CrossRef]
  29. Yang, H.; Cui, H.; Tang, W.; Li, Z.; Han, N.; Xing, F. A critical review on research progress of graphene/cement based composites. Compos. Part A Appl. Sci. Manuf. 2017, 102, 273–296. [Google Scholar] [CrossRef]
  30. Han, B.; Sun, S.; Ding, S.; Zhang, L.; Yu, X.; Ou, J. Review of nanocarbon-engineered multifunctional cementitious composites. Compos. Part A Appl. Sci. Manuf. 2015, 70, 69–81. [Google Scholar] [CrossRef]
  31. Sharma, S.; Kothiyal, N.C. Influence of graphene oxide as dispersed phase in cement mortar matrix in defining the crystal patterns of cement hydrates and its effect on mechanical, microstructural and crystallization properties. RSC Adv. 2015, 5, 52642–52657. [Google Scholar] [CrossRef]
  32. Tong, T.; Fan, Z.; Liu, Q.; Wang, S.; Tan, S.; Yu, Q. Investigation of the effects of graphene and graphene oxide nanoplatelets on the micro- and macro-properties of cementitious materials. Constr. Build. Mater. 2016, 106, 102–114. [Google Scholar] [CrossRef]
  33. Al-Dahawi, A.; Yıldırım, G.; Öztürk, O.; Şahmaran, M. Assessment of self-sensing capability of Engineered Cementitious Composites within the elastic and plastic ranges of cyclic flexural loading. Constr. Build. Mater. 2017, 145, 1–10. [Google Scholar] [CrossRef]
  34. Lin, C.; Wei, W.; Hu, Y.H. Catalytic behavior of graphene oxide for cement hydration process. J. Phys. Chem. Solids 2016, 89, 128–133. [Google Scholar] [CrossRef]
  35. Devi, S.C.; Khan, R.A. Influence of graphene oxide on sulfate attack and carbonation of concrete containing recycled concrete aggregate. Constr. Build. Mater. 2020, 250, 118883. [Google Scholar] [CrossRef]
  36. Zhu, Y.; Murali, S.; Cai, W.; Li, X.; Suk, J.W.; Potts, J.R.; Ruoff, R.S. Graphene and Graphene Oxide: Synthesis, Properties, and Applications. Adv. Mater. 2010, 22, 3906–3924. [Google Scholar] [CrossRef]
  37. Dikin, D.A.; Stankovich, S.; Zimney, E.J.; Piner, R.D.; Dommett, G.H.B.; Evmenenko, G.; Nguyen, S.T.; Ruoff, R.S. Preparation and characterization of graphene oxide paper. Nature 2007, 448, 457–460. [Google Scholar] [CrossRef]
  38. Mohammed, A.; Sanjayan, J.; Duan, W.; Nazari, A. Incorporating graphene oxide in cement composites: A study of transport properties. Constr. Build. Mater. 2015, 84, 341–347. [Google Scholar] [CrossRef]
  39. Wang, Q.; Wang, J.; Lu, C.-X.; Liu, B.-W.; Zhang, K.; Li, C.-Z. Influence of graphene oxide additions on the microstructure and mechanical strength of cement. Carbon 2015, 95, 1083–1084. [Google Scholar] [CrossRef]
  40. Zhao, L.; Guo, X.; Song, L.; Song, Y.; Dai, G.; Liu, J. An intensive review on the role of graphene oxide in cement-based materials. Constr. Build. Mater. 2020, 241, 117939. [Google Scholar] [CrossRef]
  41. Pan, Z.; He, L.; Qiu, L.; Korayem, A.H.; Li, G.; Zhu, J.W.; Collins, F.; Li, D.; Duan, W.H.; Wang, M.C. Mechanical properties and microstructure of a graphene oxide—Cement composite. Cem. Concr. Compos. 2015, 58, 140–147. [Google Scholar] [CrossRef]
  42. Fan, D.; Lue, L.; Yang, S. Molecular dynamics study of interfacial stress transfer in graphene-oxide cementitious composites. Comput. Mater. Sci. 2017, 139, 56–64. [Google Scholar] [CrossRef]
  43. Lee, S.-J.; Jeong, S.-H.; Kim, D.-U.; Won, J.-P. Graphene oxide as an additive to enhance the strength of cementitious composites. Compos. Struct. 2020, 242, 112154. [Google Scholar] [CrossRef]
  44. Chopra, P.; Kumar, R.; Kumar, M. Artificial Neural Networks for the Prediction of Compressive Strength of Concrete. Int. J. Appl. Sci. Eng. 2015, 13, 187–204. [Google Scholar]
  45. Zhang, L.; Sojobi, A.; Kodur, V.; Liew, K. Effective utilization and recycling of mixed recycled aggregates for a greener environment. J. Clean. Prod. 2019, 236, 117600. [Google Scholar] [CrossRef]
  46. Alsanusi, S.; Bentaher, L. Prediction of Compressive Strength of Concrete from Early Age Test Result Using Design of Experiments (RSM). Int. J. Civ. Environ. Struct. Constr. Archit. Eng. 2015, 9, 1522–1526. [Google Scholar]
  47. Qurishee, M.A.; Iqbal, I.T.; Islam, M.S.; Islam, M.M. Use of Slag As Coarse Aggregate and Its Effect on Mechanical Properties of Concrete. In Proceedings of the 3rd International Conference on Advances in Civil Engineering, CUET, Chittagong, Bangladesh, 21–23 December 2016. [Google Scholar]
  48. Alyamac, K.E.; Ghafari, E.; Ince, R. Development of eco-efficient self-compacting concrete with waste marble powder using the response surface method. J. Clean. Prod. 2017, 144, 192–202. [Google Scholar] [CrossRef]
  49. Şimşek, B.; Uygunoğlu, T.; Korucu, H.; Kocakerim, M.M. Analysis of the effects of dioctyl terephthalate obtained from polyethylene terephthalate wastes on concrete mortar: A response surface methodology based desirability function approach application. J. Clean. Prod. 2018, 170, 437–445. [Google Scholar] [CrossRef]
  50. Tyagi, M.; Rana, A.; Kumari, S.; Jagadevan, S. Adsorptive removal of cyanide from coke oven wastewater onto zero-valent iron: Optimization through response surface methodology, isotherm and kinetic studies. J. Clean. Prod. 2018, 178, 398–407. [Google Scholar] [CrossRef]
  51. Desai, K.M.; Survase, S.A.; Saudagar, P.S.; Lele, S.; Singhal, R.S. Comparison of artificial neural network (ANN) and response surface methodology (RSM) in fermentation media optimization: Case study of fermentative production of scleroglucan. Biochem. Eng. J. 2008, 41, 266–273. [Google Scholar] [CrossRef]
  52. Mehri, E.; Maryam, N.; Ghasem, N.; Ali Asghar, G. Modeling and Optimization of Ethanol Fermentation Using Saccharomyces Cerevisiae: Response Surface Methodology and Artificial Neural Network. Chem. Ind. Chem. Eng. Q. 2013, 19, 241–252. [Google Scholar]
  53. Bheel, N.; Benjeddou, O.; Almujibah, H.R.; Abbasi, S.A.; Sohu, S.; Ahmad, M.; Sabri, M.M.S. Effect of calcined clay and marble dust powder as cementitious material on the mechanical properties and embodied carbon of high strength concrete by using RSM-based modelling. Heliyon 2023, 9, e15029. [Google Scholar] [CrossRef]
  54. Awolusi, T.; Oke, O.; Akinkurolere, O.; Sojobi, A. Application of response surface methodology: Predicting and optimizing the properties of concrete containing steel fibre extracted from waste tires with limestone powder as filler. Case Stud. Constr. Mater. 2019, 10, e00212. [Google Scholar] [CrossRef]
  55. ASTM C150; Standard Specification for Portland Cement. ASTM International: West Conshohocken, PA, USA, 2015.
  56. ASTM C618-15; Standard Specification for Coal Fly Ash and Raw or Calcined Natural Pozzolan for Use in Concrete. ASTM International: West Conshohocken, PA, USA, 2015.
  57. Zhang, Z.; Yuvaraj, A.; Di, J.; Qian, S. Matrix design of light weight, high strength, high ductility ECC. Constr. Build. Mater. 2019, 210, 188–197. [Google Scholar] [CrossRef]
  58. Mohammed, B.S.; Achara, B.E.; Liew, M.S.; Alaloul, W.; Khed, V.C. Effects of elevated temperature on the tensile properties of NS-modified self-consolidating engineered cementitious composites and property optimization using response surface methodology (RSM). Constr. Build. Mater. 2019, 206, 449–469. [Google Scholar] [CrossRef]
  59. BS EN 12390-3; Testing Harden Concrete. Compressive Strength of Test Specimens. BSI: London, UK, 2009.
  60. BS 1881: Part 122: 1983; Method for Determination of Water Absorption. British Standards Institute: London, UK; Department, C.T.S British Stand: London, UK, 1983.
  61. AASHTO (T277-15); Electrical Indication of Concrete’s Ability to Resist Chloride Ion Penetration. American Association of State and Highway Transportation Officials: Washington, DC, USA, 2019.
  62. ASTM C1202-19; Standard Test Method for Electrical Indication of Concrete’s Ability to Resist Chloride Ion Penetration. ASTM: West Conshohocken, PA, USA, 2019.
  63. Praveenkumar, T.R.; Vijayalakshmi, M.M.; Meddah, M.S. Strengths and durability performances of blended cement concrete with TiO2 nanoparticles and rice husk ash. Constr. Build. Mater. 2019, 217, 343–351. [Google Scholar] [CrossRef]
  64. Self-Compacting Concrete European Project Group. The European Guidelines for Self-Compacting Concrete: Specification, Production and Use. Eur. Guidel. Self Compact. Concr. 2005, 68. [Google Scholar]
  65. Arun, B.R.; Nagaraja, P.S.; Srishaila, J.M. An Effect of NaOH Molarity on Fly Ash—Metakaolin-Based Self-Compacting Geopolymer Concrete. Lect. Notes Civ. Eng. 2019, 25, 233–244. [Google Scholar] [CrossRef]
  66. Bheel, N.; Awoyera, P.; Tafsirojjaman, T.; Sor, N.H.; Sohu, S. Synergic effect of metakaolin and groundnut shell ash on the behavior of fly ash-based self-compacting geopolymer concrete. Constr. Build. Mater. 2021, 311, 125327. [Google Scholar] [CrossRef]
  67. Bheel, N.; Awoyera, P.; Shar, I.A.; Abbasi, S.A.; Khahro, S.H. Synergic effect of millet husk ash and wheat straw ash on the fresh and hardened properties of Metakaolin-based self-compacting geopolymer concrete. Case Stud. Constr. Mater. 2021, 15, e00729. [Google Scholar] [CrossRef]
  68. Kong, H.-J.; Bike, S.G.; Li, V.C. Development of a self-consolidating engineered cementitious composite employing electrosteric dispersion/stabilization. Cem. Concr. Compos. 2003, 25, 301–309. [Google Scholar] [CrossRef]
  69. Abdulkadir, I.; Mohammed, B.S.; Ali, M.O.A.; Liew, M.S. Effects of Graphene Oxide and Crumb Rubber on the Fresh Properties of Self-Compacting Engineered Cementitious Composite Using Response Surface Methodology. Materials 2022, 15, 2519. [Google Scholar] [CrossRef]
  70. Wei, Z.; Wang, Y.; Qi, M.; Bi, J.; Yang, S.; Yuan, X. The role of sucrose on enhancing properties of graphene oxide reinforced cement composites containing fly ash. Constr. Build. Mater. 2021, 293, 123507. [Google Scholar] [CrossRef]
  71. Lee, S.-J.; Jeong, S.-H.; Kim, D.-U.; Won, J.-P. Effects of graphene oxide on pore structure and mechanical properties of cementitious composites. Compos. Struct. 2020, 234, 111709. [Google Scholar] [CrossRef]
  72. Lv, S.; Ma, Y.; Qiu, C.; Sun, T.; Liu, J.; Zhou, Q. Effect of graphene oxide nanosheets of microstructure and mechanical properties of cement composites. Constr. Build. Mater. 2013, 49, 121–127. [Google Scholar] [CrossRef]
  73. Gong, K.; Pan, Z.; Korayem, A.H.; Qiu, L.; Li, D.; Collins, F.; Wang, C.M.; Duan, W.H. Reinforcing Effects of Graphene Oxide on Portland Cement Paste. J. Mater. Civ. Eng. 2015, 27, 1125. [Google Scholar] [CrossRef]
  74. Kang, D.; Seo, K.S.; Lee, H.; Chung, W. Experimental study on mechanical strength of GO-cement composites. Constr. Build. Mater. 2017, 131, 303–308. [Google Scholar] [CrossRef]
  75. Wang, Q.; Wang, J.; Lu, C.-X.; Liu, B.-W.; Zhang, K.; Li, C.-Z. Influence of graphene oxide additions on the microstructure and mechanical strength of cement. New Carbon Mater. 2015, 30, 349–356. [Google Scholar] [CrossRef]
  76. Bheel, N.; Ali, M.O.A.; Kırgız, M.S.; Shafiq, N.; Gobinath, R. Effect of graphene oxide particle as nanomaterial in the production of engineered cementitious composites including superplasticizer, fly ash, and polyvinyl alcohol fiber. Mater. Today Proc. 2023. [Google Scholar] [CrossRef]
  77. Ramyar, K.; Inan, G. Sodium sulfate attack on plain and blended cements. Build. Environ. 2007, 42, 1368–1372. [Google Scholar] [CrossRef]
  78. Mohammed, B.S.; Yen, L.Y.; Haruna, S.; Huat, M.L.S.; Abdulkadir, I.; Al-Fakih, A.; Liew, M.S.; Zawawi, N.A.W.A. Effect of Elevated Temperature on the Compressive Strength and Durability Properties of Crumb Rubber Engineered Cementitious Composite. Materials 2020, 13, 3516. [Google Scholar] [CrossRef]
  79. Sabapathy, L.; Mohammed, B.S.; Al-Fakih, A.; Wahab, M.M.A.; Liew, M.S.; Amran, Y.H.M. Acid and Sulphate Attacks on a Rubberized Engineered Cementitious Composite Containing Graphene Oxide. Materials 2020, 13, 3125. [Google Scholar] [CrossRef]
  80. Gu, L.; Bennett, T.; Visintin, P. Sulphuric acid exposure of conventional concrete and alkali-activated concrete: Assessment of test methodologies. Constr. Build. Mater. 2018, 197, 681–692. [Google Scholar] [CrossRef]
  81. Chintalapudi, K.; Pannem, R.M.R. Enhanced chemical resistance to sulphuric acid attack by reinforcing Graphene Oxide in Ordinary and Portland Pozzolana cement mortars. Case Stud. Constr. Mater. 2022, 17, e01452. [Google Scholar] [CrossRef]
  82. Arif, M.; Gupta, V.; Choudhary, H.; Kumar, S.; Basu, P. Performance evaluation of cement concrete containing sandstone slurry. Constr. Build. Mater. 2018, 184, 432–439. [Google Scholar] [CrossRef]
  83. Aiken, T.A.; Kwasny, J.; Sha, W.; Soutsos, M.N. Effect of slag content and activator dosage on the resistance of fly ash geopolymer binders to sulfuric acid attack. Cem. Concr. Res. 2018, 111, 23–40. [Google Scholar] [CrossRef]
  84. Wan, X.-M.; Wittmann, F.H.; Zhao, T.-J.; Fan, H. Chloride content and pH value in the pore solution of concrete under carbonation. J. Zhejiang Univ. A 2013, 14, 71–78. [Google Scholar] [CrossRef]
  85. Kumari, K.; Preetha, R.; Ramachandran, D.; Vishwakarma, V.; George, R.P.; Sundaramurthy, C.; Mudali, U.K.; Pillai, C.S. Nanoparticles for enhancing mechanical properties of fly ash concrete. Mater. Today Proc. 2016, 3, 2387–2393. [Google Scholar] [CrossRef]
  86. Zeng, H.; Li, Y.; Zhang, J.; Chong, P.; Zhang, K. Effect of limestone powder and fly ash on the pH evolution coefficient of concrete in a sulfate-freeze—Thaw environment. J. Mater. Res. Technol. 2021, 16, 1889–1903. [Google Scholar] [CrossRef]
  87. Khotbehsara, M.M.; Miyandehi, B.M.; Naseri, F.; Ozbakkaloglu, T.; Jafari, F.; Mohseni, E. Effect of SnO2, ZrO2, and CaCO3 nanoparticles on water transport and durability properties of self-compacting mortar containing fly ash: Experimental observations and ANFIS predictions. Constr. Build. Mater. 2018, 158, 823–834. [Google Scholar] [CrossRef]
  88. Schwarz, N.; Neithalath, N. Influence of a fine glass powder on cement hydration: Comparison to fly ash and modeling the degree of hydration. Cem. Concr. Res. 2008, 38, 429–436. [Google Scholar] [CrossRef]
  89. Miyandehi, B.M.; Feizbakhsh, A.; Yazdi, M.A.; Liu, Q.-F.; Yang, J.; Alipour, P. Performance and properties of mortar mixed with nano-CuO and rice husk ash. Cem. Concr. Compos. 2016, 74, 225–235. [Google Scholar] [CrossRef]
  90. Luhar, S.; Luhar, I.; Nicolaides, D.; Gupta, R. Durability Performance Evaluation of Rubberized Geopolymer Concrete. Sustainability 2021, 13, 5969. [Google Scholar] [CrossRef]
  91. Rodríguez, A.; Santamaría-Vicario, I.; Calderón, V.; Junco, C.; García-Cuadrado, J. Study of the expansion of cement mortars manufactured with Ladle Furnace Slag LFS. Mater. Constr. 2019, 69, 183. [Google Scholar] [CrossRef]
  92. Sarwary, M.H.; Yıldırım, G.; Al-Dahawi, A.; Anıl, Ö.; Khiavi, K.A.; Toklu, K.; Şahmaran, M. Self-Sensing of Flexural Damage in Large-Scale Steel-Reinforced Mortar Beams. ACI Mater. J. 2019, 116, 51715581. [Google Scholar] [CrossRef]
  93. Anwar, A.; Mohammed, B.S.; Wahab, M.B.A.; Liew, M. Enhanced properties of cementitious composite tailored with graphene oxide nanomaterial—A review. Dev. Built Environ. 2019, 1, 100002. [Google Scholar] [CrossRef]
  94. Tittelboom, K.V.; De Belie, N.; Hooton, D. A Critical Review on Test Methods for Evaluating the Resistance of Concrete against Sulfate Attack. In Proceedings of the Chapter 4 in Performance of Cement-Based Materials in Aggressive Aqueous Environments, Rilem Proceedings, Toulouse, France, 3–5 June 2009; PRO 63. pp. 298–306. [Google Scholar]
  95. Hill, J.; Byars, E.; Sharp, J.; Lynsdale, C.; Cripps, J.; Zhou, Q. An experimental study of combined acid and sulfate attack of concrete. Cem. Concr. Compos. 2003, 25, 997–1003. [Google Scholar] [CrossRef]
  96. Honglei, C.; Zuquan, J.; Penggang, W.; Jianhong, W.; Jian, L. Comprehensive resistance of fair-faced concrete suffering from sulfate attack under marine environments. Constr. Build. Mater. 2021, 277, 122312. [Google Scholar] [CrossRef]
  97. Li, Y.; Yang, X.; Lou, P.; Wang, R.; Li, Y.; Si, Z. Sulfate attack resistance of recycled aggregate concrete with NaOH-solution-treated crumb rubber. Constr. Build. Mater. 2021, 287, 123044. [Google Scholar] [CrossRef]
  98. Behfarnia, K.; Farshadfar, O. The effects of pozzolanic binders and polypropylene fibers on durability of SCC to magnesium sulfate attack. Constr. Build. Mater. 2013, 38, 64–71. [Google Scholar] [CrossRef]
  99. Khan, M.H.; Zhu, H.; Sikandar, M.A.; Zamin, B.; Ahmad, M.; Sabri, M.M.S. Effects of Various Mineral Admixtures and Fibrillated Polypropylene Fibers on the Properties of Engineered Cementitious Composite (ECC) Based Mortars. Materials 2022, 15, 2880. [Google Scholar] [CrossRef]
  100. Mohammed, B.S.; Haruna, S.; Wahab, M.M.B.A.; Liew, M. Optimization and characterization of cast in-situ alkali-activated pastes by response surface methodology. Constr. Build. Mater. 2019, 225, 776–787. [Google Scholar] [CrossRef]
  101. Ghafari, E.; Costa, H.; Júlio, E. RSM-based model to predict the performance of self-compacting UHPC reinforced with hybrid steel micro-fibers. Constr. Build. Mater. 2014, 66, 375–383. [Google Scholar] [CrossRef]
  102. Mohammed, B.S. Evaluating the static and dynamic modulus of elasticity of roller compacted rubbercrete using response surface methodology. Int. J. Geomate 2018, 14, 42833. [Google Scholar] [CrossRef]
  103. Sadhukhan, B.; Mondal, N.K.; Chattoraj, S. Optimisation using central composite design (CCD) and the desirability function for sorption of methylene blue from aqueous solution onto Lemna major. Karbala Int. J. Mod. Sci. 2016, 2, 145–155. [Google Scholar] [CrossRef]
  104. Zahid, M.; Shafiq, N.; Isa, M.H.; Gil, L. Statistical modeling and mix design optimization of fly ash based engineered geopolymer composite using response surface methodology. J. Clean. Prod. 2018, 194, 483–498. [Google Scholar] [CrossRef]
  105. Mtarfi, N.; Rais, Z.; Taleb, M.; Kada, K. Effect of fly ash and grading agent on the properties of mortar using response surface methodology. J. Build. Eng. 2017, 9, 109–116. [Google Scholar] [CrossRef]
  106. Mermerdaş, K.; Algın, Z.; Oleiwi, S.M.; Nassani, D.E. Optimization of lightweight GGBFS and FA geopolymer mortars by response surface method. Constr. Build. Mater. 2017, 139, 159–171. [Google Scholar] [CrossRef]
  107. Murali, M.; Mohammed, B.S.; Abdulkadir, I.; Liew, M.S.; Alaloul, W.S. Utilization of Crumb Rubber and High-Volume Fly Ash in Concrete for Environmental Sustainability: RSM-Based Modeling and Optimization. Materials 2021, 14, 3322. [Google Scholar] [CrossRef] [PubMed]
Figure 1. Experimental testing setup: (a) compressive strength; (b) weight loss; (c) change in length; (d) RCPT; (e) pH test; and (f) prisms for sulfate attack test.
Buildings 13 02026 g001aBuildings 13 02026 g001b
Figure 2. Schematic diagram of the experimental investigation.
Buildings 13 02026 g002
Figure 3. Slump flow of fresh GO-ECC.
Buildings 13 02026 g003
Figure 4. Compressive strength of GO-ECC mixes.
Buildings 13 02026 g004
Figure 5. Weight loss due to Acid Attack.
Buildings 13 02026 g005
Figure 6. Change in length due to acid attack.
Buildings 13 02026 g006
Figure 7. Compressive Strength due to Acid Attack.
Buildings 13 02026 g007
Figure 8. A relationship between compressive strength and compressive strength due to acid attack.
Buildings 13 02026 g008
Figure 9. pH value of GO-ECC due to Acid Attack.
Buildings 13 02026 g009
Figure 10. A relationship between weight loss and pH value due to acid attack.
Buildings 13 02026 g010
Figure 11. Rapid chloride penetration test of GO-ECC.
Buildings 13 02026 g011
Figure 12. Weight gain of GO-ECC due to sulphate attack.
Buildings 13 02026 g012
Figure 13. Expansion of GO-ECC due to sulphate attack.
Buildings 13 02026 g013
Figure 14. Compressive Strength of GO-ECC due to Sulphate Attack.
Buildings 13 02026 g014
Figure 15. A relation between compressive strength and compressive strength due to sulfate attack.
Buildings 13 02026 g015
Figure 16. Water Absorption of GO-ECC.
Buildings 13 02026 g016
Figure 17. Predicted versus actual plots for: (a) CS; (b) weight loss; (c) change in length; (d) CS due to acid attack; (e) pH test; (f) RCPT; (g) weight gain; (h) expansion; (i) CS due to sulfate attack; and (j) Water Absorption.
Buildings 13 02026 g017aBuildings 13 02026 g017b
Figure 18. Compressive strength for (a) 2D contour plot and (b) 3D response surface diagram.
Buildings 13 02026 g018
Figure 19. Weight loss for (a) 2D contour plot and (b) 3D response surface diagram.
Buildings 13 02026 g019
Figure 20. Change in length for (a) 2D contour plot; and (b) 3D response surface diagram.
Buildings 13 02026 g020
Figure 21. CS due to Acid Attack for (a) 2D contour plot and (b) 3D response surface diagram.
Buildings 13 02026 g021
Figure 22. pH Test for (a) 2D contour plot; and (b) 3D response surface diagram.
Buildings 13 02026 g022
Figure 23. RCPT for (a) 2D contour plot and (b) 3D response surface diagram.
Buildings 13 02026 g023
Figure 24. Weight gain for (a) 2D contour plot; and (b) 3D response surface diagram.
Buildings 13 02026 g024
Figure 25. Expansion for (a) 2D contour plot; and (b) 3D response surface diagram.
Buildings 13 02026 g025
Figure 26. CS due to sulfate attack for (a) 2D contour plot and (b) 3D response surface diagram.
Buildings 13 02026 g026
Figure 27. Water absorption for (a) 2D contour plot; and (b) 3D response surface diagram.
Buildings 13 02026 g027
Figure 28. Optimization solution ramp.
Buildings 13 02026 g028
Figure 29. 3D diagram for the desirability of the optimization.
Buildings 13 02026 g029
Table 1. XRF of PC and FA.
MaterialsCompound (%)Specific GravityBlaine Fineness (m2/kg)
SiO2Al2O3Fe2O3MnOCaOMgONa2OK2OT2O
PC20.765.543.35-61.42.480.190.78-3.15290
FA57.0120.964.150.0339.791.752.231.530.682.38325
Table 2. Properties of polyvinyl alcohol fiber.
MaterialsCompound (%)Specific GravityBlaine Fineness (m2/Kg)Loss on Ignition
SiO2Al2O3Fe2O3MnOCaOMgONa2OK2OT2O
FA57.0120.964.150.0339.791.752.231.530.682.382901.25
Cement20.765.543.35-61.42.480.190.78-3.153252.20
Table 3. Mix Proportion of GO-ECC generated by RSM.
Mix IDMaterials (%)Quantity of Materials Used in ECC Mixture (kg/m3)
GOPVAPCFly AshSandWater
M00.002583700467385
M10.051.5583700467385
M20.0652583700467385
M30.0651.5583700467385
M40.081.5583700467385
M50.0651.5583700467385
M60.0651583700467385
M70.052583700467385
M80.0651.5583700467385
M90.051583700467385
M100.0651.5583700467385
M110.081583700467385
M120.0651.5583700467385
M130.082583700467385
Table 4. ANOVA outcomes.
ResponseSourceSum of SquaresDfMean SquareF-Valuep-Value > FSignificance
Model531.855106.3759.08<0.0001Yes
A-PVA81.40181.4045.210.0003Yes
B-GO352.671352.67195.87<0.0001Yes
AB13.32113.327.400.0298No
A20.09810.0980.0540.8223No
B270.11170.1138.940.0004Yes
Compressive StrengthResidual12.6071.80
Lack of Fit12.5734.19538.66<0.0001Yes
Pure Error0.03147.780 × 10³
Cor Total544.4512
Model24.17212.0826.250.0001Yes
A-PVA24.00124.0052.14<0.0001Yes
B-GO0.1710.170.360.5607No
Weight LossResidual4.60100.46
Lack of Fit1.8060.300.430.8303No
Pure Error2.8040.70
Cor Total28.7712
Model0.2850.05664.96<0.0001Yes
A-PVA0.06210.06271.40<0.0001Yes
B-GO0.1910.19215.59<0.0001Yes
AB0.02610.02629.470.0010Yes
Change in LengthA25.255 × 10³15.255 × 10³6.050.0435Yes
B24.729 × 10³14.729 × 10³5.440.0524No
Residual6.080 × 10³78.686 × 10⁻⁴
Lack of Fit5.800 × 10³31.933 × 10³27.620.0039Yes
Pure Error2.800 × 10−447.000 × 10⁻⁵
Cor Total0.2912
Model597.955119.5960.98<0.0001Yes
A-PVA110.131110.1356.160.0001Yes
B-GO392.441392.44200.11<0.0001Yes
AB11.45111.455.840.0463Yes
Compressive Strength due to Acid AttackA20.6010.600.310.5977No
B266.35166.3533.830.0007Yes
Residual13.7371.96
Lack of Fit13.4034.4755.240.0010Yes
Pure Error0.3240.081
Cor Total611.6812
Model1.3950.28362.31<0.0001Yes
A-PVA0.8410.841096.08<0.0001Yes
B-GO0.4910.49640.52<0.0001Yes
AB4.000 × 10−414.000 × 10−40.520.4944No
pH ValueA20.02910.02937.510.0005Yes
B20.04910.04963.24<0.0001Yes
Residual5.389 × 10³77.698 × 10⁻⁴
Lack of Fit4.989 × 10³31.663 × 10³16.630.0101Yes
Pure Error4.000 × 10−441.000 × 10⁻⁴
Cor Total1.4012
Model3.671 × 105573,429.32199.49<0.0001Yes
A-PVA2.714 × 10512.714 × 105737.22<0.0001Yes
B-GO86,880.67186,880.67236.03<0.0001Yes
Rapid Chloride Penetration TestAB4225.0014225.0011.480.0116Yes
A23816.3713816.3710.370.0147Yes
B213.03113.030.0350.8561No
Residual2576.637368.09
Lack of Fit2563.833854.61267.07<0.0001Yes
Pure Error12.8043.20
Cor Total3.697 × 10512
Model0.6250.1263.28<0.0001Yes
A-PVA0.5410.54273.87<0.0001Yes
B-GO6.667 × 10³16.667 × 10³3.380.1085No
AB0.04010.04020.290.0028Yes
Weight GainA20.03110.03115.490.0056Yes
B27.389 × 10−517.389 × 10−50.0370.8520No
Residual0.01471.972 × 10−3
Lack of Fit0.01334.467 × 10−344.670.0016Yes
Pure Error4.000 × 10−441.000 × 10⁻⁴
Cor Total0.6412
Model1.516 × 10−527.582 × 10−641.11<0.0001Yes
A-PVA3.682 × 10−613.682 × 10−619.960.0012Yes
B-GO1.148 × 10−511.148 × 10−562.25<0.0001Yes
ExpansionResidual1.844 × 10−6101.844 × 10−7
Lack of Fit1.816 × 10−663.027 × 10−743.250.0014Yes
Pure Error2.800 × 10−847.000 × 10⁻⁹
Cor Total1.701 × 10−512
Model552.255110.4563.26<0.0001Yes
A-PVA87.78187.7850.270.0002Yes
B-GO364.651364.65208.84<0.0001Yes
AB13.85113.857.930.0259Yes
Compressive Strength due to Sulfate AttackA20.3110.310.180.6849No
B269.63169.6339.880.0004Yes
Residual12.2271.75
Lack of Fit11.9333.9854.900.0010Yes
Pure Error0.2940.072
Cor Total564.4712
Model2.1550.4386.25<0.0001Yes
A-PVA1.6011.60320.86<0.0001Yes
B-GO0.2810.2856.430.0001Yes
AB0.00010.0000.0001.0000No
A20.1910.1937.500.0005No
Water AbsorptionB20.01010.0102.010.1987No
Residual0.03574.992 × 10³
Lack of Fit6.943 × 10³32.314 × 10³0.330.8050No
Pure Error0.02847.000 × 10³
Cor Total2.1912
Table 5. Specification for Model Validation.
Model Validation ConstraintsCSWeight
Loss
Change in LengthCS Due Acid AttackpHRCPTWeight GainExpansionCS Due to Acid AttackWA
Std. Dev.1.340.680.0291.400.02819.190.0444.295 × 10−41.320.071
Mean61.056.310.4857.7210.23966.540.864.469 × 10³59.011.33
C.V. %2.2010.766.142.430.271.985.189.612.245.31
PRESS126.007.820.058135.930.05118,660.170.143.852 × 10−6120.840.11
−2 Log Likelihood36.4923.39−62.7937.60−64.36105.65−52.13−168.1036.09−40.05
R-Squared0.97690.84000.97890.97760.99620.99300.97840.89160.97830.9840
Adj R-Squared0.96030.80800.96380.96150.99340.98810.96290.86990.96290.9726
Pred R-Squared0.76860.72810.79760.77780.96370.94950.78540.77350.78590.9494
Adeq Precision24.90213.29627.80226.00870.20751.09726.51921.00425.89030.556
BIC51.8831.09−47.4052.99−48.97121.04−36.74−160.4051.48−24.66
AICc62.4932.06−36.7963.60−38.36131.65−26.13−159.4362.09−14.05
Table 6. Optimization goals and results.
FactorsInput FactorsResponses (Output Factors)
GO
(%)
PVA
(%)
CS
(MPa)
WA
(%)
RCPT
(Coulombs)
Sulfate AttackAcid Attack
Wt. Gain (%)Expansion
(%)
CS
(MPa)
Wt. Loss (%)Change in Length (%)CSpH
ValueMin.0.05153.10.806950.400.002350.8640.2848.589.55
Max.0.08278.62.2013651.200.006576.8790.8376.2410.91
GoalRangeRangeMax.Min.Min.Min.Max.MaxMin.Min.Max.Min.
Optimization Results0.05177.031.20862.890.560.005075.374.140.4774.6710.11
Desirability78.2% (0.782)
Disclaimer/Publisher’s Note: The statements, opinions and data contained in all publications are solely those of the individual author(s) and contributor(s) and not of MDPI and/or the editor(s). MDPI and/or the editor(s) disclaim responsibility for any injury to people or property resulting from any ideas, methods, instructions or products referred to in the content.

