Review

Review of Wind-Induced Effects Estimation through Nonlinear Analysis of Tall Buildings, High-Rise Structures, Flexible Bridges and Transmission Lines

1
Department of Resources and Environment, School of Civil Engineering and Architecture, Chongqing University of Science & Technology, Chongqing 401331, China
2
Department of Architectural Engineering, School of Urban Construction, Hainan Vocational University of Science & Technology, Haikou 571126, China
3
Chongqing Key Laboratory of Energy Engineering Mechanics & Disaster Prevention and Mitigation, Chongqing 401331, China
*
Author to whom correspondence should be addressed.
Buildings 2023, 13(8), 2033; https://doi.org/10.3390/buildings13082033
Submission received: 26 June 2023 / Revised: 7 August 2023 / Accepted: 7 August 2023 / Published: 9 August 2023

Abstract

:
The nonlinear effects exhibited by structures under the action of wind loads have gradually stepped into the vision of wind-resistant researchers. By summarizing the prominent wind-induced nonlinear problems of four types of wind-sensitive structures, namely tall buildings, high-rise structures, flexible bridges, and transmission lines, the occurrence mechanism of their nonlinear effects is revealed, providing cutting-edge research progress in theoretical studies, experimental methods and vibration control. Aerodynamic admittance provides insights into the aerodynamic nonlinearity (AN) between the wind pressure spectrum and wind speed spectrum of tall building surfaces. The equivalent nonlinear equation method is used to solve nonlinear vibration equations with generalized van-der-Pol-type aerodynamic damping terms. The elastic–plastic finite element method and multiscale modeling method are widely employed to analyze the effects of geometric nonlinearity (GN) and material nonlinearity (MN) at local nodes on the wind-induced response of latticed tall structures. The AN in blunt sections of bridges arises from the amplitude dependence of the aerodynamic derivative and the higher-order term of the self-excited force. Volterra series aerodynamic models are more suitable for the nonlinear aerodynamic modeling of bridges than the polynomial models studied more in the past. The improved Lindstedt–Poincare perturbation method, which considers the strong GN in the response of ice-covered transmission lines, offers high accuracy. The complex numerical calculations and nonlinear analyses involved in wind-induced nonlinear effects continue to consume significant computational resources and time, especially for complex wind field conditions and flexible and variable structural forms. It is necessary to further develop analytical, modeling and identification tools to facilitate the modeling of nonlinear features in the future.

1. Introduction

As high-strength materials and new structural types emerge, mechanical systems are growing increasingly complex. Consequently, the wind-induced nonlinear vibration issues associated with tall buildings, high-rise structures, flexible bridges, and transmission lines have become more prominent (to distinguish from tall buildings, high-rise structures here are those that people cannot use for production or living, such as transmission towers, cooling towers, TV towers, etc.). These problems no longer align with the linear assumptions used in previous theoretical or experimental analyses [1,2,3]. To this end, there is an urgent need to develop calculation theories and test methods for wind-induced nonlinear effects. This will allow for a deeper understanding of the nonlinear properties, mechanisms, and evolutionary laws associated with wind-induced phenomena. Ultimately, these advancements will provide a scientific basis and technical support for future wind-resistant designs of high slenderness ratio and large-span structures. Wind-induced nonlinear effects typically encompass three factors: geometric nonlinearity (GN), material nonlinearity (MN), and aerodynamic nonlinearity (AN) [4].
GN arises from the need to establish the static equilibrium and deformation coordination equations based on the postdeformation position. This is represented by the nonlinear variation in the geometric stiffness matrix [5]. MN arises from materials in the structure that do not follow linear stress–strain relationships, leading to the nonlinear variation in the elastic stiffness matrix [6]. AN arises from the complex fluid–solid coupling phenomenon observed in flexible structures subjected to wind loads, resulting in nonlinearity in aerodynamic damping, aerodynamic stiffness, and aerodynamic mass matrix [7]. Any of these three nonlinearities will induce a nonlinear effect in the entire system, which can be mathematically expressed as a nonlinear differential vibration equation. Solving this vibration equation analytically provides an effective means to study the system’s motion patterns and the relationship between motion characteristics and system parameters for parameter control. However, analyzing nonlinear effects is more challenging than traditional linear analysis methods, as it requires considering highly complex nonlinear behaviors such as significant geometric deformations, nonlinear material stress–strain relationships, and nonlinear aerodynamics. Consequently, this increases the difficulty of structural analysis.
This paper discusses the analysis of wind-induced nonlinear effects by examining the vibration characteristics of various structures, including tall buildings, high-rise structures, flexible bridges, and transmission lines. It identifies key problems in the analysis of these effects and explores their solutions. Combining nonlinear vibration analysis theory, wind tunnel tests, numerical simulations, and field measurements, the application of these methods to the above four types of structural nonlinear effect problems is discussed.

2. Tall Buildings

When studying wind-resistance in tall buildings, wind-induced vibration is typically categorized into three types: along-wind vibration, crosswind vibration, and torsional vibration [8]. These classifications are based on the relationship between aerodynamic force and the direction of incoming airflow, as depicted in Figure 1.
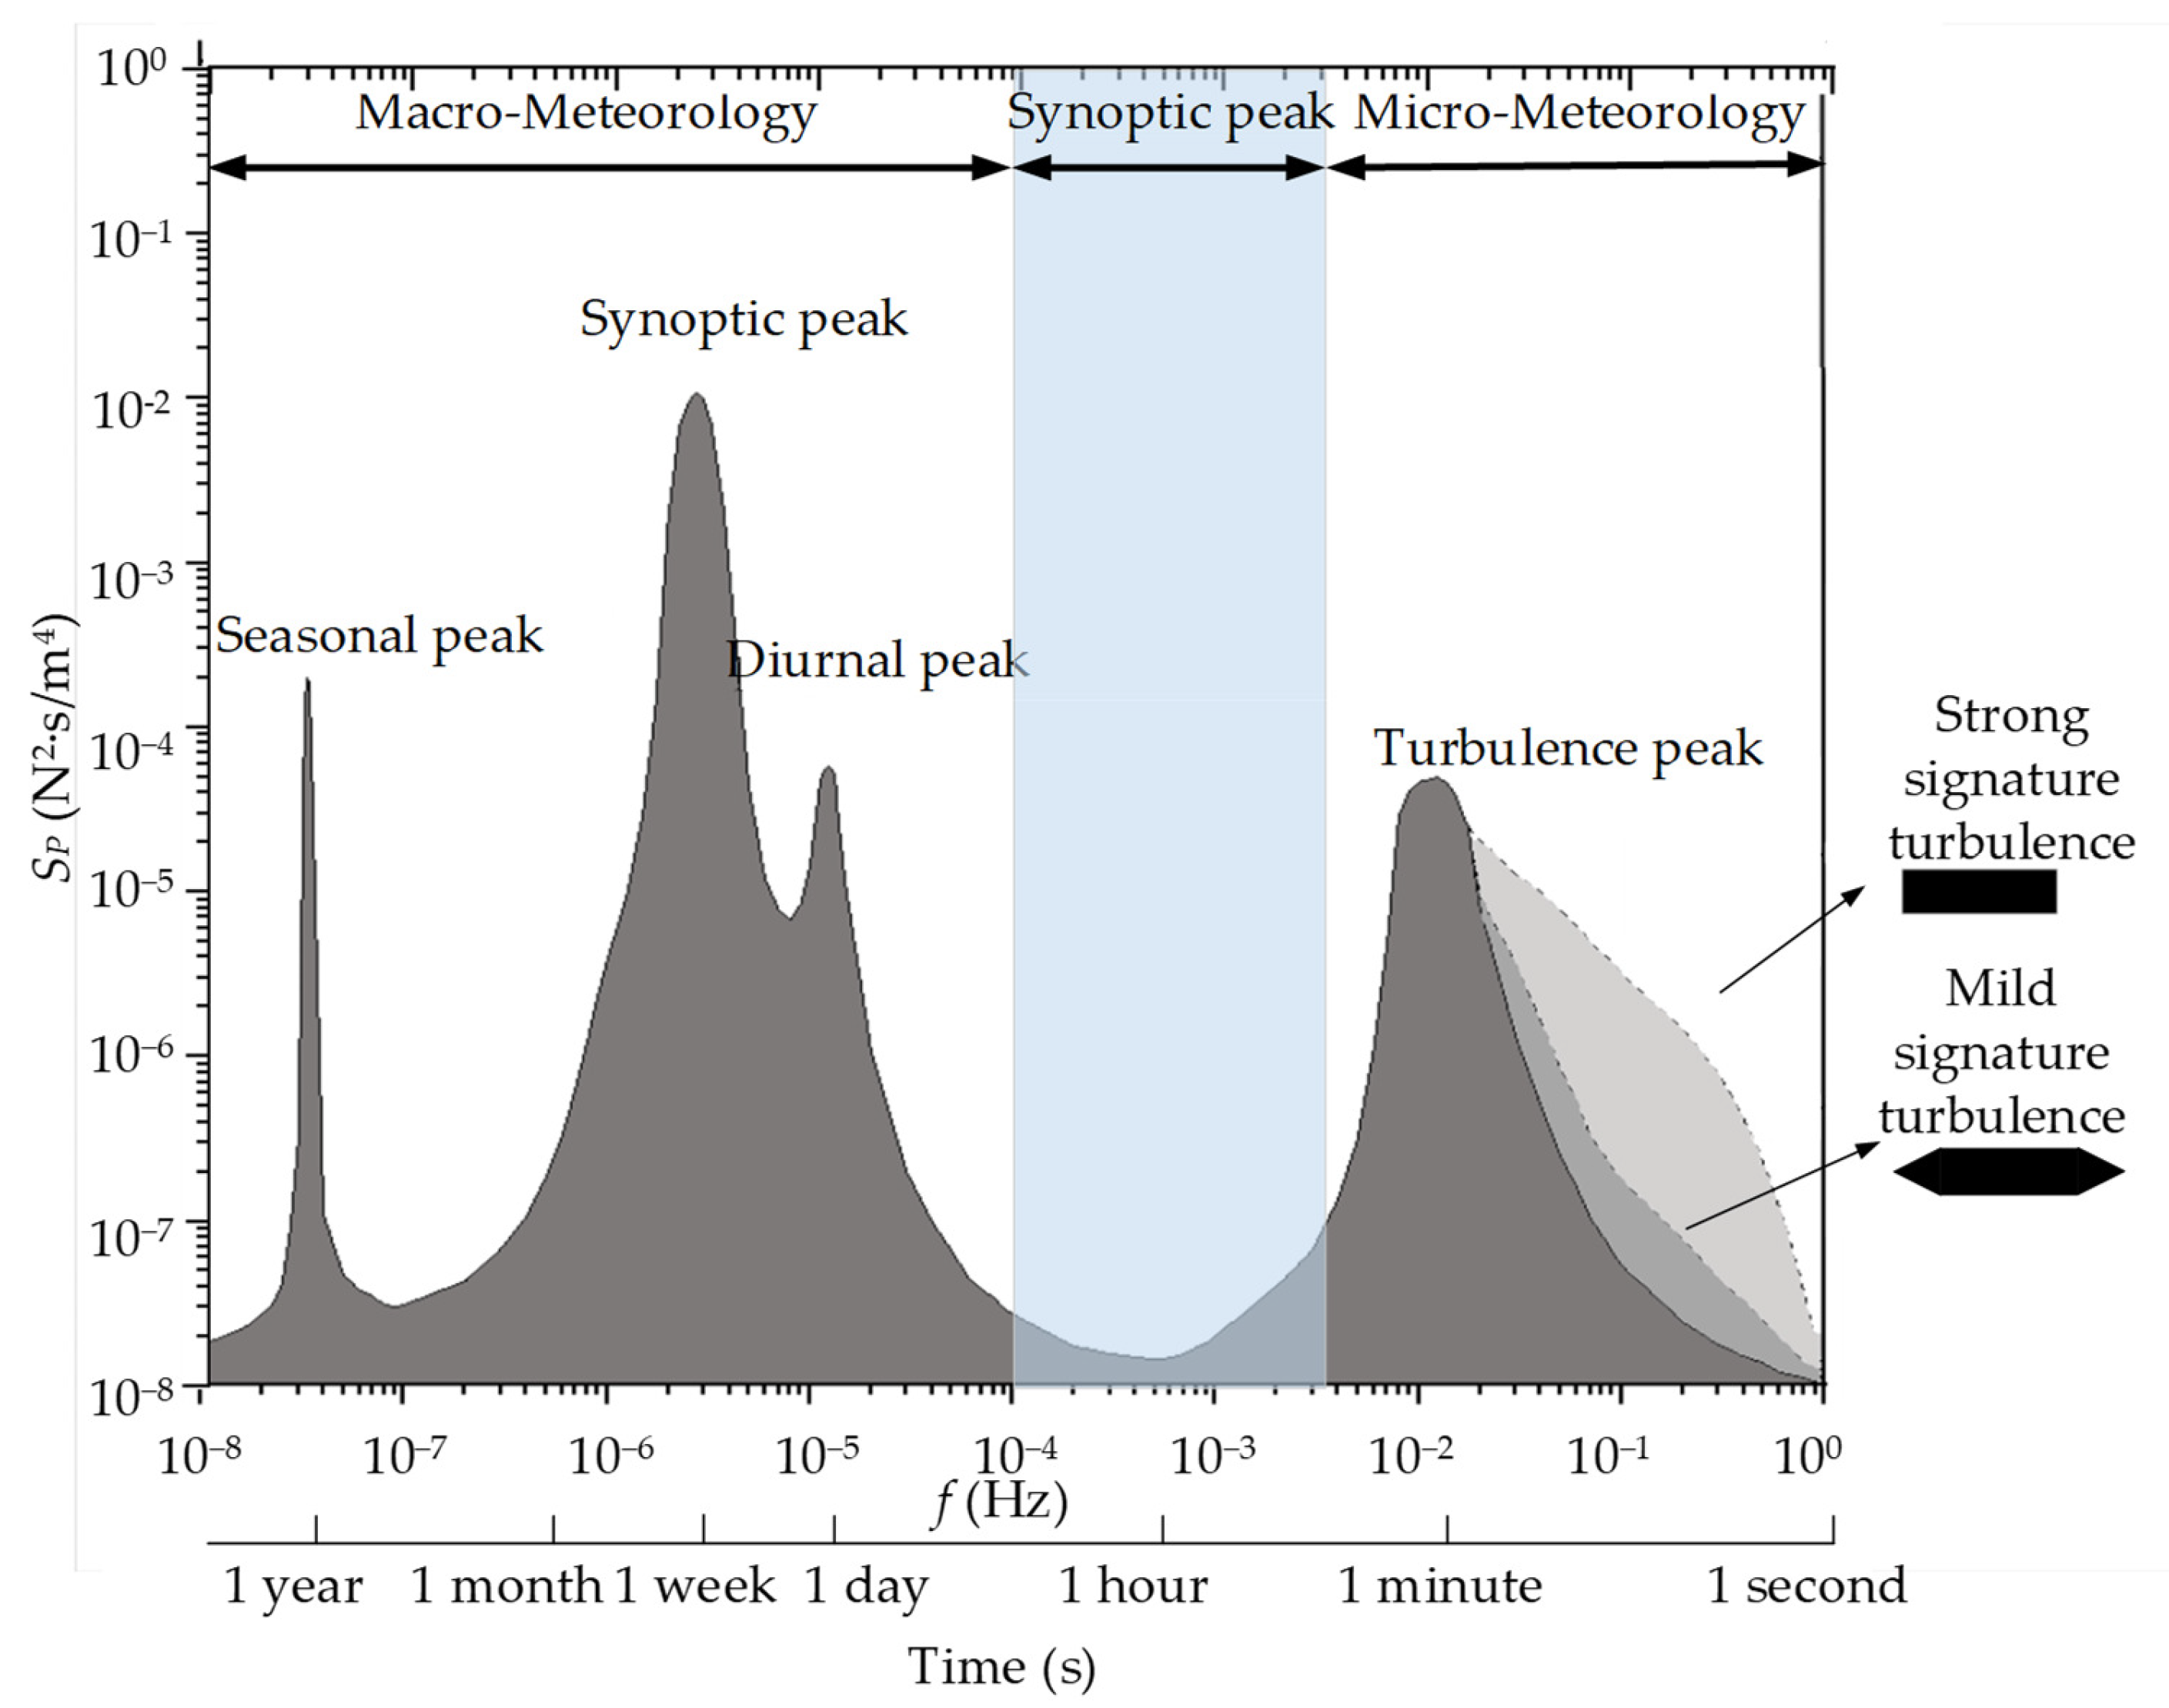
In normal-height buildings, along-wind loads predominantly play a controlling role [9]. Along-wind vibration is caused by the action of mean wind pressure and pulsating wind pressure. These forces are typically assessed using static methods and random vibration theory. The buffeting frequency domain analysis method establishes the response relationship between structure input and output under the assumption of linearity and smooth random excitation. This approach offers the advantages of simple and efficient calculation [10]. However, the method uses a linearized solution that assumes a quasi-linear relationship between the building surface wind pressure and the incoming wind speed in the time domain with simultaneous pulsations. For example, the gust load factor widely used in codes and standards [11,12] is based on a Gaussian framework, so the term containing the velocity fluctuation squared is removed from the equation. Extending this quasi-linear relationship to the frequency domain allows the derivation of the long-period wind pressure spectrum SP at a point on the building surface from the Van der Hoven wind speed spectrum [13]. As shown in Figure 2, the macrometeorological characteristics of wind pressure align with the incoming wind speed spectrum in the low-frequency range. Nonetheless, in practical structural wind engineering, greater attention is given to the high-frequency micrometeorological characteristics of wind pressure. These characteristics are associated not only with incoming turbulence but also with characteristic turbulence specific to the airflow near the point of interest. On the windward side of streamlined structures, it is approximately assumed that only incoming turbulence influences the point, resulting in a wind pressure spectrum with the same shape as the wind speed spectrum (solid line in Figure 2). Conversely, for points on the windward side of blunt body structures and in separated flow regions, there exists mild or strong characteristic turbulence, as indicated by the dashed line in Figure 2.
Based on the observations above, it is evident that the relationship between the wind pressure spectrum and the wind speed spectrum on the building surface is not a simple linear one. To account for this disparity, the concept of aerodynamic admittance was introduced, which captures the influence of free-stream turbulence on the range of scales present in the pressure coefficient spectra [14,15]. To facilitate the direct calculation of along-wind buffeting response based on wind speed information during the engineering structure design phase, several researchers have conducted extensive experiments and derived empirical formulas for aerodynamic admittance. For buffeting response analysis, the aerodynamic admittance function proposed by Castro et al. [16] is employed to attenuate the power spectra of the along-wind loads, as shown in Equation (1).
χ ( z j , f ) 2 = 1 + ( 2 f A j U ¯ ( z j ) ) 4 / 3 2
where χ ( z j , f ) 2 is the aerodynamic admittance function at height z j , which represents the relationship between the gust frequency f and its area of influence; A j is the projected area of the jth story; and U ¯ ( z j ) is the mean wind speed at height z j .
Subsequently, Castro et al. [12] made a slight modification to Equation (1) by changing the exponent −2 to −7/6. According to Castro et al. [16], this modified expression for the aerodynamic admittance function adequately attenuates the power spectrum of along-wind loads for two extensively studied structures, a 100 m steel tower [17] and the Commonwealth Advisory Aeronautical Council (CAARC) standard tall building [18,19]. Researchers have utilized this aerodynamic admittance function to analyze and simulate 3D wind-induced vibrations of rectangular tall buildings in the time domain. Their studies demonstrated the advantages of time-domain simulation through nonlinear time-history analysis, which considered a bilinear isotropic material hardening model in both translational directions [20]. Additionally, aerodynamic admittance has been used by scholars to investigate nonlinear structural response prediction [21,22], gust effect factors in regions of separated flow [23], and the wind-induced vibration control [24] of tall buildings. Although there is an abundance of qualitative analysis on aerodynamic admittance, there is a significant lack of quantitative analysis due to the diversity of building shapes and the complexity of nonlinear effects. As a result, there is no widely accepted model of aerodynamic admittance.
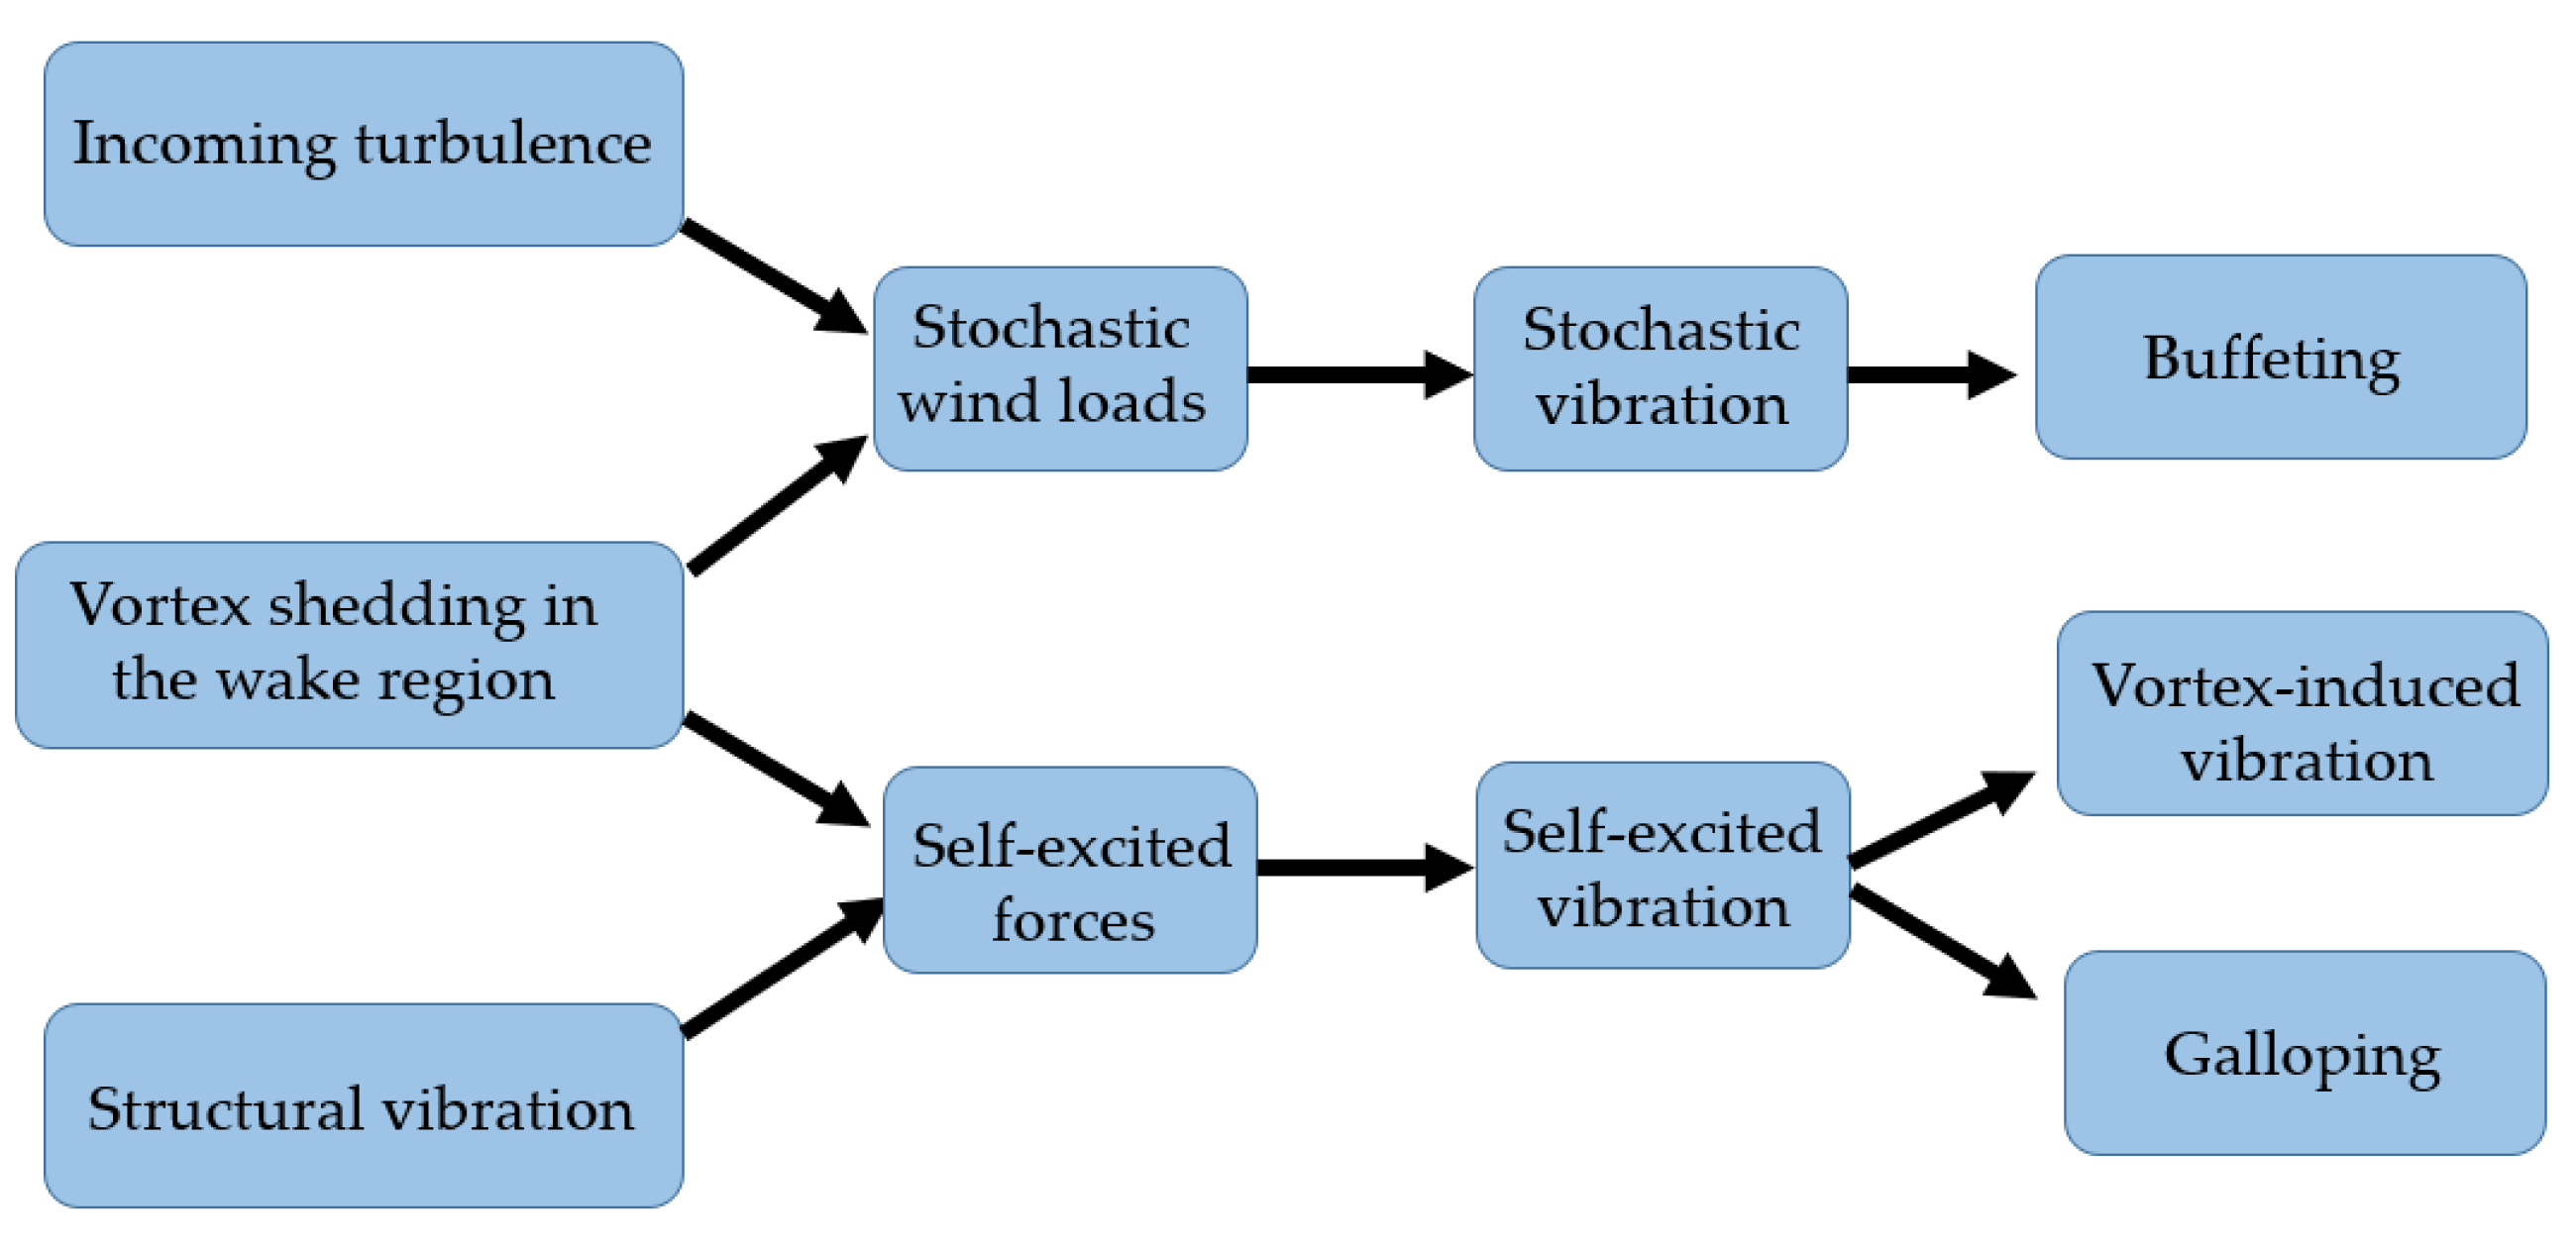
Crosswind loads often serve as the horizontal control loads for super-high-rise buildings [25]. The vibration of tall buildings caused by crosswind is primarily influenced by several factors, including incoming turbulence, vortex shedding in the wake region, and structural vibration, as shown in Figure 3.
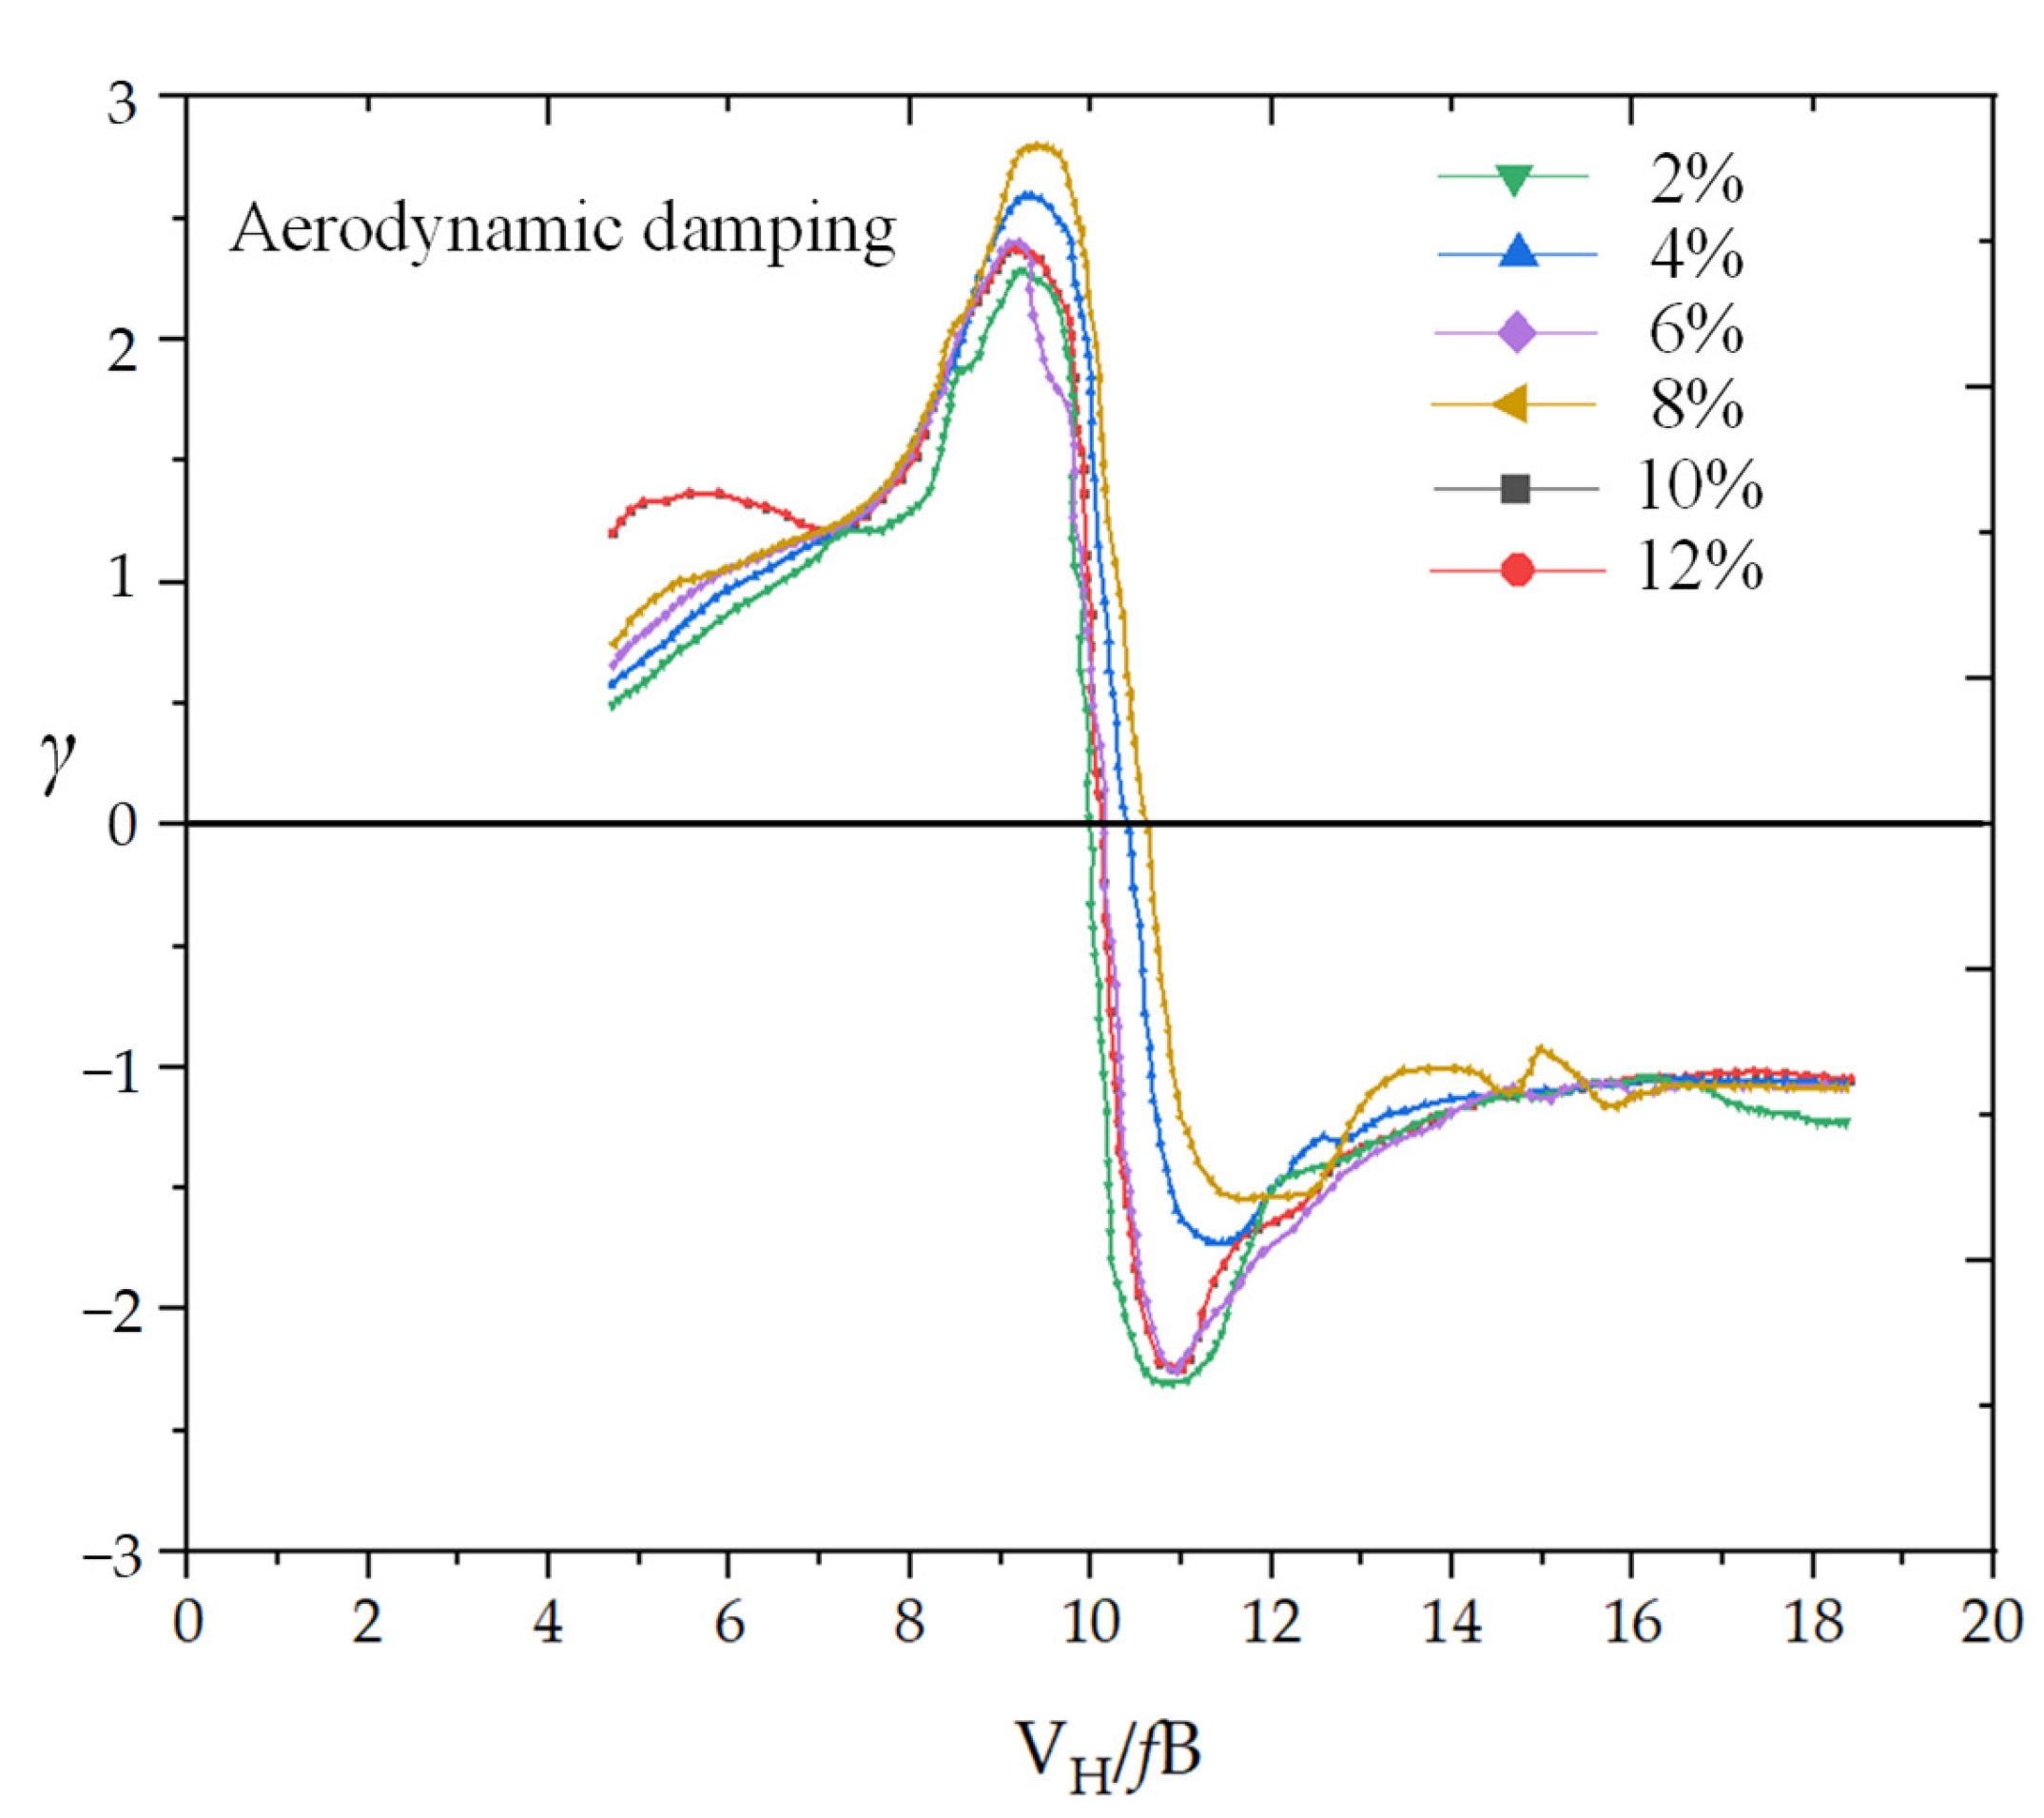
The mechanism of crosswind vibration in tall buildings is complex, and to date, there is no widely accepted computational model for it. Accurately predicting the crosswind response relies on understanding crosswind aerodynamic damping. The vortex-locked wind speed region, occurring during vortex-induced resonance, causes the aerodynamic damping to vary nonlinearly with wind speed and amplitude, resulting in significant AN. Due to the complex factors contributing to nonlinear aerodynamic damping, such as the strong instability of the incoming flow caused by vortex shedding and the failure of the quasi-steady theory, developing theoretical analytical models becomes extremely challenging. In many cases, aerodynamic damping models express the majority of their aerodynamic damping as a function of root mean square response based on the assumption of a harmonic crosswind response and are generally referred to as equivalent aerodynamic damping models [26,27]. Currently, wind tunnel tests are commonly used to determine the equivalent aerodynamic damping, taking into account the AN of crosswind vibration in tall buildings. The forced vibration test is utilized to separate the self-excited wind loads from the total wind loads and identify the equivalent aerodynamic damping [28,29]. Steckley determined the equivalent aerodynamic damping of a tall building with a square section through forced vibration tests, as shown in Figure 4 [30]. By varying the incoming wind speed at a specific vertex amplitude γ, the equivalent aerodynamic damping curves were obtained, showing the nonlinear variation with the reduced wind speed at that amplitude. Similarly, by changing the structure’s amplitude, the equivalent aerodynamic damping curve with the reduced wind speed for other amplitudes could be obtained. Figure 4 illustrates the variation in the equivalent pneumatic damping of a tall building with a square section, showcasing its dependence on the reduced wind speed and the amplitude.
Below the vortex-locked critical wind speed ( U c r / f s B = 10 ) , the equivalent aerodynamic damping is positive and shows a nonlinear increase with the reduced wind speed. As the wind speed approaches the vortex-locked critical point, the equivalent aerodynamic damping undergoes an abrupt transition from positive to negative. As the reduced wind speed continues to rise, the absolute value of the negative equivalent aerodynamic damping gradually diminishes. To conveniently determine the crosswind equivalent aerodynamic damping ξ a of tall buildings, Vickery and Basu [31] developed a theoretical basis for aerodynamic damping modeling, and the aerodynamic damping model proposed by Vickery and Basu has been adopted by several codes and standards [32,33,34], in addition to being used for solving the crosswind response in the framework of stochastic vibrations [35]. However, it has been shown that the response calculated using this aerodynamic damping model does not agree with the response measured in wind tunnel tests and may significantly overestimate the side wind response in most cases, especially for cylinders with small Scruton numbers [36,37]. Then, Watanabe et al. [27] proposed a nonlinear empirical model. This model improves the complex transfer function by analyzing the aerodynamic damping data [38] and is presented as follows:
ξ a = F 1 sin β + F 2 cos β + F p
F 1 = A M P 2 H S ( U r / U c r ) 2 1 ( U r / U c r ) 2 2 + 4 H S 2 ( U r / U c r ) 2
F 2 = A M P ( U r / U c r ) 2 1 ( U r / U c r ) 2 2 1 ( U r / U c r ) 2 2 + 4 H S 2 ( U r / U c r ) 2
F p = 3 8 π ( U r U c r ) ( 2 + 2 a 3 + a ) ( d C M L d α + d C M D )   α = 0
where F 1 and F 2 are the real and imaginary parts of the complex transfer function, respectively; A M P and H S are model parameters; β is the model parameter, which is introduced to express the coupling effect of the two functions; F p is a term introduced from Parkinson’s quasi-steady theory [39] and expressed in the form of the mass-damping parameter; U r = U / f s B and U c r = U / f v B are the reduced wind speed of the Strouhal frequency and the reduced wind speed of the oscillating prism, respectively; U is the wind speed at the reference point; f s and f v is the Strouhal frequency and the frequency of the oscillating prism, respectively; B is the width of the prism; a is the index number of the power law for wind velocity profile; C M L and C M D are the mean overturning moment coefficient in lift direction and in drag direction, respectively; and α is the attack angle of wind.
However, the prediction results indicate that the model underestimates the negative aerodynamic damping near the vortex-locked critical wind speed [27]. Furthermore, since the nonlinear aerodynamic damping is dependent on the root mean square (amplitude) of the response, the identified aerodynamic damping can accurately predict the crosswind response only if the root mean square of the high-rise building’s crosswind response coincides with the root mean square of the response corresponding to the nonlinear aerodynamic damping. However, in practical scenarios, the crosswind response of tall buildings needs to be determined, making it impossible to directly use the aerodynamic damping identified from forced vibration tests for response analysis [40]. To effectively calculate the crosswind response analytically using the aerodynamic damping identified by the forced vibration method, the aerodynamic damping is expressed as a polynomial function of the structure’s time-varying vibration velocity [41,42,43]. Although this method has the advantages of a simple algorithm and high recognition accuracy, it requires special excitation devices, complex tests, and high costs, which limits its widespread use. Currently, the forced vibration test is primarily utilized to study the self-excited wind load characteristics of sectional models or other two-dimensional column structures, as it is easier to implement for two-dimensional structural models compared with three-dimensional tall building models [44,45].
Another method to identify the equivalent aerodynamic damping is through a random vibration test. In the region near the vortex-locked wind speed, the vibration measurement device can measure the crosswind response components, including buffeting and self-excited forces [46]. The aerodynamic damping can then be determined from the crosswind response using either the time series method or the spectral method [47]. This method has gained popularity for identifying nonlinear aerodynamic damping due to its simple test setup and high measurement accuracy. Common time series methods include maximum-entropy estimates [48], autoregressive [49], autoregressive moving averages [50], and the random decrement technique [51]. Currently, the random decrement technique is frequently used in studies on equivalent aerodynamic damping of tall buildings. Marukawa et al. [52] studied the effect of section width–thickness ratio, building height–width ratio, and structural damping ratio on the crosswind aerodynamic damping of high-rise buildings using this method. They obtained the variation law of aerodynamic damping with the reduced wind speed. For a linear system excited by smooth Gaussian white noise, it is feasible to estimate the frequency and damping characteristics of the vibrating system using the method mentioned above [53]. However, when dealing with tall buildings that are relatively long and thin and are near the vortex-locked wind speed region, along with the narrowing bandwidth of the crosswind excitation, the timing method is not accurate enough to identify the crosswind nonlinear aerodynamic damping of high-rise buildings.
Aerodynamic damping is calculated by subtracting structural damping from the total system damping. The system damping can be obtained using various methods, such as the autocorrelation function method, the half-power bandwidth method, or the wavelet transform method, which are applied to the crosswind response spectrum [47]. However, similar to the time series method, most of the aforementioned methods are applicable to linear systems under broadband excitation and therefore have certain limitations.
Since the crosswind responses of tall slender structures in atmospheric boundary layer flow do not always follow harmonic processes at different wind speeds, and the characteristics of the response, such as harmonic, Gaussian, or random processes, exhibit hardening non-Gaussian distribution in real applications, the use of equivalent aerodynamic damping models may be restricted. To overcome the limitations of equivalent aerodynamic damping models, aerodynamic damping is further described as a function of time-variant displacement or velocity for a given wind speed. These time-variant aerodynamic damping models are capable of describing aerodynamic damping at various wind speeds without assuming a harmonic response [54,55]. When estimating the crosswind responses of tall buildings considering wind–structure interaction in atmospheric boundary layer flow, the challenge lies in solving a nonlinear motion equation that accounts for generalized van-der-Pol-type aerodynamic damping. Analytical solutions for such nonlinear motion equations under stochastic excitation are usually not available [56,57]. A method was proposed to transform the nonlinear motion equation into a solvable Fokker–Planck–Kolmogorov equation using the equivalent nonlinear equation method [55,58]. The combination of this method with the generalized van-der-Pol-type aerodynamic damping effectively describes the aero-elastic effect for elastically mounted circular cylinders and crosswind-excited tall slender structures in atmospheric boundary layer flow. Furthermore, this method can be extended to incorporate the influence of GN and MN on the amplitude of crosswind response in tall buildings under the action of wind loads.
Wind-induced nonlinear torsional vibration in tall buildings is usually caused by the imbalance in the instantaneous wind pressure distributions on all building surfaces and the eccentricity between the elastic and mass centers [59,60]. For symmetric tall buildings with large stiffness, the asymmetric aerodynamic-induced torsion is usually small and generally negligible. However, for flexible tall buildings, rotating members can generate large shear forces and bending moments in the members, and the torque loads may have nonlinear coupling effects with downwind and lateral loads, resulting in a strong wind vibration response [61]. Especially, slender tall buildings tend to suffer greater rotational damage under wind loads. Ref. [62] studied the torsional response for symmetric and asymmetric linear systems, where the relative distance between the center of mass (CM) and the center of stiffness (CS) varies with time during structural motions and an instantaneous load eccentricity occurs during horizontal motions of the CM in the plane, which may lead to additional torsional motions not considered in codes [11,12,63], naming this second-order nonlinear effect as the A-∆ effect. Some authors [64] solved the nonlinear differential equations considering the A-∆ second-order nonlinear effect by means of state–space model assembly and showed that the A-∆ effect has a small effect on the wind-driven displacements and accelerations, but the correlation coefficients between the wind forces have the most important influence on the response, suggesting that the different correlation levels between the wind force and the torque must be taken into account in the evaluation of the wind-driven response. In addition, nonlinearities may cause the structure to become more flexible, thereby increasing the dynamic response of the structure [65], and therefore, further analysis is required to assess the impact of the A-∆ effect on the wind response of high-rise buildings considering both structural geometric nonlinearities and material nonlinear behavior.

3. High-Rise Structures

In the case of complex and slender high-rise structures, it is important to consider the second-order effects resulting from horizontal wind loads acting on vertical loads [66]. Furthermore, structural deformation causes certain parts of the material to enter the inelastic phase. MN exhibited by these parts results in a reduction in the stiffness of concrete members, subsequently leading to increased deformation. The interaction between MN and GN is complex, making calculations considering these dual nonlinear effects challenging. To address diverse practical situations, a range of structural wind-induced nonlinear analysis methods have been developed at different levels. Since the first-order elastic analysis in Figure 5 is a method within the elastic range, only the other three methods are summarized as follows:
  • First-order inelastic analysis, which primarily considers MN and does not account for GN [66];
  • Second-order elastic analysis, which considers structural initial defects as well as P − ∆ and Pδ effects. This method requires accurate element stiffness matrices, such as cubic interpolation elements [67], stability function elements [68], and pointwise equilibrating polynomial element [69]. It also relies on stable equilibrium path iteration methods, including the Newton–Raphson method [70], arc-length method [71,72], and minimum residual displacement method [73];
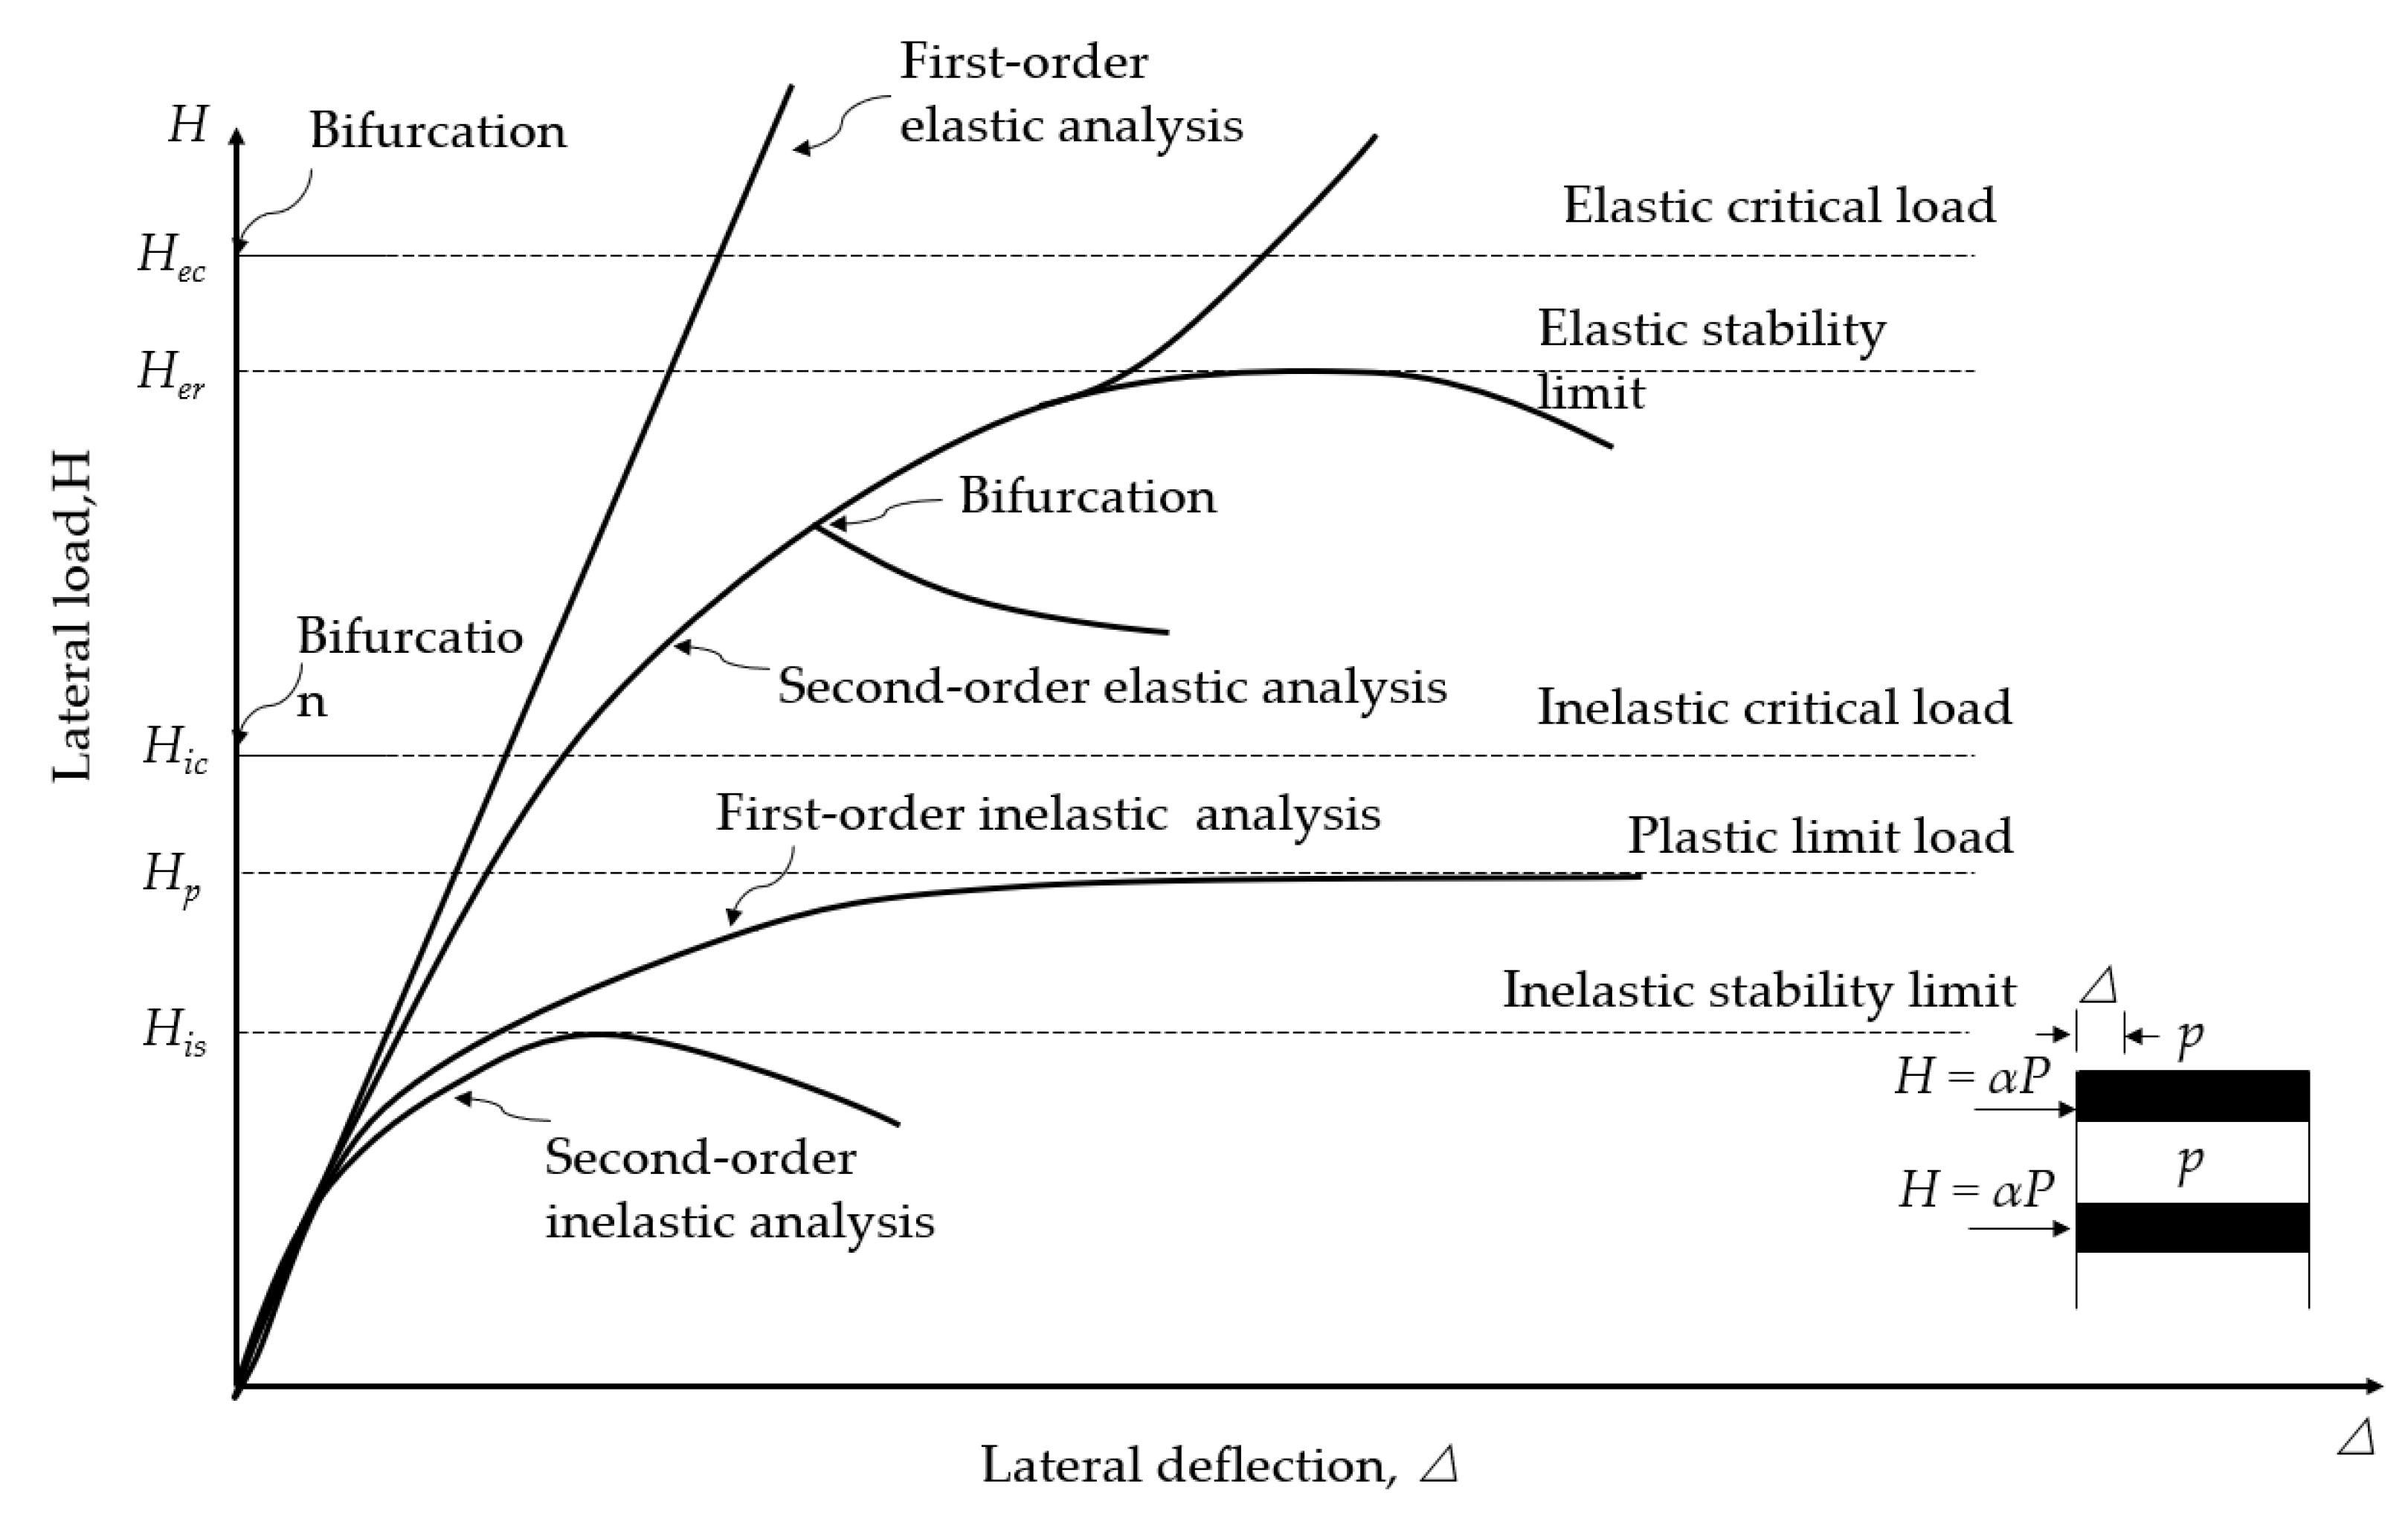
  • Second-order inelastic analysis, which considers both stability and plastic effects. This category can be further divided into the plastic zone method [74] and the plastic hinge method [75,76].
Figure 5. Wind-induced nonlinear analysis methods of high-rise structures.
Buildings 13 02033 g005
Dense high-rise structures, such as cooling towers, chimneys, and heat-absorbing towers, exhibit noticeable MN due to their predominantly concrete or reinforced concrete composition. To accurately analyze the structural behavior under wind loads, the elastic–plastic finite element method that incorporates second-order effects is employed. This method enables the simulation of overall structural deformation, as well as the deformation of individual members within the structure. The method takes into account GN and MN by correcting the stiffness of the structure in the time domain. Remyasree [77] conducted a study on 30 finite element models of chimneys using this method. The study considered nodal displacements and maximum shell stresses as output parameters. The results indicate that the chimney shell stresses decrease as the wall-thickness ratio increases. Additionally, the fully conical chimney structure exhibited lower shell stress values compared with the partially conical chimney. Other scholars used finite element analysis software to investigate the structural damage process under dynamic wind load for a 220 m high cooling tower, employing Incremental Dynamic Analysis [78,79]. Both studies considered the tower’s concrete and steel reinforcement as a plastically adaptable material model, incorporating MN and failure mechanisms. However, they used different material parameters, which may contribute to the discrepancy in the critical collapse wind speed predicted for the cooling tower. To reduce the time-consuming and complex iterative convergence in finite element analysis, it is common practice to treat steel and concrete as a single material or consider material nonlinearity using a stiffness discount tactics [80]. However, due to the existing limitations in finite element modeling techniques, accurately simulating material nonlinearity after local concrete cracking under the action of wind loads and capturing the synergy between steel and concrete remains a challenging task.
Lattice high-rise structures, such as transmission towers, TV towers, and communication towers, exhibit strong GN due to their composition of slender bars. Transmission towers play a crucial role in the power system. In previous studies on the wind resistance design of transmission towers, the overall models were established using rod elements hinged at both ends or beam elements cemented at both ends to simulate angular steel members [81,82,83]. However, these models often neglected the nodal effects, including flexibility, geometry nonlinearity, and bolt slip, which can significantly influence the overall structure. Knight [84] emphasized the need to consider the influence of connection stiffness at the nodes, as the space truss method alone may not accurately predict the behavior of transmission tower structures. The research analysis indicated that the three-dimensional method with bending moment provided the most accurate stress calculation for the rods, aligning closely with field test results. However, the modeling process using the three-dimensional frame method with bending moment can be relatively complex. Additionally, it has been observed that the traditional rod element models often fail to match the actual experimental data in complex load situations. This discrepancy can be attributed to intrinsic factors in the transmission tower structure that led to second-order responses, such as eccentricity, connection stiffness, and rod continuity. Therefore, some major rods in the transmission tower should be analyzed using beam elements to better assess the ultimate load capacity [85]. To analyze the mechanical properties of the nodes, researchers have employed a small-scale analysis method by separating the local nodes of the transmission tower and establishing a local fine model using solid elements or shell elements [84,86].
To consider the influence of nodal NG on the overall response of the structure, Rao et al. [87] proposed an analytical method that considers nodal NG, MN, eccentric connections, and rotational stiffness. Kurobane et al. [88] compiled 385 test results for steel tube plane nodes and developed a strength equation specifically for these nodes. However, traditional methods have limitations in accurately analyzing the effects of nodal effects (such as geometric nonlinearity and material nonlinearity) on the overall response of transmission tower structures at the overall scale. Furthermore, these methods fail to provide reasonable boundary conditions for local models, resulting in significant errors in local nodal analysis. Therefore, a consistent structural multiscale approach is necessary for the analysis of transmission towers, considering the coupling effect between the two scales. Banik et al. [89] introduced two methods, nonlinear elastoplastic pushover and incremental dynamic analysis, commonly used in seismic resistance, with slight modifications to the structural wind-resistant design to estimate the structural performance of transmission towers under wind loads, and obtained the wind resistance of a single tower. In recent years, the development of multiscale modeling has gained prominence and has been widely applied in various fields, attracting the attention of researchers [90]. Multiscale studies primarily focus on structural material properties and are commonly employed for simulating nonlinear processes in concrete and composite materials [91,92,93]. Voyiadjis et al. [94] summarized existing multiscale research methods and proposed an approach that connects multiple models with different degrees of freedom, ensuring energy equivalence at the interfaces. This method allows different interfaces to be connected and at the same time makes the energies equal. Nowadays, the research is mostly based on this method when considering the nonlinearity of high-rise structures.

4. Flexible Bridges

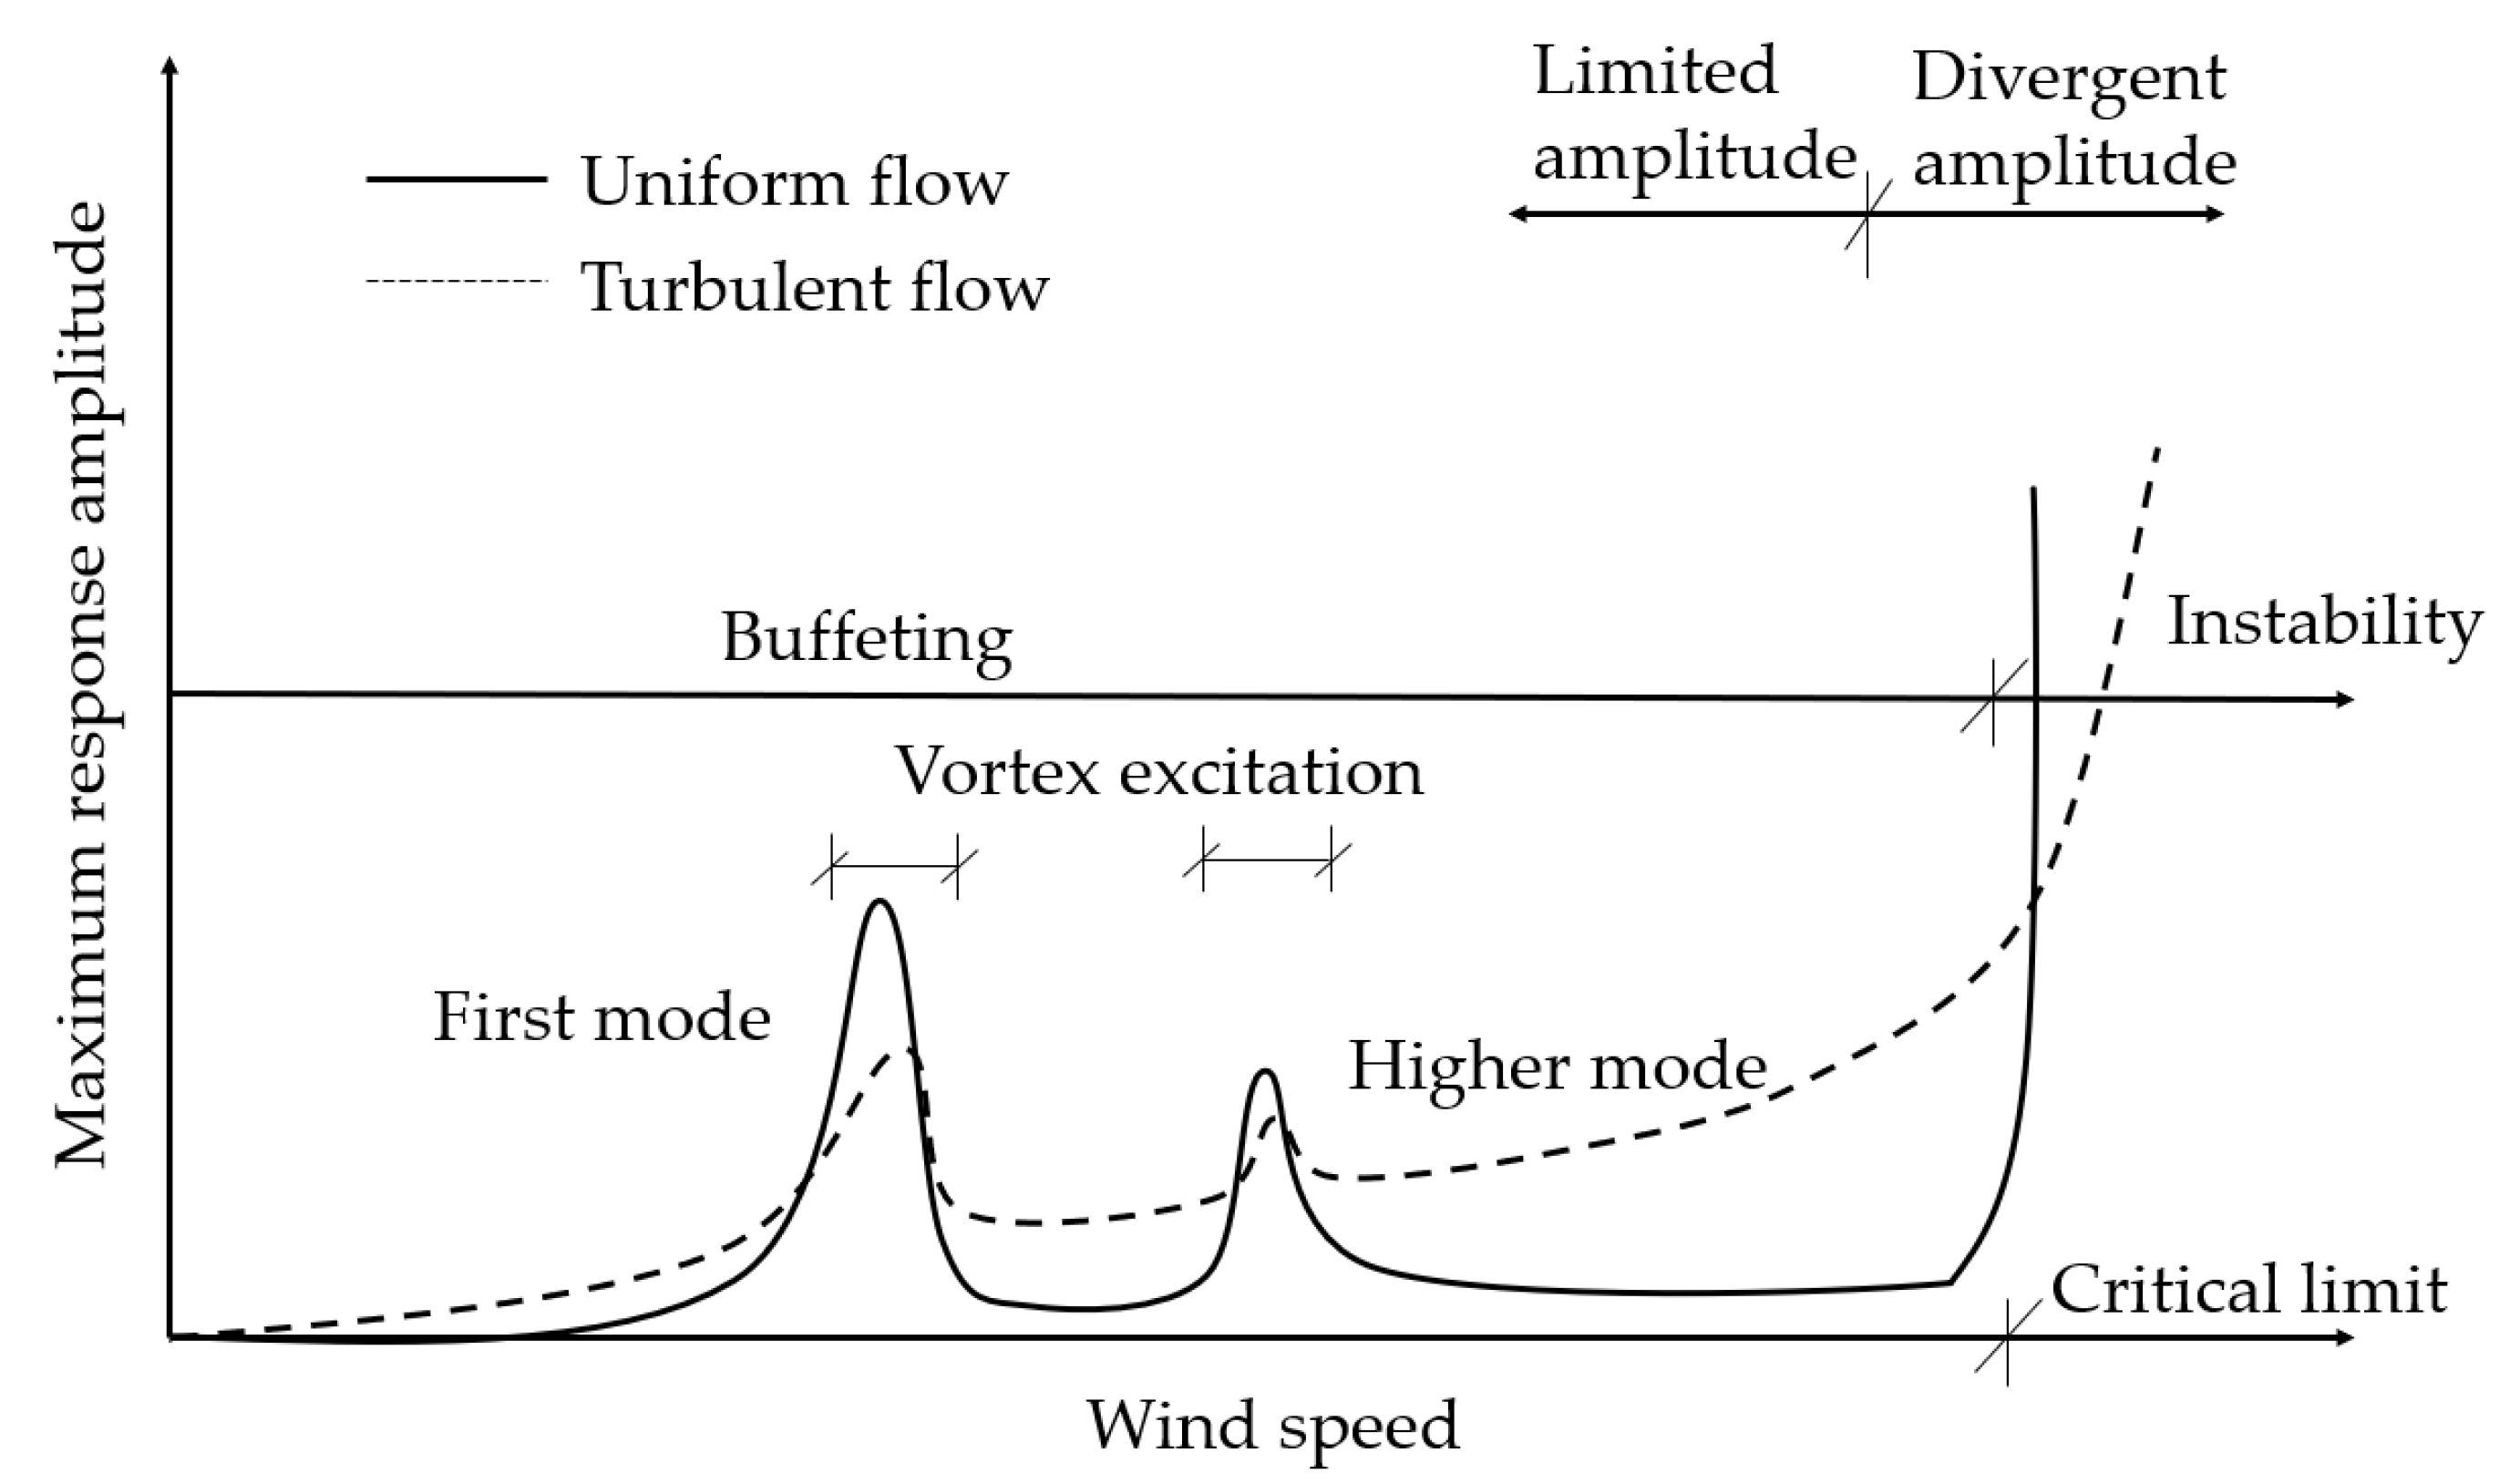
The influence of nonlinear effects on the wind-resistant performance of large-span flexible bridges has become more apparent with their increased popularity. Dynamic wind loads lead to various vibration forms in these bridges, including flutter, galloping, vortex-induced vibration, and buffeting [95], as shown in Figure 6. The blunt sections of the bridge’s main girders, towers, arch ribs, and booms exhibit evident AN when subjected to wind loads [96]. Currently, two methods are employed for analyzing AN of flexible bridges. The first method involves nonlinear vibration analysis prediction based on nonlinear aerodynamic derivatives. The second method relies on nonlinear vibration analysis prediction using a nonlinear self-excited aerodynamic model. The Scanlan linear self-excited force model assumes that the self-excited force acting on the bridge’s main girder can be represented as a linear function of the main girder’s state vector, while the aerodynamic derivative is influenced by the main girder’s section profile and reduced frequency. The Scanlan linear self-excited force model [97] can be expressed by the following equation:
L s e = ρ U 2 B K H 1 h ˙ U + K H 2 B α ˙ U + K 2 H 3 α
M s e = ρ U 2 B 2 K A 1 h ˙ U + K A 2 B α ˙ U + K 2 A 3 α
where L s e and M s e are the aerodynamic force and moment, respectively; K is the reduced frequency, = B ω / U ; ω is the circular frequency of motion; ρ is the air density; H i and A i (i = 1, 2, 3) are the aerodynamic derivatives, respectively; h and α are the vertical displacement and torsion angle of the section, respectively; and h ˙ and α ˙ are the first-order derivatives of h and α with respect to time, respectively.
In the following decades, bridge aerodynamic analysis frameworks based on linear self-excited force models were developed and widely used [98,99,100]. These linear frameworks accurately determine the flutter critical wind speed of bridges. However, such methods are in the realm of linear theory and are limited to the analysis of flutter criticality problems, which cannot accurately analyze and evaluate the postflutter characteristics of flexible bridges. Due to the influence of AN, postflutter behavior exhibits stable amplitude limit cycle oscillations [101]. Scholars have conducted sensitivity analyses of aerodynamic derivative identification and have observed the influence of amplitude on aerodynamic derivatives, considering it as a component of AN. For instance, Falco et al. [82,102] identified the aerodynamic derivatives of the main girder of the Humber Bridge under different torsional amplitudes by forced vibration wind tunnel tests and found that A 2 decreased with increasing torsional amplitude. Noda et al. [83,103] identified the flutter derivatives of rectangular section segment models with aspect ratio B/D = 13 and B/D = 150 at different amplitudes by forced vibration wind tunnel tests, and it was found that the torsional amplitude had a significant effect on H 2 and A 2 , while the vertical amplitude had little effect on flutter derivatives. However, the amplitude of H 1 varies significantly with vertical amplitude during the locking interval of vortex-induced vibration [104]. The work in [105] identified the flutter derivatives of a bridge main girder section using free decaying vibration signals and random vibration signals from free vibration wind tunnel tests and attributed the difference in the identification results between the two methods to the effect of amplitude on the flutter derivatives. Recent studies have employed amplitude-variable harmonic forced vibration to examine the influence of amplitude on flutter derivatives [106,107]. Although the effect of amplitude on aerodynamic derivatives has been widely reported, the physical mechanism behind this phenomenon has received limited attention. The winding patterns of bridge main girders can differ greatly under varying amplitude conditions, making it challenging to provide a uniform explanation for the amplitude variation in aerodynamic derivatives. Additionally, for single-degree-of-freedom systems, amplitude and frequency fully characterize steady-state vibration characteristics, suggesting that aerodynamic derivatives should be represented as a two-dimensional function of amplitude and reduced frequency. However, Matsumoto et al. [108] found that the flutter derivatives were significantly affected by the vibration mode participation form for the blunt body rectangular section segment model with relatively small width and height by comparing the identification results of the flutter derivatives for a single degree of freedom and two degrees of freedom. Zhang et al. [109] found similar results when analyzing the postflutter limit cycle oscillation of a bridge deck. This implies that multi-degree-of-freedom systems may be influenced by parameters such as amplitude ratio, frequency ratio, and phase difference between modes, indicating that the flutter derivative can be affected by the participation form of vibrating modes.
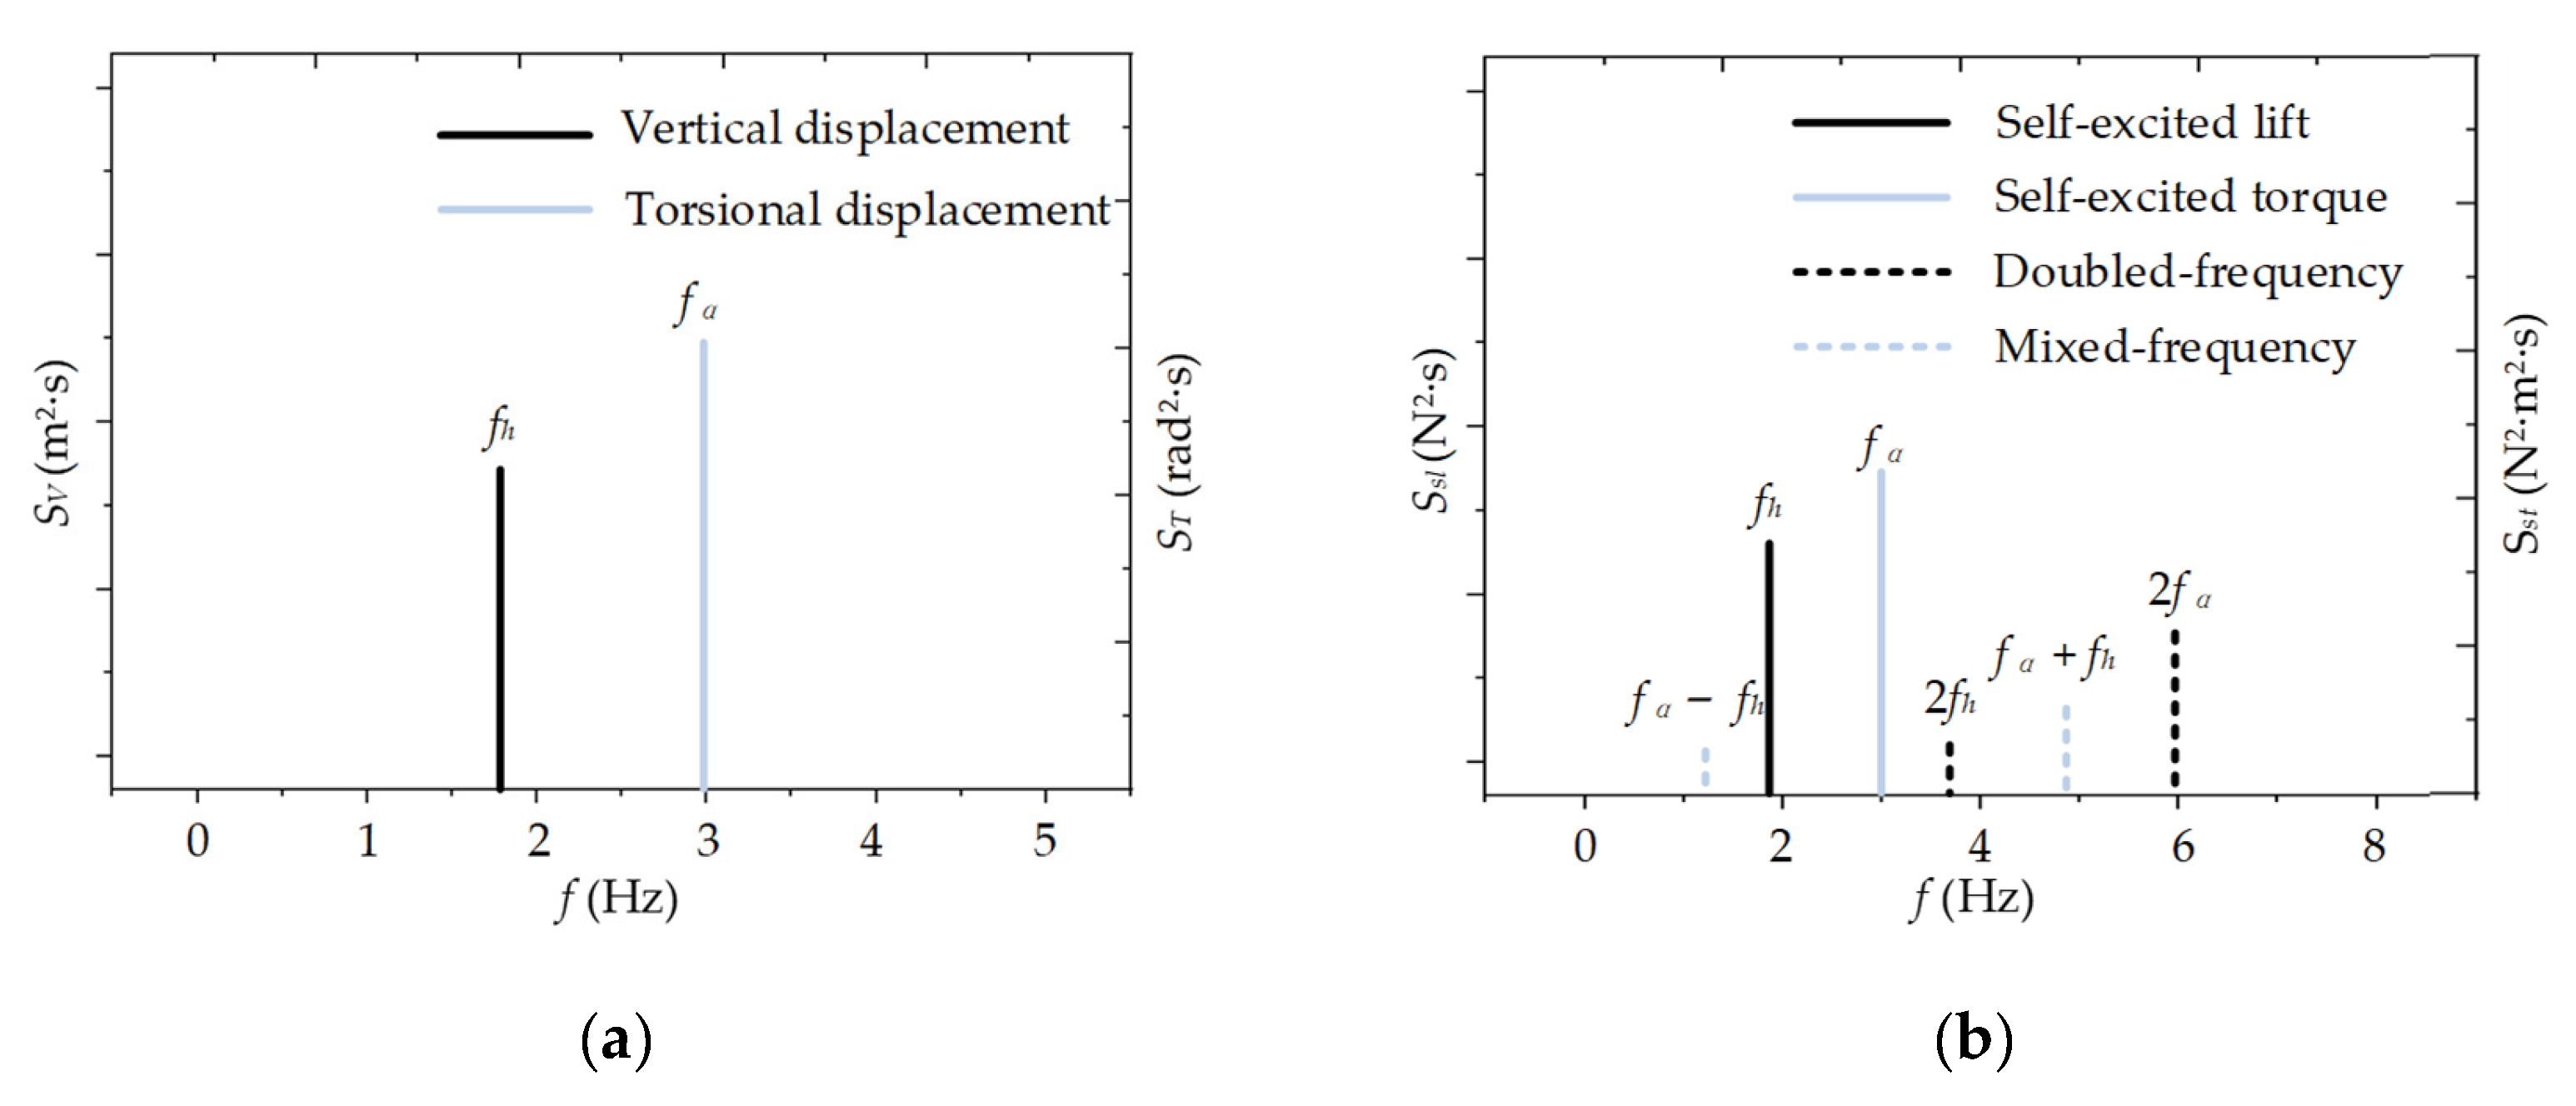
Another significant AN characteristic of the bridge’s main girder is that its aerodynamic force contains a significantly higher-order component. As shown by the dashed line in Figure 7, by applying forced vibration with vertical frequency fh and torsional frequency fa to the main beam, Chen [110] found that there may be doubled-frequency (2fh and 2fa, etc.) and mixed-frequency (fafh and fa + fh, etc.) components in the self-excited lift amplitude spectrum Ssl and in the self-excited torque amplitude spectrum Sst. This result has also been observed by other researchers when investigating the self-excited forces of bridge main girders through wind tunnel tests or numerical simulations [102,110,111]. Furthermore, in the case of bridge main girders experiencing vertical or torsional vibrations, the dominant component of the self-excited force may be a second-order component, rendering the traditional linear self-excited force model inadequate [112]. The obtuse body structure of the bridge, coupled with its mode-dense characteristics, has amplified the significance of aerodynamic higher-order effects. Consequently, the frequency of the higher-order aerodynamic force for a particular mode may closely align with the natural frequencies of other modes, leading to significant resonance phenomena.
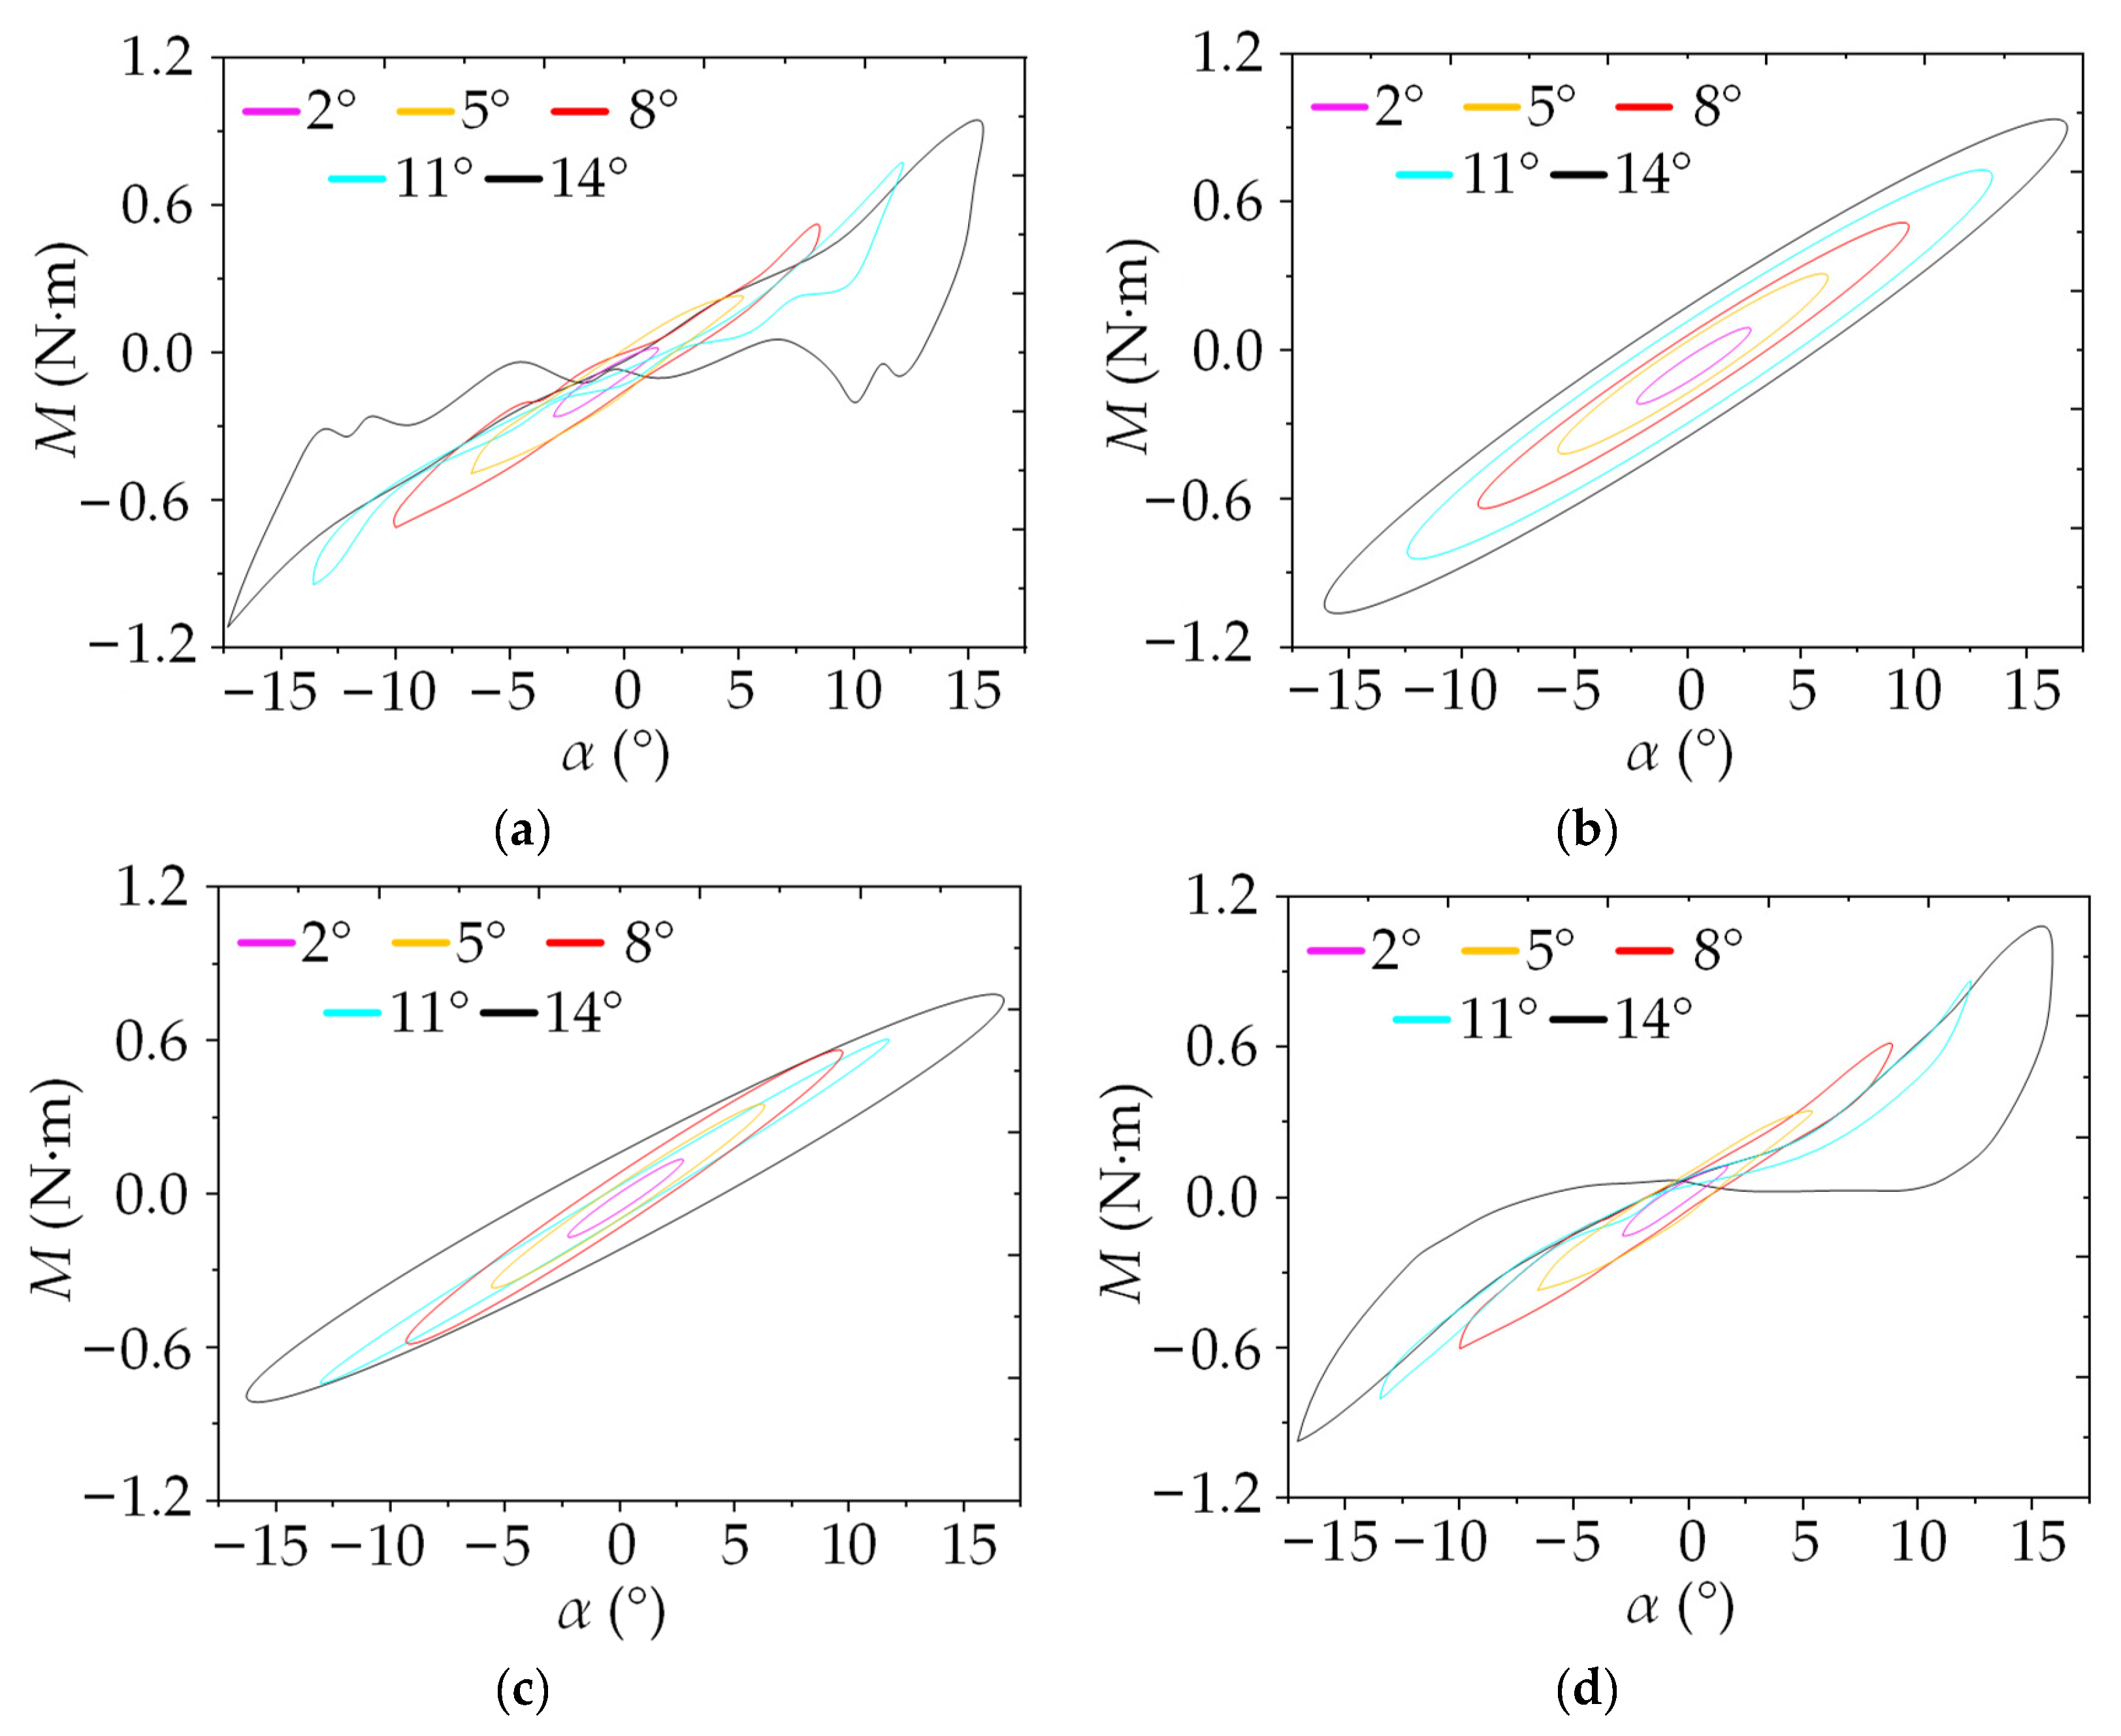
The hysteresis loop of the aerodynamic force with displacement serves as an important means to reflect AN. In fact, the aerodynamic hysteresis loop represents another manifestation of AN, which includes variations in aerodynamic derivatives with amplitude and the presence of higher-order components of the self-excited force. Diana et al. [113,114] conducted wind tunnel tests on a model of the Messina Strait Bridge main girder section and measured the aerodynamic hysteresis loops for different discounted wind speeds and amplitudes. They proposed a polynomial aerodynamic model to fit the hysteresis loops. Subsequently, numerous hysteresis loops for different sections were documented in the literature, revealing various forms [115,116,117]. The variation in self-excited torque with torsion angle for the Humen bridge main girder is shown in Figure 8 [118,119]. In the case of a linear system, the hysteresis loop appears as a standard ellipse, with the elliptical shape remaining consistent across different amplitudes. When considering the influence of the aerodynamic derivative’s amplitude variation and ignoring higher-order components of the self-excited force, the hysteresis loop also takes on an elliptical shape, but the specific form of the ellipse varies with amplitude. However, hysteresis loops that account for the higher-order self-excited force and the amplitude variation in the aerodynamic derivative closely resemble real hysteresis loops. The disparity between the hysteresis loops in Figure 8a,d is attributed to the presence of third-order components or higher in the self-excited force.
With the advancements in the study of aerodynamic nonlinearity (AN) in bridges, developing appropriate aerodynamic models that consider AN has become a prominent focus in the field of bridge wind engineering. A straightforward approach to modeling the nonlinear components of the self-excited force is to incorporate higher-order nonlinear terms into the expressions for the force. Diana et al. [114] presented the self-excited force as a cubic polynomial function of the transient attack angle of wind, but the expressions do not differentiate the contribution of each component of the transient attack angle of wind (e.g., h ˙ and α ˙ ). Therefore, further verification is required to assess its applicability. The widely used quasi-steady galloping force model and Scanlan vortex-induced force model are essentially polynomial aerodynamic models [120]. However, the model parameters of the Scanlan vortex-induced force model can exhibit significant and irregular variations with structural dynamic parameters, such as mechanical damping ratio. Consequently, many scholars have adapted the polynomial form of the model for aerodynamic damping [121,122,123] or improved parameter identification methods [124] to enhance the stability of the model parameters. Table 1 provides an overview of several existing polynomial aerodynamic model forms (without polynomial coefficients). Essentially, the fundamental purpose of using polynomial aerodynamic models to simulate aerodynamic forces is to simulate the trend of aerodynamic damping and aerodynamic stiffness with amplitude (for galloping and vortex-induced vibration, the aerodynamic stiffness effect can usually be neglected). However, the specific form of the polynomial aerodynamic model is highly sensitive to the profile of the bridge structure section. It can also vary for different wind angles of attack, even for the same section. Additionally, when analyzing multi-degree-of-freedom systems, applying the polynomial aerodynamic model can lead to increased complexity and difficulty in parameter identification.
The Volterra series theory is a valuable tool for modeling and analyzing nonlinear dynamical systems, playing a pivotal role in research on such systems [127]. Wu et al. [128,129] expanded the application of the Volterra series theory to the aeroelastic analysis of blunt body structures, including bridge main girders. As per the Volterra series theory, the output of a nonlinear system, induced by the input x(t), can be approximated as follows:
y ( t ) = n = 1 N y n ( t )
y n ( t ) = 0 + 0 + h n ( τ 1 , , τ n ) i = 1 n x ( t τ i ) d τ i
where N is the nonlinear order of the system; y 1 ( t ) is the linear component of the output; and y n ( t ) is the nth order nonlinear component of the output, where h n represents the nth order time-domain kernel function of the system. In the simulation of the aerodynamic forces acting on the structure, x ( t ) is the state vector of the structure, and y ( t ) is the state vector of the structure.
It has been theoretically demonstrated that Equation (4) effectively models various nonlinear effects [130,131,132]. For instance, the second-order Volterra series model can simulate phenomena such as doubled-frequency and mixed-frequency nonlinearities. The third-order Volterra series model can capture the dependence of the system transfer function on the input amplitude, such as the flutter derivative with amplitude. However, the identification workload of kernel functions and the computational effort required for multidimensional convolutional integration exponentially increase with N. As a result, the current application of the Volterra series model in wind engineering for blunt body structures is limited. Nevertheless, with advancements in computer technology and the Volterra series theory, there is potential for further promotion and application of the Volterra series model in nonlinear effects research in bridge wind engineering. Apart from the polynomial and Volterra series AN models mentioned above, other nonlinear models have also been explored in the field of flexible bridge nonlinear effects research. Wu et al. [116] introduced artificial neural network methods for AN simulation of blunt body structures, such as bridge main girders. Machine learning techniques like fuzzy logic methods [133] and deep learning methods [134] have also found applications in AN simulation. These AN models show promise, but their complex forms, numerous aerodynamic parameters, and the demanding workload of parameter identification make them challenging for engineers to use and difficult to promote in the engineering field at this stage. Furthermore, the sensitivity of the model form and parameters to test conditions and identification methods requires further investigation.

5. Transmission Lines

Transmission lines are subjected to three types of vibrations caused by wind loads: high-frequency low-amplitude aeolian vibration [135], low-frequency medium-amplitude subspan oscillation [136], and low-frequency large-amplitude galloping [118,137]. The aeolian vibration of transmission lines is essentially a form of vortex-induced vibration characterized by low amplitude and nonlinearity. However, its elongation deformation is typically considered as a smaller range of linear elastic deformation, and thus, MN is generally ignored. The energy balance method has been widely employed for aeolian vibration analysis and calculation for many years [138]. This method is based on the principle that the energy dissipation of the transmission conductor system equals the wind energy input, allowing the calculation of the stable amplitude of aeolian vibration [139]. However, the accuracy of wind energy input power, conductor self-damped dissipated power, and dissipated power of vibration prevention devices directly impacts the accuracy of the calculated vibration response using this method. Although some scholars have made improvements to the traditional energy balance method formula [140], there is still a lack of accuracy for multisplit conductors. Another approach to calculating aeolian vibration is the dynamic method, primarily used to calculate the steady-state response. Simplified deterministic semiempirical mathematical models, especially negative damping models like Scanlan’s empirical nonlinear models [141,142], have been widely adopted. The finite element equations of motion for transmission line aeolian vibration have been derived using these models [143]. This analytical method effectively solves the aeolian vibration equation by considering GN.
The subspan oscillation of a split conductor refers to the unstable vibration of the leeward side conductor in a multisplit transmission line when it falls into the vortex aerodynamic wake created by the windward-side conductor. This phenomenon leads to wake-induced galloping [144]. However, due to the complexity of wake shielding effects in computer theory, the study of subspan oscillations has not fully met practical engineering needs. Price [145] developed a nonlinear model based on a quasi-steady analytical model, considering both in-plane and out-of-plane damping. They solved the nonlinear equations using the Runge–Kutta numerical integration method [146] to determine the wake-induced galloping amplitude. Subsequently, Piperni [147] utilized the nonlinear equations established by Price [145] and the modified Krylov–Bogoliubov asymptotic method [148] to analyze the stability of an elastically supported cylinder in a fixed cylindrical wake. The results demonstrate that increasing mechanical damping is not effective in reducing the amplitude of wake-induced galloping in the leeward cylindrical wake when the windward cylinder is fixed. Additionally, the boundary region of wake-induced galloping obtained through nonlinear theory analysis differs significantly from that of linear theory.
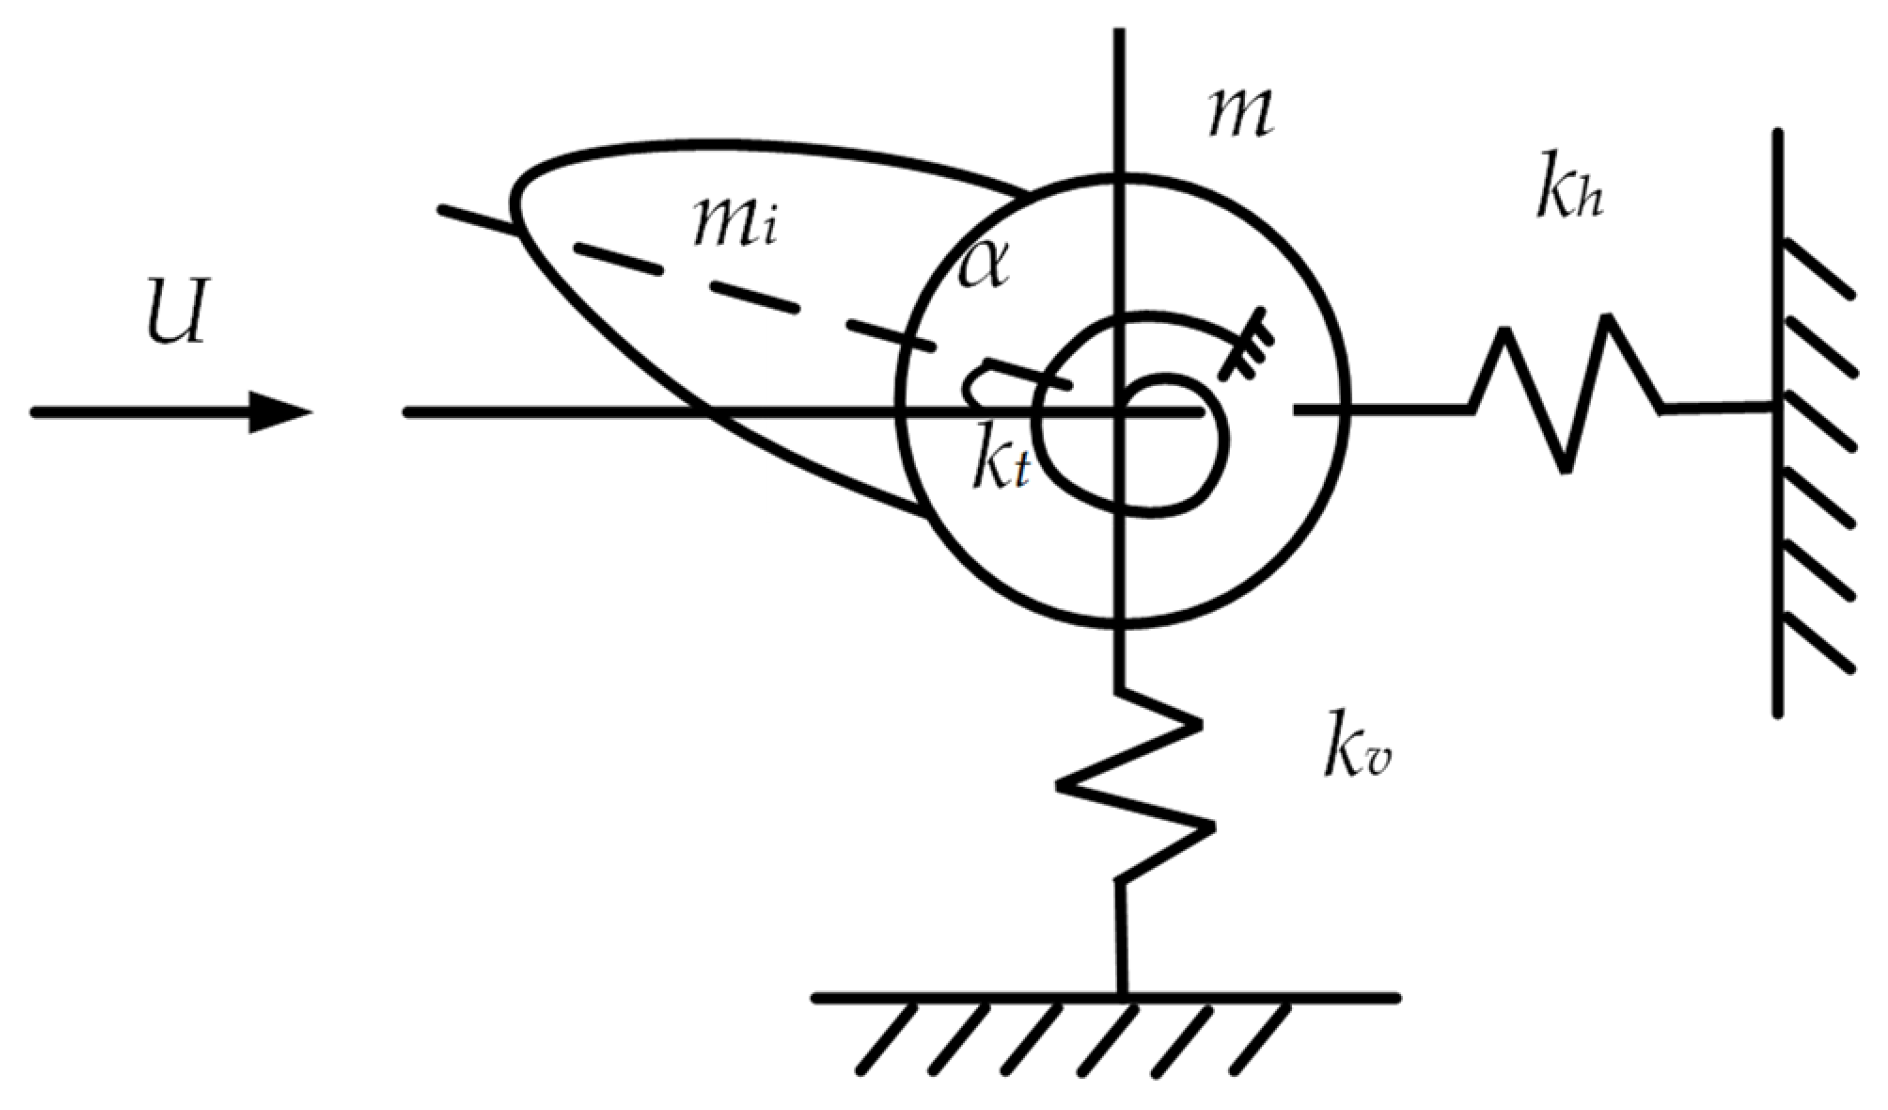
The galloping of transmission lines is a common natural aerodynamic instability phenomenon, typically characterized by large displacement and small-strain GN features. In numerical simulations of galloping, research methods have progressed from linearized mode superposition methods to geometric nonlinear methods that consider large displacements. Desai et al. [149] employed a three-node cable element to simulate ice-covered transmission lines and investigated galloping under various constraints. However, they used the mode superposition method to solve the galloping equations, neglecting the GN induced by large-amplitude motion. In a subsequent study, Desai et al. [150] proposed an efficient time-integration algorithm based on the Krylov–Bogoliubov method [148], which significantly reduced the number of calculations. Nevertheless, this method weakened the coupling between the large-amplitude motion of the ice-covered conductor and aerodynamic forces. The vertical and torsional vibrations of the ice-covered conductor are not isolated but coupled. Therefore, the equivalent single-mass (or rotational inertia) system is not a single-degree-of-freedom system but a three-degree-of-freedom system with simultaneous vertical, horizontal, and torsional vibrations, as depicted in Figure 9.
Where m i and m are the mass of ice and conductor, and k v , k h and k t are the stiffness in vertical, horizontal, and torsional.
In addition, the split conductor rotates as a whole around the center of the split circle due to the influence of the conductor spacer. Its torsional stiffness is significantly greater than that of a single conductor with the same cross-sectional area. As a result, the aerodynamic forces and moments generated by split conductors are much larger compared with those of single conductors. To account for the torsional stiffness of split conductors, Wang et al. [151,152] developed a continuous multispan conductor galloping model for both single and split conductors based on the geometric nonlinear method. They incorporated second-order coupled nonlinear terms for vertical, horizontal, and torsional modes into the split conductor torsional stiffness algorithm [153]. Liu et al. [154,155] utilized this model to simulate the galloping of a four-split transmission line with different file distances, considering the AN and GN of large-amplitude vibrations. Their findings revealed the emergence of a new galloping mode when there is an integer multiple relationship between the natural circular frequencies of vertical and horizontal motions of the conductor. This phenomenon is interpreted as a saturation phenomenon of the nonlinear dynamical system. Yan et al. [156] treated the conductor vibration process as a continuous incremental process of transient vibration. They employed the incremental harmonic balance method to solve the conductor galloping equation, considering both the nonlinear stiffness term and nonlinear damping term. They also examined the selection of the number of harmonic terms and the galloping limit loop. However, to reduce the computation of the integration of the element load vector (which is usually a higher-order function of nodal displacement and velocity), the uniform aerodynamic load vector is replaced by the element concentrated load vector. While the nonlinear finite element method used for studying galloping in ice-covered transmission lines can consider GN, it cannot provide analytical expressions for galloping amplitude and frequency, nor can it thoroughly investigate the mechanism of GN’s influence on the galloping response. In the field of bridges, some scholars [157,158,159] have conducted comprehensive studies on the GN of diagonal cables. However, the tensile force experienced by bridge diagonal cables is much higher than that of transmission lines, and their vibrations differ significantly.
Based on the continuum model of the conductor, the galloping differential equation obtained through the Galerkin-type discretization method [160] is the primary approach for theoretically solving the galloping of transmission lines differential equation. Yu et al. [161,162] employed the averaging method to solve the periodic solution of the conductor’s galloping differential equation and discussed the accuracy range of this method. They found that the small parameter ε has an upper limit of 0.01, corresponding to the maximum wind speed for the model. If the critical wind speed is exceeded, the averaging method incurs a large calculation error. To avoid these issues and account for increased model considerations, recent galloping model studies have largely adopted the multiscale method [163]. The analytical solution obtained from this method for the galloping differential equation is an asymptotic series, suitable only for weak geometric nonlinear systems with small parameters and not applicable to cases with strong GN, such as ice-covered conductor galloping. For vibrations displaying strong GN, a modified Lindstedt–Poincare regression method can be utilized to derive an approximate analytical solution for the amplitude and frequency of galloping over ice, while considering the effect of GN on the galloping response [144,164]. Using Hamilton’s principle, a three-degree-of-freedom model was employed to establish nonlinear equations of motion control for icing conductors, which were then discretized into ordinary differential equations using the Galerkin-type discretization method [145,165]. Lou et al. [146,166] developed galloping partial differential control equations for ice-covered transmission lines to describe the nonlinear interactions among in-plane, out-of-plane, and torsional vibrations, revealing the presence of internal resonance phenomena. Internal resonance plays a vital role in nonlinear field, as it leads to interactions between modes [147,167]. Additionally, although increasing damping can dissipate vibration energy in transmission lines, it does not prevent internal resonance from occurring [148,168]. In addition, the calculation of wind deflection of overhead lines mainly focuses on the static analysis method. Wang et al. [149,169] proposed a linear analysis framework with closed-form formulations to determine the static response while considering the conductor’s GN. They found that neglecting static swing leads to an overestimation of the along-wind dynamic displacement and fails to capture the dynamic crosswind and longitudinal tensions. Regarding modeling, Dua et al. [170] employed finite element software to establish a tower-line system model and performed calculations for wind deflection with large displacements. Their study concluded that the tower-line system model can intuitively and comprehensively represent the dynamic wind deflection response of transmission lines, taking into account GN.
In recent years, the topic of reducing the hazards caused by nonlinear dynamic wind loading effects on transmission lines is of particular importance. Interwire friction is a major source of energy dissipation [171]. Its application to vibration isolation systems is considered advantageous. The spiral wire rope isolator (WRI) is a typical nonlinear hysteretic damping device [172], which is also effective for wind-induced vibration control of transmission lines [173]. In addition, a newly developed nonlinear energy sink (NES) damper [174,175] is the current research hotspot of nonlinear dampers. The NES damper is more stable compared with the general damper due to its frequency–energy dependence, which makes it able to act nonlinearly in a broadband frequency–energy manner and more predictable and controllable in the theoretical analysis of parameter optimization. Some scholars have utilized the segmented linear recovery forcing function of the NES by adding nonlinear dampers with NES to single-span tension cables for mitigating chirp vibration [176]. For the problem of nonlinear dynamic interactions between transmission lines, nonlinear dampers, and wind, scholars have combined the nonlinearity of plane stretching in the conductor, the equivalent cubic stiffness of the Stockbridge damper, and the pulsating lift modeled as a Vanderbilt oscillator in a single model in order to study nonlinear vortex-excited vibrations of transmission lines. The results show that the nonlinearity in the system disappears with increasing axial tension and stall parameters of the wake oscillator [177]. In addition, the application of the NES to wind-sensitive structures such as tall buildings, high-rise structures, and flexible bridges has gradually become a topic of future research of interest to many scholars [178,179].

6. Conclusions

(1)
Wind-induced nonlinear analysis of tall buildings: Aerodynamic admittance is a measure of the impact of free-stream turbulence on the range of scales in the pressure coefficient spectra. It provides insights into the aerodynamic nonlinearity (AN) between the wind pressure spectrum and wind speed spectrum of building surfaces, specifically in the high-frequency range, where strong characteristic turbulence exists on the windward side and separation flow area of high-rise buildings. To account for the diverse shapes of tall buildings and the complex nonlinear effects, the empirical formula for aerodynamic admittance is typically derived from wind tunnel tests or numerical simulations. This formula considers the influence of AN on wind-induced vibration response. To address the evident AN in the aerodynamic damping of tall buildings caused by nonlinear changes in wind speed and amplitude, the widely adopted approach is to employ the equivalent nonlinear equation method. This method enables the solution of the nonlinear vibration equation, which incorporates the generalized van-der-Pol-type aerodynamic damping term. Furthermore, this method can also consider the effects of geometric nonlinearity (GN) and material nonlinearity (MN) in tall buildings when subjected to wind loads, particularly in relation to the crosswind response amplitude.
(2)
Wind-induced nonlinear analysis of high-rise structures: Currently, the elastic–plastic finite element method, which has the advantage of high accuracy, has been developed to account for GN and MN in high-rise structures under wind loads. In this method, the geometric stiffness and elastic stiffness are adjusted in the time domain. To simplify the iterative convergence process and reduce computation time, steel and concrete are often treated as a single material, or a stiffness discount factor is applied to consider material nonlinearity. Due to the limitations of current finite element modeling techniques, it still remains a requested subject to simulate MN and synergy between steel and concrete after local cracking occurs due to the action of wind loads. The multiscale modeling method is widely employed to analyze the effects of GN and MN at local nodes on the wind-induced response of latticed tall structures. One of the key areas of focus for future researchers is to establish reasonable boundary conditions for local models, which will further reduce errors in the wind vibration analysis of local nodes.
(3)
Wind-induced nonlinear analysis of flexible bridges: The AN in blunt sections of bridges arises from the amplitude dependence of the aerodynamic derivative and the higher-order term of the self-excited force. The presence of GN in bridge structures results in postflutter behavior that does not increase indefinitely but exhibits a small yet stable limit cycle oscillation. Modeling the nonlinear aerodynamic problems of bridges using polynomial aerodynamic models and Volterra series aerodynamic models has become a prominent research focus in bridge wind engineering. However, the identification of kernel functions and the calculation of multidimensional convolutional integration in Volterra series aerodynamic models exponentially increase as the nonlinear order rises. Therefore, further development is required to effectively apply Volterra series aerodynamic models in the field of wind-induced nonlinearity in flexible bridges.
(4)
Wind-induced nonlinear analysis of transmission lines: The extension deformation of transmission lines under aeolian vibration is commonly assumed to be linear and elastic within a small range, disregarding MN. One common approach to solving the aeolian vibration equation for multisplit transmission lines, considering GN, is to employ the empirical nonlinear model developed by Scanlan combined with dynamic methods. To address the AN of the leeward-side conductor’s subspan oscillation in the wake of the windward-side conductor in a multisplit transmission line, nonlinear finite element models and the Runge–Kutta numerical integration method are typically utilized to solve the nonlinear vibration equation. These methods enable a qualitative assessment of the impact of AN on the oscillation amplitude. When studying the wind-induced nonlinear effects of transmission line galloping, it is necessary to account for both the GN resulting from large amplitudes and the AN caused by variations in the aerodynamic three-component force coefficient with the wind angle of attack. A three-node parabolic cue element is commonly employed for modeling, combined with linearization using the incremental harmonic balance method and curved beam theory. This approach reduces the computational time required for incremental iterative calculations in numerical simulations for solving the galloping equation. Attaining an accurate solution for discretized galloping differential equations is crucial for further investigating the influence of geometric nonlinear stiffness terms on the galloping response. The improved Lindstedt–Poincare perturbation method, which considers the strong GN in the response of ice-covered transmission lines, offers high accuracy.
(5)
Existing instruments for free or forced vibration tests are not accurate enough to identify wind load parameters in the nonlinear region, and there is no uniformly recognized computational model for crosswind nonlinear aerodynamic damping of tall buildings and nonlinear self-excited aerodynamic forces of flexible bridges, which still need to be explored. In addition, the complex numerical calculations and nonlinear analyses involved in wind-induced nonlinear effects still consume a lot of computational resources and time, especially for complex wind field conditions or flexible and variable structural forms. There is still a lack of sufficient in situ measurements to support the study of complex wind fields in coastal and mountainous regions, and uniform models need to be further supplemented and summarized, especially for transient and non-Gaussian wind fields. Some of the major challenges ahead include further development of analytical, modeling, and identification tools to facilitate modeling of nonlinear features. The development of new predictive analysis tools in conjunction with artificial intelligence information technology is also a challenging area of research. Advanced suppression methods, such as aerodynamic optimization methods adapted to different Archimedean optimization algorithms (AOAs) and nonlinear damper control measures, are promising.

Author Contributions

Methodology, S.Z. and C.Z.; software, S.Z. and X.D.; formal analysis, S.Z. and C.Z.; resources, X.D. and Z.Y.; writing—original draft preparation, S.Z. and C.Z.; writing—review and editing, S.Z., C.Z. and Z.Y.; visualization, S.Z.; project administration, S.Z.; funding acquisition, Z.Y. All authors have read and agreed to the published version of the manuscript.

Funding

This research was funded by National Natural Science Foundation of China via (Grant No. 52178458), China Postdoctoral Science Foundation via (Grant No. 2022M720592), Special Funding of Chongqing Postdoctoral Research Project via (Grant No. 2022CQBSHTB2051), Natural Science Foundation of Chongqing Municipal Science and Technology Commission via (Grant No. CSTB2022NSCQ-MSX0363) and Science and Technology Research Program of Chongqing Municipal Education Commission via (Grant No. KJQN202001548 and Grant No. KJZD-M201901502).

Data Availability Statement

Not applicable.

Conflicts of Interest

The authors declare no conflict of interest.

References

  1. Wu, B.; Zhou, J.T.; Xin, J.Z.; Zhang, H.; Zhang, L.L.; Yang, X.Y. Aerodynamic forces on a bluff cylinder in sinusoidal streamwise winds with different angles of attack. Buildings 2022, 12, 1033. [Google Scholar] [CrossRef]
  2. Bian, Y.F.; Liu, X.P.; Sun, Y.; Zhong, Y.L. Optimized design of a tuned mass damper inerter (TMDI) applied to circular section members of transmission towers. Buildings 2022, 12, 1154. [Google Scholar] [CrossRef]
  3. Zhu, S.Y.; Li, Y.L.; Yang, Y.Y.; Ju, N.P. Stochastic buffeting analysis of uncertain long-span bridge deck with an optimized method. Buildings 2022, 12, 632. [Google Scholar] [CrossRef]
  4. Li, T.; Wu, T.; Liu, Z. Nonlinear unsteady bridge aerodynamics: Reduced-order modeling based on deep LSTM networks. J. Wind End. Ind. Aerodyn. 2020, 198, 104116. [Google Scholar] [CrossRef]
  5. Kandel, A.; Sun, X.Y.; Wu, Y. Wind-induced responses and equivalent static design method of oval-shaped arch-supported membrane structure. J. Wind End. Ind. Aerodyn. 2021, 213, 104620. [Google Scholar] [CrossRef]
  6. Montoya, M.C.; Hernandez, S.; Kareem, A.; Nieto, F. Efficient modal-based method for analyzing nonlinear aerostatic stability of long-span bridges. Eng. Struct. 2021, 244, 112556. [Google Scholar] [CrossRef]
  7. Skyvulstad, H.; Argentini, T.; Zasso, A.; Oiseth, O. Nonlinear modelling of aerodynamic self-excited forces: An experimental study. J. Wind End. Ind. Aerodyn. 2021, 209, 104491. [Google Scholar] [CrossRef]
  8. Abdelaziz, K.M.; Alipour, A.; Hobeck, J.D. A smart façade system controller for optimized wind-induced vibration mitigation in tall buildings. J. Wind End. Ind. Aerodyn. 2021, 212, 104601. [Google Scholar] [CrossRef]
  9. Kumar, K.S. Wind loading on tall buildings: Review of indian standards and recommended amendments. J. Wind End. Ind. Aerodyn. 2020, 204, 104240. [Google Scholar] [CrossRef]
  10. Heremans, J.; Geuzaine, M.; Denoël, V. A background/resonant decomposition based method to predict the behavior of 2-dof aeroelastic oscillators. J. Wind End. Ind. Aerodyn. 2023, 233, 105290. [Google Scholar] [CrossRef]
  11. AS/NZS 1170.2; Australia/New Zealand Standard, Structural Design Actions. Part 2: Wind Actions. Standards Australia International Ltd.: Sydney, Australia; Standards New Zealand: Wellington, New Zealand, 2011.
  12. American Society of Civil Engineers. Minimum Design Loads for Buildings and Other Structures; ASCE 7–10; American Society of Civil Engineers: Reston, VA, USA, 2013. [Google Scholar]
  13. Méndez-Gordillo, A.R.; Campos-Amezcua, R.; Cadenas, E. Wind speed forecasting using a hybrid model considering the turbulence of the airflow. Renew. Energy 2022, 196, 422–431. [Google Scholar] [CrossRef]
  14. Geleta, T.N.; Girma, B. Validation metrics and turbulence frequency limits for LES-based wind load evaluation for low-rise buildings. J. Wind End. Ind. Aerodyn. 2022, 231, 105210. [Google Scholar] [CrossRef]
  15. Davenport, A.G. Gust loading factors. J. Struct. Div. 1967, 93, 11–34. [Google Scholar] [CrossRef]
  16. Castro, H.G.; De Bortoli, M.E.; Paz, R.R.; Marighetti, J.O. Una metodología de cálculo para la determinación de la respuesta dinámica longitudinal de estructuras altas bajo la acción del viento. Rev. Int. Metod Num. 2015, 31, 235–245. [Google Scholar] [CrossRef] [Green Version]
  17. Solari, G. Wind response spectrum. J. Eng. Mech. 1989, 115, 2057–2073. [Google Scholar] [CrossRef]
  18. Melbourne, W.H. Comparison of measurements on the CAARC standard tall building model in simulated model wind flows. J. Wind End. Ind. Aerodyn. 1980, 6, 73–88. [Google Scholar] [CrossRef]
  19. Chen, L.; Letchford, C.W. Parametric study on the along-wind response of the CAARC building to downbursts in the time domain. J. Wind End. Ind. Aerodyn. 2004, 92, 703–724. [Google Scholar] [CrossRef]
  20. Huergo, I.F.; Hugo, H.B.; Roberto, G.M. Analytical simulation of 3d wind-induced vibrations of rectangular tall buildings in time domain. Shock Vib. 2022, 2022, 7283610. [Google Scholar] [CrossRef]
  21. Wang, Y.X.; Li, M.S.; Yang, Y. Prediction of along-wind loading on tall building based on two-dimensional aerodynamic admittance. J. Wind End. Ind. Aerodyn. 2023, 238, 105439. [Google Scholar] [CrossRef]
  22. Preetha, H.S.; Alice, A. Prediction of nonlinear structural response under wind loads using deep learning techniques. Appl. Soft Comput. 2022, 129, 109424. [Google Scholar] [CrossRef]
  23. Jin, W.; Kopp, G.A. Gust effect factors for regions of separated flow around rigid low-, mid-, and high-rise buildings. J. Wind End. Ind. Aerodyn. 2023, 232, 105254. [Google Scholar]
  24. John, H.; Brian, B.; Breiffni, F.; Hollie, M. Mitigation of wind induced accelerations in tall modular buildings. Structures 2022, 37, 576–587. [Google Scholar]
  25. Xue, Y.J.; Hao, W. Extracting nonlinear aerodynamic damping of crosswind-excited tall buildings based on probability density function of displacement amplitude. J. Build. Eng. 2023, 72, 106632. [Google Scholar] [CrossRef]
  26. Lupi, F.; Niemann, H.J.; Rüdiger, H. Aerodynamic damping model in vortex-induced vibrations for wind engineering applications. J. Wind End. Ind. Aerodyn. 2018, 174, 281–295. [Google Scholar] [CrossRef]
  27. Watanabe, Y.; Isyumov, N.; Davenport, A.G. Empirical aerodynamic damping function for tall buildings. J. Wind End. Ind. Aerodyn. 1997, 72, 313–321. [Google Scholar] [CrossRef]
  28. Francesca, L.; Lisa, P.; Ulf, W.; Ruediger, H. Aerodynamic damping functions in vortex-induced vibrations for structures with sharp edges. J. Wind End. Ind. Aerodyn. 2023, 238, 105411. [Google Scholar]
  29. Chen, Z.S.; Tse, K.T.; Kwok, K.C.S. Unsteady pressure measurements on an oscillating slender prism using a forced vibration technique. J. Wind End. Ind. Aerodyn. 2017, 170, 81–93. [Google Scholar] [CrossRef]
  30. Steckley, A. Motion-Induced Wind Forces on Chimneys and Tall Buildings. Ph.D. Thesis, University of Western Ontario, London, ON, Canada, 1989. [Google Scholar]
  31. Vickery, B.J.; Basu, R.I. Across-wind vibrations of structures of circular cross section. Part I: Development of a mathematical model for two-dimensional conditions. J. Wind Eng. Ind. Aerod. 1983, 12, 49–73. [Google Scholar] [CrossRef]
  32. American Society of Mechanical Engineers. The American Society of Mechanical Engineers; ASME STS-1-2006; American Society of Mechanical Engineers: New York, NY, USA, 2006. [Google Scholar]
  33. International Committee for Industrial Construction. CICIND Model Code for Steel Chimneys; CICIND 2010; International Committee for Industrial Construction: Ratingen, Germany, 2010. [Google Scholar]
  34. European Commission. Eurocode 1: Actions on Structures; EN 1991; European Commission: Brussels, Belgium, 2010. [Google Scholar]
  35. Vickery, B.J.; Clark, A.W. Lift of across-wind response of tapered stacks. Proceedings American Society of Civil Engineering. J. Struct. Div. 1972, 1, 1–19. [Google Scholar] [CrossRef]
  36. Verboom, G.K.; Koten, H. Vortex excitation: Three design rules tested on 13 industrial chimneys. J. Wind Eng. Ind. Aerod. 2010, 98, 145–154. [Google Scholar] [CrossRef]
  37. Lupi, F.; Niemann, H.J.; Hoffer, R. A novel spectral method for cross-wind vibrations: Application to 27 full-scale chimneys. J. Wind Eng. Ind. Aerod. 2017, 171, 353–365. [Google Scholar] [CrossRef]
  38. Chen, C.C.; Andrews, H.C. Target-motion-induced radar imaging. IEEE Trans. Aerosp. Electron. Syst. 1980, AES-16, 2–14. [Google Scholar] [CrossRef]
  39. Sahoo, P.K.; Chatterjee, S. Nonlinear dynamics and control of galloping vibration under unsteady wind flow by high-frequency excitation. Commun. Nonlinear Sci. Numer. Simul. 2023, 116, 106897. [Google Scholar] [CrossRef]
  40. Jha, R.; Dhapekar, N.K.; Rathod, M. A study of structural response and aerodynamic effects assessing wind performance of tall buildings. Scan. J. Inf. Syst. 2023, 35, 1138–1145. [Google Scholar]
  41. Chen, X.Z. Analysis of crosswind fatigue of wind-excited structures with nonlinear aerodynamic damping. Eng. Struct. 2014, 74, 145–156. [Google Scholar] [CrossRef]
  42. Chen, X.Z. Estimation of extreme value distribution of crosswind response of wind-excited flexible structures based on extrapolation of crossing rate. Eng. Struct. 2014, 60, 177–188. [Google Scholar] [CrossRef]
  43. Chen, X.Z.; Kareem, A. Proper orthogonal decomposition-based modeling, analysis, and simulation of dynamic wind load effects on structures. J. Eng. Mech. 2005, 131, 325–339. [Google Scholar] [CrossRef]
  44. Blackburn, H.M.; Melbourne, W.H. Cross flow response of slender circular-cylindrical structures: Prediction models and recent experimental results. J. Wind End. Ind. Aerodyn. 1993, 49, 167–176. [Google Scholar] [CrossRef]
  45. Ma, C.M.; Liu, Y.Z.; Li, Q.S.; Liao, H.L. Prediction and explanation of the aeroelastic behavior of a square-section cylinder via forced vibration. J. Wind End. Ind. Aerodyn. 2018, 176, 78–86. [Google Scholar] [CrossRef]
  46. Holmes, J.D.; Tse, T. International high-frequency base balance benchmark study. Wind Struct. 2014, 18, 457–471. [Google Scholar] [CrossRef]
  47. Kareem, A.; Gurley, K. Damping in structures: Its evaluation and treatment of uncertainty. J. Wind End. Ind. Aerodyn. 1996, 59, 131–157. [Google Scholar] [CrossRef]
  48. Xie, W.; Huang, P. Extreme estimation of wind pressure with unimodal and bimodal probability density function characteristics: A maximum entropy model based on fractional moments. J. Wind End. Ind. Aerodyn. 2021, 214, 104663. [Google Scholar] [CrossRef]
  49. De Salles, H.B.; Fadel Miguel, L.F.; Lenzi, M.S.; Lopez, R.H.; Beck, A.T. A fast frequency sweep approach for performance-based optimization of earthquake-resistant irregular large-scale buildings. Eng. Struct. 2023, 285, 116094. [Google Scholar] [CrossRef]
  50. Martin, D.; Pozos-Estrada, A. A simplified method for structural and fatigue analyses of wind turbine support structures. J. Wind End. Ind. Aerodyn. 2022, 224, 104983. [Google Scholar] [CrossRef]
  51. Castro, G.; Zurita, G. Applications of operational modal analysis in gearbox and induction motor, based on random decrement technique and enhanced ibrahim time method. Appl. Sci. 2022, 12, 5284. [Google Scholar] [CrossRef]
  52. Marukawa, H.; Kato, N.; Fujii, K.; Tamura, Y. Experimental evaluation of aerodynamic damping of tall buildings. J. Wind End. Ind. Aerodyn. 1996, 59, 177–190. [Google Scholar] [CrossRef]
  53. Tamura, Y.; Suganuma, S.Y. Evaluation of amplitude-dependent damping and natural frequency of buildings during strong winds. J. Wind End. Ind. Aerodyn. 1996, 59, 115–130. [Google Scholar] [CrossRef]
  54. Guo, K.P.; Yang, Q.S.; Liu, M.; Li, B. Aerodynamic damping model for vortex-induced vibration of suspended circular cylinder in uniform flow. J. Wind End. Ind. Aerodyn. 2021, 209, 104497. [Google Scholar] [CrossRef]
  55. Chen, X.Z. Estimation of stochastic crosswind response of wind-excited tall buildings with nonlinear aerodynamic damping. Eng. Struct. 2013, 56, 766–778. [Google Scholar] [CrossRef]
  56. Lutes, L.D.; Sarkani, S. Random Vibrations: Analysis of Structural and Mechanical Systems; Elsevier Butterworth-Heinemann: Oxford, UK, 2004. [Google Scholar]
  57. Caughey, T.K. On the response of non-linear oscillators to stochastic excitation. Probabilist. Eng. Mech. 1986, 1, 2–4. [Google Scholar] [CrossRef]
  58. Roberts, J.B.; Spanos, P.D. Random Vibration and Statistical Linearization; Courier Corporation: Chelmsford, MA, USA, 2003. [Google Scholar]
  59. Li, Y.g.; Liu, P.; Li, Y.; Yan, J.h.; Quan, J. Wind loads characteristics of irregular shaped high-rise buildings. Adv. Struct. Eng. 2023, 26, 3–16. [Google Scholar] [CrossRef]
  60. Bhattacharya, S.; Dalui, S.K. Effect of tuned mass damper in wind-induced response of “v” plan-shaped tall building. Struct. Des. Tall Spec. 2022, 31, e1931. [Google Scholar] [CrossRef]
  61. Hou, F.; Jafari, M. Investigation approaches to quantify wind-induced load and response of tall buildings: A review. Sustain. Cities Soc. 2020, 62, 102376. [Google Scholar] [CrossRef]
  62. Hong, H.P. Torsional responses under bidirectional seismic excitations: Effect of instantaneous load eccentricities. J. Struct. Eng. 2013, 139, 133–143. [Google Scholar] [CrossRef]
  63. Ministry of Construction of the People’s Republic of China. Load Code for the Design of Building Structures; GB 50009—2012; China Architecture and Building Press: Beijing, China, 2012. [Google Scholar]
  64. López-Ibarra, A.; Pozos-Estrada, A.; Nava-González, R. Effect of partially correlated wind loading on the response of two-way asymmetric systems: The impact of torsional sensitivity and nonlinear effects. Appl. Sci. 2023, 13, 6421. [Google Scholar] [CrossRef]
  65. Man, X.; Bin, Z.; Hong, Q.; Qing, X.; Guo, W.W.; He, X. Nonlinear dynamic response analysis of wind-train-bridge coupling system of hu-su-tong bridge. Eng. Mech. 2021, 38, 83. [Google Scholar]
  66. Heyman, J. Plastic Design of Portal Frames; Cambridge University Press: Cambridge, MA, USA, 1957. [Google Scholar]
  67. Barsoum, R.S.; Gallagher, R.H. Finite element analysis of torsional and torsional-flexural stability problems. Int. J. Numer. Meth. Eng. 2010, 2, 335–352. [Google Scholar] [CrossRef]
  68. Nayfeh, A.H.; Pai, P.F. Linear and Nonlinear Structural Mechanics; Wiley: Hoboken, NJ, USA, 2004. [Google Scholar]
  69. Chan, S.L.; Zhou, Z.H. Pointwise equilibrating polynomial element for nonlinear analysis of frames. J. Struct. Eng. 1994, 120, 1703–1717. [Google Scholar] [CrossRef]
  70. Kanchi, M.B. Matrix Methods of Structural Analysis; Wiley Eastern: Hoboken, NJ, USA, 1964. [Google Scholar]
  71. Meek, J.L.; Tan, H.S. Geometrically nonlinear analysis of space frames by an incremental iterative technique. Comput. Methods Appl. Mech. Eng. 1984, 47, 261–282. [Google Scholar] [CrossRef]
  72. Riks, E. An incremental approach to the solution of snapping and buckling problems. Int. J. Solids Struct. 1979, 15, 529–551. [Google Scholar] [CrossRef]
  73. Chan, S.L. Geometric and material non-linear analysis of beam-columns and frames using the minimum residual displacement method. Int. J. Numer. Meth. Eng. 1988, 26, 2657–2669. [Google Scholar]
  74. Chan, S.L. Inelastic post-buckling analysis of tubular beam-columns and frames. Eng. Struct. 1989, 11, 23–30. [Google Scholar] [CrossRef]
  75. Zhou, Z.H.; Chan, S.L. Elastoplastic and large deflection analysis of steel frames by one element per member. I: One hinge along member. J. Struct. Eng. 2004, 130, 538. [Google Scholar]
  76. Chan, S.L.; Zhou, Z.H. Elastoplastic and large deflection analysis of steel frames by one element per member. II: Three hinges along member. J. Struct. Eng. 2004, 130, 545. [Google Scholar]
  77. Remyasree, A.R.; Vijayan, M. Non-linear seismic analysis of reinforced concrete chimney. Int. J. Civ. Eng. 2016, 3, 12–17. [Google Scholar]
  78. Wu, H.X.; Ke, S.T.; Wang, F.T. Analysis of wind-induced cooling tower collapse damage based on cfd and ls-dyna coupling techniques. Proc. NACSE 2019, 37, 307–310. (In Chinese) [Google Scholar]
  79. Wang, F.; Tang, K.; Wang, X.; Wu, H. Analysis of wind-induced structural continuity collapse of very large cooling towers. Proc. NACSE 2019, 4, 282–285. (In Chinese) [Google Scholar]
  80. Meng, W.Y.; Xie, L.Y.; Zhang, Y.; Wang, Y.W.; Sun, X.F.; Zhang, S.J. Effect of mean stress on the fatigue life prediction of notched fiber-reinforced 2060 al-li alloy laminates under spectrum loading. Adv. Mater. Sci. Eng. 2018, 2018, 1–16. [Google Scholar]
  81. Rao, N.P.; Knight, G.; Lakshmanan, N.; Iyer, N.R. Investigation of transmission line tower failures. Eng. Fail. Anal. 2010, 17, 1127–1141. [Google Scholar]
  82. Albermani, F.; Kitipornchai, S. Numerical simulation of structural behaviour of transmission towers. Thin Wall-Struct. 2003, 41, 167–177. [Google Scholar] [CrossRef] [Green Version]
  83. Chan, S.L.; Cho, S.H. Second-order analysis and design of angle trusses part i: Elastic analysis and design. Eng. Struct. 2008, 30, 616–625. [Google Scholar]
  84. Knight, G.M.S.; Santhakumar, A.R. Joint effects on behavior of transmission towers. J. Struct. Eng. 1993, 119, 698–712. [Google Scholar]
  85. Kitipornchai, S. Full scale testing of transmission and telecommunication towers using numerical simulation techniques. Proc. ICASS 1996, 43–53. [Google Scholar]
  86. Ungkurapinan, N.; Chandrakeerthy, S.; Rajapakse, R.; Yue, S.B. Joint slip in steel electric transmission towers. Eng. Struct. 2003, 25, 779–788. [Google Scholar] [CrossRef]
  87. Pao, N.P.; Kalyanaraman, V. Non-linear behaviour of lattice panel of angle towers. J. Constr. Steel Res. 2001, 57, 1337–1357. [Google Scholar]
  88. Kurobane, Y.; Ogawa, K.; Ochi, K.; Makino, Y. Local buckling of braces in tubular k-joints. Thin Wall-Struct. 1986, 4, 23–40. [Google Scholar] [CrossRef]
  89. Banik, S.S.; Hong, H.P.; Kopp, G.A. Assessment of capacity curves for transmission line towers under wind loading. J. Wind End. Ind. Aerodyn. 2010, 13, 1–20. [Google Scholar]
  90. Borri-Brunetto, M.; Chiaia, B.; Ciavarella, M. Incipient sliding of rough surfaces in contact: A multiscale numerical analysis. Comput. Methods Appl. Mech. Eng. 2001, 190, 6053–6073. [Google Scholar]
  91. Zaghi, S.; Martinez, X.; Rossi, R.; Petracca, M. Adaptive and off-line techniques for non-linear multiscale analysis. Compos. Struct. 2018, 206, 215–233. [Google Scholar] [CrossRef] [Green Version]
  92. Skelton, R.E.; Fraternali, F.; Carpentieri, G.; Micheletti, A. Minimum mass design of tensegrity bridges with parametric architecture and multiscale complexity. Mech. Res. Commun. 2014, 58, 124–132. [Google Scholar]
  93. Nguyen, V.P.; Stroeven, M.; Sluys, L.J. Multiscale failure modeling of concrete: Micromechanical modeling, discontinuous homogenization and parallel computations. Comput. Methods Appl. Mech. Eng. 2012, 201–204, 139–156. [Google Scholar]
  94. Voyiadjis, G.Z.; Deliktas, B.; Aifantis, E.C. Multiscale analysis of multiple damage mechanisms coupled with inelastic behavior of composite materials. J. Eng. Mech. 2001, 27, 295–300. [Google Scholar]
  95. Abbas, T.; Kavrakov, I.; Morgenthal, G. Methods for flutter stability analysis of long-span bridges: A review. Proc. Inst. Civil. Eng Bridge Eng. 2017, 170, 271–310. [Google Scholar]
  96. Curami, A.; Zasso, A. Extensive identification of bridge deck aerolastic coefficients: Average angle of attack, reynolds number and other parameter effects. Proc. APSOWE III 1993, 143–148. [Google Scholar]
  97. Scanlan, R.H.; Tomko, J.J. Airfoil and bridge deck flutter derivatives. J. Eng. Mech. Div. 1971, 97, 1717–1733. [Google Scholar] [CrossRef]
  98. Gu, M.; Zhang, R.X.; Xiang, H.F. Identification of flutter derivatives of bridge decks. J. Wind End. Ind. Aerodyn. 2000, 84, 151–162. [Google Scholar] [CrossRef]
  99. Frandsen, J.B. Numerical bridge deck studies using finite elements. Part i: Flutter. J. Fluids Struct. 2003, 19, 171–191. [Google Scholar]
  100. Chen, X.Z.; Matsumoto, M.; Kareem, A. Time domain flutter and buffeting response analysis of bridges. J. Eng. Mech. 2000, 126, 7–16. [Google Scholar] [CrossRef] [Green Version]
  101. Colin, R.; Phanindra, T. Induced and tunable multistability due to nonholonomic constraints. Nonlinear Dyn. 2022, 108, 2115–2126. [Google Scholar]
  102. Falco, M.; Curami, A.; Zasso, A. Nonlinear effects in sectional model aeroelastic parameters identification. J. Wind End. Ind. Aerodyn. 1992, 42, 1321–1332. [Google Scholar]
  103. Shiraishi, M. Effects of oscillation amplitude on aerodynamic derivatives. J. Wind End. Ind. Aerodyn. 2003, 91, 101–111. [Google Scholar]
  104. Diana, G.; Resta, F.; Zasso, A.; Belloli, M.; Rocchi, D. Forced motion and free motion aeroelastic tests on a new concept dynamometric section model of the messina suspension bridge. J. Wind End. Ind. Aerodyn. 2004, 92, 441–462. [Google Scholar]
  105. Xin, Z.; Brownjohn, J. Effect of relative amplitude on bridge deck flutter. J. Wind End. Ind. Aerodyn. 2004, 92, 493–508. [Google Scholar]
  106. Xu, F.Y.; Ying, X.Y.; Zhang, Z. Effects of exponentially modified sinusoidal oscillation and amplitude on bridge deck flutter derivatives. J. Bridge Eng. 2016, 21, 06016001. [Google Scholar]
  107. Siedziako, B.; Oiseth, O.; Ronnquist, A. An enhanced forced vibration rig for wind tunnel testing of bridge deck section models in arbitrary motion. J. Wind End. Ind. Aerodyn. 2017, 164, 152–163. [Google Scholar]
  108. Matsumoto, M.; Shiraishi, N.; Shirato, H.; Shigetaka, K.; Niihara, Y. Aerodynamic derivatives of coupled/hybrid flutter of fundamental structural sections. J. Wind End. Ind. Aerodyn. 1993, 49, 575–584. [Google Scholar]
  109. Zhang, M.J.; Xu, F.Y.; Zhang, Z.B.; Ying, X.Y. Energy budget analysis and engineering modeling of post-flutter limit cycle oscillation of a bridge deck. J. Wind End. Ind. Aerodyn. 2019, 188, 410–420. [Google Scholar]
  110. Chen, Z.Q.; Yu, X.D.; Yang, G.; Spencer, B.F. Wind-induced self-excited loads on bridges. J. Struct. Eng. 2005, 131, 1783–1793. [Google Scholar]
  111. Huang, L.; Xu, Y.L.; Liao, H.L. Nonlinear aerodynamic forces on thin flat plate: Numerical study. J. Fluids Struct. 2014, 44, 182–194. [Google Scholar]
  112. Xu, F.Y.; Wu, T.; Ying, X.Y.; Kareem, A. Higher-order self-excited drag forces on bridge decks. J. Eng. Mech. 2015, 142, 06015007. [Google Scholar]
  113. Diana, G.; Resta, F.; Rocchi, D. A new numerical approach to reproduce bridge aerodynamic non-linearities in time domain. J. Wind End. Ind. Aerodyn. 2008, 96, 1871–1884. [Google Scholar]
  114. Diana, G.; Rocchi, D.; Argentini, T.; Muggiasca, S. Aerodynamic instability of a bridge deck section model: Linear and nonlinear approach to force modeling. J. Wind End. Ind. Aerodyn. 2010, 98, 363–374. [Google Scholar]
  115. Wu, T.; Kareem, A. Aerodynamics and aeroelasticity of cable-supported bridges: Identification of nonlinear features. J. Eng. Mech. 2013, 139, 1886. [Google Scholar]
  116. Wu, T.; Kareem, A. Modeling hysteretic nonlinear behavior of bridge aerodynamics via cellular automata nested neural network. J. Wind End. Ind. Aerodyn. 2011, 99, 378–388. [Google Scholar]
  117. Andrianne, T.; Dimitriadis, G. Experimental and numerical investigations of the torsional flutter oscillations of a 4:1 rectangular cylinder. J. Fluids Struct. 2013, 41, 64–88. [Google Scholar]
  118. Gao, G.Z.; Zhu, L.D. Nonlinear mathematical model of unsteady galloping force on a rectangular 2:1 cylinder. J. Fluids Struct. 2017, 70, 47–71. [Google Scholar]
  119. Zhu, L.D.; Meng, X.L.; Guo, Z.S. Nonlinear mathematical model of vortex-induced vertical force on a flat closed-box bridge deck. J. Wind End. Ind. Aerodyn. 2013, 122, 69–82. [Google Scholar]
  120. Zhu, L.D.; Meng, X.L.; Du, L.Q.; Ding, M.C. A simplified nonlinear model of vertical vortex-induced force on box decks for predicting stable amplitudes of vortex-induced vibrations. Engineering 2017, 3, 854–862. [Google Scholar]
  121. Xu, K.; Ge, Y.; Zhao, L.; Du, X. Calculating vortex-induced vibration of bridge decks at different mass-damping conditions. J. Bridge Eng. 2018, 23, 04017149. [Google Scholar]
  122. Gupta, H. Identification of vortex-induced-response parameters in time domain. J. Eng. Mech. 1996, 122, 1031–1037. [Google Scholar]
  123. Marra, A.M.; Mannini, C.; Bartoli, G. Van der pol-type equation for modeling vortex-induced oscillations of bridge decks. J. Wind End. Ind. Aerodyn. 2011, 99, 776–785. [Google Scholar] [CrossRef]
  124. Náprstek, J.; Pospíšil, S.; Hračov, S. Analytical and experimental modelling of non-linear aeroelastic effects on prismatic bodies. J. Wind End. Ind. Aerodyn. 2007, 95, 1315–1328. [Google Scholar] [CrossRef]
  125. Zhang, M.J.; Xu, F.Y.; Ying, X.Y. Experimental investigations on the nonlinear torsional flutter of a bridge deck. J. Bridge Eng. 2017, 22, 04017048. [Google Scholar] [CrossRef]
  126. Andrianne, T.; Dimitriadis, G. Empirical modelling of the bifurcation behaviour of a bridge deck undergoing across-wind galloping. J. Wind End. Ind. Aerodyn. 2014, 135, 129–135. [Google Scholar] [CrossRef]
  127. Rugh, W.J. Nonlinear System Theory; Johns Hopkins University Press: Baltimore, MD, USA, 1981. [Google Scholar]
  128. Wu, T.; Kareem, A. A low-dimensional model for nonlinear bluff-body aerodynamics: A peeling-an-onion analogy. J. Wind End. Ind. Aerodyn. 2015, 146, 128–138. [Google Scholar] [CrossRef]
  129. Wu, T.; Kareem, A. A nonlinear analysis framework for bluff-body aerodynamics: A volterra representation of the solution of navier-stokes equations. J. Fluids Struct. 2015, 54, 479–502. [Google Scholar]
  130. Khawaja, A.; Hiroshi, K.; Hitoshi, Y. Development of nonlinear framework for simulation of typhoon-induced buffeting response of long-span bridges using volterra series. Eng. Struct. 2021, 244, 112721. [Google Scholar]
  131. Yury, V.; Svetlana, S.; Evgeniia, M.; Ekaterina, A.; Vasilisa, B. Identification of quadratic volterra polynomials in the “input–output” models of nonlinear systems. Mathematics 2022, 10, 1836. [Google Scholar]
  132. Skyvulstad, H.; Petersen, Ø.W.; Argentini, T.; Zasso, A.; Øiseth, O. Regularised volterra series models for modelling of nonlinear self-excited forces on bridge decks. Nonlinear Dyn. 2023, 111, 12699–12731. [Google Scholar] [CrossRef]
  133. Lin, C.M.; Chin, W.L. Adaptive decoupled fuzzy sliding-mode control of a nonlinear aeroelastic system. J. Guid. Control. Dyn. 2006, 29, 206–209. [Google Scholar]
  134. Li, J. Deep neural network for unsteady aerodynamic and aeroelastic modeling across multiple mach numbers. Nonlinear Dyn. 2019, 96, 2157–2177. [Google Scholar] [CrossRef]
  135. Vecchiarelli, J.; Currie, I.G.; Havard, D.G. Computational analysis of aeolian conductor vibration with a stockbridge-type damper. J. Fluids Struct. 2000, 14, 489–509. [Google Scholar] [CrossRef]
  136. Rawlins, C. Fundamental concepts in the analysis of wake-induced oscillation of bundled conductors. IEEE Trans. Power Appar. Syst. 1976, 95, 1377–1393. [Google Scholar] [CrossRef]
  137. Matsumiya, H.; Yukino, T.; Shimizu, M.; Nishihara, T. Field observation of galloping on four-bundled conductors and verification of countermeasure effect of loose spacers. J. Wind End. Ind. Aerodyn. 2022, 220, 104859. [Google Scholar] [CrossRef]
  138. Catchpole, P. A study of parameters relevant to aeolian vibration calculations for transmission line conductors. Proc. ETC 2006, 59–68. [Google Scholar]
  139. Miao, J. Integral alternate analysis of the long-span conductor systems free vibration. J. Mech. Eng. 2002, 38, 153–155. (In Chinese) [Google Scholar] [CrossRef]
  140. Li, L.; Ye, Z.; Kong, D. Improvement of energy balance method and analysis of aeolian vibration on uhv transmission lines. Eng. Mech. 2009, 26, 176–180+197. [Google Scholar]
  141. Goswami, I.; Scanlan, R.H.; Jones, N.P. Vortex-induced vibration of circular cylinders. I: Experimental data. J. Eng. Mech. 1993, 11, 2270–2287. [Google Scholar] [CrossRef]
  142. Larsen, A. Vortex-induced vibration of circular cylinders. II: New model. J. Eng. Mech. 1995, 121, 350–353. [Google Scholar] [CrossRef]
  143. You, Y.; Zhang, L.Q.; Zhang, L.; Ma, Q.Y.; Yan, Z.T.; Liu, X.P. Study on finite element analysis of breeze vibration of transmission lines based on three-node cable elements. IOP Conf. Series EES 2018, 170, 042103. [Google Scholar]
  144. Chen, S.S. A review of flow-induced vibration of two circular cylinders in crossflow. Trans. ASME 1986, 108, 77–79. [Google Scholar] [CrossRef]
  145. Price, S.J. Wake induced flutter of power transmission conductors. J. Sound. Vib. 1975, 38, 125–147. [Google Scholar] [CrossRef]
  146. Singh, S.K. Investigation of spatial growth of young wind wave field. Proc. FMFP 2023, 2, 83–86. [Google Scholar]
  147. Piperni, S. An investigation of the effect of mechanical damping to alleviate wake-induced flutter of overhead power conductors. J. Fluids Struct. 1988, 2, 53–71. [Google Scholar]
  148. Xu, X.P.; Dai, J.; Xu, Z.D. A novel multi-objective optimization of mass dampers for controlling the vortex-induced vibration in bridges. Eng. Struct. 2023, 281, 115761. [Google Scholar] [CrossRef]
  149. Desai, Y.M.; Yu, P.; Popplewell, N.; Shah, A.H. Finite element modelling of transmission line galloping. Comput. Struct. 1995, 57, 407–420. [Google Scholar] [CrossRef]
  150. Desai, Y.M.; Shah, Y.A.H.; Popplewell, N. Perturbation-based finite element analyses of transmission line galloping. J. Sound Vib. 1996, 191, 469–489. [Google Scholar] [CrossRef] [Green Version]
  151. Wang, J.; Lilien, J.L. Overhead electrical transmission line galloping: A full multi-span 3-dof model, some applications and design recommendations. IEEE. Trans. Power Deliv. 1998, 13, 909–916. [Google Scholar] [CrossRef]
  152. Wang, J.; Lilien, J.L. A new theory for torsional stiffness of multi-span bundle overhead transmission lines. IEEE. Trans. Power Deliv. 1998, 13, 1405–1411. [Google Scholar] [CrossRef] [Green Version]
  153. Nigol, O.; Clarke, G.J.; Havard, D.G. Torsional stability of bundle conductors. IEEE Trans. Power Appar. Syst. 1977, 96, 1666–1674. [Google Scholar] [CrossRef]
  154. Liu, X.H.; Yan, B.; Zhang, H.Y.; Zhou, S. Nonlinear numerical simulation method for galloping of iced conductor. Appl. Math. Mech. 2009, 30, 489–501. [Google Scholar] [CrossRef]
  155. Liu, X.H.; Yan, B.; Zhang, H.Y.; Zhou, S.; Tang, J. Nonlinear finite element analysis method of split conductor galloping. Vib. Shock 2010, 29, 129–133 + 240–241. (In Chinese) [Google Scholar]
  156. Yan, Z.T.; Zhang, H.F.; Li, Z.L. Galloping analysis of ice-covered transmission lines based on incremental harmonic balance method. J. Vib. Eng. 2012, 25, 161–166. (In Chinese) [Google Scholar]
  157. Li, Q.; Yang, X.W.; Bu, Y.Z. Effect of geometric nonlinearity on deformation of extra-long-span cable- stayed bridge. J. Southwest Jiaotong Univ. 2007, 2, 133–137. (In Chinese) [Google Scholar]
  158. Zhao, Y.Y.; Zhou, H.B.; Jin, B.; Liu, W.C. Influence of bending rigidity on nonlinear natural frequency of inclined cable. Eng. Mech. 2008, 1, 196–202. (In Chinese) [Google Scholar]
  159. Tan, D.M.; Wang, K.L.; Qu, W.L.; Han, L.; Gao, Y.Z. Galloping analysis of wind-induced vibration for 3d stay cables with iced accretion. Vib. Shock 2016, 35, 156–160+166. (In Chinese) [Google Scholar]
  160. Zheng, Z.B.; Dai, H.Z. Structural stochastic responses determination via a sample-based stochastic finite element method. Comput. Methods Appl. Mech. Eng. 2021, 381, 113824. [Google Scholar] [CrossRef]
  161. Yu, P.; Desai, Y.M.; Popplewell, N.; Shah, A.H. Thre-degree-of-freedom model for galloping. Part ii: Solutions. J. Eng. Mech. 1993, 119, 2426–2448. [Google Scholar] [CrossRef]
  162. Yu, P.; Desai, Y.M.; Shah, A.H.; Popplewell, N. Three-degreeof-freedom model for galloping. Part i: Formulation. J. Eng. Mech. 1993, 119, 2404–2425. [Google Scholar] [CrossRef]
  163. Huang, K.; Feng, Q.; Qu, B. Bending aeroelastic instability of the structure of suspended cable-stayed beam. Nonlinear Dyn. 2017, 87, 2765–2778. [Google Scholar] [CrossRef]
  164. Li, G. Research on Analytic Solution of Galloping of Iced Conductor Considering Geometric Nonlinearity and Environmental Factors and Time-Delay Control. Ph.D. Thesis, Huazhong University of Science and Technology, Wuhan, China, 2021. (In Chinese). [Google Scholar]
  165. Zhang, Y.L.; Chen, L.Q. Steady-state response of pipes conveying pulsating fluid near a 2:1 internal resonance in the supercritical regime. Int. J. Appl. Mech. 2014, 6, 1450056. [Google Scholar] [CrossRef]
  166. Lou, W.J.; Yu, J.; Jiang, X.; Lu, M.; Lu, Z.B. Stability evaluation and aerodynamic damping study on three-degree-of-freedom coupled galloping of iced conductors. Civ. Eng. J. 2017, 50, 55–64. (In Chinese) [Google Scholar]
  167. Liu, X.; Huo, B. Nonlinear vibration and multimodal interaction analysis of transmission line with thin ice accretions. Int. J. Appl. Mech. 2015, 7, 1550007. [Google Scholar] [CrossRef]
  168. Meng, Z.; Guifeng, Z.; Jie, L. Nonlinear dynamic analysis of high-voltage overhead transmission lines. Shock Vib. 2018, 2018, 1247523. [Google Scholar]
  169. Wang, D.; Chen, X.; Li, J. Prediction of wind-induced buffeting response of overhead conductor: Comparison of linear and nonlinear analysis approaches. J. Wind End. Ind. Aerodyn. 2017, 167, 23–40. [Google Scholar] [CrossRef]
  170. Matsagar, H.V. Dynamic analysis of overhead transmission lines under turbulent wind loading. OJCE 2015, 5, 359–371. [Google Scholar]
  171. Vanderveldt, H.H.; Chung, B.S.; Reader, W.T. Some dynamic properties of axially loaded wire ropes. Exp. Mech. 1973, 13, 24–30. [Google Scholar]
  172. Ni, Y.Q.; Ko, J.M.; Wong, C.W.; Zhan, S. Modelling and identification of a wire-cable vibration isolator via a cyclic loading test. Proc. Inst. Mech. Eng. Part I J. Syst. Control. Eng. 1999, 213, 163–172. [Google Scholar]
  173. Tinker, M.L.; Cutchins, M.A. Damping phenomena in a wire rope vibration isolation system. J. Sound Vib. 1992, 157, 7–18. [Google Scholar] [CrossRef]
  174. Cao, Y.; Yao, H.; Li, Q.; Yang, P.; Wen, B. Vibration mitigation and dynamics of a rotor-blade system with an attached nonlinear energy sink. Int. J. Non-Lin. Mech. 2020, 127, 103614. [Google Scholar] [CrossRef]
  175. Li, H.; Li, A.; Kong, X. Design criteria of bistable nonlinear energy sink in steady-state dynamics of beams and plates. Nonlinear Dyn. 2021, 103, 1475–1497. [Google Scholar] [CrossRef]
  176. Leroux, M.; Langlois, S.; Savadkoohi, A.T. Nonlinear passive control of galloping of overhead transmission lines: Design and numerical verifications. Proc. Sur. Vib. Shock Noise 2023, 1–4. [Google Scholar]
  177. Gupta, S.K.; Malla, A.L.; Barry, O.R. Nonlinear vibration analysis of vortex-induced vibrations in overhead power lines with nonlinear vibration absorbers. Nonlinear Dyn. 2021, 103, 27–47. [Google Scholar] [CrossRef]
  178. Chen, D.; Gu, C.; Fang, K.; Yang, J.; Guo, D.; Marzocca, P. Vortex-induced vibration of a cylinder with nonlinear energy sink (NES) at low Reynolds number. Nonlinear Dyn. 2021, 104, 1937–1954. [Google Scholar] [CrossRef]
  179. Zuo, H.; Zhu, S. Development of novel track nonlinear energy sinks for seismic performance improvement of offshore wind turbine towers. Mech. Syst. Signal Process. 2022, 172, 108975. [Google Scholar] [CrossRef]
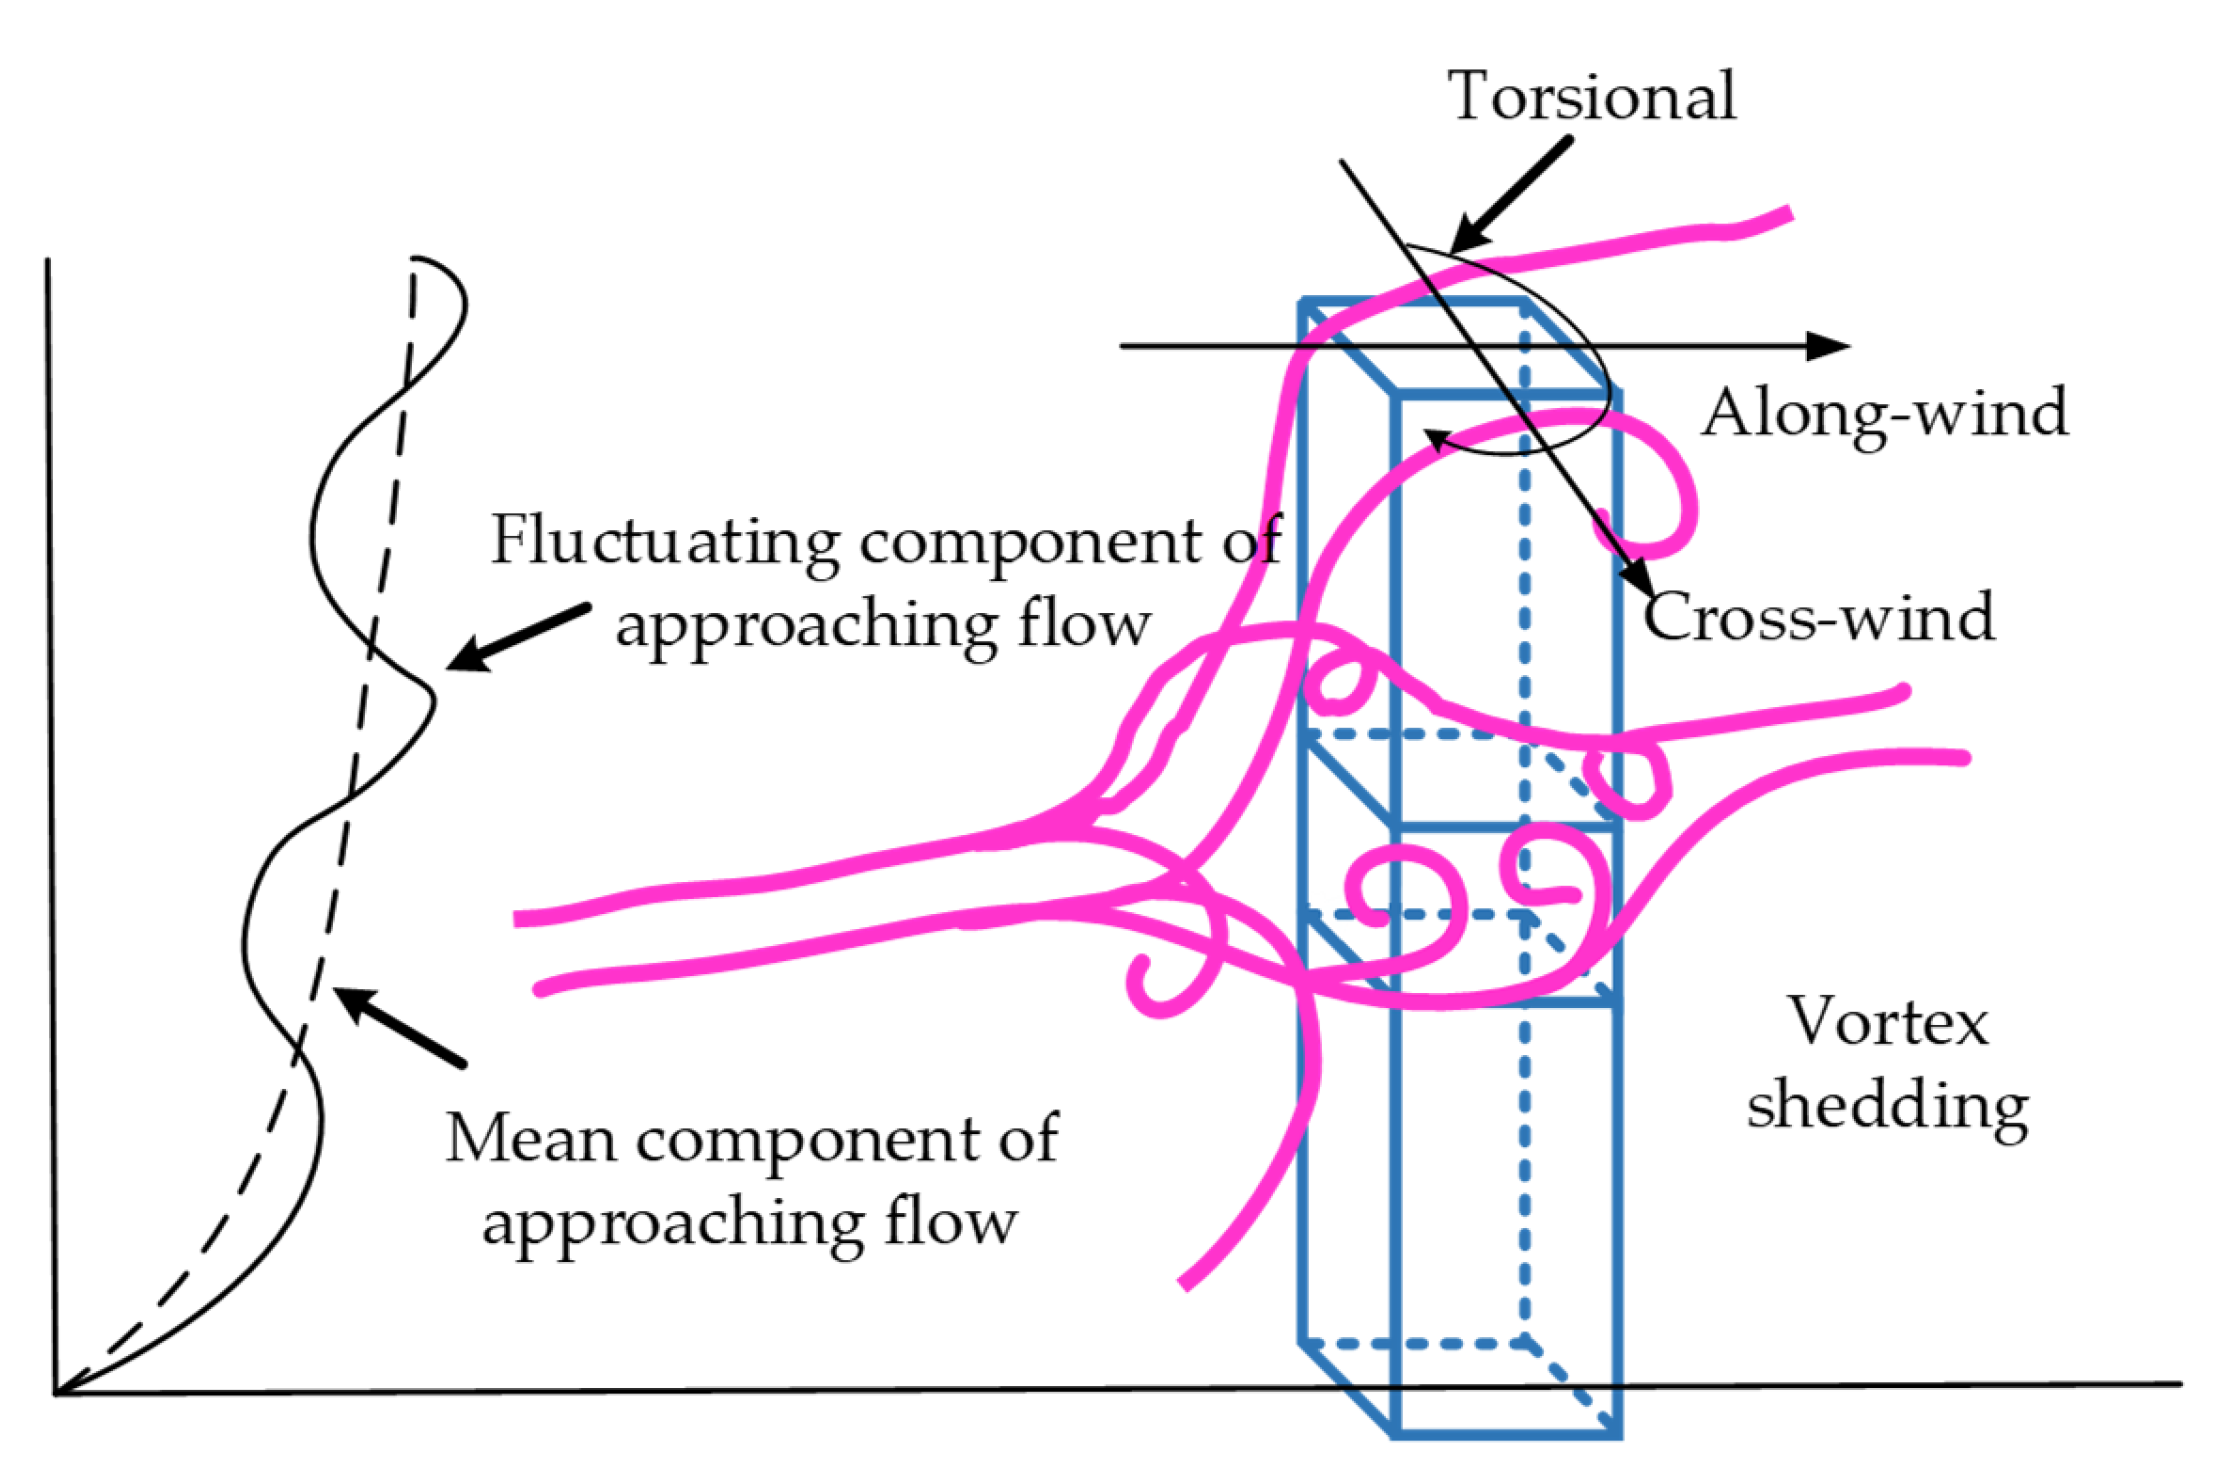
Figure 1. Wind-induced vibration of tall buildings.
Buildings 13 02033 g001
Figure 2. Long-period wind pressure spectrum at a point on the building surface [13].
Buildings 13 02033 g002
Figure 3. Vibration of tall buildings caused by crosswind.
Buildings 13 02033 g003
Figure 4. Variation in equivalent pneumatic damping of a square-section tall building with the reduced wind speed and amplitude [30].
Buildings 13 02033 g004
Figure 6. Wind-induced vibration of flexible bridges.
Buildings 13 02033 g006
Figure 7. Higher-order components in the self-excited force: (a) displacement input; (b) self-excited force output [110].
Buildings 13 02033 g007
Figure 8. Variation in self-excited torque with torsion angle for a bridge main girder: (a) real self-excited force; (b) linear self-excited force; (c) first-order self-excited force; (d) First-three-orders self-excited force [118,119].
Buildings 13 02033 g008
Figure 9. A three-degree-of-freedom centralized parametric model of transmission lines.
Buildings 13 02033 g009
Table 1. Polynomial aerodynamic model of aerodynamic force.
LiteratureResearch SubjectsPolynomial Aerodynamic Model
Naprstek et al. [124]Flutter F y : ( 1 h 2 α 2 ) ( h ˙ + α ˙ + h + α )
Diana et al. [114]Hysteresis loop M z : α + α ˙ + α 2 + α α ˙ + α 3 + α 2 α ˙ s e
Zhang et al. [125]Galloping M z : α + α ˙ + α 2 α ˙ + α 3
Andrianne [126]Galloping F y : h ˙ U + h ˙ h ˙ U 2 + h ˙ 3 U 3 + h ˙ 3 h ˙ U 4 + h ˙ 5 U 5
Zhu et al. [120]Vortex-induced force F y : ( 1 + h ˙ 2 U 2 ) h ˙ U
Disclaimer/Publisher’s Note: The statements, opinions and data contained in all publications are solely those of the individual author(s) and contributor(s) and not of MDPI and/or the editor(s). MDPI and/or the editor(s) disclaim responsibility for any injury to people or property resulting from any ideas, methods, instructions or products referred to in the content.