Abstract
The construction industry has been significantly transformed by the implementation of Building Information Modeling (BIM), which has facilitated extensive project management capabilities across the entire life cycle. Notwithstanding its advantages, there exist certain limitations that hinder its extensive implementation. This study aims to investigate the disparities related to the adoption of Building Information Modeling (BIM) by conducting a thorough analysis of factors such as data interoperability, standardization, collaboration, skill gaps, and resistance to change. The data were collected through a preliminary pilot survey and a primary questionnaire. The collected data were then subjected to analysis using two statistical techniques: Exploratory Factor Analysis (EFA) and Partial Least Squares Structural Equation Modeling (PLS-SEM). This study reveals noteworthy associations between the adoption of Building Information Modeling (BIM) and several crucial factors, including Continuous Integration (CI), Monitoring and Control (MC), Project Management (PM), Resolution and Performance (RP), Structural Management (SM), Sustainability Administration (SA), and Value Management (VM). This study provides valuable insights for professionals and policymakers, offering recommendations to enhance the implementation of Building Information Modeling (BIM) and advocating for additional research on complementary factors. Through the identification and subsequent resolution of recognized shortcomings, Building Information Modeling (BIM) can be employed in a proficient manner to augment collaboration, mitigate costs, optimize energy efficiency, and implement sustainable construction methodologies. The present study makes a substantial contribution to the progress of Building Information Modeling (BIM) adoption and the efficient management of construction project life cycles.
1. Introduction
Building Information Modeling (BIM) has emerged as a game-changer in the construction industry, empowering initiatives with end-to-end life cycle management. With a projected global market size of USD 15.06 billion by 2028, the pervasive adoption of BIM is evident. Its advantages are considerable, with enhanced collaboration being a key benefit [1]. BIM facilitates effective coordination among project stakeholders, resulting in improved collaboration and coordination. A total of 92% of BIM consumers have reported that collaboration has improved. BIM offers remarkable cost and time reductions, potentially saving up to 20% in costs and 40% in time during the design and construction phases [2,3]. The ability to visualize projects in 3D and detect collisions in a virtual environment contributes further to improved decision making and error reduction, resulting in improved project outcomes [4,5].
The influence of BIM extends beyond the construction phase, also enabling efficient facility management. BIM streamlines facility-management processes by providing accurate and up-to-date information about building components and maintenance requirements [6,7]. BIM supports material analysis, waste reduction, and environmental impact assessment, contributing to sustainable building practices [8].
Case studies from the real world further demonstrate the efficacy of BIM. Due to BIM implementation, the construction of the iconic Shard building in London saw a 5% reduction in costs and a 20% reduction in project duration [9,10]. Similarly, the integrated resort Marina Bay Sands in Singapore benefited from BIM’s coordination, dispute detection, and visualization capabilities, resulting in enhanced project efficiency [1,11].
This study aims to identify the key gaps in BIM practices and provide practical suggestions for bridging them by conducting a comprehensive examination of the current state of BIM adoption and implementation [12]. The primary focus of this research pertains to the examination and analysis of the issue of the adoption and implementation of BIM within the context of construction projects. Although BIM has demonstrated its potential for revolutionizing the construction industry by facilitating comprehensive project life cycle management, there remain notable deficiencies and obstacles that impede its widespread implementation and efficient utilization. This study offers a unique and thorough analysis of the adoption and implementation of BIM in construction projects. This study specifically aims to address the current gaps and challenges that impede its widespread adoption and effective utilization [13,14]. The existing body of literature extensively covers the subject of BIM; however, there is a noticeable dearth of research that comprehensively investigates the adoption and implementation of BIM in construction projects. Prior research has frequently presented a general assessment of the advantages and drawbacks of BIM [3,15]. However, there is a scarcity of studies that have specifically examined the precise factors that impede the extensive implementation and efficient utilization of BIM within the construction industry. In contrast to prior investigations that may have addressed certain facets of BIM implementation, our study thoroughly examines the distinct elements of data interoperability, standardization, collaboration, skill gaps, and resistance to change. Furthermore, our research establishes significant associations between the adoption of BIM and diverse project aspects. The utilization of statistical analysis techniques, specifically EFA and Partial Least Squares Structural Equation Modeling (PLS-SEM), contributes to the originality of this research by providing valuable insights into the importance of these variables in facilitating successful BIM implementation. The purpose of these analyses is to reveal new and valuable insights regarding the factors that influence the adoption of BIM and its effects on comprehensive life cycle management within construction projects. This study incorporates a range of practical situations and illustrations to demonstrate the applicability of the suggested strategies and recommendations for the adoption of BIM. The aforementioned scenarios exemplify the pragmatic implementation of the research findings in various construction projects, thereby highlighting the potential advantages of employing BIM for comprehensive life cycle management.
By addressing these voids, this manuscript intends to contribute to the advancement of BIM implementation by proposing strategies and best practices that can increase the effectiveness and efficacy of BIM in enabling construction projects to have seamless end-to-end life cycle management [16,17]. Through an analysis of industry trends, case studies, and statistical evidence, this manuscript will provide stakeholders, decision makers, and practitioners in the construction industry with valuable insights that will enable them to overcome obstacles and harness the full potential of BIM to achieve successful construction project outcomes [18,19].
“Building Information Modeling (BIM): Empowering Construction Projects with End-to-End Life Cycle Management” provides an in-depth analysis of BIM implementation’s novel aspects and innovations. This manuscript encourages the adoption of novel approaches to unleash the full potential of BIM for empowering construction projects with integrated life cycle management by exhibiting emergent technologies, methodologies, and best practices [20].
This manuscript presents a novel method for analyzing the influence of Building Information Modeling (BIM) on construction projects, particularly in the context of the Malaysian construction industry. Utilizing a structural equation modeling (SEM) approach, this study provides a novel comprehension of the complex relationships between BIM adoption, project outcomes, and overall life cycle management in the Malaysian construction industry. This novel methodological framework permits a comprehensive evaluation of the factors which influence the successful implementation of BIM and its subsequent impact on construction projects, thereby contributing new insights and knowledge to both the BIM research domain and the Malaysian construction industry.
2. Literature Review
A study found that BIM adoption improves construction project cost management, schedule adherence, and quality management. Another study conducted a systematic literature review to identify the advantages and disadvantages of BIM-based collaboration and its impact on construction project decision-making processes [21]. In addition, a review article focused on BIM applications for building life cycle management, highlighting its role in facility management, energy efficiency, and sustainability practices [22]. A case study on implementing BIM for facility management in a healthcare facility demonstrated its efficacy in maintenance planning, asset management, and space utilization [23]. A study investigated the use of BIM to enhance construction safety and risk management. It was discovered that BIM facilitates the visualization and analysis of potential dangers, resulting in proactive risk-mitigation strategies and safer construction practices [24]. The focus of the study was the influence of BIM on sustainable design and construction practices. Studies have examined how BIM facilitates energy analysis, material optimization, and environmental impact assessments, resulting in more sustainable and environmentally benign construction projects [25,26]. Another study investigated the benefits of BIM in prefabrication and modular construction. It showed how BIM streamlines the design-to-fabrication process, improves coordination between off-site and on-site activities, and boosts project productivity and efficiency [27].
A study investigated the role of BIM in enhancing communication and collaboration between diverse construction disciplines. Studies have also highlighted the significance of integrated BIM platforms for facilitating seamless data exchange, reducing errors, and nurturing effective collaboration [17,28].
The research has investigated the use of BIM for preserving and restoring historic buildings. It has demonstrated how BIM can aid in capturing, documenting, and visualizing information about historic buildings, thereby facilitating accurate restoration and preservation efforts [17,28]. The benefits of BIM for facility management and maintenance operations were examined in another study. The Journal of Facilities Management (2021) highlighted how BIM provides a digital representation of building assets, facilitating efficient maintenance planning, the monitoring of asset information, and effective resource allocation.
The integration of BIM and augmented reality (AR) technology in construction projects has been investigated. It was demonstrated how the combination of BIM and augmented reality improves on-site visualization, increases construction accuracy, and enables real-time collaboration among project stakeholders [29,30]. A study examined the financial benefits of implementing BIM in construction initiatives. It analyzed the cost savings realized through improved coordination, reduced rework, and optimized resource utilization, highlighting the positive ROI associated with BIM adoption.
Another research investigation investigated the use of BIM in large infrastructure initiatives. Researchers examined how BIM facilitates coordination among multidisciplinary teams, improves conflict detection, and enhances the overall project delivery process, resulting in effective infrastructure project outcomes [31]. A study concentrated on incorporating BIM with supply chain management in the construction industry. It highlighted how BIM-enabled supply chain collaboration enhances material procurement, reduces wastage, and improves logistics planning, resulting in cost savings and enhanced project efficiency [32,33].
The implementation of BIM in renovating and retrofitting existing structures was the subject of another investigation. It demonstrated how BIM facilitates precise as-built documentation, identifies retrofit opportunities, and facilitates decision making for energy-efficient retrofits and building performance optimization [34,35]. The use of BIM in disaster resilience and post-disaster reconstruction initiatives was investigated in a study. It demonstrated how BIM could aid in the rapid appraisal of damage, facilitate the coordination of reconstruction efforts, and improve the resilience of built infrastructure in the face of natural disasters [28,36].
Research has investigated the use of BIM in public infrastructure asset management. Studies have highlighted how BIM-based asset management systems provide a comprehensive asset information database, facilitating effective maintenance planning, condition monitoring, and life cycle assessment of public infrastructure assets [37,38]. A study investigated the use of BIM for risk management on construction projects. It demonstrated how BIM facilitates the identification and analysis of project risks, facilitates the development of risk-mitigation strategies, and improves the overall risk management processes in construction projects [17,28].
The focus of the research has been on the function of BIM in enhancing constructability and constructability reviews. Studies have also demonstrated how BIM facilitates the early identification of constructability issues, improves construction sequencing and logistics planning, and enhances overall project constructability [17,28]. The impact of BIM on client contentment in construction projects was investigated in a study. Studies have also highlighted how BIM-enabled visualization, improved communication, and enhanced project coordination contribute to increased client satisfaction and better project outcomes [17,28].
These additional studies have expanded the body of knowledge regarding the implementation of BIM and its impact on various facets of construction projects, as shown in Table 1. They have shed light on the function of BIM in infrastructure projects, supply chain management, renovation and retrofitting, disaster resilience, asset management, risk management, constructability, client satisfaction, and post-disaster reconstruction. By incorporating the findings of these studies, this manuscript’s argument regarding the transformative potential of BIM in empowering construction projects with end-to-end life cycle management is strengthened.

Table 1.
Identification of factors from the literature.
3. Methodology
This investigation of the issue being considered takes the form of a conceptual model in its methodological approach. An exhaustive examination of the relevant literature was conducted to ascertain pertinent results, which were then included in developing hypotheses [17,28]. To put these assumptions to the test, empirical data were gathered via a three-step process, which included determining, categorizing, and constructing linkages among the various components of the model [17,28]. Figure 1 illustrates the results of the model and presents them. Following an analysis of the relevant literature, the most important BIM activities for achieving success were identified, and Table 1 illustrates these activities.
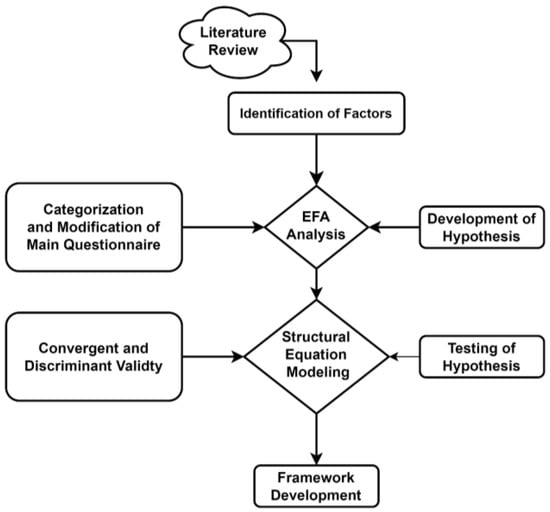
Figure 1.
Flow chart of this study.
3.1. Pilot Survey
In order to address the identified concern, this study presents a comprehensive methodology that entails a meticulous analysis of the variables influencing the adoption and implementation of BIM. The methodology encompasses an initial pilot survey followed by a primary questionnaire aimed at gathering pertinent data from stakeholders within the construction industry. The data gathered were subsequently subjected to a statistical analysis through the utilization of two specific techniques, namely EFA and PLS-SEM. These analyses facilitated the identification of significant correlations between the adoption of BIM and crucial project elements, thereby enhancing comprehension of the factors that impact its effective implementation.
Before this study’s primary data collection phase, a pilot survey was conducted to collect preliminary data and refine the research instrument. The pilot survey included 120 respondents selected based on their expertise and involvement in the construction industry. The pilot survey evaluated the questionnaire’s clarity, relevance, and efficacy in capturing the desired information regarding BIM adoption or its impact on construction project life cycle management [17,28]. The pilot survey sample was selected using a technique known as purposive sampling. This method insured that the selected respondents possessed the necessary knowledge and experience in BIM implementation, making them qualified to provide insightful feedback on the questionnaire. The participants were construction professionals with hands-on experience with BIM-enabled projects, including project managers, architects, engineers, contractors, and BIM specialists [24,27].
The pilot survey was administered using both online and in-person methods. The participants were given explicit instructions on completing the questionnaire and a reasonable amount of time to submit their answers. To ensure the accuracy and completeness of the data, the researchers maintained regular contact with the participants and addressed any queries or concerns they had throughout the survey period.
EFA Analysis
Exploratory Factor Analysis (EFA) was performed on the pilot survey data from Section 3. EFA is a statistical method for identifying underlying factors or constructs within a collection of observed variables. The EFA analysis identified the factors associated with BIM adoption and construction project life cycle management. These aspects of BIM implementation included cost management, schedule adherence, quality management, collaboration, and decision making [29,46]. The survey items with the highest factor loadings were categorized according to their respective factors. The EFA analysis was instrumental in the formulation of the primary questionnaire. It offered a methodical way to classify survey items and comprehend the underlying dimensions of interest. By identifying the factors via EFA, this study ensured that the primary questionnaire captured the most important aspects of BIM adoption and construction project life cycle management [17,28].
Overall, the EFA analysis provided valuable insights into the underlying structure of the survey data, allowing for a better comprehension of this study’s main dimensions and relationships. Utilizing this methodology, this study ensured a thorough and rigorous examination of the impact of BIM on construction project life cycle management.
3.2. Main Questionnaire
To investigate the impact that BIM variables have on the management of the life cycle of construction projects, a questionnaire (Appendix A) for a systematic cross-sectional survey was designed and carried out in the Malaysian state of Perak. The respondent’s demographic profile, BIM activities, and open-ended questions made up the three major portions of the questionnaire, which many stakeholders from the construction industry filled out as part of the research project. The stratified sampling approach was used to guarantee that the sample would be representative. The participants, who had considerable BIM activity and expertise, submitted their assessment using a Likert 5-point scale, which has been extensively utilized in prior research. The answer choices on this scale ranged from very high (5) to nil or very low (1). The number of participants in the sample was 185. The participants were chosen from 265 construction industry professionals who had previously participated in a self-administered interview. The response rate of 68%, deemed to be satisfactory for future investigation [17,28], was used.
3.2.1. PLS-SEM Factor Analysis
This study utilized Partial Least Squares Structural Equation Modeling (PLS-SEM) to investigate the relationship between the constructs of interest and the data. PLS-SEM is a statistical method for analyzing complex relationships between observed and latent variables.
The first stage of the PLS-SEM Factor Analysis was to assess the measurement model by evaluating the constructs’ reliability and validity. Cronbach’s alpha was used to evaluate the internal consistency of the items to determine the model’s reliability. Values greater than 0.7 indicate adequate reliability. In addition, composite reliability (CR) and average variance extracted (AVE) were calculated to evaluate the constructs’ reliability and convergent validity. A CR value greater than 0.70 and an AVE value greater than 0.50 indicate good reliability and convergent validity [17,24].
Next, the constructs’ discriminant validity were examined to ensure they measured distinct concepts. This was accomplished by evaluating the Fornell–Larcker criterion and the item cross-loadings. The Fornell–Larcker criterion contrasts the square root of each construct’s AVE to the inner construct correlations [15,38]. The discriminant validity is established if the square root of the AVE of a construct is greater than its correlation with other constructs. In addition, cross-loadings were examined to ensure that each item was predominantly laden on its corresponding structure.
The structural model was analyzed after establishing the measurement model to determine the construct relationships [47,48]. The statistical significance of the path coefficients, representing the strength and direction of the relationships, was determined using bootstrapping techniques. Bootstrapping entails drawing multiple samples randomly from the dataset to estimate the path coefficients’ standard errors and confidence intervals [28,39]. The bootstrapped confidence intervals were compared to zero to ascertain the significance of the path coefficients. A coefficient was deemed statistically significant if the confidence interval did not contain zero.
In addition, the coefficient of determination (R2) was calculated to ascertain the proportion of variance in the endogenous constructs that could be attributed to the exogenous constructs. This provided insight into the model’s predictive ability [40,42].
The PLS-SEM Factor Analysis technique utilized in this study allowed for an assessment of the measurement model’s reliability and validity, an examination of discriminant validity, and an evaluation of the constructs’ relationships. In the context of construction project life cycle management, this study sought to provide robust and meaningful findings regarding the impact of BIM-related activities on Open-Source Software (OSS) by employing rigorous statistical techniques.
3.2.2. Structural Model Analysis
The hypotheses presented in the table were evaluated using a bootstrap analysis. The analysis included an examination of the relationship coefficients, original sample coefficients, sample mean coefficients, standard deviations, T statistics, p-values, and overall results for each hypothesis. The hypotheses explored the relationship between various factors (CI, MC, PM, RP, SM, SA, and VM) and their impact on Building Information Modeling (BIM) [5,15].
Bootstrap analysis is a statistical technique that entails a resampling of the data set to estimate the uncertainty of the parameters and draw conclusions about the population. It was used to ascertain the significance of the coefficients and the strength of the relationships between the factors and BIM in this study.
The statistical significance of the relationships was determined by contrasting the estimated coefficients with zero and calculating T statistics and p-values. The data supported all the hypotheses, suggesting a significant positive relationship between the examined factors and BIM [32,39].
The original sample coefficients (O) represent the estimated values from the original dataset, whereas the sample mean coefficients (M) represent the mean values obtained from multiple bootstrap samples. The standard deviation (SD) measures the coefficients’ variability. The T statistics evaluate the significance of the coefficients, while the p-values indicate the probability that the observed results were obtained by coincidence [15,42].
This study’s bootstrap analysis provides strong evidence supporting the hypotheses, highlighting the significance of factors such as Continuous Integration, Monitoring and Control, Project Management, Resolution and Performance, Structural Management, Sustainability Administration, and Value Management concerning BIM implementation and its effects.
3.2.3. Predictive Relevance
This investigation used the predictive relevance Q2 measure within the Smart PLS 4.0 software as the methodology. This methodology aimed to evaluate the predictive power and applicability of the research model in relation to the observed data. By calculating the Q2 values, this study intended to ascertain the predictive relevance of the model and its capacity to generate accurate forecasts [17,28]. This analysis was conducted using Smart PLS 4, a popular software application for structural equation modeling (SEM), to improve the comprehension of the relationships between the variables and assess the predictive potential of the model. Positive values signifying the model’s ability to predict the dependent variables based on the independent variables were the anticipated outcome of employing the predictive relevance Q2 measure [3,19,28]. Higher Q2 values indicate that the research model effectively encapsulates and explains the variables’ relationships. A positive result would support the model’s validity and utility in generating accurate predictions and enhancing comprehension of the phenomenon under study.
4. Results
4.1. Demographic Details
The demographic details provide an overview of this study’s respondents’ characteristics, which are described in Table 2. The data are categorized based on profession, organization, Malaysian construction industry experience, and BIM knowledge. In terms of profession, the respondents consisted of a diverse range of professionals, including architects (9.19%), quantity surveyors (8.65%), civil engineers (52.43%), M&E engineers (3.24%), project managers (21.08%), and others (5.41%). This distribution ensures a varied perspective from different disciplines within the construction industry [12,20].
Table 2.
Demographic details of respondents.
Regarding organization, the respondents were affiliated with different types of organizations. The majority were from contractor companies (50.27%), followed by consultants (42.16%) and clients (7.57%). This representation from various sectors allowed for a comprehensive understanding of BIM adoption and challenges from different organizational perspectives. The respondents’ experience in the Malaysian construction industry was categorized into different brackets. The largest group had 0–5 years of experience (32.97%), followed by 6–10 years (32.43%), 11–15 years (21.62%), 16–20 years (8.11%), and over 20 years (4.86%). This range of experience levels ensured insights from early-career professionals and seasoned industry experts. Regarding knowledge about BIM, most respondents (98.38%) indicated that they knew about BIM, while a small portion (1.62%) reported no knowledge about BIM [49]. This indicates that this study primarily focused on individuals familiar with BIM and its implications for the construction industry.
4.2. EFA Analysis
High factor loadings indicate that the variables BIM23, BIM9, BIM15, BIM21, and BIM18 are strongly associated with Factor 1 (0.828, 0.802, 0.784, 0.719, and 0.772, respectively), and are shown in Table 3. These variables contribute significantly to Factor 1, indicating that they share similar or interconnected characteristics. Similarly, the high factor loadings of the variables BIM19, BIM1, BIM22, BIM10, BIM11, and BIM5 indicate that they significantly impact Factor 2. These variables (0.723, 0.701, 0.716, 0.705, 0.665, and 0.602) strongly correlate with Factor 2. The high factor loadings of BIM13, BIM20, and BIM3 on Factor 3 indicate their strong relationship with this factor (0.861, 0.801, and 0.761, respectively). This indicates that these variables share comparable traits or patterns.
Table 3.
Exploratory factor analysis.
Factors four through seven also have substantial variables associated with them, albeit with relatively lesser loadings [50,51]. These variables contribute to comprehending the fundamental factors and highlight their distinctive qualities [35,49]. Their eigenvalues indicate the relative significance of the factors. The higher eigenvalues of Factors 1, 2, and 3 (4.72, 4.21, and 3.60, respectively) indicate that they account for a substantial portion of the data’s variance. The remaining Factors (4–7) have progressively lower eigenvalues (3.06, 2.69, 2.29, and 2.01), indicating a diminished explanatory ability.
The EFA analysis was conducted with a minimum loading criterion threshold of 0.6. Those variables that did not satisfy this criterion were excluded from further analysis. Therefore, three variables, BIM8, BIM24, and BIM16, were omitted from the factor solution.
A varimax rotation with the principal component axis was applied to the extracted factors. This rotation method helps maximize the variance of each factor and produce factor structures that are simpler and more interpretable.
The final factor solution identified seven factors labeled Factor 1 through Factor 7. It was determined which variables had the maximum loadings on each factor, signifying their strong association with the respective factor [3,19]. The eigenvalues of the factors indicate their relative contribution to the data variance explanation. Table 4 shows the categorization of the variables after extraction from the EFA analysis; this happened after placing the variables into seven groups based on their loading and eigenvalues.
Table 4.
Categorization of variables after extraction from EFA analysis.
The EFA analysis effectively identified the fundamental factors and associated variables by employing the loading criterion and implementing a varimax rotation. This method reduces the data’s complexity and facilitates the interpretation of the factor structure. Figure 2 indicates this study’s hypotheses based on the research objective. It was generated after the EFA analysis and categorization.
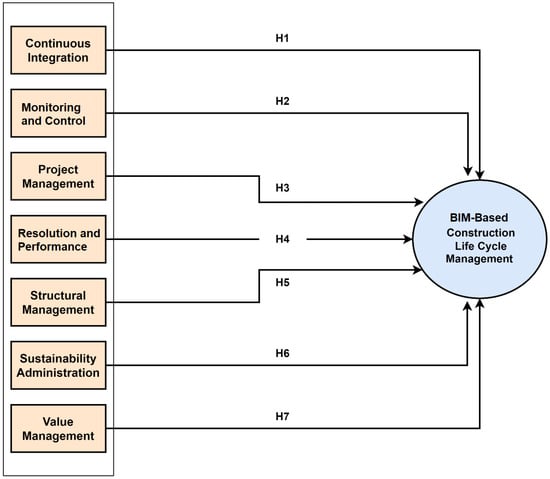
Figure 2.
Hypotheses of this study (developed after EFA).
Hypothesis 1 (H1).
Continuous integration has a significant relation with BIM-based construction life cycle management.
Hypothesis 2 (H2).
Monitoring and control have a significant relation with BIM-based construction life cycle management.
Hypothesis 3 (H3).
Project management has a significant relation with BIM-based construction life cycle management.
Hypothesis 4 (H4).
Resolution and performance have a significant relation with BIM-based construction life cycle management.
Hypothesis 5 (H5).
Structural management has a significant relation with BIM-based construction life cycle management.
Hypothesis 6 (H6).
Sustainability administration has a significant relation with BIM-based construction life cycle management.
Hypothesis 7 (H7).
Value management has a significant relation with BIM-based construction life cycle management.
4.3. PLS Algorithm Analytical Analysis
This study’s convergent validity outcomes indicate that the variables have significant associations with their respective constructs. This is supported by the variables’ ability to accurately measure the fundamental constructs, as indicated by their high factor loadings. In addition, the average variance extracted (AVE) values exceed the recommended threshold, indicating that the variables account for a substantial portion of the constructs’ variance [49,52]. Further supporting the convergent validity of the measurement model, the composite reliability (CR) values indicate good internal consistency within the constructs. These findings demonstrate the instrument’s dependability and validity. The table provides a comprehensive analysis of each category’s factor loadings, variance inflation factor (VIF), Cronbach’s alpha (CA), composite reliability (CR), and average variance extracted (AVE) [17,28].
For the category of Structural Management, the variables BIM23 and BIM9 have high loadings of 0.920 and 0.845, respectively, indicating a strong relationship with this factor. However, BIM15 did not meet the minimum criterion value, so it was removed from the analysis. Another variable, BIM21, has a significant loading of 0.913, indicating that it is relevant to the Structural Management factor. The absence of multicollinearity issues is indicated by a VIF value of 1.480. A Cronbach’s alpha (CA) value of 0.873 indicates good internal consistency among the variables in this category, and a composite reliability (CR) value of 0.882 provides additional evidence of the reliability of the measurements [14,31]. An average variance extracted (AVE) value of 0.798% suggests that the variables in this category account for a substantial proportion of the variance in the construct shown in Table 5.
Table 5.
Convergent validity analysis indicating inflation factor, loading, reliabilities, and average variances.
Moving on to the Monitoring and Control factor, BIM18 demonstrates a high loading of 0.859, indicating a strong relationship with this factor. Similar to BIM19 and BIM1, BIM19 and BIM1 exhibit substantial loadings of 0.866 and 0.817%, respectively. A VIF value of 1.423 indicates that there are no multicollinearity issues [20,49]. A CA value of 0.806 and a CR value of 0.807 indicate that this category has excellent internal consistency and reliability. An AVE value of 0.720 indicates that the variables collectively account for a substantial proportion of the construct’s variance.
BIM22 was removed from the Continuous Integration category because it did not satisfy the minimum criteria value. In contrast, BIM10, BIM11, and BIM5 have respectable loadings of 0.834, 0.789%, and 0.778%, respectively. A VIF value of 2.073 indicates that there are no major multicollinearity issues. CA and CR values of 0.721 and 0.726 indicate adequate internal consistency and reliability. An AVE value of 0.641 indicates that the variables in this category account for a moderate level of variance in the construct [17,28].
Likewise, the remaining categories (Value Management, Resolution and Performance, Project Management, and Sustainability Administration) exhibit significant loadings for their respective variables and acceptable VIF, CA, CR, and AVE values. These results indicate that the variables within each category are reliable measures of their respective constructs and contribute significantly to understanding this study as a whole, as shown in Figure 3.
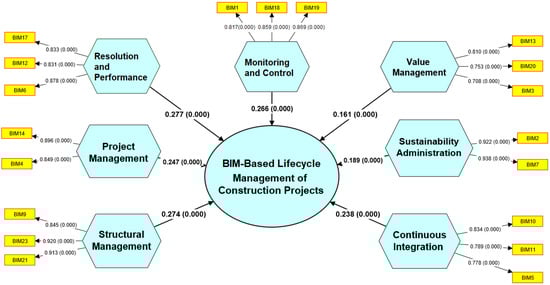
Figure 3.
PLS algorithm analysis indicating the values of path loadings along with p-values.
As shown in Table 6, the HTMT table, the discriminant validity results indicate the level of distinction between the different constructs. The values along the diagonal represent the square root of the average variance extracted (AVE) for each construct, demonstrating the constructs’ reliability [13,19]. The heterotrait–monotrait (HTMT) ratio, which assesses the intensity of the correlation between distinct constructs, is represented by values off the diagonal.
Table 6.
HTMT analysis for the determination of discriminant validity.
The diagonal elements’ HTMT values are all one, indicating perfect discriminant validity within each construct. Generally, the off-diagonal values are less than one, indicating a lower correlation between the various constructs. This indicates that the constructs are separate and measure distinct underlying concepts [3,20]. Nonetheless, a few off-diagonal values are close to or above one, indicating potentially discriminant validity issues. It may be necessary to conduct an additional analysis and interpretation of these particular values to assess the discriminant validity more precisely [53,54].
Table 7, which gives the Fornell–Larcker criteria, provides information regarding the discriminant validity of this study’s constructs. It displays the square root of the extracted average variance (AVE) values on the diagonal and the correlations between the constructs off-diagonal. The diagonal elements in this table represent the AVE values for each construct. These values indicate how much variance each construct captures [3,35]. Higher AVE values indicate that the construct is distinct and accounts for a substantial variance. It can evaluate the discriminant validity by examining the off-diagonal elements representing correlations between the constructs [55,56]. To establish the discriminant validity according to the Fornell–Larcker criteria, the correlations between the constructs must be less than the corresponding AVE values.
Table 7.
Fornell–Larcker criterion indicating discriminant validity.
In this instance, most of the off-diagonal correlations are smaller than their corresponding AVE values, indicating that the constructs have good discriminant validity. For instance, the correlation between Continuous Integration (CI) and Monitoring and Control (MC) is 0.233, which is less than CI’s mean absolute value (0.801). Likewise, other off-diagonal correlations are smaller than their respective AVE values, supporting the discriminant validity of the constructs [57]. Comparing the correlations with the corresponding AVE values, the Fornell–Larcker criteria table provides insight into the discriminant validity of the constructs [20,49]. While most of the constructs demonstrate excellent discriminant validity, those with higher correlations with other constructs may require additional examination and refinement to ensure their uniqueness.
The cross-loading criteria shown in Table 8 details the discriminant validity of the variables within each construct. It displays the variable cross-loadings on the various constructs. Each entry in this table corresponds to a variable, while each column corresponds to a construct. The cell values represent the variable cross-loadings on the corresponding constructs. The cross-loadings represent the intensity of a variable’s association with a construct [3,21].
Table 8.
Cross-loadings criteria for judgment of discriminant validity.
To evaluate the discriminant validity, the magnitude of the cross-loadings is examined. Ideally, a variable’s cross-loadings on its construct should be greater than those on other constructs. This indicates a stronger association between the variable and its construct, supporting discriminant validity [14,20]. In this instance, most of the variables have greater cross-loadings on their construct than others, indicating good discriminant validity. For instance, BIM5 has the highest density on the Continuous Integration (CI) construct (0.778) relative to the other constructs, indicating that CI is its primary focus.
In a few instances, the variables have significant cross-loadings on constructs other than their own. For example, BIM3 reveals relatively high cross-loadings on the Structural Management (SM) and Sustainability Administration (SA) constructs (0.23 and 0.28, respectively). This suggests that BIM3 lacks discriminant validity, as it is related to multiple constructs.
The cross-loadings criteria table aids in assessing the discriminant validity of the variables within the constructs. Most of the variables exhibit good discriminant validity, as their cross-loadings on their constructs are greater than those of other variables. Nonetheless, significant cross-loadings on multiple constructs for specific variables indicate the need for further investigation and possible refinement to ensure their uniqueness.
4.4. Model Structural Analysis
In general, the findings of the path model analysis carried out using the bootstrap method validate the statistical significance and directionality of the correlations between the predictor components and BIM [12,31]. This lends support to this study’s theoretical framework and assumptions. Table 9 below presents the findings obtained using the bootstrap method for the route model analysis. The path coefficients indicate the strength of the links between the predictor constructs (CI, MC, PM, RP, SM, SA, and VM) and the outcome construct (BIM), and the direction in which those associations run.
Table 9.
Hypothesis-testing results of this study.
The original sample values of the path coefficients are shown in the column labeled “O,” while the sample mean values acquired by bootstrapping are displayed in the column labeled “M.” The standard deviation, abbreviated as SD, measures the amount of variation among the route coefficients throughout all of the bootstrap samples [19,52]. A ratio of the predicted route coefficient to the standard error of that coefficient is what the T statistics seek to quantify, which can be seen in Figure 4. When the T value is larger, it suggests that the association between the predictor construct and the result construct is stronger. The results of this study show that all of the T statistics have rather high values, indicating substantial correlations between the predictor factors and BIM.
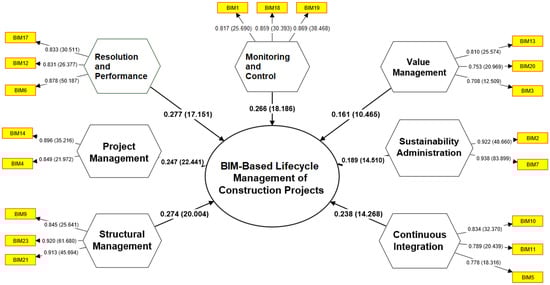
Figure 4.
Bootstrapping analysis indicating path loadings with T statistics.
The p-values indicate the chance of seeing a link as strong as or stronger than the one estimated in this study. This was performed under the assumption that no real relationship exists in the population. A p-value of zero suggests strong evidence against the alternative hypothesis of a significant association and supports the null hypothesis that there is no relationship [16,18]. In this particular instance, every p-value is equal to zero, indicating extremely significant correlations between the predictor components and BIM.
Given these findings, each hypothesis may be considered acceptable, from H1 to H7. This indicates that a substantial body of empirical data supports the links between the predictor constructs (CI, MC, PM, RP, SM, SA, and VM) and the outcome construct (BIM). These results give vital insights into the different variables’ effects on BIM [14,16]. They also indicate that each predictor construct adds considerably to the overall knowledge and prediction of BIM in the analyzed model. In general, the findings of the path model analysis carried out using the bootstrap method validate the statistical significance and directionality of the correlations between the predictor components and BIM. This lends support to this study’s theoretical framework and assumptions.
4.5. Predictive Relevance
Table 10 contains information regarding the predictive value of a model for the Building Information Modeling (BIM)-based life cycle management of construction projects. The predictive relevance is the degree to which a model or method accurately predicts the behavior or outcome of a system. In this instance, it is used to assess the efficacy of BIM within the context of construction project management. The “SSO” column indicates the sum of the squares of observations. This statistical measure computes the sum of the squared differences between each value and the mean of all observed values [18,41]. In the table’s context, SSO represents the sum of the squares of the observed values associated with the construction project predictions generated by the BIM model.
Table 10.
Predictive relevance of the main construct.
The “SSE” column indicates the sum of the squared errors. It measures the sum of the squared differences between the observed and the BIM model’s predicted values. It measures the deviation or error between the predicted and actual values. The “Q2” column represents the coefficient of determination or the proportion of the total variation in the observed values that the BIM model can explain [20,49]. It is calculated as one minus the ratio of SSE to SSO (sum of squared observations to sum of squared errors). In other words, Q2 indicates how much of the total variation in the observed data is accounted for by the model’s predictions. A value closer to one indicates a greater predictive relevance or precision of the BIM model for the life cycle management of construction projects [18,27]. The value for Q2 in the table is 0.247, indicating that the BIM model explains approximately 24.7% of the observed data’s total variance.
5. Discussion
Our findings demonstrate the significance of BIM adoption for “Empowering Construction Projects with End-to-End Life Cycle Management”. The results offer practitioners and decision makers significant insights for comprehending the determinants of BIM adoption and can aid in developing strategies and interventions to facilitate its implementation. Based on these findings, additional research could investigate additional factors and refine the understanding of BIM adoption in the construction industry.
Continuous Integration (CI) is a software development practice that entails the integration of various software tools and development practices to guarantee the continuous and efficient delivery of software [16,18]. In the context of BIM adoption in the construction industry, CI is vital for facilitating collaboration and information exchange between project stakeholders. It enables the expeditious incorporation of design modifications, facilitates the sharing of updated models and data, and aids in ensuring the accuracy and consistency of information throughout the life cycle of a project. A coefficient of 0.238 indicates a positive and statistically significant relationship between CI and BIM implementation, indicating that a greater emphasis on CI practices is associated with an increased likelihood of BIM implementation [17,28]. A mean value (M) of 0.237 and a standard deviation (SD) of 0.017 reveal the average level of and variation in CI among this study’s participants. Values of T = 14.268 and p = 0 indicate that the relationship between CI and BIM adoption is highly significant.
Monitoring and Control (MC) is a crucial aspect of construction project management, involving monitoring project progress, identifying deviations from intended objectives, and implementing corrective actions. MC practices are essential for effectively implementing and utilizing BIM technologies and processes in the context of BIM adoption. Monitoring the quality and accuracy of BIM models, tracking changes and revisions, and evaluating project performance based on predefined metrics are facilitated by MC. A coefficient of 0.266 indicates a positive and statistically significant relationship between MC and BIM adoption, indicating that a greater emphasis on MC practices is associated with a greater likelihood of effective BIM implementation. A mean value (M) of 0.26 and a standard deviation (SD) of 0.015 provide insight into the average level of and variation in MC among this study’s participants. A T-statistic value of 18.186 and the corresponding p-value of 0 indicate that the relationship between MC and BIM adoption is statistically significant [41].
Project Management (PM) entails the planning, coordination, and control of all activities necessary for the successful execution of construction initiatives. Effective project management practices are essential for ensuring the seamless integration of BIM into project workflows and attaining project objectives in the context of BIM adoption. PM practices include defining project objectives, allocating resources, administering project schedules, and monitoring team communication and collaboration. A coefficient of 0.247 indicates a positive and statistically significant relationship between PM and BIM adoption, suggesting that a greater emphasis on effective project management practices is associated with an increased likelihood of successful BIM implementation [30,31,52]. A mean value (M) of 0.246% and a standard deviation (SD) of 0.011 provide insight into the average level of and variation in PM among this study’s participants. A T-statistic value of 22.441 and the corresponding p statistic value of 0 highlight the significance of the relationship between PM and BIM adoption.
Resolution and Performance (RP) refers to the capacity of BIM technologies and processes to improve the resolution and performance of construction projects. This includes utilizing BIM capabilities to enhance project visualization, conflict detection, coordination, and overall performance. RP practices permit the identification and resolution of design conflicts, the optimization of construction processes, and the improvement of project results. A coefficient of 0.277 indicates a positive and statistically significant relationship between RP and BIM adoption, indicating that a larger emphasis on RP practices is associated with an increased likelihood of BIM implementation success. A mean value (M) of 0.27 and a standard deviation (SD) of 0.016 provide insight into the average level of and variation in RP among this study’s participants. A T-statistic value of 17.151 and the corresponding p-value of 0 indicate that the relationship between RP and BIM adoption is statistically significant [16,27].
Structural Management (SM) incorporates the implementation of BIM’s organizational and administrative aspects into construction projects. It requires establishing effective BIM workflows, delineating duties and responsibilities, and assuring appropriate coordination among the project stakeholders involved in the structural aspects. SM practices concentrate on optimizing structural design, analysis, and documentation utilizing BIM tools and techniques. A coefficient of 0.274 indicates a positive and statistically significant association between SM and BIM adoption, suggesting that a greater emphasis on structural management practices is associated with a greater likelihood of effective BIM implementation in structural engineering. A mean value (M) of 0.27 and a standard deviation (SD) of 0.014 provide insight into this study’s participants’ average level of and variation in SM [16,34]. A T-statistic value of 20.004 and the corresponding p statistic value of 0 confirm the statistical significance of the association between SM and BIM adoption.
Sustainability Administration (SA) incorporates sustainable design principles and practices into BIM-enabled construction initiatives. It entails integrating environmental factors, energy efficiency, pollution reduction, and life cycle analysis into the project life cycle. Using BIM tools and data, SA practices seeking to improve the sustainability performance of buildings and infrastructure. A coefficient of 0.189 indicates a positive and statistically significant relationship between SA and BIM adoption, suggesting that a larger emphasis on sustainable administration practices is associated with a greater likelihood of successful BIM implementation with an emphasis on sustainable construction [15,24]. A mean value (M) of 0.188 and a standard deviation (SD) of 0.013 reveal the average level of and variation in SA among this study’s participants [9,11]. A T-statistic value of 14.51 and the corresponding p statistic value of 0 support the statistical significance of the association between SA and BIM adoption.
Value Management (VM) entails using BIM to maximize value and optimize project outcomes. It incorporates BIM-based cost estimation, value engineering, and life cycle cost analysis to support decision-making processes and enhance project value. VM practices seek to increase the overall value of BIM-enabled construction projects by enhancing project efficiency, reducing costs, and minimizing waste. A coefficient of 0.161 indicates a positive and statistically significant relationship between VM and BIM adoption, suggesting that a greater emphasis on value management practices is related to an increased likelihood of successful BIM implementation and project value realization [41,58]. A mean value (M) of 0.162 and a standard deviation (SD) of 0.015 provide insights into the average level of and the variation in VM among this study’s participants. A T-statistic value of 10.465 and the corresponding p-value of 0 indicate that the relationship between VM and BIM adoption is statistically significant.
6. Conclusions
Within the scope of this research project, we investigated the elements that have a role in the construction industry’s adoption of Building Information Modeling (BIM) towards the end-to-end life cycle management of construction projects. The concepts of Continuous Integration (CI), Monitoring and Control (MC), Project Management (PM), Resolution and Performance (RP), Structural Management (SM), Sustainability Administration (SA), and Value Management (VM) were the primary foci of our research. We acquired significant insights into the value of these constructs and how they might be used in the context of BIM implementation within the construction sector by researching the linkages between these constructs and the adoption of BIM. The results of our research show that it is important to consider the relevance of each component when it comes to aiding the adoption and utilization of BIM. Continuous Integration (CI) was identified as an important component with a value of 0.238, showing a strong positively correlated association with BIM adoption. This highlights how important it is to integrate BIM processes, data, and tools smoothly across the whole project life cycle to guarantee a successful deployment and make the most of BIM’s advantages. BIM adoption was also shown to have favorable and substantial correlations with Monitoring and Control (MC), Project Management (PM), Resolution and Performance (RP), Structural Management (SM), Sustainability Administration (SA), and Value Management (VM). These factors are vital to many facets of building projects that are being carried out. A well-defined structural management strategy, efficient project management practices, the optimized resolution of project challenges, well-defined monitoring and control mechanisms, sustainable administration practices, and value-driven decision-making processes all contribute to successfully implementing BIM and improving project outcomes. The findings of our research will help to contribute to a better understanding of the elements that influence the adoption of BIM in the construction sector. Many stakeholders in the construction industry may use these insights as a resource to help them prioritize their work and allocate resources more efficiently. By focusing on upgrading the highlighted structures, organizations may create an atmosphere that is more conducive to adopting BIM, which will lead to better project performance, greater cooperation, and higher efficiency.
This study’s managerial and empirical implications highlight the significance of integrating BIM technologies into construction projects. These technologies include Continuous Integration (CI), Monitoring and Control (MC), Project Management (PM), Resolution and Performance (RP), Structural Management (SM), and Sustainability Administration (SA). Managers can improve cooperation, simplify procedures, increase project efficiency, settle disputes, optimize performance, and promote sustainability by adopting BIM and focusing on these areas. These implications give useful insights to stakeholders interested in using BIM for end-to-end life cycle management and driving innovation within the construction sector. While prior research may have briefly discussed the advantages or constraints of BIM, the present study extensively examines the crucial elements of data interoperability, standardization, collaboration, skill deficiencies, and resistance to change. Furthermore, the utilization of statistical methodologies, such as EFA and PLS-SEM, to establish associations between BIM adoption and diverse project facets contributes to the distinct perspective of this research. Additionally, the practical recommendations and techniques proposed, based on empirical data analysis, distinguish this research from previous works and offer valuable insights to professionals and policymakers in the construction management domain.
One of the limitations of this research is the relatively small sample size, which may restrict the generalizability of the results to a wider variety of construction projects. It is essential to remember that the research was carried out in a particular setting, and it is possible that the findings were impacted by the specific aspects of the projects and organizations that were engaged. In light of this, extreme care should be used before the results are extrapolated to other settings. In further studies, a bigger and more representative sample of participants should be used to verify the results. Studies using a longitudinal design may investigate the consequences of implementing BIM over a longer period. Optimum results may be achieved by conducting research into the precise methods via which BIM affects project management. Investigating the potential synergies between Building Information Modeling (BIM) and new technologies, such as artificial intelligence and the Internet of Things, may result in novel project management methods.
Overall, our research findings highlight the relevance of Continuous Integration, Monitoring and Control, Project Management, Resolution and Performance, Structural Management, Sustainability Administration, and Value Management in boosting BIM acceptance and utilization in the construction sector. Construction industry professionals can maximize the potential of building information modeling (BIM) and make the most of its possibilities for better project delivery and enhanced industry practices if they acknowledge the significance of certain constructs and make it a practice to include them in their work.
Author Contributions
Conceptualization, A.W. and I.O.; methodology, A.W.; software, S.H.; validation, S.H.; formal analysis, D.R. and T.F.G.; investigation, M.B.K. and D.R.; writing—original draft preparation, D.R. and A.W.; writing—review and editing, A.W. and T.F.G.; visualization, O.B., M.B.K. and H.R.A.; validation, formal analysis, and writing—review and editing, M.H.-N.; supervision, I.O.; project administration, I.O. All authors have read and agreed to the published version of the manuscript.
Funding
This study was supported via funding from Prince Sattam bin Abdulaziz University (project number PSAU/2023/R/1444).
Acknowledgments
This study was supported via funding from Prince Sattam bin Abdulaziz University (project number PSAU/2023/R/1444).
Conflicts of Interest
The authors declare no conflict of interest.
Correction Statement
This article has been republished with a minor correction to the existing affiliation 5's information. This change does not affect the scientific content of the article.
Appendix A
| Survey Questionnaire |
Q1: What is your profession
|
| Please indicate your agreement with factors that according to you are significant in affecting the BIM adoption in empowering construction projects from end-to-end life cycle management. | ||||||
| Question # | Questions | Strongly Disagree (1) | Disagree (2) | Neutral (3) | Agree (4) | Strongly Agree (5) |
| 1 | Increased Cooperation | |||||
| 2 | Improved Visualization | |||||
| 3 | Conflict Detection | |||||
| 4 | Efficient Project Management | |||||
| 5 | Estimation and Analysis of Costs | |||||
| 6 | Facility Administration and Maintenance | |||||
| 7 | Sustainability and Energy Analysis | |||||
| 8 | Construction Sequencing and Phasing for Prefabricated and Off-Site Construction | |||||
| 9 | Optimization of Maintenance and Operations | |||||
| 10 | Integration and Interoperability of Data | |||||
| 11 | Compliance with Regulations and Documentation | |||||
| 12 | Monitoring the Performance of the Facility | |||||
| 13 | Value of Long-Term Assets | |||||
| 14 | Continuous Enhancement and Learned Lessons | |||||
| 15 | Resource Planning and Management | |||||
| 16 | Participant Involvement Facility Expansion and Renovation | |||||
| 17 | Clash Resolution and Construction Readiness Evaluation | |||||
| 18 | Training and Simulation | |||||
| 19 | Asset Monitoring and Inventory Control | |||||
| 20 | Compliance Reporting and Management | |||||
| 21 | Remote Collaboration and Electronic Conferences | |||||
| 22 | Continuous Maintenance and Monitoring | |||||
| 23 | Management of Knowledge and Lessons Learned | |||||
| 24 | Risk Management | |||||
References
- Codinhoto, R.; Kiviniemi, A. BIM for FM: A Case Support for Business Life Cycle. In Proceedings of the IFIP International Conference on Product Lifecycle Management, Yokohama, Japan, 7–9 July 2014. [Google Scholar] [CrossRef]
- Jaaron, A.A.M.; Hijazi, I.H.; Musleh, K.I.Y. A Conceptual Model for Adoption of BIM in Construction Projects: ADKAR as an Integrative Model of Change Management. Technol. Anal. Strateg. Manag. 2022, 34, 655–667. [Google Scholar] [CrossRef]
- Muller, M.F.; Esmanioto, F.; Huber, N.; Loures, E.R.; Canciglieri, O. A Systematic Literature Review of Interoperability in the Green Building Information Modeling Lifecycle. J. Clean. Prod. 2019, 223, 397–412. [Google Scholar] [CrossRef]
- GhaffarianHoseini, A.; Zhang, T.; Nwadigo, O.; GhaffarianHoseini, A.; Naismith, N.; Tookey, J.; Raahemifar, K. Application of ND BIM Integrated Knowledge-Based Building Management System (BIM-IKBMS) for Inspecting Post-Construction Energy Efficiency. Renew. Sustain. Energy Rev. 2017, 72, 935–949. [Google Scholar] [CrossRef]
- Georgiadou, M.C. An Overview of Benefits and Challenges of Building Information Modelling (BIM) Adoption in UK Residential Projects. Constr. Innov. 2019, 19, 298–320. [Google Scholar] [CrossRef]
- Waqar, A.; Othman, I.; Shafiq, N.; Mansoor, M.S. Applications of AI in Oil and Gas Projects towards Sustainable Development: A Systematic Literature Review. Artif. Intell. Rev. 2023. [Google Scholar] [CrossRef]
- Waqar, A.; Khan, M.B.; Shafiq, N.; Skrzypkowski, K.; Zagórski, K.; Zagórska, A. Assessment of Challenges to the Adoption of IOT for the Safety Management of Small Construction Projects in Malaysia: Structural Equation Modeling Approach. Appl. Sci. 2023, 13, 3340. [Google Scholar] [CrossRef]
- Waqar, A.; Qureshi, A.H.; Alaloul, W.S. Barriers to Building Information Modeling (BIM) Deployment in Small Construction Projects: Malaysian Construction Industry. Sustainability 2023, 15, 2477. [Google Scholar] [CrossRef]
- Ahmed, S. Barriers to Implementation of Building Information Modeling (BIM) to the Construction Industry: A Review. J. Civ. Eng. Constr. 2018, 7, 107. [Google Scholar] [CrossRef]
- Jia, S.; Liu, C.; Guan, X.; Wu, H.; Zeng, D.; Guo, J. Bidirectional Interaction between BIM and Construction Processes Using a Multisource Geospatial Data Enabled Point Cloud Model. Autom. Constr. 2022, 134, 104096. [Google Scholar] [CrossRef]
- Abrishami, S.; Martín-Durán, R. Bim and Dfma: A Paradigm of New Opportunities. Sustainability 2021, 13, 9591. [Google Scholar] [CrossRef]
- Shahruddin, S.; Zairul, M. BIM Requirements across a Construction Project Lifecycle: A PRISMA-Compliant Systematic Review and Meta-Analysis. Int. J. Innov. Creat. Chang. 2020, 12, 569–590. [Google Scholar]
- Lin, K.; Long, Y.; Chen, B.; Chen, S.; Luo, Z. The BIM Lifecycle Management of Manufacturing Cultural Heritage Projects. J. Phys. Conf. Ser. 2022, 2261, 012017. [Google Scholar] [CrossRef]
- Qing, L.; Tao, G.; Ping, W.J. Study on Building Lifecycle Information Management Platform Based on BIM. Res. J. Appl. Sci. Eng. Technol. 2014, 1, 1–8. [Google Scholar] [CrossRef]
- Alhamami, A.; Petri, I.; Rezgui, Y.; Kubicki, S. Promoting Energy Efficiency in the Built Environment through Adapted BIM Training and Education. Energies 2020, 13, 2308. [Google Scholar] [CrossRef]
- Vitiello, U.; Ciotta, V.; Salzano, A.; Asprone, D.; Manfredi, G.; Cosenza, E. BIM-Based Approach for the Cost-Optimization of Seismic Retrofit Strategies on Existing Buildings. Autom. Constr. 2019, 98, 90–101. [Google Scholar] [CrossRef]
- Akbarieh, A.; Jayasinghe, L.B.; Waldmann, D.; Teferle, F.N. BIM-Based End-of-Lifecycle Decision Making and Digital Deconstruction: Literature Review. Sustainability 2020, 12, 2670. [Google Scholar] [CrossRef]
- Suliyanti, W.N.; Sari, R.F. Blockchain-Based Implementation of Building Information Modeling Information Using Hyperledger Composer. Sustainability 2021, 13, 321. [Google Scholar] [CrossRef]
- Liu, Z.; Li, P.; Wang, F.; Osmani, M.; Demian, P. Building Information Modeling (BIM) Driven Carbon Emission Reduction Research: A 14-Year Bibliometric Analysis. Int. J. Environ. Res. Public Health 2022, 19, 12820. [Google Scholar] [CrossRef]
- Olawumi, T.O.; Chan, D.W.M. Building Information Modelling and Project Information Management Framework for Construction Projects. J. Civ. Eng. Manag. 2018, 25, 53–75. [Google Scholar] [CrossRef]
- Ma, X.; Xiong, F.; Olawumi, T.O.; Dong, N.; Chan, A.P.C. Conceptual Framework and Roadmap Approach for Integrating BIM into Lifecycle Project Management. J. Manag. Eng. 2018, 34, 05018011. [Google Scholar] [CrossRef]
- Hull, J.; Ewart, I.J. Conservation Data Parameters for BIM-Enabled Heritage Asset Management. Autom. Constr. 2020, 119, 103333. [Google Scholar] [CrossRef]
- Kamal Hasni, M.I.A.; Ismail, Z.; Hashim, N. Contractual Aspects in the Utilisation of Level Two Building Information Modelling (BIM) within Malaysian Public Construction Projects. MATEC Web Conf. 2019, 266, 05002. [Google Scholar] [CrossRef]
- Akinade, O.O.; Oyedele, L.O.; Ajayi, S.O.; Bilal, M.; Alaka, H.A.; Owolabi, H.A.; Arawomo, O.O. Designing out Construction Waste Using BIM Technology: Stakeholders’ Expectations for Industry Deployment. J. Clean. Prod. 2018, 180, 375–385. [Google Scholar] [CrossRef]
- Li, L.; Yuan, J.; Tang, M.; Xu, Z.; Xu, W.; Cheng, Y. Developing a BIM-Enabled Building Lifecycle Management System for Owners: Architecture and Case Scenario. Autom. Constr. 2021, 129, 103814. [Google Scholar] [CrossRef]
- Zanni, M.; Sharpe, T.; Lammers, P.; Arnold, L.; Pickard, J. Developing a Methodology for Integration of Whole Life Costs into BIM Processes to Assist Design Decision Making. Buildings 2019, 9, 114. [Google Scholar] [CrossRef]
- Tedonchio, C.T.; Nadeau, S.; Boton, C.; Rivest, L. Digital Mock-Ups as Support Tools for Preventing Risks Related to Energy Sources in the Operation Stage of Industrial Facilities through Design. Results Eng. 2022, 16, 100690. [Google Scholar] [CrossRef]
- Bilge, E.C.; Yaman, H. Information Management Roles in Real Estate Development Lifecycle: Literature Review on BIM and IPD Framework. Constr. Innov. 2021, 21, 723–742. [Google Scholar] [CrossRef]
- Akram, R.; Thaheem, M.J.; Khan, S.; Nasir, A.R.; Maqsoom, A. Exploring the Role of BIM in Construction Safety in Developing Countries: Toward Automated Hazard Analysis. Sustainability 2022, 14, 12905. [Google Scholar] [CrossRef]
- Waqar, A.; Almujibah, H. Factors Influencing Adoption of Digital Twin Advanced Technologies for Smart City Development: Evidence from Malaysia. Buildings 2023, 13, 775. [Google Scholar] [CrossRef]
- Qiu, Q.; Zhou, X.; Zhao, J.; Yang, Y.; Tian, S.; Wang, J.; Liu, J.; Liu, H. From Sketch BIM to Design BIM: An Element Identification Approach Using Industry Foundation Classes and Object Recognition. Build. Environ. 2021, 188, 107423. [Google Scholar] [CrossRef]
- Cao, Y.; Kamaruzzaman, S.N.; Aziz, N.M. Green Building Construction: A Systematic Review of BIM Utilization. Buildings 2022, 12, 1205. [Google Scholar] [CrossRef]
- Waqar, A.; Othman, I. Impact of 3D Printing on the Overall Project Success of Residential Construction Projects Using Structural Equation Modelling. Int. J. Environ. Res. Public Health 2023, 20, 3800. [Google Scholar] [CrossRef] [PubMed]
- Wang, H.; Meng, X.; Zhu, X. Improving Knowledge Capture and Retrieval in the BIM Environment: Combining Case-Based Reasoning and Natural Language Processing. Autom. Constr. 2022, 139, 104317. [Google Scholar] [CrossRef]
- Sajjad, M.; Hu, A.; Waqar, A.; Falqi, I.I.; Alsulamy, S.H.; Bageis, A.S.; Alshehri, A.M. Evaluation of the Success of Industry 4.0 Digitalization Practices for Sustainable Construction Management: Chinese Construction Industry. Buildings 2023, 13, 1668. [Google Scholar] [CrossRef]
- Jang, K.; Kim, J.W.; Ju, K.B.; An, Y.K. Infrastructure BIM Platform for Lifecycle Management. Appl. Sci. 2021, 11, 10310. [Google Scholar] [CrossRef]
- Hatmoko, J.U.D.; Fundra, Y.; Wibowo, M.A. Zhabrinna Investigating Building Information Modelling (BIM) Adoption in Indonesia Construction Industry. MATEC Web Conf. 2019, 258, 02006. [Google Scholar] [CrossRef]
- Bansal, V.K. Integrated Framework of BIM and GIS Applications to Support Building Lifecycle: A Move toward ND Modeling. J. Archit. Eng. 2021, 27, 05021009. [Google Scholar] [CrossRef]
- Chan, J.R.; Sadeghifam, A.N.; Joo, M.S. The Barrier Factors to the Implementation of Building Information Modelling for Construction Industry in Sarawak. Civ. Sustain. Urban Eng. 2022, 2, 44–55. [Google Scholar] [CrossRef]
- Charef, R. Supporting Construction Stakeholders with the Circular Economy: A Trans-Scaler Framework to Understand the Holistic Approach. Clean. Eng. Technol. 2022, 8, 100454. [Google Scholar] [CrossRef]
- Shaqour, E.N. The Role of Implementing BIM Applications in Enhancing Project Management Knowledge Areas in Egypt. Ain Shams Eng. J. 2022, 13, 101509. [Google Scholar] [CrossRef]
- Charef, R. The Use of Building Information Modelling in the Circular Economy Context: Several Models and a New Dimension of BIM (8D). Clean. Eng. Technol. 2022, 7, 100414. [Google Scholar] [CrossRef]
- Kaewunruen, S.; Sresakoolchai, J.; Zhou, Z. Sustainability-Based Lifecycle Management for Bridge Infrastructure Using 6D BIM. Sustainability 2020, 12, 2436. [Google Scholar] [CrossRef]
- Zhang, J.; Luo, H.; Xu, J. Towards Fully BIM-Enabled Building Automation and Robotics: A Perspective of Lifecycle Information Flow. Comput. Ind. 2022, 135, 103570. [Google Scholar] [CrossRef]
- Liu, F.; Chen, C.; Wu, W. Towards the Building Information Modeling-Based Capital Project Lifecycle Management in the Luxury Yacht Industry. Polish Marit. Res. 2017, 24, 41–48. [Google Scholar] [CrossRef]
- Kim, J.I.; Li, S.; Chen, X.; Keung, C.; Suh, M.; Kim, T.W. Evaluation Framework for BIM-Based VR Applications in Design Phase. J. Comput. Des. Eng. 2021, 8, 910–922. [Google Scholar] [CrossRef]
- Ferdosi, H.; Abbasianjahromi, H.; Banihashemi, S.; Ravanshadnia, M. BIM Applications in Sustainable Construction: Scientometric and State-of-the-Art Review. Int. J. Constr. Manag. 2023, 23, 1969–1981. [Google Scholar] [CrossRef]
- Utiome, E.; Drogemuller, R.; Docherty, M. BIM-Based Lifecycle Planning and Specifications for Sustainable Cities of the Future: A Conceptual Approach. In Proceedings of the W107 Conference: Construction in Developing Countries and Its Contribution to Sustainable Development 2014, Lagos, Nigeria, 28–30 January 2014. [Google Scholar]
- Olanrewaju, O.I.; Kineber, A.F.; Chileshe, N.; Edwards, D.J. Modelling the Impact of Building Information Modelling (Bim) Implementation Drivers and Awareness on Project Lifecycle. Sustainability 2021, 13, 8887. [Google Scholar] [CrossRef]
- Charef, R.; Ganjian, E.; Emmitt, S. Socio-Economic and Environmental Barriers for a Holistic Asset Lifecycle Approach to Achieve Circular Economy: A Pattern-Matching Method. Technol. Forecast. Soc. Chang. 2021, 170, 120798. [Google Scholar] [CrossRef]
- Li, J.; Wang, Y.; Wang, X.; Luo, H.; Kang, S.-C.; Wang, J.; Guo, J.; Jiao, Y. Benefits of Building Information Modelling in the Project Lifecycle: Construction Projects in Asia. Int. J. Adv. Robot. Syst. 2014, 11, 124. [Google Scholar] [CrossRef]
- Olanrewaju, O.I.; Kineber, A.F.; Chileshe, N.; Edwards, D.J. Modelling the Relationship between Building Information Modelling (BIM) Implementation Barriers, Usage and Awareness on Building Project Lifecycle. Build. Environ. 2022, 207, 108556. [Google Scholar] [CrossRef]
- Waqar, A.; Othman, I.; Falqi, I.I.; Almujibah, H.R.; Alshehri, A.M.; Alsulamy, S.H.; Benjeddou, O. Assessment of Barriers to Robotics Process Automation (RPA) Implementation in Safety Management of Tall Buildings. Buildings 2023, 13, 1663. [Google Scholar] [CrossRef]
- Rezgui, Y.; Beach, T.; Rana, O. A Governance Approach for BIM Management across Lifecycle and Supply Chains Using Mixed-Modes of Information Delivery. J. Civ. Eng. Manag. 2013, 19, 239–258. [Google Scholar] [CrossRef]
- Nour, M.; Hosny, O.; Elhakeem, A. A BIM Based Energy and Lifecycle Cost Analysis/Optimization Approach. Int. J. Eng. Res. Appl. 2012, 2, 411–418. [Google Scholar]
- Motalebi, M.; Rashidi, A.; Nasiri, M.M. Optimization and BIM-Based Lifecycle Assessment Integration for Energy Efficiency Retrofit of Buildings. J. Build. Eng. 2022, 49, 104022. [Google Scholar] [CrossRef]
- Becker, R.; Falk, V.; Hoenen, S.; Loges, S.; Stumm, S.; Blankenbach, J.; Brell-Cokcan, S.; Hildebrandt, L.; Vallée, D. Bim—Towards the Entire Lifecycle. Int. J. Sustain. Dev. Plan. 2018, 13, 84–95. [Google Scholar] [CrossRef]
- Ren, G.; Li, H.; Zhang, J. A BIM-Based Value for Money Assessment in Public-Private Partnership: An Overall Review. Appl. Sci. 2020, 10, 6483. [Google Scholar] [CrossRef]


Disclaimer/Publisher’s Note: The statements, opinions and data contained in all publications are solely those of the individual author(s) and contributor(s) and not of MDPI and/or the editor(s). MDPI and/or the editor(s) disclaim responsibility for any injury to people or property resulting from any ideas, methods, instructions or products referred to in the content. |
© 2023 by the authors. Licensee MDPI, Basel, Switzerland. This article is an open access article distributed under the terms and conditions of the Creative Commons Attribution (CC BY) license (https://creativecommons.org/licenses/by/4.0/).