1. Introduction
As a substitute for traditional asphalt pavement, steel–UHPC composite pavement can solve the problems of the repeated maintenance of steel bridge deck pavement and fatigue cracking of steel structure. At present, this technology has been extensively used for the construction and upgrading of long-span bridge deck systems, such as China’s Hedong Bridge, Shengli Yellow River Bridge, Phoenix Yellow River Bridge, and Sunshine Skyway Bridge in the United States. According to the existing specifications in China [
1], the service life of the steel bridge deck pavement should not be less than 15a, while the longest service life of steel–UHPC composite bridge deck pavement in China has not yet exceeded 12a in actual practice. The practical application of steel–UHPC composite bridge deck pavement indicates a constant lack of long-term service data in the engineering sector to evaluate its impact on the mechanical property of orthotropic steel bridge decks. The stress level of the orthotropic steel plate and the UHPC layer is negatively correlated with the interlayer combination effect of the anchor bolts, while the performance of the anchor bolts with the wheel reciprocating and the temperature change tends to affect the long-term performance of the entire steel–UHPC composite bridge deck system [
2].
Bolted connections in steel–UHPC composite bridge decks have been studied by researchers from several countries, and different analytical and experimental models have been developed to improve the long-term performance of these elements.
Fonseca et al. [
3] studied the safety performance of dowel connections in wood using numerical simulations, and the results showed that the simulations were highly relevant. The new model can be used to verify other types of connections, providing a good example for the construction of finite element models in this study. In Fonseca and Silva’s study [
4] on the design of steel–wood-bolted connections for shear resistance, a refined finite element model was established to analyze the effects of different parameters, such as bolt diameter, on the connection. This provides a side-validation of the efficiency of numerical simulations in analyzing the performance of bolted junctions. Tao and Wang [
5] developed a two-dimensional interpolation enhancement method, which avoids the need for large amounts of computing resources to achieve high accuracy in traditional finite element calculations. Hu et al. [
6] provided detailed settings for material constitutive models and convergence criteria when performing static nonlinear analysis using finite element method. These provide a good idea for saving machine time and improving the simulation of shear mechanical behavior in steel–UHPC-bolted connections.
Dogan and Roberts [
7] conducted a series of fatigue tests on six sets of shear test pieces to evaluate the fatigue property of the anchor bolts and found that the service life of the steel–concrete–steel interlayer system under cyclic loading can be predicted in advance by evaluating the stiffness degradation of shear connections. Wei et al. [
8] investigated the static and fatigue property of anchor bolts in a steel–UHPC system via an experimental study and proposed a reasonable calculation formula after comparing and analyzing the shear capacity and the load–slip curve of the reference anchor bolts. In addition, they established a nominal S-N curve and a predictor formula for the evolution of plastic slip and elastic stiffness, providing a basis for the selection of loading and acquisition equipment for the bolt shear resistance field tests in this study. Shi et al. [
9] revealed the fatigue failure mode of anchor bolts in steel–UHPC composite bridge decks through full-scale segmental beam fatigue tests and established a shear S-N curve of anchor bolts. They found that the fatigue life of the anchor bolts measured by the push test was much more conservative compared to the full-scale beam fatigue test. Li Cong et al. [
10] established a simplified calculation formula of the shear stiffness of anchor bolts based on test results and literature data, and proposed a determination method of the elastic shear stiffness.
The above studies suggest that the long-term performance of bolted connections can be investigated using either finite element methods or model testing. Experimental studies, such as pull-out tests or indoor full-scale beam fatigue tests, have been used primarily to examine the fatigue properties of bolts in steel–UHPC composite bridge decks. Actually, the more complex stress on the anchor bolts in the composite bridge under actual bridge operation conditions makes it necessary to conduct field tests on the steel–UHPC composite bridge deck to better reflect its actual stress state after undergoing driving loads, wind loads, temperature, and other actions. This is important to provide support for the design of and maintenance decisions for steel–UHPC composite bridge deck pavement. Future research directions and gaps are also discussed in the paper.
2. Project Background
In 1984, a one-way double-lane national highway bridge was completed, consisting of 14 × 64 m simply supported steel box girders. The bridge has a total length of 919.6 m and a width of 9 m, with a 1.5 m wide walkway on each side. The bridge deck system adopted an orthotropic steel bridge deck with a thickness of 12 mm, longitudinal rib made of 125 × 80 × 8 mm angle steel, transverse pitch of 325 mm, transverse rib thickness of 8 mm, lower flange thickness of 10 mm, and longitudinal pitch of 2 m. The steel box girder diaphragm system was divided into two forms, the solid web type and the truss type, with a longitudinal pitch of 4 m. A sway brace was fitted between the two boxes, and the longitudinal pitch was made to correspond with that of the diaphragm plate. The web of the box girder is 2.9 m high and 10 mm thick, and is furnished with three longitudinal stiffeners of the same size as the longitudinal ribs of the deck. Three longitudinal stiffeners made of 160 × 100 × 10 mm angle steel are laid at the bottom plate of the box girder, which is 10 mm thick. The cross section is shown in
Figure 1, where the design load level for the vehicle is −20 and the check load for the trailer is −100.
After the bridge was put into operation, numerous cracks, ruts, and other problems appeared in the deck system, which were not fully resolved even after multiple major repairs. As a result, the original asphalt pavement was replaced with a steel–UHPC composite bridge pavement in late 2012. To facilitate the direct observation of the condition of the UHPC layer during the later stages of operation, an exposed section with a UHPC layer thickness of 80 mm was arranged within 10 m of the end of the small-magnitude side beam. The remaining 54 m is a normal UHPC section with a 50 mm UHPC layer and a 30 mm asphalt wear layer. In addition, a 2 mm bonding layer was placed between the UHPC and the steel bridge deck. The composite pavement structure is shown in
Figure 2, where the height h of the welded anchor bolts is 35 mm.
The bridge management organization commissioned relevant units to conduct five tracking tests on the composite pavement effect of the bridge. The final test results indicated that, since the first year of operation after paving, the ability of the steel–UHPC composite pavement to improve the stiffness of bridge deck systems has been decreasing year by year, with an average annual decrease rate of about 11%, which, currently, has decreased to 62.8% of the initial state.
3. Anchor Bolt Slip Constitutive
According to the specifications in China, anchor bolts are designed with elasticity, and the calculation methods for the shear stiffness of anchor bolts can be divided into two types of load–slip curve values and normative and theoretical analyses [
11,
12,
13,
14,
15,
16,
17]. Among them, there are two methods to determine the load–slip curve, that is, the specified amount of slip and the ultimate load multiplicity corresponding to the secondary stiffness. Chang et al. [
17] proposed a trilinear load–slip constitutive curve, a high degree of alignment with the field test curve for anchor bolts, and provided a detailed determination method of the key points of the curve. In this case, the true constitutive relations for the anchor bolts were obtained by shear field testing.
3.1. Test Scheme
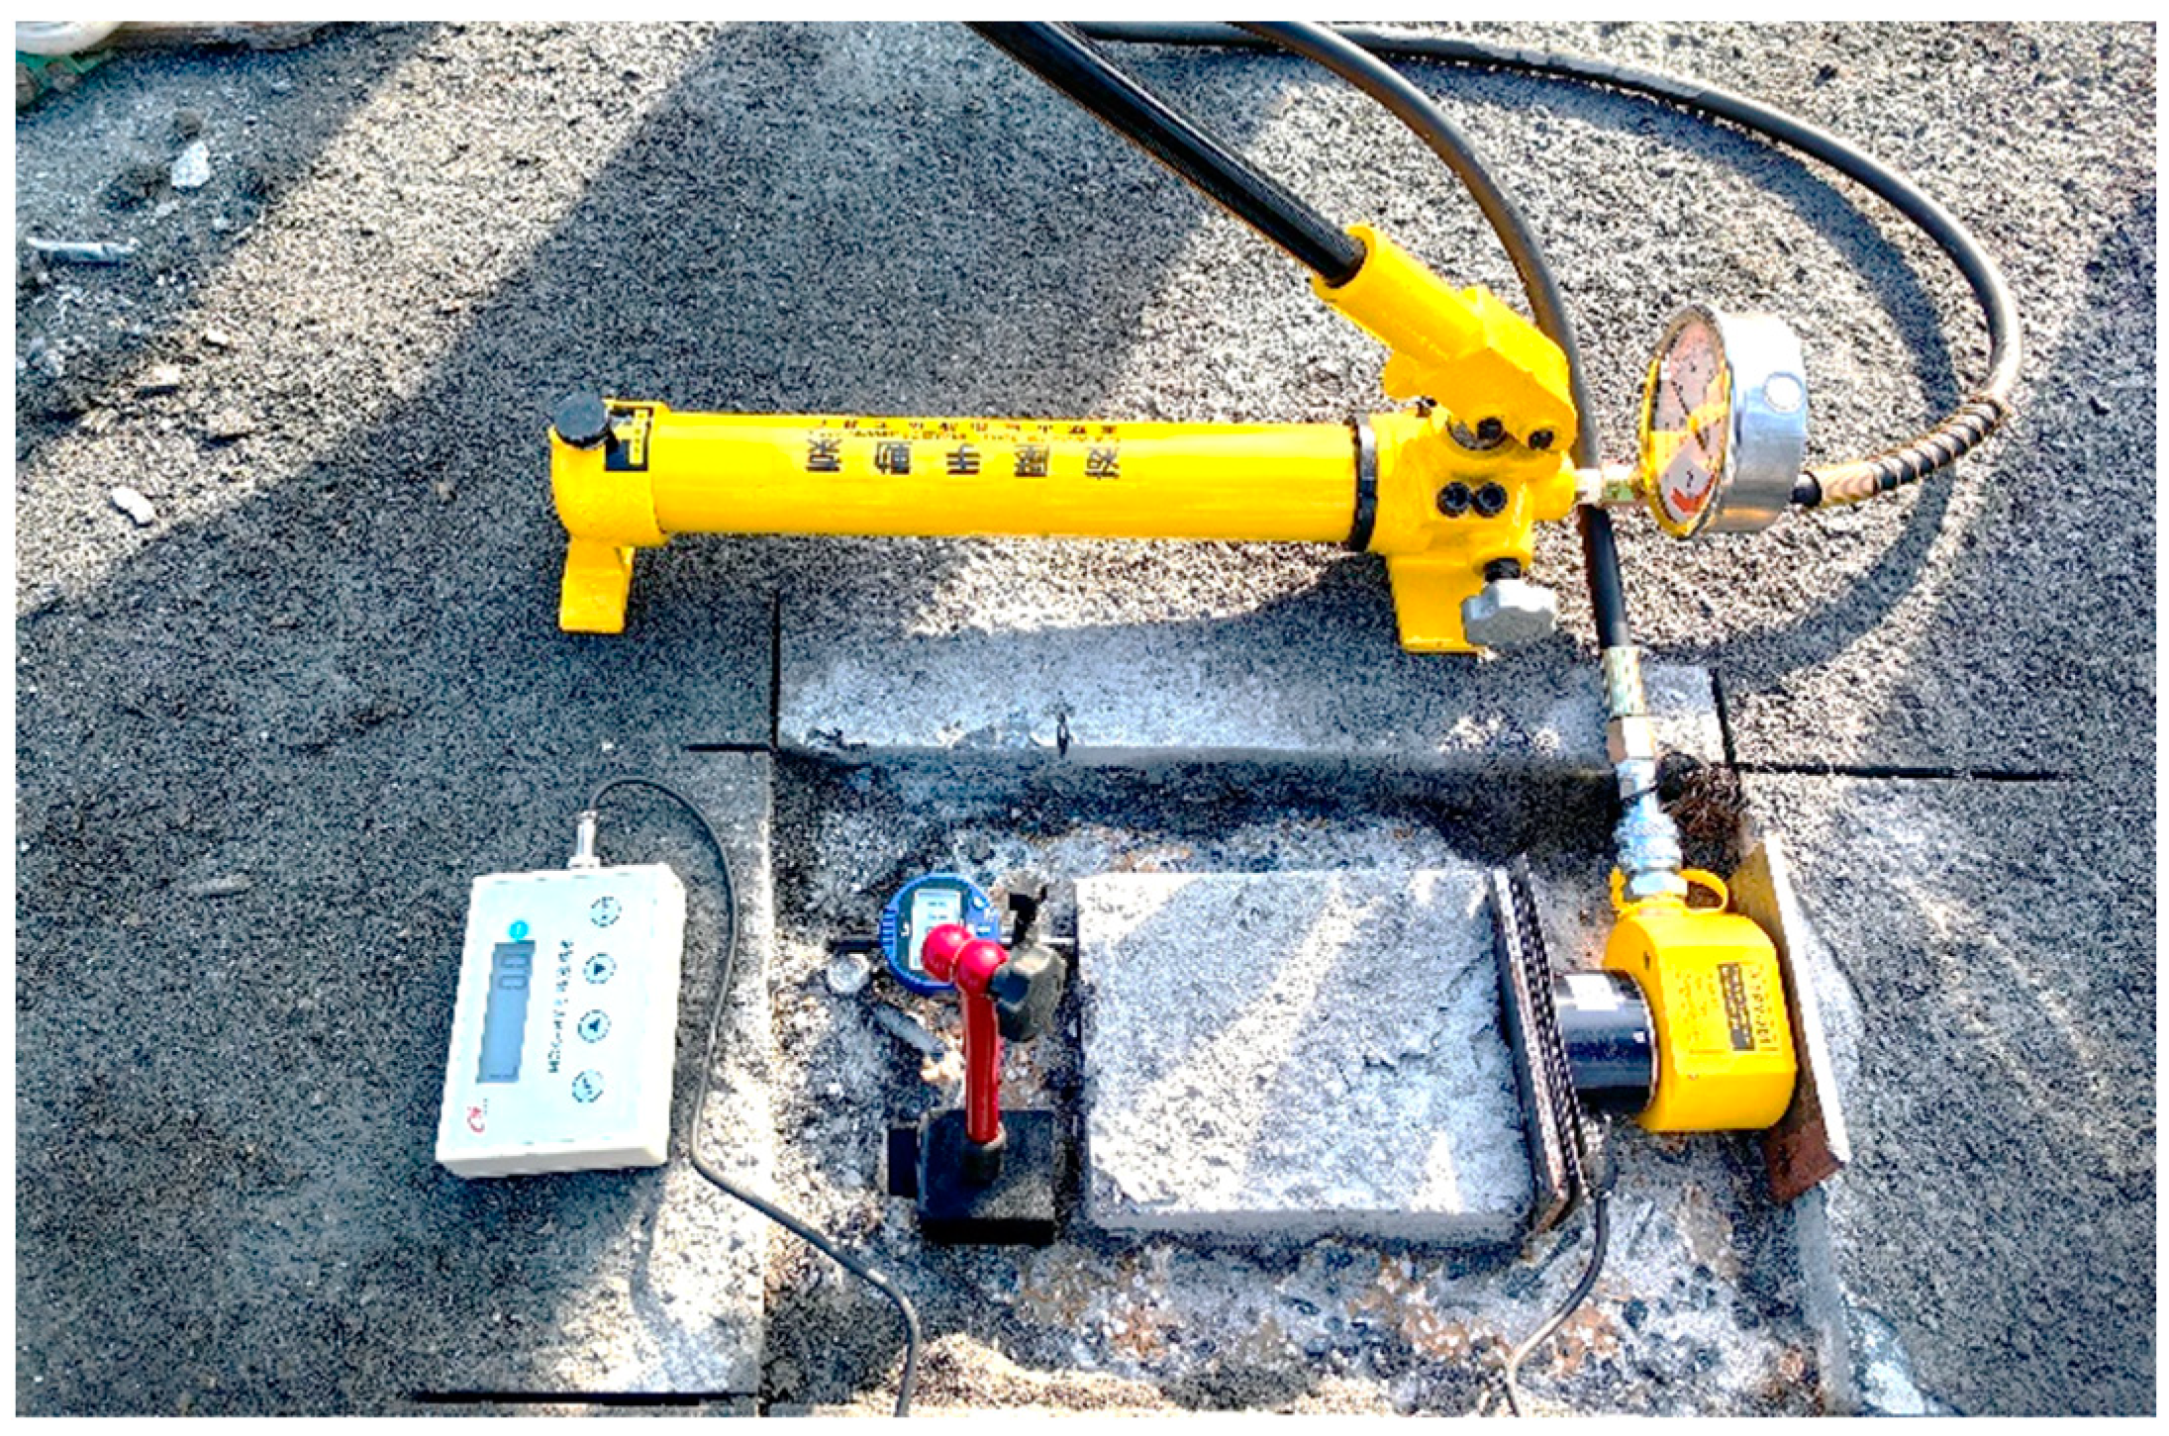
The settings of shear property test conditions for anchor bolts used in the steel–UHPC composite pavement are listed in
Table 1, and
Figure 3 shows a schematic diagram of the shear test device. To prevent local compression of UHPC at the end, two 8 mm thick steel plates were filled at the two ends of the jack. According to the relevant results of the shear property test of short bolts in UHPC [
18,
19,
20,
21,
22,
23,
24,
25], the shear capacity range of a single anchor bolt in the background bridge was 61.0–95.4 kN, and the ultimate slip range was 2–5 mm. Taking into account double redundancy, the FPY-20 flat-jack model was ultimately selected, featuring a maximum load capacity of 20 tons and a maximum stroke of 13 mm. After undergoing calibration testing, it was determined that the accuracy level meets the level 0.3 requirement specified in the
Verification Regulation of Hydraulic Jack (JJG 621-2012). To measure displacement, a 1086 WR electronic dial meter was chosen, which has a resolution of up to 0.0005 mm and a calibration error of no more than 0.004 mm. To measure the jacking force, a customized DLLG-4D pressure sensor was utilized, which has a range of 20 tons and provides a high resolution of up to 0.05% F·S.
First, the surface asphalt of the UHPC was milled using a fully automatic milling machine. For areas that were difficult to mechanically construct, such as edges and corners, manual or small air picks were used for removal. Next, the position of test blocks under various working conditions was set out with a tape measure and other tools, and the boundary of the cutting area was delineated accurately with a level according to the size shown in
Figure 3. Then, test blocks (size: 150 mm × 150 mm) surrounding the UHPC layer were broken with an air pick and grinding machine through cutting. To avoid damaging the bridge deck plates at a distance of 1 cm from the plates, a hand-held grinding wheel was used to slowly cut the plates, as shown in
Figure 4. The plates were adjusted vertically before loading, and an ultra-thin wedge-shaped plate could be inserted for adjustment in the case of significant deviation during cutting. Abrasive paper was used for smoothing when there were small deviations. Finally, after checking the verticality of the plate with a ruler to meet the requirements, the flat jack and pressure ring were installed in sequence. In the case of a gap larger than 1 mm, the custom ultra-flat iron sheet was refilled. A typical working condition test site is shown in
Figure 5. It is worth noting that the preservation of UHPC, i.e., the test block, may be damaged during the pavement breaking process, which will significantly impact the test results.
3.2. Test Results
Table 2 presents the main test results and failure phenomena, and
Figure 6 shows the load–slip curve of a single anchor bolt. All load–slip curve patterns are basically consistent, divided into three stages of elastic stage, plastic damage stage, and failure stage [
8]. Upon cutting the UHPC specimen along the loading direction centerline of the short anchor bolt, it was observed that the UHPC packing around the bolt was dense and free of any pores. The bolt rod undergoes only minor deformation at the root, while the other pins embedded in the UHPC plate remain upright. The test results show that the shear stiffness and ultimate bearing capacity of MI series anchor bolts are generally lower than those of the SI series, even lower than the theoretical design value of 67 kN. The relative error of evaluation is 15.3%, which is contrary to the horizontal shear stress and vertical uplifting force direction of anchor bolts in steel–concrete composite simply supported beams. Consequently, it can be concluded that, according to the shear test law of the anchor bolt, the fatigue stress amplitude of the anchor bolts in the mid-span area is large, while that at the beam end is small, which is clearly opposite to the test results.
4. Finite Element Model
4.1. Modeling
In this paper, a simplified finite element model of the bridge deck was developed using the ANSYS software, in which the UHPC was simulated using the solid element solid185 with an elastic modulus of 49.2 GPa and a Poisson ratio of 0.2. The element was defined by eight nodes, each with three degrees of freedom, and its formulation was full. The diaphragm plate, web, and bridge deck were simulated using shell element shell181, which is a 4-node finite strain shell element. Each node had 3 degrees of freedom, and uniform reduction integration was used. The elastic modulus and Poisson ratio were set to 209 GPa and 0.3, respectively. The horizontal mechanical behavior of the shear studs at the junction of the UHPC layer and the bridge deck was simulated using nonlinear spring element combin39; and the vertical mechanical behavior of the shear studs was simulated using the combin14 element [
26].
Due to the symmetry of the structure, only half of the structure was modeled and the rest was simulated using symmetry constraints. The bottom 3 degrees of freedom of all transverse diaphragms were constrained, as well as the Y and Z degrees of freedom of the cross section away from the support.
Up to 40 data points could be input for the
F-
D curve provided by the combin39 element, and the load–slip curve obtained from the shear stud push test was well simulated through segmented straight lines. In order to reduce the size of the finite element model and improve the computational efficiency, the nodes were not divided at the actual positions of the shear studs during modeling. Instead, all points where UHPC contacts the bridge deck were taken as shear studs, and the equivalent shear stud stiffness
Kee was obtained through Equation (1), thereby avoiding the difficulty of grid plotting and reducing the model size. Finally, the model consisted of a total of 130,473 elements and 97,550 nodes, as shown in
Figure 7. The finite element model can be utilized to analyze the shear stress of anchor bolts under varying UHPC thicknesses and specified fatigue load amplitudes, thereby providing fundamental data for the subsequent analysis of the causes of anchor bolt stiffness degradation.
where
nt denotes the actual number of rows of shear studs arranged within the model range;
nl is the actual number of columns of shear studs arranged within the element segment;
net is the total number of coupling nodes between UHPC and the bridge deck in the finite element model; and
Ke is the measured stiffness of a single shear stud.
4.2. Model Validation
The authors of [
27] conducted tracking tests on the effect of background bridge composite pavement, but shear property tests on anchor bolts were not conducted, thus failing to directly obtain the shear stiffness of anchor bolts. For this purpose, and in the belief that the rigidity of the anchor bolts at this time was undamaged, the data of the bridge after the paving was completed were chosen as the benchmark. The stiffness of anchor bolts was measured using the method in [
22] and the non-destructive damage value was measured through tests.
Figure 8 and
Figure 9 show a comparison of vertical deflection on the same section with the same wheel load and with different transverse bridge loads. It can be observed from the figures that the maximum error between the finite element calculation results and the test results does not exceed 5%, and the test values are generally smaller than the simulation values, which is attributed to the failure of taking into account the natural bonding and interfacial friction between the steel and UHPC layer. In summary, it is believed that this model can accurately describe the mechanical properties of the composite pavement.
5. Causes of the Performance Degradation of the Anchor Bolts
According to the results of a sensitivity analysis of the factors affecting the fatigue life of anchor bolts, the initial defect and the amplitude of the stress have the largest impact on their lifetime. For the same bridge, the distribution probability of the initial welding defect of the anchor bolt is consistent along the longitudinal bridge direction, so the stiffness of the anchor bolt in the longitudinal bridge direction is considered to be inversely related to its shear stress amplitude during service. The authors of [
22] proposed a calculation model for the shear force of anchor bolts in the composite bridge deck pavement based on the assumption that the shear force between the UHPC layer and steel plate layer was only transmitted by the anchor bolts. Based on this model, the fatigue stress amplitude of anchor bolts under local automotive loads was derived, as shown in Equation (2). According to the formula, under the action of a moving load, the peak value of the longitudinal shear stress of the anchor bolts in the second system is related to the concentration of wheel load, the thickness and elastic modulus of UHPC, as well as the thickness and elastic modulus of steel plate. The only difference between the shear studs in the mid-span and at the beam end of the background bridge is the actual thickness of UHPC. Combined with Equation (2), the analytical solution of the extreme shear stress of the anchor bolts in the second system in the steel–UHPC composite pavement with different thickness can also be obtained, but the disadvantage is that the influence of the pavement layers with different thicknesses on the uplifting effect of the anchor bolt has not been considered. Therefore, the finite element method can be used to obtain an approximate solution that takes into account the uplifting effect of the anchor bolts.
where
q denotes the concentration of the load;
Hs is the thickness of the plate; and
hc is the thickness of the UHPC pavement layer. Other symbols can be found in [
22].
Considering that the bridge was renovated as a steel–UHPC composite pavement after more than 10 years of operation, and that there has been a permanent deflection in the mid-span area that exceeds the maximum pre-camber after years of overload vehicle action, the thickness of the UHPC layer in the mid-span area far exceeds that at the beam end after the renovation. In addition, the investigation of the thickness of the pavement layer in a shear field test of anchor bolts also reflects this phenomenon, as shown in
Figure 10.
Thus, the effect of the thickness of the UHPC on the longitudinal force on the anchor bolts in the second system was considered.
Figure 11 shows the peak value of the shear stress between the anchor bolt layers (the same load case) calculated by the finite element model when the thickness
hc interval of the UHPC pavement layer is 50–120 mm. It can be observed from the figure that the UHPC pavement thickness has a significant effect on the shear force on the anchor bolts. For the commonly used UHPC composite bridge deck pavement with a thickness of
hc = 50 mm, the relative change in shear force value exceeds 20% when the error in pavement thickness exceeds ±5%. However, the absolute value of shear stress between the composite pavement layers is inversely related to the UHPC thickness, that is, the overall ultimate shear capacity of the MI series anchor bolts should be higher than that of the SI series, if only the impact of the pavement thickness on the force of the second system is considered.
Tan Qingquan [
28], based on the coordinated relationship between the interface slip and load of the composite beams and the degradation of the shear stiffness of anchor bolts, established a discontinuous load-transferring model on steel–concrete interface under the first system of composite beams, and validated its accuracy through numerical models. It was shown that fatigue loading can lead to a redistribution of shear forces in the composite beam bolt cluster, and that the shear stress in the second system, which is borne by the anchor bolts near the mid-span region, gradually increases with the number of fatigue loads. Moreover, the larger fatigue load amplitude of the bridge deck is accompanied by a larger increase in the shear stress in the first regime.
Figure 12 shows the changes in the shear force of the anchor bolts under the second system at a distance of 8 m and 24 m from the mid-span with the number of loading times when the mid-span fatigue load is 0–30 t calculated by using the method in [
28]. When conducting the calculations, the variation in the UHPC thickness was taken into account, and the vertical distribution of the UHPC thickness was fitted approximately using a quadratic parabola with a deviation of +2 cm between the UHPC thickness at mid-span and the design. As shown in the figure, the shear force of the SI series anchor bolts in the second system gradually increases with the number of fatigue loads. At a fatigue load of 600,000, the shear stress reached 24.67 kN, nearly equal to 24.81 kN near the beam end, an increase of 12.7%. Without taking into account the effect of longitudinal changes in the thickness of the UHPC plate, the shear value of the MI series anchor bolts in the same row becomes lower, i.e., 0.84 kN. Correspondingly, as the service life lengthens, the anchor bolts at the beam end experience more unloading due to their reduced shear stiffness, resulting in the anchor bolts in the mid-span area bearing more longitudinal shear force. In addition, the positive deviation of the composite pavement thickness due to permanent settling and other factors prior to the renovation of the bridge pavement in the mid-span area also causes the anchor bolts in the mid-span area to share more shear force. Moreover, there is no weighing system in the vicinity of the background bridge, making it difficult to fully understand the fatigue load spectrum of the bridge during operation. However, based on the results of the field extrapolation tests on anchor bolts, it can be confirmed that the stress of anchor bolts undergoes a significant longitudinal redistribution.
6. Conclusions
This study utilized the first steel bridge with steel–UHPC composite bridge deck pavement in China to obtain the actual stiffness of anchor bolts after prolonged service through field push tests. Based on the experimental findings, a finite element model of the shear force of the steel–UHPC composite pavement was established, and the impact of typical fatigue load amplitudes and different UHPC thicknesses on the shear stress of anchor bolts was determined. The causes of anchor bolt performance degradation were analyzed by combining the composite beam anchorage force transmission model with the fatigue formula for anchor bolt stiffness degradation. The results and experience of this series of tests provide robust support for the design and maintenance of similar structures using steel–UHPC composite paving during later stages of renovation, as well as a reference and inspiration for the promotion and development of related engineering technologies.
(1) After long-term service, the ultimate bearing capacity of the anchor bolts in the mid-span area is significantly lower than that at the beam end, and the shear capacity at the beam end reaches 1.32 times that in the mid-span area;
(2) Before paving the UHPC layer, the permanent downward deflection of the steel beam causes the composite pavement thickness in the mid-span area to be greater than the design value, which is an important reason for the significantly lower shear stiffness of the anchor bolts in this composite pavement than that in other positions in the later stage of service;
(3) The stiffness of the steel–UHPC composite bridge deck pavement in the second system can be accurately evaluated by combining the anchor bolt push test and finite element model, and a maximum error of no more than 5% can be achieved;
(4) After years of operation, there may be a significant stress redistribution in the anchor bolts used in the steel–UHPC composite pavement, which should be fully considered during design.
(5) For this work, the background bridge was retrofitted with a steel–UHPC pavement after a period of service, while the original pavement was not of the steel–UHPC type. The effects of the steel bridge deck parameters, such as service time and thickness, should be taken into account in subsequent studies of the long-term performance effects of composite paving.
Author Contributions
C.H.: Project administration Conceptualization, Methodology, Validation, Software. J.L.: Data curation, Writing—Original draft preparation. B.W.: Validation, Software. X.Z.: Resources and Editing, Investigation. L.G.: Data curation, Investigation, Supervision. All authors have read and agreed to the published version of the manuscript.
Funding
This work was supported by the Special Fund Program of the Basic Research Operating Expenses for Central Public Research Institutes (grant numbers 2021-9060a and 2022-9048); and the Key Technologies R&D Program of Guangdong Province (grant number 2019B111106002).
Data Availability Statement
Some or all data, models, or codes generated or used during the study are available from the corresponding author upon request.
Acknowledgments
Financial support from the R&D Program in the the Key Technologies R&D Program of Guangdong Province (grant number 2019B111106002) is gratefully acknowledged by the second author.
Conflicts of Interest
The authors declare that they have no competing interest.
References
- JTG D60-2015; General Specifications for Design of Highway Bridges and Culverts. China Communication Press: Beijing, China, 2015.
- Dieng, L.; Marchand, P.; Gomes, F.; Tessier, C.; Toutlemonde, F. Use of UHPFRC Overlay to Reduce Stresses in Orthotropic Steel Decks. J. Constr. Steel Res. 2013, 89, 30–41. [Google Scholar] [CrossRef]
- Fonseca, E.M.; Leite, P.; Silva, L.D.; Silva, V.S.; Lopes, H.M. Parametric study of three types of timber connections with metal fasteners using Eurocode 5. Appl. Sci. 2022, 12, 1701. [Google Scholar] [CrossRef]
- Zhao, Q.; Huang, G.; Xu, C.; Peng, Y. Push-out behavior of short headed stud connectors in steel-ultra high performance concrete composite deck. KSCE J. Civ. Eng. 2021, 25, 2640–2650. [Google Scholar] [CrossRef]
- Fonseca, E.M.M.; Silva, V. Design of steel-wood-steel connections at the ambient and elevated temperature. J. Comput. Appl. Mech. 2021, 52, 85–101. [Google Scholar]
- Hu, L.; Xu, Y.L.; Huang, W.F. Typhoon-induced non- stationary buffeting response of long-span bridges in complex terrain. Eng. Struct. 2013, 57, 406–415. [Google Scholar] [CrossRef]
- Dogan, O.; Roberts, T.M. Fatigue performance and stiffness variation of stud connectors in steel–concrete–steel sandwich systems. J. Constr. Steel Res. 2012, 70, 86–92. [Google Scholar] [CrossRef]
- Wei, C.; Zhang, Q.; Zhou, Y.; Cheng, Z.; Li, M.; Cui, C. Static and fatigue behaviors of short stud connectors embedded in ultra-high performance concrete. Eng. Struct. 2022, 273, e114888. [Google Scholar] [CrossRef]
- Shi, Z.; Su, Q.; Kavoura, F.; Veljkovic, M. Behavior of short-headed stud connectors in orthotropic steel-UHPC composite bridge deck under fatigue loading. Int. J. Fatigue 2022, 160, 106845. [Google Scholar] [CrossRef]
- Li, C.; Chen, B.; Hu, W.; Su, J. Calculation of Shear Bearing Capacity, Slip and Stiffness of Headed Studs in Steel-uhpc Composite Slab. Engineering Mechanics: 1–13 [21 April 2023]. Available online: http://kns.cnki.net/kcms/detail/11.2595.o3.20221024.1745.436.html (accessed on 10 August 2023).
- JTG D64-2015; Specifications for Design of Highway Steel Bridge. China Communication Press: Beijing, China, 2015.
- Nie, J. Steel−Concrete Composite Beam Structure: Experiment, Theory and Application; Science Press: Beijing, China, 2005. [Google Scholar]
- EN 1994-1-1: 2004; Eurocode 4: Design of Composite and Concrete Structures Part 1-1: General Rules and Rules for Buildings. European Committee for Standardization: Brussels, Belgium, 2004.
- Japanese Society of Steel Construction. Standard on Push out Test for Headed Stud (Draft); Japanese Society of Steel Construction: Tokyo, Japan, 1996. [Google Scholar]
- Johnson, R.P.; May, I.M. Partial-interaction design of composite beams. Struct. Eng. 1975, 53, 305–311. [Google Scholar]
- Oehlersd, J. The stiffness of stud shear connections in composite beams. J. Constr. Steel Res. 1986, 6, 273–284. [Google Scholar] [CrossRef]
- Shim, C.S.; Lee, P.G.; Yoon, T.Y. Static behavior of large stud shear connectors. Eng. Struct. 2004, 26, 1853–1860. [Google Scholar] [CrossRef]
- Wu, F.-W.; Feng, Y.-P.; Dai, J.; Wang, G.-Q.; Zhang, J.-F. Study on mechanical properties of stud shear connectors in steel-UHPC composite structures. Eng. Mech. 2022, 39, 222–234+243. [Google Scholar]
- Wang, J.; Qi, J.; Tong, T.; Xu, Q.; Xiu, H. Behavior of Large Stud Shear Connectors in Steel-UHPC Composite Structures. Eng. Struct. 2018, 178, 534–542. [Google Scholar] [CrossRef]
- Zhou, J. Anlysis and Experimental Study on Shear Behaviour of Stud Connectors in Steel-UHPC Composite Structure. Ph.D. Thesis, Chang’an University, Xi’an, China, 2023. [Google Scholar]
- Weng, X. Study on Static and Fatigue per Formance of the Short Studs in Steel-UHPC Lightweight Composite Bridge Deck. Ph.D. Thesis, Southwest Jiaotong University, Chengdu, China, 2017. [Google Scholar]
- Shao, X.; Zhou, H.; Cao, J. Shear behavior of studs of composite deck system composed of steel and ultra-thin RPC layer. Highw. Transp. Technol. 2013, 30, 34–39, 64. [Google Scholar]
- Huang, Y.-H.; Huang, C.; Huang, Z. Study on the effect of shear studs’ stiffness on the mechanical performance of composite beam cable stayed bridge. J. Guangzhou Univ. 2015, 14, 47–52. [Google Scholar]
- Zhang, C.; Zhang, S.; Guo, X. Calculation of interlaminar shear stress of lightweight composite bridge and preliminary study on layout design of stud connectors. J. Highw. Transp. Res. Dev. 2017, 34, 62–69. [Google Scholar]
- Xiong, H. Experiments and Theoretic Research on Uplift Effect of Steel-Concrete Composite Beams. Ph.D. Thesis, Xi’an University of Architecture and Technology, Xi’an, China, 2009. [Google Scholar]
- Deng, Q.; Ni, F.; Gu, X.; Chen, R. Rational simplified model offinite element analysis for deck pavement of long-spansteel bridge. J. Traffic Transp. Eng. 2008, 8, 53–58. [Google Scholar]
- Zhang, Y.; Gao, Y.; Wang, S. Effect of deck pavement retrofitting on mechanical properties of orthotropic steel deck. Bridge Constr. 2016, 46, 55–60. [Google Scholar]
- Tang, Q. Study on the Deterior ation Mech nism in Mechanical Properties of Composite Beams Caused by Fatigue Damage of Stud Connectors. Ph.D. Thesis, Southwest Jiaotong University, Chengdu, China, 2017. [Google Scholar]
| Disclaimer/Publisher’s Note: The statements, opinions and data contained in all publications are solely those of the individual author(s) and contributor(s) and not of MDPI and/or the editor(s). MDPI and/or the editor(s) disclaim responsibility for any injury to people or property resulting from any ideas, methods, instructions or products referred to in the content. |
© 2023 by the authors. Licensee MDPI, Basel, Switzerland. This article is an open access article distributed under the terms and conditions of the Creative Commons Attribution (CC BY) license (https://creativecommons.org/licenses/by/4.0/).


