Article

Exposure of Elderly People to Indoor Air Pollutants in Wanxia Nursing Home

1
School of Architecture, Southwest Jiaotong University, Chengdu 610017, China
2
Sichuan Waterfront Urban and Rural Development Co., Ltd., Chengdu 610000, China
*
Author to whom correspondence should be addressed.
Buildings 2023, 13(9), 2135; https://doi.org/10.3390/buildings13092135
Submission received: 13 July 2023 / Revised: 8 August 2023 / Accepted: 21 August 2023 / Published: 23 August 2023
(This article belongs to the Section Building Energy, Physics, Environment, and Systems)

Abstract

:
The elderly residing in nursing homes are typically more advanced in age, have more health issues, and spend more time indoors than other elderly people. This study explored the indoor air quality in the Wanxia nursing home, the largest private nursing home in Chengdu, China, based on long-term measurement data. Air pollutant sensors measured the level of air pollution in the Wanxia nursing home from March 2021 to February 2022. This study obtained several important results: (1) The indoor air quality index (IAQI) of the Wanxia nursing home was at a low pollution level in spring, summer, and autumn, and at a moderate pollution level in winter. PM concentration played the most important role in determining indoor air quality; (2) During winter, the 24 h mean indoor concentrations of PM2.5 and PM10 were close to or even exceeded the standard limits. During winter and summer nights, indoor CO2 levels were very close to or greater than 1000 ppm. During spring and summer nights, the indoor TVOC concentrations exceeded the limit (0.45 mg/m3); (3) Apart from HCHO concentrations in autumn, the levels of other indoor air pollutants were significantly influenced by their outdoor levels. In addition, the seasonal indoor/outdoor (I/O) ratios of CO2 and TVOCs exceeded 1; and (4) Indoor CO2 levels were closely related to indoor temperature (Ta) and relative humidity (RH) in each season. PM10 concentration correlated with Ta and RH in summer, while PM2.5 concentration did not correlate with Ta and RH in winter. The indoor TVOC level positively correlated with RH. Lastly, the indoor HCHO level was minimally influenced by changes in Ta and RH. Due to the above results, this study proposes targeted strategies for improving indoor air quality in nursing homes.

1. Introduction

In the last 20 years, rapid urbanization and economic development have caused significant environmental issues in China, particularly urban air pollution [1]. Epidemiological evidence indicates a relationship between air pollution and people’s health. Air pollutants typically include particulate matter (PM) of different sizes, total volatile organic compounds (TVOCs), and gaseous air pollutants, such as carbon monoxide (CO), carbon dioxide (CO2), nitrogen dioxide (NO2), etc. Long-term exposure to air pollution in urban areas is believed to contribute to the degradation of public health [2], causing more than 8.8 million deaths per year, and reducing life expectancy by 2.9 years [3]. Due to their weakened immune system and chronic diseases associated with old age, such as chronic cardiopulmonary disease, influenza, or asthma, elderly people are particularly vulnerable to the adverse effects of air pollutants, even at low concentrations [4,5].
PM usually refers to PM2.5 and PM10, which represent particulate matter with aerodynamic diameters of less than 2.5 μm and 10 μm, respectively [6]. The main sources of PM are traffic and various industrial processes [7]. Previous studies have shown that PM is associated with several medical conditions, including lung cancer, stroke, lower respiratory infections, chronic obstructive pulmonary disease, ischemic heart disease, acute infections, and sudden infant death syndrome [8,9]. Some studies have found a strong correlation between PM concentration and daily mortality rates among individuals over 75 in Spain [10] and the USA [11]. “Air Pollution and Health: A European Information System” (APHEIS) showed that the improvement in the burden of mortality in European cities brought about by reducing PM2.5 levels to 15 µg/m3 was over 30% greater than that brought about by reducing PM2.5 to 20 µg/m3 [12]. Moreover, it was found that reducing long-term exposure to PM10 concentrations by 5 mg/m3 would have ‘‘prevented’’ between 3300 and 7700 early deaths annually in 19 European cities [13]. The PM2.5 increase of 10 μg/m3 is associated with a 15~27% increased risk of lung cancer mortality [14]. Since 2010, high PM levels have been identified as the fourth major cause of death in China (WHO 2014). In recent years, the PM2.5 concentration in urban areas of southern China has ranged from 25 μg/m3 to more than 60 μg/m3, while in northern China, some urban areas witnessed concentrations over 100 μg/m3 [15]. In 2016 and 2017, about 40% of cities in China had an annual average concentration of PM2.5 within the range of 35~52.5 µg/m3 [16].
TVOCs are total volatile organic compounds. As a precursor to the formation of photochemical smog, outdoor TVOCs play an important role in stratospheric ozone depletion and the greenhouse effect [17]. Indoor TVOCs represent a potential risk to people’s health [18], because people are more exposed to them [19]. They are primarily found in construction materials and ambient air [19,20]. Long or recurrent exposure to indoor TVOCs may cause harmful effects on the human nervous, immune, and reproductive systems; cause liver and kidney damage [21]; induce asthma, wheezing, and allergies [22]; and cause cancer [7]. In 2020, TVOCs exhibited a decrease (20~66%) in North China and an increase (13~127%) in the Yangtze River Delta region [23]. While studies on indoor TVOCs are relatively rare compared to outdoor TVOC studies [23], numerous buildings have exceeded TVOC concentrations based on China’s “Standards for Indoor Air Quality” (GB/T 18883-2002) [24,25]. In addition, formaldehyde (HCHO) has also been observed indoors due to its relatively high concentration [26,27]. It has been found that construction materials and furniture are the main sources of indoor HCHO [26].
CO2 in ambient air is primarily a greenhouse gas that causes global warming [28]. Approximately 70% of global CO2 emissions originate from urban fossil fuel combustion [29]. Nowadays, there is growing interest in monitoring CO2 in urban areas as an effort to control carbon emissions [30,31]. In residential buildings with natural ventilation, human activities cause significant increases in indoor CO2 levels [32,33]. Thus, the indoor CO2 concentration is a crucial factor in assessing indoor air quality (IAQ) [34,35]. Previous studies have suggested that the permissible indoor CO2 concentration is 700~1000 ppm. However, even low CO2 levels can impact peripheral blood flow, impair the functioning state of the cerebral cortex, and alter respiratory movement [36]. When indoor CO2 concentration is higher than 1000 ppm and there is inadequate ventilation, it can deteriorate sleep quality, cause headaches, confusion, anxiety, and drowsiness, diminish cognitive decision-making abilities, and reduce psychomotor performance [37,38,39].
Previous studies have focused on the variability of the indoor-to-outdoor ratio (I/O ratio) of air pollutant concentrations [40]. The large difference in I/O ratios can be attributed to different building types, crack geometry in buildings, construction materials, ventilation, indoor sources of air pollutants, and outdoor wind conditions [40,41]. In addition, the indoor air quality index (IAQI) is a nonlinear index that quantitatively describes indoor air quality. It has been used as an indicator to assess the effects of air pollutants on people’s health [42,43]. It has been found that a poor IAQI can cause poisoning, allergic reactions, and sick building syndrome [44]. Concentration levels of nine common indoor air pollutants, including CO2, carbon monoxide (CO), nitrogen dioxide (NO2), ozone (O3), HCHO, PM, TVOCs, radon (Rn), and airborne bacteria count (ABC), were also used as indicators for calculating IAQI values [45]. These studies chose the type of indoor air pollutants according to actual indoor conditions. The conditions varied significantly depending on the building type and its characteristics (e.g., ventilation, envelope design, materials, etc.) [46], indoor emission sources, outdoor environmental conditions, indoor activities (e.g., smoking and cooking) [47], etc. In recent years, IAQI data have been observed in many indoor spaces, such as office buildings [42,48], shopping malls [21,49], stations and train cabins [50,51,52], schools [53,54,55], hospitals [56], and residential buildings [57,58]. However, IAQI data for nursing homes are very scarce.
The World Health Organization defines older persons as those over 60 years of age. In 2018, the total number of elderly aged 65+ in China accounted for 12.0% of the total population. There is no doubt that China will soon face particularly tough challenges in regard to the aging population [59,60]. Due to the 4-2-1 family structure in China (four grandparents, two parents, and one child), an increasing number of elderly people have to trade traditional family care for institutional care [61]. Since 2019, nearly 30,000 nursing homes have been established and more than 7.46 million beds have been supplied for the aging population in these homes in China [62]. Due to a weak immune system and a higher chance of chronic diseases [63], the elderly are particularly vulnerable to air pollutants. Moreover, the elderly residing in nursing homes are usually more advanced in age, already have health issues, and spend more time indoors than other elderly people. Assessing indoor air pollution exposure and clarifying the relationship between indoor and outdoor air pollutants is important for understanding the impact of air pollution on the health of elderly people.
The elderly living in nursing homes usually spend more time indoors. Therefore, this study measured the air quality in the Wanxia nursing home. The aims were to (a) use the IAQI values of the nursing home with natural ventilation to describe the daily exposure of the elderly to several indoor air pollutants, including PM10, PM2.5, CO2, HCHO, and TVOCs; (b) analyze the relationship between indoor and outdoor air pollutants and determine the factors influencing indoor air quality; and (c) optimize strategies for natural ventilation to improve the health of the indoor environment. This is the first study to assess exposure to indoor air pollution in nursing home buildings in southwest China. The findings of this study may raise public awareness of indoor air quality in institutional nursing homes in the hopes of protecting the elderly by adopting the most convenient, efficient, and affordable methods to reduce their exposure to indoor air pollutants.

2. Materials and Methods

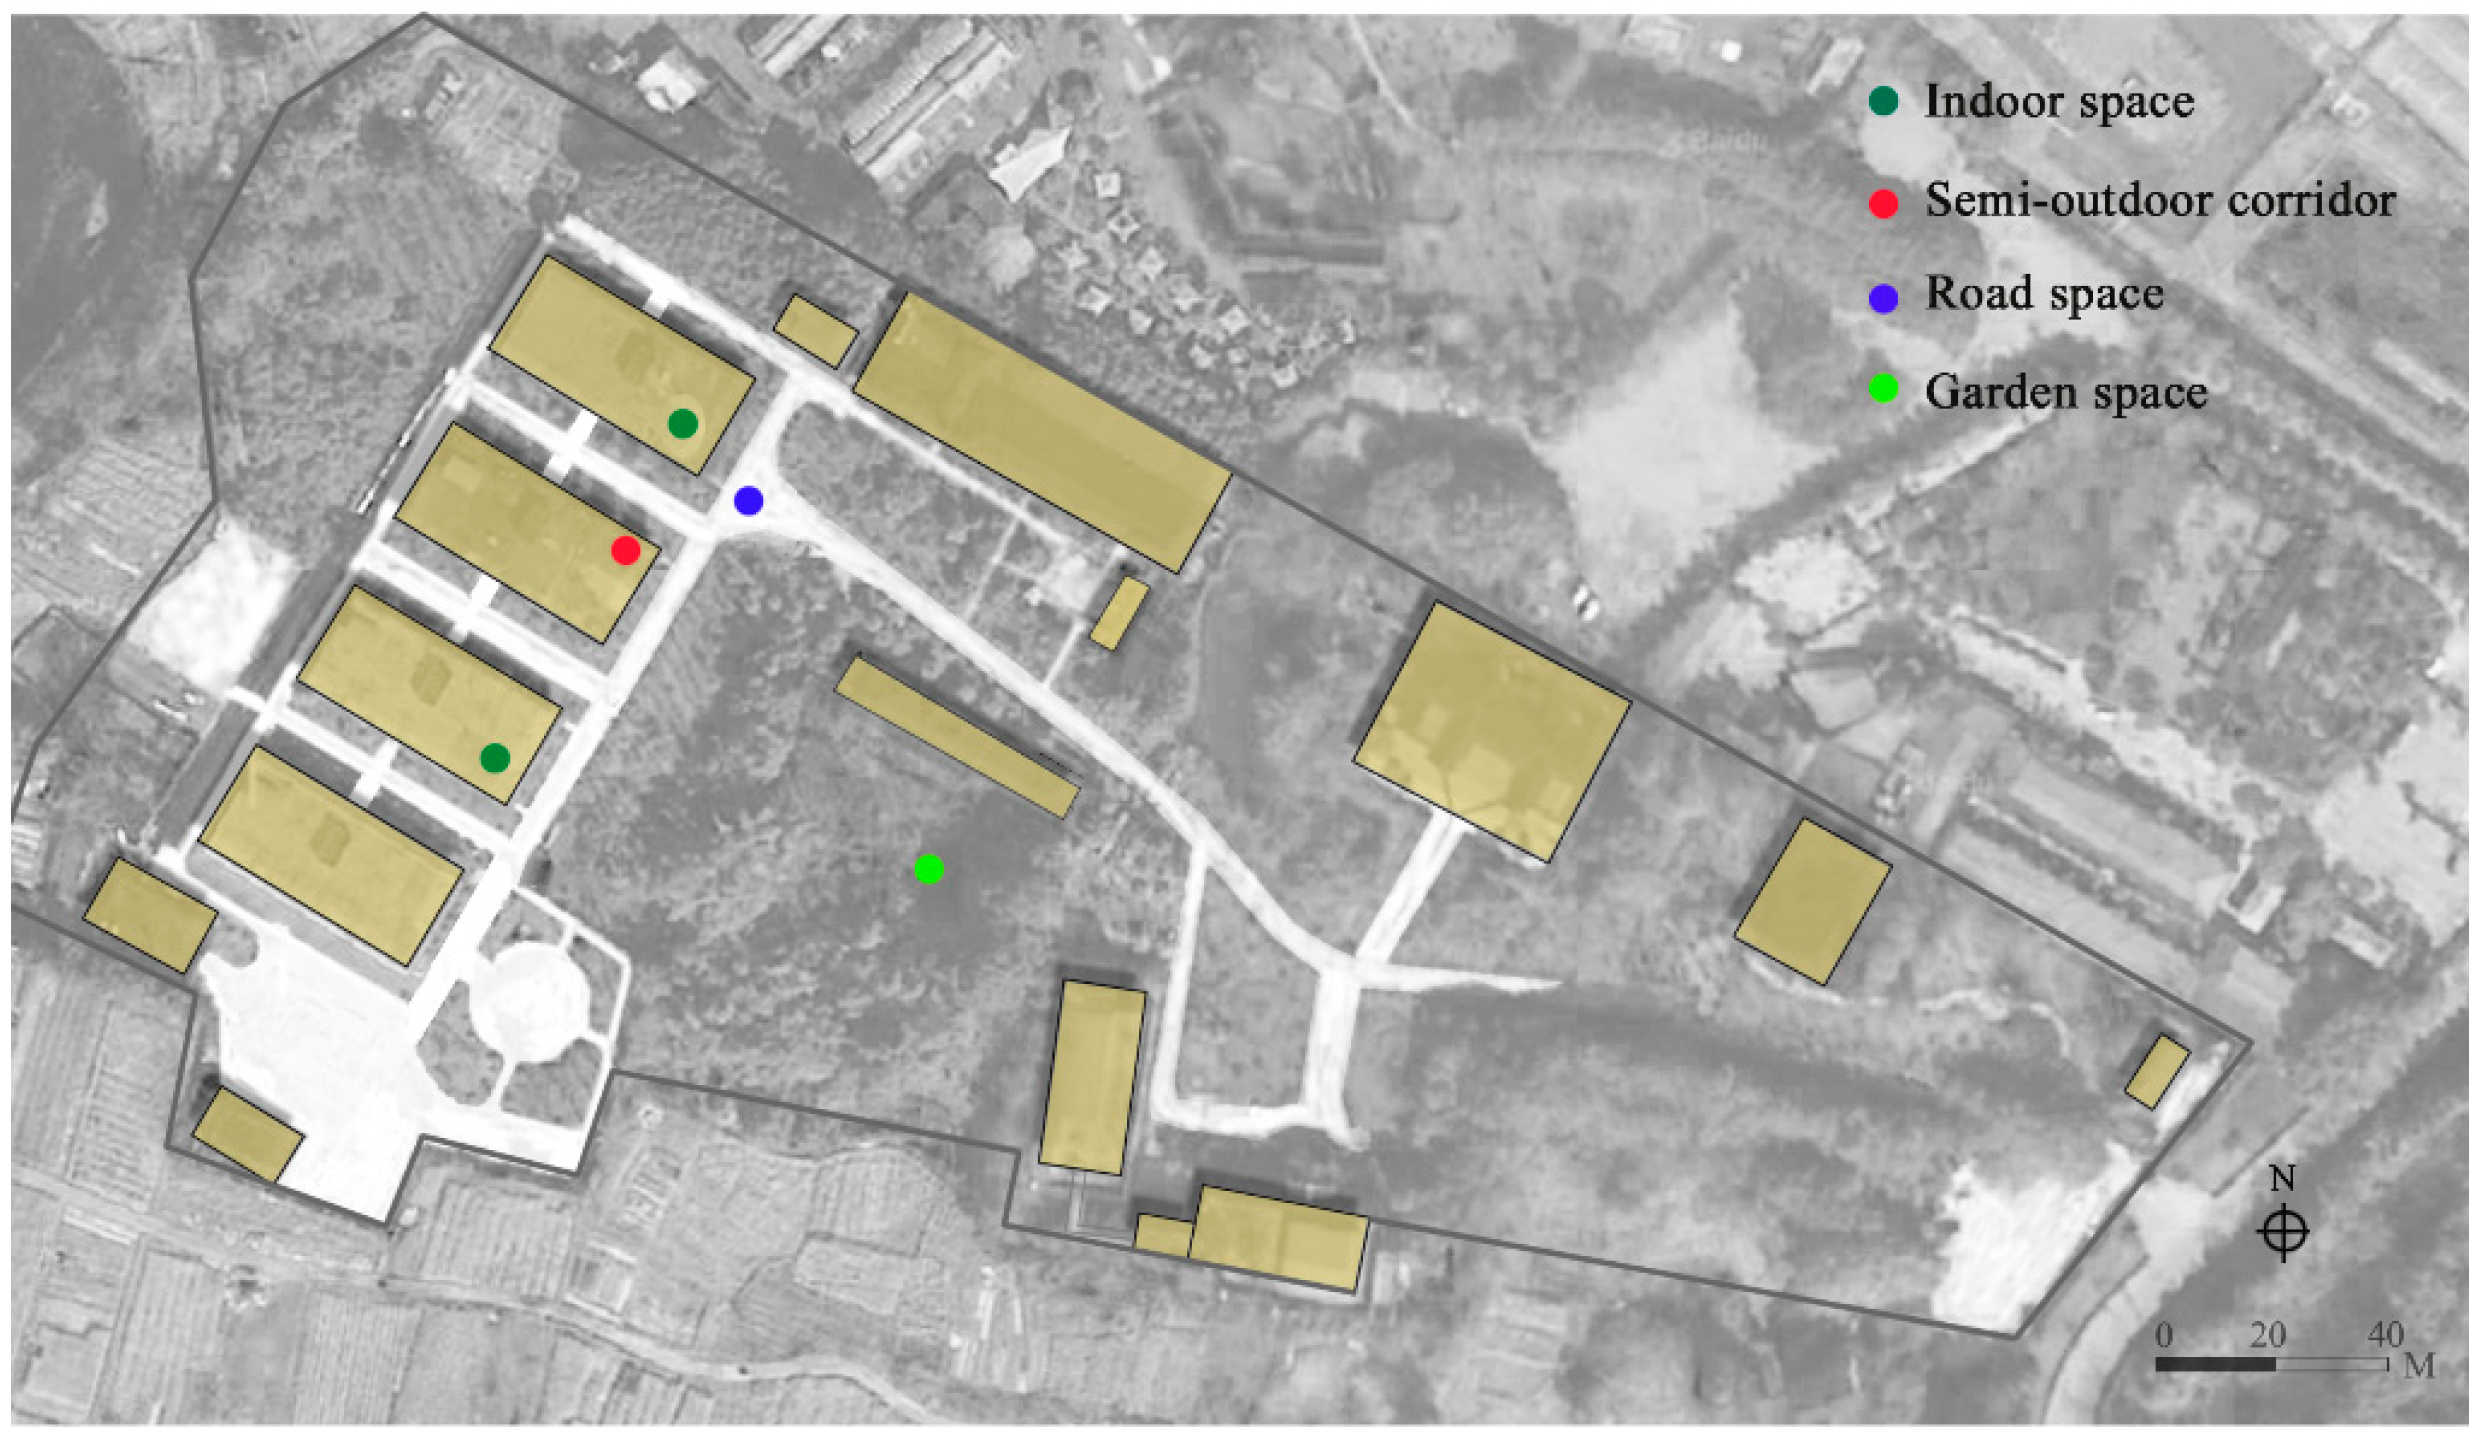
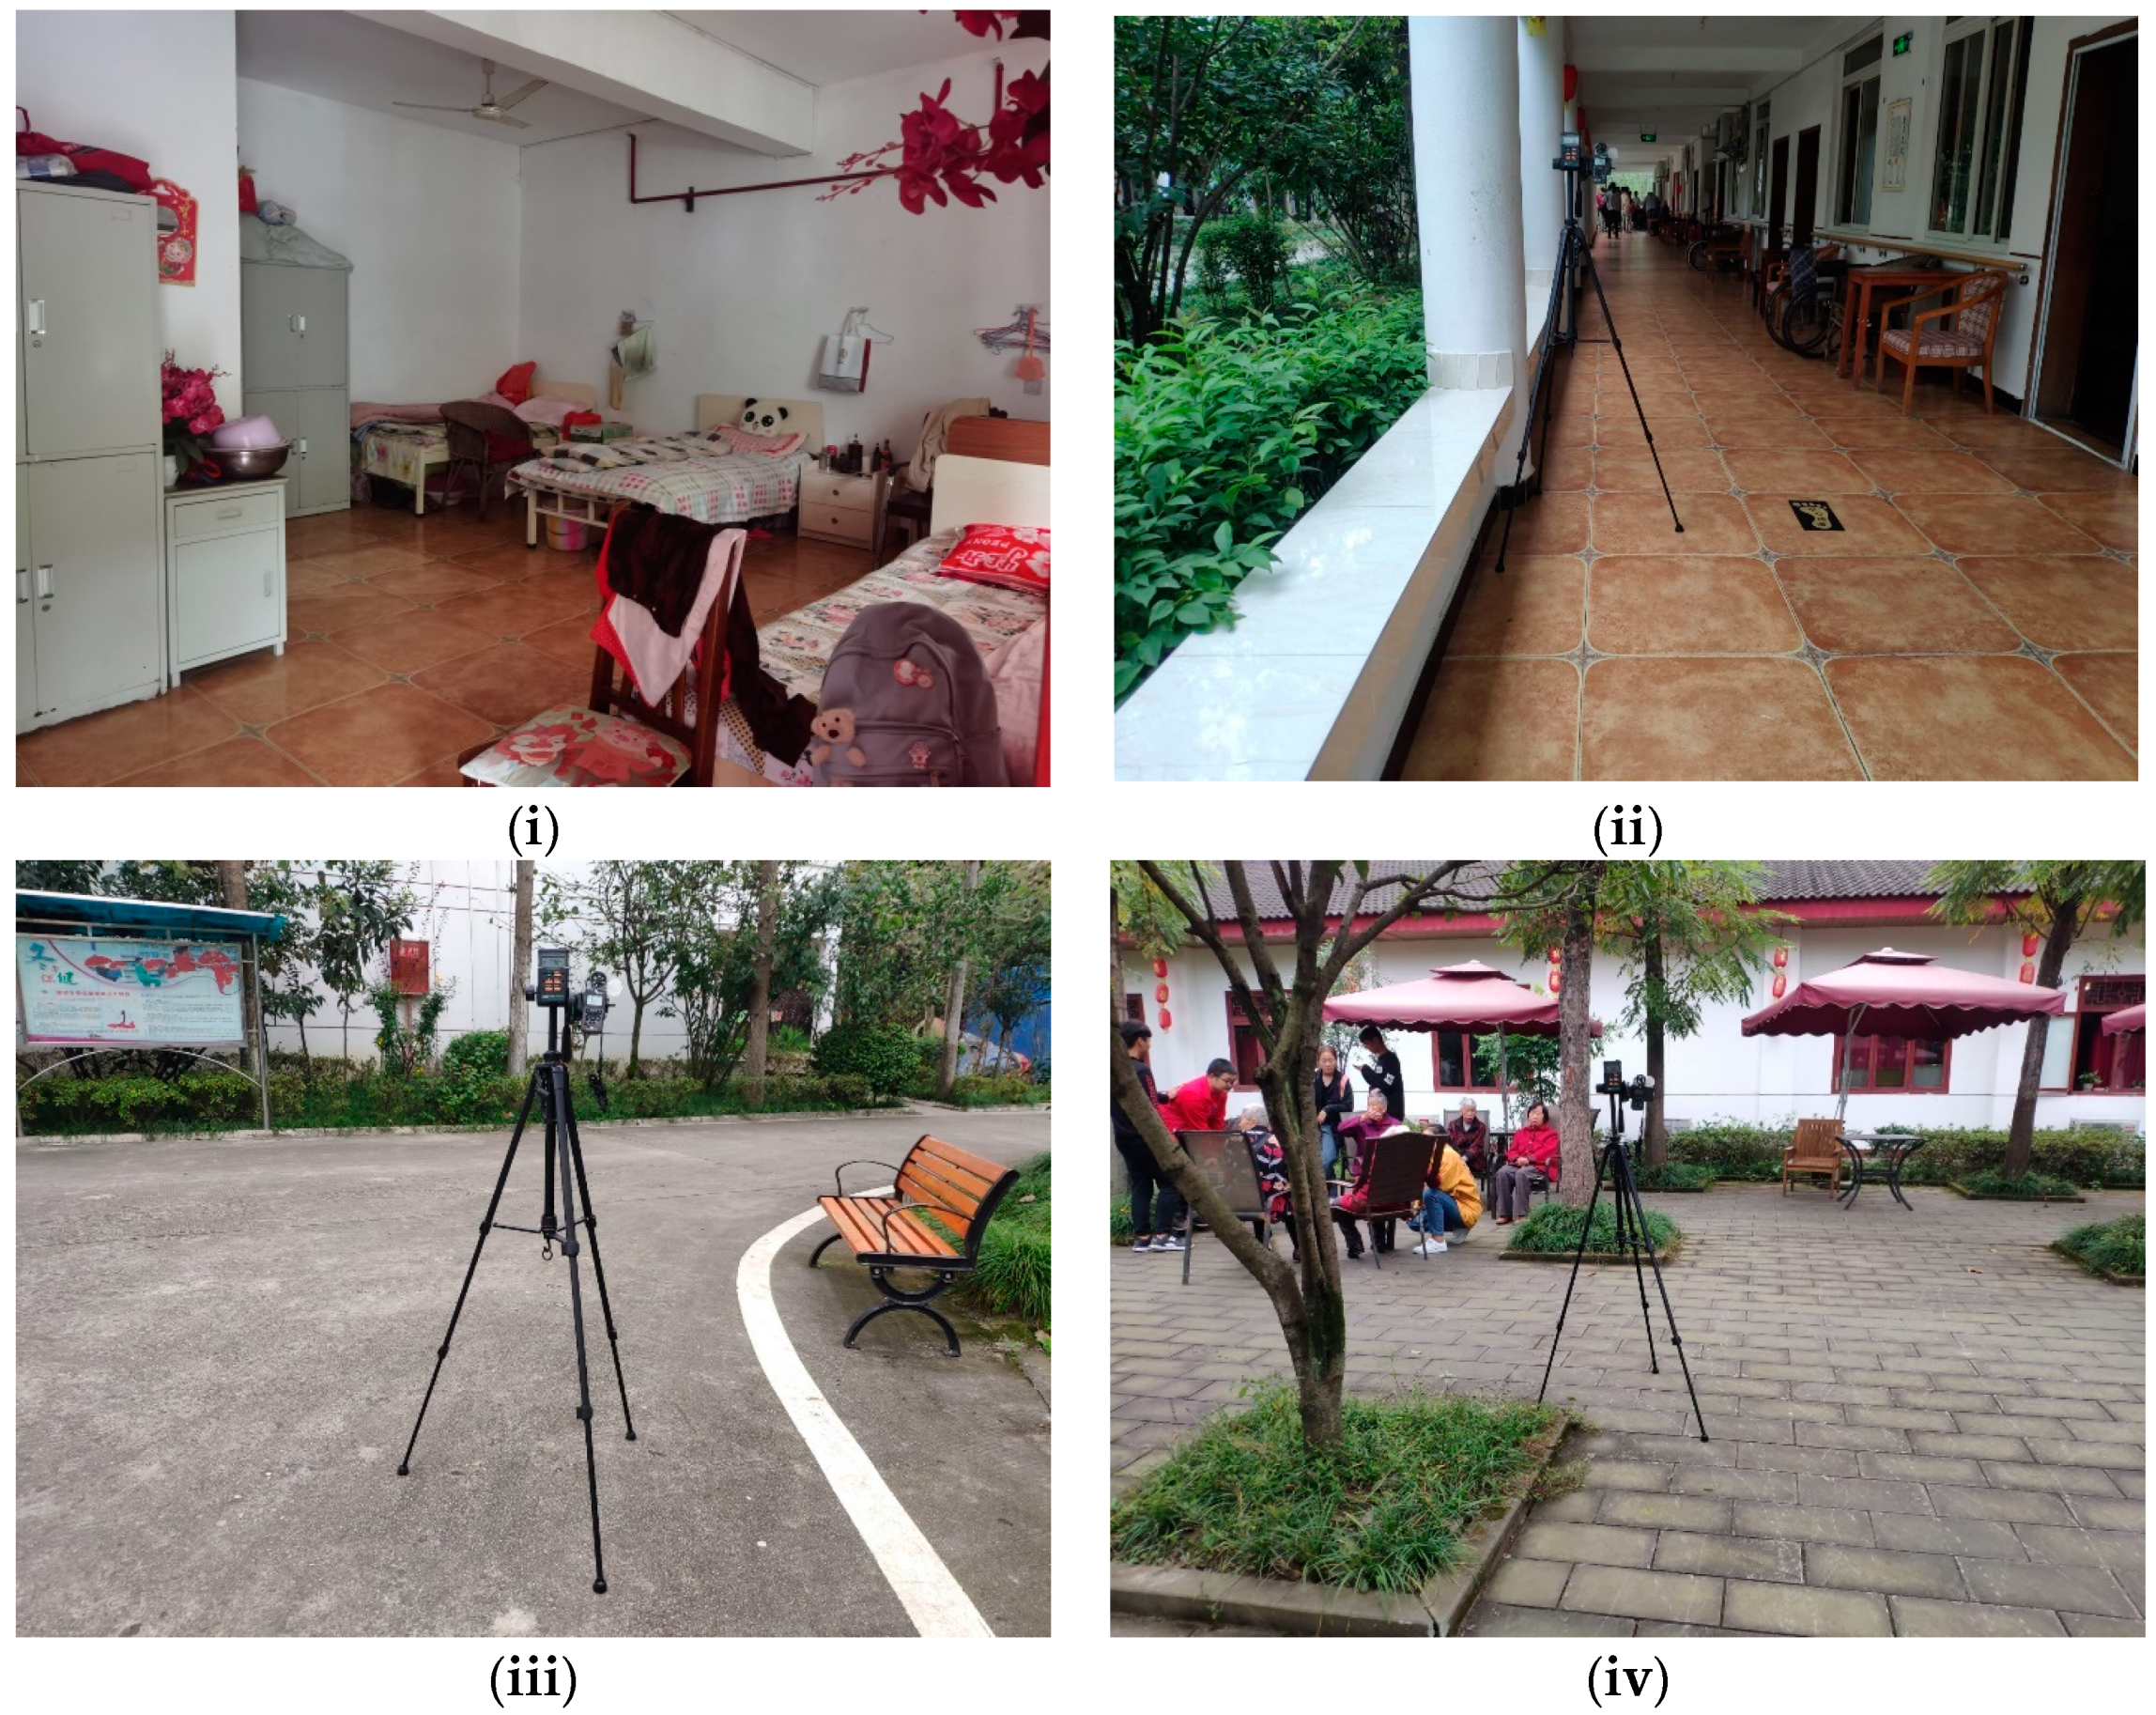
2.1. Study Area and Sample Selection

As of the end of 2021, the number of elderly people in Chengdu has reached 3.2 million, accounting for 20.61% of the total local population (Chengdu Statistical Yearbook). The elderly care facility in this study was Wanxia Elderly Service Center (Wanxia nursing home in the rest of the paper), the largest private nursing home in Chengdu. It is located in Jinniu District of Chengdu (N30°05′–N31°26′, E102°54′–E104°53′). Established in 2003, the nursing home covers an area of about 46,666.66 m2 and is equipped with 500 beds. A total of 180 elderly people live in this nursing home. More than 90% of the elderly people are 80 and older, and 2.8% are 90 and older. Of these 180 elderly people, 120 (66.7%) are women and 60 (33.3%) are men.
Within the nursing home, there are nine randomly distributed two-story buildings, covering a total building area of 25,380 m2. These buildings rely only on natural ventilation, i.e., opening doors and windows. When this study collected data on air quality indicators, the nursing home was divided into four functional spaces: indoor space (bedroom), semi-open pubic corridor space, road space, and garden space. This study selected five random monitoring areas (Figure 1 and Figure 2), i.e., two bedrooms, one public corridor, one main road, and one garden. Each bedroom can house four elderly residents and has a washroom. The bedroom and its indoor washroom are usually cleaned with water every three days. These bedrooms are adjacent to the public corridor. Within the bedrooms and corridors, there is tile flooring. The parameters of the bedrooms and their furniture are shown in Table 1. Within these areas, this study simultaneously monitored air pollutants and microclimate. In addition, there is no kitchen in the bedrooms, and the elderly go to the dining room by themselves. For the elderly who are unable to take care of themselves, meals are delivered to their bedrooms. At the end of the hallway on each floor is a cleaning room. The parking lot is outside the entrance to the nursing home, away from the accommodation buildings. It is important to note that the elderly residing in the two bedrooms are non-smokers and do not have access to a fresh air system. The bedrooms are naturally ventilated through opening doors and windows. No pets were found in any of the bedrooms.

2.2. Air Pollutants and Microclimate Measurement

Concentrations of particulate matter (PM10 and PM2.5), gaseous air pollutants (CO2, HCHO and TVOCs), temperature (Ta), and relative humidity (RH) within the five areas were monitored simultaneously using direct reading instruments from March 2021 to February 2022, including 15 days in spring, 14 days in summer, 14 days in autumn, and 14 days in winter. These instruments were placed horizontally in the center of the indoor and outdoor spaces, 1.1 m above the ground. To prevent the elderly from tripping, the indoor instruments were placed on the side of the bedroom at a sufficient distance from doors and windows to avoid potential disturbances. During the monitoring period, all monitoring was conducted for 24 h each day. The elderly maintained their everyday activities without changing their typical habits.
Continuous indoor and outdoor CO2 measurements were conducted using an LI-830 CO2 analyzer (LI-COR Inc., Lincoln, NE, USA) at 5 min intervals, which is also suitable for monitoring urban CO2 levels [28]. PM10 and PM2.5 were observed within each area using a SMART 126S monitor (Taylor Inc., Changzhou, China), which is based on the principle of laser scattering. A SMART 128S monitor (Taylor Inc., Changzhou, China) was used to monitor TVOCs and HCHO concentrations using semiconductor and electrochemical sensors, respectively. Finally, Ta and RH were measured using a Kestrel 5500 portable weather station (Nielsen-Kellerman, Boothwyn, PA, USA). All instruments were configured to perform measurements at 5 min intervals. A detailed explanation of the measuring equipment is shown in Table 2. Overall, the above design of direct detection apparatus is based on the principle of infrared, laser, or electrochemical methods, and the direct detection data are reliable [64].

2.3. Indoor/Outdoor (I/O) Ratio and IAQI Benchmarks

The I/O ratio represents a direct relationship between indoor and outdoor air pollutant concentrations. The I/O ratio is calculated as follows:
I / O   ratio = C i n C o u t
where Cin and Cout are the indoor and outdoor air pollutant concentration, respectively. Subsequently, the concentrations of PM2.5, PM10, CO2, HCHO, and TVOCs were chosen to calculate the IAQI values. The IAQI calculation method takes into account not only the mean concentration of each air pollutant, but also the maximum concentration of the pollution, enabling an objective assessment of air quality. The following formula was used to calculate IAQI values (Equations (2) and (3)) [65,66]:
I A Q I = I m a x × I a v e r a g e
I = 1 n i = 1 n C i S i  
where Ci is the fractional dose of the i-th representative pollutant; n is the number of pollutants, i = 1, 2, ..., n; and Si denotes the evaluation standard value of the i-th representative pollutant.
The IAQI value is divided into 4 levels: good air quality and no pollution (IAQI < 0.59), low pollution level (0.5 < IAQI < 1), moderate pollution level (1 < IAQI < 2), and high pollution level (IAQI > 2) [65,66]. The higher the IAQI value is, the worse the air quality is. The evaluation of air pollutants was performed by comparing the “Standard for Indoor Environmental Pollution Control of Civil Building Engineering” (GB50325-2020) [67], “Ambient Air Quality Standards” (GB3095-2012) [68], and the “Standard for Indoor Air Quality” (GB/T18883-2022) [69].

2.4. Data Analysis Methods

In this study, all parameters were calculated for each measurement day and mean values were determined for the entire season. Variance and Pearson’s correlation analysis in SPSS 11.0 (SPSS Inc., Chicago, IL, USA) were used to assess differences in the concentration of air pollutants between the indoors and the outdoors. Results are expressed as 95% confidence intervals. Origin 8.0 was used to draw charts and perform function fitting.

3. Results

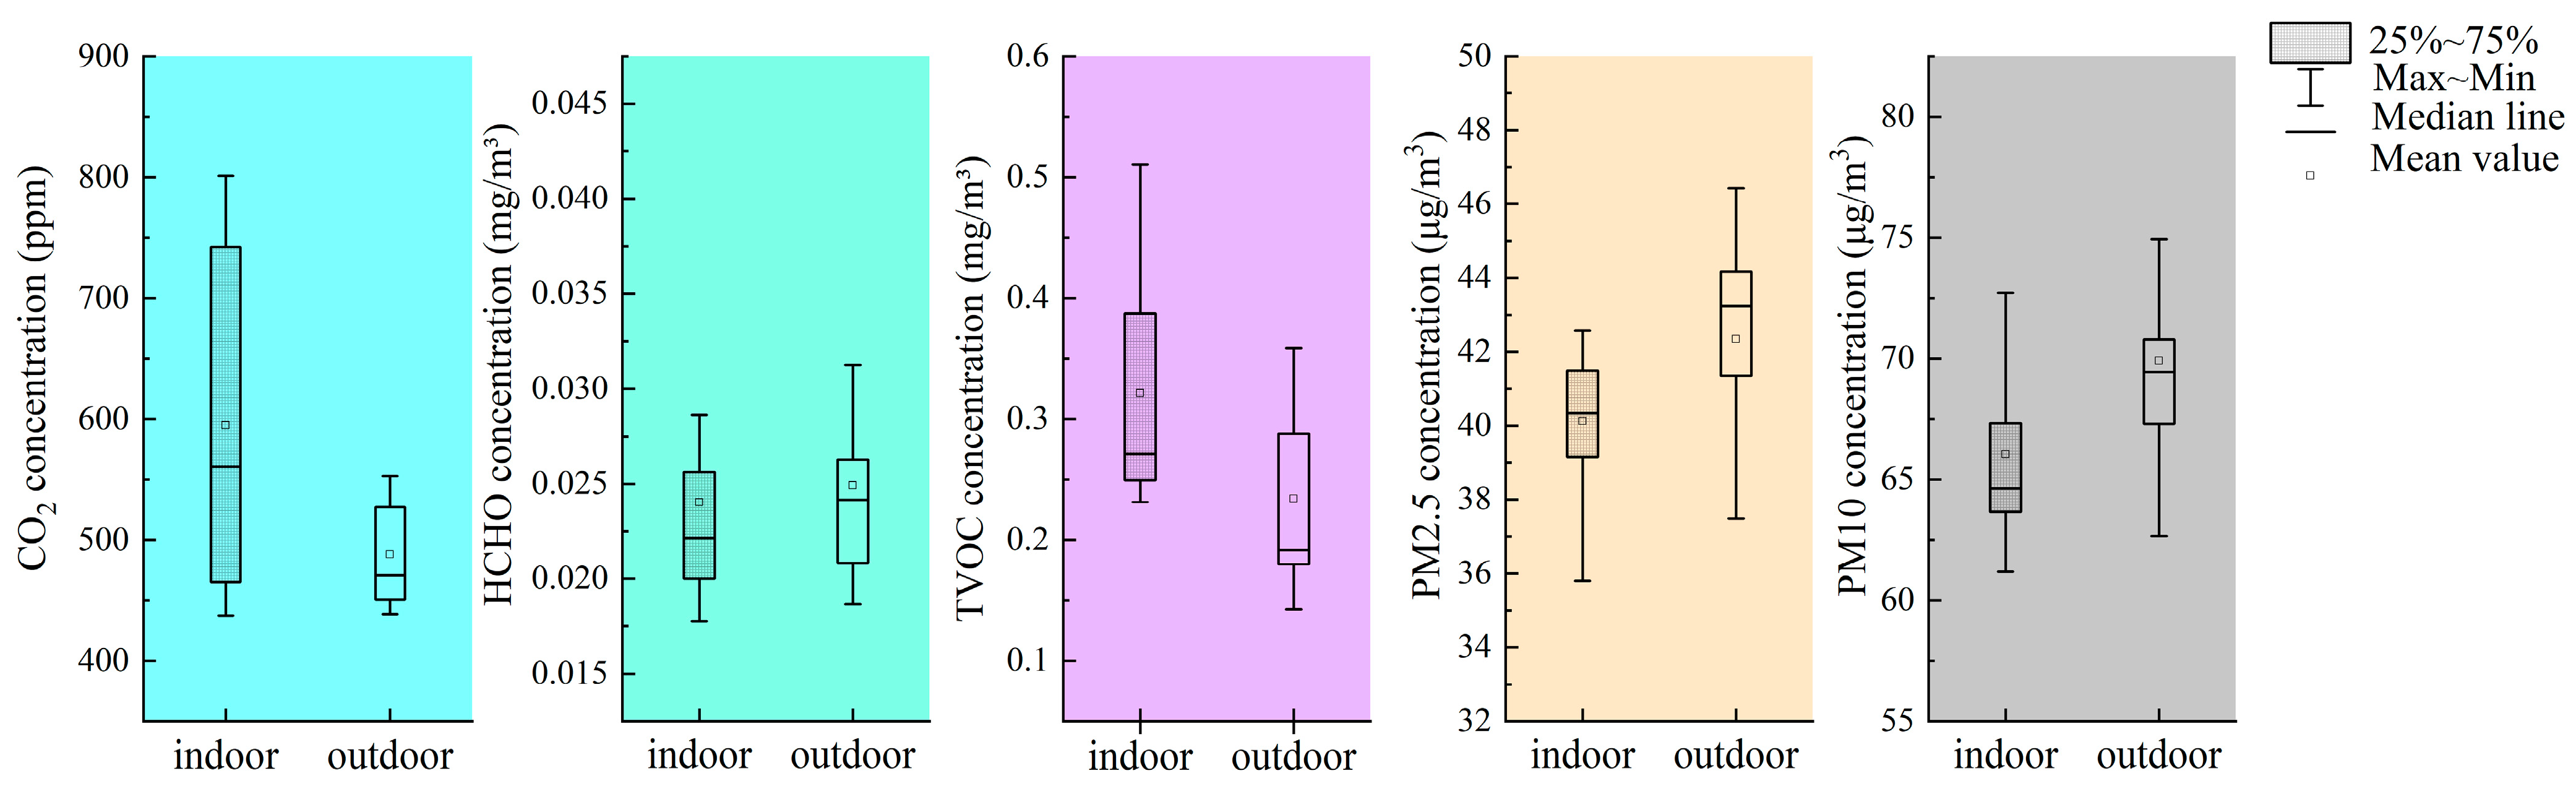
3.1. Seasonal Levels of Indoor and Outdoor Air Pollutants

Given the unique topography of the Sichuan Basin, Chengdu is characterized as a densely populated city with limited air movement, which contributes to the accumulation of air pollutants that are difficult to disperse later. The annual and seasonal mean concentrations of CO2, HCHO, PM10, PM2.5 and TVOCs in the Wanxia nursing home are shown in Figure 3 and Table 3. The annual mean concentration of indoor CO2 (594.76 ppm) was clearly higher than that of the outdoor one (479.68 ppm). Moreover, the annual mean CO2 concentration in all monitored areas did not exceed the standard limit (1000 ppm) and met residential standards.
The annual mean indoor HCHO concentration (0.024 mg/m³) was below the standard limit (0.07 mg/m³) (GB50325-2020) and met residential standards (Figure 3). The annual mean outdoor HCHO concentration (0.025 mg/m³) was higher than the reported outdoor HCHO concentration (0.012 mg/m3) in Chinese cities [70], exceeding the chronic exposure reference levels (RELs) of 0.009 mg/m3 set by the Office of Environmental Health Hazard Assessment (OEHHA) [71]. In summer, the indoor HCHO concentration was the highest compared to other seasons. The indoor HCHO concentration was significantly lower than the outdoor concentration in spring, autumn, and winter. However, HCHO concentration was significantly higher indoors than outdoors during summer.
The annual mean concentration of indoor TVOCs (0.32 mg/m³) in the Wanxia nursing home was significantly higher than that of outdoor TVOCs (0.23 mg/m³) (Figure 3). Both of the measurements were lower than the standard limit (0.45 mg/m³) specified for Class I buildings in the “Standard for Indoor Environmental Pollution Control of Civil Building Engineering” (GB50325-2020). The highest indoor TVOCs concentration (0.401 mg/m³) in the Wanxia nursing home was observed in summer (Table 3), which was very close to the standard limit, followed by spring (0.398 mg/m³). Moreover, the outdoor TVOCs concentration exhibited a varying decreasing trend across the seasons, with spring (0.288 mg/m³) having the highest levels, followed by winter (0.281 mg/m³), summer (0.217 mg/m³), and autumn (0.150 mg/m³).
The annual mean concentrations of indoor and outdoor PM 2.5 in the Wanxia nursing home were 40.13 μg/m3 and 42.34 μg/m3, respectively, while that of indoor and outdoor PM10 ranged from 66.03 μg/m3 to 69.91 μg/m3 (Figure 3), respectively. The concentrations of PM were lower than the upper limit (50 mg/m³ PM2.5 and 100 mg/m³ PM10), as proposed in “Standards for Indoor Air Quality” (GB/T18883-2022). This study found that the PM10 concentration was 65% higher than the PM2.5 concentration. In winter, the mean concentrations of PM2.5 and PM10 in all monitored areas almost doubled compared to those in summer (Table 3), and the values exceeded the upper limit. During summer, there were no significant differences (p ≥ 0.05) between indoor and outdoor PM2.5 and PM10 concentrations in the Wanxia nursing home. This indicates that indoor PM levels were most affected by outdoor levels in summer.

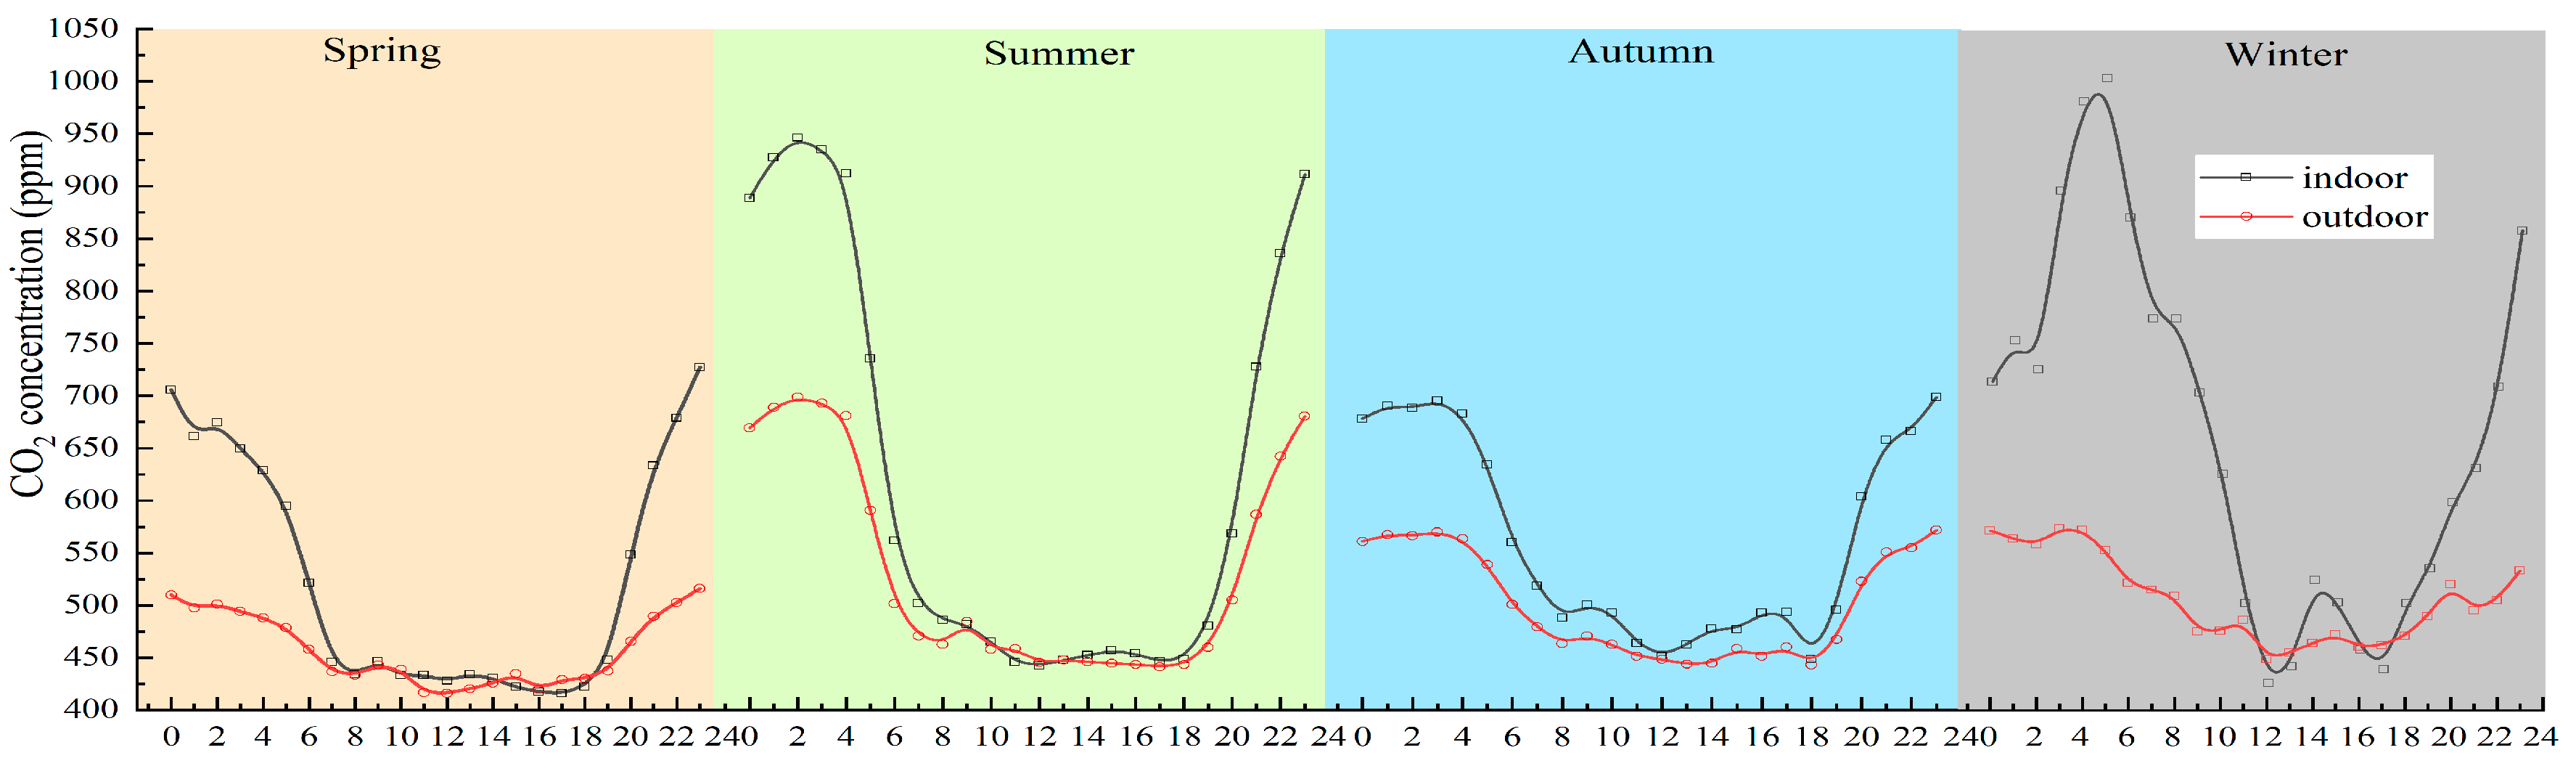
3.2. Diurnal Variation in Indoor and Outdoor Air Pollutant Concentrations

This study used hourly measurements to examine the duration of time during each day when air pollutants exceed the standard limit. Figure 4 shows the 24 h mean concentrations of CO2, HCHO, PM10, PM2.5, and TVOCs of indoor and outdoor areas in the Wanxia nursing home.
The 24 h mean CO2 concentration levels in indoor and outdoor areas exhibited a more consistent trend across seasons (Figure 4). The highest 24 h mean indoor and outdoor CO2 concentrations were observed in winter. Furthermore, the largest differences between indoor and outdoor CO2 levels also occurred in winter. It is worth noting that there was a peak of CO2 levels in the late night and early morning hours, specifically from 10:00 pm to 05:00 am. Indoor CO2 concentration during winter and summer nights was 946.52 ppm and 1004.29 ppm, respectively. These values were close to or exceeded the standard limit (1000 ppm). As the day went by, the CO2 concentration dropped sharply until 8:00 am and the lowest CO2 levels appeared in the afternoon. After that, CO2 levels increased rapidly from 6:00 pm, especially indoors. Changes in indoor concentrations throughout the day were consistent with the daily routines (waking up and sleeping schedules) of the elderly.
The 24 h HCHO concentration levels indoors and outdoors exhibited large differences between seasons (Figure 4). Although the 24 h mean indoor HCHO concentration levels were below the standard limit (0.07 mg/m³), the maximum value (0.068) was very close to the standard limit in spring. The highest 24 h fluctuations in HCHO concentrations were also observed in spring, with a mean deviation of 0.016 mg/m³. In contrast, the lowest concentration fluctuations occurred in autumn, with a deviation of only 0.001 mg/m³. In spring and summer, indoor and outdoor HCHO levels increased rapidly from 6:00 pm, and their peaks were observed at 9:00 pm (Figure 4). However, in autumn and winter, the peak was delayed until 1:00 am.
The 24 h fluctuations in TVOC concentrations were highest in spring (0.19 mg/m³), followed by summer (0.14 mg/m³), winter (0.07 mg/m³), and autumn (0.04 mg/m³). In spring and summer, the 24 h indoor TVOCs concentration was consistently higher than that outdoors. Moreover, two peak concentrations were observed at 9:00 pm and 12:00 pm (Figure 4). However, in autumn and winter, the outdoor TVOCs concentration was higher than the indoor from 11:00 am to 4:00 pm. It is worth noting that the indoor TVOC concentrations from 8:00 pm to 4:00 am consistently exceeded the standard limit (0.45 mg/m³) in spring and summer.
The 24 h mean concentrations of indoor PM2.5 ranged from 35.80 mg/m³ to 42.57 mg/m³, while the indoor PM10 ranged from 61.18 mg/m³ to 73.43 mg/m³ (Figure 4). The trajectories of the indoor and outdoor PM concentrations were more consistent over the 24 h period. The indoor and outdoor concentration of PM2.5 increased sharply around 6:00 pm and remained at its lowest value in the afternoon. The highest (42.57 mg/m³) and lowest (35.80 mg/m³) hourly mean indoor PM2.5 concentrations occurred at 11:00 am and 17:00 pm, respectively. The hourly PM10 concentration showed an inconsistent pattern of change throughout the seasons. In summer, autumn, and winter, the peak indoor and outdoor PM10 concentration was observed between 9:00 am and 12:00 am. In spring, however, the highest concentrations of indoor and outdoor PM10 occurred at 4:00 am. Although both indoor and outdoor concentrations were lower than the standard limit (50 mg/m³ PM2.5 and 100 mg/m³ PM10) (GB/T18883-2022), they exceeded the recommendations of the World Health Organization (WHO) (AQG2021) of 15 mg/m³ of PM2.5 and 45 mg/m³ of PM10 by 2 and 1.55 times.

3.3. Level of Indoor Air Quality and Its Main Influencing Factor

As seen in Table 4, indoor air quality was at a low pollution level (0.51 < IAQI < 1) in spring, summer, and autumn. In winter, it rose to a moderate pollution level (1 < IAQI < 2). The PM concentration played an important role in the indoor air quality levels. In spring, summer, and winter, the PM10 level had the greatest impact on IAQI values, followed by PM2.5 levels. In autumn, however, the impact of PM2.5 concentration on IAQI was more prevalent compared to that of PM10. HCHO, on the other hand, had a minimal impact on IAQI in all seasons. In addition, in spring and summer, the TVOCs concentration had a greater impact on IAQI than CO2, but in autumn and winter it was the opposite.
The indoor/outdoor (I/O) ratios offered a general understanding of the relationship between indoor and outdoor air pollutants (Table 5). The seasonal I/O ratios of CO2 and TVOCs exceeded 1. A higher I/O ratio of TVOCs (1.945) was found in summer. There was a considerable seasonal variability in the HCHO I/O ratio. The highest I/O ratio of HCHO was approximately 1.31 in summer. However, the HCHO I/O ratio ranged from 0.728 to 0.882 in other seasons. The I/O ratios of PM2.5 and PM10 ranged from 0.919 to 0.988 and from 0.788 to 1.097, respectively. Most of them were <1 in this study.
Table 5 also shows the Pearson correlation between indoor and outdoor air pollutant levels across seasons. There was no correlation between indoor and outdoor HCHO levels in autumn only. Setting this aspect aside, indoor air pollutant levels were significantly influenced by outdoor air pollutant levels in all seasons. The ingress of PM from the outdoor to the indoor environment is evident in the high correlations between indoor and outdoor PM2.5 (r from 0.56 to 0.986) and PM10 (r from 0.894 to 0.985) in all seasons. These high correlations suggest that outdoor PM, including emissions from construction and vehicles, predominantly contributed to indoor PM exposure. Figure 5 and the fitted equations within it describe the significant linear correlations between indoor and outdoor air pollutant levels. These results are similar to studies in a primary school in Nakhon Si Thammarat, Thailand [72] and urban buildings in Guangzhou, China [73], which indicated a strong linear correlation between outdoor and indoor PM and TVOCs, respectively. Indoor air pollutant levels can be calculated from outdoor air pollutant levels using high-fit linear equations.
Table 6 shows a comparison of seasonal indoor air pollutant concentrations affected by Ta and RH. Indoor CO2 levels were closely related to indoor Ta and RH. It was found that the higher the indoor RH in all seasons, the higher the concentration of CO2 (p < 0.01). In winter, CO2 levels increased as Ta decreased, but in other seasons it was the opposite. Trends in PM10 and PM2.5 levels varied considerably with Ta and RH. In particular, PM10 concentration was correlated with Ta and RH only in summer, while PM2.5 concentration did not correlate with Ta and RH in winter (Table 6). Indoor HCHO levels were positively correlated with Ta in winter and RH in summer, but negatively correlated with Ta in spring and summer. TVOCs concentration was also positively correlated with RH.

4. Discussion

In many cities, the highest outdoor CO2 levels are observed in winter [74], due to heating emissions from private households and businesses [75]. In this study, indoor and outdoor CO2 concentrations were slightly higher in winter than in other seasons. The reason for this may be related to natural ventilation in the cold season [76]. In many urban areas, such as Baltimore [77], London [78], Tokyo [74], and Melbourne [79], increased outdoor CO2 levels also occur during the nighttime or early morning throughout the seasons. In these areas, atmospheric stability and increased CO2 emissions during the nighttime were the main reasons for increased outdoor CO2 concentration [74]. Similarly, in this study, the 24 h mean indoor and outdoor CO2 concentration levels showed a more consistent trend across seasons. Indoor CO2 concentrations during winter and summer nights were close to or exceeded the standard limit (1000 ppm). More importantly, one study found that the indoor CO2 concentration of 945 ppm corresponded to a 15% decline in cognitive functions [80]. High indoor CO2 concentration is usually caused by inadequate ventilation and airflow [81]. Therefore, the high indoor CO2 concentration during the night in this study was possibly also the result of inadequate ventilation. Closing windows and door at night, small rooms, and residents’ breathing during sleep cause a sharp increase in indoor CO2 concentration because residents cannot control ventilation at all times [38]. A similar pattern of changes in CO2 levels was observed in elderly care centers in Lisbon and Loures in the District of Lisbon [82]. In contrast, the lowest CO2 levels occurred in the afternoon. At that time, plants in urban areas photosynthesize the most, absorbing and converting large amounts of CO2 [83]. In addition, seasonal I/O ratios of CO2 exceeded 1. This result is consistent with previous studies on naturally ventilated urban buildings [84,85], where the I/O ratio of CO2 was higher than 1. The metabolic rate and respiration of the elderly can contribute to higher CO2 levels indoors.
In this study, indoor HCHO concentration was significantly higher than that outdoor only in summer. Similar results of indoor HCHO seasonal variations have also been reported in other studies [86,87,88]. This can be attributed to higher indoor Ta and RH during summer that causes the highest indoor HCHO release. A previous study reported that indoor HCHO concentrations were higher in southern than in northern China in summer, which can be partially explained by higher indoor Ta and RH in the south [26]. In spring and summer, 24 h indoor and outdoor HCHO levels increased rapidly from 04:00 pm, and their peaks occurred at 9:00 pm. However, in autumn and winter, the peak is delayed until 1:00 am. This finding is contrary to the results of previous studies, which indicated that indoor HCHO was highest at noon and lowest at night [87]. These differences may be attributed to the dependence of indoor HCHO levels on outdoor HCHO levels. This study showed that outdoor HCHO may contribute more than three-quarters to the indoor concentration in all seasons except summer, implying that outdoor HCHO contributes substantially to the indoor concentrations in the Wanxia nursing home during most of the year. It is totally different from the results of campus buildings (I/O ratio ranged from 3.70 to 5.55) [87], public buildings (1.75), and residential buildings (2.13) in developing countries [89]. In these studies, although outdoor HCHO concentrations still had some degree of influence indoors, the degree of influence was much less than that in the Wanxia nursing home. This could be attributed to the fact that the interior furniture in the Wanxia nursing home was mostly made of metal rather than wood. Moreover, there were almost no interior decorations. Generally speaking, HCHO is primarily emitted by wood-based products due to the widespread use of formaldehyde-related adhesives [90]. In addition, the variation in outdoor HCHO levels has a strong dependence on meteorological and dispersive conditions, especially on Ta [91]. Chengdu is located at the bottom of the Sichuan Basin, with a high frequency of static winds and more foggy days in autumn and winter. There is also an inversion layer throughout the year, with higher nighttime Ta, which is not conducive to horizontal and vertical dispersion of air pollutants [92]. At 6:00 pm, increased traffic begins during the evening rush hour. Higher Ta due to the inversion layer and the burning of large amounts of fuels such as oil, coal, and natural gas in the evening could produce profiles with the highest concentrations of outdoor HCHO.
A high concentration of TVOC was observed in a recently conducted study in Chengdu [93]. In the Wanxia nursing home, the highest indoor TVOCs concentration (0.401 mg/m³) was observed in summer, which was very close to the standard limit. This was mainly attributed to paint, glue, or panel furniture, which are known sources of TVOCs [24]. Here, the TVOC levels were lower than in residential buildings in the Terai region of northern India, where the indoor TVOC level was 0.90 mg/m³ [94]. Outdoor TVOCs concentration showed higher levels in spring and winter. It was noticed that the seasonal variation trend of outdoor TVOCs in northern India and northern China was conducive to the results of this study, where high TVOCs generally occur in winter and are usually more than double those in summer [94]. This can be attributed to relatively lower photochemical degradation in winter caused by OH radicals, infrequent rain showers, and increased biomass burning and fuel consumption [95,96,97]. Seasonal I/O ratios of TVOCs exceeded 1. Similarly, the I/O ratios of TVOCs in eighteen naturally ventilated dormitories at a certain university in China were higher than 1 [98]. A higher I/O ratio of TVOCs (1.945) was found in summer, which can be attributed to elevated Ta and RH in this season [99]. These phenomena were considered as a potential indication of insufficient ventilation, indicating the significant presence of indoor air pollution sources [85,100].
The annual mean indoor and outdoor PM concentrations were lower than the upper limit. Nevertheless, these values exceeded the recommendations of the World Health Organization (WHO) (AQG2021) of 15 mg/m³ of PM2.5 and 45 mg/m³ of PM10 by 2 to 1.55 times. This concentration of indoor PM has been found to pose a threat even at low doses, leading to chronic exposure and illness [81]. This suggests that, during a significant part of the day, elderly people are exposed to an environment that poses potential health risks. The side effects of PM should not only be viewed only as a result of its concentration, but also as a result of biological constituents, biological activity, and chemical characteristics [101]. However, current research almost always ignores these elements. In winter, the mean concentrations of both PM2.5 and PM10 in all monitored areas were almost doubled compared to those in summer, and the values exceeded the upper limit (1000 ppm). This can be attributed to elevated concentrations of PM in winter. In northern China, the use of combustion sources indoors or within urban areas, such as heating, cooking, and industrial emissions, was considered the most likely contributor to PM in the winter months [102]. In Chengdu, industrial and vehicle pollution were the main sources of PM [103]. During winter, the prevailing westerly or north-westerly winds and the complex and enclosed terrain hinder the formation of precipitation and wind, creating static meteorological conditions. This stagnant weather promotes the PM accumulation and the formation of secondary PM pollutants and reduces the scavenging efficiency of PM [104,105]. The I/O ratios of PM in residential buildings in China usually vary in the range of 0~5 [41]. The PM2.5 I/O ratio in the Wanxia nursing home ranges from 0.919 to 0.988 and is similar to Chen’s report [106], which indicated that natural ventilation can reduce indoor air pollution generated by outdoor sources by 5 to 20%. This also indicates that the buildings in the Wanxia nursing home are only able to minimally reduce infiltrating PM due to their building envelopes and natural ventilation. The PM2.5 I/O ratio here was much higher than the previously reported ratio ranging from 0.197 to 0.876 in residential buildings in the Yangtze River Delta [107] and Beijing [15], but was close to the ratio in six office buildings in Chengdu (0.97) [81]. It varies between cities depending on climate conditions, pollutant concentrations, and building envelopes and ventilation. In addition, the levels of PM infiltration from the outside were highest in summer compared to other seasons. In addition, considering that PM is the most important parameter in determining indoor air quality, this further implies that the IAQI in the nursing home was influenced by outdoor PM. In their hospital-based study, Chamseddine et al. [85] found that PM2.5 and PM10 have the most significant impact on IAQI.
Indoor CO2 levels were closely related to indoor Ta and RH. A study on residential and private daycare centers in Korea also observed the same variation trend in indoor CO2 levels affected by RH [88]. Indoor HCHO levels are positively correlated with Ta in winter and RH in summer. This result is slightly different from a previous report that stated that the emission rate of indoor HCHO was positively correlated with Ta and RH [26,108]. In addition, Jarnstrom et al. [86] reported a higher indoor HCHO concentration when RH was higher than 50%. In addition, indoor TVOCs concentration was negatively correlated with Ta in spring and summer and positively correlated with Ta in winter. TVOCs concentration was also positively correlated with RH. This finding differs from a previous study in which indoor TVOC emission rates increased with increasing Ta and RH [99].
The current study has some limitations that should be addressed in the future. One limitation is the small sample size wherein only one nursing home was monitored, although it is the largest private nursing home in Chengdu. Limited sampling sites do not allow for more general conclusions to be drawn. Another limitation is the performance of air monitoring during only one year. It was not possible to obtain a multi-year pattern of indoor air pollutants variation in nursing homes. More detailed research is needed in the future in order to investigate the spatial and temporal variations in indoor air quality in other types of nursing homes with multi-year follow-up, such as those with mechanical ventilation or en-suites.

5. Conclusions

Overall, the indoor air quality of the Wanxia nursing home is poor, showing low pollution levels in spring, summer, and autumn, and a moderate pollution level in winter. Sources of outdoor air pollutants play an important role in the indoor air quality of the analyzed nursing home. It was found that PM concentration played the most important part in determining IAQI values. Although the annual and 24h mean levels of indoor PM2.5 and PM10 were lower than the upper limit, the mean levels in winter were very close to or exceeded this limit. The ingress of PM from outdoor to indoor spaces was made evident in the extremely high correlation between indoor and outdoor PM levels in all seasons. This situation suggests that the elderly should adopt effective mitigation strategies to avoid exposure to indoor PM by reducing outdoor PM levels. It was found that the location of the nursing home is also very important. In terms of the annual mean PM values in Chengdu, PM levels in areas outside the third Ring Road were lower than those inside it [109]. Likewise, PM levels near large parks were also lower than in other places. Therefore, to control the exposure to PM, the focus needs to be on local sources of PM, such as traffic and various industrial processes. Due to this, the location of future nursing homes should be outside the third Ring Road or near large parks. Similarly, nursing homes should be located away from major traffic and industrial enterprises. Between 8:00 am and 10:00 am and 6:00 pm and 8:00 pm, windows or doors should be closed due to rush hours.
During winter and summer nights, the CO2 concentration was very close to or exceeded the standard limit (1000 ppm). From 8:00 pm to 4:00 am in spring and summer, the indoor TVOCs concentration was above the standard limit (0.45 mg/m³). Moreover, indoor levels of CO2 and TVOCs exceeded outdoor levels in all seasons. This can be attributed to poor ventilation and small bedrooms in the nursing home. Although indoor HCHO levels had a minimal impact on IAQI values in all seasons, prolonged exposure to HCHO and inadequate ventilation could adversely affect the health of the elderly. Therefore, natural ventilation in the Wanxia nursing home proved to be ineffective, especially after 8:00 pm. It is recommended to increase natural ventilation (with filtration) by opening windows and doors, optimize the ventilation systems in periods with less traffic (afternoon and night), and use mechanical ventilation instead of natural ventilation.

Author Contributions

Conceptualization, M.L.; methodology, M.L.; investigation, L.T.; data curation, Z.C.; writing—original draft preparation, H.Z.; writing—review and editing, H.Z.; funding acquisition, H.Z. and M.L. All authors have read and agreed to the published version of the manuscript.

Funding

This research was funded by the National Natural Science Foundation of China, Grant No. 31971716 and 32271945.

Data Availability Statement

The data presented in this study are available on request from the corresponding author.

Conflicts of Interest

The authors declare that they have no conflict of interest for this work. We declare that we have no commercial or associative interest that represents a conflict of interest in connection to this submitted work.

References

  1. Zhou, W.-Y.; Yang, W.-L.; Wan, W.-X.; Zhang, J.; Yang, H.-S.; Yang, H.; Xiao, H.; Deng, S.-H.; Shen, F.; Wang, Y.-J. The influences of industrial gross domestic product, urbanization rate, environmental investment, and coal consumption on industrial air pollutant emission in China. Environ. Ecol. Stat. 2018, 25, 429–442. [Google Scholar] [CrossRef]
  2. Lin, X.; Wang, D. Spatiotemporal evolution of urban air quality and socioeconomic driving forces in China. J. Geogr. Sci. 2016, 26, 1533–1549. [Google Scholar] [CrossRef]
  3. Lelieveld, J.; Pozzer, A.; Pöschl, U.; Fnais, M.; Haines, A.; Münzel, T. Loss of life expectancy from air pollution compared to other risk factors: A worldwide perspective. Cardiovasc. Res. 2020, 116, 1910–1917. [Google Scholar] [CrossRef] [PubMed]
  4. Mendes, A.; Papoila, A.L.; Carreiro-Martins, P.; Bonassi, S.; Caires, I.; Palmeiro, T.; Aguiar, L.; Pereira, C.; Neves, P.; Mendes, D.; et al. The impact of indoor air quality and contaminants on respiratory health of older people living in long-term care residences in Porto. Age Ageing 2016, 45, 136–142. [Google Scholar] [CrossRef]
  5. Jiménez, E.; Linares, C.; Martínez, D.; Díaz, J. Role of Saharan dust in the relationship between particulate matter and short-term daily mortality among the elderly in Madrid (Spain). Sci. Total Environ. 2010, 408, 5729–5736. [Google Scholar] [CrossRef]
  6. Li, Z.; Wen, Q.; Zhang, R. Sources, health effects and control strategies of indoor fine particulate matter (PM2.5): A review. Sci. Total Environ. 2017, 586, 610–622. [Google Scholar] [CrossRef]
  7. Wickliffe, J.K.; Stock, T.H.; Howard, J.L.; Frahm, E.; Simon-Friedt, B.R.; Montgomery, K.; Wilson, M.J.; Lichtveld, M.Y.; Harville, E. Increased long-term health risks attributable to select volatile organic compounds in residential indoor air in southeast Louisiana. Sci. Rep. 2020, 10, 21649. [Google Scholar] [CrossRef]
  8. Jones, J.; Stick, S.; Dingle, P.; Franklin, P. Spatial variability of particulates in homes: Implications for infant exposure. Sci. Total Environ. 2007, 376, 317–323. [Google Scholar] [CrossRef]
  9. GBD 2017 Risk Factor Collaborators. Global, regional, and national comparative risk assessment of 84 behavioural, environmental and occupational, and metabolic risks or clusters of risks for 195 countries and territories, 1990–2017: A systematic analysis for the Global Burden of Disease Study 2017. Lancet 2018, 392, 1923–1994. [Google Scholar]
  10. Jiménez, E.; Linares, C.; Rodríguez, L.; Bleda, M.; Díaz, J. Short-term impact of particulate matter (PM2.5) on daily mortality among the over-75 age group in Madrid (Spain). Sci. Total Environ. 2009, 407, 5486–5492. [Google Scholar] [CrossRef]
  11. Miller, K.A.; Siscovick, D.S.; Sheppard, L.; Shepherd, K.; Sullivan, J.H.; Anderson, G.L.; Kaufman, J.D. Long-Term Exposure to Air Pollution and Incidence of Cardiovascular Events in Women. N. Engl. J. Med. 2007, 356, 447–458. [Google Scholar] [CrossRef]
  12. Ballester, F.; Medina, S.; Boldo, E.; Goodman, P.; Neuberger, M.; Iñiguez, C.; Künzli, N.; Network, O.B.O.T.A. Reducing ambient levels of fine particulates could substantially improve health: A mortality impact assessment for 26 European cities. J. Epidemiol. Community Health 2008, 62, 98–105. [Google Scholar] [CrossRef]
  13. Medina, S.; Plasencia, A.; Ballester, F.; Mücke, H.G.; Schwartz, J.; Apheis Group. Apheis: Public health impact of PM10 in 19 European cities. J. Epidemiol. Community Health 2004, 58, 831–836. [Google Scholar] [CrossRef] [PubMed]
  14. Turner, M.C.; Krewski, D.; Pope, C.A., III; Chen, Y.; Gapstur, S.M.; Thun, M.J. Long-term ambient fine particulate matter air pollution and lung cancer in a large cohort of never-smokers. Am. J. Respir. Crit. Care Med. 2011, 184, 1374–1381. [Google Scholar] [CrossRef]
  15. Huang, L.; Pu, Z.; Li, M.; Sundell, J. Characterizing the Indoor-Outdoor Relationship of Fine Particulate Matter in Non-Heating Season for Urban Residences in Beijing. PLoS ONE 2015, 10, e0138559. [Google Scholar] [CrossRef]
  16. Xu, L.; Zhong, X.; Chen, F.; Ye, R.; Zhang, L.; Wu, X.; Deng, J.; Li, J.; Chen, F. Spatiotemporal disequilibrium and spillover effect of fine particulate matter across China. Sci. Total Environ. 2020, 704, 135422. [Google Scholar] [CrossRef] [PubMed]
  17. Ras, M.R.; Marcé, R.M.; Borrull, F. Volatile organic compounds in air at urban and industrial areas in the Tarragona region by thermal desorption and gas chromatography–mass spectrometry. Environ. Monit. Assess. 2010, 161, 389–402. [Google Scholar] [CrossRef] [PubMed]
  18. Safar, A.N.; Yassin, M.F.; Hamoda, M.F. Indoor and outdoor air concentrations of volatile organic compounds in schools within different urban areas. Int. J. Environ. Sci. Technol. 2018, 16, 2831–2838. [Google Scholar] [CrossRef]
  19. Lima, B.D.; Kautzmann, R.M.; da Silveira, F.R.; da Silva Civeira, M.; de Vargas, F.C.; Taffarel, S.R. Quantitative evaluation of total volatile organic compounds in urban and rural schools of southern Brazil. Environ. Monit. Assess 2020, 192, 634. [Google Scholar] [CrossRef]
  20. Hu, Y.; Xu, L.; Liang, W. A preliminary study on volatile organic compounds and odor in university dormitories: Situation, contribution, and correlation. Build. Simul. 2022, 16, 379–391. [Google Scholar] [CrossRef]
  21. Amodio, M.; Dambruoso, P.R.; de Gennaro, G.; de Gennaro, L.; Loiotile, A.D.; Marzocca, A.; Stasi, F.; Trizio, L.; Tutino, M. Indoor air quality (IAQ) assessment in a multistorey shopping mall by high-spatial-resolution monitoring of volatile organic compounds (VOC). Environ. Sci. Pollut. Res. 2014, 21, 13186–13195. [Google Scholar] [CrossRef]
  22. Natarajan, S.; Mukhopadhyay, K.; Thangaswamy, D.; Natarajan, A.; Chakraborty, D. Characterisation of Indoor Volatile Organic Compounds and Its Association with Respiratory Symptoms Among Children Living in Solid Fuel Using Households in Tamil Nadu, India. Mapan 2022, 37, 565–578. [Google Scholar] [CrossRef]
  23. Mozaffar, A.; Zhang, Y.-L. Atmospheric Volatile Organic Compounds (VOCs) in China: A Review. Curr. Pollut. Rep. 2020, 6, 250–263. [Google Scholar] [CrossRef]
  24. Chen, X.; Li, F.; Liu, C.; Yang, J.; Zhang, J.; Peng, C. Monitoring, Human Health Risk Assessment and Optimized Management for Typical Pollutants in Indoor Air from Random Families of University Staff, Wuhan City, China. Sustainability 2017, 9, 1115. [Google Scholar] [CrossRef]
  25. Zhang, L.; Wang, J.; Hu, X.; Zhou, J.; Zhao, M.; Zhang, J.; Bo, Y.; Huang, Y.; Zhang, Y. VOCs and PM concentrations in underground parking garages of the commercial center and high-rise residential buildings. Air Qual. Atmos. Health 2021, 14, 1117–1131. [Google Scholar] [CrossRef]
  26. Huang, S.; Wei, W.; Weschler, L.B.; Salthammer, T.; Kan, H.; Bu, Z.; Zhang, Y. Indoor formaldehyde concentrations in urban China: Preliminary study of some important influencing factors. Sci. Total Environ. 2017, 590–591, 394–405. [Google Scholar] [CrossRef]
  27. Sun, J.; Wang, J.; Yang, J.; Shi, X.; Li, S.; Cheng, J.; Chen, S.; Sun, K.; Wu, Y. Association between maternal exposure to indoor air pollution and offspring congenital heart disease: A case–control study in East China. BMC Public Health 2022, 22, 767. [Google Scholar] [CrossRef]
  28. Sim, S.; Jeong, S.; Park, H.; Park, C.; Kwak, K.-H.; Lee, S.-B.; Kim, C.H.; Lee, S.; Chang, J.S.; Kang, H.; et al. Co-benefit potential of urban CO2 and air quality monitoring: A study on the first mobile campaign and building monitoring experiments in Seoul during the winter. Atmos. Pollut. Res. 2020, 11, 1963–1970. [Google Scholar] [CrossRef]
  29. Bares, R.; Lin, J.C.; Hoch, S.W.; Baasandorj, M.; Mendoza, D.L.; Fasoli, B.; Mitchell, L.; Catharine, D.; Stephens, B.B. The Wintertime Covariation of CO2 and Criteria Pollutants in an Urban Valley of the Western United States. J. Geophys. Res. Atmos. 2018, 123, 2684–2703. [Google Scholar] [CrossRef]
  30. Lin, J.C.; Mitchell, L.; Crosman, E.; Mendoza, D.L.; Buchert, M.; Bares, R.; Fasoli, B.; Bowling, D.R.; Pataki, D.; Catharine, D.; et al. CO2 and Carbon Emissions from Cities: Linkages to Air Quality, Socioeconomic Activity, and Stakeholders in the Salt Lake City Urban Area. Bull. Am. Meteorol. Soc. 2018, 99, 2325–2339. [Google Scholar] [CrossRef]
  31. Wilkey, J.; Kelly, K.; Jaramillo, I.C.; Spinti, J.; Ring, T.; Hogue, M.; Pasqualini, D. Predicting emissions from oil and gas operations in the Uinta Basin, Utah. J. Air Waste Manag. Assoc. 2016, 66, 528–545. [Google Scholar] [CrossRef] [PubMed]
  32. Bekö, G.; Lund, T.; Nors, F.; Toftum, J.; Clausen, G. Ventilation rates in the bedrooms of 500 Danish children. Build. Environ. 2010, 45, 2289–2295. [Google Scholar] [CrossRef]
  33. López, L.; Dessì, P.; Cabrera-Codony, A.; Rocha-Melogno, L.; Kraakman, B.; Naddeo, V.; Balaguer, M.D.; Puig, S. CO2 in indoor environments: From environmental and health risk to potential renewable carbon source. Sci. Total Environ. 2023, 856 Pt 2, 159088. [Google Scholar] [CrossRef] [PubMed]
  34. Morawska, L.; Allen, J.; Bahnfleth, W.; Bluyssen, P.M.; Boerstra, A.; Buonanno, G.; Cao, J.; Dancer, S.; Floto, A.; Franchimon, F.; et al. A paradigm shift to combat indoor respiratory infection. Science 2021, 372, 689–691. [Google Scholar] [CrossRef] [PubMed]
  35. Duhirwe, P.N.; Ngarambe, J.; Yun, G.Y. Energy-efficient virtual sensor-based deep reinforcement learning control of indoor CO2 in a kindergarten. Front. Archit. Res. 2022, 12, 394–409. [Google Scholar] [CrossRef]
  36. Azuma, K.; Kagi, N.; Yanagi, U.; Osawa, H. Effects of low-level inhalation exposure to carbon dioxide in indoor environments: A short review on human health and psychomotor performance. Environ. Int. 2018, 121 Pt 1, 51–56. [Google Scholar] [CrossRef]
  37. Caddick, Z.A.; Gregory, K.; Arsintescu, L.; Flynn-Evans, E.E. A review of the environmental parameters necessary for an optimal sleep environment. Build. Environ. 2018, 132, 11–20. [Google Scholar] [CrossRef]
  38. Shin, M.-S.; Rhee, K.-N.; Lee, E.-T.; Jung, G.-J. Performance evaluation of CO2-based ventilation control to reduce CO2 concentration and condensation risk in residential buildings. Build. Environ. 2018, 142, 451–463. [Google Scholar] [CrossRef]
  39. Zhang, X.; Wargocki, P.; Lian, Z. Physiological responses during exposure to carbon dioxide and bioeffluents at levels typically occurring indoors. Indoor Air 2017, 27, 65–77. [Google Scholar] [CrossRef]
  40. Zhao, L.; Liu, J.; Ren, J. Impact of various ventilation modes on IAQ and energy consumption in Chinese dwellings: First long-term monitoring study in Tianjin, China. Build. Environ. 2018, 143, 99–106. [Google Scholar] [CrossRef]
  41. Chen, C.; Zhao, B. Review of relationship between indoor and outdoor particles: I/O ratio, infiltration factor and penetration factor. Atmos. Environ. 2011, 45, 275–288. [Google Scholar] [CrossRef]
  42. Hui, P.-S.; Mui, K.-W.; Wong, L.-T. Influence of indoor air quality (IAQ) objectives on air-conditioned offices in Hong Kong. Environ. Monit. Assess. 2008, 144, 315–322. [Google Scholar] [CrossRef] [PubMed]
  43. Palmisani, J.; Di Gilio, A.; Viana, M.; de Gennaro, G.; Ferro, A. Indoor air quality evaluation in oncology units at two European hospitals: Low-cost sensors for TVOCs, PM2.5 and CO2 real-time monitoring. Build. Environ. 2021, 205, 108237. [Google Scholar] [CrossRef]
  44. Güneş, G.; Yalçin, N.; Çolaklar, H. Investigation of indoor air quality in university libraries in terms of gaseous and particulate pollutants in Bartin, Turkey. Environ. Monit. Assess. 2022, 194, 200. [Google Scholar] [CrossRef]
  45. Zhang, Y.; Hopke, P.K.; Mandin, C. Handbook of Indoor Air Quality; Springer: Singapore, 2022. [Google Scholar]
  46. Jung, C.-C.; Hsu, N.-Y.; Su, H.-J. Temporal and spatial variations in IAQ and its association with building characteristics and human activities in tropical and subtropical areas. Build. Environ. 2019, 163, 106249. [Google Scholar] [CrossRef]
  47. Abdel-Salam, M.M. Indoor exposure of elderly to air pollutants in residential buildings in Alexandria, Egypt. Build. Environ. 2022, 219, 109221. [Google Scholar] [CrossRef]
  48. Zhou, Z.; Wang, R. Evaluation of Four Office Buildings’ Indoor Air Quality Using the Decibel Concept in Guilin. In Proceedings of the 8th International Symposium on Heating, Ventilation and Air Conditioning, Chengdu, China, 30 July 2014; pp. 421–428. [Google Scholar]
  49. Kim, J.; Jang, M.; Choi, K.; Kim, K. Perception of indoor air quality (IAQ) by workers in underground shopping centers in relation to sick-building syndrome (SBS) and store type: A cross-sectional study in Korea. BMC Public Health 2019, 19, 632. [Google Scholar] [CrossRef]
  50. Zhao, L.; Zhou, H.; Jin, Y.; Li, Z. Experimental and numerical investigation of TVOC concentrations and ventilation dilution in enclosed train cabin. Build. Simul. 2022, 15, 831–844. [Google Scholar] [CrossRef]
  51. Liu, H.; Huang, M.; Kim, J.T.; Yoo, C. Adaptive neuro-fuzzy inference system based faulty sensor monitoring of indoor air quality in a subway station. Korean J. Chem. Eng. 2013, 30, 528–539. [Google Scholar] [CrossRef]
  52. Hwang, S.H.; Park, W.M. Indoor air quality assessment with respect to culturable airborne bacteria, total volatile organic compounds, formaldehyde, PM10, CO2, NO2, and O3 in underground subway stations and parking lots. Air Qual. Atmos. Health 2019, 12, 435–441. [Google Scholar] [CrossRef]
  53. Alaidroos, A.; Almaimani, A.; Krarti, M.; Dahlan, A.; Maddah, R. Evaluation of the performance of demand control ventilation system for school buildings located in the hot climate of Saudi Arabia. Build. Simul. 2021, 15, 1067–1082. [Google Scholar] [CrossRef]
  54. Goyal, R.; Khare, M. Indoor air quality modeling for PM10, PM2.5, and PM1.0 in naturally ventilated classrooms of an urban Indian school building. Environ. Monit. Assess. 2011, 176, 501–516. [Google Scholar] [CrossRef] [PubMed]
  55. Lin, S.; Lu, Y.; Lin, Z.; Romeiko, X.X.; Marks, T.; Zhang, W.; Khwaja, H.A.; Dong, G.; Thurston, G. Identifying and evaluating school environmental health indicators. Environ. Sci. Pollut. Res. 2020, 27, 16624–16639. [Google Scholar] [CrossRef] [PubMed]
  56. Zaman, S.U.; Yesmin, M.; Pavel, R.S.; Jeba, F.; Salam, A. Indoor air quality indicators and toxicity potential at the hospitals’ environment in Dhaka, Bangladesh. Environ. Sci. Pollut. Res. 2021, 28, 37727–37740. [Google Scholar] [CrossRef]
  57. Phongphetkul, P.; Mangkang, S.; Praditsmanont, A.; Intrachooto, S.; Choruengwiwat, J.; Treesubsuntorn, C.; Thiravetyan, P. Evaluation of indoor air quality in high-rise residential buildings in Bangkok and factor analysis. Environ. Monit. Assess. 2021, 193, 23. [Google Scholar] [CrossRef]
  58. Algarni, S.; Khan, R.A.; Khan, N.A.; Mubarak, N.M. Particulate matter concentration and health risk assessment for a residential building during COVID-19 pandemic in Abha, Saudi Arabia. Environ. Sci. Pollut. Res. 2021, 28, 65822–65831. [Google Scholar] [CrossRef]
  59. Guo, Y.; Yang, L.; Zhu, L.; Wan, Y.; Zhang, S.; Zhang, J. Willingness and associated factors of working with older people among undergraduate nursing students in China: A cross-sectional study. BMC Nurs. 2021, 20, 113. [Google Scholar] [CrossRef]
  60. Zhang, B.; He, S.; Chen, X.; Jiang, L. Determining the spatial distribution of nursing homes in China: A spatial heterogeneity analysis. J. Hous. Built Environ. 2022, 37, 1769–1788. [Google Scholar] [CrossRef]
  61. Zong, H.; Wang, J.; Zhou, T.; Sun, J.; Chen, X. The Influence of Transient Changes in Indoor and Outdoor Thermal Comfort on the Use of Outdoor Space by Older Adults in the Nursing Home. Buildings 2022, 12, 905. [Google Scholar] [CrossRef]
  62. Sun, C.; Yu, Y.; Li, X.; Cui, Y.; Ding, Y.; Zhu, S.; Li, X.; Chen, S.; Zhou, R. The factors of adaptation to nursing homes in mainland China: A cross-sectional study. BMC Geriatr. 2020, 20, 517. [Google Scholar] [CrossRef]
  63. Shahid, Z.; Kalayanamitra, R.; McClafferty, B.; Kepko, D.; Ramgobin, D.; Patel, R.; Aggarwal, C.; Vunnam, R.; Sahu, N.; Bhatt, D.; et al. COVID-19 and Older Adults: What We Know. J. Am. Geriatr. Soc. 2020, 68, 926–929. [Google Scholar] [CrossRef] [PubMed]
  64. Kung, P.Y.; Wang, Y.T.; Chiu, J.C.; Hsu, Y.C.; Wu, T.N.; Shen, Y.H.; Wen, S.B. Comparison of Indoor Air Quality Measurement by Using Direct Detection Apparatus and Standard Methods. Adv. Mater. Res. 2011, 230-232, 905–909. [Google Scholar]
  65. Sung, W.-T.; Hsiao, S.-J. Building an indoor air quality monitoring system based on the architecture of the Internet of Things. EURASIP J. Wirel. Commun. Netw. 2021, 2021, 153. [Google Scholar] [CrossRef]
  66. Li, S.; Li, P.; Fan, L.; Wang, X.L.; Wu, Y.P.; Tian, L.J.; Li, X.R.; Li, Y.M.; Wang, J.Y. Surveillance and evaluation on indoor chemical pollutants in dwelling in two urban areas of a city. Bull. Dis. Control Prev. 2021, 36, 26–29. [Google Scholar]
  67. GB50325-2020; Standard for Indoor Environmental Pollution Control of Civil Building Engineering. Ministry of Housing and Urban-Rural Development: Beijing, China, 2020.
  68. GB3095-2012; Ambient Air Quality Standards. China-Environmental-Science-Press: Beijing, China, 2012.
  69. GB/T18883-2022; Standard for Indoor Air Quality. State Administration for Market Regulation: Beijing, China, 2022.
  70. Tang, X.; Bai, Y.; Duong, A.; Smith, M.T.; Li, L.; Zhang, L. Formaldehyde in China: Production, consumption, exposure levels, and health effects. Environ. Int. 2009, 35, 1210–1224. [Google Scholar] [CrossRef]
  71. OEHHA. 2008. Available online: http://www.oehha.ca.gov/air/allrels.html (accessed on 6 August 2008).
  72. Kaewrat, J.; Janta, R.; Sichum, S.; Kanabkaew, T. Indoor Air Quality and Human Health Risk Assessment in the Open-Air Classroom. Sustainability 2021, 13, 8302. [Google Scholar] [CrossRef]
  73. Cao, J.; Huang, H.; Lee, S.; Chow, J.C.; Zou, C.; Ho, K.; Watson, J.G. Indoor/Outdoor Relationships for Organic and Elemental Carbon in PM2.5 at Residential Homes in Guangzhou, China. Aerosol Air Qual. Res. 2012, 12, 902–910. [Google Scholar] [CrossRef]
  74. Imasu, R.; Tanabe, Y. Diurnal and Seasonal Variations of Carbon Dioxide (CO2) Concentration in Urban, Suburban, and Rural Areas around Tokyo. Atmosphere 2018, 9, 367. [Google Scholar] [CrossRef]
  75. Matese, A.; Gioli, B.; Vaccari, F.P.; Zaldei, A.; Miglietta, F. Carbon Dioxide Emissions of the City Center of Firenze, Italy: Measurement, Evaluation, and Source Partitioning. J. Appl. Meteorol. Clim. 2009, 48, 1940–1947. [Google Scholar] [CrossRef]
  76. Geng, Y.; Lin, B.; Yu, J.; Zhou, H.; Ji, W.; Chen, H.; Zhang, Z.; Zhu, Y. Indoor environmental quality of green office buildings in China: Large-scale and long-term measurement. Build. Environ. 2019, 150, 266–280. [Google Scholar] [CrossRef]
  77. George, K.; Ziska, L.; Bunce, J.; Quebedeaux, B. Elevated atmospheric CO2 concentration and temperature across an urban–rural transect. Atmos. Environ. 2007, 41, 7654–7665. [Google Scholar] [CrossRef]
  78. Ward, H.; Kotthaus, S.; Grimmond, C.; Bjorkegren, A.; Wilkinson, M.; Morrison, W.; Evans, J.; Morison, J.; Iamarino, M. Effects of urban density on carbon dioxide exchanges: Observations of dense urban, suburban and woodland areas of southern England. Environ. Pollut. 2015, 198, 186–200. [Google Scholar] [CrossRef] [PubMed]
  79. Coutts, A.M.; Beringer, J.; Tapper, N.J. Characteristics influencing the variability of urban CO2 fluxes in Melbourne, Australia. Atmos. Environ. 2007, 41, 51–62. [Google Scholar] [CrossRef]
  80. Allen, J.G.; MacNaughton, P.; Satish, U.; Santanam, S.; Vallarino, J.; Spengler, J.D. Associations of Cognitive Function Scores with Carbon Dioxide, Ventilation, and Volatile Organic Compound Exposures in Office Workers: A Controlled Exposure Study of Green and Conventional Office Environments. Environ. Health Perspect. 2016, 124, 805–812. [Google Scholar] [CrossRef]
  81. Qiu, Y.; Wang, Y.; Tang, Y. Investigation of indoor air quality in six office buildings in Chengdu, China based on field measurements. Build. Simul. 2020, 13, 1009–1020. [Google Scholar] [CrossRef]
  82. Almeida-Silva, M.; Wolterbeek, H.; Almeida, S. Elderly exposure to indoor air pollutants. Atmos. Environ. 2014, 85, 54–63. [Google Scholar] [CrossRef]
  83. Urban, O.; Hrstka, M.; Holub, P.; Veselá, B.; Večeřová, K.; Novotná, K.; Grace, J.; Klem, K. Interactive effects of ultraviolet radiation and elevated CO2 concentration on photosynthetic characteristics of European beech saplings during the vegetation season. Plant Physiol. Biochem. 2019, 134, 20–30. [Google Scholar] [CrossRef]
  84. de Blas, M.; Navazo, M.; Alonso, L.; Durana, N.; Gomez, M.C.; Iza, J. Simultaneous indoor and outdoor on-line hourly monitoring of atmospheric volatile organic compounds in an urban building. The role of inside and outside sources. Sci. Total Environ. 2012, 426, 327–335. [Google Scholar] [CrossRef]
  85. Chamseddine, A.; Alameddine, I.; Hatzopoulou, M.; El-Fadel, M. Seasonal variation of air quality in hospitals with indoor–outdoor correlations. Build. Environ. 2019, 148, 689–700. [Google Scholar] [CrossRef]
  86. Jarnstrom, H.; Saarela, K.; Kalliokoski, P.; Pasanen, A.-L. Reference values for indoor air pollutant concentrations in new, residential buildings in Finland. Atmos. Environ. 2006, 40, 7178–7191. [Google Scholar] [CrossRef]
  87. Zhang, H.; Zheng, Z.; Yu, T.; Liu, C.; Qian, H.; Li, J. Seasonal and diurnal patterns of outdoor formaldehyde and impacts on indoor environments and health. Environ. Res. 2022, 205, 112550. [Google Scholar] [CrossRef] [PubMed]
  88. Hwang, S.H.; Lee, G.B.; Kim, I.S.; Park, W.M. Formaldehyde and carbon dioxide air concentrations and their relationship with indoor environmental factors in daycare centers. J. Air Waste Manag. Assoc. 2017, 67, 306–312. [Google Scholar] [CrossRef]
  89. Liu, C.; Miao, X.; Li, J. Outdoor formaldehyde matters and substantially impacts indoor formaldehyde concentrations. Build. Environ. 2019, 158, 145–150. [Google Scholar] [CrossRef]
  90. Chen, W.; Mendell, M.; Li, N.; Kumagai, K. Formaldehyde emissions from seams and cut edges of laminate flooring: Implications for emission testing protocols and exposure estimation. Build. Environ. 2018, 143, 652–660. [Google Scholar] [CrossRef]
  91. de Blas, M.; Ibáñez, P.; García, J.A.; Gómez, M.C.; Navazo, M.; Alonso, L.; Durana, N.; Iza, J.; Gangoiti, G.; de Cámara, E.S. Summertime high resolution variability of atmospheric formaldehyde and non-methane volatile organic compounds in a rural background area. Sci. Total Environ. 2019, 647, 862–877. [Google Scholar] [CrossRef]
  92. Brasseur, G.P.; Jacob, D.J. Modeling of Atmospheric Chemistry; Cambridge University Press: New York, NY, USA, 2017. [Google Scholar]
  93. Song, M.; Tan, Q.; Feng, M.; Qu, Y.; Liu, X.; An, J.; Zhang, Y. Source Apportionment and Secondary Transformation of Atmospheric Nonmethane Hydrocarbons in Chengdu, Southwest China. J. Geophys. Res. Atmos. 2018, 123, 9741–9763. [Google Scholar] [CrossRef]
  94. Masih, A.; Lall, A.S. Total Volatile Organic Compounds (TVOCs) in Indoor and outdoor Urban Atmospheres at a Terai Region of Northern India. Glob. J. Sci. Front. Res. H Environ. Earth Sci. 2016, 16, 059999. [Google Scholar]
  95. Wu, S.; Tang, G.; Wang, Y.; Mai, R.; Yao, D.; Kang, Y.; Wang, Q.; Wang, Y. Vertical Evolution of Boundary Layer Volatile Organic Compounds in Summer over the North China Plain and the Differences with Winter. Adv. Atmos. Sci. 2021, 38, 1165–1176. [Google Scholar] [CrossRef]
  96. Sun, J.; Shen, Z.; Zhang, Y.; Dai, W.; He, K.; Xu, H.; Zhang, Z.; Cui, L.; Li, X.; Huang, Y.; et al. Profiles and Source Apportionment of Nonmethane Volatile Organic Compounds in Winter and Summer in Xi’an, China, based on the Hybrid Environmental Receptor Model. Adv. Atmos. Sci. 2020, 38, 116–131. [Google Scholar] [CrossRef]
  97. Na, K.; Moon, K.-C.; Kim, Y.P. Source contribution to aromatic VOC concentration and ozone formation potential in the atmosphere of Seoul. Atmos. Environ. 2005, 39, 5517–5524. [Google Scholar] [CrossRef]
  98. Wang, L.; Luo, M.; Wang, B.; Huo, M.; Bai, Y.; Liu, Z.; Liang, B. Indoor and outdoor air quality investigation at dormitory in the university in Beijing, China in the fall. In Proceedings of the 5th International Symposium on Heating, Ventilating and Air Conditioning, Beijing, China, 7–8 September 2007; Volume I–II, pp. 410–416. [Google Scholar]
  99. Bellis, H. Material emission rates: Literature review, and the impact of indoor air temperature and relative humidity. Build. Environ. 1998, 33, 261–277. [Google Scholar]
  100. Sahu, V.; Gurjar, B.R. Spatial and seasonal variation of air quality in different microenvironments of a technical university in India. Build. Environ. 2020, 185, 107310. [Google Scholar] [CrossRef]
  101. Bhat, M.A.; Eraslan, F.N.; Awad, A.; Malkoç, S.; Üzmez, Ö.; Döğeroğlu, T.; Gaga, E.O. Investigation of indoor and outdoor air quality in a university campus during COVID-19 lock down period. Build. Environ. 2022, 219, 109176. [Google Scholar] [CrossRef] [PubMed]
  102. Gu, J.; Bai, Z.; Li, W.; Wu, L.; Liu, A.; Dong, H.; Xie, Y. Chemical composition of PM2.5 during winter in Tianjin, China. Particuology 2011, 9, 215–221. [Google Scholar]
  103. Xu, Y.; Xue, W.; Lei, Y.; Zhao, Y.; Cheng, S.; Ren, Z.; Huang, Q. Impact of Meteorological Conditions on PM2.5 Pollution in China during Winter. Atmosphere 2018, 9, 429. [Google Scholar] [CrossRef]
  104. Tao, J.; Cao, J.-J.; Zhang, R.-J.; Zhu, L.; Zhang, T.; Shi, S.; Chan, C.-Y. Reconstructed light extinction coefficients using chemical compositions of PM2.5 in winter in Urban Guangzhou, China. Adv. Atmos. Sci. 2012, 29, 359–368. [Google Scholar] [CrossRef]
  105. Liao, T.; Wang, S.; Ai, J.; Gui, K.; Duan, B.; Zhao, Q.; Zhang, X.; Jiang, W.; Sun, Y. Heavy pollution episodes, transport pathways and potential sources of PM(2.5) during the winter of 2013 in Chengdu (China). Sci. Total Environ. 2017, 584–585, 1056–1065. [Google Scholar]
  106. Chen, J.; Brager, G.S.; Augenbroe, G.; Song, X. Impact of outdoor air quality on the natural ventilation usage of commercial buildings in the US. Appl. Energy 2019, 235, 673–684. [Google Scholar] [CrossRef]
  107. Wang, F.; Meng, D.; Li, X.; Tan, J. Indoor-outdoor relationships of PM2.5 in four residential dwellings in winter in the Yangtze River Delta, China. Environ. Pollut. 2016, 215, 280–289. [Google Scholar] [CrossRef]
  108. Huang, S.; Xiong, J.; Zhang, Y. Impact of Temperature on the Ratio of Initial Emittable Concentration to Total Concentration for Formaldehyde in Building Materials: Theoretical Correlation and Validation. Environ. Sci. Technol. 2015, 49, 1537–1544. [Google Scholar] [CrossRef]
  109. Zhu, X.; Yang, S. Research and analysis of air quality data in Chengdu city. Electron. World 2020, 17–18. [Google Scholar]
Figure 1. Spatial layout of measurement sites.
Buildings 13 02135 g001
Figure 2. Functional spaces of Wanxia nursing home. (i) Bedroom. (ii) Public corridor. (iii) Road space. (iv) Garden space.
Buildings 13 02135 g002
Figure 3. Comparison of annual mean indoor and outdoor air pollutant levels.
Buildings 13 02135 g003
Figure 4. The 24 h variation in indoor and outdoor air pollutant levels.
Buildings 13 02135 g004aBuildings 13 02135 g004b
Figure 5. Linear correlations between indoor and outdoor air pollutant levels.
Buildings 13 02135 g005
Table 1. Bedroom parameters.
Size (m) (Length × Width × Height)Number
Bedroom6.3 × 6.0 × 3.31
Door1.2 × 2.41
Window1.0 × 1.53
Beds2.0 × 1.24
FurnitureTin wardrobe, TV stand and wooden chairs
Table 2. Sensor characteristics and air pollutants exposure limits.
InstrumentParameterOperationalAccuracyCircumstance Demands
Kestrel 5500Ta−29~70 °C0.1 °C−30~80 °C
RH0~100%1%
SMART126SPM2.50~999 μg/m31 μg/m30–50 °C
0~100% RH
PM10
LI-830CO20~20,000 ppm3%0~45 °C
90~100% RH
SMART128SHCHO0~3.000 mg/m30.001 mg/m3
TVOCs0~9.999 mg/m30.001 mg/m3
Table 3. Seasonal concentrations of indoor and outdoor air pollutants.
Air PollutantsSpringSummerAutumnWinter
BedroomCorridorRoadGardenBedroomCorridorRoadGardenBedroomCorridorRoadGardenBedroomCorridorRoadGarden
CO2 (ppm)Mean526.4 b468.4 a451.2 a453.2 a623.4 b497.3 a484.9 a487.0 a563.6 b475.3 a463.5 a466.1 a665.7 b536.5 a504.0 a475.2 a
Max1264.5855.0875.5893.51302.1895.4872.0743.21016.1941.8900.0919.31368.4900.6934.6963.4
Min400.0400.0400.0400.0400.8400.0400.0400.0400.2400.0400.0400.0405.3404.2403.8402.4
HCHO (mg/m³)Mean0.030 a0.037 a0.037 a0.037 a0.034 c0.030 b0.025 a0.023 a0.013 a0.017 b0.018 b0.018 b0.019 a0.017 a0.026 b0.024 b
Max0.590.190.090.110.570.080.080.050.460.090.130.0660.210.120.160.11
Min0.0120.0060.0010.0010.0360.0010.0010.0010.0060.0010.0010.0010.0050.0060.0060.002
TVOCs (mg/m³)Mean0.398 b0.293 ab0.292 ab0.279 a0.401 b0.231 a0.202 a0.275 a0.191 b0.157 a0.147 a0.147 a0.295 b0.305 b0.286 ab0.252 a
Max2.460.510.580.491.8350.550.420.571.010.550.560.591.6550.600.570.52
Min0.0290.0010.0050.0010.00850.0010.0010.0010.0070.0040.0070.0020.0060.0010.0060.014
PM10 (μg/m3)Mean51.1 a56.4 b59.8 bc64.2 d49.9 a49.9 a50.9 a52.3 a54.7 a69.6 b69. 7 b69.1 b108.4 b100.0 a99.7 a97.3 a
Max142.1122.2132.5127.5135.7145.0146.4145.0248.3285.2288.8283.6238.9219.8226.8230.0
Min5.54.04.04.03.55.05.05.01.592.02.02.025.0532.632.434.8
PM2.5 (μg/m3)Mean29.9 a30.7 ab32.7 ab35.2 b33.8 a34.0 a34.3 a34.6 a34.1 a37.3 b37.2 b37.4 b62.6 a64.2 b65.5 b65.0 b
Max118.0074.3591.3357.3696.2495.6495.0589.22149.93144.82146.88139.61137.25144.6145.8141.0
Min5.63.04.03.03.34.87.74.82.31.01.01.020.3324.425.423.4
Values followed by different letters indicate a statistically significant difference between treatment groups at p ≤ 0.05 (5%) according to one-way ANOVA test followed by Duncan’s post hoc test. The common letters indicate no significant difference between groups.
Table 4. Individual air quality index of indoor air pollutants and seasonal IAQI.
Indoor Air PollutantsSpringSummerAutumnWinterMean
Individual air Quality IndexCO20.580.630.570.660.61
HCHO0.390.430.160.240.31
TVOCs0.660.800.380.610.61
PM101.041.070.912.251.32
PM2.50.850.970.981.871.17
Seasonal IAQI0.870.920.771.591.04
Table 5. Pearson correlation analysis between indoor and outdoor air pollutant concentrations.
Air PollutantsSpringI/O RatioSummerI/O ratioAutumnI/O RatioWinterI/O Ratio
CO2 concentration0.985 **1.139 ab0.989 **1.245 bc0.997 **1.118 a0.834 **1.303 c
HCHO concentration0.996 **0.882 b0.725 **1.303 c−0.0220.728 a0.941 **0.860 b
TVOCs concentration0.953 **1.812 b 0.929 **1.945 b0.434 *1.294 a0.983 **1.039 a
PM10 concentration0.894 **0.856 c0.936 **0.982 b0.985 **0.788 d0.985 **1.097 a
PM2.5 concentration0.942 **0.919 a0.560 **0.988 a0.960 **0.918 a0.986 **0.965 a
Values followed by different letters indicate a statistically significant difference between treatment groups at p ≤ 0.05 (5%) according to one-way ANOVA test followed by Duncan’s post hoc test. The common letters indicate no significant difference between groups. All values followed by * show a significant correlation; by ** shows an extremely significant correlation.
Table 6. Pearson correlation between indoor air pollutant concentrations and microclimate parameters.
Indoor Air Pollutant LevelsSpringSummerAutumnWinter
TaRHTaRHTaRHTaRH
CO2−0.796 **0.741 **−0.602 **0.666 **−0.540 **0.781 **0.370 *0.466 *
HCHO−0.3700.391−0.2200.455 *0.167−0.1140.633 **0.361
TVOCs−0.445 *0.416 *−0.423 *0.657 **−0.1790.3450.454 *0.525 **
PM100.3530.3340.410 *−0.628 **−0.0120.020−0.270−0.012
PM2.5−0.231−0.295−0.341 *−0.487 *−0.417 *0.502 *0.599 **0.504 *
All values followed by * are significantly different at p ≤ 0.05 and followed by ** are significantly different at p ≤ 0.01 according to one-way ANOVA test followed by Duncan’s post hoc test.
Disclaimer/Publisher’s Note: The statements, opinions and data contained in all publications are solely those of the individual author(s) and contributor(s) and not of MDPI and/or the editor(s). MDPI and/or the editor(s) disclaim responsibility for any injury to people or property resulting from any ideas, methods, instructions or products referred to in the content.

