
How Building Energy Use Reacted to Variable Occupancy Pre- and Post- COVID-19 Pandemic—Sensitivity Analysis of 35 Commercial Buildings in Canada


Abstract
:1. Introduction
2. Literature Review

| Country | Short-Term Deviation (1–6 Months) | ||
|---|---|---|---|
| Country-Wide | Commercial | Residential | |
| India | −20 to −30% [5] | ||
| Spain | −13.5% [6], −25% [17] | ||
| Italy | −17.7% [17], −25% [6] | ||
| Belgium | −15.6 [17] | ||
| United Kingdom | −14.2 [17] | ||
| Netherlands | −11.6% [17] | ||
| Sweden | +2.1% [17] | ||
| Poland | −15 to −23% [22] | ||
| U.S. | −12% (except Florida) [26] | −9% (commercial), −11% (industrial) [12] | +6% [12] |
| Brazil | −3 to −19% [18] | ||
| Canada | −5% to −16% [24] | −10% [10] | |
| Kuwait | −17.6% [21] | ||
Research Gaps and Objectives
- Analyze the energy performance of 35 commercial smart buildings for 2 full years following the COVID-19 pandemic lockdown order on 16 March 2020, where 3 energy types are addressed (electricity (lighting, plug loads, and fans), district heating (steam or high temperature hot water), and district cooling (chilled water));
- Use change point model analysis to understand the heating and cooling load characteristics of buildings during the unoccupied period;
- Perform a black-box sensitivity analysis on the effects of occupancy levels on electricity usage, taking the COVID-19 stay-home period as a reference for electricity performance with no occupancy, and the pre-COVID period as a reference for business-as-usual electrical performance;
- Propose electricity usage scenarios for future hybrid work postures.
3. Materials and Methods
3.1. Low-Occupancy Energy Usage Data Exploration
- Electricity: changes in annual electricity usage varied between −35% and +48% in PY1 and between −38% and +62% in PY2. Out of 35 buildings, pandemic-related annual reductions were observed in 26 buildings in PY1 and 21 buildings PY2. The mean change percentage in annual electricity usage is −4.8% and −4.1%, while the median change percentage is −7% and −5% for PY1 and PY2, respectively.
- Steam/HTHW: a wide range of post-pandemic onset behavior is observed, where weather-normalized changes in annual steam/HTHW usage varied between −67% and +90% in PY1 and between −69% and +134% in PY2. Pandemic-related annual reductions were observed in 56% and 44% of buildings in PY1 and PY2, respectively, indicating that nearly half of the building stock increased its heating loads during the pandemic, despite the fact that these buildings were either unoccupied or had restricted occupancy. The mean change percentage in annual weather-normalized steam/HTHW usage is −2.2% and +13.4%, while the median change percentage is −6% and +3% for PY1 and PY2, respectively.
- Chilled water: weather-normalized changes in annual chilled water usage varied between −100% and +310% in PY1 and between −100% and +91% in PY2. Pandemic-related annual reductions were observed in 71% and 68% of the building stock in PY1 and PY2, respectively. The mean change percentage in annual weather-normalized chilled water usage is −19.3% and −29.9%, while the median change percentage is −34% and −30% for PY1 and PY2, respectively.
3.2. Predicting Occupancy-Driven Electricity EUI in the Absence of Occupancy Data
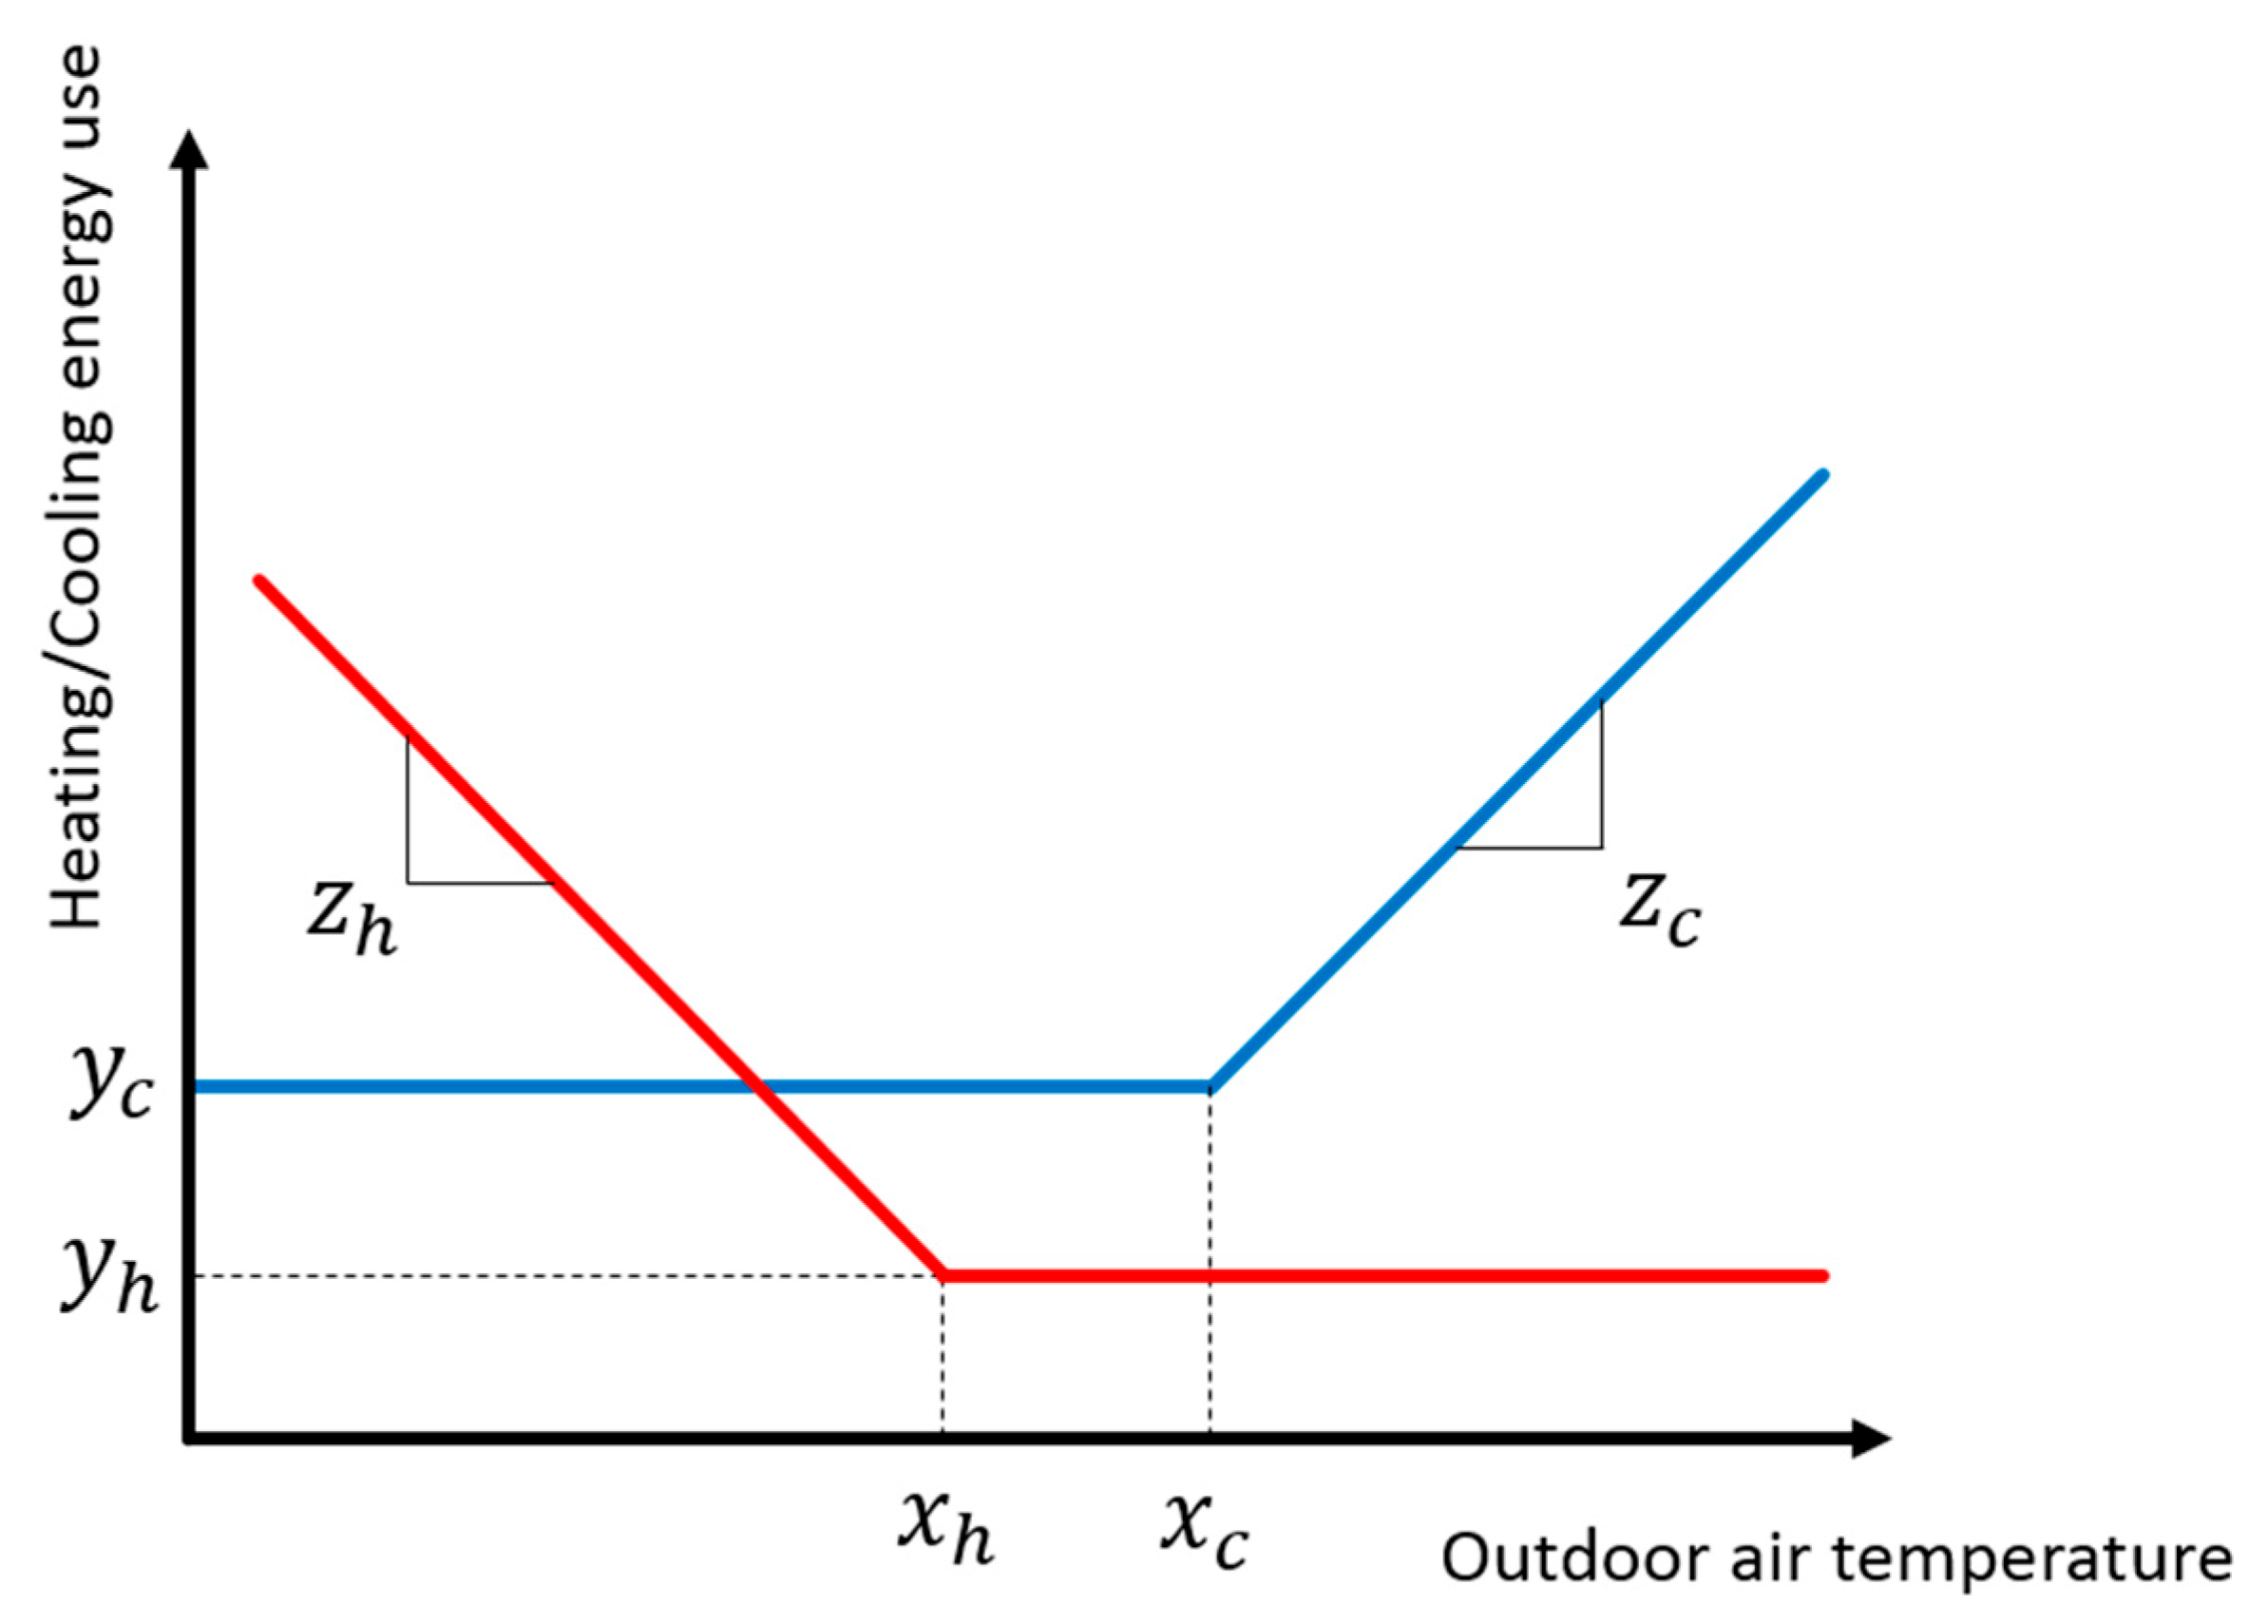
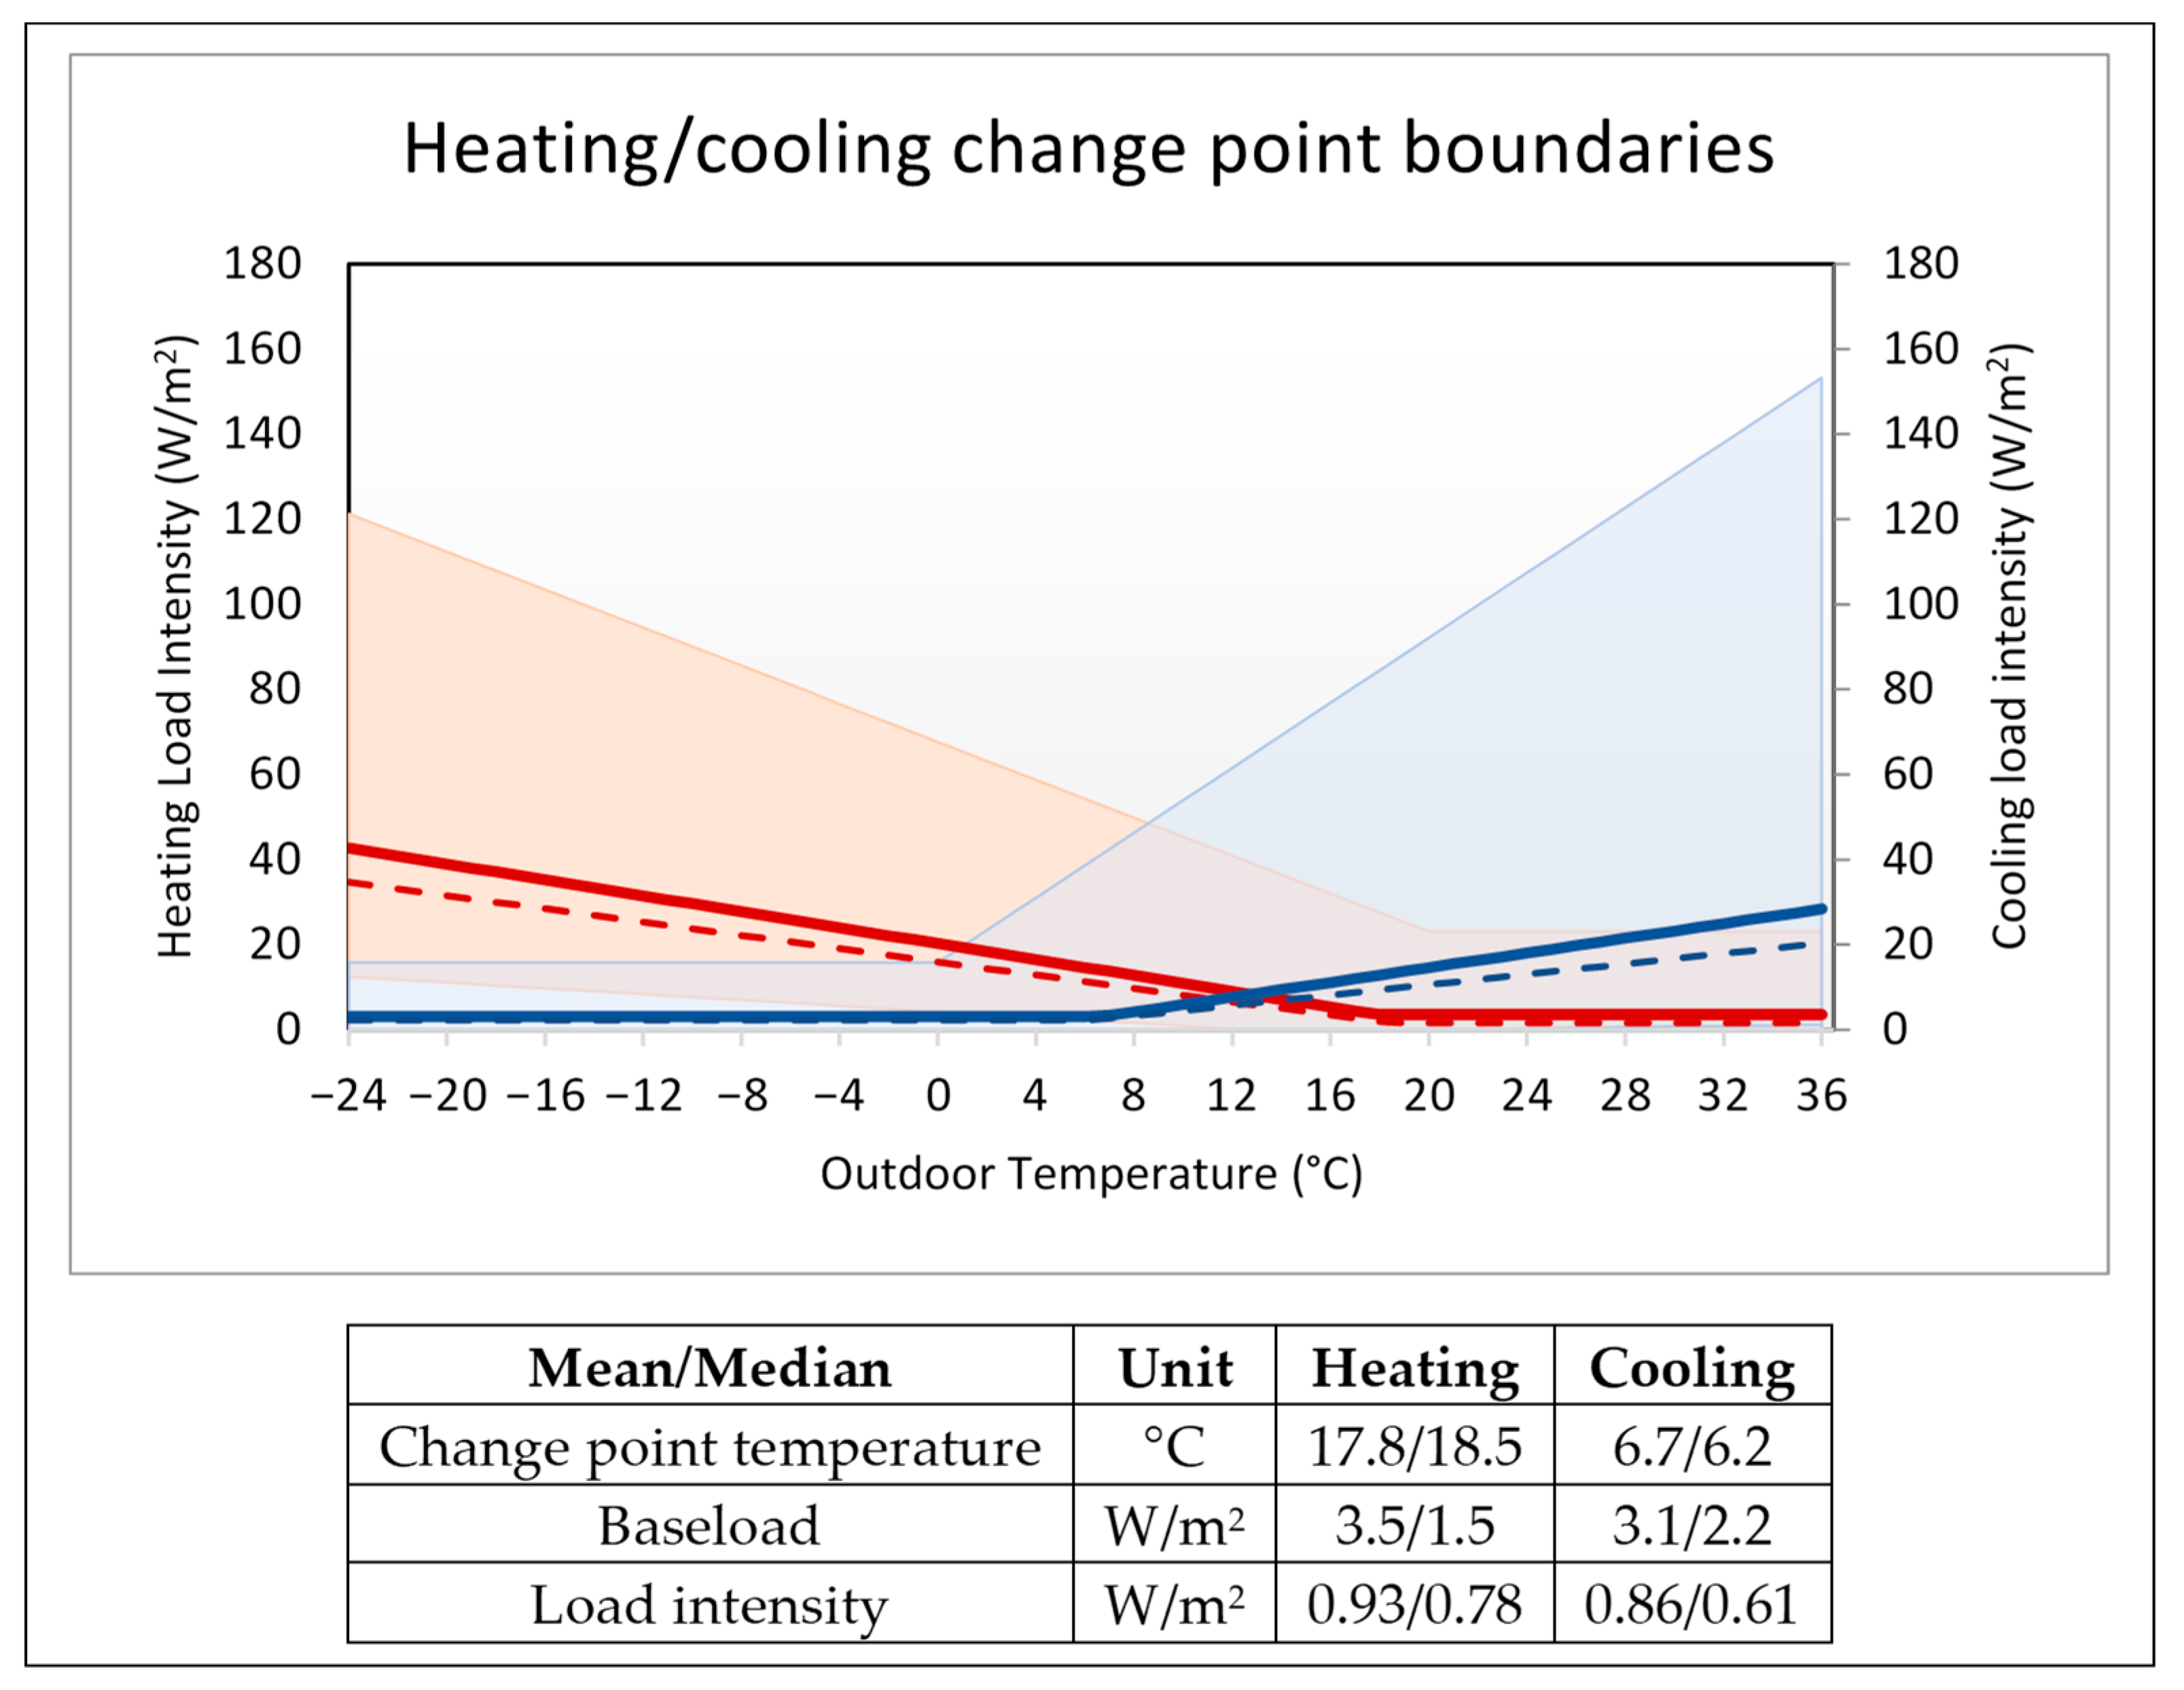
3.3. Thermal Load Change Point Analysis
4. Results
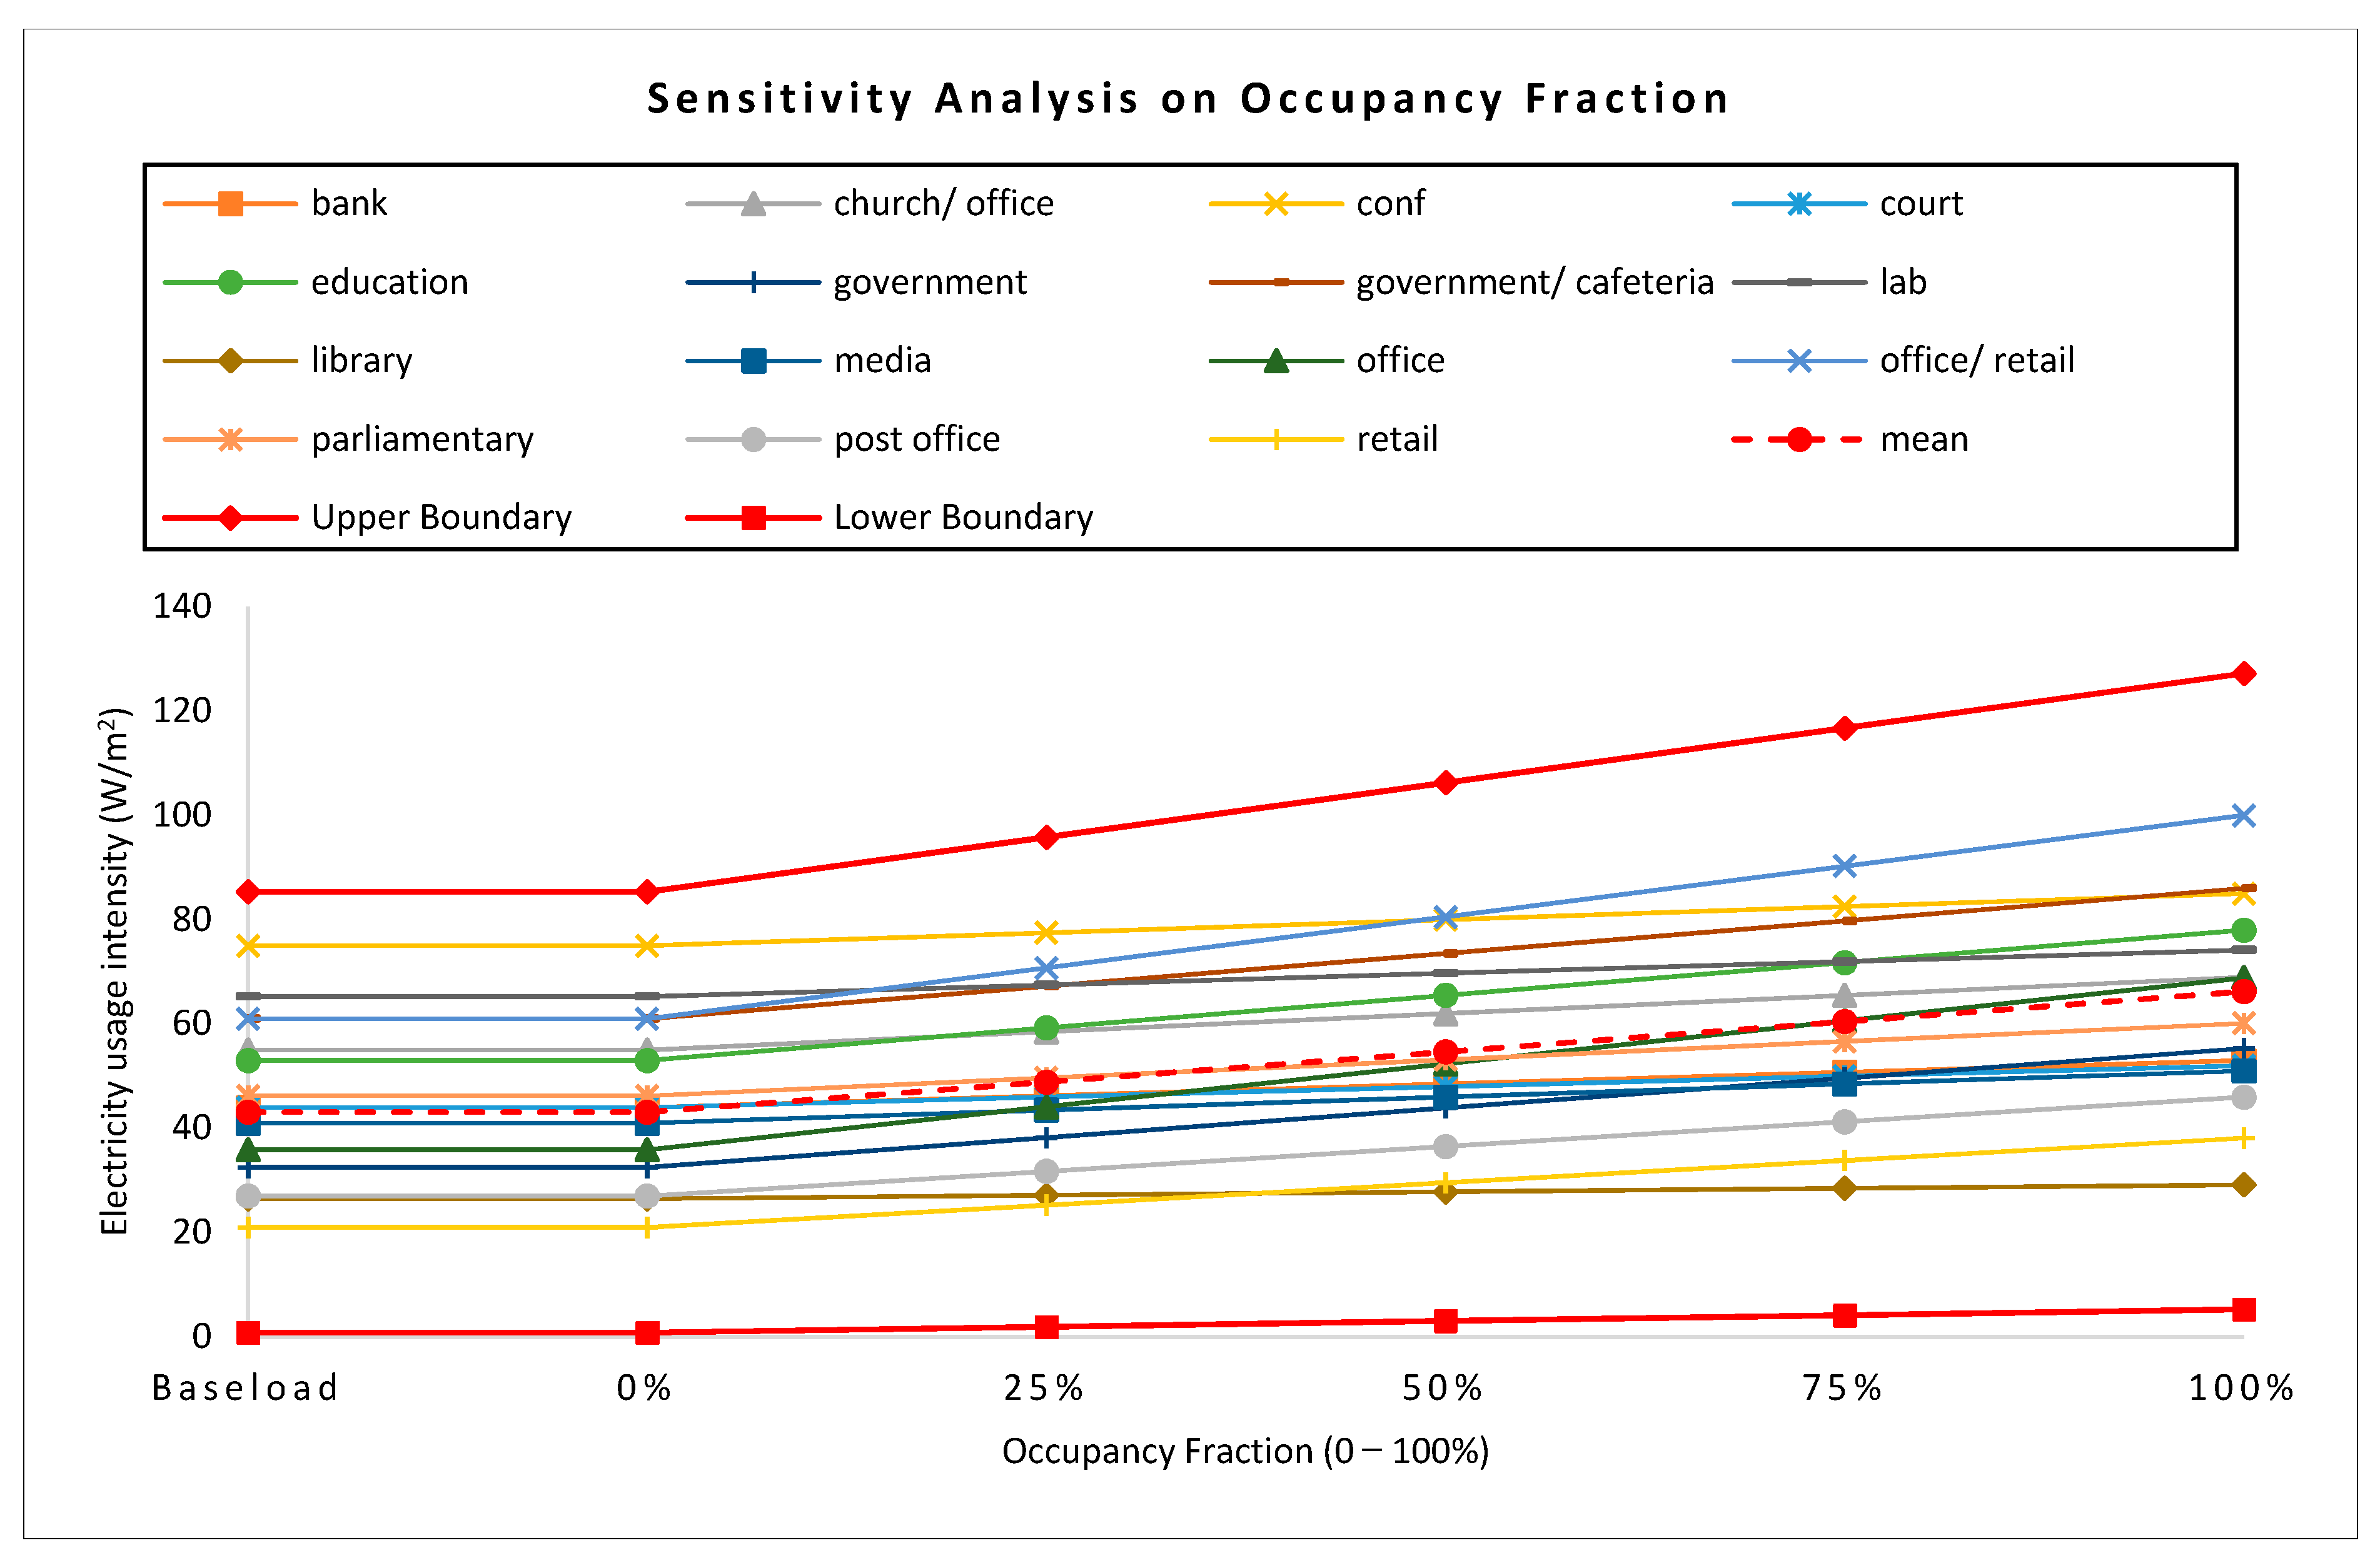
4.1. Electricity EUI Sensitivity to Occupancy (ESTO)
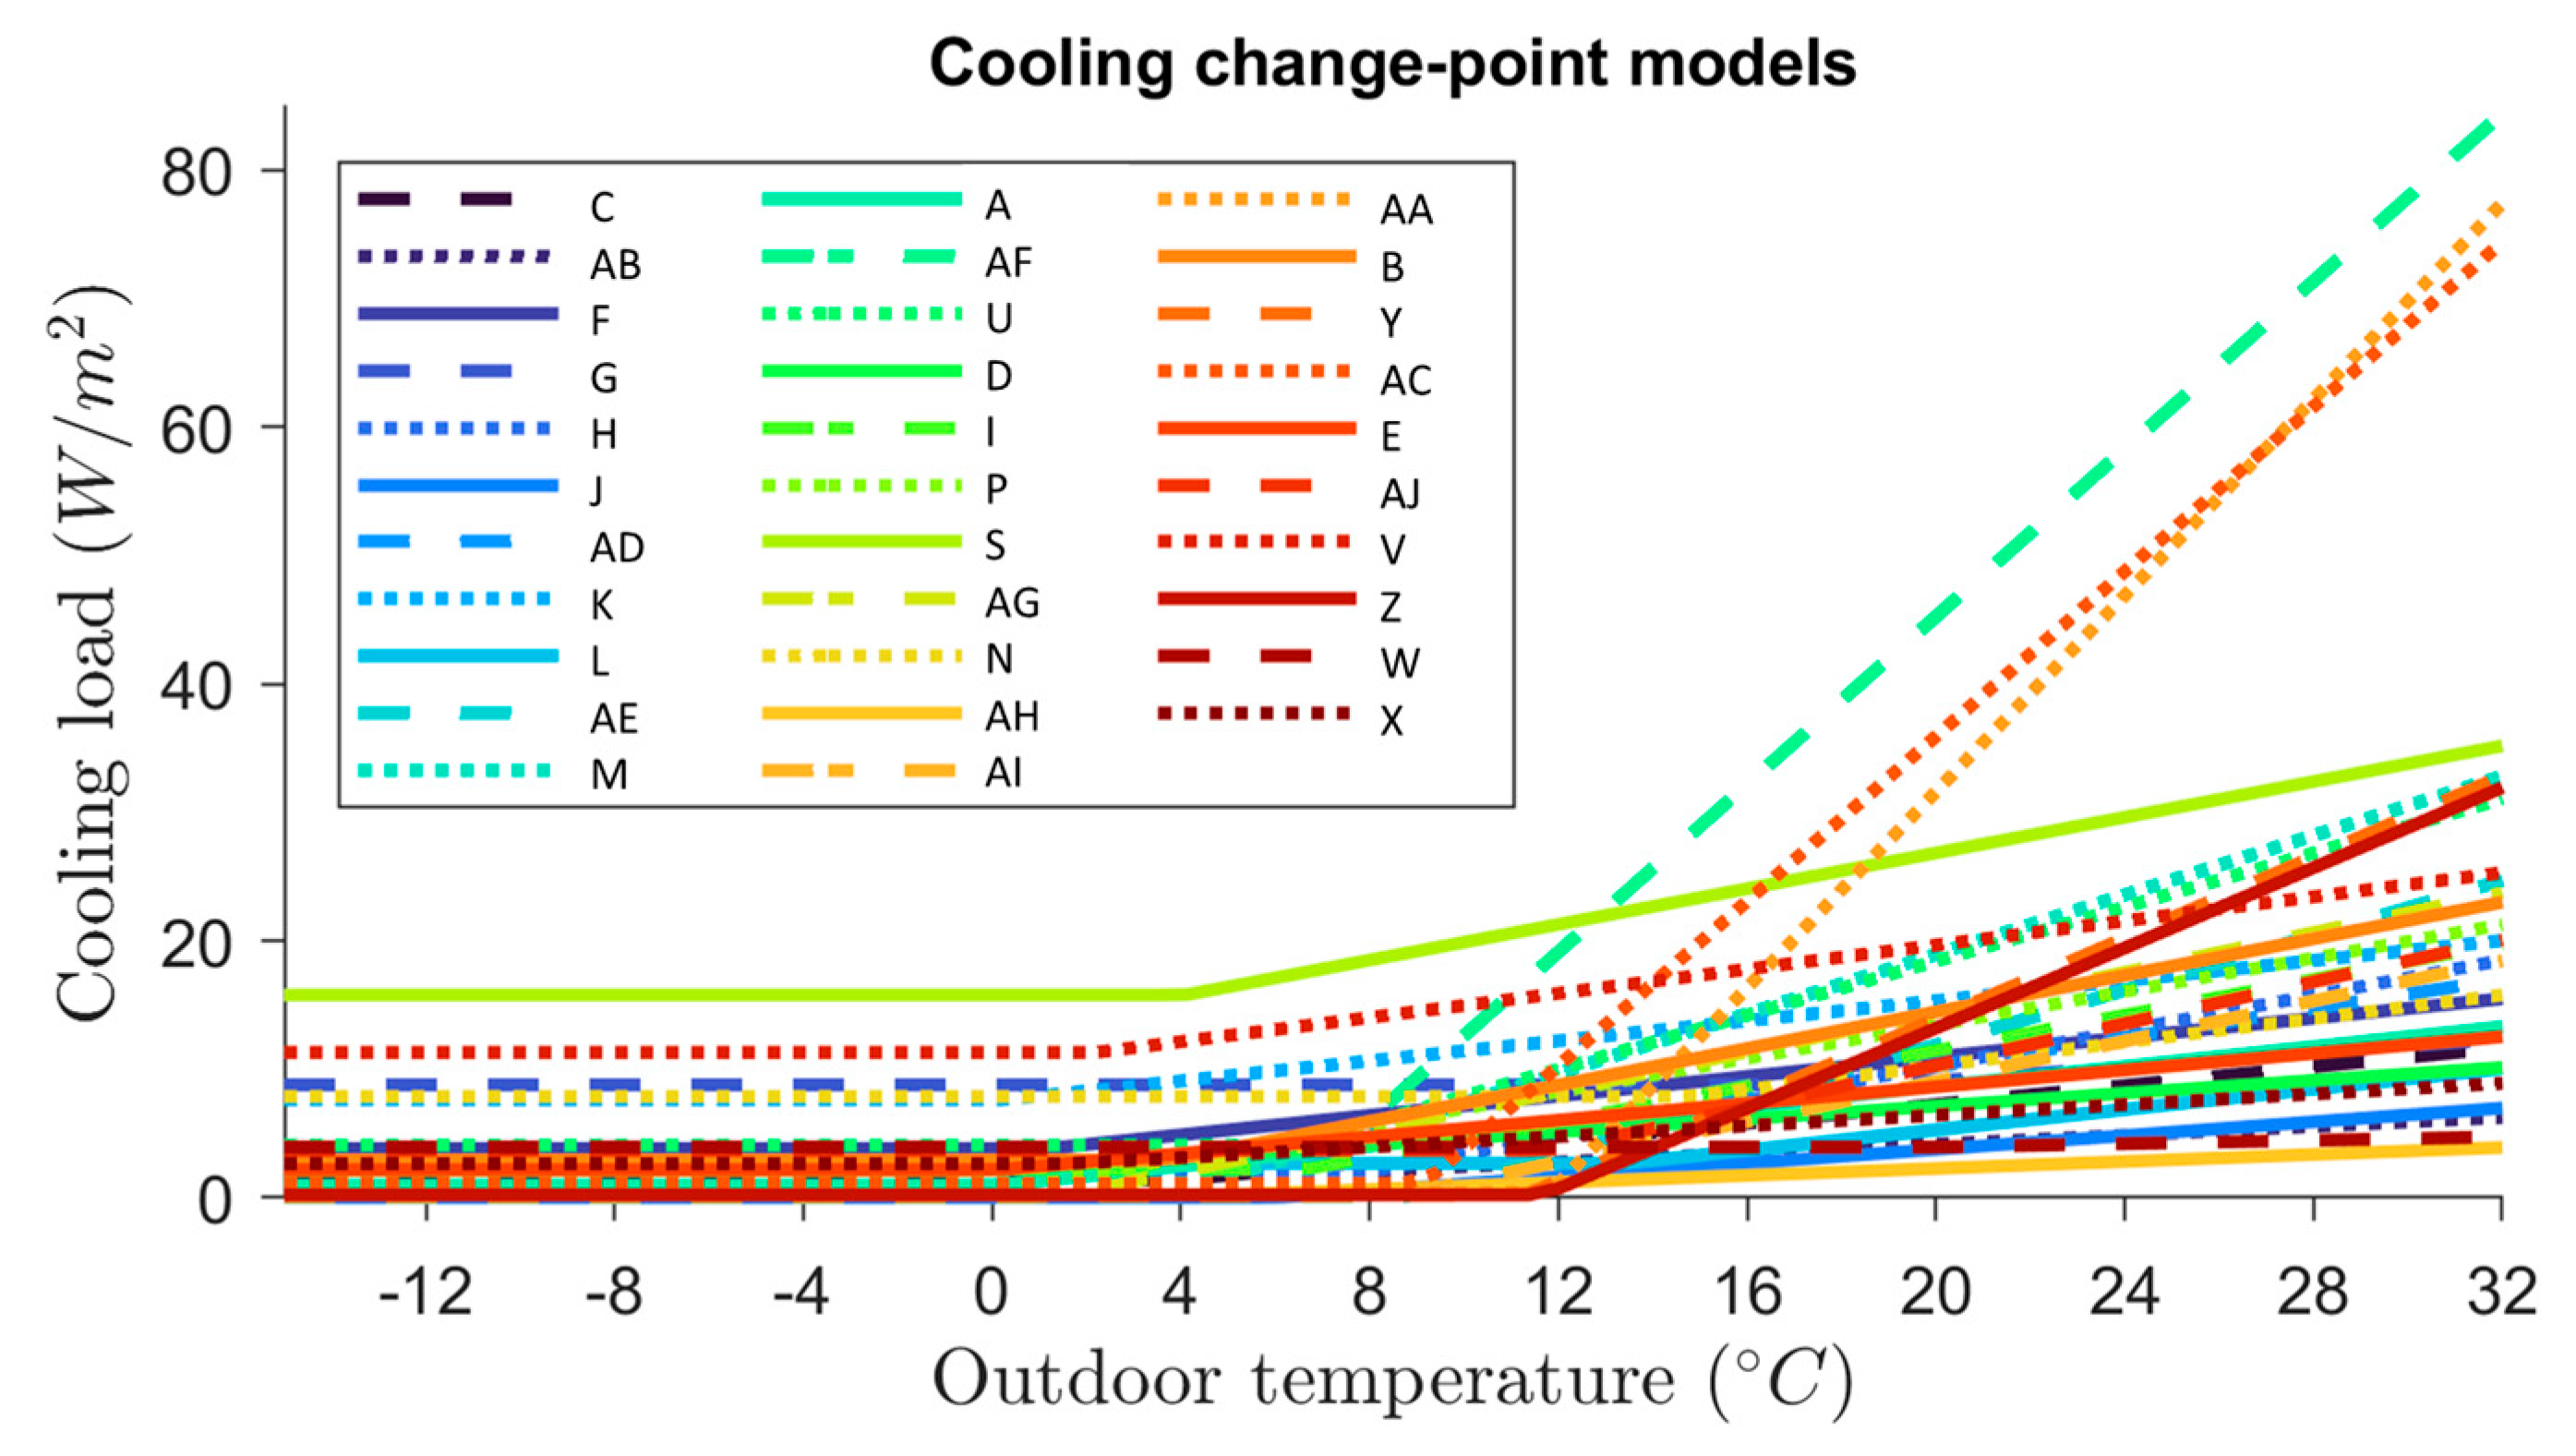
4.2. Cooling
| Name 1 | Type | xc | yc | zc | Name | Type | xc | yc | zc | Name | Type | xc | yc | zc |
|---|---|---|---|---|---|---|---|---|---|---|---|---|---|---|
| A | Education | 0 | 0.95 | 0.39 | L | Post office | 13.5 | 2.68 | 0.4 | AA | Lab | 11.8 | 0.43 | 3.82 |
| B | Mixed | 3.8 | 2.94 | 0.71 | M | Parliamentary | 4.6 | 1.16 | 1.16 | AB | Office | 3.6 | 1.32 | 0.17 |
| C | Mixed | 4 | 1.38 | 0.37 | N | Parliamentary | 14.8 | 7.88 | 0.46 | AC | Lab | 9.1 | 1.11 | 3.21 |
| D | Library | 0 | 2.12 | 0.25 | P | Library | 0.3 | 0.61 | 0.65 | AD | Office | 6.9 | 2.78 | 0.57 |
| E | Bank | 0.1 | 2.18 | 0.33 | S | Media | 4.1 | 15.78 | 0.69 | AE | Government | 9 | 0.1 | 1.07 |
| F | Office | 1.1 | 3.82 | 0.38 | U | Mixed | 6.4 | 4.09 | 1.05 | AF | Lab | 7.2 | 3.59 | 3.26 |
| G | Parliamentary | 18.9 | 8.79 | 0.27 | V | Court | 2.2 | 11.31 | 0.47 | AG | Lab | 1.4 | 0.07 | 0.77 |
| H | Office | 7.9 | 2.01 | 0.68 | W | Parliamentary | 20 | 3.95 | 0.07 | AH | Office | 5 | 0.24 | 0.14 |
| I | Government | 6.7 | 2.22 | 0.69 | X | Parliamentary | 1.7 | 2.65 | 0.21 | AI | Office | 8.6 | 0.13 | 0.78 |
| J | Government | 6 | 0.01 | 0.27 | Y | Government | 11.3 | 0.19 | 1.58 | AJ | Office | 11.9 | 3.69 | 0.81 |
| K | Conf | 0.3 | 7.65 | 0.39 | Z | Office | 11.7 | 0.23 | 1.56 |
- Many buildings have a cooling balance temperature that is quite close to zero, meaning that the active cooling starts and ends in winter, rather than the shoulder seasons (keep in mind that we are using average daily temperatures). For this reason, the portfolio owner might want to check the criteria for starting up and shutting down the cooling system.
- As mentioned before, a necessary condition to avoid simultaneous heating and cooling is to have a base load equal to or close to zero. By inspecting Table 2, we see that only three buildings, “J”, “AE”, and “AG”, have a base load of 0.1 Watts per square meter or lower, hence the remaining buildings have some simultaneous heating and cooling that may need to be investigated.
- For “S” and “V” that have a high base load, the portfolio owner might want to check that there is no unwanted cooling in these buildings during the heating season.
- The load intensity is a good indication of envelope performance. As a result, for buildings “AF”, “Z”, and “AC”, envelope inspection (insulation, windows, ceiling, etc.) can be a priority point in the next audit schedule.
4.3. Heating
- In terms of heating balance temperature, the highest value observed is 20 degrees Celsius. For Ottawa, this average daily temperature is usually crossed in the months of May and September, meaning that the heating system is properly started and stopped in the shoulder seasons. For “AE” and “AJ” that have a low heating balance temperature, this might create a comfort problem for the occupants by delaying the start of the active heating season to a later time.
- Regarding the base load, similar arguments to the one made for cooling can be made. Only one building, “N”, has a base load close to zero. This means that almost all buildings are prone to experience simultaneous heating and cooling and waste energy, particularly for buildings “AC” and “AF”.
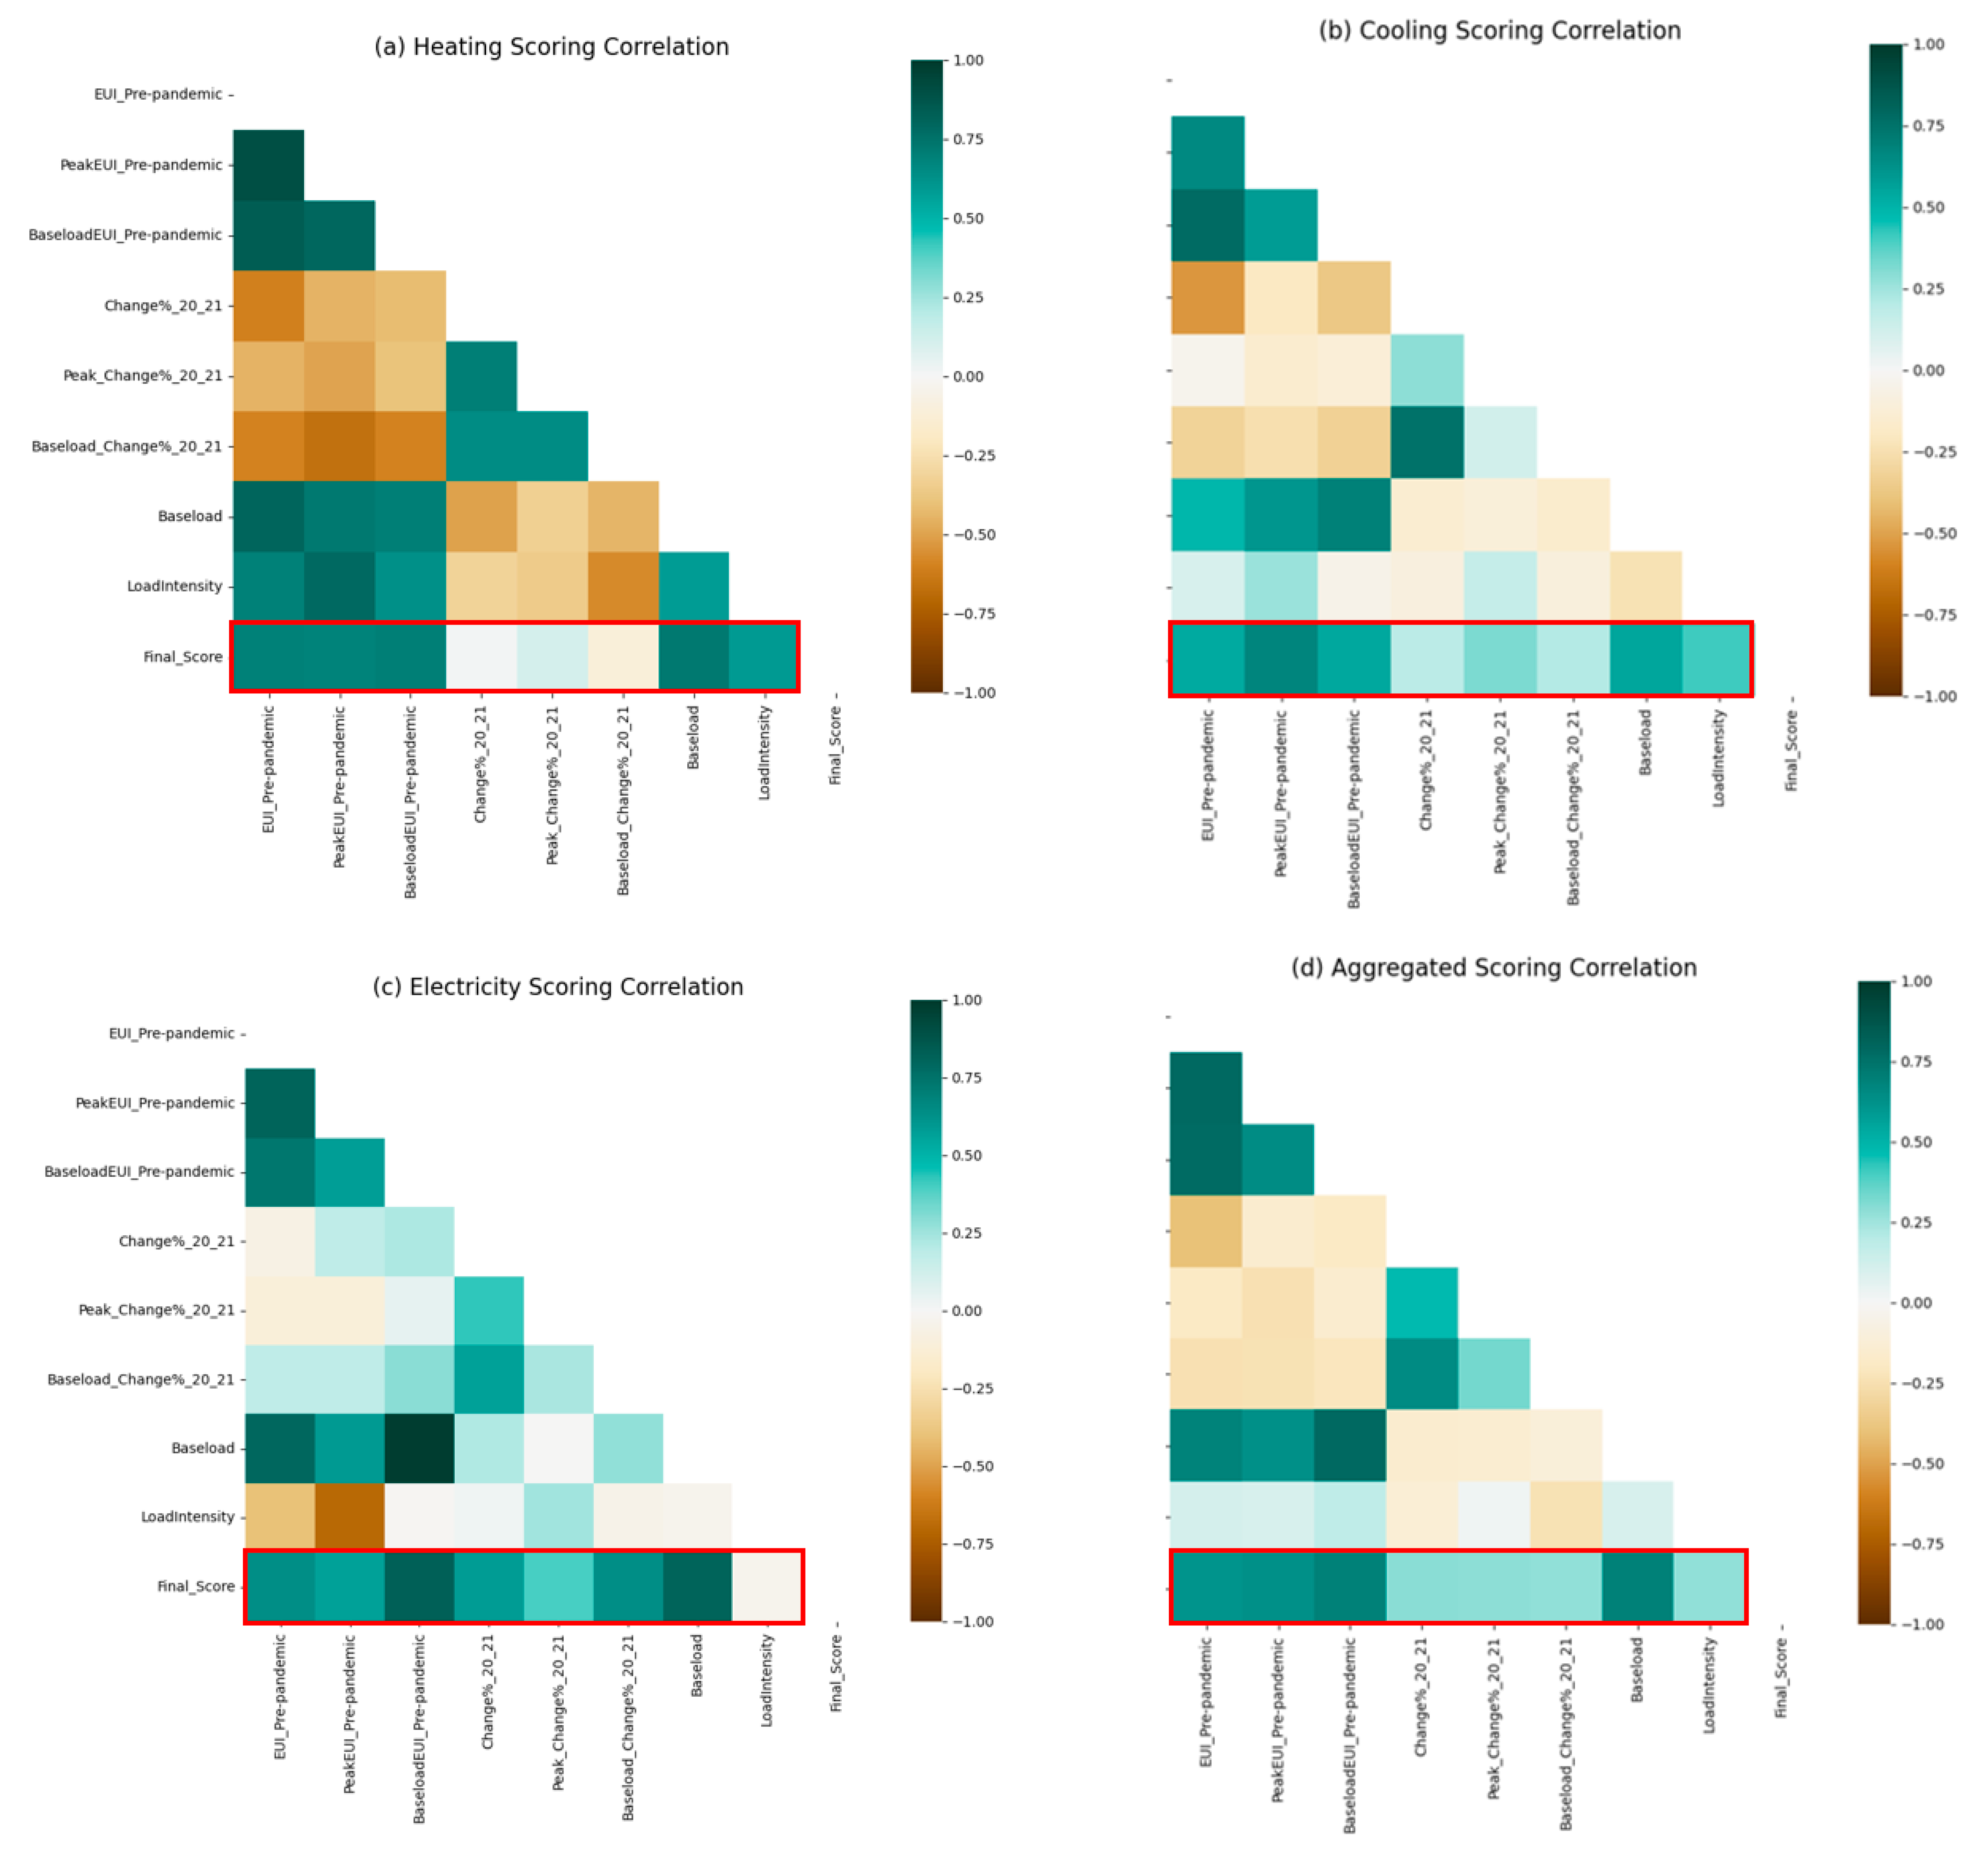
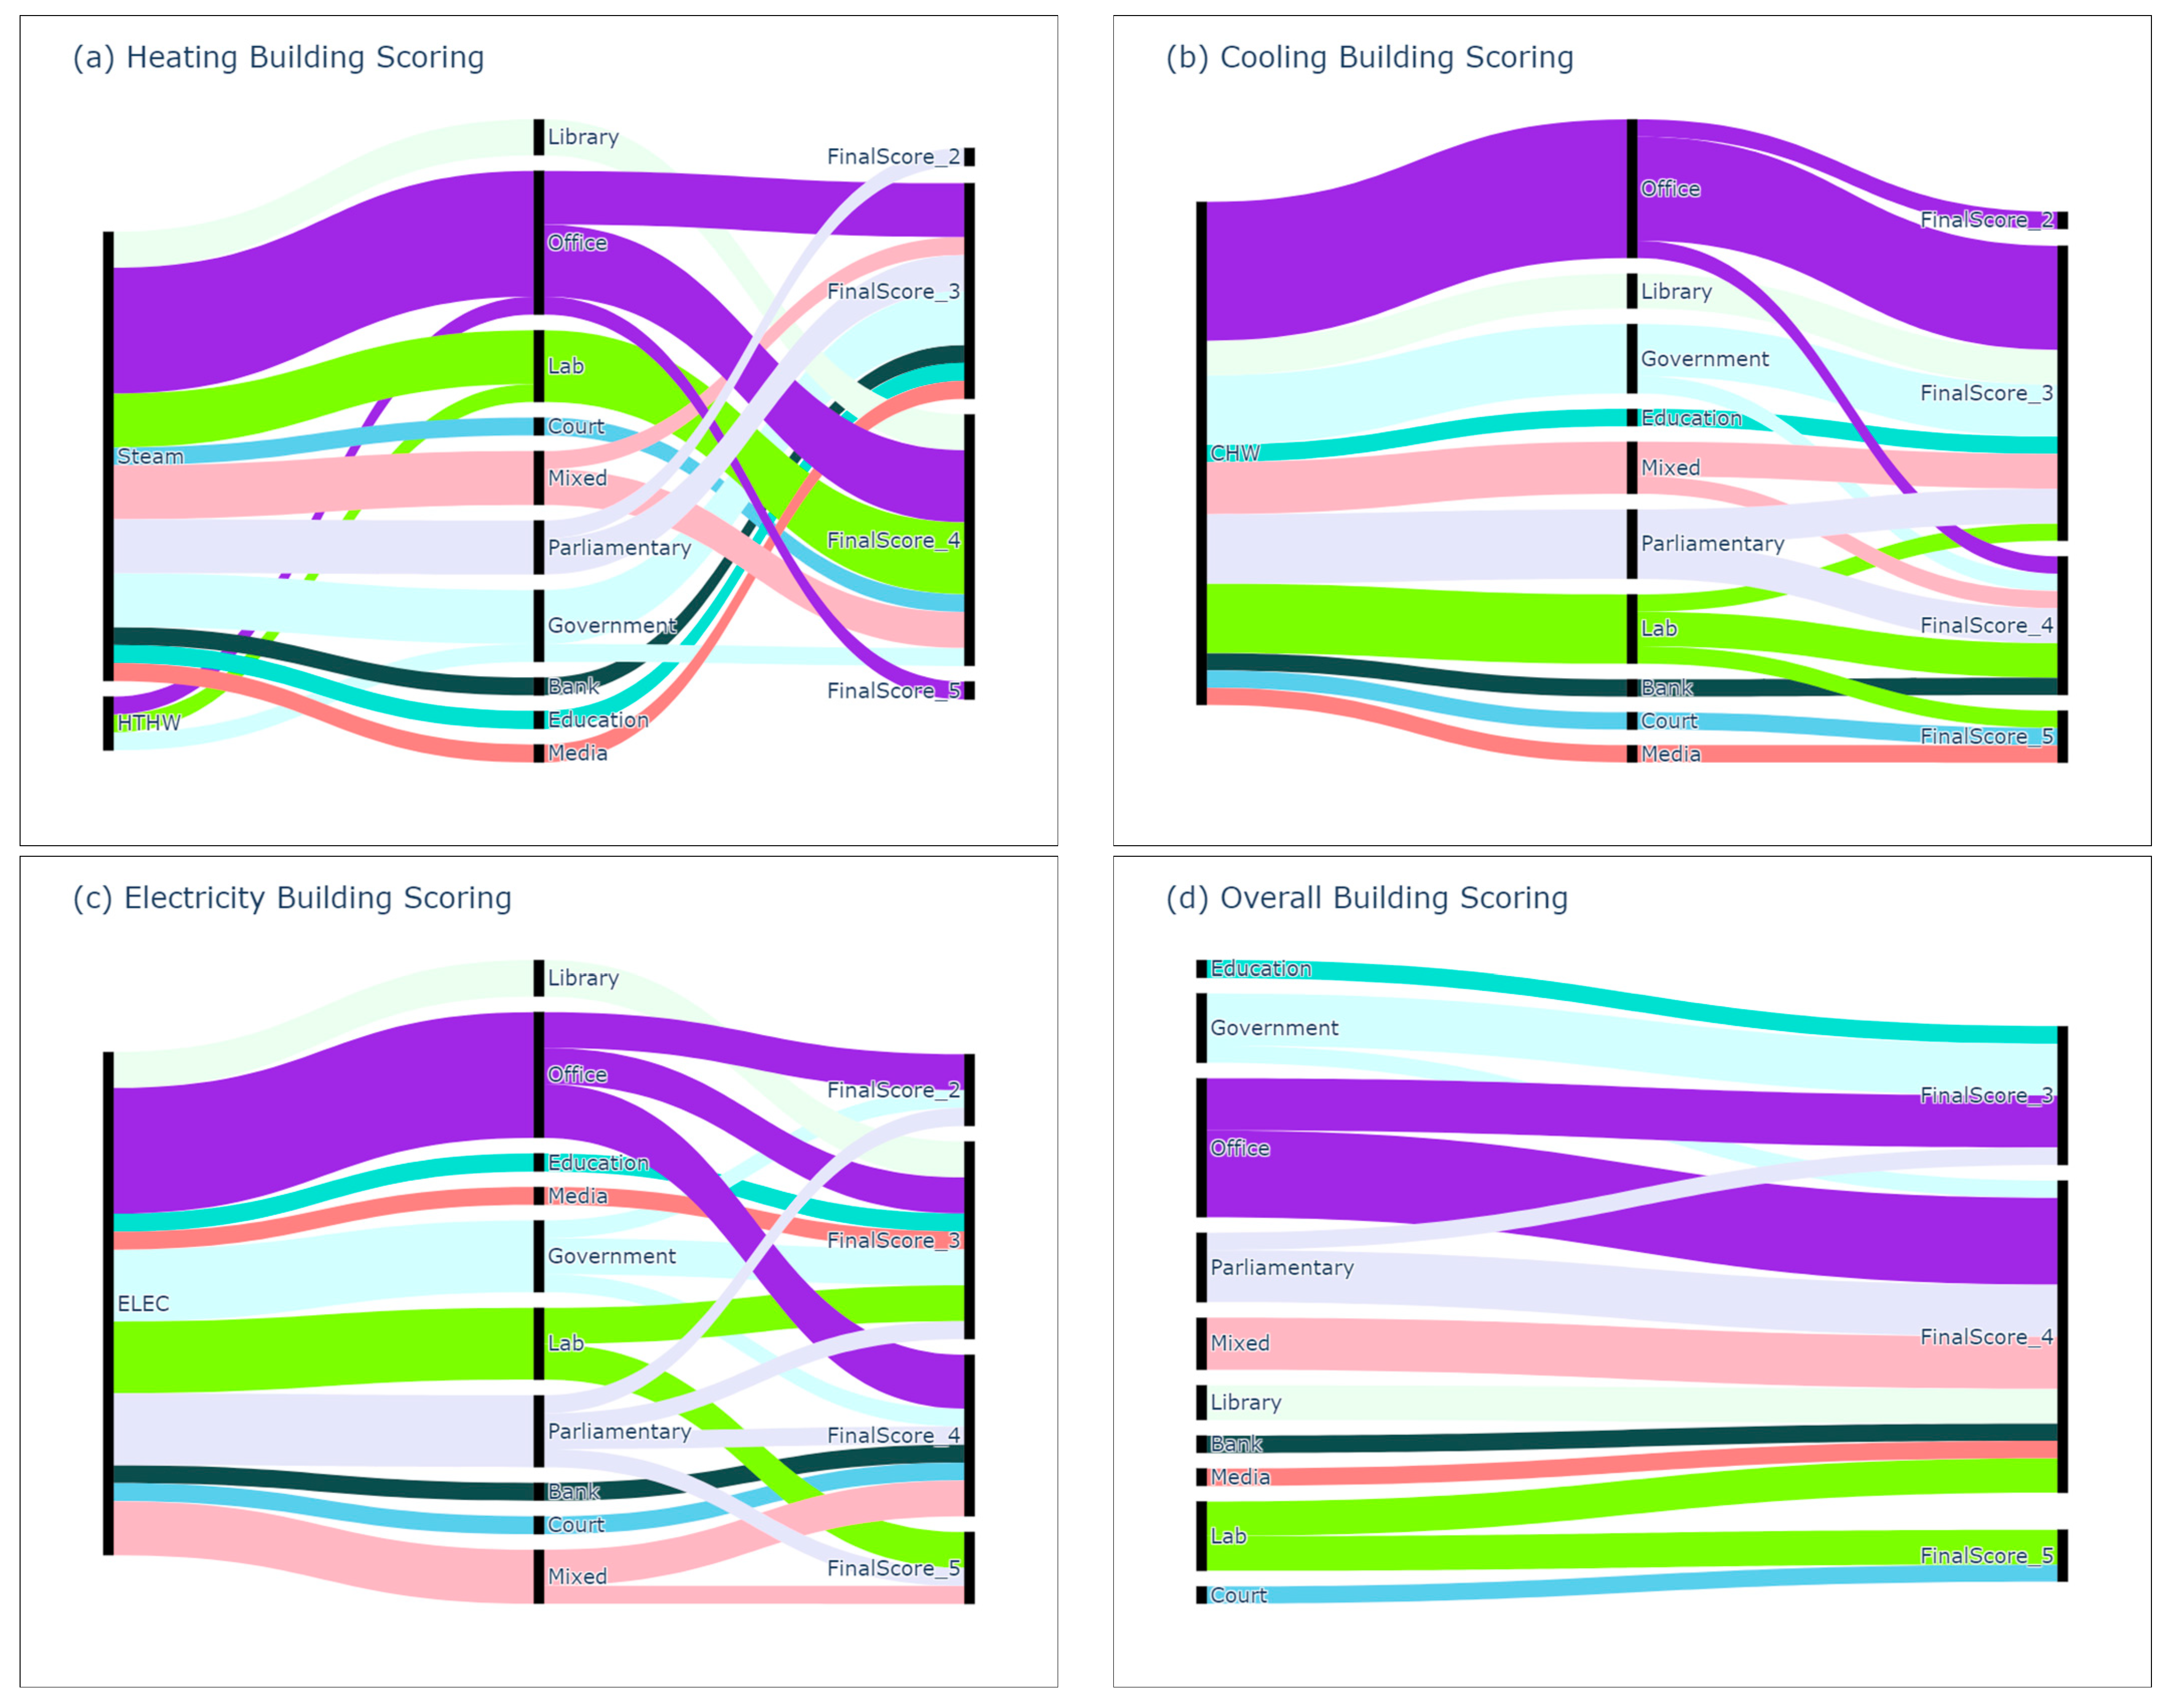
5. Performance Scorecard
6. Discussion
6.1. ESTO
6.2. Change Point Model
6.3. Summary of Discussion
7. Conclusions and Future Work
- Application of time-series decomposition methods to filter out noise, seasonality and residuals, and only compare the highest and lowest points on the trend [27]. It is critical to isolate weather and other possible parameters that may affect the electricity usage trends.
- It is critical to disaggregate electrical loads to user-dependent (e.g., kitchen appliances, personal devices, lighting intensity) and user-independent (e.g., security systems, lab equipment, servers, baseloads for minimum HVAC operation, especially in winter months) in order to fully capture the effects of occupancy on electricity usage intensity. The method we proposed was able to capture user-independent baseloads during the COVID-19 pandemic ad hoc lockdown period. In the future, we aim to cross validate those findings by conducting either field visits, questionnaires, or, if possible, submetering for major plug loads.
- Cross-validate the proposed method with occupancy data from one or more study buildings. Proxies for occupancy such as security access badge-in (combined with badge-out), Wi-Fi information, or CO2 concentration have proven to be useful at varying degrees of accuracy.
- Expand the model to include all-season data, not only shoulder season data.
Author Contributions
Funding
Data Availability Statement
Acknowledgments
Conflicts of Interest
References
- International Energy Agency. Covid-19 Impact on Electricity; IEA: Paris, France, 2020. [Google Scholar]
- Soava, G.; Mehedintu, A.; Sterpu, M.; Grecu, E. The Impact of the COVID-19 Pandemic on Electricity Consumption and Economic Growth in Romania. Energies 2021, 14, 2394. [Google Scholar] [CrossRef]
- United Nations. WHO Chief Declares End to COVID-19 as a Global Health Emergency. Available online: https://news.un.org/en/story/2023/05/1136367 (accessed on 18 August 2023).
- Gunay, H.B.; Ouf, M.; Newsham, G.; O’Brien, W. Sensitivity Analysis and Optimization of Building Operations. Energy Build. 2019, 199, 164–175. [Google Scholar] [CrossRef]
- Beyer, R.C.M.; Franco-Bedoya, S.; Galdo, V. Examining the Economic Impact of COVID-19 in India through Daily Electricity Consumption and Nighttime Light Intensity. World Dev. 2021, 140, 105287. [Google Scholar] [CrossRef] [PubMed]
- Santiago, I.; Moreno-Munoz, A.; Quintero-Jiménez, P.; Garcia-Torres, F.; Gonzalez-Redondo, M.J. Electricity Demand during Pandemic Times: The Case of the COVID-19 in Spain. Energy Policy 2021, 148, 111964. [Google Scholar] [CrossRef] [PubMed]
- Ding, Y.; Ivanko, D.; Cao, G.; Brattebø, H.; Nord, N. Analysis of Electricity Use and Economic Impacts for Buildings with Electric Heating under Lockdown Conditions: Examples for Educational Buildings and Residential Buildings in Norway. Sustain. Cities Soc. 2021, 74, 103253. [Google Scholar] [CrossRef]
- Henderson, J.V.; Squires, T.; Storeygard, A.; Weil, D. The global distribution of economic activity: Nature, history, and the role of trade. Q. J. Econ. 2017, 133, 357–406. [Google Scholar] [CrossRef] [PubMed]
- Buechler, E.; Powell, S.; Sun, T.; Astier, N.; Zanocco, C.; Bolorinos, J.; Flora, J.; Boudet, H.; Rajagopal, R. Global Changes in Electricity Consumption during COVID-19. iScience 2022, 25, 103568. [Google Scholar] [CrossRef] [PubMed]
- Awad, H.; Ashouri, A.; Bahiraei, F. Implications of COVID-19 for Electricity Use in Commercial Smart Buildings in Canada—A Case Study. In Proceedings of the eSim 2022: 12th Conference of IBPSA, Ottawa, ON, Canada, 22–23 June 2022; International Building Performance Simulation Association (IBPSA): Ottawa, ON, Canada, 2022. [Google Scholar]
- Leach, A.; Rivers, N.; Shaffer, B. Canadian Electricity Markets during the COVID-19 Pandemic: An Initial Assessment. Can. Public Policy 2020, 46, S145–S159. [Google Scholar] [CrossRef]
- Burleyson, C.D.; Rahman, A.; Rice, J.S.; Smith, A.D.; Voisin, N. Multiscale Effects Masked the Impact of the COVID-19 Pandemic on Electricity Demand in the United States. Appl. Energy 2021, 304, 117711. [Google Scholar] [CrossRef]
- Zhang, X.; Pellegrino, F.; Shen, J.; Copertaro, B.; Huang, P.; Kumar Saini, P.; Lovati, M. A Preliminary Simulation Study about the Impact of COVID-19 Crisis on Energy Demand of a Building Mix at a District in Sweden. Appl. Energy 2020, 280, 115954. [Google Scholar] [CrossRef]
- Rouleau, J.; Gosselin, L. Impacts of the COVID-19 Lockdown on Energy Consumption in a Canadian Social Housing Building. Appl. Energy 2021, 287, 116565. [Google Scholar] [CrossRef] [PubMed]
- Li, L.; Meinrenken, C.J.; Modi, V.; Culligan, P.J. Impacts of COVID-19 Related Stay-at-Home Restrictions on Residential Electricity Use and Implications for Future Grid Stability. Energy Build. 2021, 251, 111330. [Google Scholar] [CrossRef] [PubMed]
- Halbrügge, S.; Schott, P.; Weibelzahl, M.; Buhl, H.U.; Fridgen, G.; Schöpf, M. How Did the German and Other European Electricity Systems React to the COVID-19 Pandemic? Appl. Energy 2021, 285, 116370. [Google Scholar] [CrossRef] [PubMed]
- Bahmanyar, A.; Estebsari, A.; Ernst, D. The Impact of Different COVID-19 Containment Measures on Electricity Consumption in Europe. Energy Res. Soc. Sci. 2020, 68, 101683. [Google Scholar] [CrossRef] [PubMed]
- Delgado, D.B.d.M.; de Lima, K.M.; Cancela, M.d.C.; Siqueira, C.A.d.S.; Carvalho, M.; de Souza, D.L.B. Trend Analyses of Electricity Load Changes in Brazil Due to COVID-19 Shutdowns. Electr. Power Syst. Res. 2021, 193, 107009. [Google Scholar] [CrossRef]
- Norouzi, N.; Zarazua de Rubens, G.; Choubanpishehzafar, S.; Enevoldsen, P. When Pandemics Impact Economies and Climate Change: Exploring the Impacts of COVID-19 on Oil and Electricity Demand in China. Energy Res. Soc. Sci. 2020, 68, 101654. [Google Scholar] [CrossRef] [PubMed]
- Kirli, D.; Parzen, M.; Kiprakis, A. Impact of the Covid-19 Lockdown on the Electricity System of Great Britain: A Study on Energy Demand, Generation, Pricing and Grid Stability. Energies 2021, 14, 635. [Google Scholar] [CrossRef]
- Alhajeri, H.M.; Almutairi, A.; Alenezi, A.; Alshammari, F. Energy Demand in the State of Kuwait During the Covid-19 Pandemic: Technical, Economic, and Environmental Perspectives. Energies 2020, 13, 4370. [Google Scholar] [CrossRef]
- Malec, M.; Kinelski, G.; Czarnecka, M. The Impact of Covid-19 on Electricity Demand Profiles: A Case Study of Selected Business Clients in Poland. Energies 2021, 14, 5332. [Google Scholar] [CrossRef]
- Agdas, D.; Barooah, P. Impact of the COVID-19 Pandemic on the U.S. Electricity Demand and Supply: An Early View from Data. IEEE Access 2020, 8, 151523–151534. [Google Scholar] [CrossRef]
- Abu-Rayash, A.; Dincer, I. Analysis of the Electricity Demand Trends amidst the COVID-19 Coronavirus Pandemic. Energy Res. Soc. Sci. 2020, 68, 101682. [Google Scholar] [CrossRef]
- Santiago, I.; Lopez-Rodriguez, M.A.; Trillo-Montero, D.; Torriti, J.; Moreno-Munoz, A. Activities Related with Electricity Consumption in the Spanish Residential Sector: Variations between Days of the Week, Autonomous Communities and Size of Towns. Energy Build. 2014, 79, 84–97. [Google Scholar] [CrossRef]
- López Prol, J.; Sungmin, O. Impact of COVID-19 Measures on Short-Term Electricity Consumption in the Most Affected EU Countries and USA States. iScience 2020, 23, 101639. [Google Scholar] [CrossRef] [PubMed]
- Awad, H.; Wilton, I.; Newsham, G.R. Analyzing the Impact of the COVID-19 Pandemic on Electricity Usage in Federal Government Smart Buildings in Canada. In Proceedings of the 23rd International Conference on Building Envelopes Engineering, Vancouver, BC, Canada, 23–24 September 2021. [Google Scholar]
- Zou, H.; Jiang, H.; Yang, J.; Xie, L.; Spanos, C.J. Non-Intrusive Occupancy Sensing in Commercial Buildings. Energy Build. 2017, 154, 633–643. [Google Scholar] [CrossRef]
- Hobson, B.W.; Lowcay, D.; Gunay, H.B.; Ashouri, A.; Newsham, G.R. Opportunistic Occupancy-Count Estimation Using Sensor Fusion: A Case Study. Build. Environ. 2019, 159, 106154. [Google Scholar] [CrossRef]
- Ontario Agency for Health Protection and Promotion (Public Health Ontario). Daily Epidemiological Summary: COVID-19 in Ontario—January 15, 2020 to February 25, 2022; Public Health Ontario: Toronto, ON, Canada, 2022. [Google Scholar]
- Awad, H.; Rizvi, F.; Shillinglaw, S. Energy Performance of Commercial Buildings in Partial-to-No- Occupancy: Lessons Learned from the COVID-19 Pandemic Lockdown in Canadian Government Buildings. Accepted for Publication. In Proceedings of the 18th International IBPSA Conference and Exhibition, Shanghai, China, 4–6 September 2023. [Google Scholar]
- Kissock, J.K.; Haberl, J.S.; Claridge, D.E. Development of a Toolkit for Calculating Linear, Change-Point Linear, and Multiple-Linear Inverse Building Energy Analysis Models 2002; Texas A&M University: College Station, TX, USA; pp. 1–32.
- Burak Gunay, H.; Shen, W.; Newsham, G.; Ashouri, A. Detection and Interpretation of Anomalies in Building Energy Use through Inverse Modeling. Sci. Technol. Built Environ. 2019, 25, 488–503. [Google Scholar] [CrossRef]
- Baasch, G.M.; Evins, R. Targeting Buildings for Energy Retrofit Using Recurrent Neural Networks with Multivariate Time Series. In Proceedings of the 33rd NeurIPS 2019 Workshop: Tackling Climate Change with Machine Learning, Vancouver, BC, Canada, 14 December 2019. [Google Scholar]
- Fernandez, N.; Katipamula, S.; Wang, W.; Xie, Y.; Zhao, M.; Corbin, C. Impacts of Commercial Building Controls on Energy Savings and Peak Load Reduction; Pacific Northwest National Lab.: Richland, WA, USA, 2017. [Google Scholar]
- Ouf, M.M.; O’Brien, W.; Gunay, B. On Quantifying Building Performance Adaptability to Variable Occupancy. Build. Environ. 2019, 155, 257–267. [Google Scholar] [CrossRef]


| Name 1 | Type | xh | yh | zh | Name | Type | xh | yh | zh | Name | Type | xh | yh | zh |
|---|---|---|---|---|---|---|---|---|---|---|---|---|---|---|
| A | Education | 19.9 | 0.94 | 0.49 | L | Post office | 16.4 | 0.28 | 1.12 | Z | Office | 19.8 | 5.31 | 0.54 |
| B | Mixed | 16.8 | 3.05 | 0.76 | M | Parliamentary | 19.8 | 0.61 | 0.34 | AA | Lab | 17.8 | 6.01 | 1 |
| C | Mixed | 17.4 | 0.56 | 0.73 | N | Parliamentary | 15.4 | 0.02 | 0.78 | AB | Office | 18.5 | 1.26 | 0.92 |
| D | Library | 19.9 | 1.7 | 0.74 | O | Retail | 20 | 5.09 | 1.93 | AC | Lab | 16.4 | 14.28 | 2.18 |
| E | Bank | 16.1 | 2.47 | 0.83 | P | Library | 18.7 | 8.85 | 0.62 | AD | Office | 17.3 | 6.45 | 1.83 |
| F | Office | 19.8 | 0.44 | 0.59 | R | Retail | 19.3 | 0.37 | 2.23 | AE | Government | 12.5 | 0.17 | 0.78 |
| G | Parliamentary | 13.5 | 0.21 | 0.52 | S | Media | 19.9 | 1.81 | 0.65 | AF | Lab | 19.2 | 23.09 | 1.44 |
| H | Office | 19.6 | 3.5 | 0.64 | U | Mixed | 18.3 | 2.47 | 0.98 | AG | Lab | 16.8 | 0.57 | 1.12 |
| I | Government | 19.6 | 1.5 | 0.87 | V | Court | 19.8 | 4.13 | 1.45 | AH | Office | 16.2 | 0.2 | 0.48 |
| J | Government | 16.2 | 0.43 | 0.74 | W | Parliamentary | 19.4 | 0.59 | 0.45 | AI | Office | 15.6 | 0.31 | 0.54 |
| K | Conf | 19.6 | 12.67 | 0.82 | Y | Government | 20 | 0.89 | 0.61 | AJ | Office | 12.8 | 6.68 | 1.17 |
| Energy Type/Parameter | Electricity | Cooling | Heating | Ranking Order (Ap,b) 1 | |
|---|---|---|---|---|---|
| Baseline/Pre-pandemic | Annual EUI | Y | Y | Y | Ascending 2 |
| Peak EUI | Y | Y | Y | ||
| Baseload (year-round) EUI | Y | Y | Y | ||
| Deviation in FY20_21% | Annual | Y | Y | Y | |
| Peak | Y | Y | Y | ||
| Baseload (year-round) | Y | Y | Y | ||
| Change Point model | Baseload (off-season) | - | Y | Y | |
| Load intensity | - | Y | Y | ||
| ESTO model | Baseload | Y | - | - | |
| Load intensity | Y | - | - | Descending |
| Performance Param. | EUI_Pre-Pandemic | Peak EUI Pre-Pandemic | Baseload EUI Pre-Pandemic | Change % 20_21 | Peak_Change % 20_21 | Baseload_Change % 20_21 | Baseload | Load Intensity | Final Score | ||||||||||||||||||||
|---|---|---|---|---|---|---|---|---|---|---|---|---|---|---|---|---|---|---|---|---|---|---|---|---|---|---|---|---|---|
| Energy Type 1 | C | E | H | C | E | H | C | E | H | C | E | H | C | E | H | C | E | H | C | E | H | C | E | H | C | E | H | T | |
| A | Education | 4 | 4 | 4 | 3 | 4 | 4 | 5 | 4 | 4 | 1 | 1 | 1 | 1 | 1 | 1 | 1 | 1 | 1 | 2 | 4 | 3 | 2 | 2 | 1 | 3 | 3 | 3 | 3 |
| B | Mixed | 4 | 4 | 2 | 4 | 4 | 2 | 4 | 4 | 3 | 1 | 3 | 5 | 2 | 1 | 4 | 1 | 3 | 4 | 4 | 4 | 4 | 4 | 4 | 3 | 3 | 4 | 4 | 4 |
| C | Mixed | 1 | 5 | 2 | 1 | 5 | 2 | 2 | 5 | 3 | 5 | 5 | 4 | 5 | 2 | 4 | 4 | 5 | 2 | 3 | 5 | 2 | 2 | 1 | 2 | 3 | 5 | 3 | 4 |
| D | Library | 3 | 1 | 3 | 2 | 1 | 3 | 4 | 3 | 4 | 2 | 5 | 5 | 2 | 5 | 5 | 2 | 1 | 4 | 3 | 3 | 3 | 1 | 5 | 3 | 3 | 3 | 4 | 4 |
| E | Bank | 3 | 4 | 4 | 3 | 3 | 4 | 3 | 4 | 2 | 3 | 2 | 1 | 5 | 4 | 1 | 4 | 4 | 1 | 3 | 4 | 4 | 2 | 5 | 4 | 4 | 4 | 3 | 4 |
| F | Office | 4 | 3 | 2 | 5 | 3 | 3 | 3 | 4 | 3 | 3 | 4 | 4 | 1 | 2 | 2 | 4 | 4 | 4 | 4 | 4 | 2 | 2 | 2 | 2 | 4 | 4 | 3 | 4 |
| G | Parliamentary | 4 | 1 | 2 | 4 | 1 | 1 | 5 | 3 | 2 | 2 | 2 | 4 | 3 | 4 | 5 | 2 | 3 | 5 | 5 | 2 | 1 | 1 | 5 | 1 | 4 | 3 | 3 | 4 |
| H | Office | 2 | 2 | 3 | 2 | 3 | 3 | 3 | 2 | 4 | 2 | 5 | 3 | 1 | 4 | 2 | 1 | 5 | 4 | 3 | 2 | 4 | 3 | 2 | 2 | 3 | 4 | 4 | 4 |
| I | Government | 3 | 4 | 2 | 3 | 5 | 3 | 3 | 3 | 1 | 4 | 5 | 5 | 2 | 3 | 4 | 4 | 5 | 5 | 3 | 3 | 3 | 3 | 1 | 4 | 4 | 4 | 4 | 4 |
| J | Government | 1 | 2 | 2 | 1 | 2 | 2 | 1 | 3 | 3 | 5 | 3 | 3 | 2 | 1 | 2 | 5 | 3 | 3 | 1 | 3 | 2 | 1 | 4 | 3 | 3 | 3 | 3 | 3 |
| M | Parliamentary | 4 | 1 | 1 | 3 | 1 | 1 | 4 | 2 | 1 | 1 | 2 | 2 | 2 | 2 | 2 | 2 | 2 | 3 | 2 | 2 | 2 | 5 | 4 | 1 | 3 | 2 | 2 | 3 |
| N | Parliamentary | 2 | 3 | 2 | 5 | 5 | 2 | 3 | 5 | 2 | 5 | 5 | 3 | 1 | 5 | 1 | 5 | 5 | 4 | 5 | 4 | 1 | 3 | 2 | 3 | 4 | 5 | 3 | 4 |
| P | Library | 3 | 1 | 3 | 2 | 1 | 3 | 2 | 1 | 4 | 4 | 5 | 4 | 3 | 5 | 4 | 4 | 5 | 4 | 2 | 1 | 5 | 3 | 5 | 2 | 3 | 3 | 4 | 4 |
| S | Media | 4 | 4 | 1 | 4 | 3 | 1 | 5 | 3 | 2 | 5 | 1 | 2 | 5 | 2 | 3 | 5 | 2 | 3 | 5 | 3 | 3 | 3 | 4 | 2 | 5 | 3 | 3 | 4 |
| U | Mixed | 5 | 5 | 4 | 5 | 4 | 3 | 5 | 5 | 5 | 1 | 2 | 2 | 1 | 3 | 2 | 1 | 4 | 2 | 5 | 5 | 4 | 4 | 2 | 4 | 4 | 4 | 4 | 4 |
| V | Court | 5 | 3 | 5 | 5 | 2 | 4 | 5 | 4 | 5 | 4 | 3 | 2 | 4 | 3 | 3 | 2 | 2 | 2 | 5 | 4 | 4 | 3 | 5 | 5 | 5 | 4 | 4 | 5 |
| X | Parliamentary | 3 | 4 | 2 | 3 | 4 | 4 | 4 | 3 | 4 | 3 | 3 | 3 | 3 | 4 | 1 | 4 | 3 | 4 | 4 | |||||||||
| Y | Government | 2 | 1 | 3 | 2 | 2 | 2 | 2 | 2 | 2 | 4 | 4 | 2 | 2 | 2 | 5 | 5 | 4 | 5 | 1 | 2 | 3 | 5 | 3 | 2 | 3 | 3 | 3 | 3 |
| Z | Office | 1 | 3 | 1 | 2 | 1 | 2 | 5 | 4 | 5 | 5 | 5 | 5 | 1 | 4 | 5 | 1 | 3 | 4 | 4 | |||||||||
| AA | Lab | 5 | 2 | 5 | 4 | 1 | 5 | 3 | 3 | 5 | 2 | 2 | 1 | 3 | 5 | 2 | 3 | 3 | 1 | 2 | 3 | 5 | 5 | 5 | 4 | 4 | 3 | 4 | 4 |
| AB | Office | 5 | 3 | 3 | 3 | 4 | 4 | 2 | 2 | 3 | 1 | 1 | 5 | 4 | 1 | 3 | 2 | 1 | 2 | 3 | 2 | 3 | 1 | 1 | 4 | 3 | 2 | 4 | 3 |
| AC | Lab | 5 | 5 | 5 | 5 | 5 | 5 | 4 | 5 | 5 | 3 | 4 | 1 | 4 | 5 | 1 | 3 | 2 | 1 | 2 | 5 | 5 | 5 | 3 | 5 | 4 | 5 | 4 | 5 |
| AD | Office | 2 | 3 | 5 | 3 | 3 | 5 | 3 | 1 | 5 | 3 | 2 | 2 | 3 | 5 | 3 | 3 | 2 | 3 | 4 | 1 | 5 | 3 | 1 | 5 | 3 | 3 | 5 | 4 |
| AE | Government | 2 | 2 | 1 | 2 | 2 | 2 | 1 | 1 | 2 | 2 | 1 | 4 | 4 | 3 | 5 | 3 | 1 | 2 | 1 | 1 | 1 | 5 | 2 | 3 | 3 | 2 | 3 | 3 |
| AF | Lab | 5 | 5 | 5 | 5 | 5 | 5 | 5 | 5 | 5 | 3 | 4 | 1 | 4 | 4 | 1 | 3 | 4 | 1 | 4 | 5 | 5 | 5 | 3 | 5 | 5 | 5 | 4 | 5 |
| AG | Lab | 1 | 3 | 3 | 5 | 4 | 4 | 1 | 2 | 4 | 5 | 3 | 5 | 3 | 3 | 4 | 2 | 2 | 3 | 1 | 2 | 2 | 4 | 2 | 4 | 3 | 3 | 4 | 4 |
| AH | Office | 1 | 1 | 1 | 1 | 2 | 1 | 1 | 1 | 1 | 4 | 3 | 4 | 1 | 3 | 4 | 5 | 3 | 5 | 2 | 1 | 1 | 1 | 3 | 1 | 2 | 3 | 3 | 3 |
| AI | Office | 1 | 3 | 1 | 1 | 4 | 1 | 1 | 2 | 1 | 3 | 1 | 5 | 5 | 1 | 5 | 1 | 1 | 5 | 1 | 2 | 1 | 4 | 1 | 1 | 3 | 2 | 3 | 3 |
| AJ | Office | 2 | 5 | 4 | 4 | 5 | 4 | 2 | 5 | 4 | 2 | 3 | 2 | 3 | 4 | 3 | 1 | 4 | 2 | 4 | 5 | 5 | 4 | 1 | 5 | 3 | 4 | 4 | 4 |
Disclaimer/Publisher’s Note: The statements, opinions and data contained in all publications are solely those of the individual author(s) and contributor(s) and not of MDPI and/or the editor(s). MDPI and/or the editor(s) disclaim responsibility for any injury to people or property resulting from any ideas, methods, instructions or products referred to in the content. |
© 2023 by the authors. Licensee MDPI, Basel, Switzerland. This article is an open access article distributed under the terms and conditions of the Creative Commons Attribution (CC BY) license (https://creativecommons.org/licenses/by/4.0/).
Share and Cite
Awad, H.; Ashouri, A.; Rizvi, F. How Building Energy Use Reacted to Variable Occupancy Pre- and Post- COVID-19 Pandemic—Sensitivity Analysis of 35 Commercial Buildings in Canada. Buildings 2023, 13, 2160. https://doi.org/10.3390/buildings13092160
Awad H, Ashouri A, Rizvi F. How Building Energy Use Reacted to Variable Occupancy Pre- and Post- COVID-19 Pandemic—Sensitivity Analysis of 35 Commercial Buildings in Canada. Buildings. 2023; 13(9):2160. https://doi.org/10.3390/buildings13092160
Chicago/Turabian StyleAwad, Hadia, Araz Ashouri, and Farzeen Rizvi. 2023. "How Building Energy Use Reacted to Variable Occupancy Pre- and Post- COVID-19 Pandemic—Sensitivity Analysis of 35 Commercial Buildings in Canada" Buildings 13, no. 9: 2160. https://doi.org/10.3390/buildings13092160