Article

Experimental and Analytical Study on the Axial Behavior of Circular High-Strength Concrete Columns with Hybrid Carbon Fibers and Steel Confinement System

1
Faculty of Civil and Environmental Engineering, Technion—Israel Institute of Technology, Haifa 32000, Israel
2
Department of Civil Engineering, Braude College of Engineering, Karmiel 216100, Israel
*
Author to whom correspondence should be addressed.
Buildings 2023, 13(9), 2180; https://doi.org/10.3390/buildings13092180
Submission received: 3 August 2023 / Revised: 22 August 2023 / Accepted: 24 August 2023 / Published: 28 August 2023
(This article belongs to the Section Building Structures)

Abstract

:
This paper describes a work that examines a new solution to the problem that arises from the relatively high amount of transverse reinforcement required in HSC columns. It presents an alternative to common transverse steel reinforcement, a dual system comprising steel ties and a carbon-fiber mesh (CFM) applied internally together with steel ties. The behavior of the proposed system was examined in this work in a series of twelve laboratory tests of circular stub column specimens. The experiments performed in this work focused on the columns’ load and displacement capacities. The tests were planned with the aid of an analytical model that was originally developed for a hybrid system of external fiber-reinforced polymer (FRP) sheets and internal steel, and was adapted for the current system. An analysis of the results shows that for a given amount of conventional transverse steel, the application of the carbon-fiber meshes adds efficiency to the rebar confinement system, in terms of both the load bearing capacity and the ductility, and for specimens with the hybrid confinement system, the higher the carbon fiber amount the larger the ductility improvement. Furthermore, fair to good agreement was observed between the model and the measured stress–strain curves, especially those of the peak stresses. Based on the above findings and the added benefit of fire resistance, the hybrid method appears to be promising for confining HSC columns.

1. Introduction

The structural and material properties of high-strength concrete (HSC) have been studied for several decades [1,2,3,4,5,6,7,8,9]. HSC is often used in high-rise buildings to reduce the cross-sectional area of columns and increase floor space. An important aspect of column design is the employment of confined concrete behavior at the ultimate limit state to allow the enhancement of both the column’s load bearing and deformation capacities. Enhanced deformation capacity is required even for braced columns not considered part of the seismic-force-resisting system which can be subjected to eccentric loads such as those developed in the event of an earthquake (e.g., [10]). The modeling of reinforced concrete (RC) column behavior is commonly based on their confined constitutive (stress–strain) relations [11,12,13,14,15,16,17]. For this reason, it is also important to understand the uniaxial behavior of confined RC columns.
A RC column’s confinement is commonly provided by transverse steel reinforcement, which responds passively to the lateral expansion of concrete (subjected to axial loading), especially when it is already cracked [18,19]. It is well known that the required confining steel volume increases as concrete strength increases (e.g., [20]). For example, for a circular HSC column (with a compressive concrete strength of fc = 100 MPa) with a diameter of 1000 mm designed to bear half of the unconfined nominal capacity ( P A c f c = 0.5 where Ac is the column cross-section area), ACI 318 [21] requires a 22 mm transverse steel reinforcement (fy = 400 MPa) spaced at 70 mm (center-to-center) which leads to a clear spacing of only 48 mm. This is a high amount of transverse steel reinforcement which can cause technical difficulties during casting and inhibit fresh concrete flow [10].
Confining a concrete column with a steel tube can be a possible solution to the high-strength concrete confinement issue [22]. However, steel is sensitive to environmental influences such as fire or corrosion [23,24], which might compromise the confinement system, necessitating special treatment for fire resistance [25] and corrosion protection [26].
Another possible solution to high-strength concrete confinement is to wrap fiber-reinforced polymer (FRP) sheets around the HSC column. Many studies have examined this method for increasing confinement in concrete columns and reducing lateral steel requirements (e.g., [27,28,29,30,31,32,33,34,35,36]). Yet, when considering performance under fire events, external FRP wrapping leads to low fire resistance, requiring additional insulation to protect the column [37,38]. This is because the polymer matrix strength of the FRP and the bond between the FRP and concrete is severely reduced at temperatures higher than the glass transition temperature of the FRP system (about 60 to 82 °C) [39,40]. Thus, the external application of FRP sheets is more sensitive to fire compared with that of reinforcing steel, which is protected by the concrete cover and at external temperature of 300 °C loses only 20% of its strength [41,42,43]. A further concern regarding the use of external FRP is the necessity to enhance its durability and to take into account the influence of time-dependent characteristics on the FRP [44].
This work presents a new solution that combines a steel transverse reinforcement and a carbon-fiber mesh (CFM) which are both placed inside newly constructed HSC columns (i.e., before casting), thus providing both confinement and fire safety. This method was examined in an experimental program that employed an uncoated carbon-fiber mesh without a polymer resin. This polymer-free mesh has high fire resistance [41] and therefore it could allow reduced concrete cover, compared with that required for a concrete column reinforced with only conventional steel reinforcement.
Th feasibility of the proposed innovative method has been demonstrated in [33,45,46,47,48] and this research was aimed at studying the experimental and analytical behavior of HSC stub columns with the proposed hybrid reinforcement system. The experiments performed in this work focused on the columns’ load and displacement capacities, where the latter is henceforth denoted here as ductility. The work demonstrates, experimentally and analytically, the method’s effectiveness as well as the role of each component of the hybrid confinement.

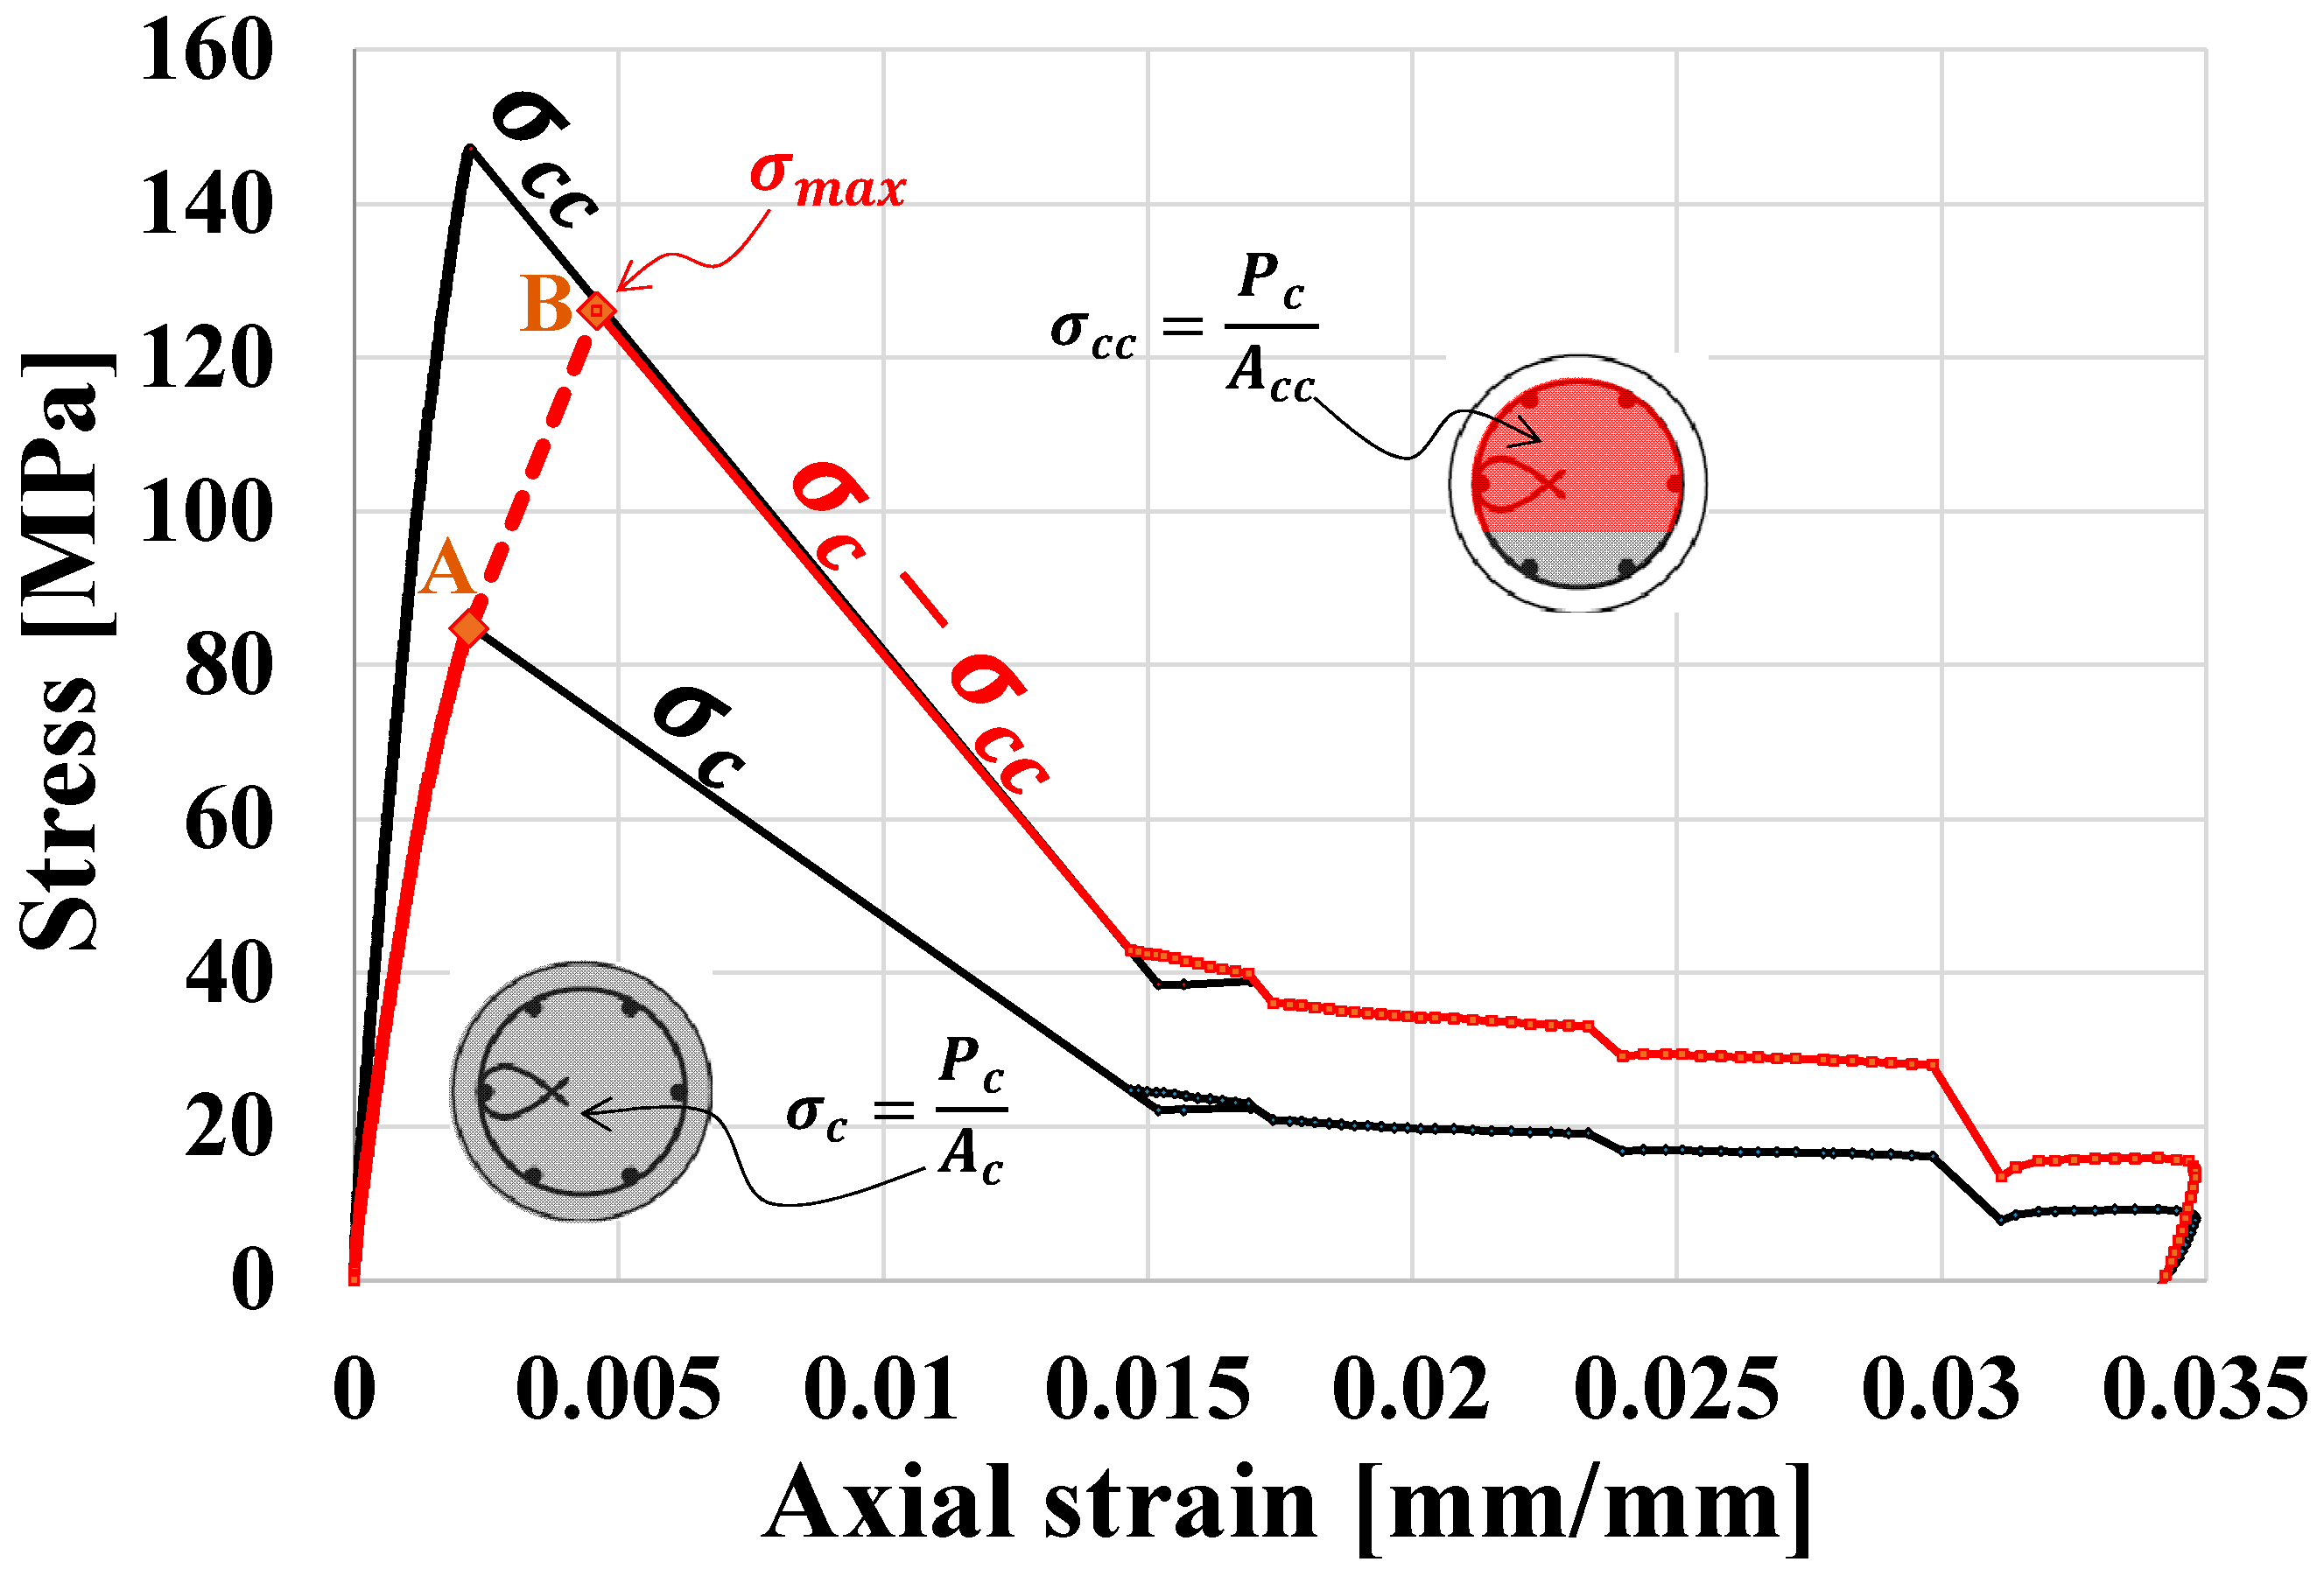
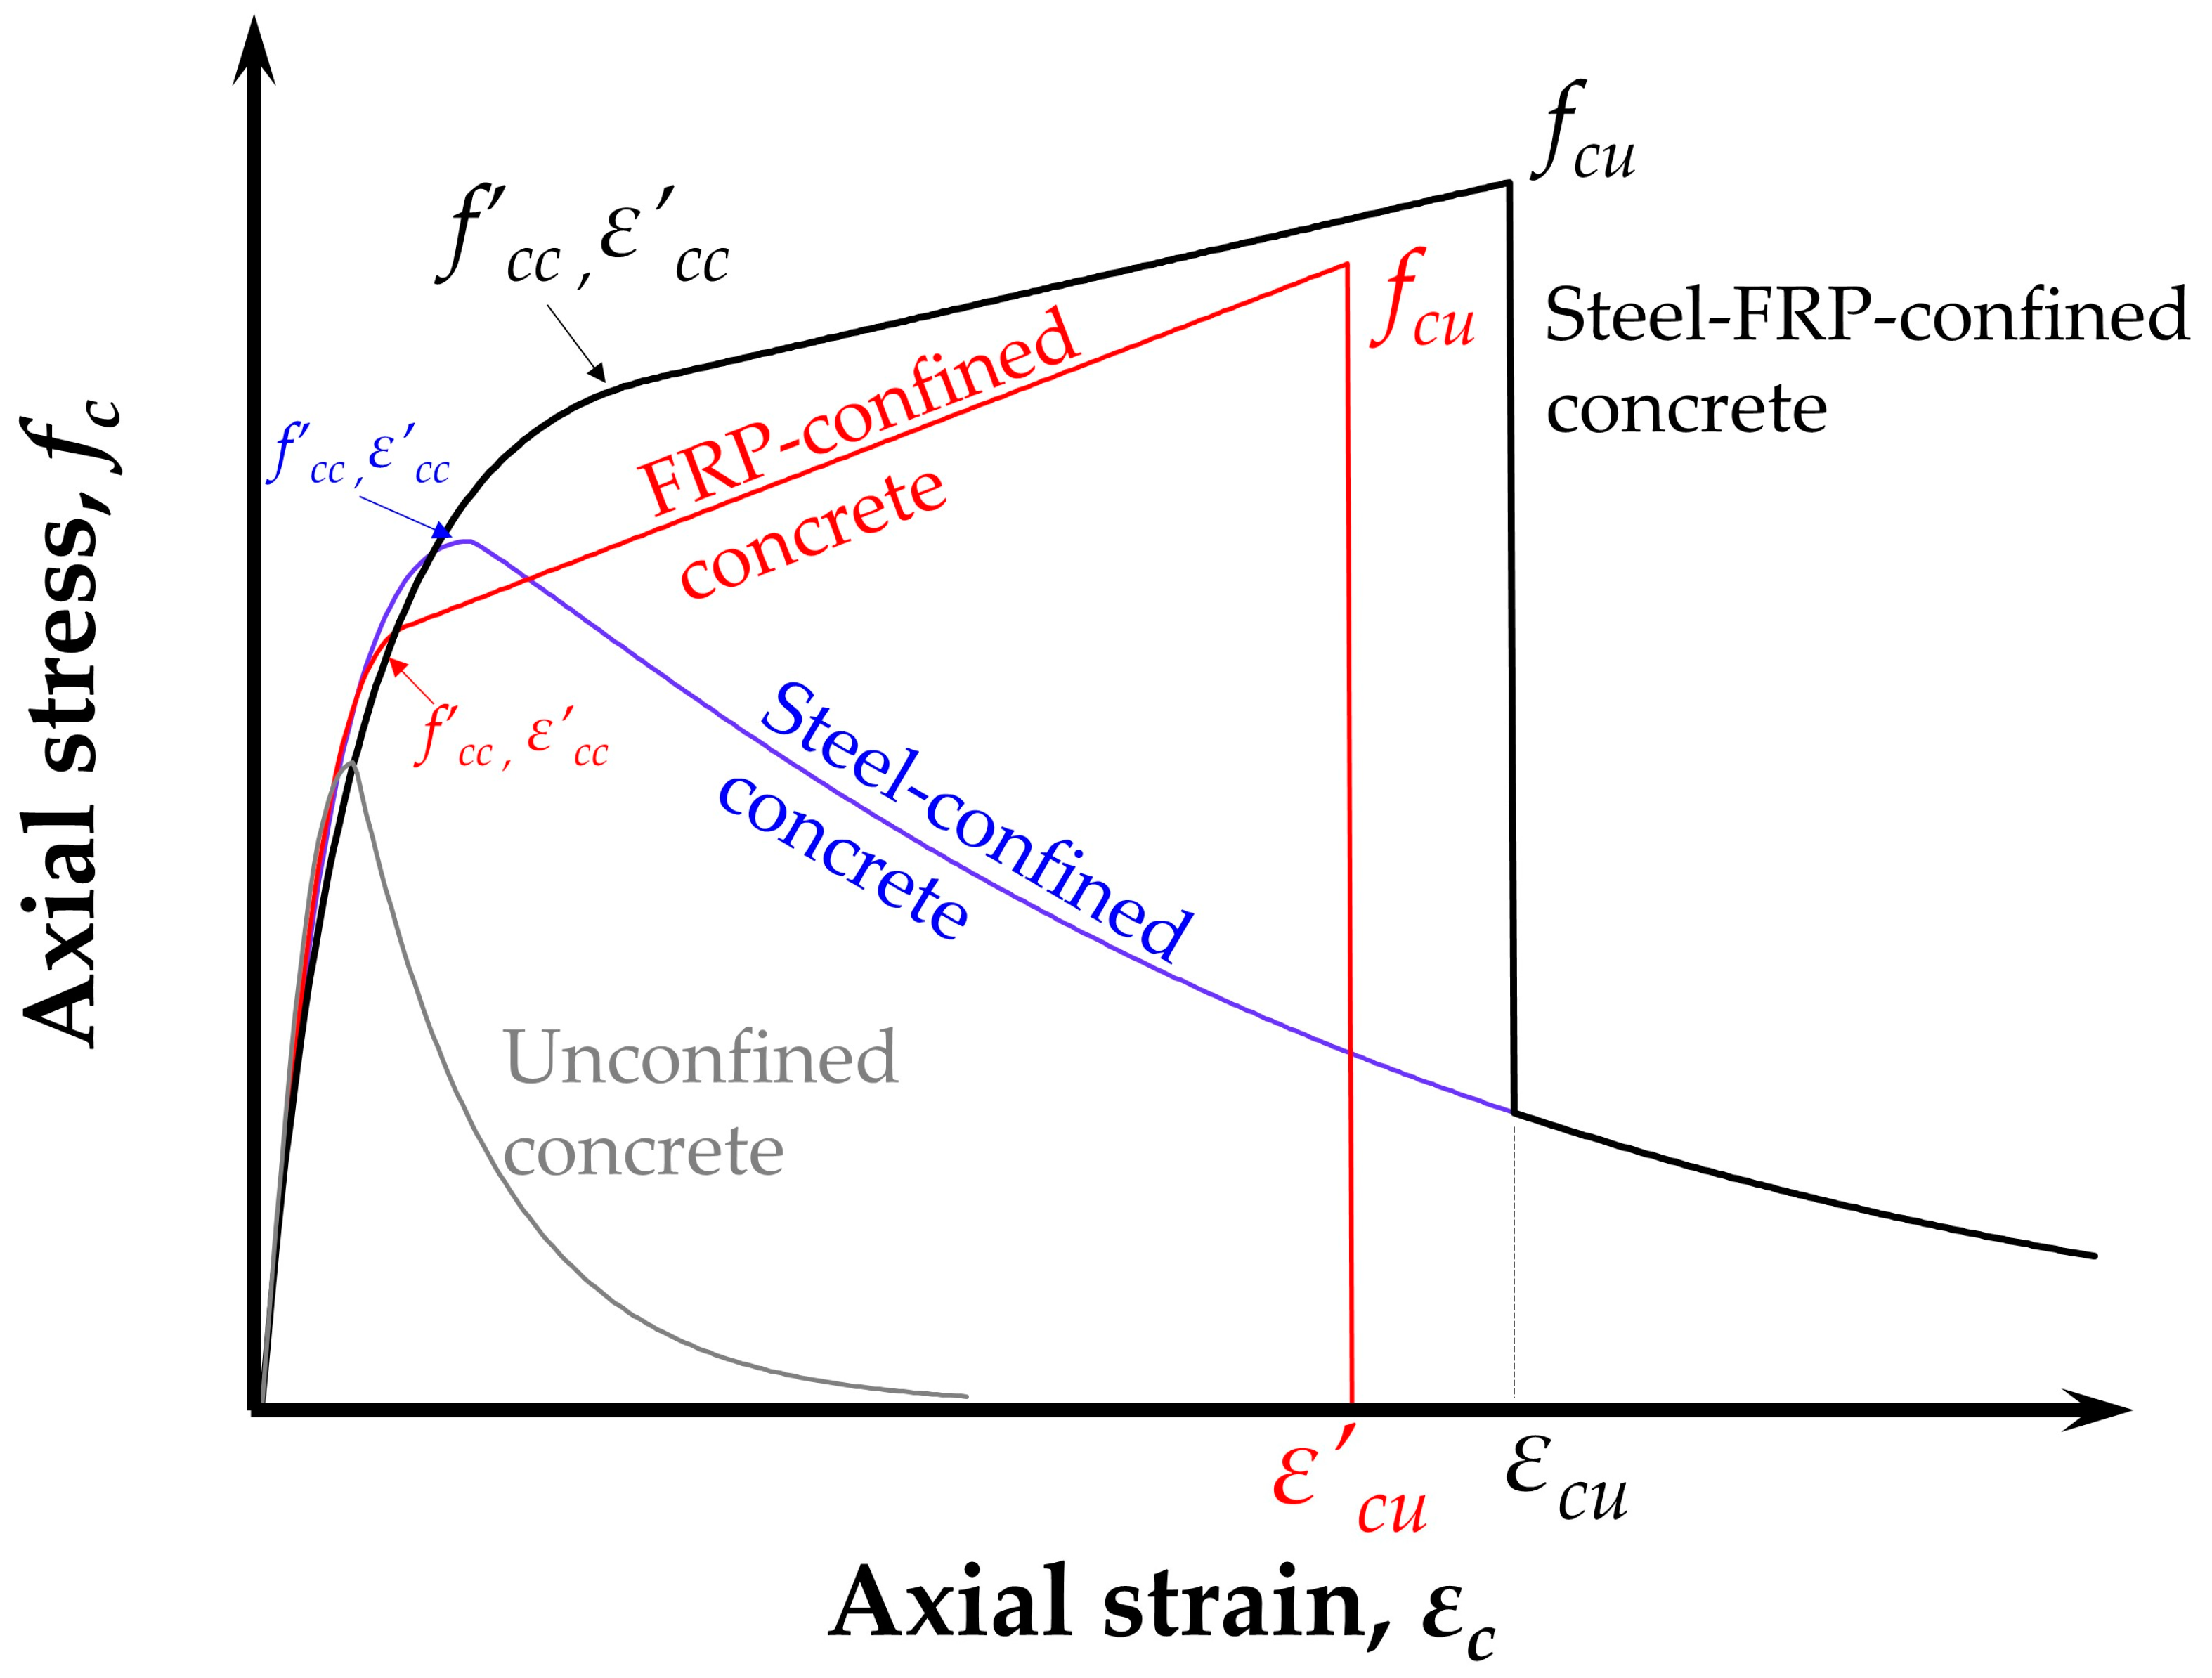
2. Dual Confinement Model

A model for predicting the axial behavior of a circular column with the dual, internal steel, and external FRP confinement system was proposed by Eid and Paultre [12]. This model was used for a tentative design of the experimental program (see Section 4) and then, its predictions of the column specimens’ axial stress–strain behavior were examined via a comparison with the experimental results (Section 6.4).
This chapter presents a model for the axial behavior of a circular column with the dual, steel and CFM confinement system. This model, originally developed by Eid and Paultre for an internal steel and external FRP hybrid system, was used for a tentative design of the experimental program (see Section 3) and then, its predictions of the column specimens’ load–displacement behavior were examined via a comparison with the experimental results (Section 6.4).
The confinement provided by the passive lateral pressure of both the steel and the carbon mesh is a function of their tensile strain, which results from the lateral expansion of the confined concrete. To account for the confining actions of both components, the model of [12] was adapted (see Figure 1). The original model is based on the assumption that the lateral strains of the transverse steel and of the FRP are equal [49]. Here, this assumption becomes redundant since the CFM is placed internally, at the same location as the transverse steel. The following text describes the main features of the axial stress–strain relations of a circular steel CFM laterally reinforced concrete column.
The pre-peak branch of the model is based on the modified expression of the fractional relationship proposed by Sargin [50] and used also by Cusson and Paultre [51] and by Légeron and Paultre [52]. The confined concrete parameters defining the stress–strain curve shown in Figure 1 are the normalized confined concrete strength and its corresponding peak strain, given by Equations (1) and (2) [12], respectively.
f c c f c = 1 + 2.4 · I e 0.7
ε c c ε c = 1 + 35 · I e 1.2
where f’cc and f’c are the confined concrete strength and unconfined concrete strength (respectively), ε′cc and ε′c are the strain corresponding to fcc and fc (respectively), and I e is a confinement index, which is derived from equilibrium and strain compatibility [53] and given by:
I e = I e 1 = ν c c κ 1 η I e 2                                 ; f o r   κ 1 > η   a n d   κ 2 > η     I e 2 = ν c c f c + κ 2 ρ s e f h y f c κ 2 η I e , m a x             ; f o r   κ 1 η   a n d   κ 2 > η     I e , m a x = ρ s e f h y + E f l ε f u ξ f c                   ; f o r   κ 1 η   a n d   κ 2 < η
where ρ s e is a function of the volumetric transverse reinforcement ratio multiplied by an arching geometrical effectiveness factor (between 1 for transverse reinforcement with zero clear spacing and 0 for a column without transverse reinforcement), fhy is the transverse steel yield strength and E f l is the lateral stiffness of the carbon fibers. In circular columns, ρ s e is equal to half of the volumetric transverse reinforcement ratio multiplied by the effectiveness factor and E f l = 2 t e q E f D c , where Dc is the column core diameter (center-to-center of the ties), Ef is the elastic modulus of the carbon fibers, and ξ is a ‘strain efficiency factor’ of the carbon mesh, which ranges from 0.55 to 0.61 [39]. t e q = A s t r a n d S f is the equivalent thickness of the fibers, which considers the spacing, S f , between fiber strands.
The coefficients κ 1 , κ 2 , η , and ν c c are given by the following:
κ 1 = E c E s l + E f l ;   κ 2 = E c E f l ;   η = 29.8 ν c c 3.56 ν c c = 10 f c E f l + E s l · γ s f 0.9 0.5 ν c 0
where E s l = ρ s e E s is the lateral steel stiffness, the coefficient ν c 0 is the unconfined concrete Poisson’s ratio and γ s f = ε h y ε f u is the ratio between the lateral steel yield strain and the carbon fibers’ ultimate strain for a column with hybrid CFM–transverse steel confinement and γ s f = 0.133 for a column confined with only transverse steel confinement.
The post-peak branch of the stress–strain curve is calculated via an expression proposed in Eid and Paultre [12] (see Figure 1). This branch can be of a descending or ascending nature depending on the confinement level. For lateral strains larger than the carbon fiber’s rupture strain, the column is confined only by the transverse steel and the stress–strain relationship is calculated with the above parameters but without the carbon fiber’s influence (i.e., E f l = 0 in Equations (3) and (4)).

3. Experimental Program

The role of each component of the hybrid confinement system was examined in an experimental program comprising 12 HSC specimens with different amounts of transverse steel and CFM. The stub column specimens were circular, with a 250 mm diameter and 950 mm height.

3.1. Material Properties

3.1.1. Concrete

The HSC mixture had a 0.24 water:cement ratio and it included 2 kg/m3 Polypropylene fibers. The fibers were added to HSC mixtures to avoid spalling in case the elements were exposed to elevated temperatures (as recommended in EN-1992-1-2 [43]).
The average compressive strength measured using 150 × 150 mm cubes at 28 days was 99.6 MPa (corresponding to an average cylinder strength of 84.7 MPa by applying a cube-to-cylinder conversion factor of 0.85) with a standard deviation of 3.7 MPa. Details of the concrete mixture properties are shown in Table 1.

3.1.2. Reinforcing Steel

Six longitudinal deformed steel bars (see Figure 2) measuring 12 mm in diameter were used (with a longitudinal reinforcement ratio of ρl = 1.4%). The average tensile yield strength was 561 MPa, as evaluated via testing four specimens from the same batch. The circular ties (see Figure 2) were deformed steel bars measuring 10 mm in diameter with an average yield strength of 582 MPa (obtained from tension tests of four specimens). The rupture strains of the ties and of the longitudinal rebars were 12 and 15% (respectively).

3.1.3. Carbon-Fiber Mesh (CFM)

The CFM was uncoated and polymer-free (‘Solidian GRID Q95-CC-38’ and ‘Solidian GRID Q71-CC-51’ [54]). The modulus of elasticity of the mesh fibers was 230,000 MPa with a rupture strain of ε f u = 0.013 , and the cross-section area of each strand was Astrand = 3.62 mm2 (as reported by the manufacturer). The spacing of the strands, S f , was 51 or 38 mm.
Notably, planning the experimental program at this stage of the research involved considering only the relative amounts of the hybrid confinement system’s components. Consequently, the aspect of reinforcement congestion was not a factor in the planning of the test specimens, where it was understood that further development for practical use would be completed based on the current findings.

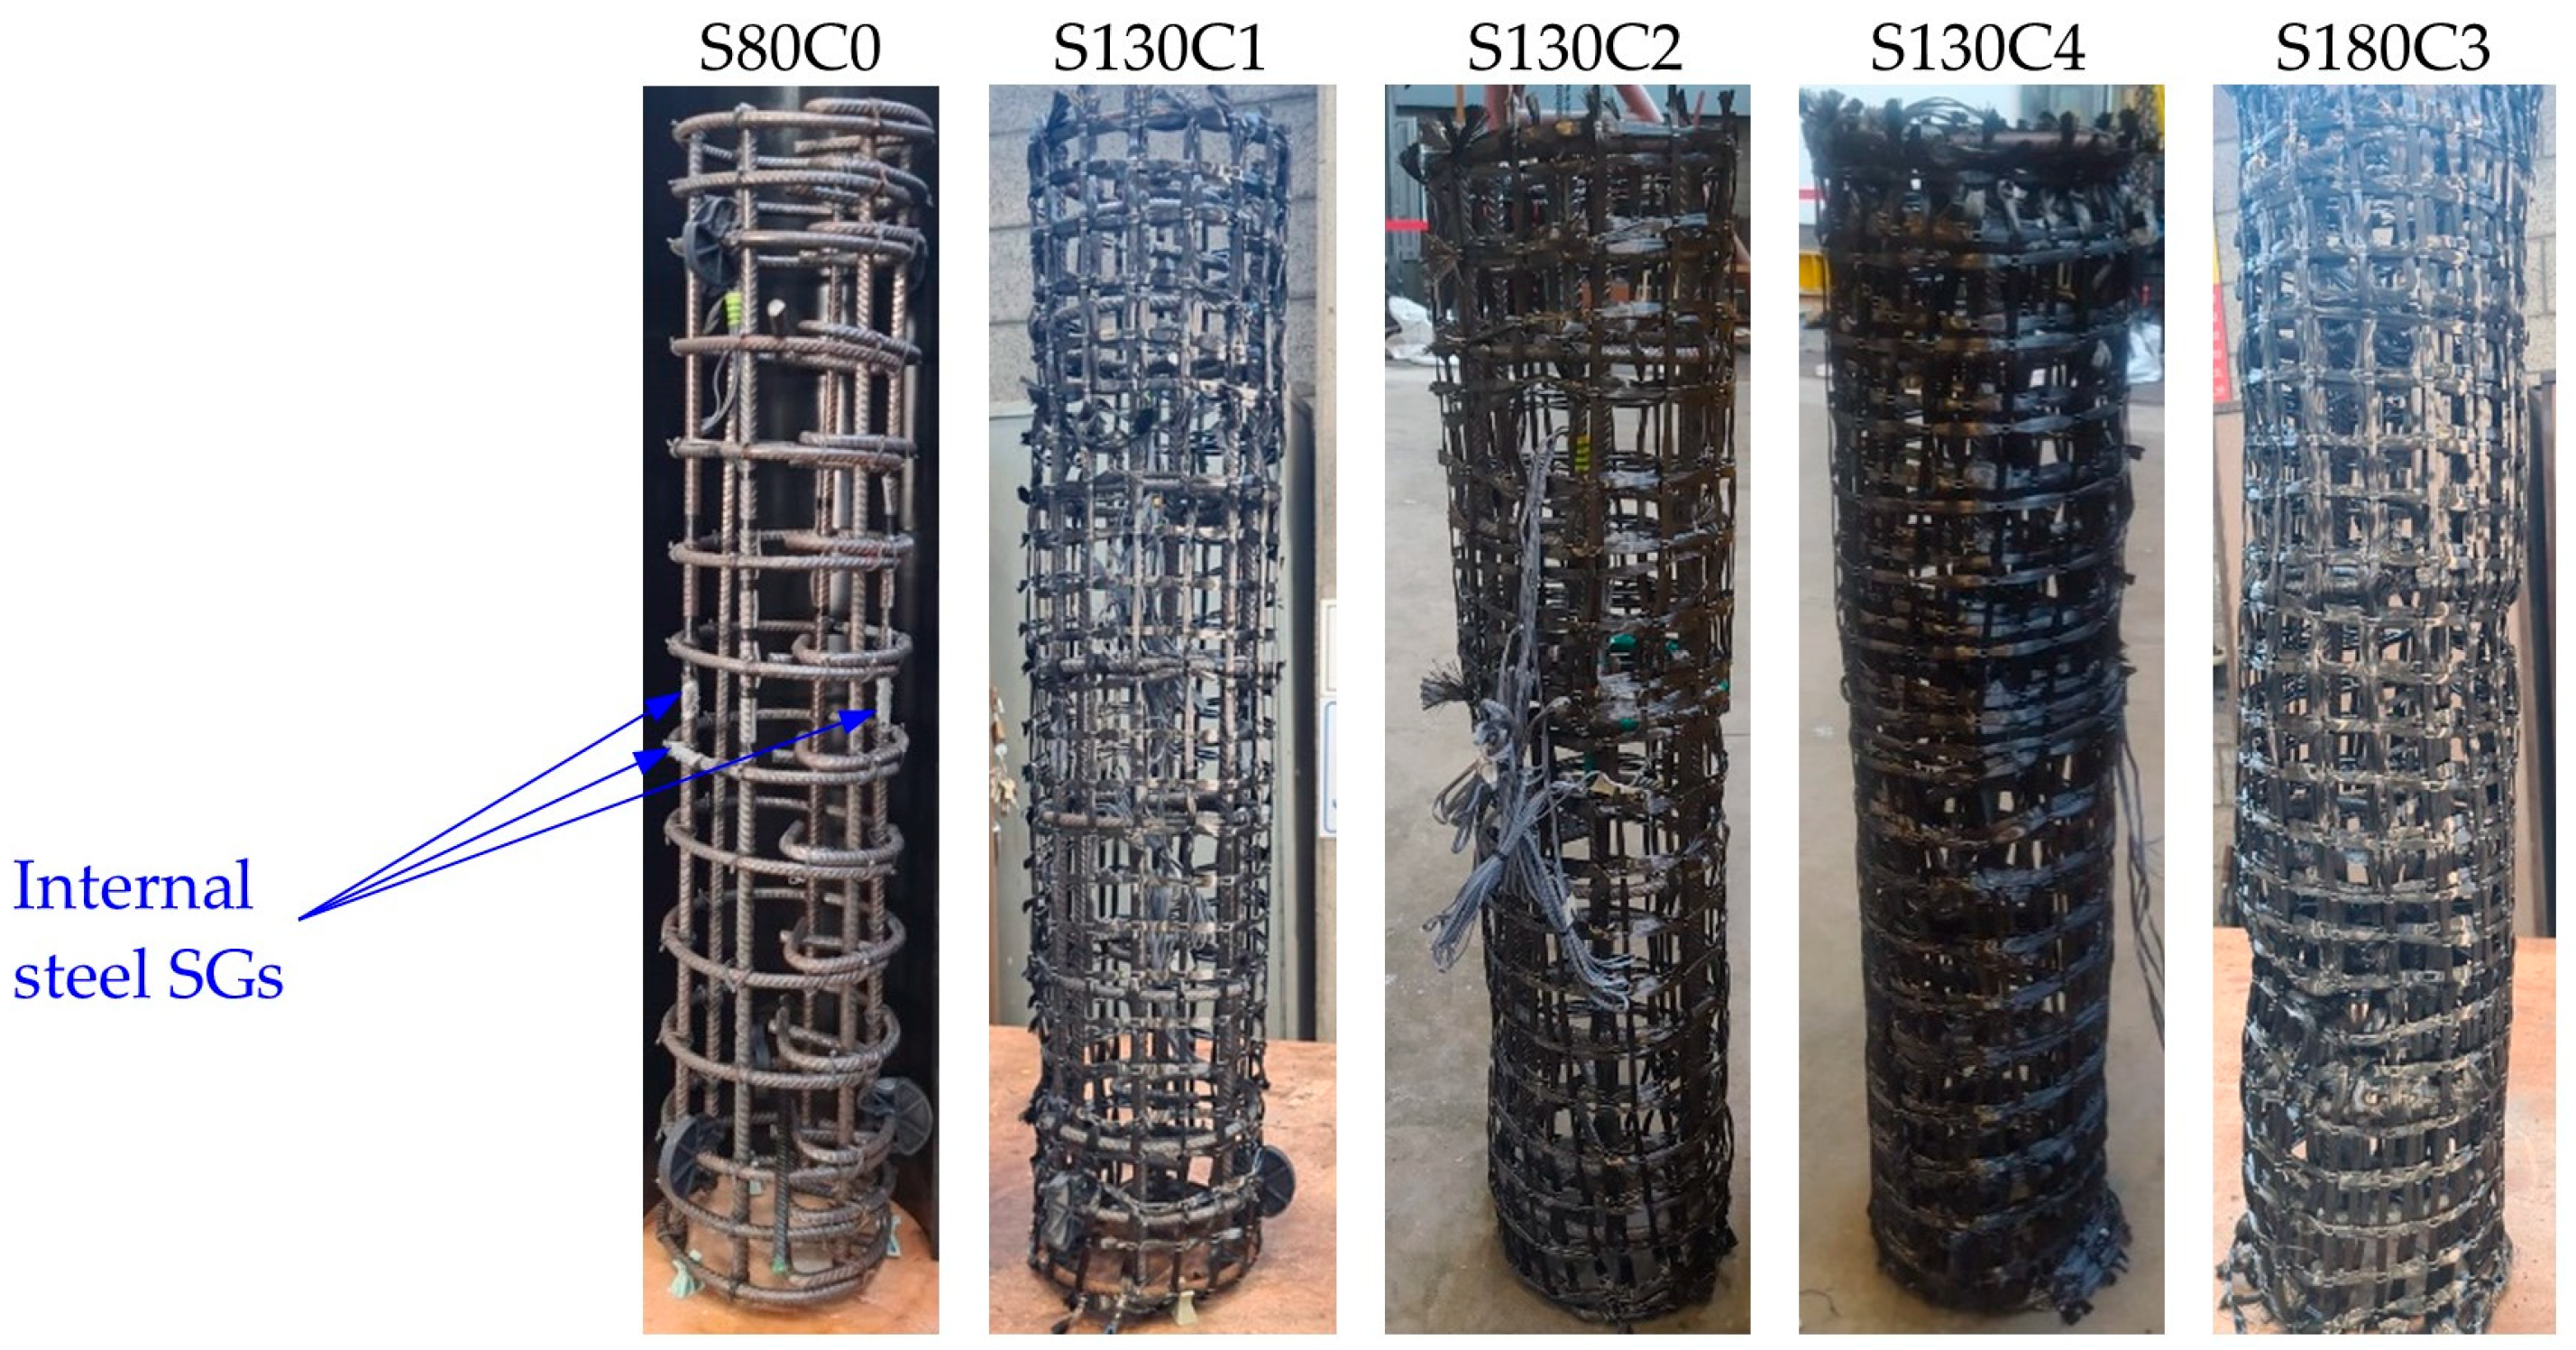
3.2. The Hybrid Confinement System
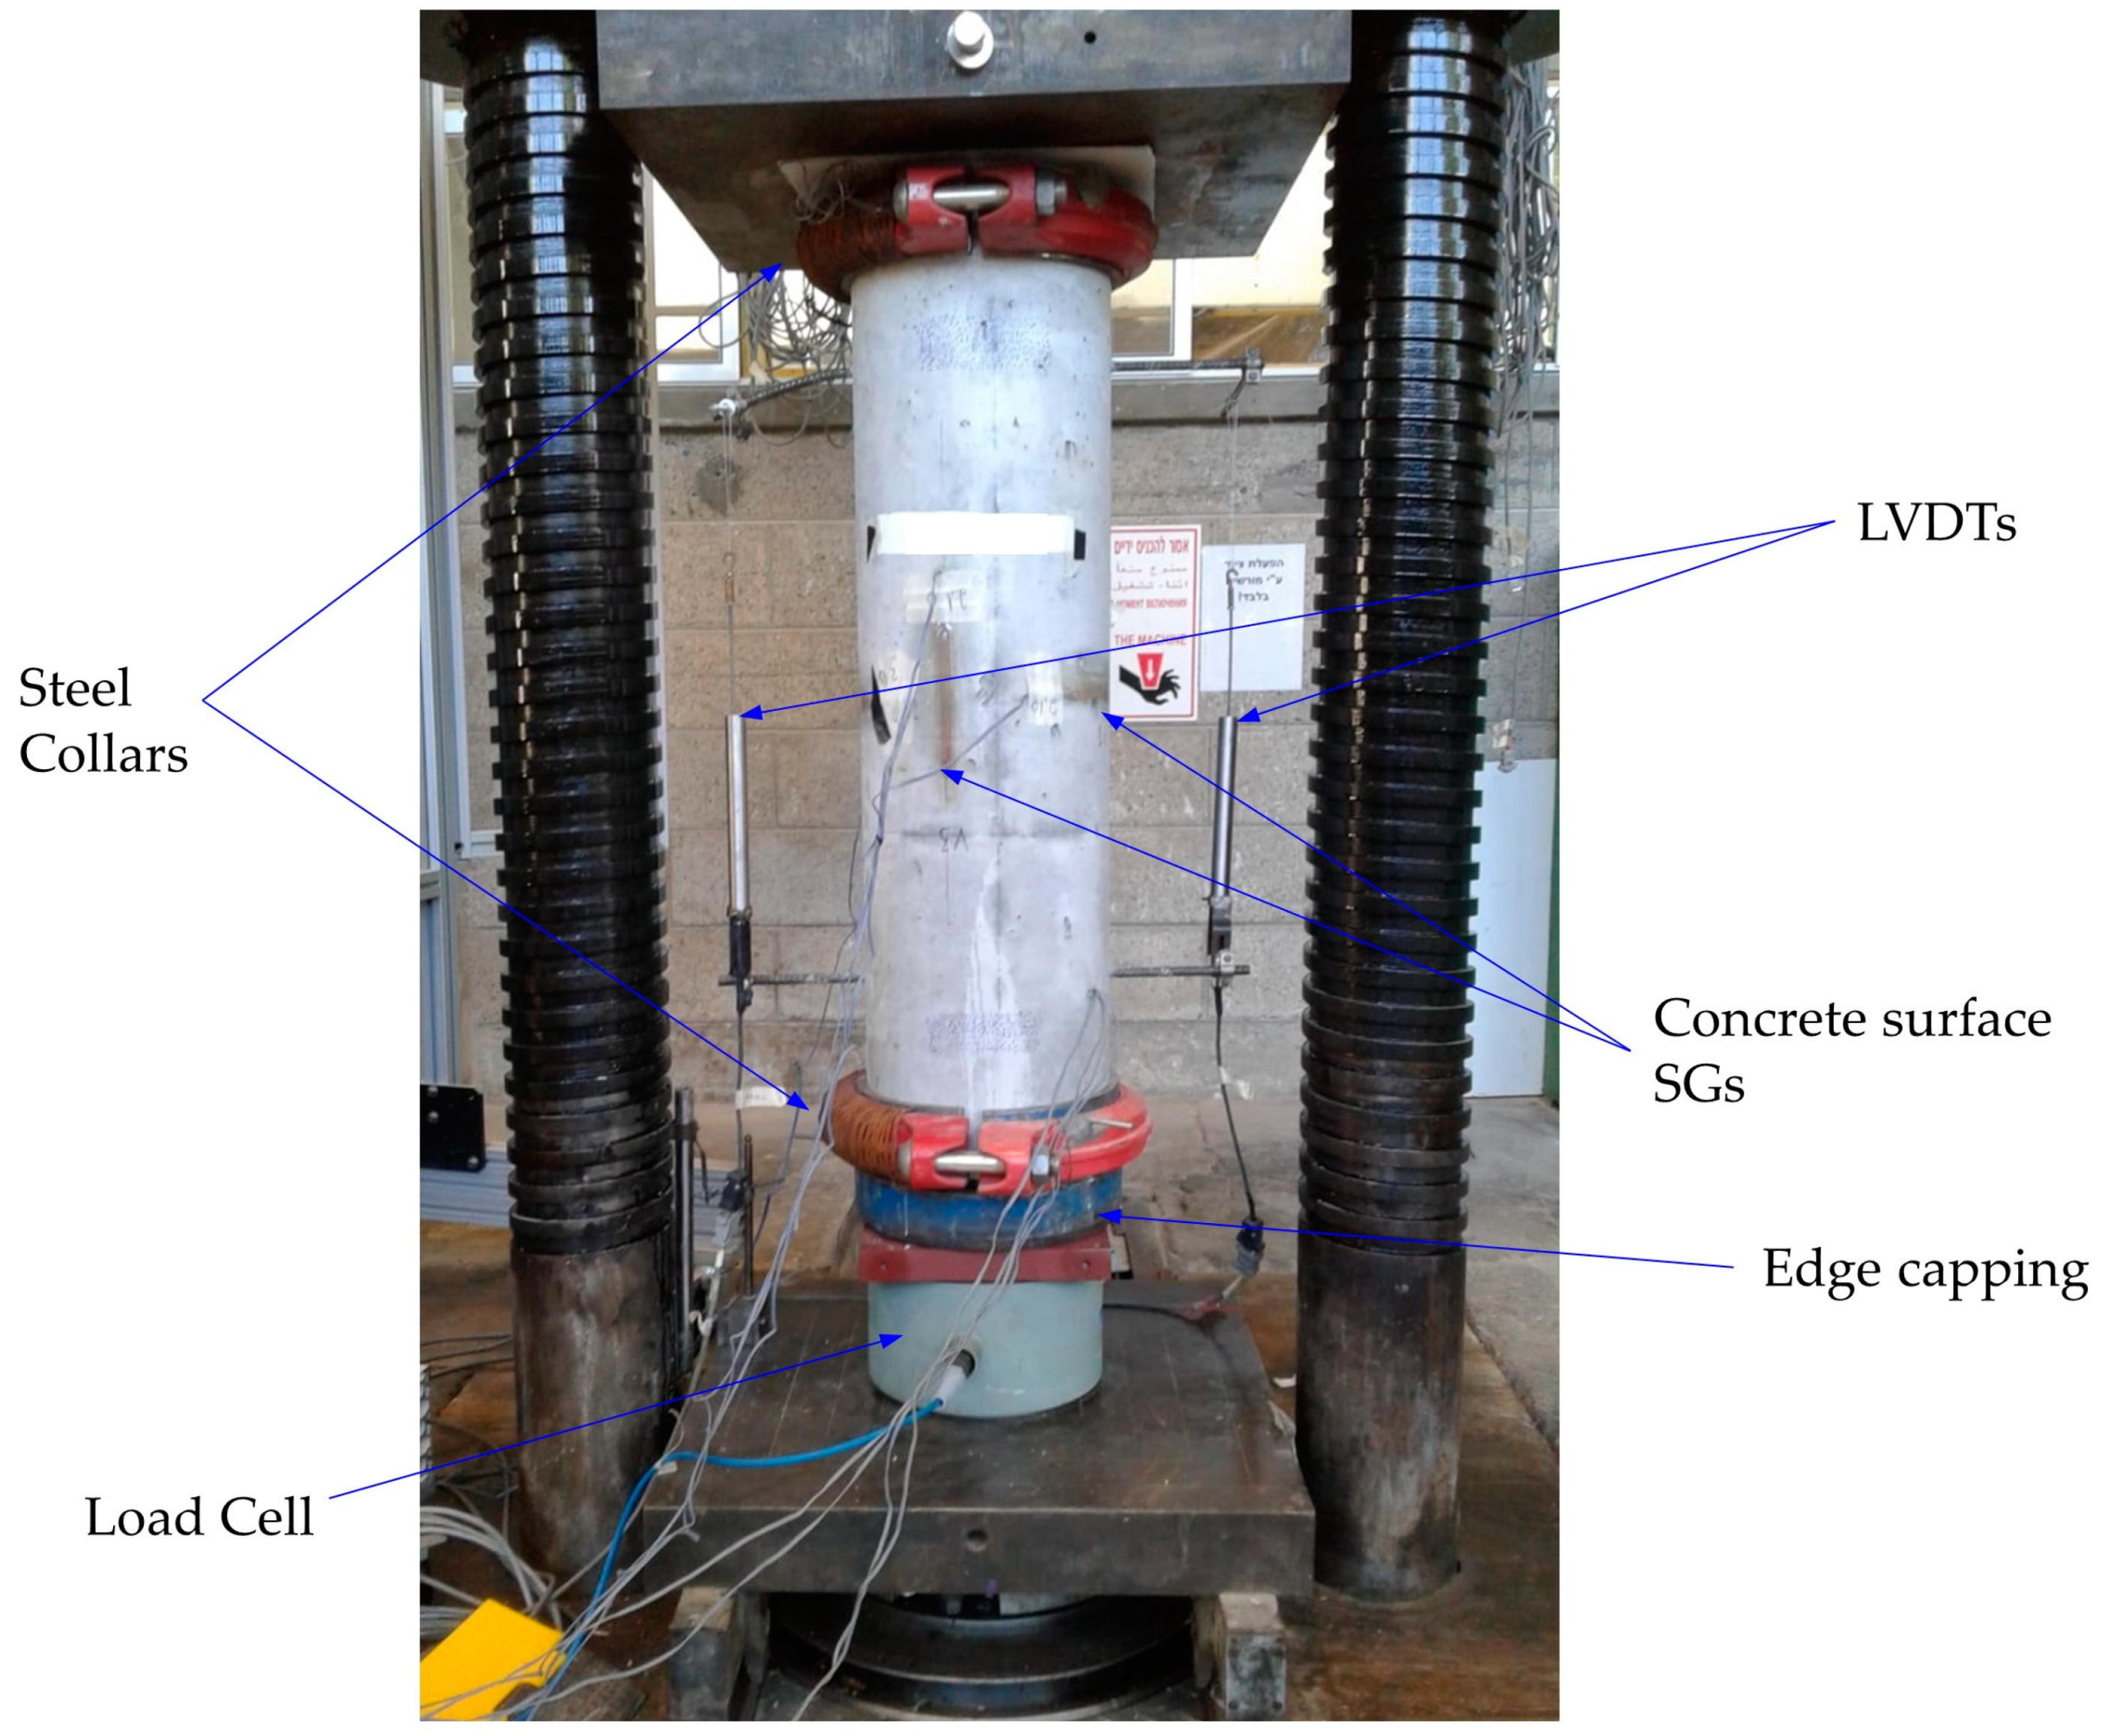
The test program was planned based on the model described above. A control specimen consisted only of transverse steel (without the CFM) with a transverse steel reinforcement volumetric ratio of 1.78%, provided by 10 mm steel ties, spaced at 80 mm. The other five specimen types with the hybrid reinforcement were designed (using the above-described model) to provide different confinement combinations, with lower amounts of transverse steel (than those provided in the control specimens) and the CFM with one, two, three, or four layers. At least two specimens of each type were tested (altogether 12 tests). The specimens are described in Figure 2 and the details of the specimens are presented in Table 2.

4. Test Setup

The column specimens were cast in a single batch at a concrete plant and were tested in the laboratory of the National Building Research Institute at Technion—Israel Institute of Technology.

4.1. Testing Machine

A rigid hydraulic 5 MN press with a manual stroke control was used to axially load the column specimens. In order to avoid failure due to the stress concentration, steel collars restrained the specimens at their edges, leaving free the 810 mm long mid-part of the column. A thin layer of sand was placed under the rougher side of the specimens (perpendicular to the casting direction) with a steel capping to level the specimen uniaxially. The experimental setup and instruments are shown in Figure 3.

4.2. Measurements

The axial load was measured using a 7.5 MN compression load cell. The deformations were measured using five external SGs (strain gauges) glued to the surface of the column, two in the lateral direction and three in the longitudinal direction (see Figure 3), and using four internal SGs bonded to each specimen’s steel reinforcement system—two on the longitudinal rebars and two on the ties, as shown in Figure 2 and Figure 4. All SG’s were placed at the mid-height point of the specimen. The global vertical deformation was measured using two LVDTs that were attached to the horizontal steel bars (before casting), extending on each side of the specimen (see Figure 2 and Figure 3).
Longitudinal global shortening was also measured via image analysis, applying the DIC (digital image correlation) technique. The photos were taken with a 4K video camera using a time-lapse mode of one frame per second. The measurements of the DIC were limited because of the concrete cover failure. Therefore, these results were used only in case the LVDT’s results suffered technical issues (specimens S130C2a and S130C2b).

5. Results and Discussion
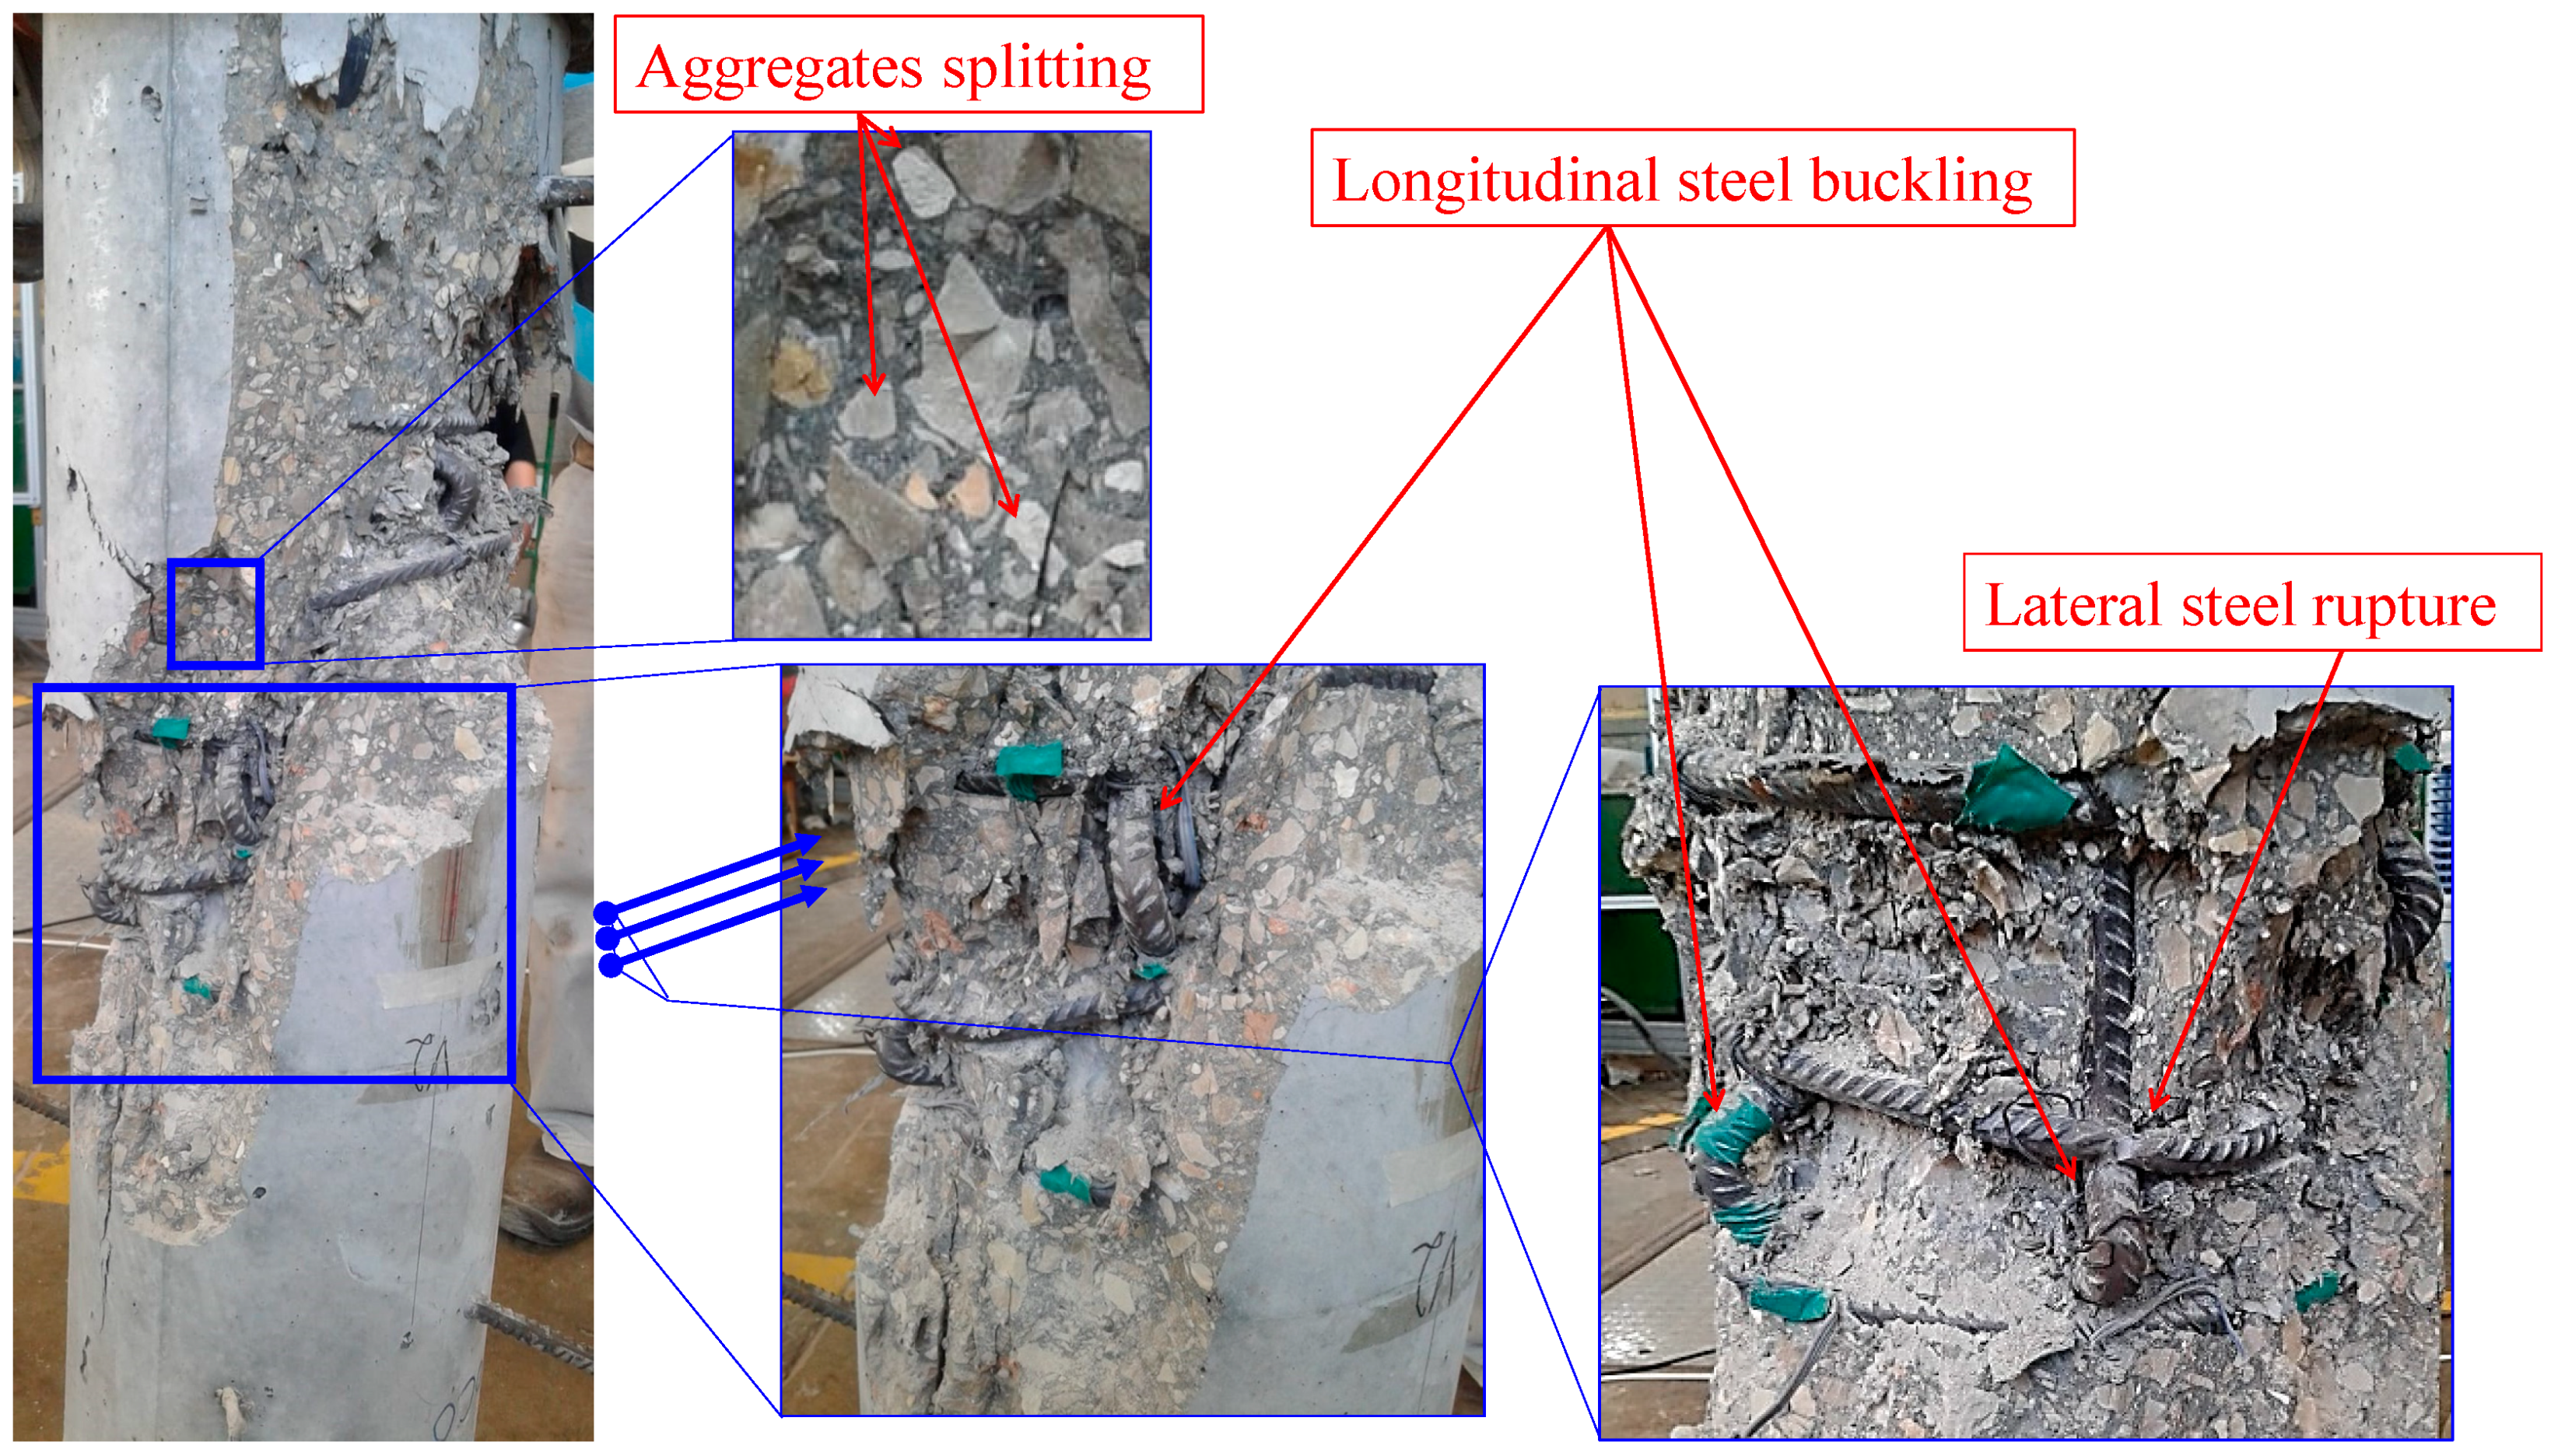
The machine stroke was controlled to yield load rates of 10–18 tons per minute until the failure of the concrete cover was observed. Then, the stroke rate was reduced to obtain post-peak measurements (as many as possible). The displacements of the column were measured using all the devices detailed above until the failure of the concrete cover. This failure was sudden and it was accompanied by relatively large displacement and a load decrease. In all cases, the maximal load was measured when the concrete cover failed.

5.1. Failure Mode

All specimens exhibited similar behavior, characterized by the spalling of the unconfined concrete cover, followed by the crushing of the concrete confined in the reinforcing cage. As shown in Figure 5, failure developed around the mid-height of the columns, and it was accompanied by local buckling of the longitudinal rebars (Figure 6). Furthermore, as shown in Figure 6 and Figure 7, the control specimens also exhibited rupture of their lateral ties, and similarly, full or partial rupture of their carbon strands was observed in the dually confined specimens. Thus, for the dually confined specimens, the test was terminated when the longitudinal steel buckled whereas for the control specimens this buckling was followed by the rupture of a steel tie and then the test ended. It can also be seen in Figure 6 and Figure 7 that concrete failure occurred due to the splitting of the aggregates, which is typical for HSC.
The core’s eventual failure occurred after a significant displacement of 15~21 mm, equivalent to a global vertical strain of 2~2.5%.

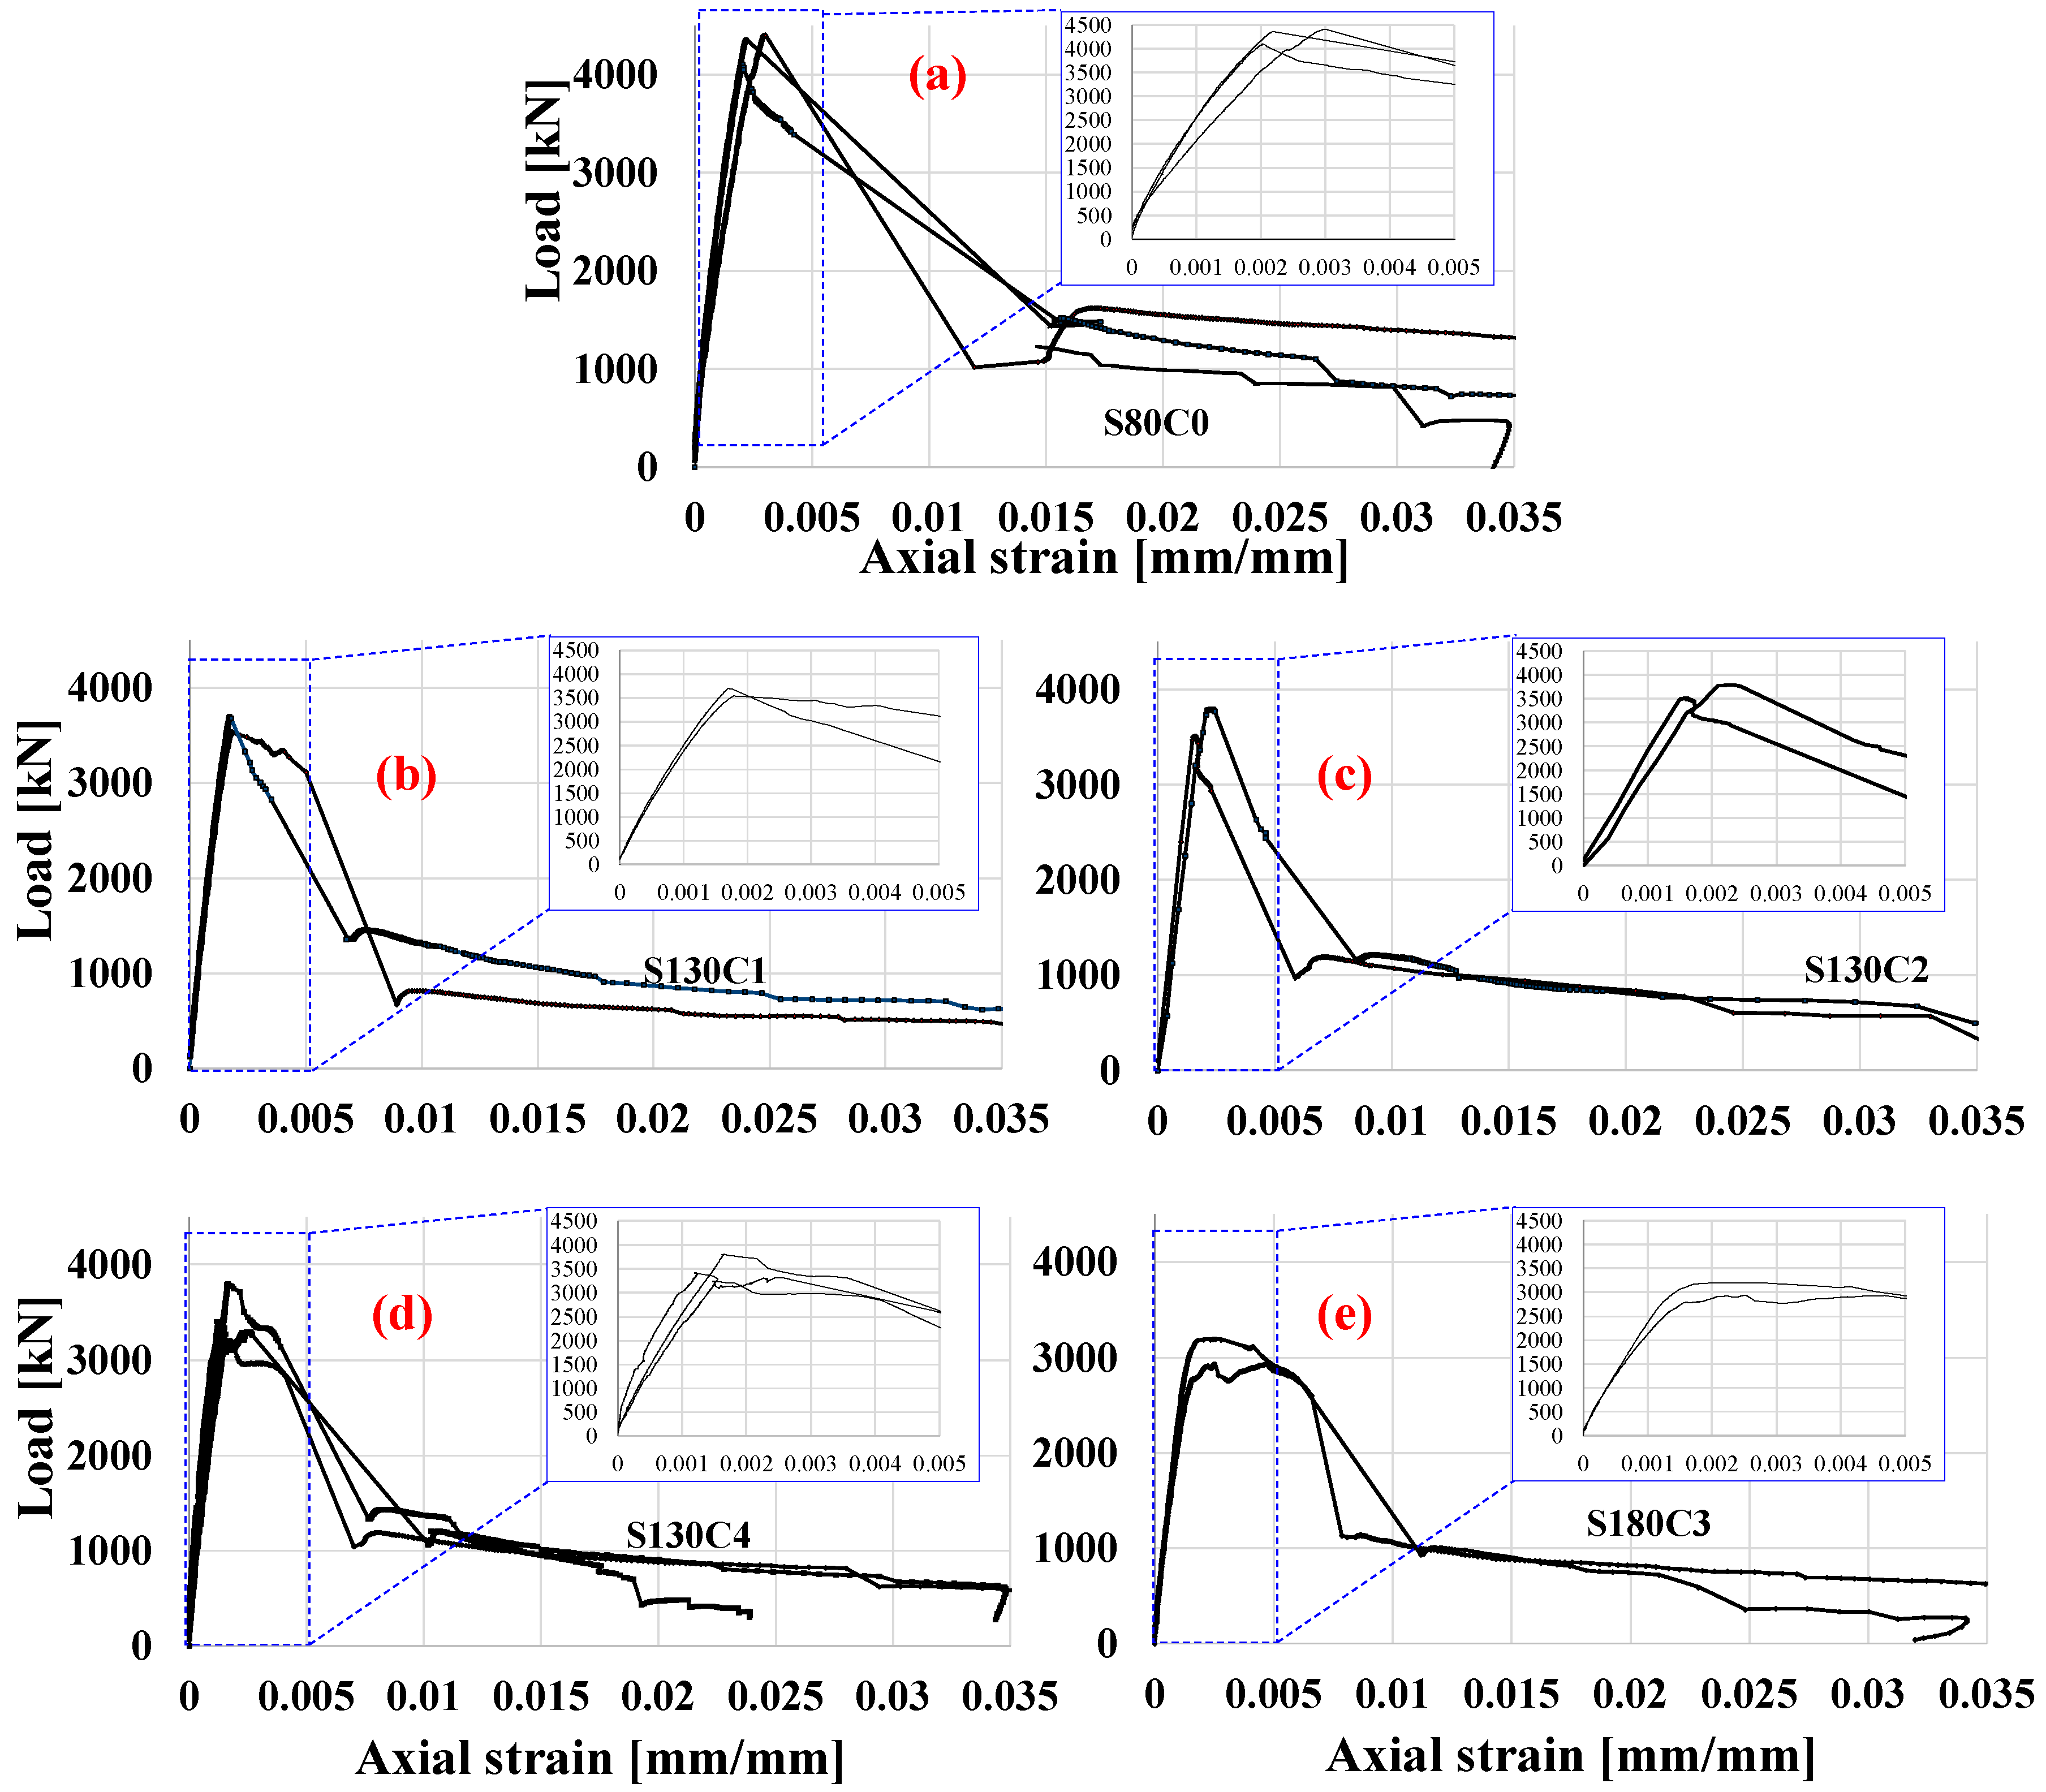
5.2. Load–Displacement Curves

During the sudden failure of the concrete cover, most of the strain gauges (SGs) went off-scale (both lateral and axial). The measurements of the vertical SGs matched those of the LVDTs in the ascending curve but only the LVDTs continued to also be measured in the post-peak part. In some specimens, the horizontal SGs on the concrete surface showed a large immediate strain during spalling but most of the SGs went off-scale right after the peak point. The lateral external strains, just before the spalling of the concrete cover occurred, are given in column 6 of Table 3.
The axial load–strain curves as measured via the LVDTs are presented in Figure 8 for all specimens except for the two specimens of type S130C2. For these specimens, the LVDT results suffered from technical issues during spalling and therefore their load–strain curves were obtained from the DIC backup measurements and they are shown in Figure 8c.
Maximal measured loads, the ratios between them and the unconfined nominal capacity ( P 0 = 0.85 f c A c ) are presented in columns 2–3 of Table 3. The axial displacements and strains at the maximal (peak) load are presented in columns 4–5 of Table 3.
As mentioned above, the peak load was reached when the concrete cover failed. For specimens with CFM confinement, it was somewhat lower (by ~12%) than that for control specimens (type S80C0). This difference may have been caused by the separation of the concrete cover from the concrete core at high axial loads, preventing the specimen from reaching its expected maximum load. This assumption is based on the observation that HSC columns with dense reinforcement steel cages can have longitudinal weakness planes between the concrete core and the concrete cover [55,56,57] and the perception that in specimens with the CFM, the carbon mesh wrapped around the steel cage could have also exhibited the same phenomenon.
Table 3. Experimental results and the model’s predictions.
123456789101112
Experimental ResultsModel Prediction
SpecimenPmax (kN) P m a x P 0 Peak Axial Disp. (mm)Peak Axial StrainSpalling Lateral Concrete StrainPeak Stress {1}(MPa)Peak Strain {1}Model Peak Stress (MPa)Error (%)Model Strain at Peak StressError (%)
1S80C0a43671.241.330.002190.000576126.00.00459107.1−15.00.004855.7
2S80C0b44071.251.820.003000.000334118.00.00503107.1−9.20.00485−3.6
3S80C0c41061.161.230.002030.000596113.00.00357107.1−5.20.0048536.0
4S130C1a36951.051.040.001710.000875100.00.0026996.7−3.30.0034327.1
5S130C1b35371.001.080.001780.000399106.80.0040096.7−9.50.00343−14.4
6S130C2a35090.991.150.001610.00040698.80.0021298.0−0.80.0035868.2
7S130C2b37941.071.540.002300.000559105.00.0031898.0−6.60.0035812.5
8S130C4a38011.081.010.001660.000519109.00.00259102.7−5.80.0042062.1
9S130C4b32390.920.890.001470.00034195.00.00265102.78.10.0042058.3
10S130C4c34100.970.740.001220.000174107.60.00244102.7−4.60.0042072.4
11S180C3a31970.911.560.002560.00035799.00.0034997.5−1.50.003634.0
12S180C3b29370.831.520.002500.00023292.00.0046897.55.90.00363−22.5
Mean percentage error (%) −4.0 25.5
Mean absolute percentage error (MAPE) (%)6.332.2
{1} σmax and its corresponding strain on the σc–σcc curve (refer to Figure 9).
Figure 9. Stress–strain curve evaluation ( σ c σ c c   c u r v e ) .
Buildings 13 02180 g009

6. Analysis of Test Results

The following analysis of the experimental results refers only to the load carried by the concrete, Pc. This was performed by subtracting the load carried by the longitudinal steel from the measured, total load. To carry this out, the measured global longitudinal strain was applied in a bi-linear elastoplastic stress–strain relation of the steel with an elastic modulus of 200 GPa and yield stress of 561 MPa (see Section 3.1.2).
Due to the failure of the concrete cover, the evaluation of the specimens’ response was conducted in terms of the longitudinal stress (rather than in terms of the load). Therefore, it is necessary to consider the vertical stress that developed in the concrete core and cover before the failure of the cover and in the core—after this failure. First, up to failure of the concrete cover (the ascending branch of the load–displacement curve) the concrete load, Pc, is divided by the full cross-sectional area (denoted Ac in Figure 9). Then, after the cover is spalled off, Pc is divided by the core area (denoted Acc in Figure 9). Yet, the transition between the two regimes needs to be resolved. This is conducted by applying the process described below.

6.1. Columns’ Stress–Strain Relation

The column’s stress–strain relation consists of the specimens’ response before and after the failure of the concrete cover with a smooth transition between the two ranges [28,55]. This transition is achieved in this work by adopting the principle proposed in [55], as illustrated in Figure 9. The peak stress, which occurs at the point of concrete cover’s failure, is marked on the σ c curve (Pc/Ac) by point “A”. This point is connected by a straight line to point “B” on the σ c c curve (Pc/Acc). The slope of the line is set by the ascending slope of the σc curve at the vicinity of point A, and point B is obtained by the crossing of the straight line with the σ c c curve. The final stress–strain curve is the three-domain curve marked “ σ c σ c c ” in Figure 9 (shown for specimen S80C0a). Thus, the peak stress, “σmax”, is measured at point “B”.

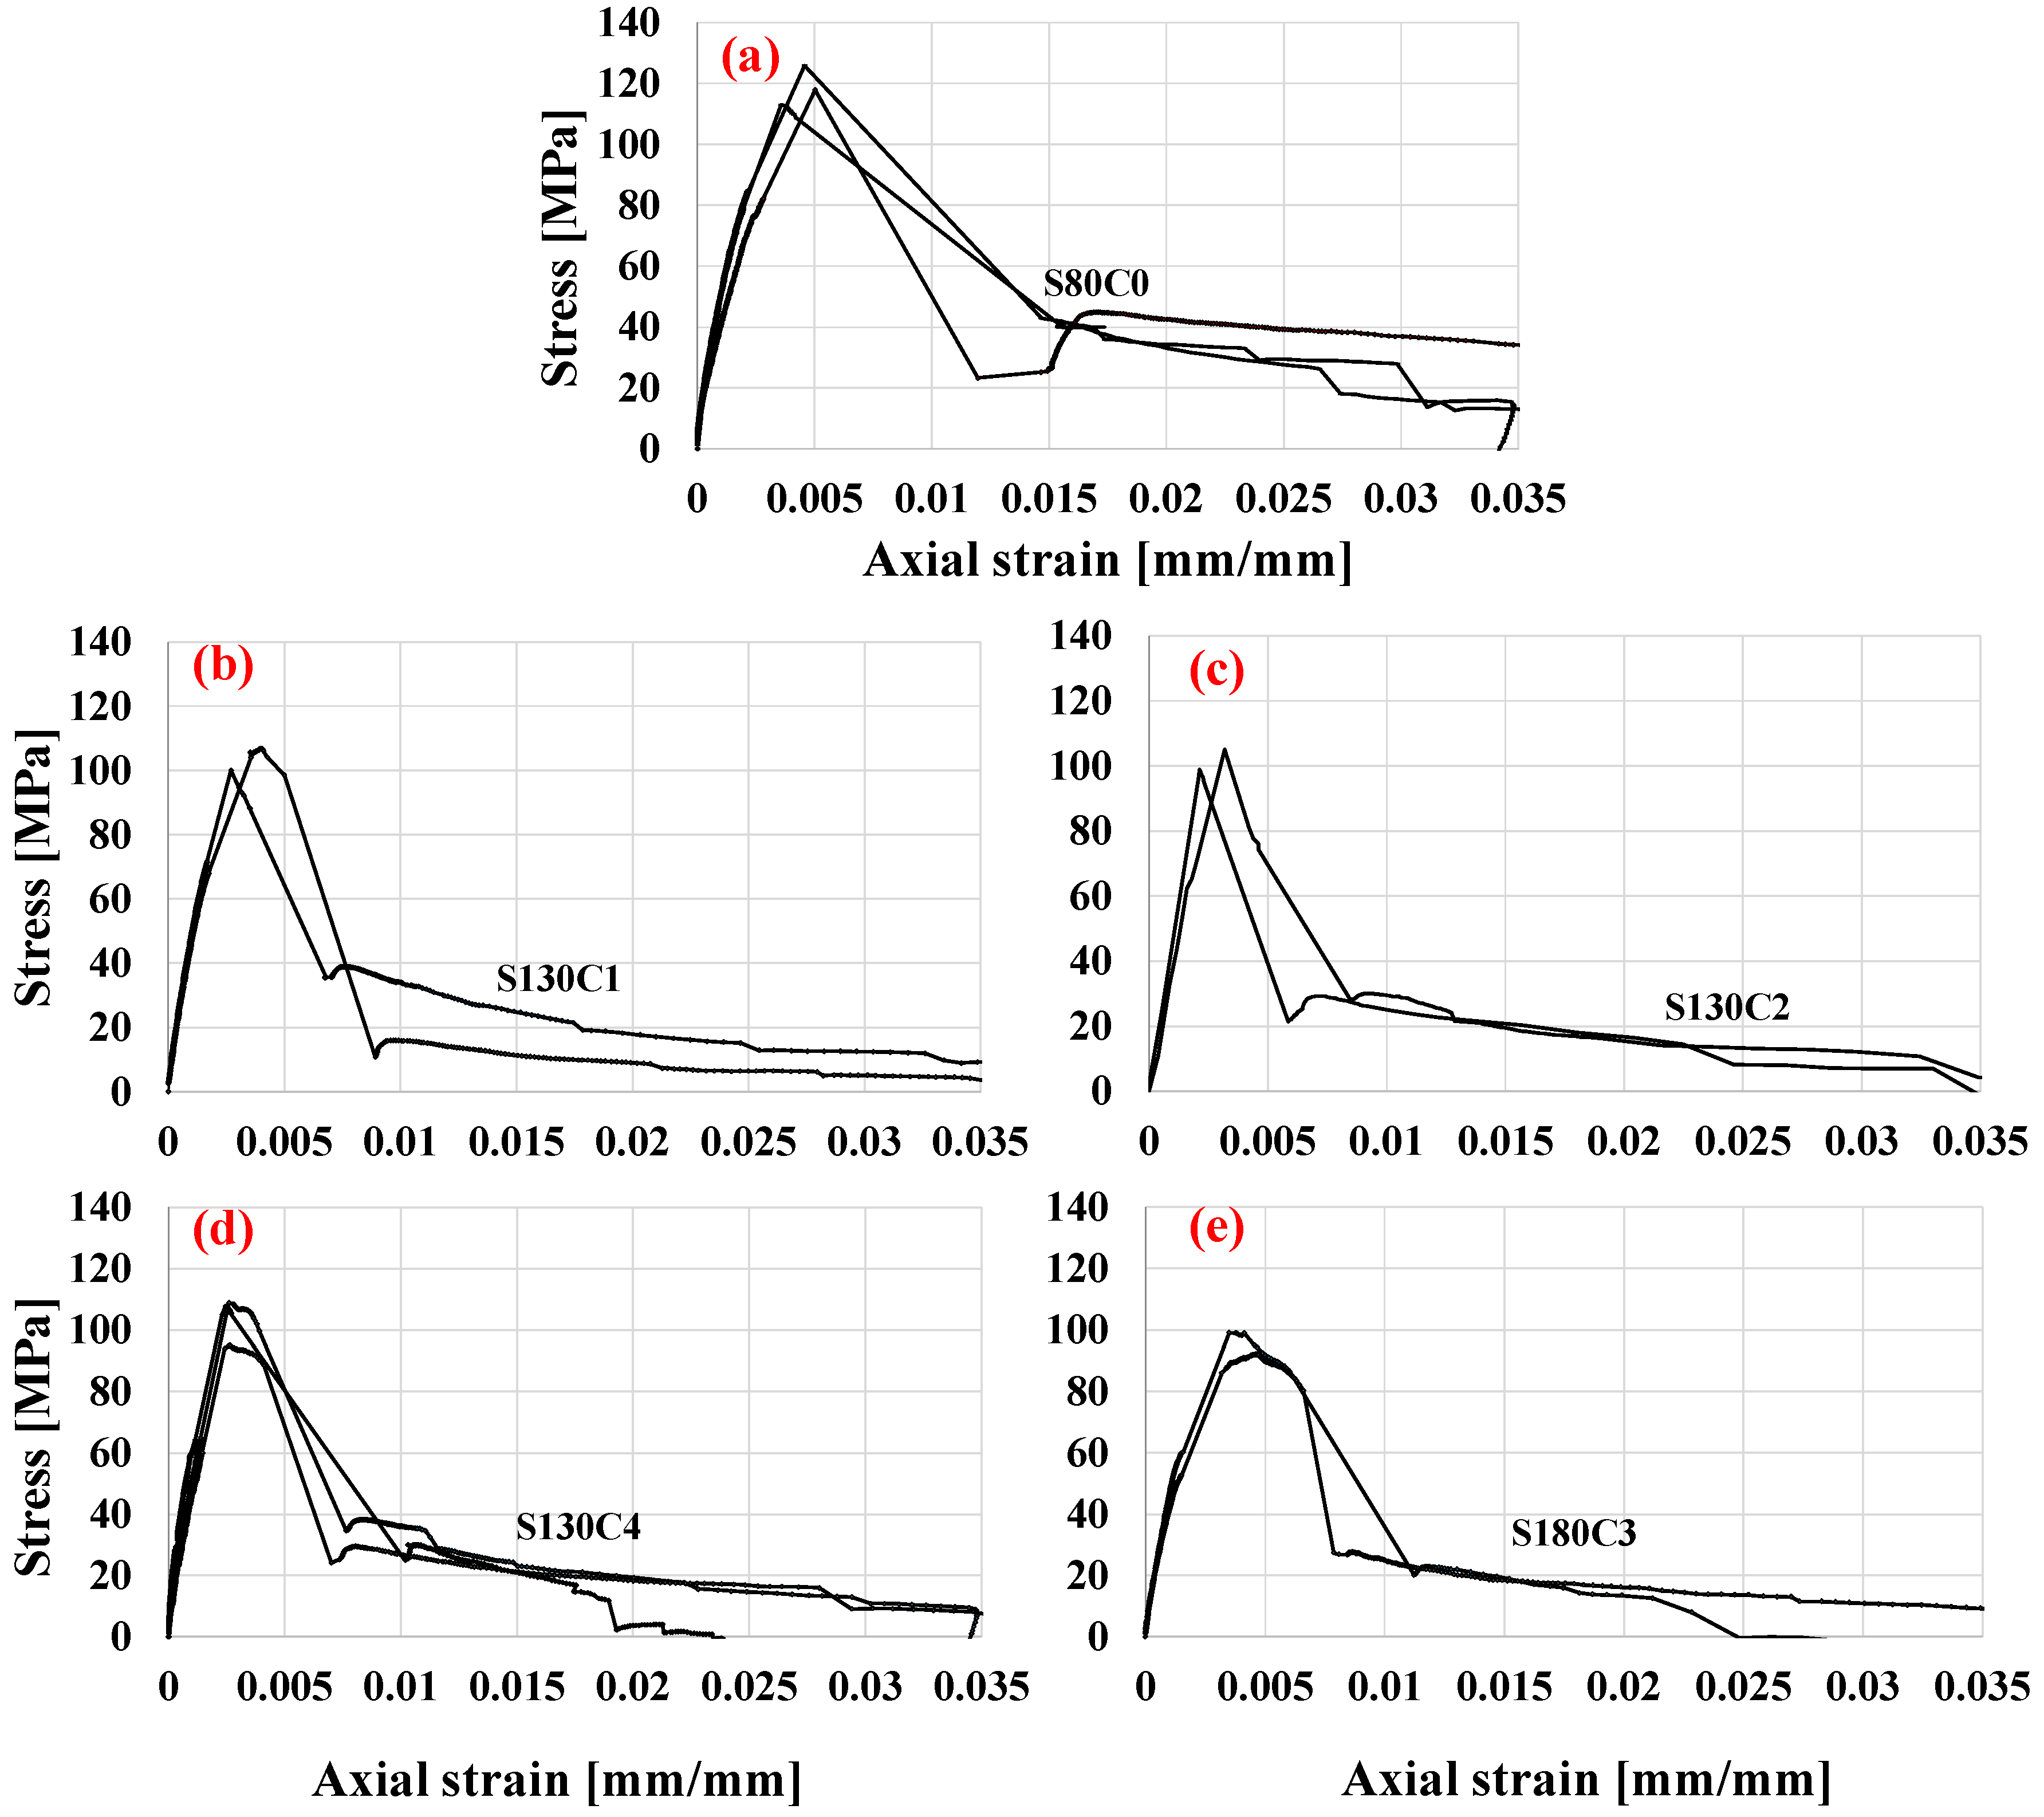
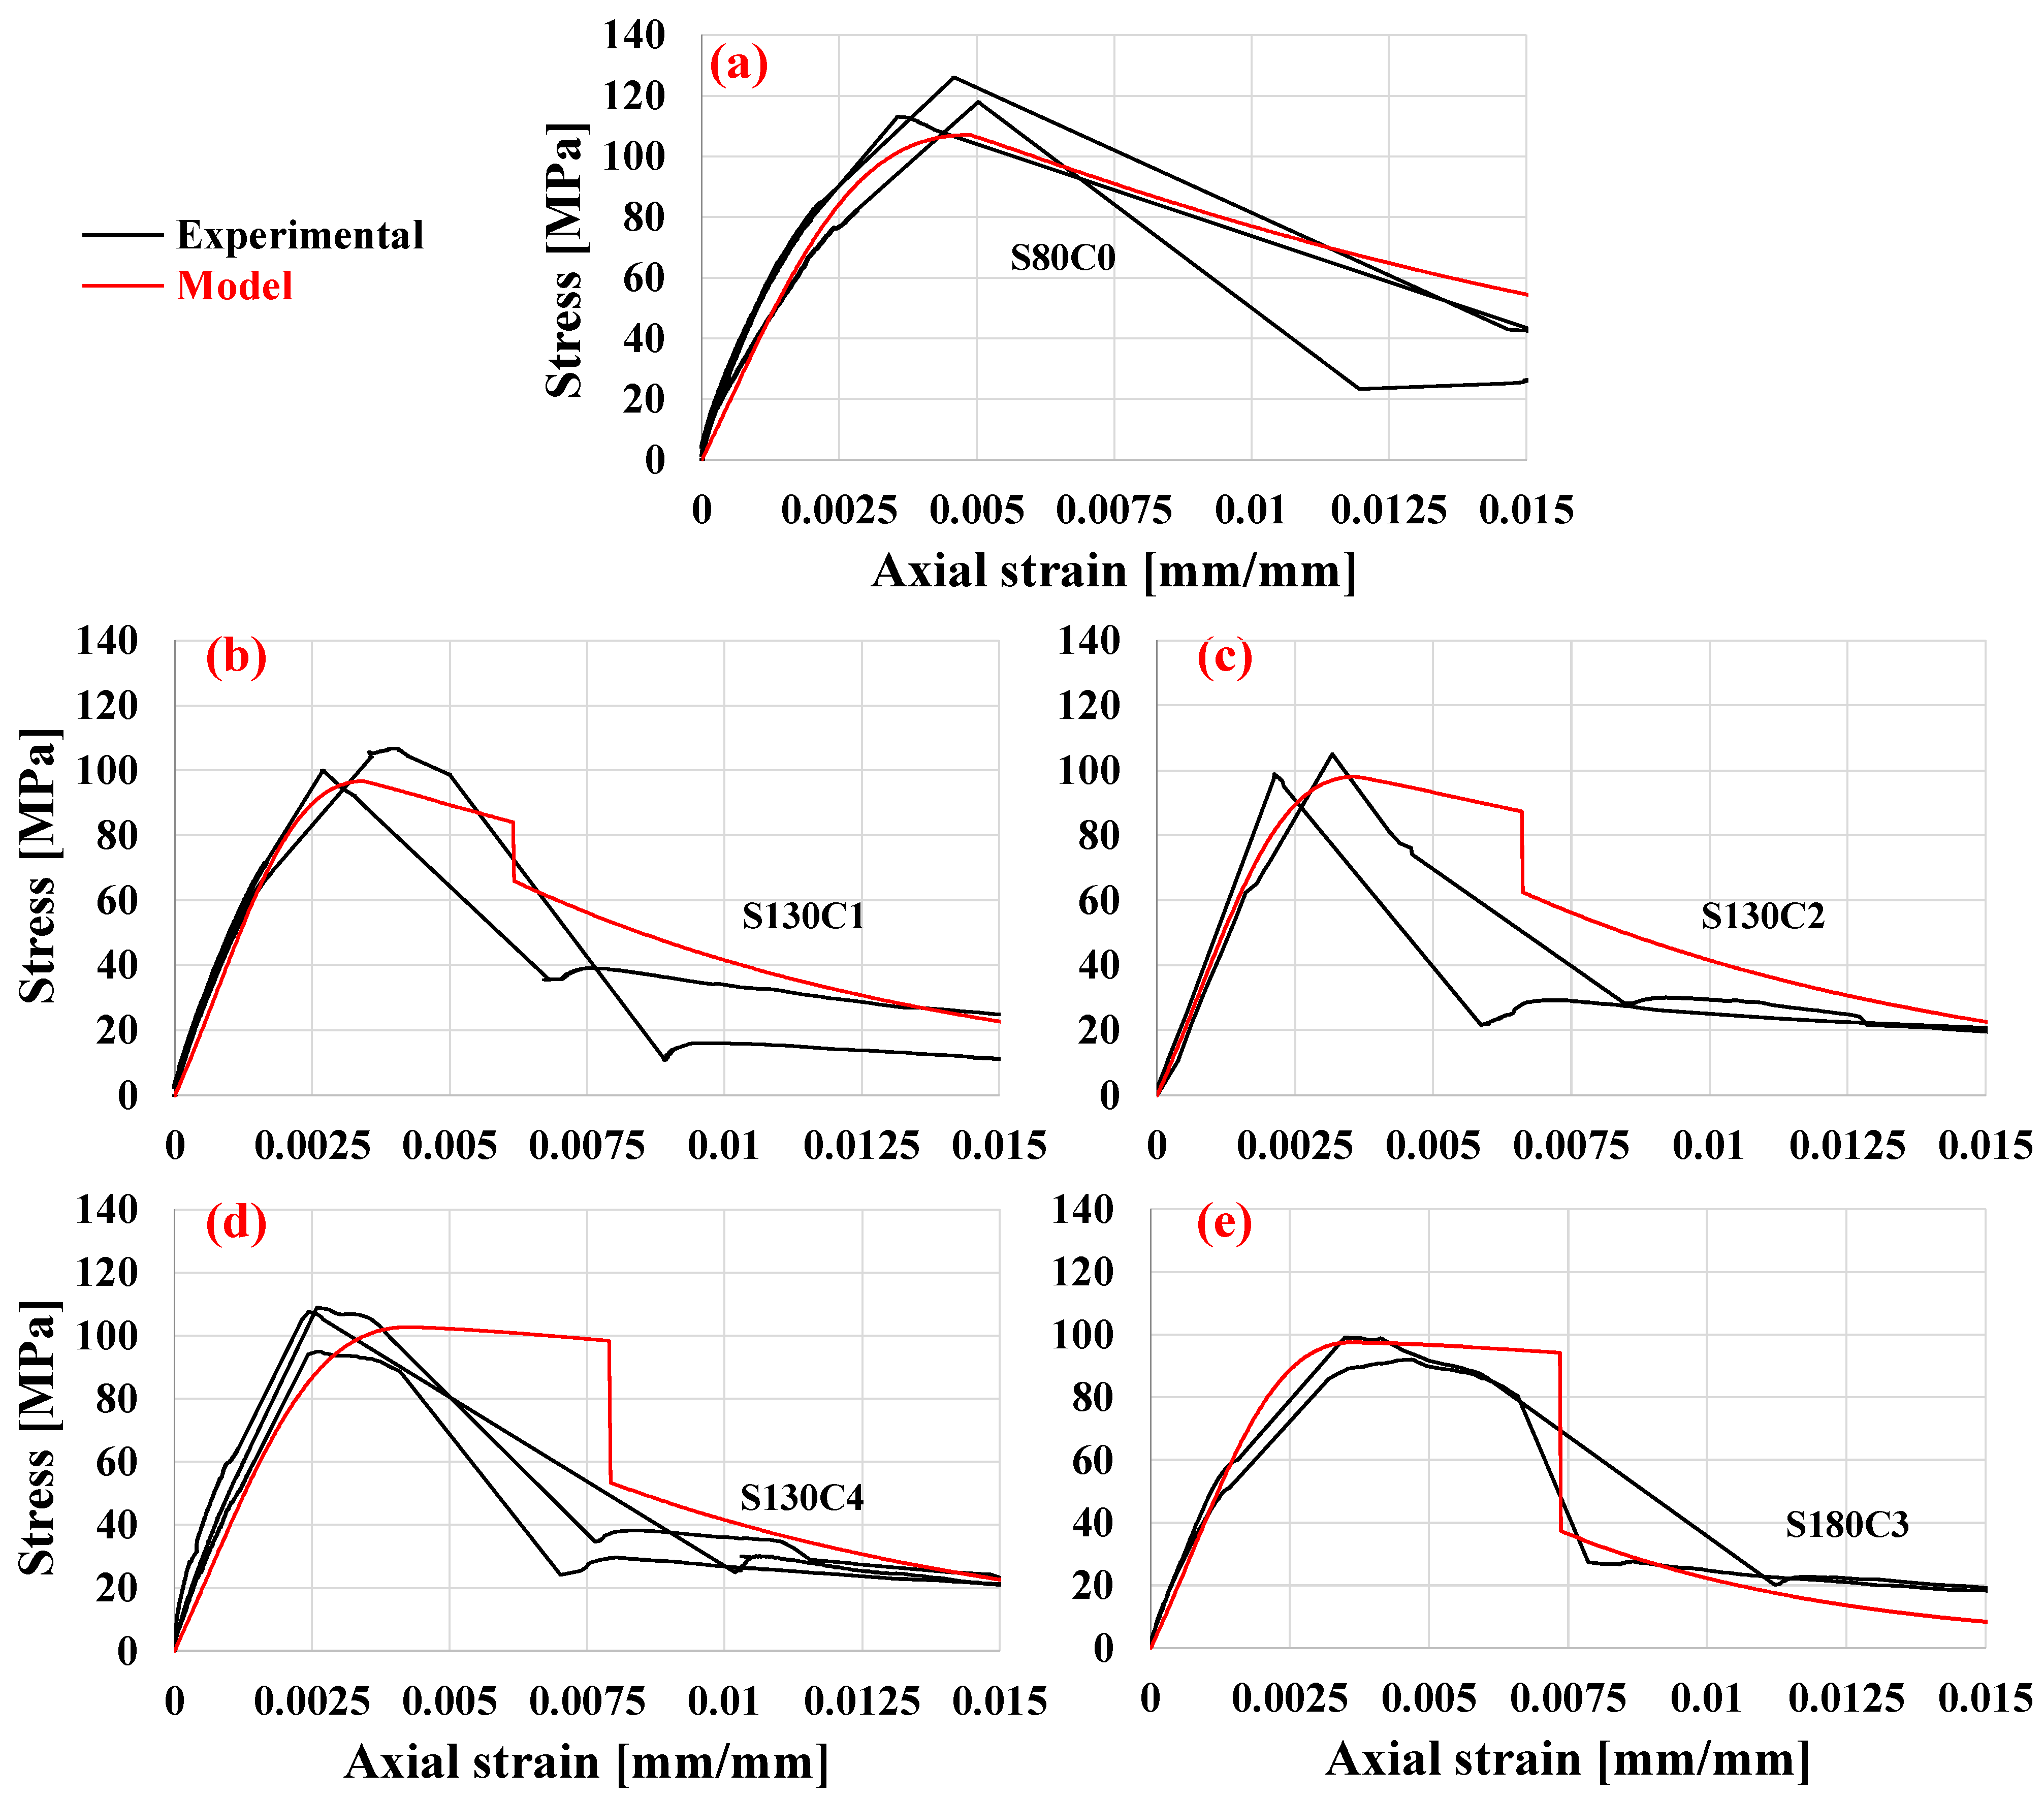
6.2. Stress–Strain Results

The results in terms of the columns’ stress–strain curves are presented in Figure 10. The figure shows that the application of the carbon-fiber meshes adds efficiency to the conventional rebar confinement (e.g., see S130C4’s higher peak-point than that of S130C2 in column 7 of Table 3). Yet, in the current tests the peak stresses obtained with the dual confinement system were ~15% lower than those of the control specimens that had dense confining steel ties (compare the peak of 126 MPa with that of 109 MPa in Table 3 for specimens S80C0a (control) and S130C4a (hybrid), respectively). The evaluation of the displacement capacity is discussed in the following section.

6.3. Ductility Assessment

The ductility of the specimens was defined in this study by the area under the stress–strain curve up to a post-peak stress value of 20% of the peak, based on the curves presented in Park and Paulay [58] (who quote Kent and Park [59]) of concrete confined by ties. The areas under the stress–strain curves of all the specimens, normalized with respect to the analytical unconfined concrete ductility (calculated as 0.27 MPa), are presented in Figure 11. The figure shows that the control specimens with the high amount of lateral steel are the most ductile where the specimens with the hybrid confinement had lower ductility by about 40%. However, specimens with the largest amount of CFM (type S130C4) exhibited more ductile behavior than those with less CFM. These results show that for the specimens with the hybrid confinement system the higher the carbon fibers amount the larger the ductility improvement (see also average ductility values in Section 6.4). Yet, they also show that for the confinement transverse reinforcement and CFM amounts considered in this study, the hybrid system is less efficient in terms of ductility compared to the conventional reinforcement. It is also worth noting that the control specimens had a conventional volumetric lateral reinforcement ratio of ρs = 1.78% compared with only 0.79–1.10% in the specimens with CFM.

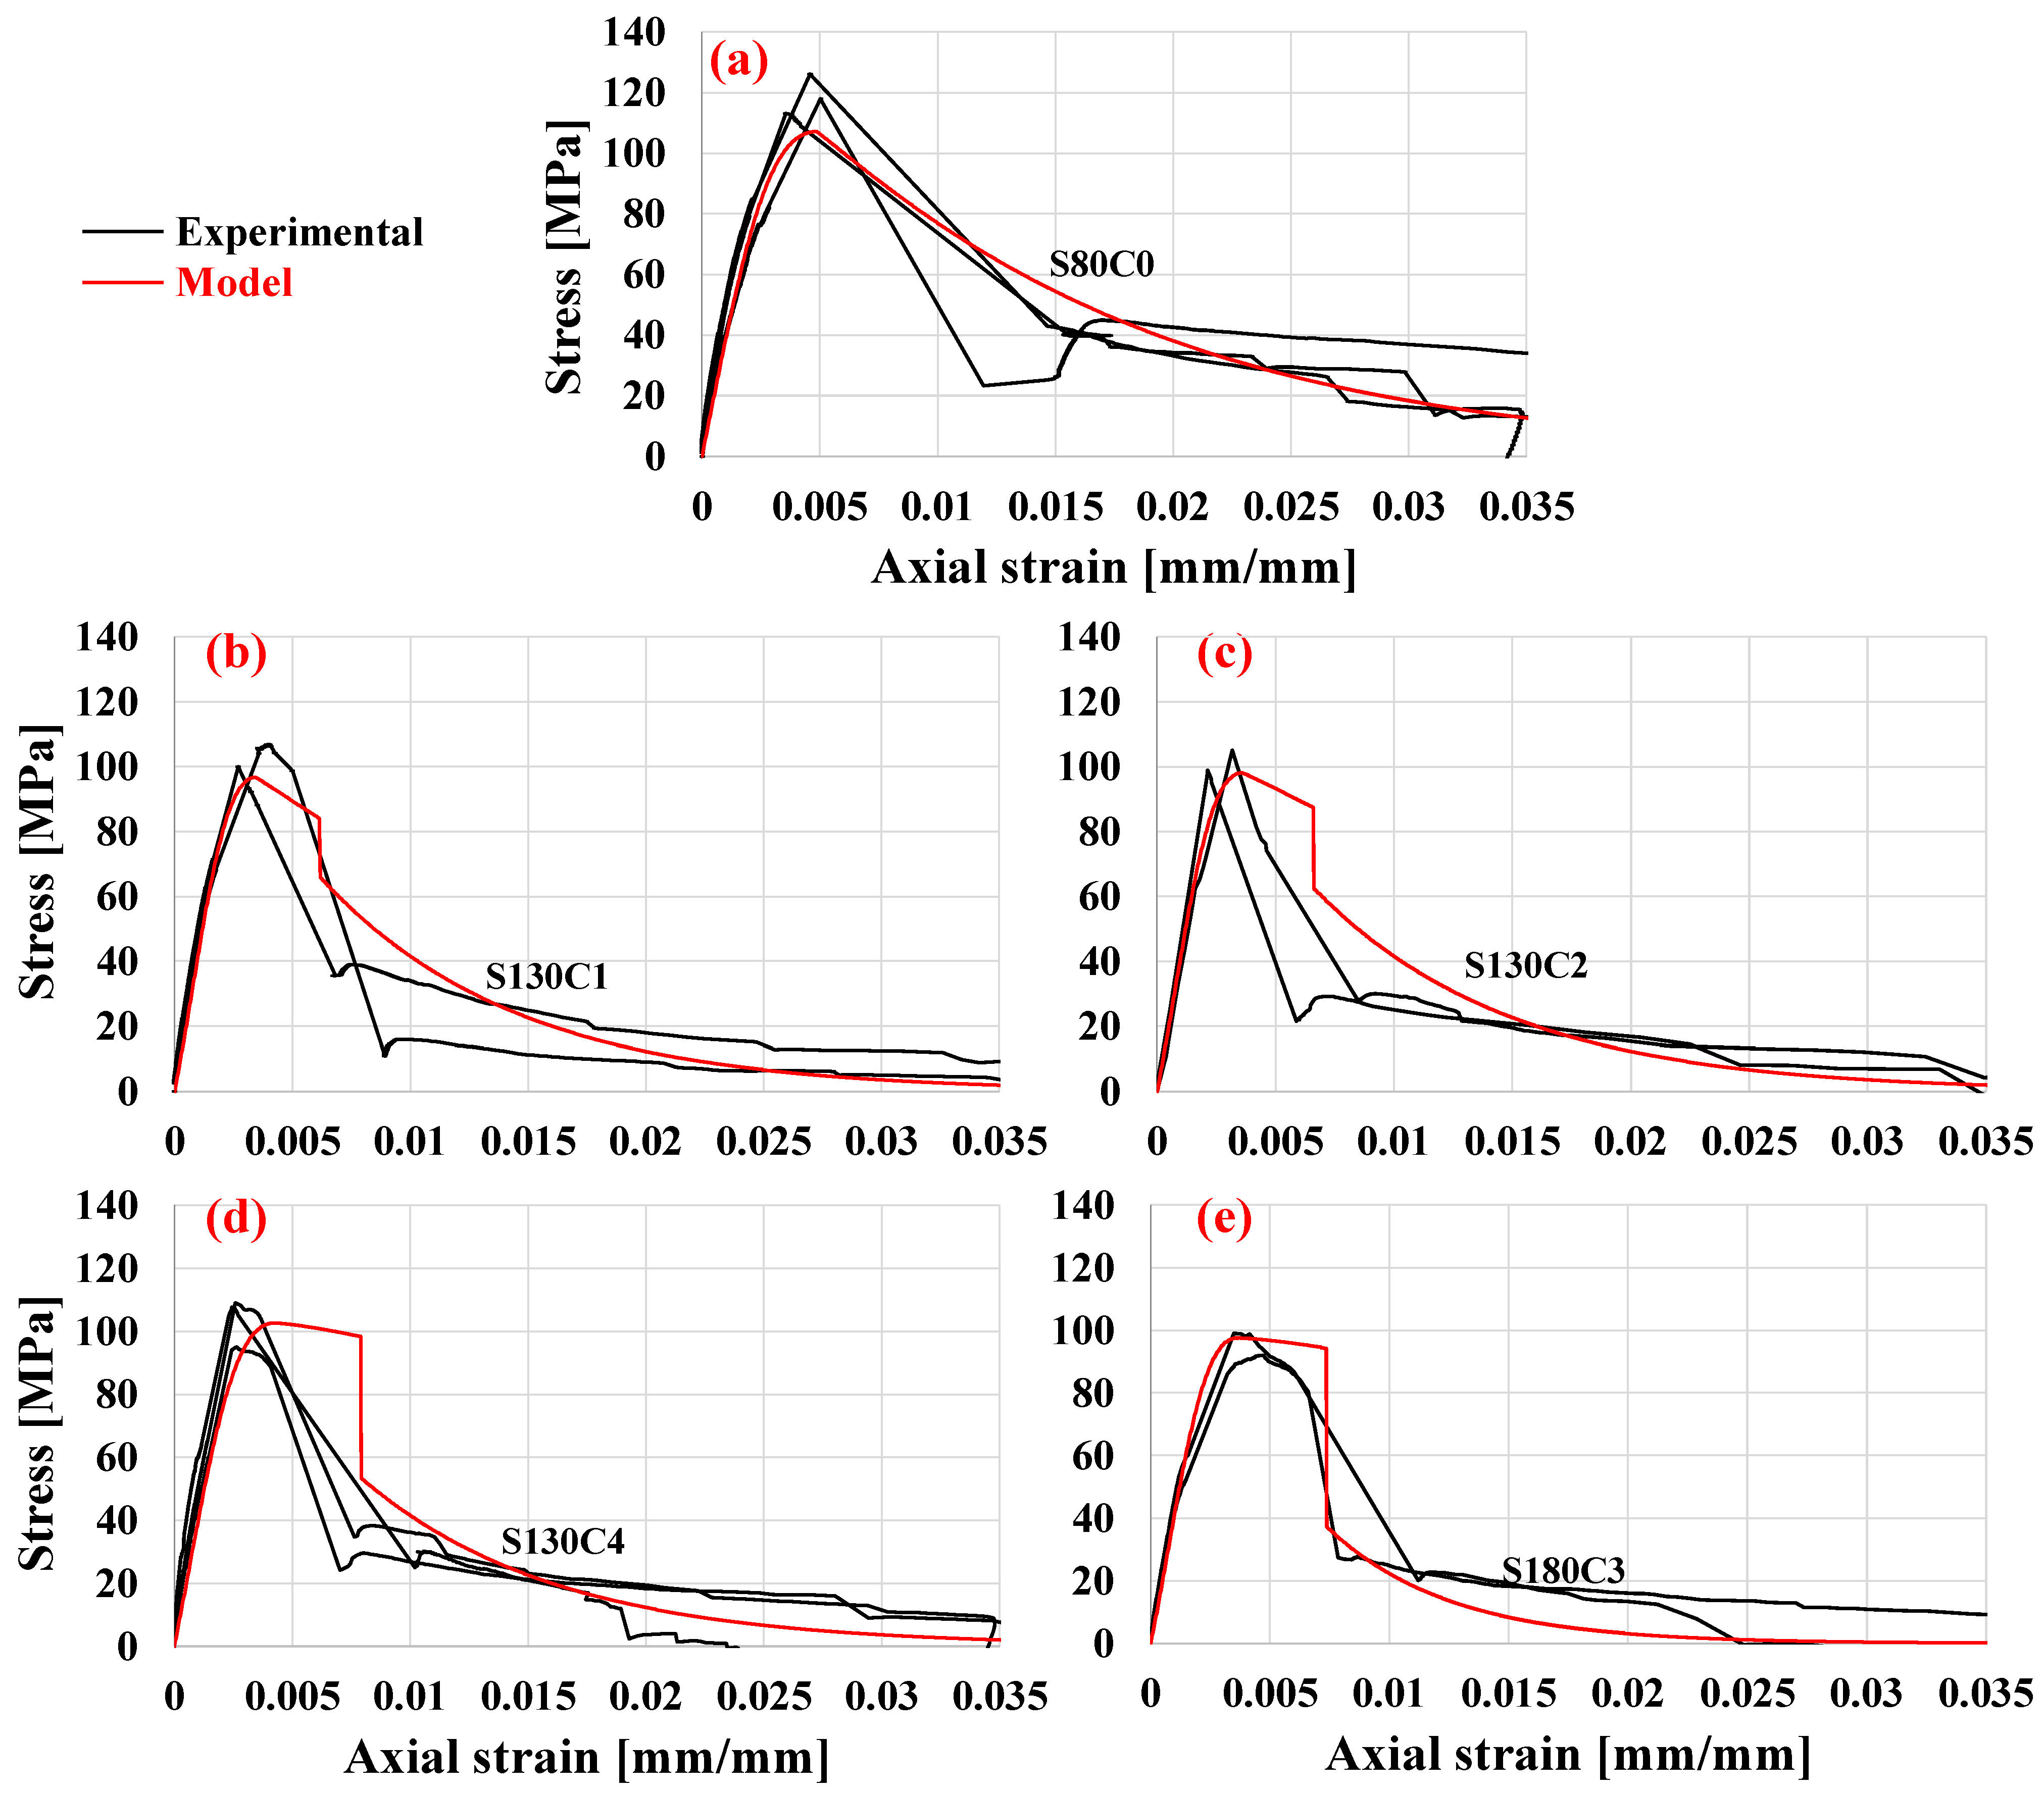
6.4. Model Validation

The results are compared in terms of stress–strain curves to the predictions of the model mentioned in Section 2—in Figure 12 and in Figure 13—with zoom-in on the ascending branch. The evaluations of the model were obtained with unconfined concrete peak strain of ε c = 0.027 , unconfined concrete Poisson’s ratio of ν c 0 = 0.15 and fibers efficiency factor of  ξ = 0.6 (see above in Section 2). Figure 12 and Figure 13 show fair to good agreement between the model and the measured stress–strain curves, particularly in terms of the stress.
A statistical analysis of the key points in the curves, namely the peak stress (σmax) and its corresponding strain, is presented in Table 3. The table provides their quantitative values (columns 7–9 and 11 in Table 3) as well as the calculated-to-measured percentage errors of the model’s predictions compared to those of the experimental results, and the mean absolute percentage error (MAPE).
For the peak stress, the error is determined via (σmax,calσmax,exp)/σmax,exp [%]) and the MAPE is determined via 1 N σ m a x , c a l c σ m a x , e x p σ m a x , e x p % (where N represents the number of specimens, and the indexes “calc” and “exp” represent the calculated and experimental results). Table 3 reveals that the largest absolute peak stress error does not exceed 15% with a MAPE of 6.3%. Moreover, in 11 out of the 12 specimens, the error is below 10%.
When considering a similar statistical analysis of the strain corresponding to the peak stress, the model exhibits larger deviations when compared to the experimental results, yielding a MAPE of 32.2% (see column 12 of Table 3).
It should be noted, though, that while the model was developed for FRP, in which the carbon fibers are impregnated in the epoxy resin, the CFM used in the experiments was polymer-free, with uncoated fibers. The epoxy coating in FRP is known to cause brittle rupture, characterized by a sudden drop in the stress capacity, whereas the rupture of uncoated fiber strands can occur with some but limited ductility. This is due to the different, non-simultaneous nature of the fiber strands’ rupture, which is typified by a sort of telescopic action [60]. Therefore, while the model shows a sudden drop at the point of rupture of the fibers, this drop was somewhat more gradual in the experiments.
The average ductility values of each specimen type (which are detailed above) together with their corresponding model predictions are presented in Figure 14. The figure shows that the model’s ductility has the highest agreement with the average experimental ductility of types S130C4, and S180C3 specimens, i.e., the hybrid specimens with the highest amount of CFM.

6.5. Influence of CFM Confinement

An examination of the contribution of the CFM amount in a hybrid confinement system is illustrated in Figure 15 for the case of steel ties spaced at 180 mm, i.e., with a transverse steel reinforcement ratio of 0.79%. For the control specimen (without CFM) with this spacing, a calculated curve has been generated (denoted as S180C0 in the figure), relying on the model’s good prediction of the tested control specimen with 80 mm spacing (see Figure 12a). Figure 15 shows this curve together with both the measured (denoted “EXP”) and calculated stress–strain curves of the hybrid specimens. It shows that compared to the control S180C0 specimen, the addition of the CFM confinement at teq = 0.285 and 0.570 mm (S180C3 and S180C3*2t in Figure 15, respectively) leads to a calculated increase in the peak stress, from 89.8 to 97.5 and 113.9 MPa (respectively).
Note that the curve named S180C3*2t represents the use of the same CFM with a doubled-strand cross-section (hence its teq = 0.570 mm).
As for the ductility, for the control, steel-only confined concrete, the normalized area below the predicted curve is 1.96 while the normalized areas under the hybrid-confined concrete curves are 2.52 and 3.38 (S180C0, S180C3 and S180C3*2t, respectively, in Figure 15. See also line 3 of Table 4). Note that, as above, normalization has been done with respect to the calculated 0.27 MPa ductility of the unconfined concrete. It is thus evident from the figure that increasing the amount of lateral CFM reinforcement leads to a higher capacity and larger ductility level.
The normalized, calculated ductility values of the specimens discussed above and of specimens with similar equivalent CFM thicknesses, teq, but different tie spacing, are presented in Table 4. These ductility values show that there is an improvement in column ductility with increasing CFM thickness and that this improvement is more pronounced for lower amounts of steel confinement. Thus, there is an increase of 72% from 1.96 to 3.38 for ρs = 0.79% (line 3 of Table 4) while the increase is only 11% from 5.94 to 6.62 for ρs = 1.78% (line 1 of Table 4).

7. Conclusions

This paper describes a work that examines a new solution to the problem that arises from the relatively high amount of transverse reinforcement required in HSC columns. It presents an alternative to common transverse steel reinforcement—a dual system composed of steel ties and a carbon-fiber mesh (CFM), applied internally, together with the steel ties. This solution is also suitable for fire resistance, because unlike strengthening FRP sheets that are applied externally and are therefore vulnerable to fire, a CFM is applied internally, and thus it is protected by the concrete cover.
The behavior of the proposed system under ambient temperature was examined in this work in a series of twelve laboratory tests of circular stub column specimens with a diameter of 250 mm and a length of 950 mm. Five different confining systems were tested: control specimens with only conventional reinforcement and specimens with four different combinations of the two components of the system, steel and CFM. The experiments performed in this work focused on the columns’ load and displacement capacities. The latter is denoted here as ductility, which was evaluated in this work in terms of the area under the stress–strain curve up to a post-peak stress value of 20% of the peak.
The tests were planned with the aid of an analytical model that characterizes the confinement of high-strength concrete columns using a carbon-fiber mesh reinforcement together with lateral steel. The model that was originally developed for hybrid, external FRP and internal steel was adapted for the current system.
All specimens exhibited similar behavior, characterized by the spalling of the unconfined concrete cover, followed by the crushing of the concrete confined in the reinforcing cage. The analysis of the results has led to the following main conclusions:
  • For a given amount of conventional transverse steel, the application of carbon-fiber meshes gives efficiency to the rebar confinement, in terms of both the load bearing capacity and the ductility.
  • For the specimens with the hybrid confinement system, the higher the amount of carbon fibers the larger the ductility improvement.
  • Yet, for the confinement transverse reinforcement and CFM amounts tested in this study, the hybrid system was less efficient in terms of ductility compared to the conventional reinforcement. It is noted though, that the control specimens had a relatively high conventional volumetric lateral reinforcement ratio (of 1.78%) that was greater than that of the hybrid specimens.
  • Fair to good agreement was observed between the model and the measured stress–strain curves, especially of the peak stresses.
  • There was an improvement in the column’s ductility with increasing CFM thickness, where this improvement was more pronounced for lower amounts of steel confinement.
Further modification of the model to consider carbon strands (rather than carbon sheets) should enhance the prediction of the behavior of columns with the proposed confinement system. Based on the above findings and the added benefit of fire resistance, the hybrid method appears to be a promising method for confining HSC columns.

Author Contributions

Conceptualization, Y.M.S., R.E. and A.N.D.; methodology, Y.M.S., R.E. and A.N.D.; software, Y.M.S.; validation, Y.M.S., R.E. and A.N.D.; writing—original draft preparation, Y.M.S.; writing—review and editing, R.E. and A.N.D.; visualization, Y.M.S.; supervision, R.E. and A.N.D.; project administration, A.N.D.; funding acquisition, R.E. and A.N.D. All authors have read and agreed to the published version of the manuscript.

Funding

This research was partially funded by the Israeli Ministry of Construction and Housing, grant number 2031519.

Data Availability Statement

The data presented in this study are available on request from the authors.

Acknowledgments

This research is partially supported by the Israeli Ministry of Construction and Housing. Thanks are extended also to Ami Dahan from Israbeton Concrete, for his supportive collaboration and to Elhanan Izhak, and Edi Gershengoren from the National Building Research Institute at Technion for their technical assistance.

Conflicts of Interest

The authors declare no conflict of interest. The funders had no role in the design of the study; in the collection, analyses, or interpretation of data; in the writing of the manuscript; or in the decision to publish the results.

References

  1. ACI. ACI Report on Equivalent Rectangular Concrete Stress Block and Transverse Reinforcement for High-Strength Concrete Columns (441.1R-18); American Concrete Institute: Farmington Hills, MI, USA, 2018. [Google Scholar]
  2. Lee, H.-J.; Lai, Y.-L.; Chen, C.-W.; Tao, C.-C.; Lee, H. Behavior and modeling of high-strength concrete tied columns under axial compression. J. Chin. Inst. Eng. 2018, 41, 353–365. [Google Scholar] [CrossRef]
  3. Shah, S.P.; Zia, P.; Johnston, D. Economic Considerations for Using High Strength Concrete in High Rise Buildings. 1983; a study prepared for Elborg technology Co. [Google Scholar]
  4. Luther, M.D.; Bauer, K.C. Using High Strength Concrete Simplifies Precast Column Design. Concr. Constr. 1987, 32, 546–547. [Google Scholar]
  5. Schmidt, W.; Hoffman, E.S. 9000 psi concrete—Why? Why not? Civ. Eng. 1975, 45, 52–55. [Google Scholar]
  6. Zia, P.; Leming, M.L.; Ahmad, S.H. High-Performance Concretes: A State-Of-The-Art Report; North Carolina State University: Raleigh, NC, USA, 1991. [Google Scholar]
  7. Kunze, W.E. High-strength Concrete in the United States. In Proceedings of XIV Biennial Conference in Concrete; Concrete Institute of Australia: Sydney, Australia, 1995. [Google Scholar]
  8. Antonius; Imran, I.; Setiyawan, P. On the Confined High-strength Concrete and Need of Future Research. Procedia Eng. 2017, 171, 121–130. [Google Scholar] [CrossRef]
  9. Aslani, F.; Bastami, M. Constitutive Relationships for Normal- and High-Strength. ACI Mater. J. 2011, 108, 355–364. [Google Scholar]
  10. Eid, R.; Kovler, K.; David, I.; Khoury, W.; Miller, S. Behavior and design of high-strength circular reinforced concrete columns subjected to axial compression. Eng. Struct. 2018, 173, 472–480. [Google Scholar] [CrossRef]
  11. Li, B.; Park, R.; Tanaka, H. Strength and Ductility of Reinforced Concrete Members and Frames Constructed Using High Strength Concrete; Research Report; University of Canterbury: Christchurch, New Zealand, 1994. [Google Scholar]
  12. Eid, R.; Paultre, P. Compressive behavior of FRP-confined reinforced concrete columns. Eng. Struct. 2017, 132, 518–530. [Google Scholar] [CrossRef]
  13. Desprez, C.; Mazars, J.; Kotronis, P.; Paultre, P. Damage model for FRP-confined concrete columns under cyclic loading. Eng. Struct. 2013, 48, 519–531. [Google Scholar] [CrossRef]
  14. Yu, T.; Zhang, B.; Teng, J. Unified cyclic stress–strain model for normal and high strength concrete confined with FRP. Eng. Struct. 2015, 102, 189–201. [Google Scholar] [CrossRef]
  15. Tri, Q.; Belgian, P.; Maes, N.; Nuclear, B.; Jacques, D.; Nuclear, B.; Ashraf, W.; Leemann, A.; Phung, Q.T.; Maes, N.; et al. Proceedings of the 4th Congrès International de Géotechnique-Ouvrages-Structures; Springer: Berlin/Heidelberg, Germany, 2017. [Google Scholar] [CrossRef]
  16. Légeron, F.; Paultre, P. Behavior of High-Strength Concrete Columns under Cyclic Flexure and Constant Axial Load. ACI Struct. J. 2000, 97, 591–601. [Google Scholar] [CrossRef]
  17. Yuan, F.; Wu, Y.-F.; Zhao, X.-Y. Effect of Internal Stirrups on the Eccentric Compression Behavior of FRP-Confined RC Columns Based on Finite-Element Analysis. J. Compos. Constr. 2022, 26, 04021069. [Google Scholar] [CrossRef]
  18. Eid, R.; Dancygier, A.N.; Paultre, P. Stress–strain curve for concrete in circular columns based on elastoplastic analysis. Mater. Struct. 2009, 43, 63–79. [Google Scholar] [CrossRef]
  19. Eid, R.; Dancygier, A.N.; Paultre, P. Elastoplastic Confinement Model for Circular Concrete Columns. J. Struct. Eng. 2007, 133, 1821–1831. [Google Scholar] [CrossRef]
  20. ACI 441R-96; High-Strength Concrete Columns: State of the Art Reported by Joint ACI-ASCE Committee 441. American Concrete Institute: Farmington Hills, MI, USA, 1996.
  21. ACI 874 318R-19; Commentary on Building Code Requirements for Structural Concrete. American Concrete Institute: Farmington Hills, MI, USA, 2019; ISBN 978-1641950565.
  22. Zhong, Y.; Sun, Y.; Tan, K.H.; Zhao, O. Testing, modelling and design of high strength concrete-filled high strength steel tube (HCFHST) stub columns under combined compression and bending. Eng. Struct. 2021, 241, 112334. [Google Scholar] [CrossRef]
  23. He, A.; Liang, Y.; Zhao, O. Behaviour and residual compression resistances of circular high strength concrete-filled stainless steel tube (HCFSST) stub columns after exposure to fire. Eng. Struct. 2020, 203, 109897. [Google Scholar] [CrossRef]
  24. Wang, H.; Zhang, Z.; Qian, H.; Liu, Y.; Hu, N.; Fan, F. Galvanic corrosion induced localized defects and resulting strength reduction of circular steel tubes under axial compression: An experimental study. Thin Walled Struct. 2020, 154, 106881. [Google Scholar] [CrossRef]
  25. Yu, M.; Hu, X.; Chi, Y.; Ye, J. A unified method for calculating the fire resistance of concrete-filled steel tube with fire protection under combined loading. J. Constr. Steel Res. 2020, 168, 106003. [Google Scholar] [CrossRef]
  26. Khan, M.; Chu, S.; Deng, X.; Wang, Y. Protection of steel tube against corrosion using self-prestressing UHPC prepared with expansive agent and steel fibers. Structures 2022, 37, 95–108. [Google Scholar] [CrossRef]
  27. Lim, J.C.; Ozbakkaloglu, T. Confinement Model for FRP-Confined High-Strength Concrete. J. Compos. Constr. 2014, 18, 04013058. [Google Scholar] [CrossRef]
  28. Eid, R.; Roy, N.; Paultre, P. Normal- and High-Strength Concrete Circular Elements Wrapped with FRP Composites. J. Compos. Constr. 2009, 13, 113–124. [Google Scholar] [CrossRef]
  29. Ozbakkaloglu, T. Compressive behavior of concrete-filled FRP tube columns: Assessment of critical column parameters. Eng. Struct. 2013, 51, 188–199. [Google Scholar] [CrossRef]
  30. Ozbakkaloglu, T. Axial Compressive Behavior of Square and Rectangular High-Strength Concrete-Filled FRP Tubes. J. Compos. Constr. 2013, 17, 151–161. [Google Scholar] [CrossRef]
  31. Ortlepp, R.; Lorenz, A.; Curbach, M. Column Strengthening with TRC: Influences of the Column Geometry onto the Confinement Effect. Adv. Mater. Sci. Eng. 2009, 2009, 493097. [Google Scholar] [CrossRef]
  32. Ortlepp, R.; Ortlepp, S. Textile reinforced concrete for strengthening of RC columns: A contribution to resource conservation through the preservation of structures. Constr. Build. Mater. 2017, 132, 150–160. [Google Scholar] [CrossRef]
  33. Eid, R.; Cohen, A.; Guma, R.; Ifrach, E.; Levi, N.; Zvi, A. High-Strength Concrete Circular Columns with TRC-TSR Dual Internal Confinement. Buildings 2019, 9, 218. [Google Scholar] [CrossRef]
  34. Lin, G.; Yu, T.; Teng, J.G. Design-Oriented Stress–Strain Model for Concrete under Combined FRP-Steel Confinement. J. Compos. Constr. 2016, 20, 04015084. [Google Scholar] [CrossRef]
  35. Teng, J.G.; Lin, G.; Yu, T. Analysis-Oriented Stress-Strain Model for Concrete under Combined FRP-Steel Confinement. J. Compos. Constr. 2015, 19, 04014084. [Google Scholar] [CrossRef]
  36. Valasaki, M.K.; Papakonstantinou, C.G. Fiber Reinforced Polymer (FRP) Confined Circular Concrete Columns: An Experimental Overview. Buildings 2023, 13, 1248. [Google Scholar] [CrossRef]
  37. Chowdhury, E.; Bisby, L.; Green, M.; Bénichou, N.; Kodur, V. Heat transfer and structural response modelling of FRP confined rectangular concrete columns in fire. Constr. Build. Mater. 2012, 32, 77–89. [Google Scholar] [CrossRef]
  38. Bisby, L.A.; Green, M.F.; Kodur, V.K.R. Modeling the Behavior of Fiber Reinforced Polymer-Confined Concrete Columns Exposed to Fire. J. Compos. Constr. 2005, 9, 15–24. [Google Scholar] [CrossRef]
  39. ACI 440.2R-17; Guide for the Design and Construction of Externally Bonded FRP Systems for Strengthening Concrete Structures. American Concrete Institute: Farmington Hills, MI, USA, 2016; pp. 909–961.
  40. Firmo, J.P.; Correia, J.R.; Bisby, L.A. Fire behaviour of FRP-strengthened reinforced concrete structural elements: A state-of-the-art review. Compos. Part B Eng. 2015, 80, 198–216. [Google Scholar] [CrossRef]
  41. Bisby, L. Fire Resistance of Textile Fiber Composites Used in Civil Engineering. In Textile Fibre Composites in Civil Engineering; Elsevier Ltd.: Edinburgh, UK, 2016; pp. 169–185. ISBN 9781782424697. [Google Scholar] [CrossRef]
  42. Bazli, M.; Abolfazli, M. Mechanical Properties of Fibre Reinforced Polymers under Elevated Temperatures: An Overview. Polymers 2020, 12, 2600. [Google Scholar] [CrossRef] [PubMed]
  43. BS EN 1992-1-2:2004; Eurocode 2. Design of Concrete Structures. General Rules. Structural Fire Design. CEN: Brussels, Belgium, 2004.
  44. Chen, Z.; Yu, J.; Nong, Y.; Yang, Y.; Zhang, H.; Tang, Y. Beyond time: Enhancing corrosion resistance of geopolymer concrete and BFRP bars in seawater. Compos. Struct. 2023, 322, 117439. [Google Scholar] [CrossRef]
  45. Shachar, Y.M.; Eid, R.; Dancygier, A.N. Steel and carbon fiber textile reinforced high-strength-concrete columns. In Proceedings of the 14th fib PhD Symposium, Rome, Italy, 5–7 September 2022; pp. 1–8. [Google Scholar]
  46. Shachar, Y.M.; Eid, R.; Dancygier, A.N. On The Axial Behavior of High Strength Concrete Columns. In Proceedings of the 6th fib Congress, Oslo, Norway, 12–16 June 2022. [Google Scholar]
  47. Shachar, Y.M.; Eid, R.; Dancygier, A.N. On The Structural Behavior and Fire Resistance of Carbon Fibers and Steel Reinforced High-Strength Axially Loaded Concrete Columns. In Proceedings of the 11th International Conference on Fiber-Reinforced Polymer (FRP) Composites in Civil Engineering (CICE 2023), Rio de Janeiro, Brazil, 23–26 July 2023; pp. 1–10. [Google Scholar] [CrossRef]
  48. Shachar, Y.M.; Eid, R.; Dancygier, A.N. Dual Steel-Carbon Confinement of HSC Columns Considering Fire Resistance. In Building for the Future: Durable, Sustainable, Resilient; fib Symposium 2023. Lecture Notes in Civil Engineering; Ilki, A., Çavunt, D., Çavunt, Y.S., Eds.; Springer: Cham, Switzerland, 2023; Volume 349, pp. 1505–1514. [Google Scholar] [CrossRef]
  49. Eid, R.; Paultre, P. Plasticity-based model for circular concrete columns confined with fibre-composite sheets. Eng. Struct. 2007, 29, 3301–3311. [Google Scholar] [CrossRef]
  50. Sargin, M.; Kumar Handa, S. A General Formulation for the Stress–Strain Properties of Concrete; Report No. 3; University of Waterloo: Waterloo, ON, Canada, 1969. [Google Scholar]
  51. Cusson, D.; Paultre, P. Stress-Strain Model for Confined High-Strength Concrete. J. Struct. Eng. 1995, 121, 468–477. [Google Scholar] [CrossRef]
  52. Légeron, F.; Paultre, P. Uniaxial Confinement Model for Normal- and High-Strength Concrete Columns. J. Struct. Eng. 2003, 129, 241–252. [Google Scholar] [CrossRef]
  53. Eid, R.; Paultre, P. Analytical Model for FRP-Confined Circular Reinforced Concrete Columns. J. Compos. Constr. 2008, 12, 541–552. [Google Scholar] [CrossRef]
  54. Solidian. Solidian-Technical Product Data Sheet; Solidian: Albstadt, Germany, 2023. [Google Scholar]
  55. Cusson, D.; Paultre, P. High-Strength Concrete Columns Confined by Rectangular Ties. J. Struct. Eng. 1994, 120, 783–804. [Google Scholar] [CrossRef]
  56. Foster, S.J.; Liu, J.; Sheikh, S.A. Cover Spalling in HSC Columns Loaded in Concentric Compression. J. Struct. Eng. 1998, 124, 1431–1437. [Google Scholar] [CrossRef]
  57. Paultre, P.; Khayat, K.H.; Langlois, Y.; Trudel, A.; Cusson, D. Structural performance of some special concretes. In Proceedings of the 4th International Symposium on Utilization of High-Strength/High-Performance Concrete, Paris, France, 29–31 May 1996; pp. 787–796. [Google Scholar]
  58. Park, R.; Paulay, T. Reinforced Concrete Structures; John Wiley & Sons, Inc.: Hoboken, NJ, USA, 1975. [Google Scholar]
  59. Kent, D.C.; Park, R. Flexural Members with Confined Concrete. J. Struct. Div. 1971, 97, 1969–1990. [Google Scholar] [CrossRef]
  60. Valeri, P.; Ruiz, M.F.; Muttoni, A. Tensile response of textile reinforced concrete. Constr. Build. Mater. 2020, 258, 119517. [Google Scholar] [CrossRef]
Figure 1. The hybrid confinement model used to plan the experiments (following [12]).
Buildings 13 02180 g001
Figure 2. Reinforcement details of the specimens and the measurement devices.
Buildings 13 02180 g002
Figure 3. Experimental setup.
Buildings 13 02180 g003
Figure 4. Confinement system of the column specimens.
Buildings 13 02180 g004
Figure 5. HSC concrete column specimens before and after testing.
Buildings 13 02180 g005
Figure 6. Typical failure of the control specimens (without the CFM).
Buildings 13 02180 g006
Figure 7. Typical failure of the hybrid-confined specimens.
Buildings 13 02180 g007
Figure 8. Axial load–strain curves of specimens (a) S80C0, (b) S130C1, (c) S130C2, (d) S130C4, and (e) S180C3 (all deformations measured via the LVDTs except for (c) specimens S130C2a and S130C2b which were measured using the DIC technique).
Buildings 13 02180 g008
Figure 10. Stress–strain curves of the five specimen types (a) S80C0, (b) S130C1, (c) S130C2, (d) S130C4, and (e) S180C3.
Buildings 13 02180 g010
Figure 11. Ductility of the specimens as obtained by the areas under the σc–σcc curve, normalized with respect to the calculated unconfined concrete ductility (0.27 MPa).
Buildings 13 02180 g011
Figure 12. Comparison of the experimental and model stress–strain curves of specimens (a) S80C0, (b) S130C1, (c) S130C2, (d) S130C4, and (e) S180C3.
Buildings 13 02180 g012
Figure 13. Comparison of the experimental and model stress–strain curves (zoom-in on the ascending branch) of specimens (a) S80C0, (b) S130C1, (c) S130C2, (d) S130C4, and (e) S180C3.
Buildings 13 02180 g013
Figure 14. Model–experiment comparison of the specimen’s ductility as obtained via the areas under the curve normalized with respect to analytical unconfined concrete (experimental values are averages with minimum and maximum results).
Buildings 13 02180 g014
Figure 15. The influence of the CFM reinforcement amount on the stress–strain behavior of specimens with 10 mm ties and 180 mm spacing (transverse steel reinforcement ratio of 0.79%).
Buildings 13 02180 g015
Table 1. Concrete mixture components.
ComponentAmount
Portland cement CEM I-52.5N (kg/m3)492
Water (kg/m3)118
Fly ash (kg/m3)103
Polypropylene fibers (kg/m3)2
Coarse aggregate (kg/m3)677
Sand (kg/m3)1041
Superplasticizer SIKA3110 (kg/m3)10
Retarding admixture BGR-80 (kg/m3)2
Slump (mm)140
Air content (%)2
Water to cementitious materials—w/c0.24
28-day average 150 × 150 mm cube compressive strength (MPa)99.6
Table 2. Column specimen details (circular, 250 mm diameter, 950 mm long, and fc = 84.7 MPa; steel reinforcement: ρl = 1.4%, and fy = 561 MPa).
NameTransverse
Steel Reinforcement
CFM
Φh (mm)s (mm)fhy (MPa)ρs (%)Sf(mm)Aroving
(mm2/m)
Layersteq {1}
(mm)
1S80C0a10805821.78-000
2S80C0b10805821.78-000
3S80C0c10805821.78-000
4S130C1a101305821.10389510.095
5S130C1b101305821.10389510.095
6S130C2a101305821.10517120.142
7S130C2b101305821.10517120.142
8S130C4a101305821.10517140.284
9S130C4b101305821.10517140.284
10S130C4c101305821.10517140.284
11S180C3a101805820.79389530.285
12S180C3b101805820.79389530.285
{1}  t e q = A s t r a n d S f , Astrand = 3.62 mm2.
Table 4. Normalized calculated ductility of hybrid-confined 250 mm diameter HSC columns.
Transverse Steel
Reinforcement
CFM Lateral Reinforcement
Ties Spacing
s (mm)
ρs (%)teq = 0 mmteq = 0.095 mmteq = 0.285 mmteq = 0.570 mm
Normalized Ductility
1801.785.945.986.156.62
21301.103.023.133.444.14
31800.791.962.112.523.38
Disclaimer/Publisher’s Note: The statements, opinions and data contained in all publications are solely those of the individual author(s) and contributor(s) and not of MDPI and/or the editor(s). MDPI and/or the editor(s) disclaim responsibility for any injury to people or property resulting from any ideas, methods, instructions or products referred to in the content.

