Abstract
The effects of thermoactivated recycled concrete cement (TARC) on mortar as a partial replacement for cement was examined. TARC is derived from concrete waste through a series of processes. Different mortar mixtures were tested, ranging from 0% to 50% TARC in 10% increments. A comprehensive range of tests was conducted to assess the properties of the mortar, including fresh, mechanical, microstructure, and durability evaluations. The fresh test indicated that the incorporation of TARC impacted the flow of mortar, leading to reduced workability as the percentage of replacement increased. Regarding mechanical performance, using 20% TARC resulted in improved compressive strength, bulk density, and ultrasonic pulse velocity (UPV). Microstructural analysis using thermogravimetry, scanning electron microscopy, and Fourier transform infrared spectroscopy (FTIR) revealed that the TARC mix exhibited advantageous thermal properties, enhanced FTIR spectra, and a denser microstructure, thereby enhancing the durability of the mortar. Overall, substituting OPC with TARC significantly reduces the carbon footprint associated with cement production, promoting sustainability and contributing to a circular economy in the construction industry.
1. Introduction
The demand for concrete is growing globally because of continued vigorous growth in the construction industry, which consumes half of all extracted natural raw materials, produces up to 40% of anthropogenic waste, and releases 30% of all polluting gases (CO2) [1]. A study on world economic growth forecasted that the planet’s built area will double in the next 40 years and that concrete production will have to rise by 25% by 2030 [2]. The total concrete output in 2017 has been estimated to be approximately 27 gigatons (Gt) [3]. This will lead to a rapid increase in aggregate consumption due to the high volume of aggregate content in concrete mixtures, which is estimated to be around 19 Gt of aggregate [1], around 4 Gt of Portland cement [4], and 2 Gt to 3 Gt of fresh water [5]. Therefore, if the trend for the source of material is the same during the coming years, the environmental impact, energy consumption, and increase in CO2 intensity of the concrete to be used for construction will become more evident, leading the construction industry to be more aggressive in addressing these issues.
The higher energy consumption and the emission of CO2 in concrete are mainly associated with cement production [6]. Cement products are the second most consumed substances on earth after water, with their production growing by 2.5% annually. Their production increased from 2.3 Gt in 2005 to 3.5 Gt in 2020, and it is expected to be around 3.7–4.4 Gt by 2050 [7]. Portland cement (PC) manufacturing for concrete work is an energy-intensive process that requires high temperatures (1450–1550 °C), consumes natural resources (mainly limestone and clay), and generates vast greenhouse gas emissions in the atmosphere (approximately 1 ton of CO2 per ton of produced cement). It is one of the primary causes of global warming and accounts for 8% of worldwide CO2 emissions [8]. Cement is the most energy-intensive material produced in the world, next only to steel and aluminum [9]. The production of one ton of cement consumes 80 units of electric power and around 1.5 tons of raw materials [7]. As a result, cement stands out as a construction material with substantial embodied energy and CO2 emissions, even in developing nations [10].
Tackling the concern of CO2 emissions arising from the cement industry stands as a substantial challenge, but it is accompanied by several viable pathways for exploration. Among these approaches, one involves integrating waste materials with cementitious properties into the cement manufacturing process. This utilization of waste materials holds promise for diminishing the need for conventional cement ingredients, consequently lowering the environmental impact generated by cement production and simultaneously promoting more ecologically sound waste-handling methods. Over the past two decades, a multitude of research endeavors have delved into the incorporation of supplementary cementitious materials (SCMs) sourced from diverse waste streams [11,12,13,14,15].
The annual generation of construction and demolition waste (CDW) accounts for the most significant volume of solid waste materials, with waste concrete being the predominant component among them [16,17,18]. The main driver behind the substantial amount of concrete waste is attributed to demolition activities. This is due to a combination of factors, including the presence of numerous aged structures and buildings that have surpassed their functional lifespan, the introduction of new construction standards, and the occurrence of natural disasters such as storms and earthquakes [17]. The conventional practice of disposing of these extensive waste quantities in landfills is no longer deemed appropriate. Therefore, the exploration of alternative approaches becomes imperative. Notably, research has been directed towards harnessing the potential of recycled concrete aggregate to enhance concrete sustainability [19,20,21]. Presently, CDW is subject to processing at specialized facilities, resulting in the creation of what is termed recycled aggregate [22]. These materials, categorized based on their composition, encompass recycled concrete aggregate (RCA), recycled ceramic aggregate, and recycled mixed aggregate (RMA) [23].
Concrete waste has the potential to serve as a valuable input for cement production, thereby decreasing the reliance on natural mineral resources in this process. Ongoing efforts are being directed towards incorporating waste concrete directly into cement replacement [16]. Specific strength grades of concrete are being studied, as they do not align with the current scenario of waste concrete disposal. Despite these advancements, unlike the recycling of concrete aggregates, the recycling sector is encountering difficulties in achieving the necessary technological advancements to effectively recycle and seamlessly integrate waste concrete into cement production.
Recycled cement (RC) can be produced from cement paste waste and can have similar properties to OPC [24]. Cement pastes from RC produced under 450 °C have the same strength as OPC paste, albeit with compromised workability. The properties of mortars containing thermoactivated recycled cement (TARC) has been investigated [25]. Binders containing CEM I 42.5R and 20%, 50%, and 100% TARC can be framed in the European normative strength classes 52.5, 42.5, and 32.5, respectively. The main obstacles that hinder the application of TARC are its low setting time and high water demand. Compared to the production process for OPC, the production of RC-450 °C can reduce CO2 emissions by 94% [26]. Evaluation has revealed that RC-450 °C paste exhibits strength similar to OPC paste, indicating the potential for substituting OPC with RC-450 °C. Consequently, TARC exhibits significant promise as an SCM for cement substitution.
Characterization of TARC in mortar compositions is currently in its early stages due to numerous uncertainties surrounding manufacturing, hydration behavior, and the resulting development of fresh, mechanical, microstructural, and durability properties. Moreover, there is a limited amount of knowledge available regarding the microstructural characterization of TARC, despite a few recent qualitative findings. Additionally, many studies have focused solely on TARC efficiency within a limited range of mortar compositions while neglecting various mix design characterization and TARC production conditions. As a consequence, the acquisition of additional scientific and technical information regarding the possibility of replacing OPC with TARC, as well as the effects that TARC has on the properties of mortar, is necessary. The effect of using TARC as a partial replacement in cement on the fresh, mechanical, microstructure, and durability properties of mortar to address the aforementioned issues, which primarily concern the impact on the environment caused by cement production’s carbon emissions, energy consumption, and the disposal of CDW in landfills through recycling and reusing, has been evaluated.
Brunauer–Emmett–Teller (BET), thermogravimetry (TG), and scanning electron microscopy (SEM) were used in conjunction with Fourier transform infrared spectroscopy (FTIR) to conduct a thorough investigation of this effect. Experiments were carried out to observe and analyze changes in thermal behavior, FTIR spectra, and the microstructural evolution of mortar following 28 days of curing. Furthermore, the mechanical and durability strengths for 3, 7, 28, 56, and 91 curing ages were evaluated. The combination of these methodologies enabled an extensive investigation and consistent characterization of the microstructure, mechanical, and durability development of TARC-produced cement mortar, providing greater understanding in this area.
2. Materials and Methods
This section comprises a comprehensive exploration of the experimental approach, utilized materials, mixture formulation, TARC production process, and characterization of related components. All experiments adhere to ASTM standards.
2.1. Materials
2.1.1. Binders
The binding materials selected for this study encompassed type I Portland cement (OPC) sourced from Dangote Cement PLC, conforming to the pertinent ASTM C150/C150M [27] standards, along with TARC. Before delving into the evaluation of how TARC affected mortar properties, a number of characterization tests were undertaken. The results of the BET test, disclosing surface area, pore size, and volume data for both OPC and TARC, along with chemical compositions as determined by X-ray fluorescence (XRF) analysis, are outlined in Table 1. TARC exhibits a more extensive surface area, measuring 500 m2/g, as opposed to OPC’s value of 340 m2/g. It is noteworthy that hydrated cement possesses a notably larger surface area when compared to its unhydrated counterpart [28]. This phenomenon can be attributed to micro-cracking and structural alterations, causing an incremental increase in the surface area of the dehydrated phases within TARC during thermal depolymerization. The specific gravity of TARC is indeed lower than that of OPC, as evidenced by Table 1. Depending on the annealing temperature during thermal treatment, the density of recycled cement can fluctuate between 2.65 g/cm3 and 2.95 g/cm3, a range that falls below the specific gravity of OPC particles, which is 3.15 g/cm3 [25].

Table 1.
Physical and chemical properties OPC and TARC.
The chemical analysis indicates that the major oxides of TARC are CaO (40.84%), SiO2 (25.36%), Al2O3 (5.4%), and Fe2O3 (8.5%). This material has both a hydraulic and pozzolanic nature since it has a significant amount of both CaO and SiO2. The pozzolanic reactivity of materials is primarily determined by their silica content [29]. Other oxides, such as MgO, K2O, and Na2O contents, were found to be within a limit specified in ASTM C618 [30]. MgO is less than 5%. Alkalis (K2O, Na2O), which contribute to the alkali–silica reaction [31] and reduce the strength of mortar [32], are also present in a low amount in TARC.
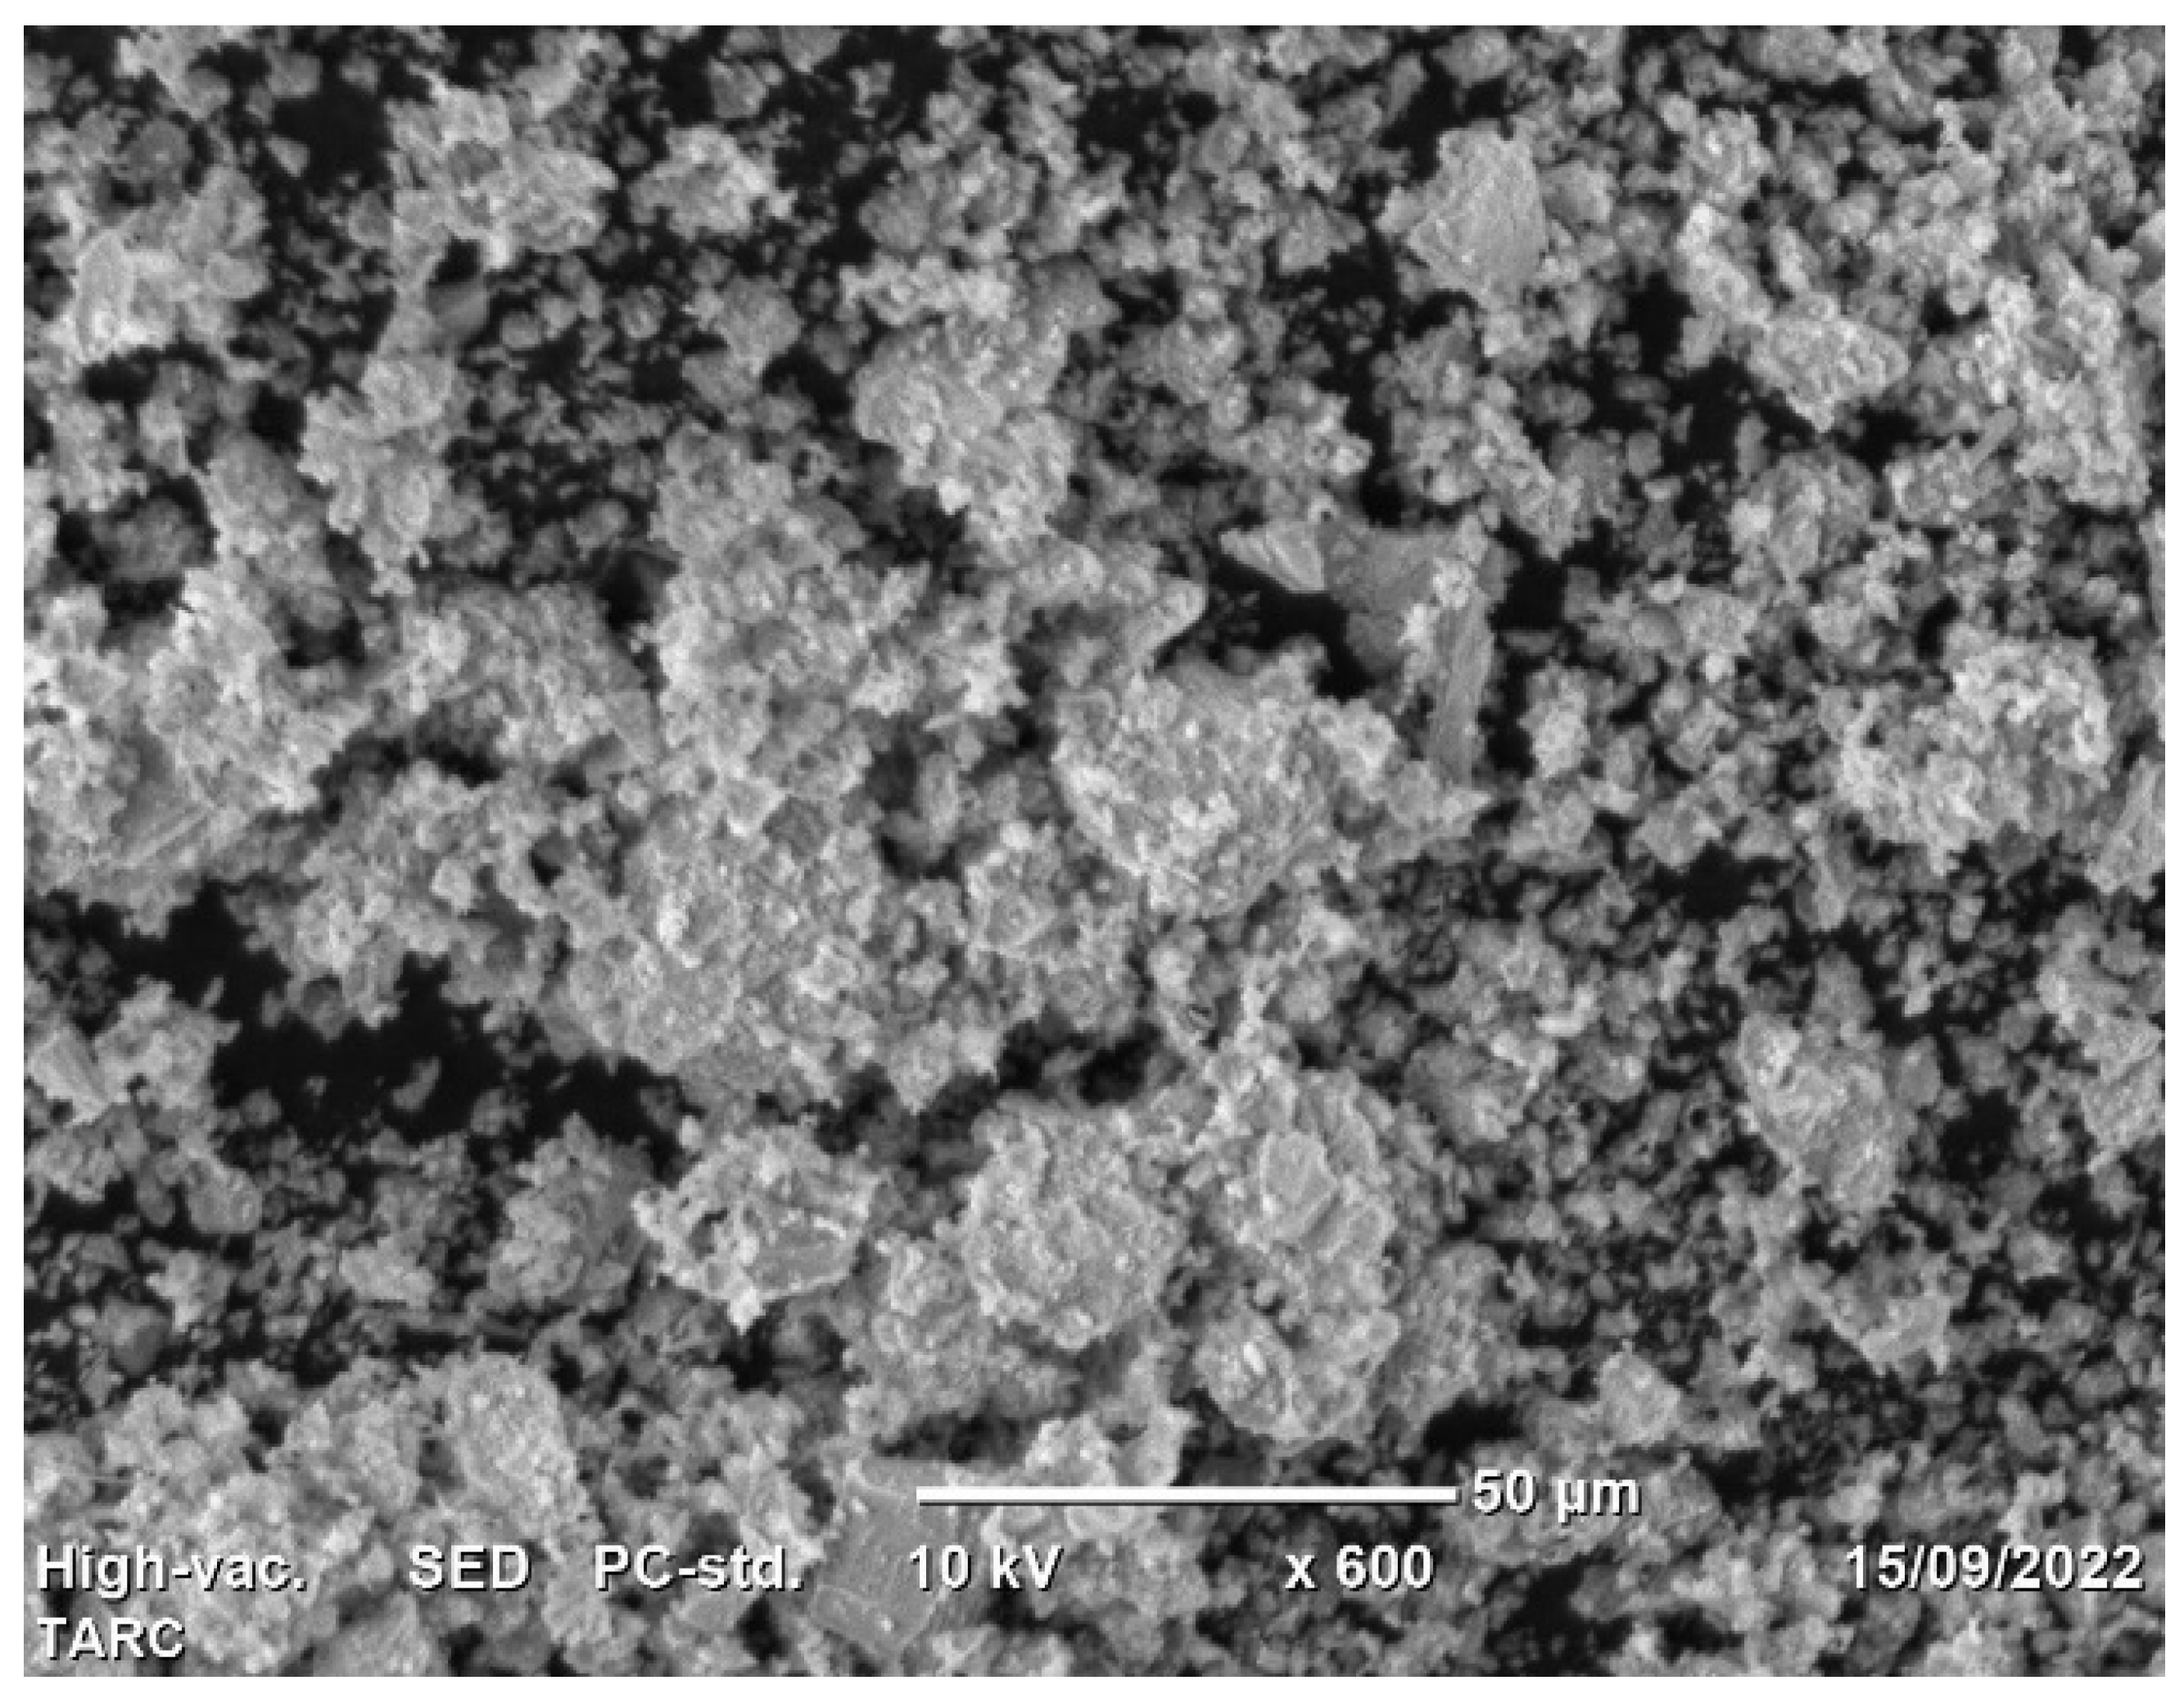
Utilizing scanning electron microscopy (SEM), the morphology of TARC was subjected to examination. The SEM scan, as illustrated in Figure 1, enabled the observation of TARC’s overall form and surface characteristics. The particles exhibit irregular edges and a coarse surface texture [33], along with a degree of porosity. This distinctive arrangement, when used as an additive, can elevate water requirements and impact the workability of concrete [34]. Furthermore, crystalline inclusions were identified on the surface of TARC particles. These inclusions might signify remnants of hydrates formed during the initial hardening process, encompassing portions of non-hydrated cement, unreacted calcium, and calcium silicates [35]. Similar findings have been reported in other studies, indicating the rough and angular surface morphology with a porous structure of recycled cement in contrast to the compact and crystalline structure characteristic of OPC [25,36].

Figure 1.
Morphology of TARC.
2.1.2. Fine Aggregates
Natural sand with a particle size below 4.75 mm, sourced from Lalibela, was used as the fine aggregate in this study. The appropriateness of this sand for the research was ascertained through a series of supplementary evaluations. A comprehensive summary of all examinations conducted is presented in Table 2. The results reveal that all characteristics fall within the acceptable range.
Table 2.
Physical properties of fine aggregate.
2.2. Methods
2.2.1. TARC Production Procedures
The production of TARC involved the establishment of a sequence of interconnected stages. The initial phase encompassed the collection of CDW from various construction sites. This waste originated from diverse construction activities like plastering, chiseling, block demolition, and other concrete-related tasks. Once the material was acquired, the subsequent stage involved the separation of non-concrete components and the utilization of mechanical techniques to reduce the screened CDW to a smaller size of 16 mm. For this mechanical crushing process, a jaw crusher machine with a production rate of 150 kg/h was employed. In the third stage, the product from the previous step underwent grinding or milling, facilitated by a grinding mill machine. To eliminate excess moisture content, the material was initially subjected to drying in an oven at 105 °C. Determining an optimal burning temperature and subsequently producing TARC constituted the final stages of the material production process. A spectrum of burning temperatures (ranging from 450 °C to 700 °C) was chosen, informed by prior studies [16,25,26,33,34,35,42], and further refined by conducting trial compressive strength tests for the selected temperatures. From this evaluation, a burning temperature of 700 °C was selected. The manufacturing of TARC culminated with a heating rate of 10 °C/min over a span of 1.5 h, followed by natural cooling, all executed within a muffle furnace, ensuring its readiness for ultimate use.
2.2.2. Mix Proportions
This study employed a cement-to-sand ratio of 1:2.75 for mortar production, which aligns with the standard ratio specified by ASTM C109/C109M for 2 inch or 50 mm cube mortar [43]. A consistent water-to-binder ratio of 0.486 was maintained. The specific material proportions for TARC-containing mortar are presented in Table 3. Mixing of the mortar adhered to the guidelines stipulated in ASTM C305 [44].
Table 3.
Material proportion of TARC-containing mortar.
The number of samples produced was determined by the mechanical and durability tests chosen. Therefore, the number of percentage replacements, along with the compressive strength, water absorption, sulphate resistance, and UPV of mortar, strongly influenced the basic size of the study. As per ASTM C109/C109M, a minimum of 3 samples must be used for each mortar test at various ages (e.g., 3, 7, 28, 56, and 91 days) [43]. Overall, a total of 291 cubes were cast to execute all the experiments constituting this study.
2.2.3. Test Program
As per the corresponding ASTM C187 [45], ASTM C191 [46], and ASTM C1437 [47] standard procedures, consistency, setting time, and workability were all determined. The assessment of consistency and setting time was carried out by employing the Vicat apparatus. The consistency test evaluates the uniformity of the mortar by quantifying the quantity of water required to achieve a standard level of penetration resistance when a plunger is applied to the surface of the mortar specimen. Meanwhile, the setting time evaluation involves measuring the duration necessary for specified penetration resistance to manifest within the mortar samples during the setting process. The onset of initial setting time is marked when the mortar has adequately solidified to hinder a 1.13 mm (0.44 inch) diameter needle from penetrating the surface, whereas the ultimate setting time is ascertained when the needle fails to penetrate a 3.18 mm (0.125 inch) diameter orifice in the mortar. The assessment of mortar workability was carried out by gauging its consistency using the flow table method.
To ascertain the compressive strength of TARC mortars, procedures in ASTM C109/C109M were followed [43]. The mortar’s sulphate resistance was calculated based on its remaining compressive strength. For the acid attack test, water diluted with 5% sodium sulphate (Na2SO4) was utilized. The bulk density of the mortar was calculated by weighing the cubes (2 inch) in their saturated surface dry (SSD) state and measuring their actual dimensions. Water absorption was measured by drying a sample to a constant mass, then adding water and determining the mass gain as a percentage of the dry mass. The Archimedes method was also used to measure porosity by adding to the mortar’s mass and weighing it underneath the water (buoyance).
The ultrasonic pulse velocity (UPV) test serves to examine both the quality of mortar and the presence of defects within it, achieved by transmitting electronic waves through the concrete. Throughout the entire curing period, the mortar’s UPV was measured using the same cubes. For each mixture, an average of three measurements was employed [48]. Scanning electron microscopy (SEM) was utilized to monitor the microstructure progression of ground cement and hardened mortar. These assessments were conducted under a high vacuum at 10 kV, employing different levels of magnification. Fourier transform infrared spectroscopy (FTIR) analysis was applied to distinguish organic, inorganic, and polymeric materials through the utilization of infrared light for sample scanning. Within the wavelength range of 4000–400 cm−1, the technique located functional groups and other substances. The ASTM E1131 [49] standard, originally designed for thermogravimetric and compositional analysis of solids and liquids, underwent adjustments to accommodate thermal analysis (DTA and TGA) assessments. Employing crucibles crafted from alumina, a DTA-TG analysis apparatus was utilized to evaluate the thermal stability of mortar across temperatures spanning from 20 to 900 °C, with an increment of 20 °C per minute.
3. Results and Discussion
3.1. Fresh Properties
3.1.1. Water Demand
Figure 2 shows the normal consistency of several selected mix compositions. The water requirements surged as the percentage cement replacement by TARC increased. Despite the fact that all of the mixes required more water than the control, they were all within the allowed limit of 27–33% to achieve a normal consistency [45].
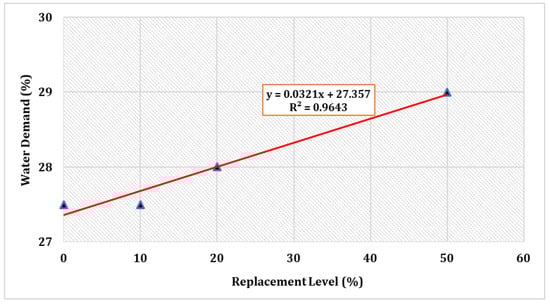
Figure 2.
Consistency of cement with partial substitution by TARC.
The increased uniformity might be attributable to the finer nature of the cement. Given that the recycled cement possesses a greater surface area in comparison to OPC, this factor can lead to a heightened requirement for mixing water [50]. In fact, given that TARC contains CaO in its composition, a portion of the mixing water promptly engages in a reaction with this compound, whereas another segment dissipates due to the exothermic character of this reaction [25]. Furthermore, a comparable investigation verified that TARC powders exhibit a greater need for water in comparison to OPC. This is primarily attributable to the high surface area and porous structure of the dehydrated components, coupled with the substantial accumulation of free CaO formed during the process of thermal treatment [33].
3.1.2. Setting Time
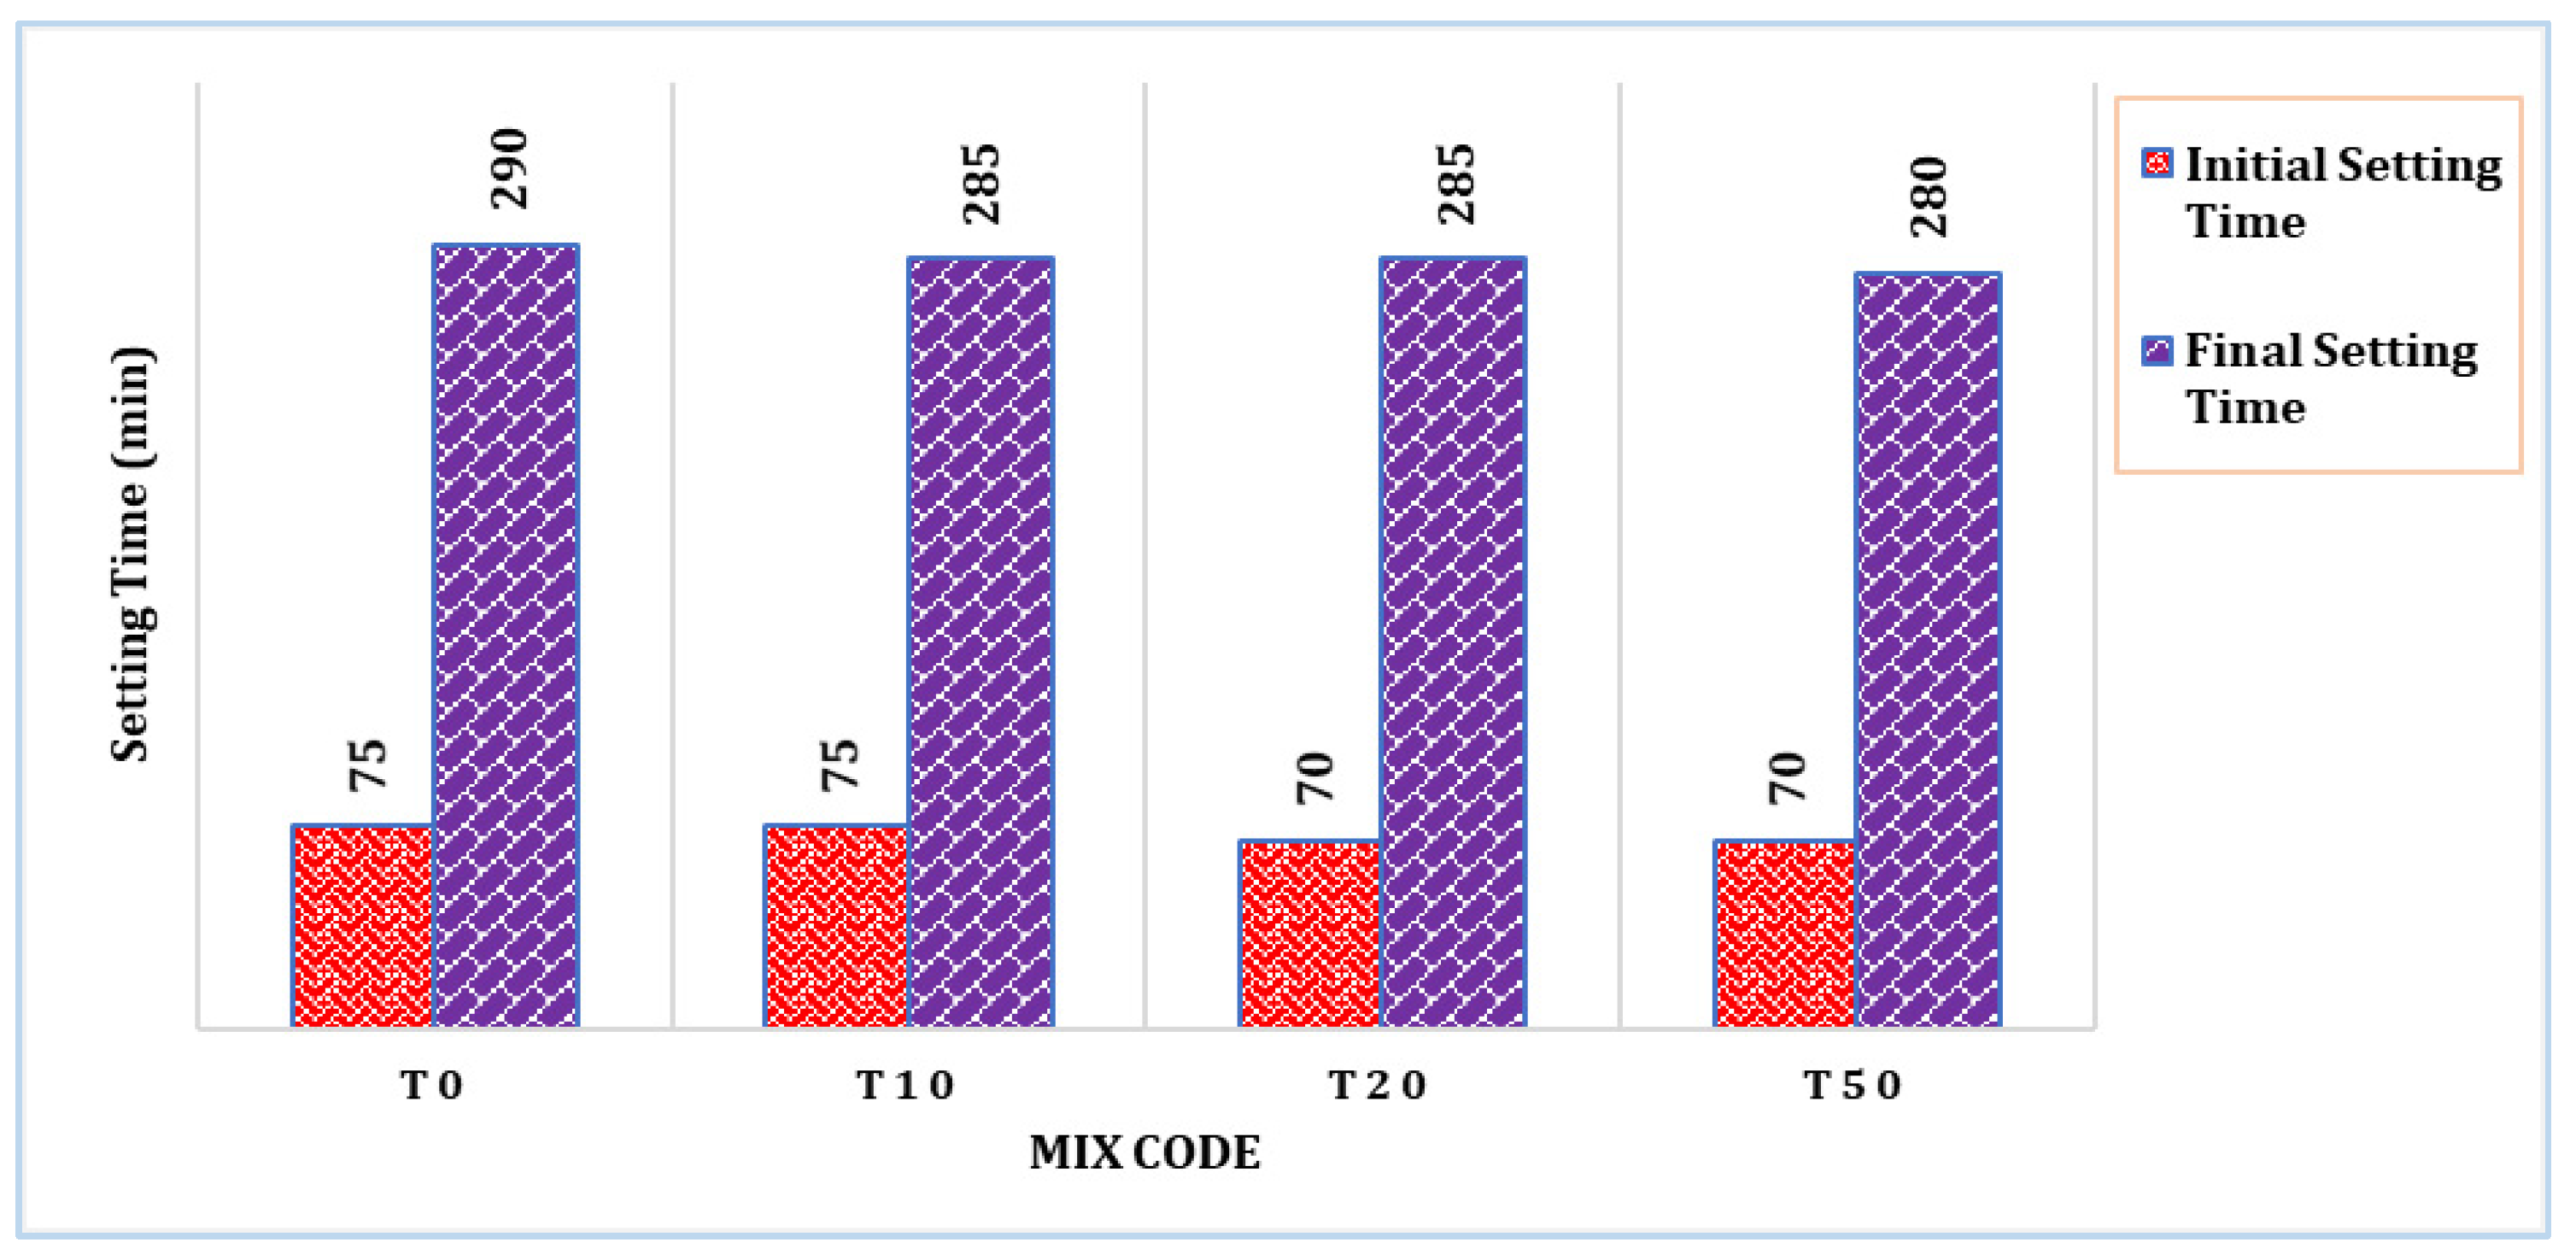
The setting time of selected mixes is shown in Figure 3. It can be observed that the TARC mix had a slightly shorter setting time compared to the control mix (T0). The initial setting time of the T10 mix remained unaffected by the incorporation of TARC. However, with increasing levels of replacement, both the initial and final setting times demonstrated a minor reduction. This outcome primarily stems from the impact of temperature treatment and chemical composition. Similarly, a related investigation manifested a gradual decrease in setting time as treatment temperature escalated, reaching up to 800 °C. This trend is attributed to the heightened degree of dehydration achieved during the process [28].

Figure 3.
Setting time of control and selected TARC mixes.
3.1.3. Slump Flow
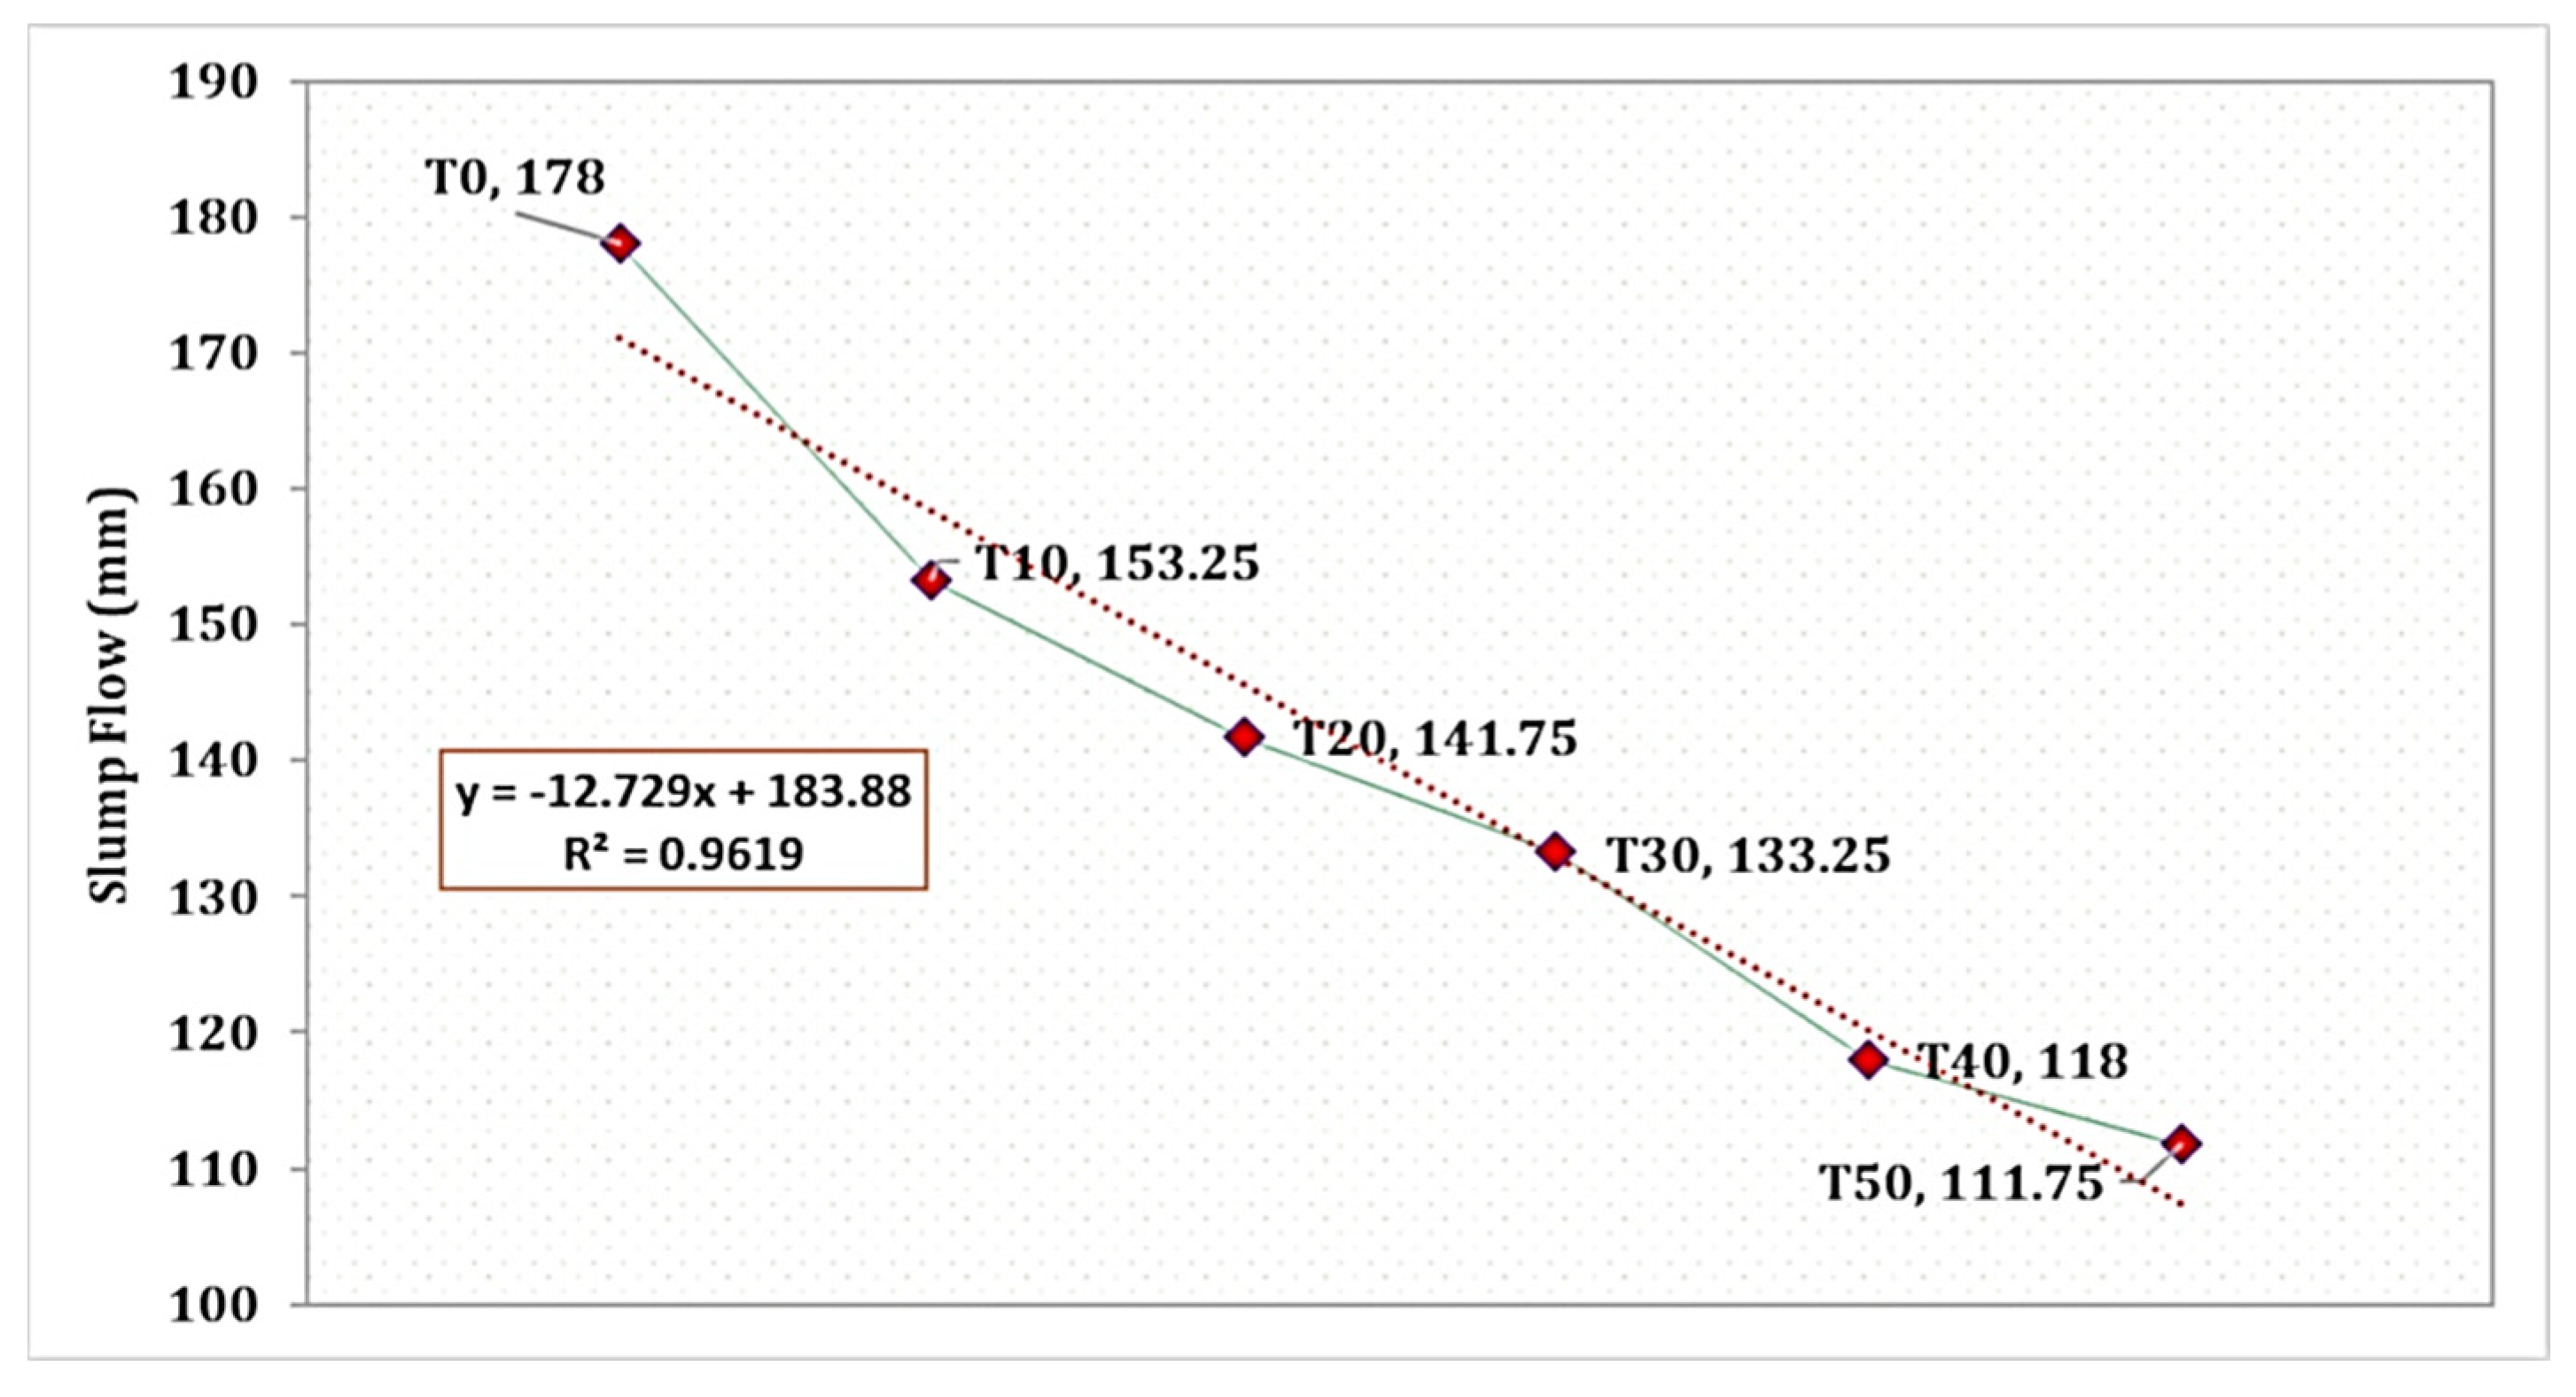
The influence of TARC replacement on mortar workability is evident in Figure 4, despite all mixes maintaining an identical water-to-cement ratio. The T0 mix showcased a comparatively improved average mortar flow of 178 mm. Conversely, with the increase in the proportion of TARC replacement, there was a gradual decrease in workability, following a linear pattern. As depicted in the figure, the reduction in flow corresponds significantly (R2 = 0.961) to the increase in TARC replacement percentage. The rationale behind this reduction in workability compared to the control mix lies in the characteristics of TARC, including its greater surface area, rough texture, and irregular morphology, all of which are illustrated in its morphology. A comparable investigation affirmed that the TARC mixture exhibited inferior workability compared to the OPC mixture. For instance, research conducted by [51] highlighted slight adjustments up to a 10% replacement level, though requiring the application of superplasticizer for TARC content ranging from 20% to 30%. Another study unveiled that as TARC necessitates more water than OPC, incorporating higher proportions of TARC led to mortars with a heightened water-to-binder ratio (w/b) to achieve equivalent workability. In the case of 100% TARC substitution, a staggering 34% more water was required compared to the scenario with 0% TARC [25].
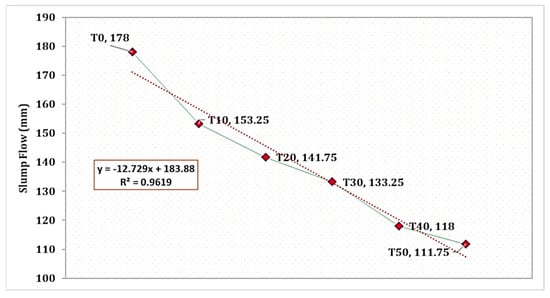
Figure 4.
Slump flow of mortar incorporating different levels of TARC replacement.
3.2. Mechanical Properties
3.2.1. Bulk Density
Figure 5 displays the bulk density of mortar determined by SSD weight across diverse mixture compositions and varying periods of mortar curing. The bulk density of TARC exhibited a noticeable surge as its replacement percentage escalated, reaching a peak at 20% replacement before declining, particularly with increasing mortar age. Remarkably, the T20 mix was denser than both the T0 mix and all other blends. This phenomenon is mainly attributed to the dual pozzolanic and hydraulic properties of TARC. Moreover, the heightened surface area of TARC plays a significant role in augmenting bulk density over extended periods. Materials with greater specific surface area values have the tendency to densify and compact concrete due to their ability to fill pores [51].
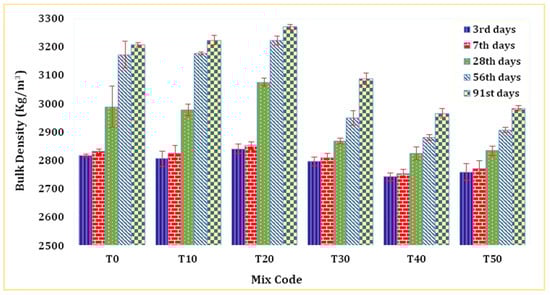
Figure 5.
Bulk density of mortar containing TARC.
3.2.2. Compressive Strength
Figure 6 depicts the impact of TARC on the compressive strength of mortar. A substantial rise in compressive strength was evident up to the 20% replacement level (T20), followed by a steep drop from T20 to T50. As demonstrated in the figure, replacements ranging from 10% to 40% exceeded the strength activity index (SAI) line. These mixtures attained over 75% of the 28 day compressive strength observed in the T0 mixture.
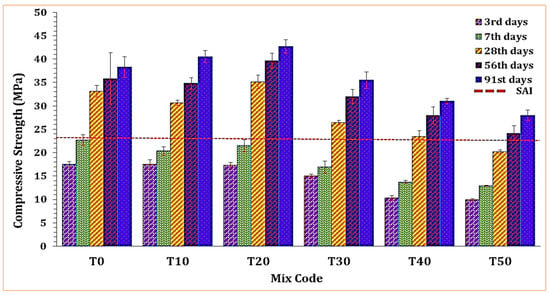
Figure 6.
The effect of TARC on the compressive strength of mortar.
Several investigations [51,52,53] have delved into the incorporation of varying quantities of TARC within the OPC matrix, yielding somewhat contradictory outcomes. These researchers examined the material with different replacement percentages and diverse source materials. For instance, in one study [52], an attempt was made to substitute OPC with TARC at 750 °C in high proportions (40–60%). The results indicated that at a 40% replacement level, the 28 day compressive strength (50 MPa) slightly lagged behind that of OPC paste (57 MPa). Another study [53] involved the inclusion of 5% to 15% TARC at 650 °C. In comparison to OPC paste, a 30% increase in compressive strength was observed when 5% of OPC was replaced with TARC. A separate study [51] produced mortars incorporating thermoactivated recycled concrete fines (RCFs) at 500 °C and 800 °C to substitute 10% to 30% of the cement. As more TARCs were introduced, the compressive strength of these mortars decreased. Notably, across all replacement ratios, TARCs treated at 800 °C exhibited the most favorable overall mechanical performance. Even replacing 10% of OPC with such treated TARCs remained sufficient to meet the specifications for a 42.5 strength class cement.
Although pozzolans account for the vast majority of SCMs, it is critical to distinguish between pozzolans and direct cement substitutes. A cement substitute known as a direct cement replacement can substitute for Portland cement without requiring pozzolanic activity or reaction, and ground granulated blast furnace slag (GGBFS) is an excellent example of this [54]. These materials can directly replace up to 90% of cement. When compared to GGBFS, TARC has very similar chemical compositions. As a result, it can be asserted that this material exhibits both a hydraulic and pozzolanic nature. This explains the early-age strength in 10% replacement between 3 and 7 days and the latter-age strength between 56 and 91 days. According to [55], pozzolanic reactions occur over long time scales (months to years). The main mechanism involves the transportation of calcium hydroxide (C–H) via water to combine with the aluminate and/or silicate clay minerals.
3.2.3. Ultrasonic Pulse Velocity
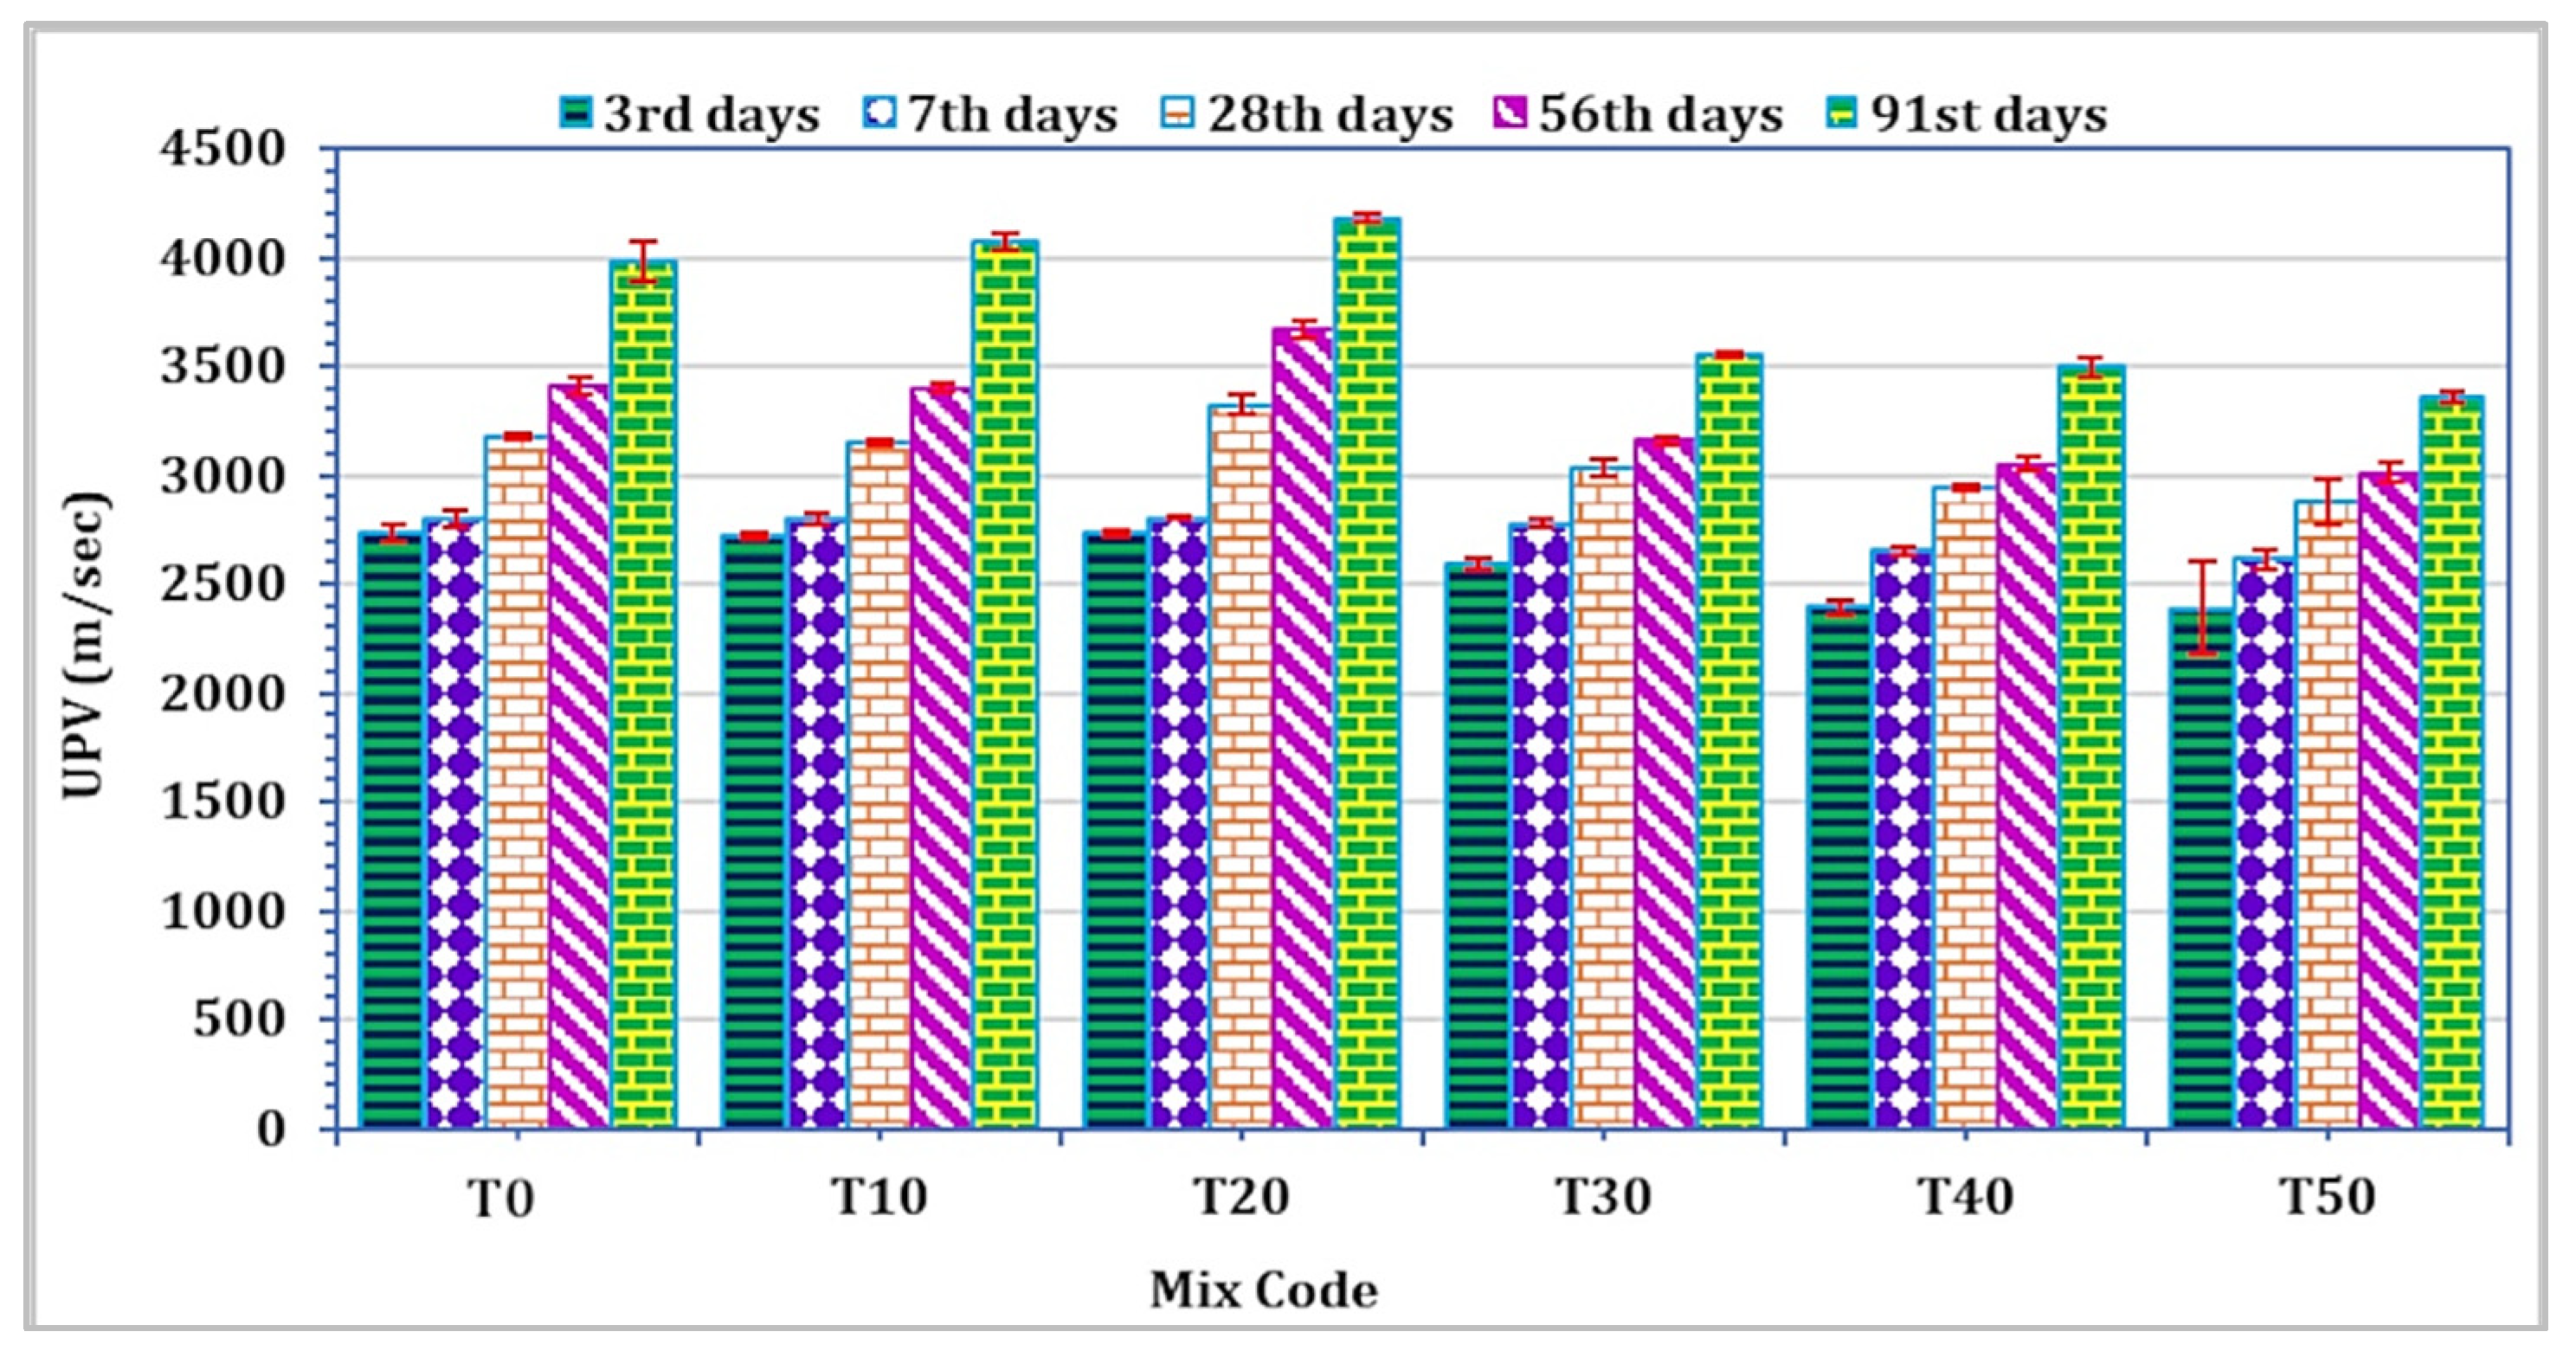
To assess the impact across different curing periods, three cubes were employed to analyze the UPV of mortar for each mixture and at all curing durations. The spectrum of UPV values for all curing intervals ranged from 2387.3 m/s to 4178.3 m/s, as depicted in Figure 7. Notably, TARC replacement within the 10–20% range demonstrated an enhancement in UPV value. However, subsequent to this modest enhancement up to 20%, there followed a rapid linear decrease in UPV. To classify concrete quality based on UPV values, the BS 1881: Part 203 standard [56] was employed. As per this standard, UPV values falling within the range of 3500 m/s to 4500 m/s are categorized as representing good quality. It is noteworthy that the UPV measurement for mortar incorporating 20% TARC, observed after 28 days of curing or more, fell within the classification of good-quality concrete.
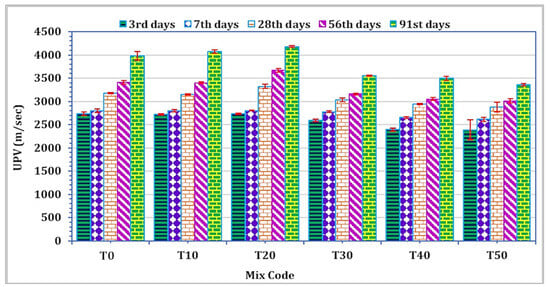
Figure 7.
The effect of TARC on UPV of mortar.
3.3. Microstructure Properties
3.3.1. SEM
Figure 8 depicts SEM images illustrating the surface morphologies of diverse specimen hydration products, captured through secondary electron imaging. The specimens under scrutiny include the control (T0), T10, and T30 mortars. Across all samples, the presence of calcium silicate hydrate (C–S–H), Portlandite (C–H), and pores was evident. The primary hydration products, C–H and C–S–H, were recognized and characterized based on their distinct morphologies [42]. C–S–H was recognized by its foil-like appearance, and the pores appeared to be dark in the SEM images of hardened concrete, where C–H exhibited a typical hexagonal habit and appeared as blocky crystals [57].
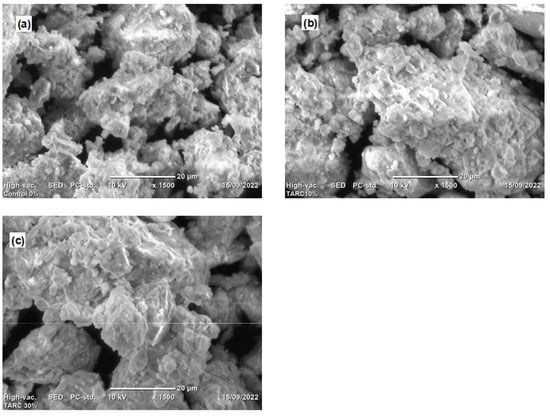
Figure 8.
SEM image for (a) T0 (control), (b) T10, and (c) T30.
The control mix exhibited a sizable amount of C–H compared to the T10 mortar, despite the fact that SEM did not serve as a quantification method for assessing the abundance of hydration products within the mix. This observation finds additional support through the TGA and DTA curves showcased in Section 3.3.3. The TGA and DTA graphs indicate that the control sample demonstrated an early generation of C–H as a result of CaO rehydration or the decomposition of C–H caused by water loss, transpiring within the temperature range of 450–510 °C. The magnitude of this phenomenon in the control mix surpassed that observed in the other mixtures.
The SEM analysis revealed a relatively compact microstructure or the formation of hydration products within the T10 mixtures, as illustrated in Figure 8b, underscoring the reactivity of TARC. The substantial specific surface area and the hydraulic characteristics of TARC significantly contributed to the observed dense microstructure in these mortar compositions. An essential objective of pozzolanic materials, or materials exhibiting such traits, is to occupy voids within concrete or refine pores [58]. The chemical compositions substantiate this aspect, having showcased a noteworthy presence of CaO and SiO2 in TARC. Consequently, this attribute enhanced the generation of more C–S–H, owing to the reactive SiO2 within TARC. Furthermore, given the heightened fineness of this material, it effectively served as a filler, accentuating its pore-filling capacity.
3.3.2. FTIR
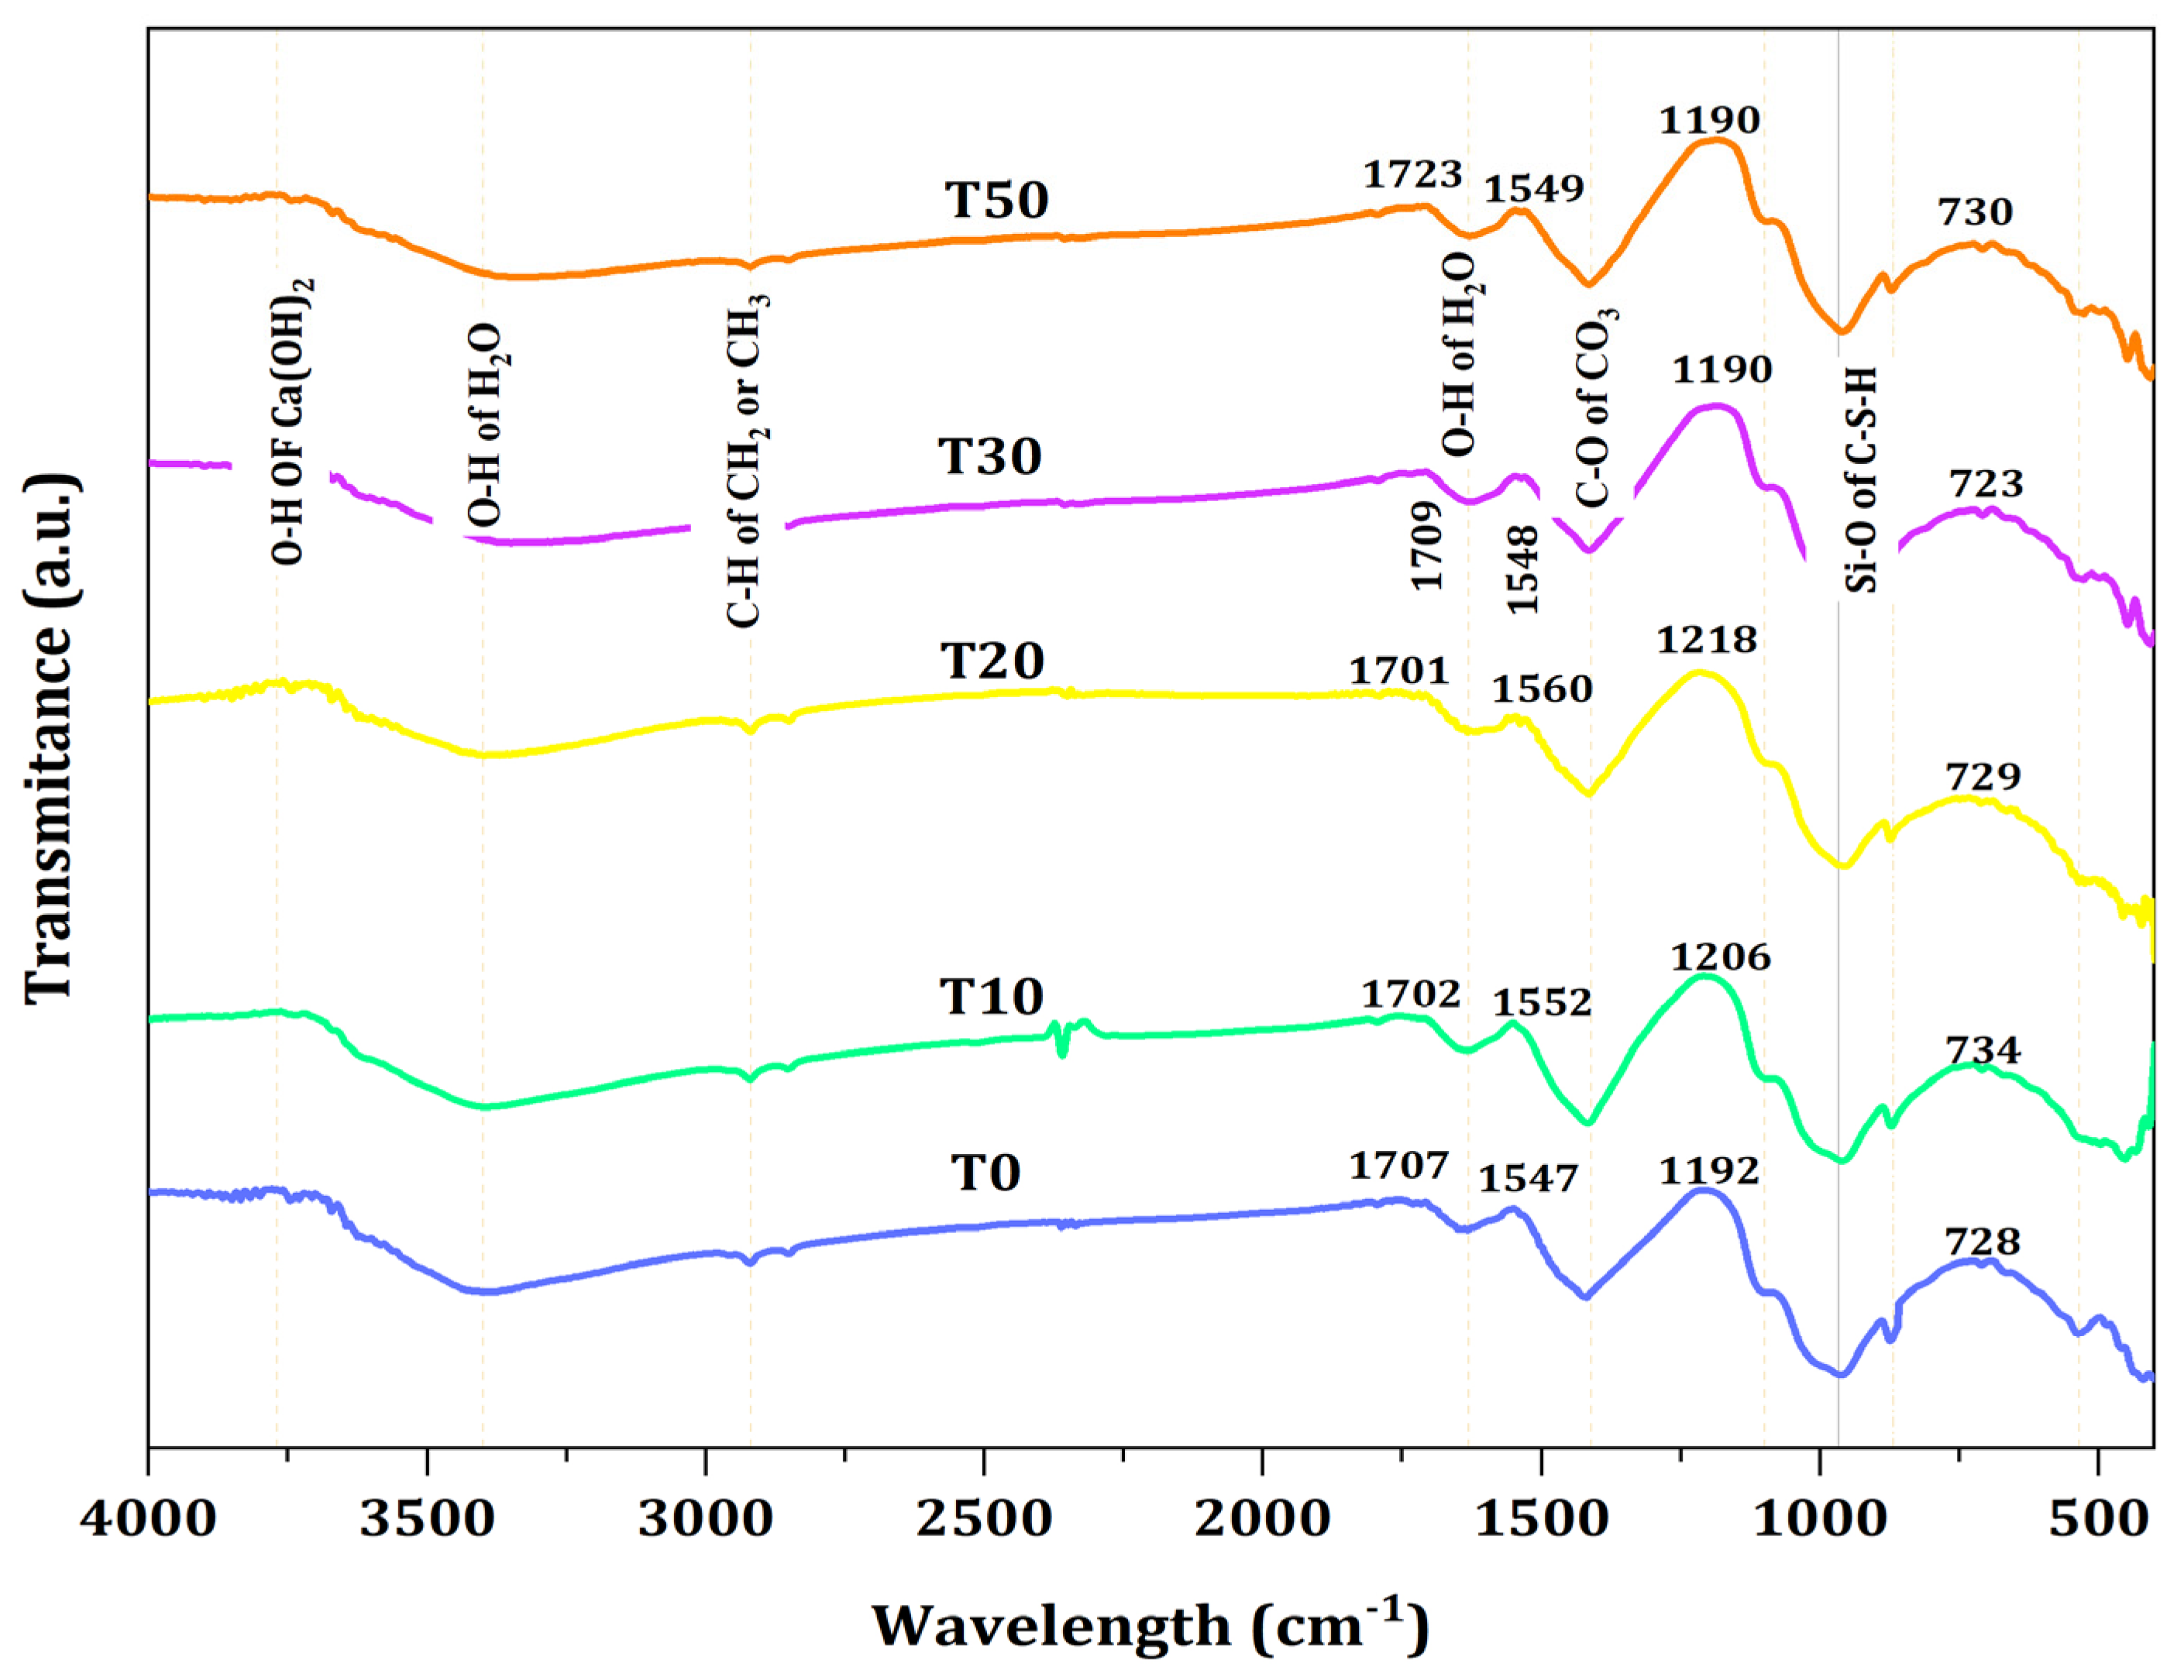
Figure 9 shows the FTIR spectra of mortar containing TARC with varying percentage replacements. As illustrated in the figure, the peaks situated between 900 and 1100 cm−1 correspond to the vibrations of Si–O bonds within the C–S–H phase. A comparison with the control samples revealed that the (Si–O–Si) band’s relative intensity was greater in paste samples containing only T10 and T20 or their combination with TARC. The displacement of the Si–O band toward higher wavenumbers arose from the polymerization of silica.
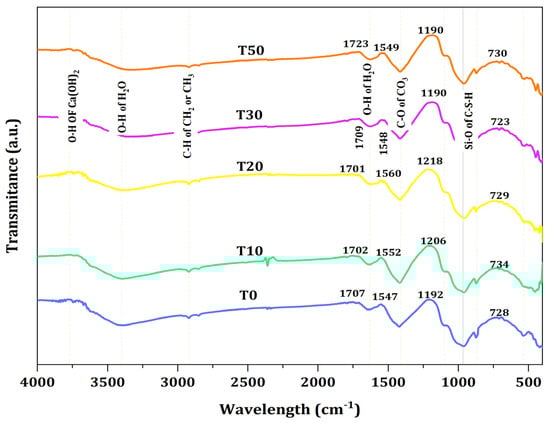
Figure 9.
FTIR spectra of TARC-containing mortar.
The wave number in the spectra of T10 and T20 mixes indicated the formation of a large quantity of high-density C–S–H gels. According to [59], this heightened formation of C–S–H gels could potentially account for the elevated compressive strength and favorable FTIR spectra in these particular mixtures [59]. However, with the progression of the TARC replacement percentage, there was a discernible presence of partially unreacted particles, observed particularly in the T30 and T50 compositions, indicated by a peak around 455 cm−1 [60], in contrast to the other blends.
Table 4 provides a consolidated overview of the analysis concerning absorption peaks, bonds, phases, and the assignment of FTIR spectra for the previously mentioned mix formulations that underwent 28 day water curing. The identification of the specific peaks was facilitated by using the data reader within the Origin Pro software. It is worth noting that although the generated graphs employed arbitrary units for transmittance intensity, the data were still accurately extracted and interpreted.
Table 4.
Summary of interpretation for absorption peaks.
3.3.3. TGA and DTA
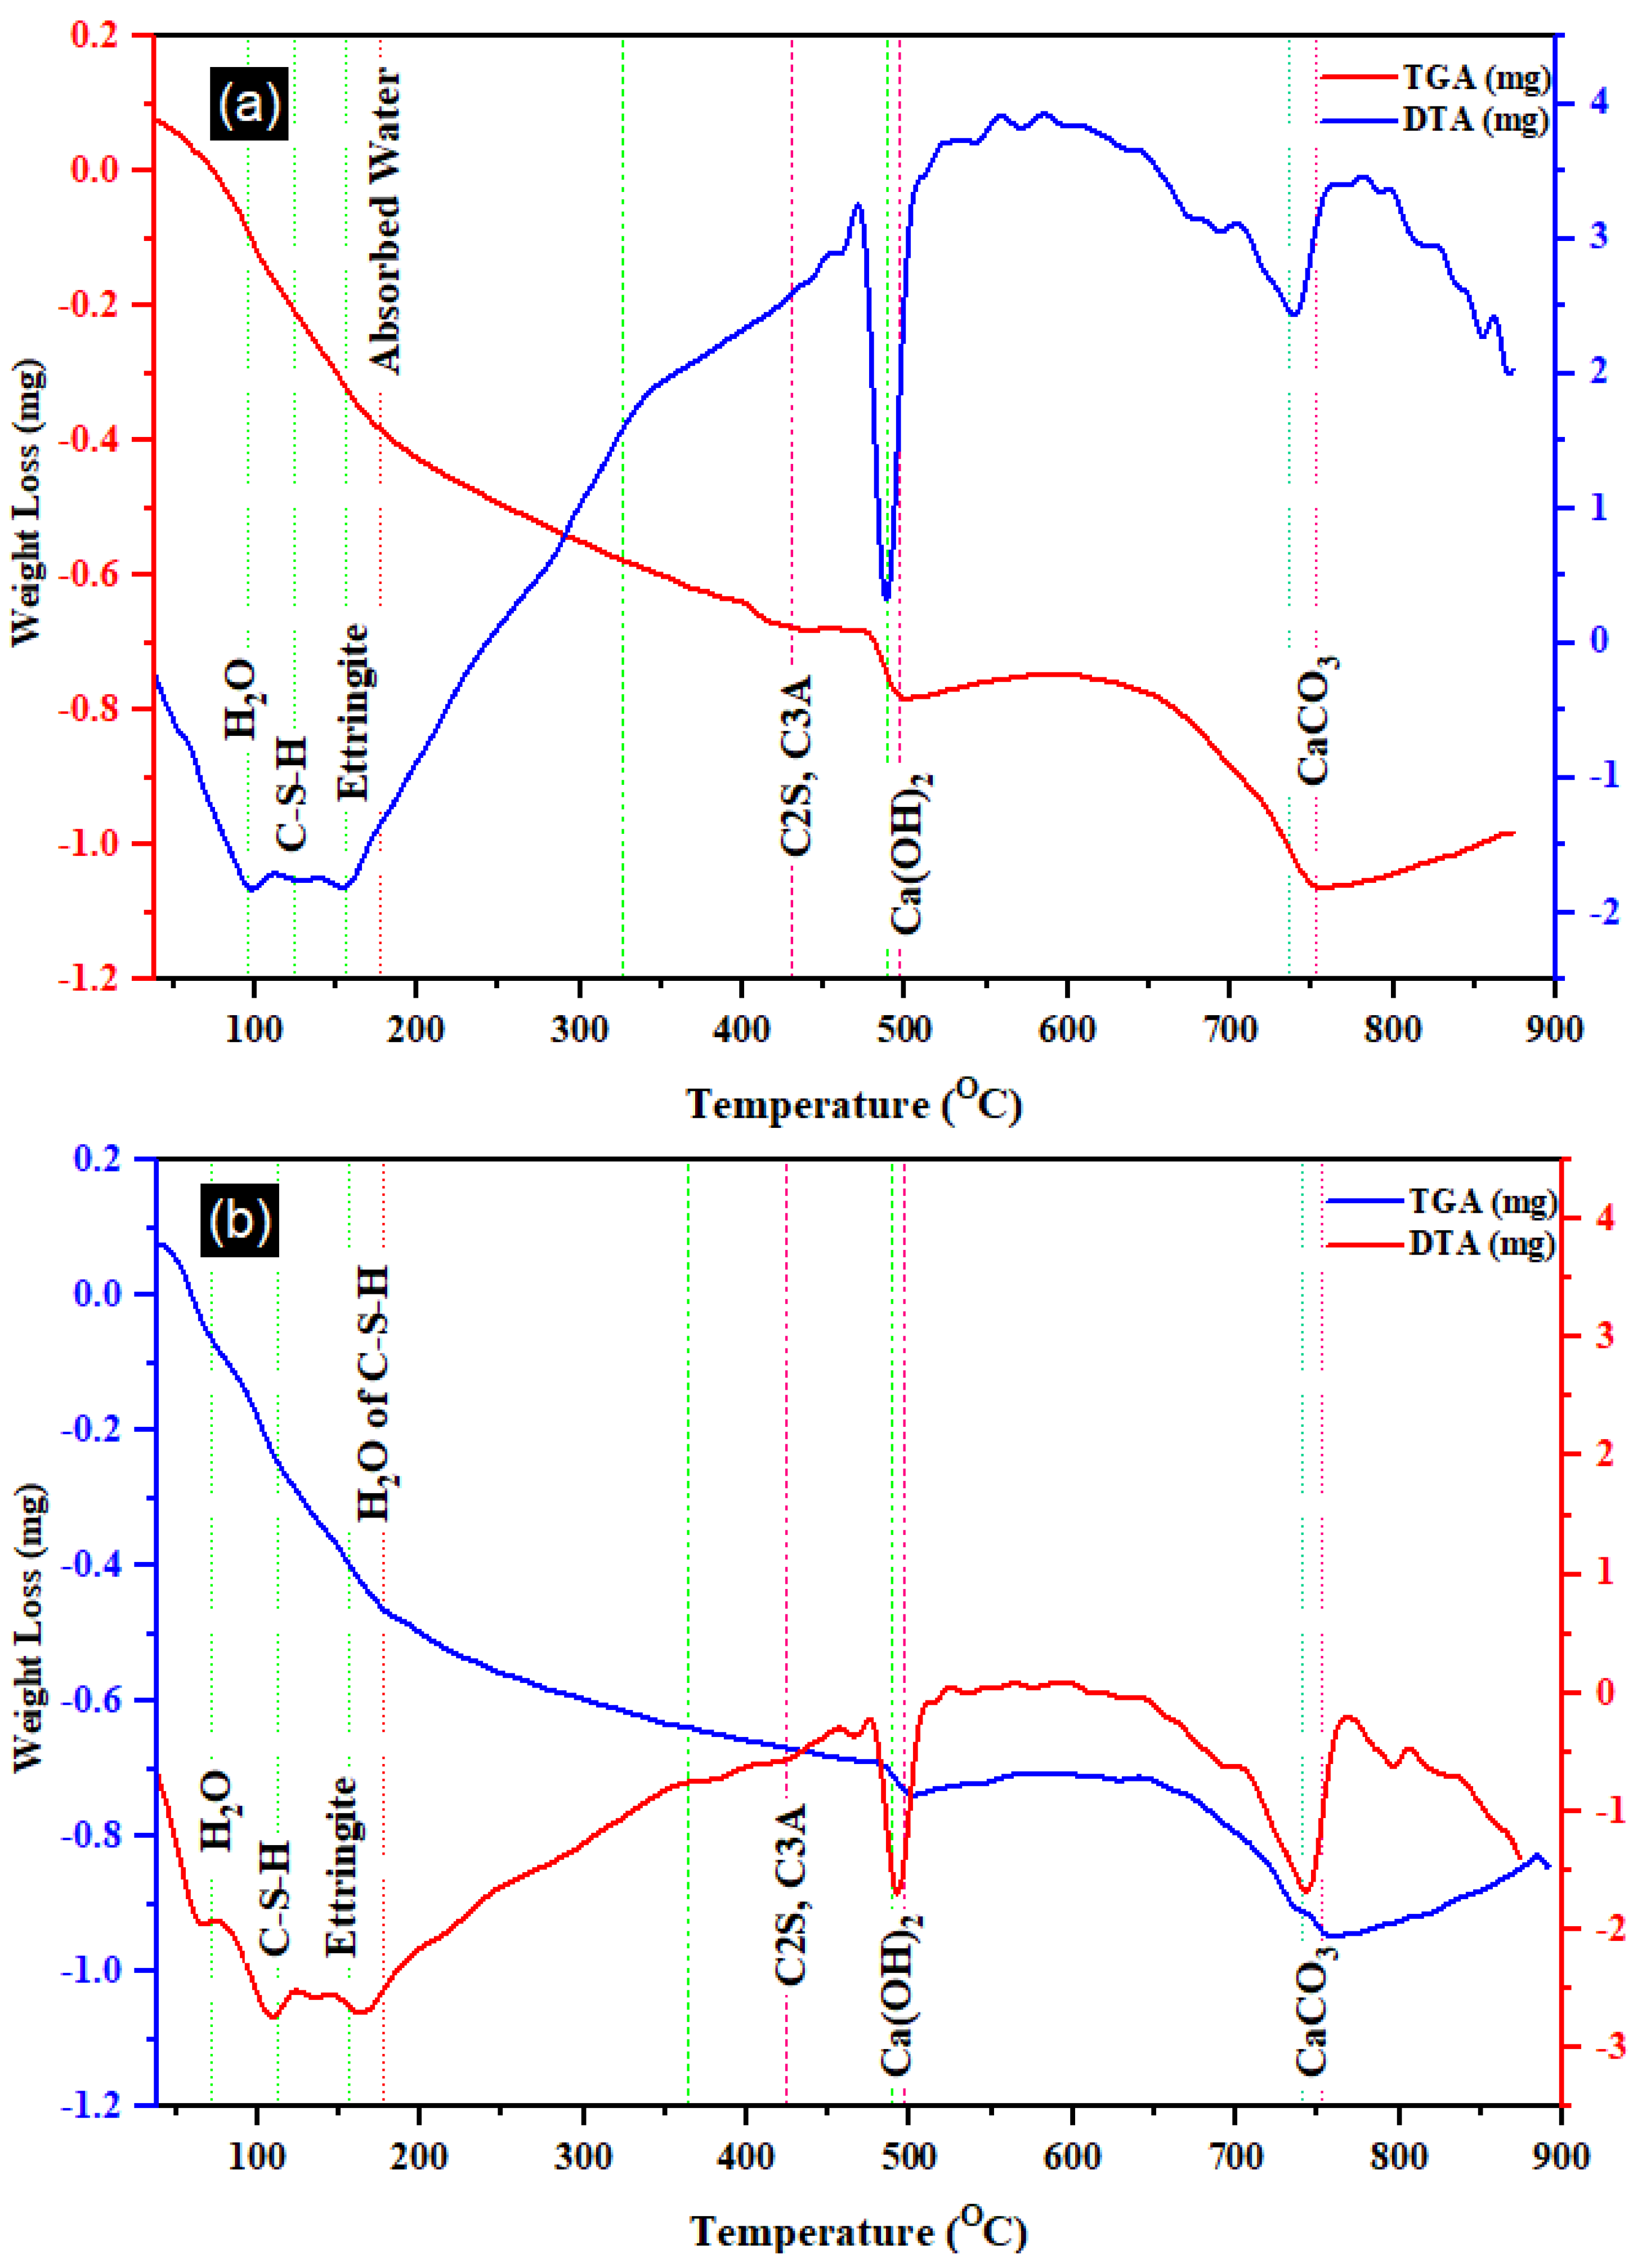
Figure 10 depicts the DTA and TGA curves for the T0 and T20 mixes. Each curve exhibited seven distinctive peaks, indicative of the major hydration products [60]. A notable reduction in mass between 450 and 510 °C was identified, correlating with the premature formation of C–H arising from CaO rehydration. Additionally, a minor Ettringite peak at 160 °C [61], observed in both the SEM images of T0 and T20, was discernible. At this point, free water emanating from C–S–H was also observable [62]. Another significant peak around 750 °C can be attributed to the decomposition or decarbonization of CaCO3 (Calcite) [63]. Notably, the DTA and TGA profiles indicated a relatively higher C–S–H decomposition in T20 compared to T0 (the reference mortar) at 100 °C, present in both mixes. Furthermore, the detection of Portlandite at 495 °C in T20 blends was less pronounced than in T0 due to the hydration reaction between silica and this material. This observation aligns with the other mechanical and microstructure characteristics of the mortar discussed in the preceding section.

Figure 10.
TGA and DTA of (a) T0 and (b) T20 mortar.
Table 5 provides a comprehensive overview detailing distinct thermal events observed through TGA and DTA for the selected samples, along with their corresponding temperature intervals. As outlined in the table, four prominent events encompassing thermal decompositions were identified, enabling the calculation of their associated mass losses. Notably, the decomposition of Portlandite within the T20 mix registered significantly lower than that observed in the T0 blend. A similar trend was observed in the decarbonization of calcite or calcium carbonate, which was notably subdued in the T20 mixture. In contrast, the T0 mix exhibited notably heightened decomposition in calcite, transpiring within the temperature range of 650 to 800 °C [64].
Table 5.
Summary of thermal events for TGA and DTA selected material, referring to Figure 10.
3.4. Durability Properties
3.4.1. Sulphate Attack
Sulphate attacks on concrete can cause expansion, spalling, cracking, and strength loss [65,66]. Sulphate attacks can be internal or external, depending on where the sulphate comes from [67]. Figure 11 shows the compressive strength of mortars subjected to water and sulfate solutions during various curing periods (from the 3rd to the 91st day). It is discernible that the compressive strength of mortars cured in sulfate solutions was marginally lower than that of mortars cured in water, irrespective of the mortar compositions, whether the control mix or TARC-containing mortars. Notably, the reduction in compressive strength experienced a slight elevation with the augmentation of the TARC replacement. In general, the average reduction in compressive strength due to sulfate attack ranged from 0.07 MPa to 1.79 MPa across all curing stages (from the 3rd to the 91st day). This observation suggests that sulfate attack has minimal impact on the mortar, particularly in its early stages of development. The manifestation of sulfate attacks might take several decades to become evident. Consequently, only a limited number of studies have examined concrete subjected to extended exposure periods [67].
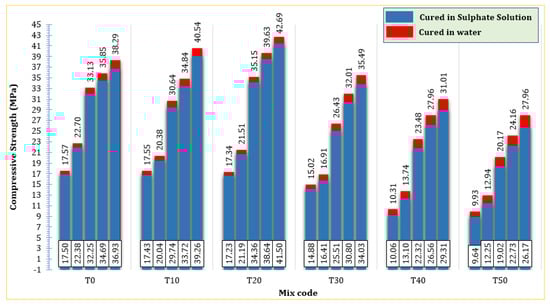
Figure 11.
The effect of TARC on the sulphate resistance of mortar.
3.4.2. Water Absorption
Figure 12 shows the water absorption rate of all mix formulations across curing durations from the 3rd to the 91st day. A notable reduction in water absorption levels was observed as the curing duration progressed across all ages. Comparable studies have likewise demonstrated a systematic reduction in the rate of water absorption with an increase in the curing period [1,68]. As seen in Figure 12, evidently, there was a marginal enhancement in the water absorption rate up to a 20% replacement, particularly during the later curing periods. However, in its initial stage, this blend demonstrated slightly inferior performance compared to the T0 mortar. Notably, the highest water absorption rate was recorded in T50 on the 3rd day of curing, reaching 13.55%. On the 3rd and 7th days of curing, the reference mortar (T0) exhibited superior water absorption characteristics. Similar to the trends observed in compressive strength, UPV, and mortar density in the preceding sections, a 20% replacement of TARC also led to improved water absorption performance. Upon reaching the 91st day of curing, the T20 mortar displayed a water absorption rate of 5.3%, surpassing all other mixtures. This outcome signifies the matrix’s heightened compactness, strength, and durability.
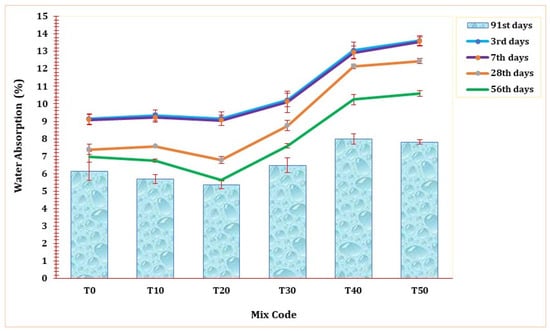
Figure 12.
The effect of TARC on water absorption of mortar.
3.4.3. Apparent Porosity
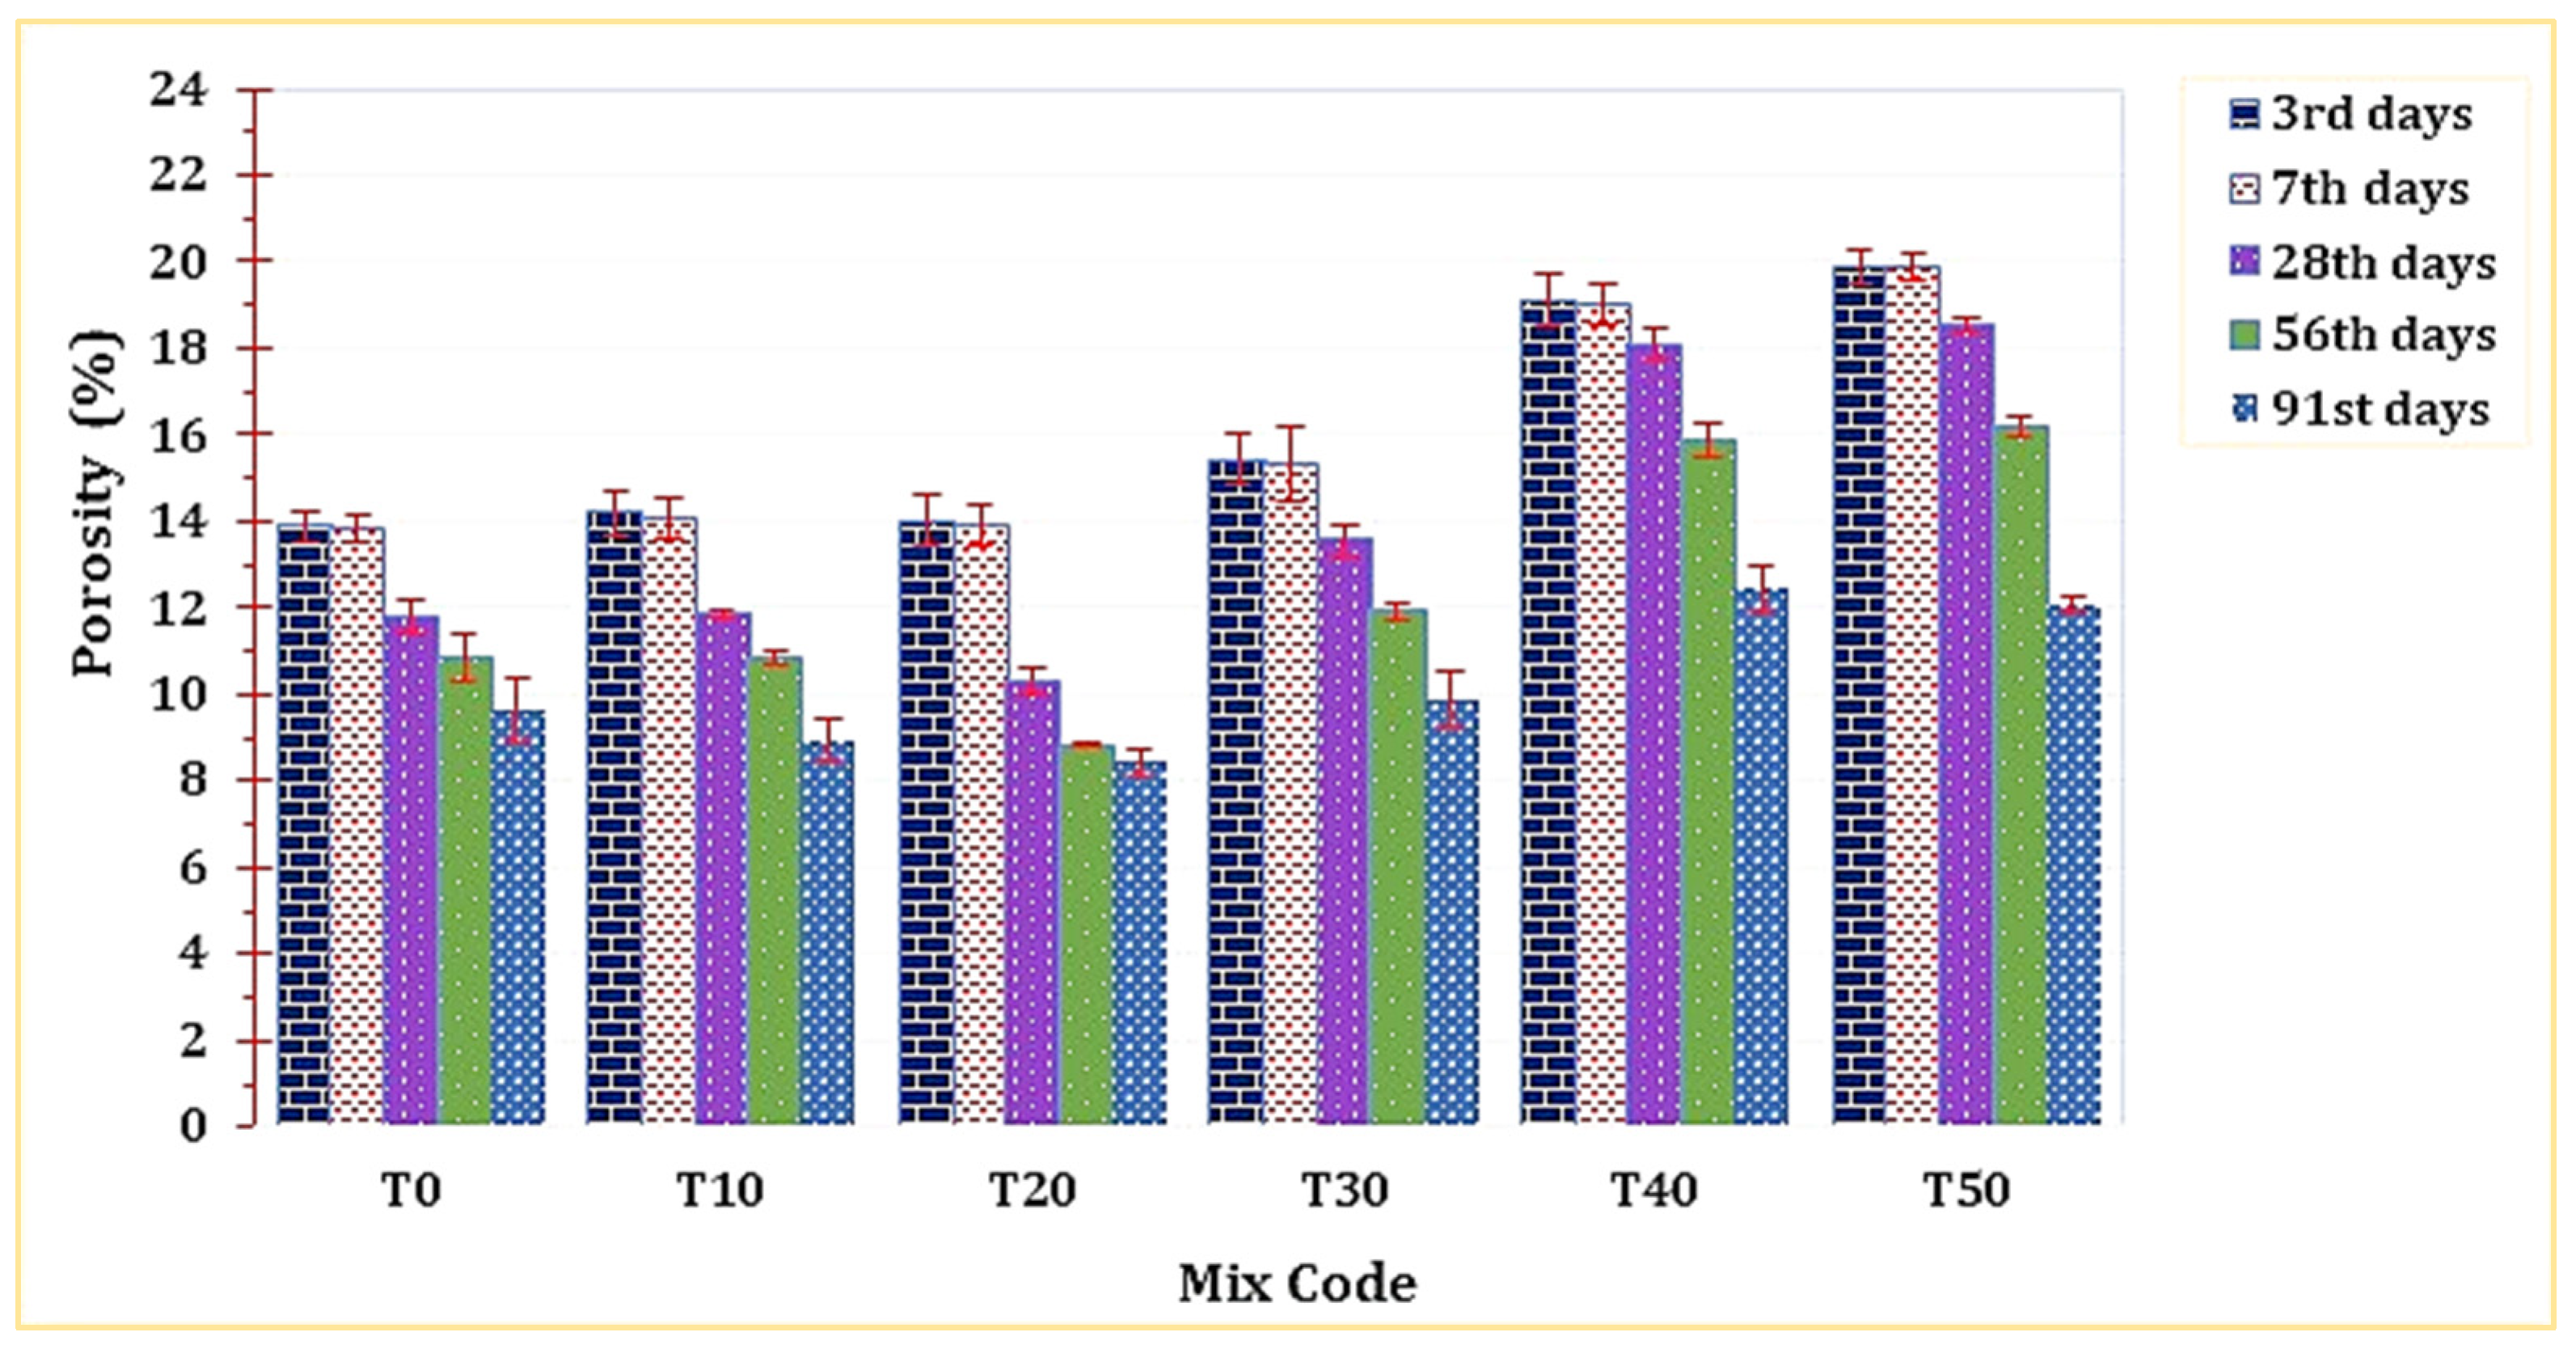
As depicted in Figure 13, the porosity of T20 was notably lower compared to all other mixtures. This outcome can be attributed to its elevated bulk density, a factor discussed in the preceding section. The enhanced, denser microstructure revealed in the SEM analysis serves as evidence for T20’s reduced porosity. However, it was observed that raising the percentage of this material replacement would lead to a subsequent decline in the mortar’s porosity.
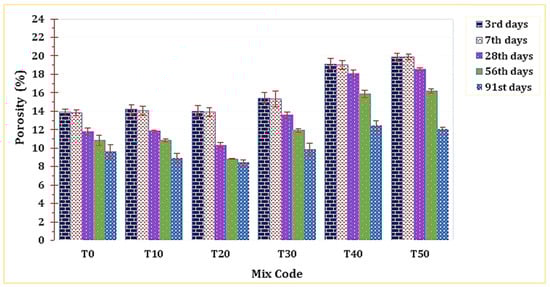
Figure 13.
The effect of TARC on the porosity of mortar.
It is evident that TARC contributes to the improvement of mortar qualities, evident through its microstructure, compressive strength, and various other parameters. This enhancement can be primarily attributed to the hydraulic and pozzolanic characteristics of the materials [34], as well as their larger specific surface area [25] and capacity for refining pores.
3.5. Correlations between Properties of Mortar
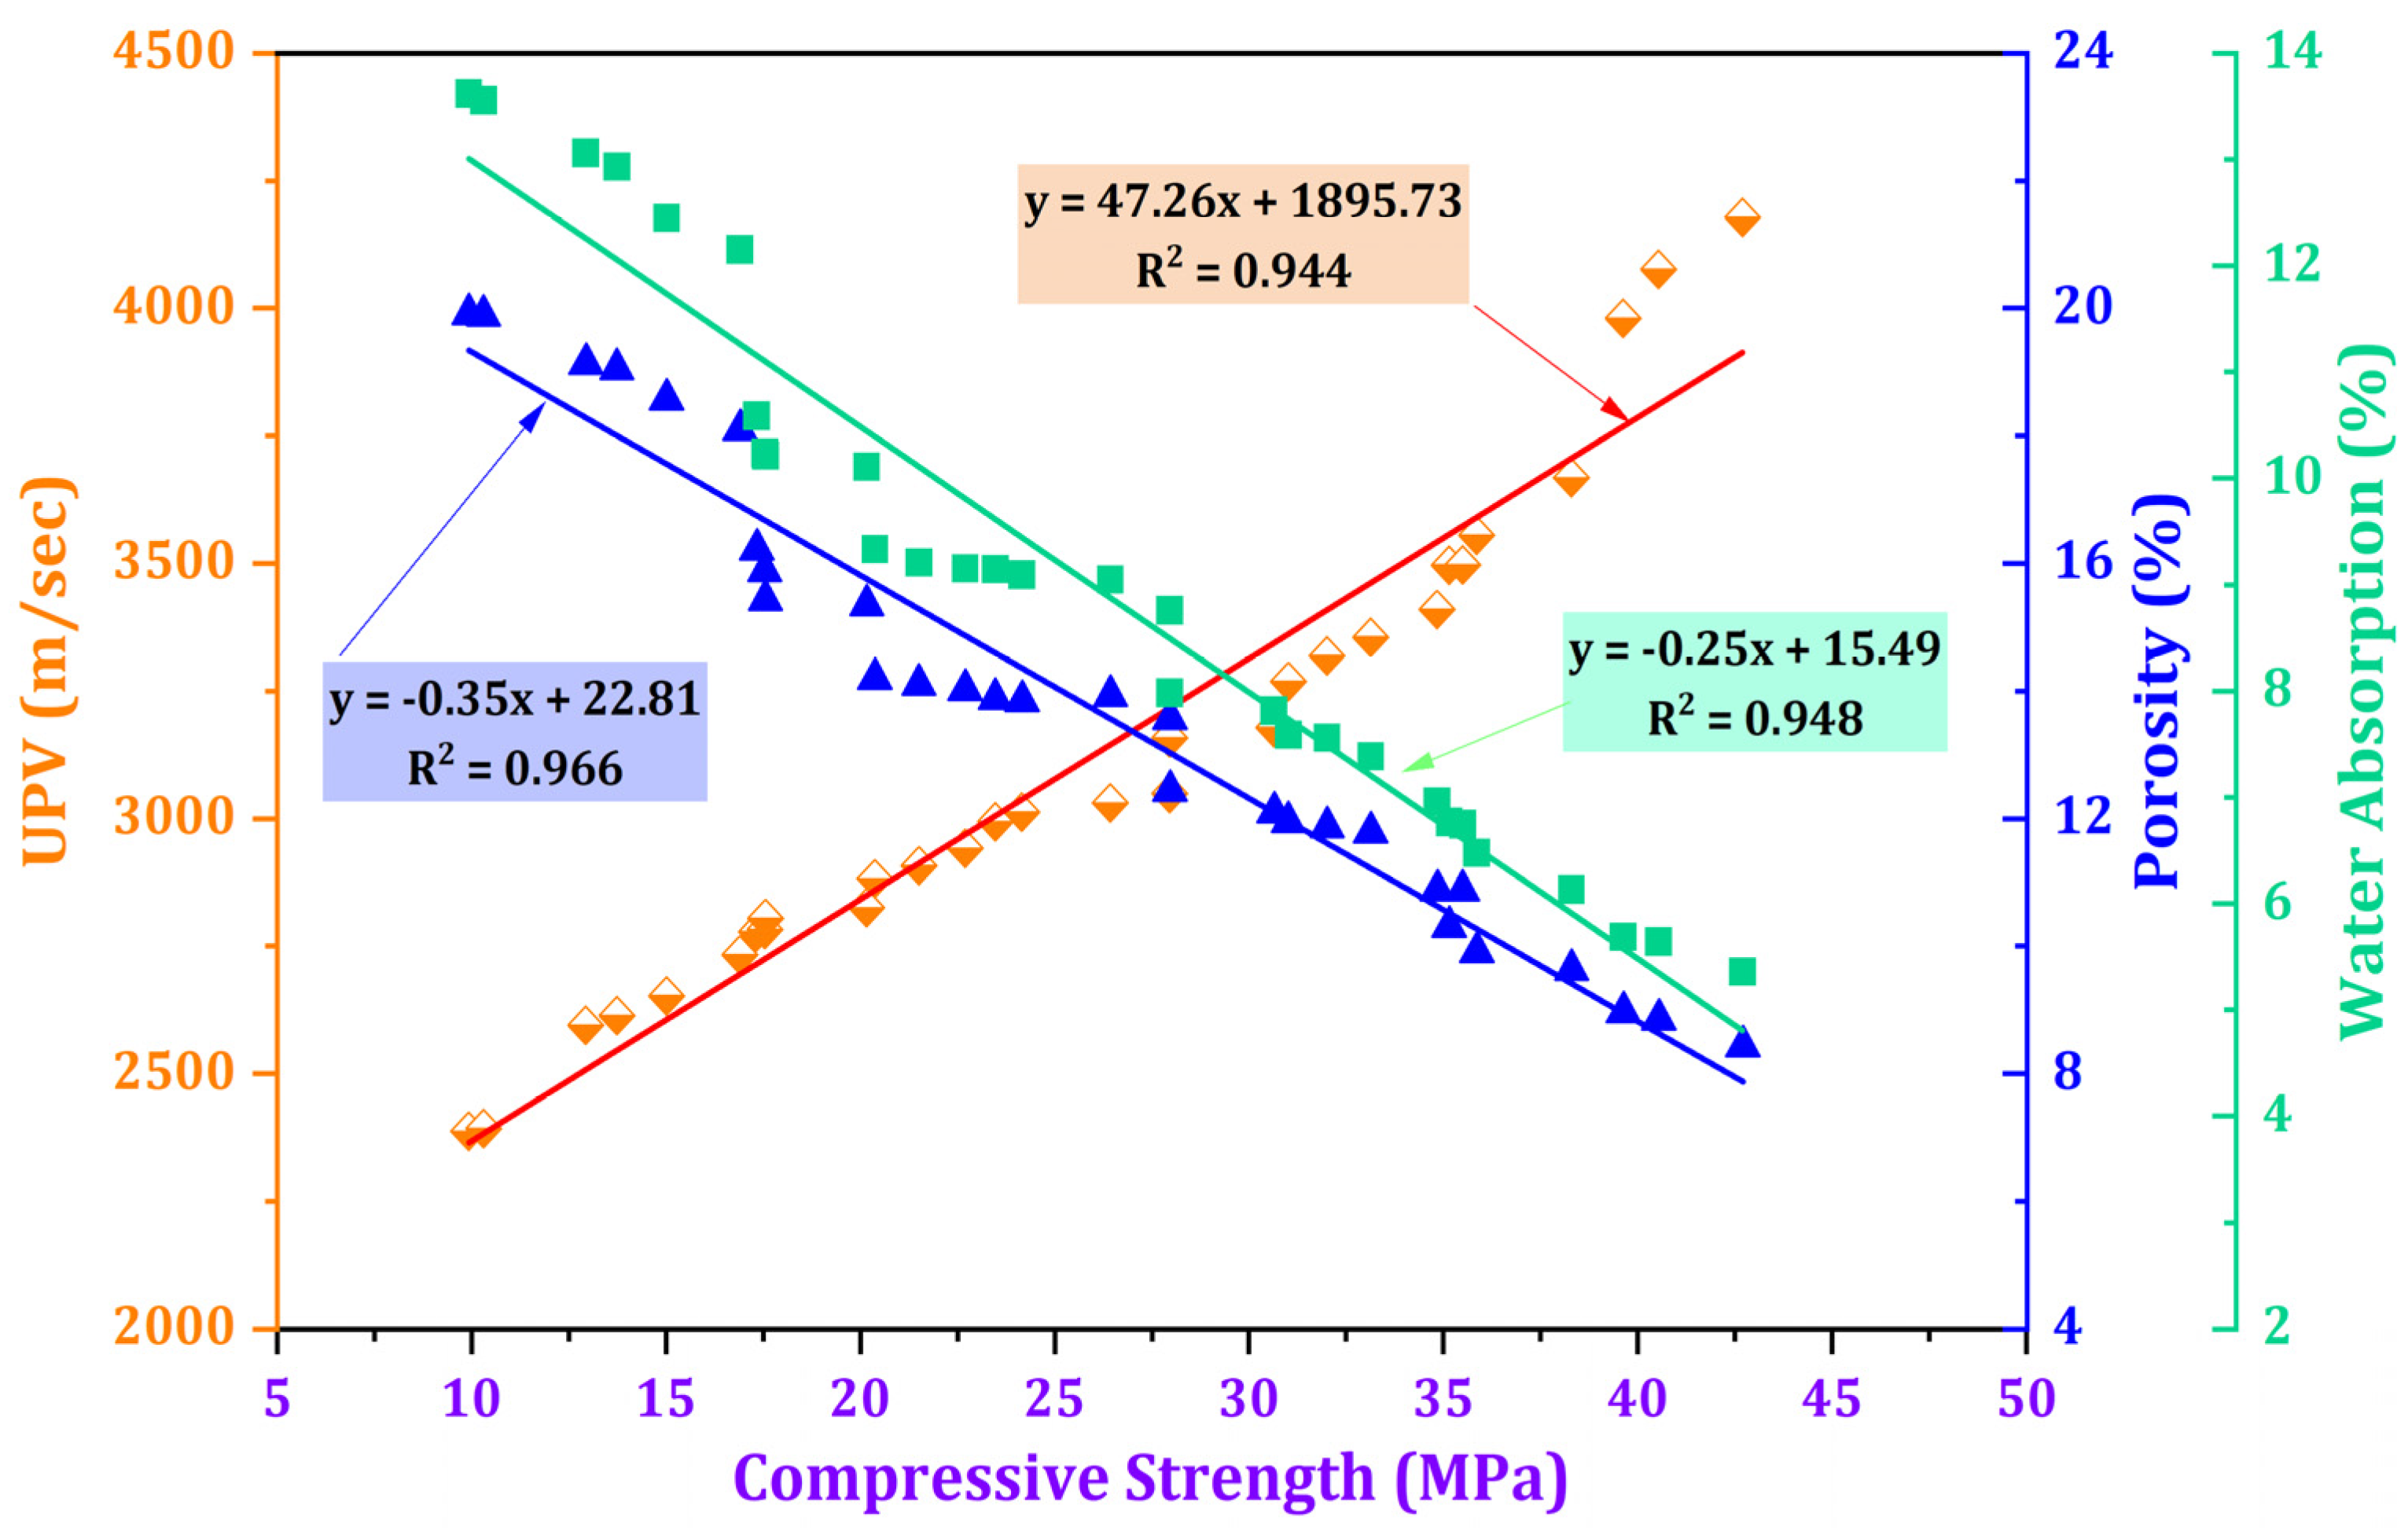
Figure 14 shows the relationship between compressive strength with water absorption, porosity, and UPV for the impact of TARC across all stages of mortar development. These interrelationships are illustrated through linear graphs boasting robust coefficients of determination (R2), each exceeding 0.9 for all properties. Notably, a direct and robust correlation emerged between compressive strength and UPV, with an R2-value of 0.944. Conversely, water absorption (R2 = 0.948) and porosity (R2 = 0.966) shared an inverse connection with compressive strength, evidenced by their negative slope values. Various studies have consistently highlighted that heightened water absorption and increased porosity correspond with decreased compressive strength [69,70,71]. This observation confirms that the denser microstructure in concrete, as indicated by UPV, directly contributes to an elevation in compressive strength while concurrently mitigating water absorption and porosity within TARC-containing mortar [72].
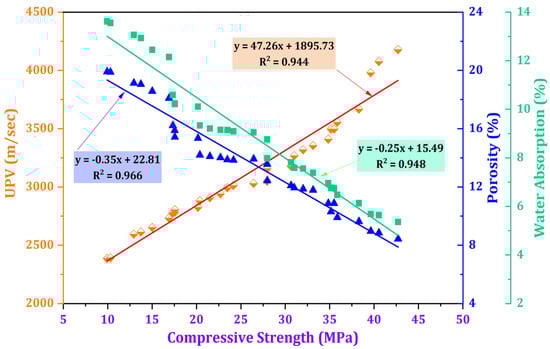
Figure 14.
Relationship between compressive strength and the variables of UPV, water absorption, and porosity.
4. Conclusions
The following conclusions were deduced from the examination of how thermoactivated recycled concrete cement influences various qualities of mortar:
- The inclusion of TARC significantly affected the flow of mortar. The workability of the TARC mix experienced a linear decline with increasing replacement percentages, in contrast to the control mix, which displayed notably superior average mortar flow.
- In terms of mechanical performance, the early-aged mortar exhibited comparable, if not better, attributes when compared to the control mix. Commencing from the 28th day of curing, T20 mixes demonstrated improved compressive strength, bulk density, and UPV. Consequently, the optimal percentage replacement for TARC was up to 20%. However, the SAI indicated that even a 40% replacement would perform well.
- Microstructural analysis revealed that the TARC mix possessed favorable thermal properties, enhanced FTIR spectra, and a structurally compact or densely packed microstructure.
- The incorporation of TARC contributed to bolstering the durability of the mortar. Although the sulphate resistance test did not initially showcase a substantial reduction in compressive strength, it became evident over an extended curing period that sulphate solutions exerted a slightly more pronounced detrimental influence.
Overall, TARC showcases promising and commendable performance, exerting a positive impact on microstructure development and thus enhancing the mechanical and durability characteristics of mortar. The utilization of TARC as a substitute for OPC not only reduces the carbon footprint associated with cement production but also promotes sustainability, contributing to the advancement of a circular economy within the construction industry.
Author Contributions
Conceptualization, E.M.G. and M.D.Y.; methodology, E.M.G. and M.D.Y.; software, E.M.G.; validation, B.W.Y., M.D.Y. and W.Z.T.; formal analysis, E.M.G.; investigation, E.M.G.; data curation, E.M.G.; writing—original draft preparation, E.M.G.; writing—review and editing, B.W.Y., M.D.Y. and W.Z.T.; visualization, E.M.G.; supervision, M.D.Y.; funding acquisition, W.Z.T. All authors have read and agreed to the published version of the manuscript.
Funding
This research received no external funding.
Data Availability Statement
The data supporting the findings of this study are available upon request.
Conflicts of Interest
The authors declare no conflict of interest.
References
- Vo, D.-H.; Yehualaw, M.D.; Hwang, C.-L.; Liao, M.-C.; Thi, K.-D.T.; Chao, Y.-F. Mechanical and durability properties of recycled aggregate concrete produced from recycled and natural aggregate blended based on the Densified Mixture Design Algorithm method. J. Build. Eng. 2021, 35, 102067. [Google Scholar] [CrossRef]
- Miller, S.A.; Horvath, A.; Monteiro, P.J.M. Impacts of booming concrete production on water resources worldwide. Nat. Sustain. 2018, 1, 69–76. [Google Scholar] [CrossRef]
- Cantero, B.; Bravo, M.; de Brito, J.; del Bosque, I.S.; Medina, C. Mechanical behaviour of structural concrete with ground recycled concrete cement and mixed recycled aggregate. J. Clean. Prod. 2020, 275, 122913. [Google Scholar] [CrossRef]
- Coffetti, D.; Crotti, E.; Gazzaniga, G.; Carrara, M.; Pastore, T.; Coppola, L. Pathways towards sustainable concrete. Cem. Concr. Res. 2022, 154, 106718. [Google Scholar] [CrossRef]
- Aboelkheir, M.G.; Pal, K.; Cardoso, V.A.; Celestino, R.; Yoshikawa, N.K.; Resende, M.M. Influence of concrete mixer washing waste water on the chemical and mechanical properties of mortars. J. Mol. Struct. 2021, 1232, 130003. [Google Scholar] [CrossRef]
- Barcelo, L.; Kline, J.; Walenta, G.; Gartner, E. Cement and carbon emissions. Mater. Struct. 2014, 47, 1055–1065. [Google Scholar] [CrossRef]
- Khalil, M.J.; Aslam, M.; Ahmad, S. Utilization of sugarcane bagasse ash as cement replacement for the production of sustainable concrete—A review. Constr. Build. Mater. 2021, 270, 121371. [Google Scholar] [CrossRef]
- Cosentino, I.; Liendo, F.; Arduino, M.; Restuccia, L.; Bensaid, S.; Deorsola, F.; Ferro, G.A. Nano CaCO3 particles in cement mortars towards developing a circular economy in the cement industry. Procedia Struct. Integr. 2020, 26, 155–165. [Google Scholar] [CrossRef]
- Chusilp, N.; Jaturapitakkul, C.; Kiattikomol, K. Effects of LOI of ground bagasse ash on the compressive strength and sulfate resistance of mortars. Constr. Build. Mater. 2009, 12, 3523–3531. [Google Scholar] [CrossRef]
- Taffese, W.Z.; Abegaz, K.A. Embodied Energy and CO2 Emissions of Widely Used Building Materials: The Ethiopian Context. Buildings 2019, 9, 136. [Google Scholar] [CrossRef]
- Lan, T.; Meng, Y.; Ju, T.; Song, M.; Chen, Z.; Shen, P.; Du, Y.; Deng, Y.; Han, S.; Jiang, J. Manufacture of alkali-activated and geopolymer hybrid binder (AGHB) by municipal waste incineration fly ash incorporating aluminosilicate supplementary cementitious materials (ASCM). Chemosphere 2022, 303, 134978. [Google Scholar] [CrossRef]
- Yehualaw, M.D.; Alemu, M.; Hailemariam, B.Z.; Vo, D.-H.; Taffese, W.Z. Aquatic Weed for Concrete Sustainability. Sustainability 2022, 14, 15501. [Google Scholar] [CrossRef]
- Li, Z.; Zhang, W.; Jin, H.; Fan, X.; Liu, J.; Xing, F.; Tang, L. Research on the durability and Sustainability of an artificial lightweight aggregate concrete made from municipal solid waste incinerator bottom ash (MSWIBA). Constr. Build. Mater. 2023, 365, 129993. [Google Scholar] [CrossRef]
- Nega, D.M.; Yifru, B.W.; Taffese, W.Z.; Ayele, Y.K.; Yehualaw, M.D. Impact of Partial Replacement of Cement with a Blend of Marble and Granite Waste Powder on Mortar. Appl. Sci. 2023, 13, 8998. [Google Scholar] [CrossRef]
- Liu, J.; Xie, G.; Wang, Z.; Zeng, C.; Fan, X.; Li, Z.; Ren, J.; Xing, F.; Zhang, W. Manufacture of alkali-activated cementitious materials using municipal solid waste incineration (MSWI) ash: Immobilization of heavy metals in MSWI fly ash by MSWI bottom ash. Constr. Build. Mater. 2023, 392, 131848. [Google Scholar] [CrossRef]
- Haiyan, Y.; Zhixiao, R.; Cuina, Q.; Lintong, H. Experimental study on recycled cement prepared from waste concrete. Ferroelectrics 2021, 570, 218–227. [Google Scholar] [CrossRef]
- Oikonomou, N. Recycled concrete aggregates. Cem. Concr. Compos. 2005, 27, 315–318. [Google Scholar] [CrossRef]
- Cantero, B.; del Bosque, I.S.; Matías, A.; de Rojas, M.S.; Medina, C. Inclusion of construction and demolition waste as a coarse aggregate and a cement addition in structural concrete design. Arch. Civ. Mech. Eng. 2019, 19, 1338–1352. [Google Scholar] [CrossRef]
- Yu, Y.; Wang, P.; Yu, Z.; Yue, G.; Wang, L.; Guo, Y.; Li, Q. Study on the Effect of Recycled Coarse Aggregate on the Shrinkage Performance of Green Recycled Concrete. Sustainability 2021, 13, 13200. [Google Scholar] [CrossRef]
- Taffese, W.Z. Suitability Investigation of Recycled Concrete Aggregates for Concrete Production: An Experimental Case Study. Adv. Civ. Eng. 2018, 2018, 8368351. [Google Scholar] [CrossRef]
- Batikha, M.; Ali, S.T.M.; Rostami, A.; Kurtayev, M. Using recycled coarse aggregate and ceramic waste to produce sustainable economic concrete. Int. J. Sustain. Eng. 2021, 14, 785–799. [Google Scholar] [CrossRef]
- Neto, R.O.; Gastineau, P.; Cazacliu, B.G.; Le Guen, L.L.; Paranhos, R.S.; Petter, C.O. An economic analysis of the processing technologies in CDW recycling platforms. Waste Manag. 2017, 60, 277–289. [Google Scholar] [CrossRef]
- Silva, R.V.; De Brito, J.; Dhir, R.K. Properties and composition of recycled aggregates from construction and demolition waste suitable for concrete production. Constr. Build. Mater. 2014, 65, 201–217. [Google Scholar] [CrossRef]
- Wang, J.; Mu, M.; Liu, Y. Recycled cement. Constr. Build. Mater. 2018, 190, 1124–1132. [Google Scholar] [CrossRef]
- Carriço, A.; Real, S.; Bogas, J.A.; Pereira, M.F.C. Mortars with thermo activated recycled cement: Fresh and mechanical characterisation. Constr. Build. Mater. 2020, 256, 119502. [Google Scholar] [CrossRef]
- He, Z.; Zhu, X.; Wang, J.; Mu, M.; Wang, Y. Comparison of CO2 emissions from OPC and recycled cement production. Constr. Build. Mater. 2019, 211, 965–973. [Google Scholar] [CrossRef]
- ASTM C150/C150M-22; Standard Specification for Portland Cement. American Society for Testing and Materials: West Conshohocken, PA, USA, 2022.
- Shui, Z.; Xuan, D.; Chen, W.; Yu, R.; Zhang, R. Cementitious characteristics of hydrated cement paste subjected to various dehydration temperatures. Constr. Build. Mater. 2009, 23, 531–537. [Google Scholar] [CrossRef]
- Endale, S.A.; Taffese, W.Z.; Vo, D.-H.; Yehualaw, M.D. Rice Husk Ash in Concrete. Sustainability 2022, 15, 137. [Google Scholar] [CrossRef]
- ASTM C618; A Standard Test Method for Coal Fly Ash and Raw Calcined Natural Pozzolan for Use in Concrete. American Society for Testing and Materials: West Conshohocken, PA, USA, 2015.
- Kalina, R.D.; Al-Shmaisani, S.; Seraj, S.; Cano, R.; Ferron, R.D.; Juenger, M.C.G. Role of Alkalis in Natural Pozzolans on Alkali-Silica Reaction. ACI Mater. J. 2021, 118, 83–89. [Google Scholar] [CrossRef]
- Li, Z.; Afshinnia, K.; Rangaraju, P.R. Effect of alkali content of cement on properties of high performance cementitious mortar. Constr. Build. Mater. 2016, 102, 631–639. [Google Scholar] [CrossRef]
- Carriço, A.; Bogas, J.A.; Guedes, M. Thermoactivated cementitious materials—A review. Constr. Build. Mater. 2020, 250, 118873. [Google Scholar] [CrossRef]
- Bogas, J.A.; Carriço, A.; Tenza-Abril, A.J. Microstructure of thermoactivated recycled cement pastes. Cem. Concr. Res. 2020, 138, 106226. [Google Scholar] [CrossRef]
- Kalinowska-Wichrowska, K.; Kosior-Kazberuk, M.; Pawluczuk, E. The Properties of Composites with Recycled Cement Mortar Used as a Supplementary Cementitious Material. Materials 2019, 13, 64. [Google Scholar] [CrossRef]
- Kim, Y.J.; Choi, Y.W. Utilization of waste concrete powder as a substitution material for cement. Constr. Build. Mater. 2012, 30, 500–504. [Google Scholar] [CrossRef]
- ASTM C29/C29M; Standard Test Method for Bulk Density (“Unit Weight”) and Voids in Aggregate. American Society for Testing and Materials: West Conshohocken, PA, USA, 2017.
- ASTM C117-17; Standard Test Method for Materials Finer than 75-μm (No. 200) Sieve in Mineral Aggregates by Washing. American Society for Testing and Materials: West Conshohocken, PA, USA, 2020.
- ASTM C136; Standard Test Method for Sieve Analysis of Fine and Coarse Aggregates. American Society for Testing and Materials: West Conshohocken, PA, USA, 2014.
- ASTM C128; Standard Test Method for Relative Density (Specific Gravity) and Absorption of Fine Aggregate. American Society for Testing and Materials: West Conshohocken, PA, USA, 2022.
- ASTM C566; Standard Test Method for Total Evaporable Moisture Content of Aggregate by Drying. American Society for Testing and Materials: West Conshohocken, PA, USA, 2019.
- Lim, S.; Mondal, P. Micro- and nano-scale characterization to study the thermal degradation of cement-based materials. Mater. Charact. 2014, 92, 15–25. [Google Scholar] [CrossRef]
- ASTM C109/C109M-20; Standard Test Method for Compressive Strength of Hydraulic Cement Mortars (Using 2-in. or [50-mm] Cube Specimens). American Society for Testing and Materials: West Conshohocken, PA, USA, 2020.
- ASTM C305; Standard Practice for Mechanical Mixing of Hydraulic Cement Pastes and Mortars of Plastic Consistency. American Society for Testing and Materials: West Conshohocken, PA, USA, 2020.
- ASTM C187; Standard Test Method for Amount of Water Required for Normal Consistency of Hydraulic Cement Paste. American Society for Testing and Materials: West Conshohocken, PA, USA, 2016.
- ASTM C191; Standard Test Methods for Time of Setting of Hydraulic Cement by Vicat Needle. American Society for Testing and Materials: West Conshohocken, PA, USA, 2021.
- ASTM C1437; Standard Test Method for Flow of Hydraulic Cement Mortar. American Society for Testing and Materials: West Conshohocken, PA, USA, 2020.
- ASTM C597; Standard Test Method for Pulse Velocity Through Concrete. American Society for Testing and Materials: West Conshohocken, PA, USA, 2016.
- ASTM E1131; Standard Test Method for Compositional Analysis by Thermogravimetry. American Society for Testing and Materials: West Conshohocken, PA, USA, 2020.
- Gedefaw, A.; Yifru, B.W.; Endale, S.A.; Habtegebreal, B.T.; Yehualaw, M.D. Experimental Investigation on the Effects of Coffee Husk Ash as Partial Replacement of Cement on Concrete Properties. Adv. Mater. Sci. Eng. 2022, 2022, 4175460. [Google Scholar] [CrossRef]
- Florea, M.; Ning, Z.; Brouwers, H. Activation of liberated concrete fines and their application in mortars. Constr. Build. Mater. 2014, 50, 1–12. [Google Scholar] [CrossRef]
- Xinwei, M.; Zhaoxiang, H.; Xueying, L. Reactivity of dehydrated cement paste from waste concrete subjected to heat treatment. In Coventry University and the University of Wisconsin Milwaukee Centre for By-Products Utilization Conference Proceeding Second International Conference on Sustainable Construction Materials and Technologies, Ancona, Italy, 28–30 June 2010; Università Politecnica delle Marche: Ancona, Italy, 2010; pp. 28–30. [Google Scholar]
- Yu, R.; Shui, Z. Influence of agglomeration of a recycled cement additive on the hydration and microstructure development of cement based materials. Constr. Build. Mater. 2013, 49, 841–851. [Google Scholar] [CrossRef]
- Ahmed, A.; Kamau, J.; Pone, J.; Hyndman, F.; Fitriani, H. Chemical Reactions in Pozzolanic Concrete. Mod. Approaches Mater. Sci. 2019, 1, 128–133. [Google Scholar] [CrossRef]
- Sargent, P. The development of alkali-activated mixtures for soil stabilisation. In Handbook of Alkali-Activated Cements, Mortars and Concretes; Pacheco-Torgal, F., Labrincha, J.A., Leonelli, C., Palomo, A., Chindaprasirt, P., Eds.; Woodhead Publishing: Oxford, UK, 2015; pp. 555–604. [Google Scholar] [CrossRef]
- BS 1881; Part 203, Testing Concrete: Part 203. Recommendations for Measurement of Velocity of Ultrasonic Pulses in Concrete. British Standards Institution: London, UK, 1986.
- Shahsavari, R.; Hwang, S.H. Morphogenesis of Cement Hydrate: From Natural C-S-H to Synthetic C-S-H. In Cement Based Materials; Saleh, H.E.-D.M., Rahman, R.O.A., Eds.; IntechOpen: Rijeka, Croatia, 2018. [Google Scholar] [CrossRef]
- Rodríguez-Camacho, R.; Uribe-Afif, R. Importance of using the natural pozzolans on concrete durability. Cem. Concr. Res. 2002, 32, 1851–1858. [Google Scholar] [CrossRef]
- Amin, M.N.; Ahmad, A.; Shahzada, K.; Khan, K.; Jalal, F.E.; Qadir, M.G. Mechanical and microstructural performance of concrete containing high-volume of bagasse ash and silica fume. Sci. Rep. 2022, 12, 5719. [Google Scholar] [CrossRef] [PubMed]
- Worku, M.A.; Taffese, W.Z.; Hailemariam, B.Z.; Yehualaw, M.D. Cow Dung Ash in Mortar: An Experimental Study. Appl. Sci. 2023, 13, 6218. [Google Scholar] [CrossRef]
- Fridrichová, M.; Dvořák, K.; Gazdič, D.; Mokrá, J.; Kulísek, K. Thermodynamic Stability of Ettringite Formed by Hydration of Ye’elimite Clinker. Adv. Mater. Sci. Eng. 2016, 2016, 9280131. [Google Scholar] [CrossRef]
- Maddalena, R.; Hall, C.; Hamilton, A. Effect of silica particle size on the formation of calcium silicate hydrate [C-S-H] using thermal analysis. Thermochim. Acta 2019, 672, 142–149. [Google Scholar] [CrossRef]
- Santos, T.A.; Silva, G.A.d.O.e.; Ribeiro, D.V. Mineralogical Analysis of Portland Cement Pastes Rehydrated. J. Solid Waste Technol. Manag. 2020, 46, 15–23. [Google Scholar] [CrossRef]
- Karunadasa, K.S.; Manoratne, C.; Pitawala, H.; Rajapakse, R. Thermal decomposition of calcium carbonate (calcite polymorph) as examined by in-situ high-temperature X-ray powder diffraction. J. Phys. Chem. Solids 2019, 134, 21–28. [Google Scholar] [CrossRef]
- Lee, S.; Moon, H. Swamy Sulfate attack and role of silica fume in resisting strength loss. Cem. Concr. Compos. 2005, 27, 65–76. [Google Scholar] [CrossRef]
- Tian, B.; Cohen, M.D. Does gypsum formation during sulfate attack on concrete lead to expansion? Cem. Concr. Res. 2000, 30, 117–123. [Google Scholar] [CrossRef]
- Tayeh, B.A.; Al Saffar, D.M.; Aadi, A.S.; Almeshal, I. Sulphate resistance of cement mortar contains glass powder. J. King Saud Univ. Eng. Sci. 2020, 32, 495–500. [Google Scholar] [CrossRef]
- Güneyisi, E.; Gesoğlu, M. A study on durability properties of high-performance concretes incorporating high replacement levels of slag. Mater. Struct. 2008, 41, 479–493. [Google Scholar] [CrossRef]
- Jiang, C.; Cai, S.; Mao, L.; Wang, Z. Effect of Porosity on Dynamic Mechanical Properties and Impact Response Characteristics of High Aluminum Content PTFE/Al Energetic Materials. Materials 2019, 13, 140. [Google Scholar] [CrossRef] [PubMed]
- Zhang, S.P.; Zong, L. Evaluation of Relationship between Water Absorption and Durability of Concrete Materials. Adv. Mater. Sci. Eng. 2014, 2014, 650373. [Google Scholar] [CrossRef]
- Alsayed, S.H.; Amjad, M.A. Strength, Water Absorption and Porosity of Concrete Incorporating Natural and Crushed Aggregate. J. King Saud Univ. Eng. Sci. 1996, 8, 109–119. [Google Scholar] [CrossRef]
- Vo, D.-H.; Hwang, C.-L.; Thi, K.-D.T.; Yehualaw, M.D.; Chen, W.-C. Effect of Fly Ash and Reactive MgO on the Engineering Properties and Durability of High-Performance Concrete Produced with Alkali-Activated Slag and Recycled Aggregate. J. Mater. Civ. Eng. 2020, 32, 04020332. [Google Scholar] [CrossRef]


Disclaimer/Publisher’s Note: The statements, opinions and data contained in all publications are solely those of the individual author(s) and contributor(s) and not of MDPI and/or the editor(s). MDPI and/or the editor(s) disclaim responsibility for any injury to people or property resulting from any ideas, methods, instructions or products referred to in the content. |
© 2023 by the authors. Licensee MDPI, Basel, Switzerland. This article is an open access article distributed under the terms and conditions of the Creative Commons Attribution (CC BY) license (https://creativecommons.org/licenses/by/4.0/).