Abstract
An online questionnaire on the subjective response to noise was created to collect national experiences from households during the first COVID-19 wave (from 14 March to 21 June). In this study, different noise sources (general noise, but also noise from neighbors, common areas, facilities, premises, and traffic) and self-declared health effects (stress, lack of concentration, sleep disturbance, anxiety, irritability, or their absence) reported from 582 participants were analyzed (before and during quarantine). A descriptive and statistical analysis between variables was established to observe relational trends for the two periods. The results associated stress and sleep disturbance with most of the noise sources before the pandemic. Sleep disturbance was not significant in confinement, maybe due to habit changes and staying home. Uncertainty linked to the pandemic could explain why stress showed significance during quarantine. Irritability showed an inverse relation with noise sources since their values were greater for declared noise sources and more annoying before the pandemic in all cases. Finally, anxiety showed an association with fewer noise sources, maybe also conditioned by other factors. However, the extreme situation and the uncertainty generated, the presence of cohabitants at home, and building factors (such as acoustic insulation) conditioned the households’ experience.
1. Introduction
1.1. Effects of Noise on Health
Environmental noise is defined in the Environmental Noise Directive (END) [1] as unwanted or harmful outdoor sound due to human activities, such as means of transport (road, rail, and air traffic) and industrial activity, and it is considered one of the main environmental problems affecting the health and well-being of people, with an estimated 1 million healthy years of life lost every year from health effects [2,3,4]. In particular, road traffic noise ranks second among the nine environmental risk factors, with the highest health impact in European countries [5].
In Europe, noise is among the most frequent reasons for complaints regarding environmental issues. People, increasingly concerned about noise, perceive it as an important issue affecting their health. This has been studied in recent years through several Europe-wide surveys. The results of the 2010 survey, requested by the EC, showed that 80% of respondents (n = 26,602) believed that noise affected their health, either to some or a great extent [6].
Data on the perception of specific sources of environmental noise as a problem are not available for the entire WHO European Region; however, at the national level, some countries (i.e., France, Germany, The Netherlands, Slovakia, and the United Kingdom) conducted national surveys on annoyance from specific noise sources [3]. According to these surveys, noise from road traffic is the most important source of annoyance, followed closely by neighbor noise. Aircraft noise can also be a significant source of annoyance and, to a lesser extent, railway noise and industrial noise.
Noise exposure modifies the function of multiple organs and systems and has multiple adverse health effects, causing both auditory and non-auditory ones [7]. These effects range from disturbing and interfering with individual activities, including concentration, communication, relaxation, and sleep, to neuro-vegetative, cardiovascular, and endocrine system effects.
Nowadays, there is evidence of the following health outcomes related to environmental noise: sleep disturbance, annoyance, cardiovascular and metabolic disease, adverse birth outcomes, cognitive impairment (mainly in children), and poor quality of life, mental health, and well-being [4,8,9,10,11,12,13,14]. The strongest evidence found so far relates exposure to environmental noise (particularly road traffic noise) to the development of cardiovascular diseases [14].
Annoyance is one of the most prevalent responses to noise-related stress reactions, which includes negative feelings (disturbance, dissatisfaction, distress, displeasure, irritation, and nuisance) [13]. If exposure is long-term, it can lead to the development of cardiovascular disease [11,12].
Finally, sleep disturbance [7,15,16] is assumed to be the most harmful non-auditory effect of environmental noise exposure, as proper sleep restoration is essential to avoid tiredness, daytime sleepiness, and the need for compensatory resting periods. In addition, sleep restriction causes, for instance, changes in glucose metabolism and appetite regulation, impaired memory consolidation, and a dysfunction in blood vessels. Long-term sleep disturbance can also lead to cardiovascular health issues.
The WHO estimated that nearly one million years of life are lost annually because of environmental noise in high-income Western Europe countries. Sleep disturbance and annoyance, mainly related to road traffic noise, constitute the bulk of this burden. This burden of disease from environmental noise is the second highest after air pollution [2,5]. However, these health impacts are likely to be underestimated since the WHO has updated to lower values the thresholds above which health effects start to occur (levels below 55 dB Lden and 50 dB Lnight are now considered) [4]. The latest noise reports followed the END [1] thresholds, as updating to these new values is still voluntary for countries until at least 2018.
1.2. Social Noise Perception and Annoyance during COVID-19 Lockdown
The large number of cases and deaths caused by SARS-CoV-2, as well as the lack of knowledge on the transmission and symptoms of the subsequent infectious disease, COVID-19, entailed great difficulty in controlling the disease and led to a change in lifestyles and habits worldwide, both at health and social levels.
The first case of COVID-19 appeared in Wuhan, China, in December 2019. In Spain, the first case was recorded on 31 January 2020 in the Canary Islands, reaching mainland Spain on 24 February, after which the number of cases began to increase exponentially. This increase in cases also occurred globally, leading the World Health Organisation (WHO) to declare COVID-19 a pandemic on 11 March 2020 [2].
Faced with this global situation, on 14 March 2020, in order to prevent the transmission of COVID-19, the Spanish government declared a state of alarm [17]. During this state of alarm, the free movement of people was prohibited, limiting it to essential activities. All entertainment places were closed, as well as shops, with the exception of supermarkets and pharmacies selling basic goods and health care products. Passenger transport and face-to-face school activities at all levels of education were also restricted in favor of telematics educational activities during this period.
Time spent at home resulted in reduced mobility. In the same way, one of the main tools in the fight against COVID-19’s spread was the limited displacement of the Spanish population. Both reasons led to a significant decrease in mobility and transport, with the passenger segment being the most affected and the freight segment maintaining its normal activity due to the need to ensure and facilitate the distribution of goods [18].
COVID-19 limitations and restrictions on mobility and activities led to empty streets and, consequently, to a reduction in noise pollution. Several studies quantified the variations in outdoor sound pressure levels before and during the COVID-19 lockdown in urban areas based on measurements. A study in Madrid [19] analyzed the information from the noise monitoring network. It revealed that the average reduction for descriptors Lday, Levening, and Lnight due to the reduction in road traffic, was between 4 and 5 dB on working days but reached 6 dB during the weekends. This study also showed a change in daily noise patterns. Similar research was conducted in Barcelona [20] and Girona [21], which showed that all areas did not experience the same reductions in noise levels. In Barcelona, a significant decrease of 9 dB in A-weighted equivalent sound pressure level (LAeq) was measured in nightlife areas, a moderate to high decline of 7 dB in commercial and restaurant zones, and a smaller reduction of 5 dB in densely trafficked areas. In Girona, in a nocturnal activities area, discernible noise reduction disparities ranging from 5 dB (Lday on weekdays) to 11 dB (Lnight on weekends) were recorded, comparing pre-lockdown noise levels with those during the lockdown period.
The urban areas that experienced the biggest drop in sound pressure levels were leisure and nightlife areas. Consistent results were also found in other studies in several cities in Spain, such as Córdoba [22] and Granada [23]. Similar research was also conducted in France [24], Italy [25], and England [26].
However, mobility reduction during COVID-19 lockdowns did not only alter the sound levels, the composition of the soundscapes was also changed. Several studies based on questionnaires compared the perceived sound environment before and after the COVID-19 lockdown. They evidenced the positive perception of outdoor soundscapes during the lockdowns, compared to the pre-existing soundscapes [22,24]. There was an increase in the perception of biophonic sounds like birds [27] and geophonic sounds [28]. Some studies even detected an increased presence of human sounds of voices and walking [29,30].
The exceptional situation of COVID-19 confinement produced a change in the habits of the population at all levels: work, personal, work–life balance, etc. [31]. The home became the central axis of society [32], and occupants had to adapt themselves to this new situation, experiencing changes in habits that directly affected their health, such as a decrease in physical activity [33], which were sometimes solved by practicing sport at home or changes in diet [34]. These negative lifestyle changes, together with the stress caused by the pandemic, for example, having a vulnerable person in the family [35], risk of illness, and constant news about COVID-19, etc. were associated with poor mental health and other symptoms such as depression, anxiety, or stress [36].
Additionally, telework and online classes were introduced in most Spanish households, meaning that homes had to combine work, leisure, and family activities. Individuals’ satisfaction with and adaptation to this new situation was conditioned by the characteristics of the work area and the home itself, as well as by the composition of the household, number of individuals, and household income [37]. Telework in Spain was mostly maintained both during the period of confinement and under the new normality, being retained in 43.4% of establishments (8 points less than during confinement) [38]. Also, the closure of educational buildings led to virtual lessons, so students had to use a domestic space to follow their courses and do their homework [39].
For all these reasons, housing habitability in general [40,41,42] and indoor environmental quality [43,44,45,46] in particular were issues of research interest during the lockdown.
Regarding acoustics in dwellings, various activities that demanded different acoustic requirements, such as telework, exercise, relaxation, virtual interaction with friends, etc., had to be performed in shared spaces. In addition, indoor sounds were more noticeable as occupants spent more time at home. Although the positive assessment of outdoor soundscapes was corroborated by a general reduction in outdoor noise, some questionnaires also revealed an increase in indoor sounds from neighbors and sounds from occupants in the same dwelling [22,30,47]. A study in London [48] revealed that airborne and structurally borne noise from neighbors was more annoying than outdoor sounds; in particular, talking and shouting were the most heard and disturbing noises. However, other studies in Canada [47] and Turkey [49] found that noise from one’s own dwelling was more problematic and annoying than noise from neighbors.
It is evidenced in [50] that the indoor soundscape evaluation depends on the activities performed at home, at least for working from home and for relaxation. Psychological well-being and comfort while teleworking and relaxation was correlated with comfortable soundscapes, that is to say, soundscapes with dominant natural sounds and soundscapes shaped by music and TV played by occupants, in contrast to negative soundscapes with noticeable noise from neighbors [51]. Regarding noise from building services, the results of Torresin et al. [52] proved that it was not dominant in most of the buildings in Italy and London, but soundscapes with less noise from building services were rated as better for relaxation.
Finally, research on the effects of indoor soundscapes on the self-rated health of Bulgarian university students [53] showed that exposure to mechanical sounds was related to worse self-rated health; moreover, the exposure to mechanical sounds resulted in a lower restorative quality of the home, whereas natural sounds were correlated with higher restorative quality.
Bearing in mind all the studies referred to noise, social behavior, and health, a lack of a comprehensive analysis is detected. A contribution covering the main noise sources and annoyances, together with self-perceived effects on health and well-being, is relevant to delve into symptoms related to mental health and well-being generated by noise annoyance. This study tries to unveil possible causes of why people perceived certain health effects according to the noise sources and the evolution of those, comparing “before pandemic” and “in confinement” scenarios. Also, this study is the only one that has nationwide responses.
2. Materials and Methods
The research design was developed following the steps described in Figure 1. In this figure, the main stages of the study are (1) Questionnaire design, according to the different aspects to be covered (socio-demographic, housing, noise sources, health effects, etc.); (2) Validation of this questionnaire, based on reliability and validity tests (Cronbach’s alpha, Kaiser–Meyer–Olkin (KMO) and Bartlett tests); (3) Questionnaire dissemination, for participant recruitment, using webpages and the snowball technique; (4) Data collection and processing, using different web platforms, databases, and statistical programs; (5) Data analysis, including bivariate analysis using chi-Square tests, the Bonferroni correction, and Wilcoxon test. Details about these steps are given below.
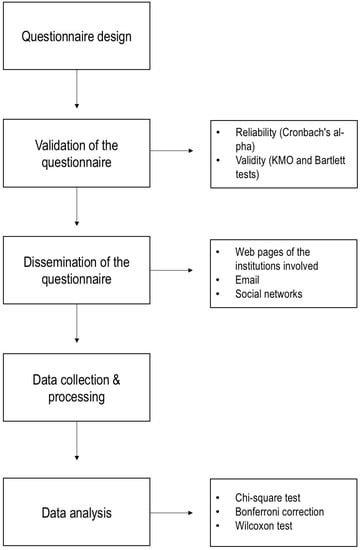
Figure 1.
Research design: description of the main followed steps and tools/techniques applied.
2.1. Data Collection for the Study
The survey questionnaire was originally designed by the Acoustics Group in the Building Quality Unit in Eduardo Torroja Institute for Construction Science (IETcc), which belongs to the Spanish National Research Council (CSIC), in collaboration with the Spanish Acoustical Society (SEA) and together with Spanish representatives of the Young Acousticians Network (YAN). This study belongs to the International Year Sound 2020 (IYS2020) activities [54].
The survey was conducted to discover the Spanish population’s perception of noise-related annoyance in their homes during confinement in comparison to the previous situation. The survey was available in the online Google Forms survey management software [55]. It allowed the data collection for this study, while the population was still under certain restrictions, through a simple and easily distributable interface. The link to participate in the online questionnaire was distributed through web pages of the institutions involved, email distribution lists, and social networks. The survey link was accompanied by participant information and an informed consent letter. It included a brief explanation informing people about the aim of the study, the confidential treatment of their personal data, and the anonymity of the answers. No IP addresses were saved.
The research activity was approved by the CSIC Ethics Committee (Approved Report ref. 112/2020).
2.2. Questionnaire Design
The questionnaire was based on a previous survey designed in the Action COST TU0901 [56] in which the Acoustics Group of the Construction Quality Unit of the IETcc participated. The object of this action was to create a proposal for the convergence in Europe of different sound insulation aspects and to review criteria for the study of perceived satisfaction or annoyance related to neighbor noise; as a result, a harmonized questionnaire was proposed. This questionnaire, in turn, was based on different types of surveys [57,58,59,60,61,62] in the study of the subjective response to noise exposures in dwellings and on the standard ISO/TS 15666 [63]. This standard develops criteria and recommendations for the surveys conducted to obtain information about noise annoyance “at home”. The translation and the wording of the survey into Spanish were also performed in accordance with this standard and important previous research [64] in order to determine the meaning.
The internal reliability of the entire questionnaire (n = 64) was assessed using Cronbach’s alpha. The Cronbach’s alpha coefficient ranges from 0 to 1, and these thresholds are used to determine the quality of internal consistency of the questionnaire [65].
- α = 0.9: Excellent
- α = 0.8: Good
- α = 0.7: Acceptable
- α = 0.5: Poor
- α < 0.5: Unacceptable [65].
The construct validity was assessed using the KMO and Bartlett’s tests. The KMO and Bartlett’s Test of Sphericity are two tests used to assess the suitability of the data for conducting factor analysis or a similar data reduction technique. Factor analysis is a technique used to identify underlying patterns or latent dimensions in the data, especially when working with questionnaires or scales containing multiple items [65].
KMO: The value of KMO ranges from 0 to 1. A value closer to 1 indicates a higher suitability of the data for factor analysis. As a general guideline, the following ranges are considered for interpreting KMO:
- KMO > 0.9: Marvelous
- KMO > 0.8: Meritorious
- KMO > 0.7: Middling
- KMO > 0.6: Mediocre
- KMO > 0.5: Miserable
- KMO < 0.5: Unacceptable
Bartlett’s Test of Sphericity: This test evaluates the null hypothesis that the variables in the dataset are uncorrelated, indicating they are not suitable for factor analysis. A significant result (p-value < 0.05) in Bartlett’s Test indicates that the variables are sufficiently correlated to conduct a factor analysis. If the test result is significant, it is appropriate to proceed with the factor analysis [65].
The results indicated satisfactory validity and strong internal consistency, as evidenced by a Cronbach’s alpha value of 0.821. Furthermore, the KMO value was 0.839, and Bartlett’s test was significant (p-value < 0.05), confirming the validity of the questionnaire.
The questionnaire used in this work was entitled “Questionnaire on the perception of noise in homes during the COVID-19 confinement”. It was designed so that it might be completed in about 10 min. It was composed of 52 questions grouped into five topics.
- Personal variables and social-demographic data (age, gender, education, occupation, and working from home (WFH) activity) (Q1–Q6).
- Dwelling data and characterization of the sound environment (Q7–Q17), including dwelling features and information about the living or working environment.
- Comparison of noise annoyance perceived from different noise sources before and during the confinement period (Q18–Q31). Participants were asked to give scaled answers regarding the annoyance due to different noise sources by comparing the situations before and during the lockdown. First of all, a general question (Q18) about general noise annoyance was asked; the following questions attempted to obtain related information in more detail. Noise sources were evaluated as the most important inside dwellings, for example, neighbors (Q19–Q23) (people talking/shouting, TV/music, footsteps, movements of furniture, doors closing), noise generated in common areas (Q24 and Q25) (people walking or talking in hallways and staircases), service equipment (Q26–Q28) (water installation, ventilation and climate installations, lifts, etc.), environmental activities (Q29 and Q30) (road, rail, and aircraft traffic, premises such as garages, shops, offices, pubs, restaurants, laundry rooms, or other), and own family present at home. Different paths of sound transmission were also considered in the questionnaire, such as coming through walls or floors/ceilings.
- Self-reporting on the perception of the new sound environment and occupants’ behavior (Q32–Q44). Occupants were asked to assess the new acoustic environment and new sound conditions in their dwellings and to answer how their behavior adapted to cope with their own noise generated.
- Emotional and health response to the sound environment and satisfaction with the acoustic climate at home (before and during the confinement period) (Q45–Q52). Respondents were specifically asked about their emotions and symptoms related to mental health and well-being generated by noise annoyances. The emotions and symptoms participants were asked to report, based on their experience before and during the confinement, were sleep disturbance, anxiety, stress, lack of concentration, irritability, or none of the above.
Objective and subjective questions were included, using a single-choice, closed-response options question matrix, either with yes/no questions or using the Likert scale, to determine the intensity of the user’s perceptions related to the inconvenience caused by noise. The Likert ranking was based on unipolar and bipolar 5-point verbal scales [63,64,65,66], ranging from “not at all” to “extremely”, and from “much less than before” to “much more than before”, respectively (comparison made of the sound environment before and during the confinement period).
For this study, topics three and five were analyzed in order to find relationships among their respective variables.
2.3. Variable Selection and Treatment
For this study, the dependent variables related to the most common self-perceived health effects and discomfort linked to noise were selected. These were anxiety, stress, lack of concentration, sleep disturbance, and irritability, as well as the absence of all of them. These self-perceived health effects were declared by the participants in the same questionnaire for two different scenarios: the usual one (pre-pandemic) and the second, during the COVID-19 confinement (also expressed as “lockdown”, with analogous meaning).
These dependent variables were, in turn, compared with the most common noise sources. These were grouped, according to their origin, into general noise, noise from neighbors, noise in common areas, building services noise, cohabitants’ noise (from the home itself), noise from nearby commercial spaces, and traffic noise. In turn, these sources could be perceived more sharply, the same, or less before than during confinement.
Therefore, to start the bivariate analysis, the categories were recorded as follows.
- For the dependent variables (self-perceived health effects and discomfort), the multiple responses were selected in isolation, converting each health effect into a dummy variable, with “1” being the perception of each effect and “0” its absence. This conversion was carried out for the two periods compared (before and during confinement).
- For the independent variables corresponding to the noise sources, the questions related to each of them were originally grouped by nature. In turn, the original answers on the perception of noise by type of source were distributed on a Likert scale of five categories. These were “much less than before lockdown”, “somewhat less than before lockdown”, “same as before lockdown”, “somewhat more than before lockdown”, and “much more than before lockdown”. These five categories were regrouped into two new answers, “less than or the same as before the lockdown”, also referred to as “≤in confinement” in Table 1 (grouping the first three), and “more than before the lockdown” (including the last two), expressed as “>in confinement”, in the cited table. Thus, the crosses of Table 1 were constructed, where only the relative distributions (row percentages) of those who declared each of the health conditions (or the absence of all of them) were reflected before and during the confinement. These were distributed for each noise source, distinguishing whether it was perceived more, the same, or less than before confinement.
 Table 1. Compared health impacts pursuant to noise sources.
2.4. Statistical Analysis
Due to the exploratory nature of the study, a descriptive statistical analysis was conducted, followed by a bivariate analysis utilizing the chi-square test. Bonferroni correction was used to account for multiple comparisons. To assess the differences in responses before and during the COVID-19 lockdown period, the non-parametric Wilcoxon test was used for analysis.
SPSS software, version 29, was utilized for conducting the analysis.
3. Results
3.1. Overall Representation and Result Distribution
A total of 582 responses to the questionnaire were collected between 26 June and 24 July 2020. During this period, Spain was in phases II and III of de-escalation or in a new-normal situation. However, this period was close enough to the start of the lockdown period for participants to easily remember how they perceived the soundscape before the confinement period.
The response rate was 97%, as only 565 questionnaires were statistically analyzed. The remaining responses were rejected because they were received from places other than Spain or had inconsistencies (e.g., all answers were null or duplicated). Other inclusion criteria were being over the age of 18 years, expressing agreement to voluntarily participate in the study, and having read the information sheet. No incomplete answers were received.
The participation distribution nationwide is shown in Figure 2.
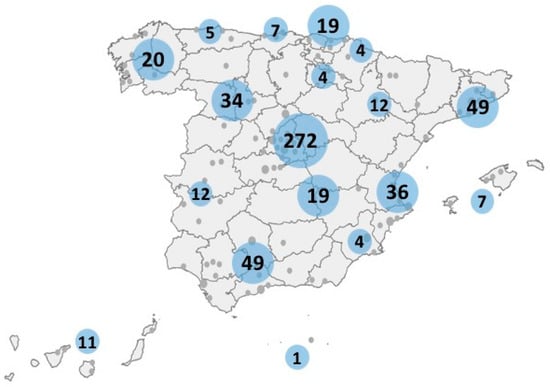
Figure 2.
Distribution of Spanish homes’ participation. Blue circles show participation clustered for each of the Autonomous Communities (regions) within the whole national territory.
As Figure 2 shows, the distribution of the online questionnaire was quite balanced throughout the national territory. Despite the limitation of this route, being an exploratory study distributed for convenience, responses from all the autonomous communities and from almost all the Spanish provinces were obtained.
Figure 3 below shows the main socio-demographic characteristics of the sample, including the variables gender, age, educational level, and current employment status.
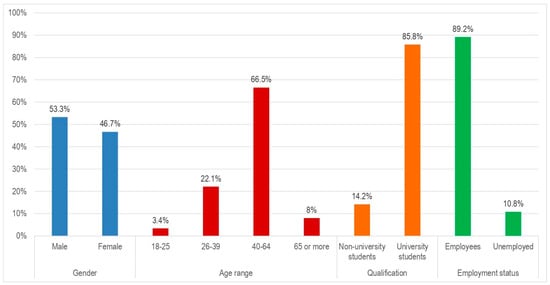
Figure 3.
Distribution of the sample according to socio-demographic variables (gender, age, level of studies, and current employment).
Regarding gender, the distribution was fairly even between males and females, obtaining more responses from the first. The majority age group corresponded to the middle-aged active population (two-thirds), while more than a fifth of the sample were young people between 26 and 39 years old. The youngest and the oldest participants were in the minority. Regarding the level of studies, a large majority had university studies, and something else, even, in the sample itself, they were full-time employees, compared to other very minority groups (students, retirees, unemployed, etc.).
Below, Figure 4 shows the comparative distribution in percentages of the perception differentiated by noise sources before and during the pandemic.
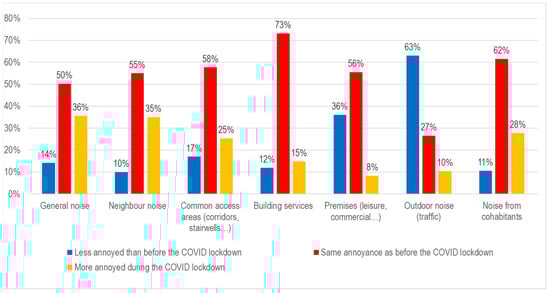
Figure 4.
Compared distribution of noise sources and annoyance before the pandemic and during lockdown for the Spanish home sampling.
According to Figure 4, on the comparative perception of the different sources of noise by participants, three of them could be highlighted: exterior noise (the only one of all the sources with the majority of perception before confinement), noise from building facilities (source with the highest percentage of stability between the pre-pandemic period and confinement), and noise in general and from neighbors, which comparatively obtained more than a third of the total higher perceptions during lockdown than before. These were followed by noise from common areas, also more perceived during this period for a quarter of the sample. However, among the indoor sources, the most perceived was the noise from neighbors during confinement. Annoyance due to noise produced by the users themselves also increased during the confinement period. A comparison of perceived health effects in the two periods is shown in Figure 5.
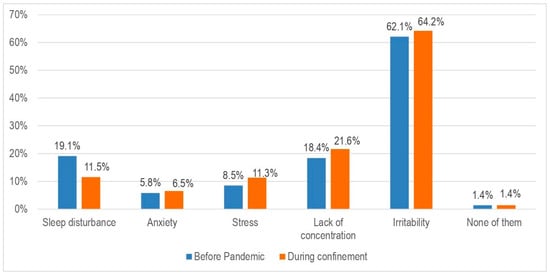
Figure 5.
Distribution of perceived health impacts before and in lockdown.
Figure 5 describes the main health effects self-perceived by the participants in the sample, both before the pandemic and during confinement.
Two-thirds of the sample that declared feeling irascible, both before the pandemic and during confinement (this value being somewhat higher), stood out considerably compared to a minority that, in general, claimed to suffer the rest of the health effects due to noise. Thus, for example, sleep disturbance and lack of concentration before the pandemic had similar values, close to a fifth of the sample. However, its evolution during confinement was not the same. However, sleep disturbance decreased by 7.6 percentage points, and lack of concentration increased by just over 3, similar to the increase experienced by those who perceived stress, which increased from 8.5% to 11.3%. For their part, the minorities who experienced anxiety before the pandemic (5.8%) did not change much, as they rose by a little more than half a percentage point. Finally, those who did not perceive any effect on health effects remained at 1.4% before and during confinement.
3.2. Bivariate Analysis According to Noise Source and Health Impacts for the Two Scenarios Described
Table 1 includes all the relationships between the different kinds of noise sources, perceived with more intensity before or during confinement, and the self-perceived statement of effects on health and well-being associated with noise for both scenarios. The results are presented in Table 1.
3.2.1. Relations between Variables before COVID-19 Pandemic
With regard to suffering from some type of health condition before the pandemic, several respondents showed a significant relationship with the noise source. Only those who stated “not suffering from any condition” showed a significant relationship with the type of source “traffic”, although this absence of discomfort was greater during confinement. The remaining sources did not show significance with not suffering any health condition.
The effects that showed a statistically significant relationship with more noise sources before the pandemic were lack of concentration and stress. Only lack of concentration manifested to be more pronounced during confinement. As a difference to highlight between both conditions, the lack of concentration accounted for between 40% and 70% fewer reported cases than stress (obtained by calculating the ratio between percentages for both health effects for the same period and noise source, according to results shown in Table 1), with the differences being greater for those who reported a greater impact in the pre-pandemic period. The differences were somewhat smoother for those who suffered from both effects and also perceived more noise from sources during confinement.
Sleep disturbance showed a significant relationship with all noise sources except traffic and cohabitants. Instead, anxiety showed a significant relationship with all except premises, traffic, and cohabitants. Likewise, all these noise sources were perceived by those who declared suffering from any of these effects, more markedly, during confinement.
Finally, before the pandemic, irritability showed a statistically significant relationship with five different noise sources (general noise and all indoor noise), while it did not with noise from premises and traffic. It is also noteworthy that the declared irritability, in all cases of statistical significance, was comparatively higher when the sources were more perceived before the pandemic.
3.2.2. Variable Relationships during Lockdown
During confinement, the declared situation of “not suffering from any condition” attributable to noise was not significantly related to any source of noise, always having less than 4% of the sample by category and variable.
As for those who did declare having some condition, lack of concentration was the only one that showed a significant relationship with all sources of noise, highlighting this relationship with a greater incidence of all these sources during confinement. Irritability followed, statistically associated with all noise sources except for room noise. This variable continued to show in this period an inverse relationship with noise sources, compared to the rest of the health effects.
For the rest of the effects, such as sleep disturbance, anxiety, and stress, noise sources significantly associated were general noise and all indoor noise, except premises and traffic. The relationship between these three effects was significant when these noises were louder in confinement.
3.2.3. Comparison before/during Lockdown
Regarding the comparison between the perception of noise and its effects before the pandemic and during confinement, some percentages stood out.
Comparing the general distributions by health condition before and during the pandemic, these could be grouped by frequencies obtained. First of all, irritability was the most declared condition, varying between 40% and 80% of the sample, depending on the category of period where each noise source was perceived more. This variable showed a more pronounced behavior for those whose noise sources were more annoying before the pandemic. Additionally, it showed its maximum values for noise from neighbors (71.5%), while the lowest value was for traffic noise (50.8%). During the State of Alarm, irritability expressed its maximum for the “neighbors” noise source (80.6%), while its minimum was related to the noise from home cohabitants (43.9%).
The following most declared conditions were sleep disturbance and stress for the pre-pandemic period. While, for the confinement period, sleep disturbance (which varied between 4.2% and 21.4%) was reached, with a margin of between 1 and 10 percentage points, due to the lack of concentration (with a 20.3% maximum pre-pandemic frequency and 27.7% in confinement, for the most voted category). Perceived stress presented its highest value before the pandemic for traffic noise, more pronounced during confinement (30.5%), while the least valued category was noise caused by neighbors, more pronounced before confinement (11.4%). During confinement, stress fluctuated between 10.3% from noise by neighbors (for those who perceived it more strongly before confinement) and 38.3% from general noise, which was perceived by the sample (more strongly in confinement).
For its part, sleep disturbance varied in the pre-pandemic period, between 12.5% (coming from more pronounced noise by neighbors more perceived before the pandemic) and 36.2% relative to noise by premises (source more accentuated during confinement). During the quarantine, these distributions fluctuated between 4.2%, coming from noise by neighbors again, also notable before the pandemic, and 21.4% from general noise, mostly perceived in the period of the State of Alarm.
The lack of concentration ranged, before the pandemic, between 3.8% of general noise and neighbor sources (declared as more perceived before the pandemic) and 20.3 percentage points from traffic (for participants declaring more outstanding after the declaration of the State of Alarm). During this quarantine period, this condition varied between 4.2%, also caused by neighbors, more pronounced before the pandemic, and 27.7% caused by locals, more accentuated during the confinement.
Furthermore, anxiety varied between 2.7% due to neighbors (more highlighted before the pandemic) and 12.8% due to premises, suffered more during the quarantine. Meanwhile, during the lockdown, it was declared by between 3.4% and 12.8%, respectively, for the same reasons. In the declared case of not perceiving a condition attributable to noise, the percentages varied between 0.5% due to noise from common areas, more perceived during confinement, and 5.1% due to traffic for people during the pandemic, for the period before the quarantine. For the situation of confinement, the absence of effects on health varied between 0.0% for premises (according to people voting more annoying in quarantine) and 3.4% for traffic (also perceived as more remarkable in confinement), thus decreasing during the pandemic.
Finally, the Wilcoxon signed-rank test revealed a significant difference (Z = −3.867, p < 0.001) in participants’ satisfaction with the acoustic environment before and during confinement. Additionally, considering each health effect (categories), a significant difference was observed for “sleep disturbance” and “stress” (Table 2).
Table 2.
Results for the Wilcoxon signed-rank test for the acoustic environment by noise source, comparing “before” and “during” confinement.
4. Discussion
According to the results, stress and sleep disturbance were the effects subjectively related to a greater number of noise sources. This marked behavior in totality could be explained by a general lack of sound insulation in the residential building stock towards the outside of the unit-dwelling for the fourth or third part of the sample, depending on the noise source. This is consistent with empirical studies on Spanish housing [67,68,69] and is justified according to the year of construction of the residential stock, as indicated by the Long-Term Strategy for Energy Rehabilitation in the Building Sector in Spain [70], as well as with the changes in habits carried out during the quarantine [31,48]. Likewise, it can be compared with the study of habitability in Spanish homes during the pandemic, which established acoustic discomfort for 40% of the homes surveyed [42], as well as with another study that established an average sound insulation of 40 dB for Spanish homes [67]. These health effects from multiple sources were mostly perceived by staying longer at home while the population was confined [47,49]. For its part, the percentages of stress increased for those affected during confinement. It was mainly due to the sources of general noise and internal noise (aligned with studies on neighbor noise and home noise) [22,47,48], while it remained constant for local and traffic sources [49]. One possible explanation, given that the activity of the latter two sources decreased in confinement [18,19,20,21,22,23], would be that stress was due (at least partially) to issues other than noise. In fact, uncertainty, concern, or instability provoked by the pandemic or, more specifically, by the lockdown itself would boost noise as a stressor [49,71,72]. Also, other likely situations, such as being close to nuisance sources (whose emissions had remained stable in both periods) or even worrying about being an annoying noise source for others [49], could be affected.
This was not the case for sleep disturbance. Although it showed significant relationships with external sources on a regular basis during the pandemic, it was not statistically related. The non-statistical significance could once again be due to sleep disturbance attributable to other causes, such as habit changes, the uncertainty of the pandemic itself, or other related socioeconomic conditions, such as concerns about job stability or family income, or of another nature [73].
These conditions (stress and sleep disturbance) were surpassed by irritability in terms of frequency but not in the number of related sources. This, in turn, was significantly more pronounced in the opposite direction than the rest of the conditions. In general, people declaring to perceive irritability lightly increased in general terms in quarantine (Figure 5). However, when analyzed in relation to noise sources, the proportion of people feeling irritability mostly declared to perceive each noise source as less notable in confinement, and thus, being more significant than the annoyance before the pandemic. This is, with nuances, consistent with [74].
Another remarkable behavior of irritability regarding health came from related noise sources. Usually, irritability was related to all sources inside the building and the dwelling itself but not to external sources (local and traffic). Observing the distributions for both periods, it can be concluded that the percentage of the sample affected by this source was the same in both periods. However, there were many more who declared that it bothered them more before confinement due to the decrease in traffic due to the lack of external activity [22].
Lack of concentration was also significantly related to all noise sources (except premises), but only for a fifth of the sample at most, as usual. This percentage reached, according to different sources, a quarter during the pandemic, declaring these sources to be more remarkable during confinement. The possible explanation for the significance maintained in both periods with all sources could be due to the existing difference in cases; very few declared greater discomfort in the pre-pandemic period compared to those declaring greater disturbance in confinement. For the latter, percentages ranged from a fifth on a regular basis to a quarter for certain sources during the lockdown. Another reason could be poor acoustic insulation and more time spent in homes performing various activities simultaneously. In the sample, there was a large number of teleworkers, which could have influenced and even biased the answers specifically in this health condition since several studies showed that noise affected the ability to telework [37,47,51,75].
Anxiety in the usual way was the least frequent health condition, more pronounced due to noise from some external sources (premises and traffic) and some from inside the building (facilities and common areas) for an eighth of the sample, and less due to the remaining sources. This condition began to maintain a more or less stable behavior after confinement, regardless of the type of source. Anxiety could be mainly due to, or more influenced by, other factors. Moreover, it was not associated by the majority of participants in the sample with specific sources of noise [49,71].
Study Limitations
The sample obtained as the basis of the study has certain limitations and the usual biases in this type of study and data collection [76,77,78]. On the one hand, the sample was non-probabilistic and collected through digital media dissemination. An internet connection and the use of a computer, a tablet, or a smartphone was required to answer the questionnaire. People with digital resources and skills to manage them were more likely to participate (only 7.9% of participants were 65 years of age or older). In addition, people who were already teleworking (73.9%) and, therefore, equipped with these resources were more likely to participate in the survey compared to those working on-site (26.1%) or to general population.
On the other hand, a potential bias in data collection was the distribution of the survey within the technical and scientific community, as it can be deducted by 85.8% of the respondents having a qualification of at least a university degree, and specifically 33.3% were post-graduates (master or doctorate). There was an overrepresentation of highly qualified people.
Regarding the size of the sample, it can be thought that it is compromised, but it is usual that in studies carried out in the field of building acoustics, the sample size is not highly representative. In this field, procedures based on in situ surveys have been used since the middle of the 20th century to make regulative decisions [79,80,81].
Surveys carried out in different European countries over several decades, including the most recent ones [82,83,84,85,86], showed that the size of the sample in home surveys, had around several hundred participants. Only a few studies carried out over several years have reported significantly superior results.
Therefore, the sample obtained with this study, in exceptional and urgent circumstances such as the COVID-19 pandemic, despite not being highly representative, did represent a relevant source of information for the analysis of the acoustic comfort conditions of Spanish homes.
Finally, more limitations were detected in this study. The first one is related to the description of a “whole noise-related picture” of the disruptive event of COVID-19 for the Spanish population. In fact, the analysis shown in this contribution is mainly descriptive, including absolute and relative frequencies and bivariate analysis. Proxy probability or other multivariate predictive models have no sense in this kind of study, with many dependent variables, also comparing all of them for two scenarios.
Additionally, the ability to recall noise perception before and during the lockdown period may be affected by the time elapsed between the end of the lockdown and the completion of the questionnaire. Another limitation of this study is related to the self-perceived character of the health conditions included. Since no medical or personal data were asked for, and given the subjective nature of the questionnaire, the perception of noise sources and health perturbations were described according to the participants. Also, variables such as the dwelling type or urban/non-urban municipalities were not included in this study, so a deeper analysis could have been relevant in this sense.
5. Conclusions
This study presents a national overview of Spanish households on the possible discomfort or health conditions in relation to the perception of noise by source. These possible relationships were comparatively established for the scenarios before and during the COVID-19 confinement.
Although definitive conclusions cannot be established that relate cause–effect, there were interesting relational trends. These allow both to define the different noise sources with possible effects and to relativize them, in the case of an extreme situation, against other possible causes that remained stable in both scenarios (such as no variations found in the noise sources between the compared periods).
Even though the disruptive circumstances of COVID-19 confinement and the associated uncertainty might have altered citizens’ perception of their own environment, this work reveals a slight increase in noise annoyance due to internal noise sources during the COVID-19 lockdown. The reasons for this discomfort were the variety of activities performed in dwellings, the longer exposure to indoor noise sources, and the lack of acoustic quality of most of the building stock [67,68,69,87,88].
This paper evidences the importance of acoustic conditions in dwellings and the need to increase the sound insulation of both the external envelope and the internal building elements. This implies including acoustics in the retrofit targets and plans for the existing building stock, as well as the enforcement of regulations for new housing and for environmental noise since comfortable acoustic environments can be associated with higher psychological well-being.
Author Contributions
Conceptualization, M.Á.N.-M. and T.C.-V.; Data curation, B.C.-H., A.R.-F., T.C., M.Á.N.-M. and T.C.-V.; Formal analysis, B.C.-H., M.Á.N.-M. and T.C.-V.; Investigation, B.C.-H., M.Á.N.-M. and T.C.-V.; Methodology, B.C.-H., A.R.-F., T.C., M.Á.N.-M. and T.C.-V.; Project administration, B.C.-H., A.R.-F. and T.C.; Resources, B.C.-H., A.R.-F. and T.C.; Software, M.Á.N.-M. and T.C.-V.; Supervision, M.Á.N.-M. and T.C.-V.; Validation, B.C.-H., A.R.-F., T.C., M.Á.N.-M. and T.C.-V.; Visualization, T.C., M.Á.N.-M. and T.C.-V.; Writing—original draft, B.C.-H., A.R.-F., T.C., M.Á.N.-M. and T.C.-V.; Writing—review and editing, B.C.-H., A.R.-F., T.C., M.Á.N.-M. and T.C.-V. All authors have read and agreed to the published version of the manuscript.
Funding
This research received no external funding.
Data Availability Statement
Data are not available due to privacy restrictions.
Acknowledgments
The authors would like to thank the support from the Spanish National Research Council (CSIC) when launching this study, as well as the Spanish Acoustical Society (SEA) and the Young Acoustician Network (YAN) of the European Acoustics Association (EAA). Finally, we appreciate all the participant responses, which were essential for this study.
Conflicts of Interest
The authors declare no conflict of interest.
References
- European Commission. Directive 2002/49/EC of the European Parliament and of the Council of 25 June 2002 Relating to the Assessment and Management of Environmental Noise; European Commission: Brussels, Belgium, 2002. [Google Scholar]
- WHO. Burden of Disease from Environmental Noise Quantification of Healthy Life Years Lost in Europe; WHO: Copenhagen, Denmark, 2011. [Google Scholar]
- EEA. Environmental Noise in Europe; EEA: Brussels, Belgium, 2020. [Google Scholar]
- WHO. Environmental Noise Guidelines for the European Region; WHO: Copenhagen, Denmark, 2018. [Google Scholar]
- Hänninen, O.; Knol, A.B.; Jantunen, M.; Lim, T.A.; Conrad, A.; Rappolder, M.; Carrer, P.; Fanetti, A.C.; Kim, R.; Buekers, J.; et al. Environmental Burden of Disease in Europe: Assessing Nine Risk Factors in Six Countries. In Environmental Health Perspectives; Public Health Services, US Department of Health and Human Services: Washington, DC, USA, 2014; pp. 439–446. [Google Scholar] [CrossRef]
- European Commission. Eurobarómetro Especial 347: Campos Electromagnéticos. Available online: https://data.europa.eu/data/datasets/s843_73_3_ebs347?locale=es (accessed on 1 November 2022).
- Basner, M.; McGuire, S. WHO Environmental Noise Guidelines for the European Region: A Systematic Review on Environmental Noise and Effects on Sleep. Int. J. Environ. Res. Public Health 2018, 15, 519. [Google Scholar] [CrossRef] [PubMed]
- Bodin, T.; Björk, J.; Ardö, J.; Albin, M. Annoyance, Sleep and Concentration Problems Due to Combined Traffic Noise and the Benefit of Quiet Side. Int. J. Environ. Res. Public Health 2015, 12, 1612–1628. [Google Scholar] [CrossRef] [PubMed]
- Clark, C.; Paunovic, K. WHO Environmental Noise Guidelines for the European Region: A Systematic Review on Environmental Noise and Cognition. Int. J. Environ. Res. Public Health 2018, 15, 285. [Google Scholar] [CrossRef]
- Clark, C.; Paunovic, K. WHO Environmental Noise Guidelines for the European Region: A Systematic Review on Environmental Noise and Quality of Life, Wellbeing and Mental Health. Int. J. Environ. Res. Public Health 2018, 15, 2400. [Google Scholar] [CrossRef]
- Munzel, T.; Gori, T.; Babisch, W.; Basner, M. Cardiovascular Effects of Environmental Noise Exposure. Eur. Heart J. 2014, 35, 829–836. [Google Scholar] [CrossRef] [PubMed]
- Eriksson, C.; Pershagen, G. Iological Mechanisms Related to Cardiovascular and Metabolic Effects by Environmental Noise; WHO: Copenhagen, Denmark, 2009. [Google Scholar]
- Guski, R.; Schreckenberg, D.; Schuemer, R. WHO Environmental Noise Guidelines for the European Region: A Systematic Review on Environmental Noise and Annoyance. Int. J. Environ. Res. Public Health 2017, 14, 1539. [Google Scholar] [CrossRef]
- van Kempen, E.; Casas, M.; Pershagen, G.; Foraster, M. WHO Environmental Noise Guidelines for the European Region: A Systematic Review on Environmental Noise and Cardiovascular and Metabolic Effects: A Summary. Int. J. Environ. Res. Public Health 2018, 15, 379. [Google Scholar] [CrossRef]
- WHO. Night Noise Guidelines for Europe; WHO: Copenhagen, Denmark, 2009. [Google Scholar]
- Muzet, A. Environmental Noise, Sleep and Health. Sleep Med. Rev. 2007, 11, 135–142. [Google Scholar] [CrossRef]
- Gobierno de España. Real Decreto 463/2020, de 14 de Marzo, Por El Que Se Declara El Estado de Alarma Para La Gestión de La Situación de Crisis Sanitaria Ocasionada Por El COVID-19; Gobierno de España: Madrid, Spain, 2020. [Google Scholar]
- Gobierno de España. Informe Monográfico: Movilidad y Transporte En Tiempos de COVID-19; Gobierno de España: Madrid, Spain, 2020. [Google Scholar]
- Asensio, C.; Pavón, I.; de Arcas, G. Changes in Noise Levels in the City of Madrid during COVID-19 Lockdown in 2020. J. Acoust. Soc. Am. 2020, 148, 1748–1755. [Google Scholar] [CrossRef]
- Bonet-Solà, D.; Martínez-Suquía, C.; Alsina-Pagès, R.M.; Bergadà, P. The Soundscape of the COVID-19 Lockdown: Barcelona Noise Monitoring Network Case Study. Int. J. Environ. Res. Public Health 2021, 18, 5799. [Google Scholar] [CrossRef]
- Alsina-Pagès, R.M.; Bergadà, P.; Martínez-Suquía, C. Changes in the Soundscape of Girona during the COVID Lockdown. J. Acoust. Soc. Am. 2021, 149, 3416–3423. [Google Scholar] [CrossRef] [PubMed]
- Redel-Macías, M.D.; Aparicio-Martinez, P.; Pinzi, S.; Arezes, P.; Cubero-Atienza, A.J. Monitoring Sound and Its Perception during the Lockdown and De-Escalation of COVID-19 Pandemic: A Spanish Study. Int. J. Environ. Res. Public Health 2021, 18, 3392. [Google Scholar] [CrossRef]
- Manzano, J.V.; Pastor, J.A.A.; Quesada, R.G.; Aletta, F.; Oberman, T.; Mitchell, A.; Kang, J. The “Sound of Silence” in Granada during the COVID-19 Lockdown. Noise Mapp. 2021, 8, 16–31. [Google Scholar] [CrossRef]
- Munoz, P.; Vincent, B.; Domergue, C.; Gissinger, V.; Guillot, S.; Halbwachs, Y.; Janillon, V. Lockdown during COVID-19 Pandemic: Impact on Road Traffic Noise and on the Perception of Sound Environment in France. Noise Mapp. 2020, 7, 287–302. [Google Scholar] [CrossRef]
- Pagès, R.M.A.; Alías, F.; Bellucci, P.; Cartolano, P.P.; Coppa, I.; Peruzzi, L.; Bisceglie, A.; Zambon, G. Noise at the Time of COVID 19: The Impact in Some Areas in Rome and Milan, Italy. Noise Mapp. 2020, 7, 248–264. [Google Scholar] [CrossRef]
- Aletta, F.; Oberman, T.; Mitchell, A.; Tong, H.; Kang, J. Assessing the Changing Urban Sound Environment during the COVID-19 Lockdown Period Using Short-Term Acoustic Measurements. Noise Mapp. 2020, 7, 123–134. [Google Scholar] [CrossRef]
- Aumond, P.; Can, A.; Lagrange, M.; Gontier, F.; Lavandier, C. Multidimensional Analyses of the Noise Impacts of COVID-19 Lockdown. J. Acoust. Soc. Am. 2022, 151, 911–923. [Google Scholar] [CrossRef] [PubMed]
- Maggi, A.L.; Muratore, J.; Gaetán, S.; Zalazar-Jaime, M.F.; Evin, D.; Pérez Villalobo, J.; Hinalaf, M. Perception of the Acoustic Environment during COVID-19 Lockdown in Argentina. J. Acoust. Soc. Am. 2021, 149, 3902. [Google Scholar] [CrossRef]
- Lenzi, S.; Sádaba, J.; Lindborg, P. Soundscape in Times of Change: Case Study of a City Neighbourhood During the COVID-19 Lockdown. Front. Psychol. 2021, 12, 570741. [Google Scholar] [CrossRef] [PubMed]
- Bartalucci, C.; Bellomini, R.; Luzzi, S.; Pulella, P.; Torelli, G. A Survey on the Soundscape Perception before and during the COVID-19 Pandemic in Italy. Noise Mapp. 2021, 8, 65–88. [Google Scholar] [CrossRef]
- Navas-Martín, M.Á.; López-Bueno, J.A.; Oteiza, I.; Cuerdo-Vilches, T. Routines, Time Dedication and Habit Changes in Spanish Homes during the COVID-19 Lockdown. A Large Cross-Sectional Survey. Int. J. Environ. Res. Public Health 2021, 18, 12176. [Google Scholar] [CrossRef]
- Cuerdo Vilches, T.; Oteiza San José, I.; Navas Martín, M.Á. Proyecto Sobre Confinamiento Social (COVID-19), Vivienda y Habitabilidad [COVID-HAB]. Paraninfo Digit. 2020, 14, e32066o. [Google Scholar]
- Harangi-Rákos, M.; Pfau, C.; Bácsné Bába, É.; Bács, B.A.; Kőmíves, P.M. Lockdowns and Physical Activities: Sports in the Time of COVID. Int. J. Environ. Res. Public Health 2022, 19, 2175. [Google Scholar] [CrossRef] [PubMed]
- Pérez-Rodrigo, C.; Gianzo Citores, M.; Hervás Bárbara, G.; Ruiz-Litago, F.; Casis Sáenz, L.; Arija, V.; López-Sobaler, A.M.; de Victoria, E.; Ortega, R.M.; Partearroyo, T.; et al. Patterns of Change in Dietary Habits and Physical Activity during Lockdown in Spain Due to the COVID-19 Pandemic. Nutrients 2021, 13, 300. [Google Scholar] [CrossRef]
- Cuerdo-Vilches, T.; Navas-Martín, M.Á.; Navas-Martín, M. Estudio [COVID-HAB-PAC]: Un Enfoque Cualitativo Sobre El Confinamiento Social (COVID-19), Vivienda y Habitabilidad En Pacientes Crónicos y Su Entorno. Paraninfo Digit. 2020, 14, e32075o. [Google Scholar]
- Ingram, J.; Maciejewski, G.; Hand, C.J. Changes in Diet, Sleep, and Physical Activity Are Associated with Differences in Negative Mood During COVID-19 Lockdown. Front. Psychol. 2020, 11, 588604. [Google Scholar] [CrossRef]
- Cuerdo-Vilches, T.; Navas-Martín, M.Á.; March, S.; Oteiza, I. Adequacy of Telework Spaces in Homes during the Lockdown in Madrid, According to Socioeconomic Factors and Home Features. Sustain. Cities Soc. 2021, 75, 103262. [Google Scholar] [CrossRef]
- Spanish National Statistics Institute, I.N.E. Impact on Business Confidence Indicators During the Second Semester of 2020 and Forecasts for the First Semester of 2021; Spanish National Statistics Institute, I.N.E.: Madrid, Spain, 2021. [Google Scholar]
- Cuerdo-Vilches, T.; Navas-Martín, M.Á. Confined Students: A Visual-Emotional Analysis of Study and Rest Spaces in the Homes. Int. J. Environ. Res. Public Health 2021, 18, 5506. [Google Scholar] [CrossRef] [PubMed]
- Zarrabi, M.; Yazdanfar, S.A.; Hosseini, S.B. COVID-19 and Healthy Home Preferences: The Case of Apartment Residents in Tehran. J. Build. Eng. 2021, 35, 102021. [Google Scholar] [CrossRef]
- Abellán García, A.; Aceituno Nieto, P.; Allende, A.; de Andrés, A.; Arenillas, A.; Bartomeus, F.; Bastolla, U.; Benavides, J.; Cabal, B.; Castillo Belmonte, A.B.; et al. Una Visión Global de La Pandemia COVID-19: Qué Sabemos y Qué Estamos Investigando Desde El CSIC. In Informe Elaborado Desde la Plataforma Temática Interdisciplinar Salud Global/Global Health del CSIC; Consejo Superior de Investigaciones Científicas (España): Madrid, Spain, 2021. [Google Scholar]
- Navas-Martín, M.Á.; Oteiza, I.; Cuerdo-Vilches, T. Dwelling in Times of COVID-19: An Analysis on Habitability and Environmental Factors of Spanish Housing. J. Build. Eng. 2022, 60, 105012. [Google Scholar] [CrossRef]
- Muñoz-González, C.; Ruiz-Jaramillo, J.; Cuerdo-Vilches, T.; Joyanes-Díaz, M.D.; Montiel Vega, L.; Cano-Martos, V.; Navas-Martín, M.Á. Natural Lighting in Historic Houses during Times of Pandemic. The Case of Housing in the Mediterranean Climate. Int. J. Environ. Res. Public Health 2021, 18, 7264. [Google Scholar] [CrossRef]
- de Frutos, F.; Cuerdo-Vilches, T.; Alonso, C.; Martín-Consuegra, F.; Frutos, B.; Oteiza, I.; Navas-Martín, M.Á. Indoor Environmental Quality and Consumption Patterns before and during the COVID-19 Lockdown in Twelve Social Dwellings in Madrid, Spain. Sustainability 2021, 13, 7700. [Google Scholar] [CrossRef]
- Cuerdo-Vilches, T.; Navas-Martín, M.Á.; Oteiza, I. Behavior Patterns, Energy Consumption and Comfort during COVID-19 Lockdown Related to Home Features, Socioeconomic Factors and Energy Poverty in Madrid. Sustainability 2021, 13, 5949. [Google Scholar] [CrossRef]
- Navas-Martín, M.Á.; Cuerdo-Vilches, T. Natural Ventilation as a Healthy Habit during the First Wave of the COVID-19 Pandemic: An Analysis of the Frequency of Window Opening in Spanish Homes. J. Build. Eng. 2023, 65, 105649. [Google Scholar] [CrossRef]
- Andargie, M.S.; Touchie, M.; O’Brien, W. Case Study: A Survey of Perceived Noise in Canadian Multi-Unit Residential Buildings to Study Long-Term Implications for Widespread Teleworking. Build. Acoust. 2021, 28, 443–460. [Google Scholar] [CrossRef]
- Lee, P.J.; Jeong, J.H. Attitudes towards Outdoor and Neighbour Noise during the COVID-19 Lockdown: A Case Study in London. Sustain. Cities Soc. 2021, 67, 102768. [Google Scholar] [CrossRef]
- Şentop Dümen, A.; Şaher, K. Noise Annoyance during COVID-19 Lockdown: A Research of Public Opinion before and during the Pandemic. J. Acoust. Soc. Am. 2020, 148, 3489–3496. [Google Scholar] [CrossRef] [PubMed]
- Torresin, S.; Albatici, R.; Aletta, F.; Babich, F.; Oberman, T.; Stawinoga, A.E.; Kang, J. Indoor Soundscapes at Home during the COVID-19 Lockdown in London—Part I: Associations between the Perception of the Acoustic Environment, Occupantś Activity and Well-Being. Appl. Acoust. 2021, 183, 108305. [Google Scholar] [CrossRef]
- Torresin, S.; Albatici, R.; Aletta, F.; Babich, F.; Oberman, T.; Stawinoga, A.E.; Kang, J. Indoor Soundscapes at Home during the {COVID}-19 Lockdown in London—{Part} II: A Structural Equation Model for Comfort, Content, and Well-Being. Appl. Acoust. 2022, 185, 108379. [Google Scholar] [CrossRef]
- Torresin, S.; Albatici, R.; Aletta, F.; Babich, F.; Oberman, T.; Kang, J. Associations between Indoor Soundscapes, Building Services and Window Opening Behaviour during the COVID-19 Lockdown. Build. Serv. Eng. Res. Technol. 2022, 43, 225–240. [Google Scholar] [CrossRef]
- Dzhambov, A.M.; Lercher, P.; Stoyanov, D.; Petrova, N.; Novakov, S.; Dimitrova, D.D. University Students’ Self-Rated Health in Relation to Perceived Acoustic Environment during the COVID-19 Home Quarantine. Int. J. Environ. Res. Public Health 2021, 18, 2538. [Google Scholar] [CrossRef] [PubMed]
- International Commission for Acoustics. International Year of Sound. Available online: https://www.sound2020.org/ (accessed on 1 November 2022).
- Google. Formularios de Google: Solución Para Crear Formularios Online. Available online: https://www.google.com/forms/about/ (accessed on 1 November 2022).
- Simmons, C. Developing a Uniform Questionnaire for Socio-Acoustic Surveys in Residential Buildings. In Building Acoustics Throughout Europe Volume 1: Towards a Common Framework in Building Acoustics Throughout Europe; Rasmussen, B., Machimbarrena, M., Eds.; COST TU0901: Brussels, Belgium, 2014; pp. 101–132. [Google Scholar]
- CSTB. Social Study on the Satisfaction of Inhabitants Living in Dwellings in Accordance with Regulation; CSTB: Paris, France, 1969. [Google Scholar]
- Izewska, A. Subjective and Objective Evaluation of Acoustic Climate in Dwellings—Previous Experiences in Poland. In Proceedings of the 39th International Congress on Noise Control Engineering 2010, INTER-NOISE 2010, Lisbon, Portugal, 13–16 June 2010; Volume 2, pp. 876–884. [Google Scholar]
- NordTest. Assessment of Annoyance Caused by Vibrations in Dwellings from Road and Rail Traffic by Means of Socio-Vibrational and Social Surveys; NordTest: Oslo, Norway, 2001. [Google Scholar]
- Howarth, H.; Griffin, M.J. Development of a Social Survey Questionnaire of Reactions to Vibration in Residential Buildings. In Proceedings—European Conference on Noise Control; Acoustical Society of America (ASA): Melville, NY, USA, 2008; Volume 123, pp. 4319–4323. [Google Scholar] [CrossRef]
- Martín, M.A.; Tarrero, A.; González, J.; Machimbarrena, M. Exposure-Effect Relationships between Road Traffic Noise Annoyance and Noise Cost Valuations in Valladolid, Spain. Appl. Acoust. 2006, 67, 945–958. [Google Scholar] [CrossRef]
- Martin Bravo, M.A.; Tarrero Fernández, A.I.; Machimbarrena Gutiérrez, M. Procedure Used to Determine Citizens Annoyance Due to Noise in Málaga; 2009. [Google Scholar]
- ISO. ISO—ISO/TS 15666:2003—Acoustics—Assessment of Noise Annoyance by Means of Social and Socio-Acoustic Surveys. Available online: https://www.iso.org/standard/28630.html (accessed on 1 November 2022).
- Fields, J.M.; De Jong, R.G.; Gjestland, T.; Flindell, I.H.; Job, R.F.S.; Kurra, S.; Lercher, P.; Vallet, M.; Yano, T.; Guski, R.; et al. Standardized General-Purpose Noise Reaction Questions for Community Noise Surveys: Research and a Recommendation. J. Sound Vib. 2001, 242, 641–679. [Google Scholar] [CrossRef]
- George, D.; Mallery, P. IBM SPSS Statistics 25 Step by Step, 15th ed.; Routledge: London, UK, 2018. [Google Scholar] [CrossRef]
- UNE. UNE-ISO 4121:2006 Análisis Sensorial. Directrices Para la Utilización de Escalas de Respuestas Cuantitativas. (ISO 4121:2003). Available online: https://www.une.org/encuentra-tu-norma/busca-tu-norma/norma/?Tipo=N&c=N0037445 (accessed on 1 November 2022).
- ISO. ISO—ISO/TS 12913-2:2018—Acoustics—Soundscape—Part 2: Data Collection and Reporting Requirements. Available online: https://www.iso.org/standard/75267.html (accessed on 1 November 2022).
- García, T.C.; Romero Fernández, A.; Casla Herguedas, B. Noise Requirements in Existing Buildings in Spain: New Proposals and the Existing Building Evaluation Report. In Proceedings of the 10th European Congress and Exposition on Noise Control Engineering, EuroNoise, Maastricht, The Netherlands, 31 May–3 June 2015; pp. 1889–1894. [Google Scholar]
- Carrascal García, M.T.; Romero Fernández, A.; Casla Herguedas, M.B. The Evolution in the Sound Insulation of Spanish Floors. Typical Performance and Their Potential for Improvement. In Proceedings of the INTER-NOISE 2019 MADRID—48th International Congress and Exhibition on Noise Control Engineerin, Madrid, Spain, 16–19 June 2019; Euronoise: Madrid, Spain, 2019. [Google Scholar]
- Romero Fernández, A.; Teresa Carrascal García, M.; Belén Casla Herguedas, M. Aislamiento Acústico a Ruido Aéreo En Particiones Verticales. Evolución y Prestaciones. In Proceedings of the Tecniacústica 2020, Faro, Portugal, 21–23 October 2020. [Google Scholar]
- Gobierno de España. De La Estrategia a Largo Plazo Para La Rehabilitación Energética En El Sector de La Edificación En España (ERESEE); Gobierno de España: Madrid, Spain, 2020. [Google Scholar]
- Holmes, E.A.; O’Connor, R.C.; Perry, V.H.; Tracey, I.; Wessely, S.; Arseneault, L.; Ballard, C.; Christensen, H.; Silver, R.C.; Everall, I.; et al. Multidisciplinary Research Priorities for the COVID-19 Pandemic: A Call for Action for Mental Health Science. The Lancet Psychiatry 2020, 7, 547–560. [Google Scholar] [CrossRef] [PubMed]
- Vindegaard, N.; Benros, M.E. COVID-19 Pandemic and Mental Health Consequences: Systematic Review of the Current Evidence. Brain. Behav. Immun. 2020, 89, 531–542. [Google Scholar] [CrossRef] [PubMed]
- Altena, E.; Micoulaud-Franchi, J.A.; Geoffroy, P.A.; Sanz-Arigita, E.; Bioulac, S.; Philip, P. The Bidirectional Relation between Emotional Reactivity and Sleep: From Disruption to Recovery. Behav. Neurosci. 2016, 130, 336–350. [Google Scholar] [CrossRef]
- Dzhambov, A.M. Objective and Perceived Acoustic Environments during the COVID-19 Lockdown: An Overview of Evidence. In Proceedings of the INTER-NOISE and NOISE-CON Congress and Conference Proceedings, Inter.Noise, Glasgow, UK, 21–24 August 2022. [Google Scholar]
- Puglisi, G.E.; Di Blasio, S.; Shtrepi, L.; Astolfi, A. Remote Working in the COVID-19 Pandemic: Results from a Questionnaire on the Perceived Noise Annoyance. Front. Built Environ. 2021, 7, 688484. [Google Scholar] [CrossRef]
- Pierce, M.; McManus, S.; Jessop, C.; John, A.; Hotopf, M.; Ford, T.; Hatch, S.; Wessely, S.; Abel, K.M. Says Who? The Significance of Sampling in Mental Health Surveys during COVID-19. In The Lancet Psychiatry; Elsevier Ltd.: Amsterdam, The Netherlands, 2020; pp. 567–568. [Google Scholar] [CrossRef]
- de Boni, R.B. Web Surveys in the Time of COVID-19. In Cadernos de Saude Publica; Fundacao Oswaldo Cruz: Rio de Janeiro, Brazil, 2020. [Google Scholar] [CrossRef]
- Cuerdo-Vilches, T.; Navas-Martín, M.Á. Indicadores de Satisfacción y Hábitos de Ocupación de Los Mayores Españoles En Sus Viviendas Durante El Confinamiento COVID-19. WPS Rev. Int. Sustain. Hous. Urban Renew. 2020, 9–10, 66–82. [Google Scholar] [CrossRef]
- Gray, P.; Cartwright, A.; Parkin, P.H. Noise in Three Groups of Flats with Different Floor Insulations; National Building Studies Research; Her Majesty’s Stationery Office: London, UK, 1958. [Google Scholar]
- Brandt, O. European Experience with Sound-Insulation Requirements. J. Acoust. Soc. Am. 1964, 36, 719–724. [Google Scholar] [CrossRef]
- Josse, R.; Plagnol, R.; Coblentz, A.; Alexandre, M. Etude Sociologique de La Satisfaction Des Occupants de Locaux Conformes Aux Règles Qui Sont Supposées Garantir Un Confort Acoustique Suffisant; CSTB (Centre Scientifique et Technique du Bâtiment): Marne-la-Vallée, France, 1969. [Google Scholar]
- Ljunggren, F.; Simmons, C.; Hagberg, K. Findings from the AkuLite Project: Correlation between Measured Vibro-Acoustic Parameters and Subjective Perception in Lightweight Buildings. In Proceedings of the International Congress and Exposition on Noise Control Engineering, Innsbruck, Austria, 15–18 September 2013; pp. 578–1585. [Google Scholar]
- Ljunggren, F.; Simmons, C.; Hagberg, K. Correlation between Sound Insulation and Occupants’ Perception—Proposal of Alternative Single Number Rating of Impact Sound. Appl. Acoust. 2014, 85, 57–68. [Google Scholar] [CrossRef]
- Simmons, C.; Hagberg, K.; Backman, E. Acoustical Performance of Apartment Buildings—Resident’s Survey and Field Measurements. AkuLite Report 2; SP Rapport; AkuLite: Lisbon, Portugal, 2011. [Google Scholar]
- Milford, I.; Høsøien, C.O.; Løvstad, A.; Rindel, J.; Klæboe, R. Socio-Acoustic Survey of Sound Quality in Dwellings in Norway. In Proceedings of the INTER-NOISE and NOISE-CON Congress and Conference Proceedings, Lucerne, Switzerland, 21–24 August 2016. [Google Scholar]
- Hongisto, V.; Mäkilä, M.; Suokas, M. Satisfaction with Sound Insulation in Residential Dwellings—The Effect of Wall Construction. Build. Environ. 2015, 85, 309–320. [Google Scholar] [CrossRef]
- Cuerdo-Vilches, T.; Blázquez, A.; Oteiza, I. Análisis de Soluciones Innovadoras Para Rehabilitación de Fachada En Vivienda Social Con Documentos de Idoneidad Técnica (DIT, DITE/ETE, Ditplus). In Proceedings of the 1st Congreso Internacional sobre Investigación en Construcción y Tecnología Arquitectónicas, Madrid, Spain, 11–13 June 2014. [Google Scholar]
Disclaimer/Publisher’s Note: The statements, opinions and data contained in all publications are solely those of the individual author(s) and contributor(s) and not of MDPI and/or the editor(s). MDPI and/or the editor(s) disclaim responsibility for any injury to people or property resulting from any ideas, methods, instructions or products referred to in the content. |
© 2023 by the authors. Licensee MDPI, Basel, Switzerland. This article is an open access article distributed under the terms and conditions of the Creative Commons Attribution (CC BY) license (https://creativecommons.org/licenses/by/4.0/).