Abstract
Currently, modular building is undergoing vigorous development in China, and has provided a significant advantage in many fields, but its quality is difficult to guarantee. The key is to improve the design process, shorten the development cycle, and enhance competitiveness. Therefore, it is necessary to establish and optimize the design process of modular buildings. This article was based on the DSM and adopted a parallel design to model the modular building design process. Based on this, the design process was analyzed and optimized to shorten the development cycle and reduce costs. At the same time, considering the differences in attributes between different stages of the modular building design process, a DSM model with different resolutions was constructed based on the content and interrelationships of modular building design. The schedule and cost of the design process were evaluated through simulation, the differences between different resolution models were compared, and a more reliable estimate of the schedule and cost of the design process was obtained. Considering the workload and difficulty of high-resolution modeling, an approximate estimation method based on low-resolution modeling was proposed to alleviate the dependence on high-resolution models and modeling costs to some extent, thereby effectively improving the predictability of the design process and providing necessary reference for product design management personnel.
1. Introduction
Currently, China’s industry is among the middle to low end of the world’s industrial chain. Vigorously developing emerging industries and utilizing technological innovation to drive the transformation and upgrading of traditional industries is the only path for China’s future economic development. In 2022, the report of the 20th National Congress of the Communist Party of China proposed the following: “Adhere to promoting new industrialization and focus on promoting high-quality development.” Therefore, high-quality development of the construction industry is imperative. The industrialization of new buildings achieves sustainable development throughout the entire life cycle of buildings by mastering advanced R&D [Appendix A Table A1], construction technologies, and modern organizational management methods. Modular building is the result of the high development of building industrialization. Its core concept is the standardized prefabricated space module.
In addition, the current extensive construction model in China has brought heavy pressure to the ecological environment, and there is an urgent need for new construction and residential models. Confronted by the changes in human survival and the social demand for the sustainable development of buildings, the modular building practice has responded. Modular buildings utilize many of the latest developments in the field of architecture, representing a direction for the development of future architecture. From lightweight and high-strength structural components to energy-saving and environmentally friendly exterior envelopment materials, from disaster relief buildings to large-scale exhibition venues, modular buildings are creating a broad field.
Currently, modular buildings are undergoing vigorous development in China and have made notable progress. Especially in the critical period of COVID-19 from 2020 to 2022, a large number of shelter hospitals (such as Wuhan Huoshen Mountain Hospital) were built all over China in a short time, reflecting the huge advantages of modular building. However, a considerable number of modular buildings still belong to the low-end quality level. Many modular building manufacturers have simple equipment, low technical assembly technique, and have not formed a complete R&D and manufacturing system, which makes it difficult to guarantee the building quality.
There are usually three ways to improve modular building quality: 1. Select high-quality raw materials; 2. improve design; 3. improve the design process. Compared with the first and second methods, the most direct way is to improve the design process, shorten the development cycle, and enhance competitiveness.
Currently, construction projects in China are based on the traditional “design bidding construction” model, which can be divided into five stages: preliminary preparation, design, construction preparation, construction, and delivery. After the upstream team finishes their work, the downstream team can continue to work on their achievements. The information transmission is a typical serial mode. The disadvantage of this model is that there are obstacles in information exchange between professional teams, which often leads to cross stage iterative design, resulting in project cycle delays and increased costs, and product quality cannot be guaranteed.
Therefore, the modular building in this article will learn from the design concepts of advanced manufacturing industry, apply parallel design methods, emphasize the need to consider the relevant processes in the early stages as synchronously as possible, avoid design errors as much as possible, reduce the frequency and scope of design changes, and change the design iteration of large scope and span into a small scope design cycle, so as to achieve one-time success in design and development. In this way, compared to serial mode, the constraints and dependencies between R&D activities in the parallel design process will inevitably increase significantly, and the complexity of the R&D process will also increase significantly, as shown in Figure 1. Therefore, it is necessary to apply corresponding research methods and technologies. This article used the DSM [Appendix A Table A1] to model the modular building design process, and analyzed and optimized the design process based on this. This is crucial for shortening the development cycle and reducing costs, improving the predictability of the design process, and providing necessary decision support for management personnel. At the same time, due to the significant differences in attributes between different stages of the modular building design process, in order to improve model utilization and reduce dependence on high-resolution models, it is necessary to construct multiresolution models [Appendix A Table A1] with different levels of detail in stages.
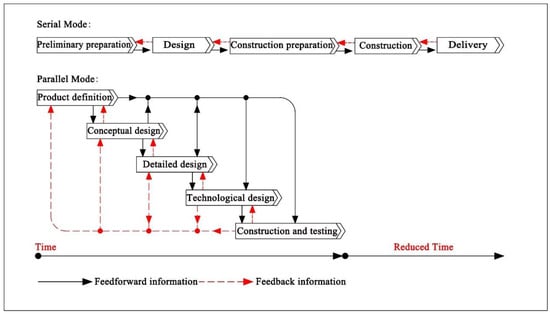
Figure 1.
Transition from serial mode (traditional construction projects) to parallel mode (typical product R&D).
2. Literature Review
Modular buildings have the dual characteristics of both manufacturing and construction industries. This article will study the manufacturing product R&D process and architectural design process, respectively.
2.1. Research on Manufacturing Product R&D Process
In the current global new technological revolution, advanced manufacturing is developing at an unprecedented speed, with high-quality manufacturing products continuously emerging. On the other hand, in traditional Chinese construction industry, due to extensive construction and management, there is a significant gap in quality and efficiency between construction products and advanced manufacturing products. Therefore, in the study of modular building, this article draws on the production methods of advanced manufacturing industries and deeply integrates the construction and manufacturing industries.
In the field of domestic research on product R&D processes in the manufacturing industry, Zeng used doorstep management theory, absorbed the advantages of the project management knowledge system, and applied the ideas and methods of business process optimization to propose targeted recommendations [1]. Wang used integrated product development management theory to optimize the R&D process of new products based on the five stages of product concept, planning, development, validation, and release [2]. Xu et al. proposed a flexible modeling method based on Petri nets, which uses attribute rules such as priority and transition trigger rules to describe the flexibility of the model, reducing the complexity of product R&D and design workflow modeling [3]. Feng et al. proposed module decomposition, layering, and merging methods for complex product R&D processes from two aspects: functional relevance and information relevance [4]. Yu et al. analyzed the process of product innovation in financial institutions from six aspects: environmental analysis and evaluation, product planning, product design and development, product pilot and modification, market implementation, and product evaluation and optimization [5]. Gu applied DSM theory and related analysis methods to analyze and optimize the product development process of YF Company, and proposed corresponding auxiliary measures for process management and control [6]. Zeng applied the DSM theory to optimize the product R&D process of S Company. After model simulation and effect evaluation, the project cycle has been well improved [7]. Yang et al. proposed a modeling and optimization method based on DSM and System Modeling Language (SysML) to decompose and optimize the product R&D process, reduce iterations of design activities, and improve the accuracy and efficiency of modeling [8].
Carvalho et al. integrated design thinking, parallel engineering, and agile technology into the design process management of electromechanical products. Design thinking was adopted in the early stages, while parallel engineering and agility were applied in the product development process to address emerging user needs and shorten development cycles [9]. Liu constructed a multi-model interaction mechanism and used an improved fuzzy analytic hierarchy process to evaluate the product design process [10]. Sheng et al. proposed a new DSM optimization algorithm, established an objective optimization function, and designed coding, crossover, and mutation methods based on genetic algorithms [11]. Sinha et al. proposed a new method for system architecture decomposition and modularization based on DSM, combining multiple design constraints into clustering algorithms [12]. Gunawan et al. proposed a modeling method based on the DSM, striving to minimize coupling factors during the modeling process and build MDO models with a low degree of coupling [13]. Tyson et al. combined DSM with colored Petri nets to conduct research on product design process modeling and simulation, achieving conflict detection and resource redistribution and adjustment in the product development process [14].
By reviewing the present research as outlined above, it can be found that the concept of concurrent engineering is the foundation and core of manufacturing R&D, and most of the research methods related to design processes are based on the DSM modeling method. These two points can be applied to modular building design processes.
2.2. Research on Architectural Design Process
With the increasing burdens of market demand on the development cycle, cost, and quality of buildings, more attention is being paid to the optimization of design processes.
Relevant scholars use building information modeling (BIM) technology to optimize the design and construction process of building projects from four aspects: model creation, collision detection, progress simulation, and real-time roaming. Deng et al. proposed a detailed design process for prefabricated components based on BIM to address the problems of insufficient component accuracy and low visualization level in the traditional detailed design process for prefabricated buildings [15]. Wang et al. focused on the advantages of two collaborative design methods: file linking and worksets under BIM technology, and combined modular residential design cases to build a BIM integrated multidisciplinary collaborative design process framework [16]. Letizia et al. established a BIM-BPM workflow model for the renovation project [17]. Sigalov et al. and Lee et al. established a process model for construction schedule planning based on BIM [18,19].
China’s Ministry of Housing and Urban–Rural Development issued the “Several Opinions on Further Promoting the Development of Fabricated Buildings”, proposing that by 2025, the proportion of prefabricated buildings in the newly built building area will reach 30%. Domestic and foreign scholars have proposed the idea of combining manufacturing industry theory to improve the management process of assembly construction [20], introducing theoretical methods such as concurrent engineering, and exploring the feasibility of its application in assembly construction [21]. The characteristics of parallel engineering in assembly construction also bring coupling and iteration problems, resulting in rework. Currently, there are many methods for modeling construction process optimization [22], such as the critical path method (CPM) commonly used in project management, the integrated definition methodology (IDEF), and the design structure matrix-based model (DSM) [23]. The design structure matrix-based model (DSM) intuitively represents the dependencies and constraints between system elements in the form of a square matrix, with strong iterative ability and can effectively identify coupling activities, thereby reducing the complexity of the development process [24]. Li, Gunawan et al., and Pekta et al. used a work breakdown structure to subdivide the work content of the five disciplines of architecture, structure, electrical, HVAC, and water supply and drainage in the design process of a construction project [25,26,27]. At the same time, based on DSM theory, they optimized and analyzed the design process of a construction project to obtain a design process with the most economical resource allocation, the most reasonable process connection, and the most efficient time schedule. Zhao et al., Hyun et al., and Ma et al., based on parallel engineering theory and starting from the characteristics of the assembly construction process, constructed a DSM model to analyze dependencies in the assembly construction process, identified and optimized coupling tasks, and reduced coupling iterations between tasks [28,29,30]. Aiming at the risk propagation mode of rework, a process optimization model with the goal of minimizing cost and duration was established. The DSM model was combined with a genetic algorithm to optimize and analyze the entire assembly construction process. Le, Oloufa et al., Brady, and Bulloch introduced the idea of overlapping activities, established a DSM based duration calculation model using ternary parameter sets, imported key processes into the model, determined the logical relationship of processes through algorithms, and shortened the early work cycle of the project [31,32,33,34].
Through the above review of the current research status of design processes in two different fields, it can be found that, currently, an increasing number of prefabricated buildings use DSM models to identify coupling, reduce iterations, and optimize processes. Compared with prefabricated building, modular building has a higher degree of standardization, generalization, and integration. The reference and transformation of modular building to the production mode of the manufacturing industry has completely transformed the original system of the traditional construction industry. Therefore, building a modular building design process model based on DSM is necessary and more typical.
At present, there are few studies on the design process of modular buildings, and they are all single-resolution modeling based on DSM. Considering the complexity of the design process of modular building and the requirements of multi-level and multi-stage, a single resolution is likely to reduce the credibility of risk assessment. At the same time, the attributes of each stage of modular building design vary greatly. In order to improve the utilization rate of the model, it is necessary to build a multi-resolution model with different levels of detail in different stages.
2.3. Research on Multiresolution Modeling
Complex products refer to a type of product with complex requirements, composition, process, and management. A modular building is a typical complex product, and its modeling and simulation has multi-level and multi-stage requirements. Modular building encompasses a unit modular product system structure, which can be divided into functional body, module, parts, and other different levels from the whole to the part. Its R&D process presents a multi-stage nature, going through multiple stages such as product definition, conceptual design, system design, construction design, prototype product construction, and product testing. The workload, information exchange, and other factors vary in each stage. At the same time, the conversion process from modular building low-resolution models [Appendix A Table A1] to high-resolution models [Appendix A Table A1] will result in a large amount of preliminary research costs and modeling workload. Adopting different resolution models for different stages of the design process will to some extent reduce dependence on high-resolution models and modeling costs. Therefore, it is necessary to study the multiresolution modeling of modular building design processes.
In the field of modeling and simulation, many scholars at home and abroad have provided the definition, formal representation, and quantitative methods of model resolution. The definition of model resolution based on the characteristics of complex product models is as follows [35]:
- The resolution of a complex product model: The level of detail and detail that the model describes the hierarchy, stages, static attributes, and dynamic behavior of the object. Generally speaking, models with higher levels, earlier design stages, fewer details, and lower levels of detail are called low-resolution models; a model with a lower level, a later design stage, more detail, and a higher level of detail is called a high-resolution model.
- Model aggregation: The process of converting a higher resolution model into a lower resolution model.
- Model disaggregation: The process of converting a lower resolution model into a higher resolution model.
Yue et al. analyzed the conceptual connotation and typical methods of multiresolution modeling technology, constructed a multiresolution model space, and designed an aggregation and disaggregation process from two dimensions, namely, two-dimensional and three-dimensional space, providing a methodological approach for effectively constructing marine digital equipment models [36]. Xu Yifan improved the granularity of system analysis through a multiresolution modeling method, enabling the method to keep the technical risk assessment updated and improving the granularity of analysis as the system evolves [37]. In response to the problem of low credibility of development risk assessment due to the large scale of ship design systems and complex relationships between design tasks, it was proposed that multiresolution modeling can describe systems, processes, and their interrelationships. Based on specific analysis needs, model resolution can be improved or reduced to provide convenience for modeling and analysis calculations [38].
In view of the complexity of the modular building system, in order to meet the analysis needs of the continuous refinement of its design process, this article proposed a multi-resolution modeling method, and according to its design contents and their interrelationships, established a DSM with different resolutions, by means of evaluating the progress and cost risks of the design process through simulation, comparing the advantages and disadvantages of different resolution models, thereby obtaining results with higher reliability and optimizing the design process.
3. Multiresolution Modeling Based on DSM
3.1. Product Design Process Optimization Based on DSM
The DSM was first proposed by Dr. Donald Steward of the United States. It is mainly used to establish a product R&D process model, analyze, optimize, and reorganize the interrelationships and information transmission methods between R&D activities using appropriate technical strategies, and form reasonable dependencies for establishing product R&D processes [39]. The DSM is composed of n elements located in the same row and column positions and arranged in the same order. The elements in the row and column represent the R&D activities in the design process, and the cells on the non-diagonal lines in the matrix represent the interrelationships between the corresponding row and column elements. The cells located below the diagonal represent feedforward information, while the cells located above the diagonal represent feedback information. The cells on the diagonal have no meaning.
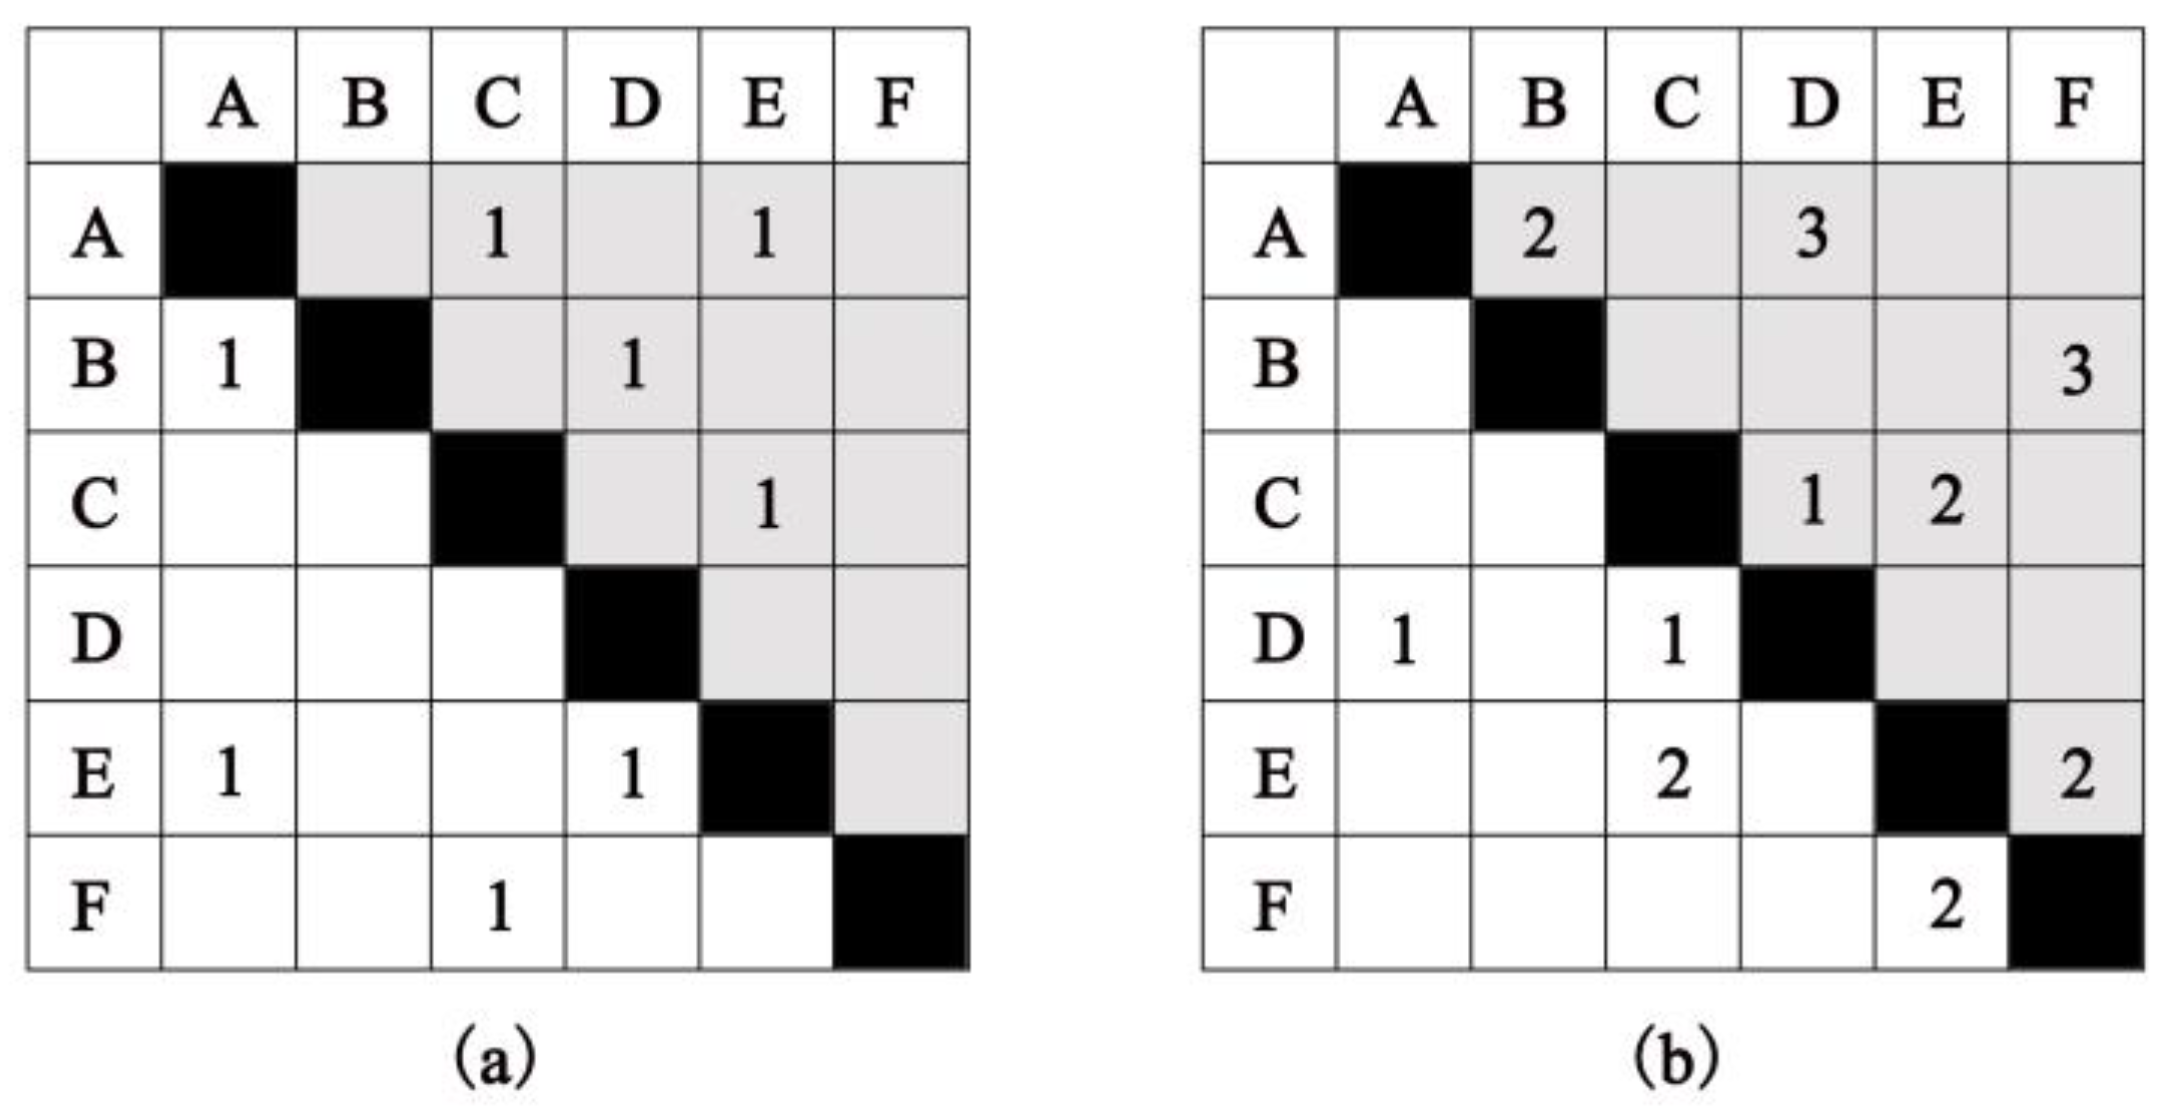
Formally, the DSM can be divided into binary and numerical types, as shown in Figure 2. The binary type of DSM refers to marking the cells of the matrix in the form of binary values (“X” and “blank” or “1” and “0”). When there is a connection between the corresponding cells of the row and column, it is marked with “X” or “1”, and when there is no connection, it is marked with “blank” or “0”. As shown in Figure 2a, the DSM consists of six row and column activities: A, B, C, D, E, and F. When the cell corresponding to any row activity and column activity is marked with “1”, it indicates a dependency relationship between these two activities. The cells on the diagonal of the matrix do not reflect dependencies between activities and represent the activities themselves, filled with black blocks. The presence of “1” in the cell corresponding to the row activity indicates that the row activity needs to input information from the corresponding column activity. When there is a “1” in the cell corresponding to the column activity, it indicates that the column activity needs to output information to the corresponding row activity. Notably, the dependency relationships between activities located below the diagonal of the matrix are all positive, that is, the information required by the activities comes from upstream, and the information is transmitted in a positive direction, such as B relying on A and E relying on A. The matrix elements located above the diagonal of the matrix describe the existence of a reverse dependency relationship between activities, that is, upstream activities require information input from downstream activities, information is transmitted in reverse, and there is an iterative relationship, such as A relying on C and B relying on D. When the cells corresponding to row and column activities are blank, it indicates that there is no forward or reverse dependency relationship between the two activities. The numerical type of DSM is a further development based on the binary type. It uses specific numerical values to quantitatively describe the strength of the row column activity dependency relationship in the matrix, and the numerical range is generally [0, 3]. A smaller value indicates a weaker degree of dependency, while a value of 0 indicates no relationship between the two [40], as shown in Figure 2b. In this article, the binary type of DSM was used.
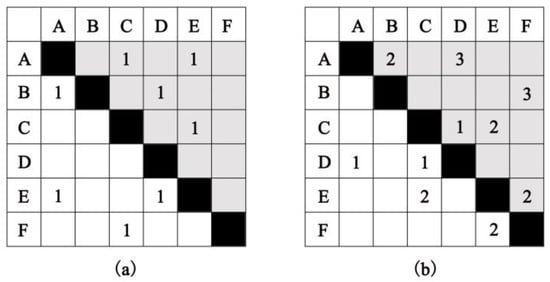
Figure 2.
DSM (white area: feedforward information; gray area: feedback information). (a) Binary tyre of DSM (b) Numerical type of DSM.
3.2. Multiresolution Modeling
When the system resolution is low, the n2 elements in the DSM are determined one by one based on the dependency between system components, and the workload is relatively controllable. If the system resolution is significantly improved, the information collection and modeling workload required to determine the n2 matrix elements will be very large. However, if the sparsity of matrix elements and matrix operations can be reasonably utilized, this workload can be significantly reduced. When the system resolution is improved, an element in the low-resolution DSM is replaced by a new DSM, as shown in Figure 3a. L represents the original low-resolution DSM, and L is divided into 9 regions (Laa, Lab, Lac, Lba, Lbb, Lbc, Lca, Lcb, and Lcc), where Lbb represents the system composition that needs to improve resolution. Gaa represents the DSM after the Lbb resolution is improved, and Gab and Gba represent the correlation matrix between the high-resolution system composition and other system components. Due to the relatively small composition scale, it is relatively easy to determine the internal and external dependencies of Gaa, and the four gray areas of L (Laa, Lac, Lca, and Lcc) do not need to be changed.

Figure 3.
Multiresolution modeling at the same system level: (a) System resolution upgrading; (b) pending DSM after system resolution upgrading; (c) determined DSM after system resolution upgrading.
In addition, it is necessary to determine how the Lab, Lba, Lbc, and Lcb will expand as the resolution increases. After replacing Lbb with Gaa, the high-resolution DSM to be confirmed as shown in Figure 3b. H indicates the DSM after the system resolution is improved, and the nine regions of H are determined by Formulas (1)–(9) through matrix operations [37].
The resolution improvement area is:
Hbb = Gaa
The area to be confirmed after resolution improvement is:
Hab = Lab × Gba
Hba = Gab × Lba
Hbc = Gab × Lbc
Hcb = Lcb × Gba
The invariant area is:
Haa = Laa
Hac = Lac
Hca = Lca
Hcc = Lcc
“X” in H represents the matrix element to be confirmed for dependency, while other matrix elements need not be examined, further narrowing the scope of investigation for modeling work. Assuming that through information collection, expert opinions, or confirmation of relevant knowledge in the professional field, some of the matrix elements marked with “X” have dependencies, the final confirmed DSM after the system resolution is improved is shown in Figure 3c.
4. Case Study
4.1. Design of Aluminum Alloy Modular Building
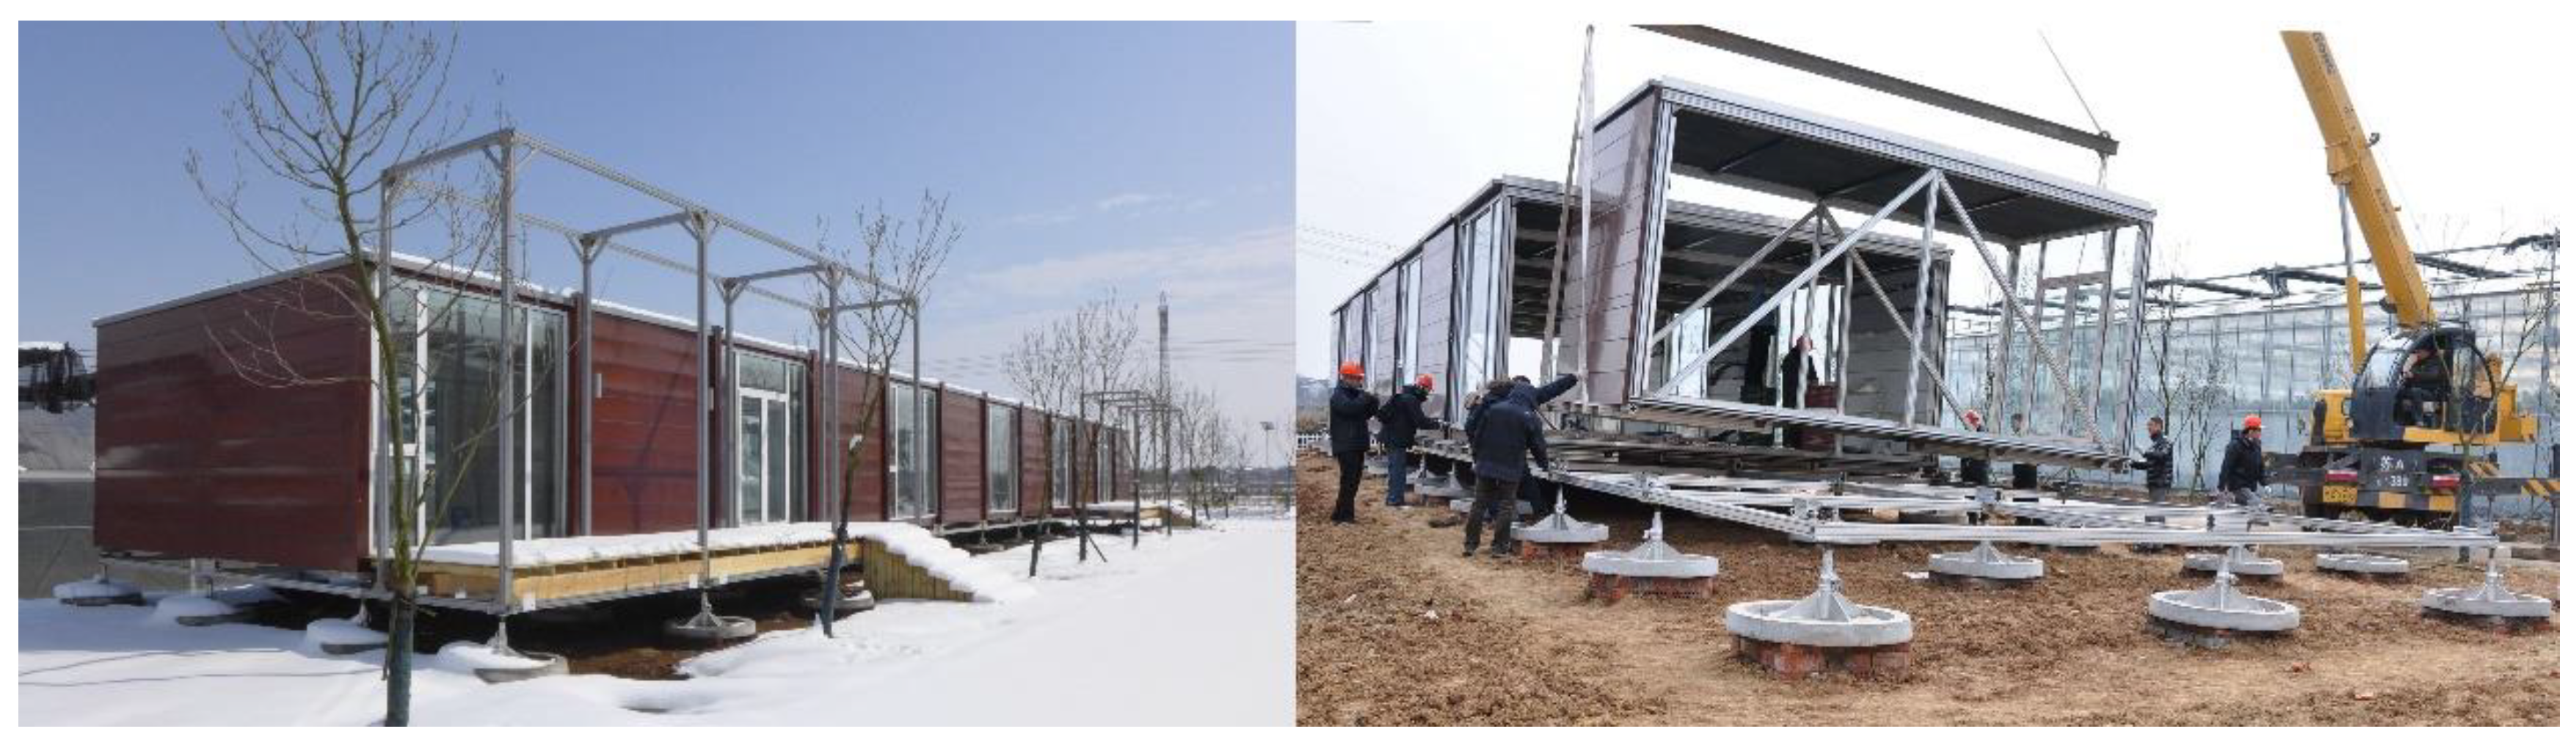
Since 2012, the author has been involved in the R&D of aluminum alloy modular building series carried out by the School of Architecture of Southeast University School of Architecture. This series uses aluminum alloy as the main building material, and utilizes modular design methods, factory manufacturing and assembly, and containerized logistics to preliminarily achieve the transformation from traditional architectural design and construction to manufacturing mode. By 2023, five generations of prototype products have been completed, with the second generation being the most typical, as shown in Figure 4.

Figure 4.
The second generation of aluminum alloy modular building.
The aluminum alloy modular building consists of three levels. The first level includes Structure, Enclosure, Interior decoration, and Equipment. The second and third levels are, respectively, the refinement of the previous level, such as Structure including Main structure and Subsidiary structure, and Main structure also including Main structural members and Structural connectors. The specific content and decomposition structure are shown in Figure 5.
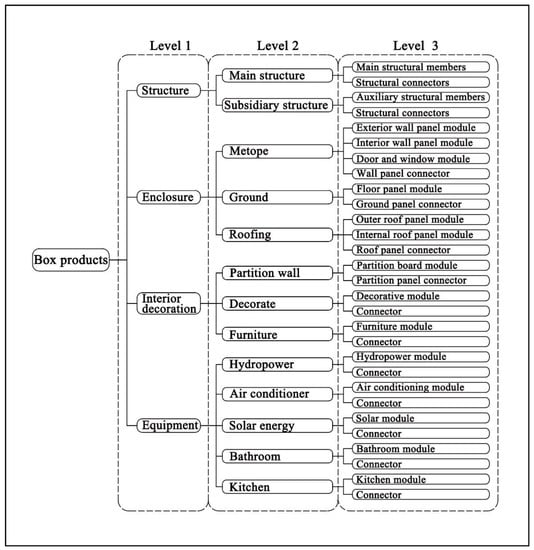
Figure 5.
Decomposition structure of aluminum alloy modular buildings.
The R&D process of aluminum alloy modular building also includes three levels. The first level consists of two parts: Design and Construction. In the second level, Design includes four stages: (1) Product definition and planning, (2) conceptual scheme design, (3) system-level design, and (4) construction design. Construction includes two stages: (1) prototype product construction and (2) product test. The third level is a further decomposition of each stage of the second level. The specific content and decomposition structure are shown in Figure 6.
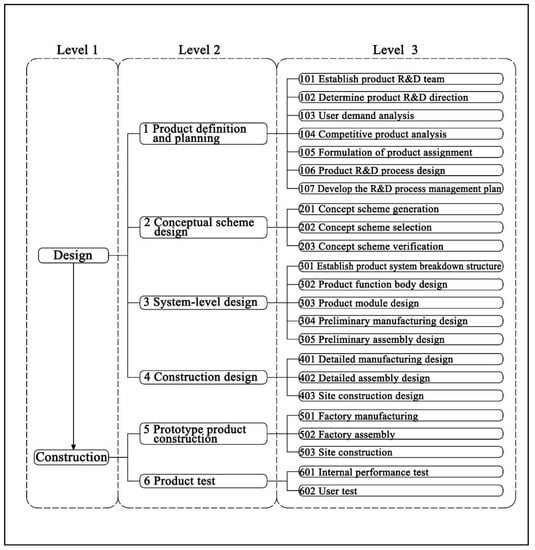
Figure 6.
Decomposition structure of the R&D process of aluminum alloy modular buildings.
4.2. Multiresolution Modeling of Modular Building Design Process Based on DSM
Combined with the decomposition structure of modular building R&D process and the design process optimization based on the DSM, the basic steps and methods of multi-resolution modeling of modular building design process are summarized.
Step 1: Generation of low-resolution binary DSM from design flow chart.
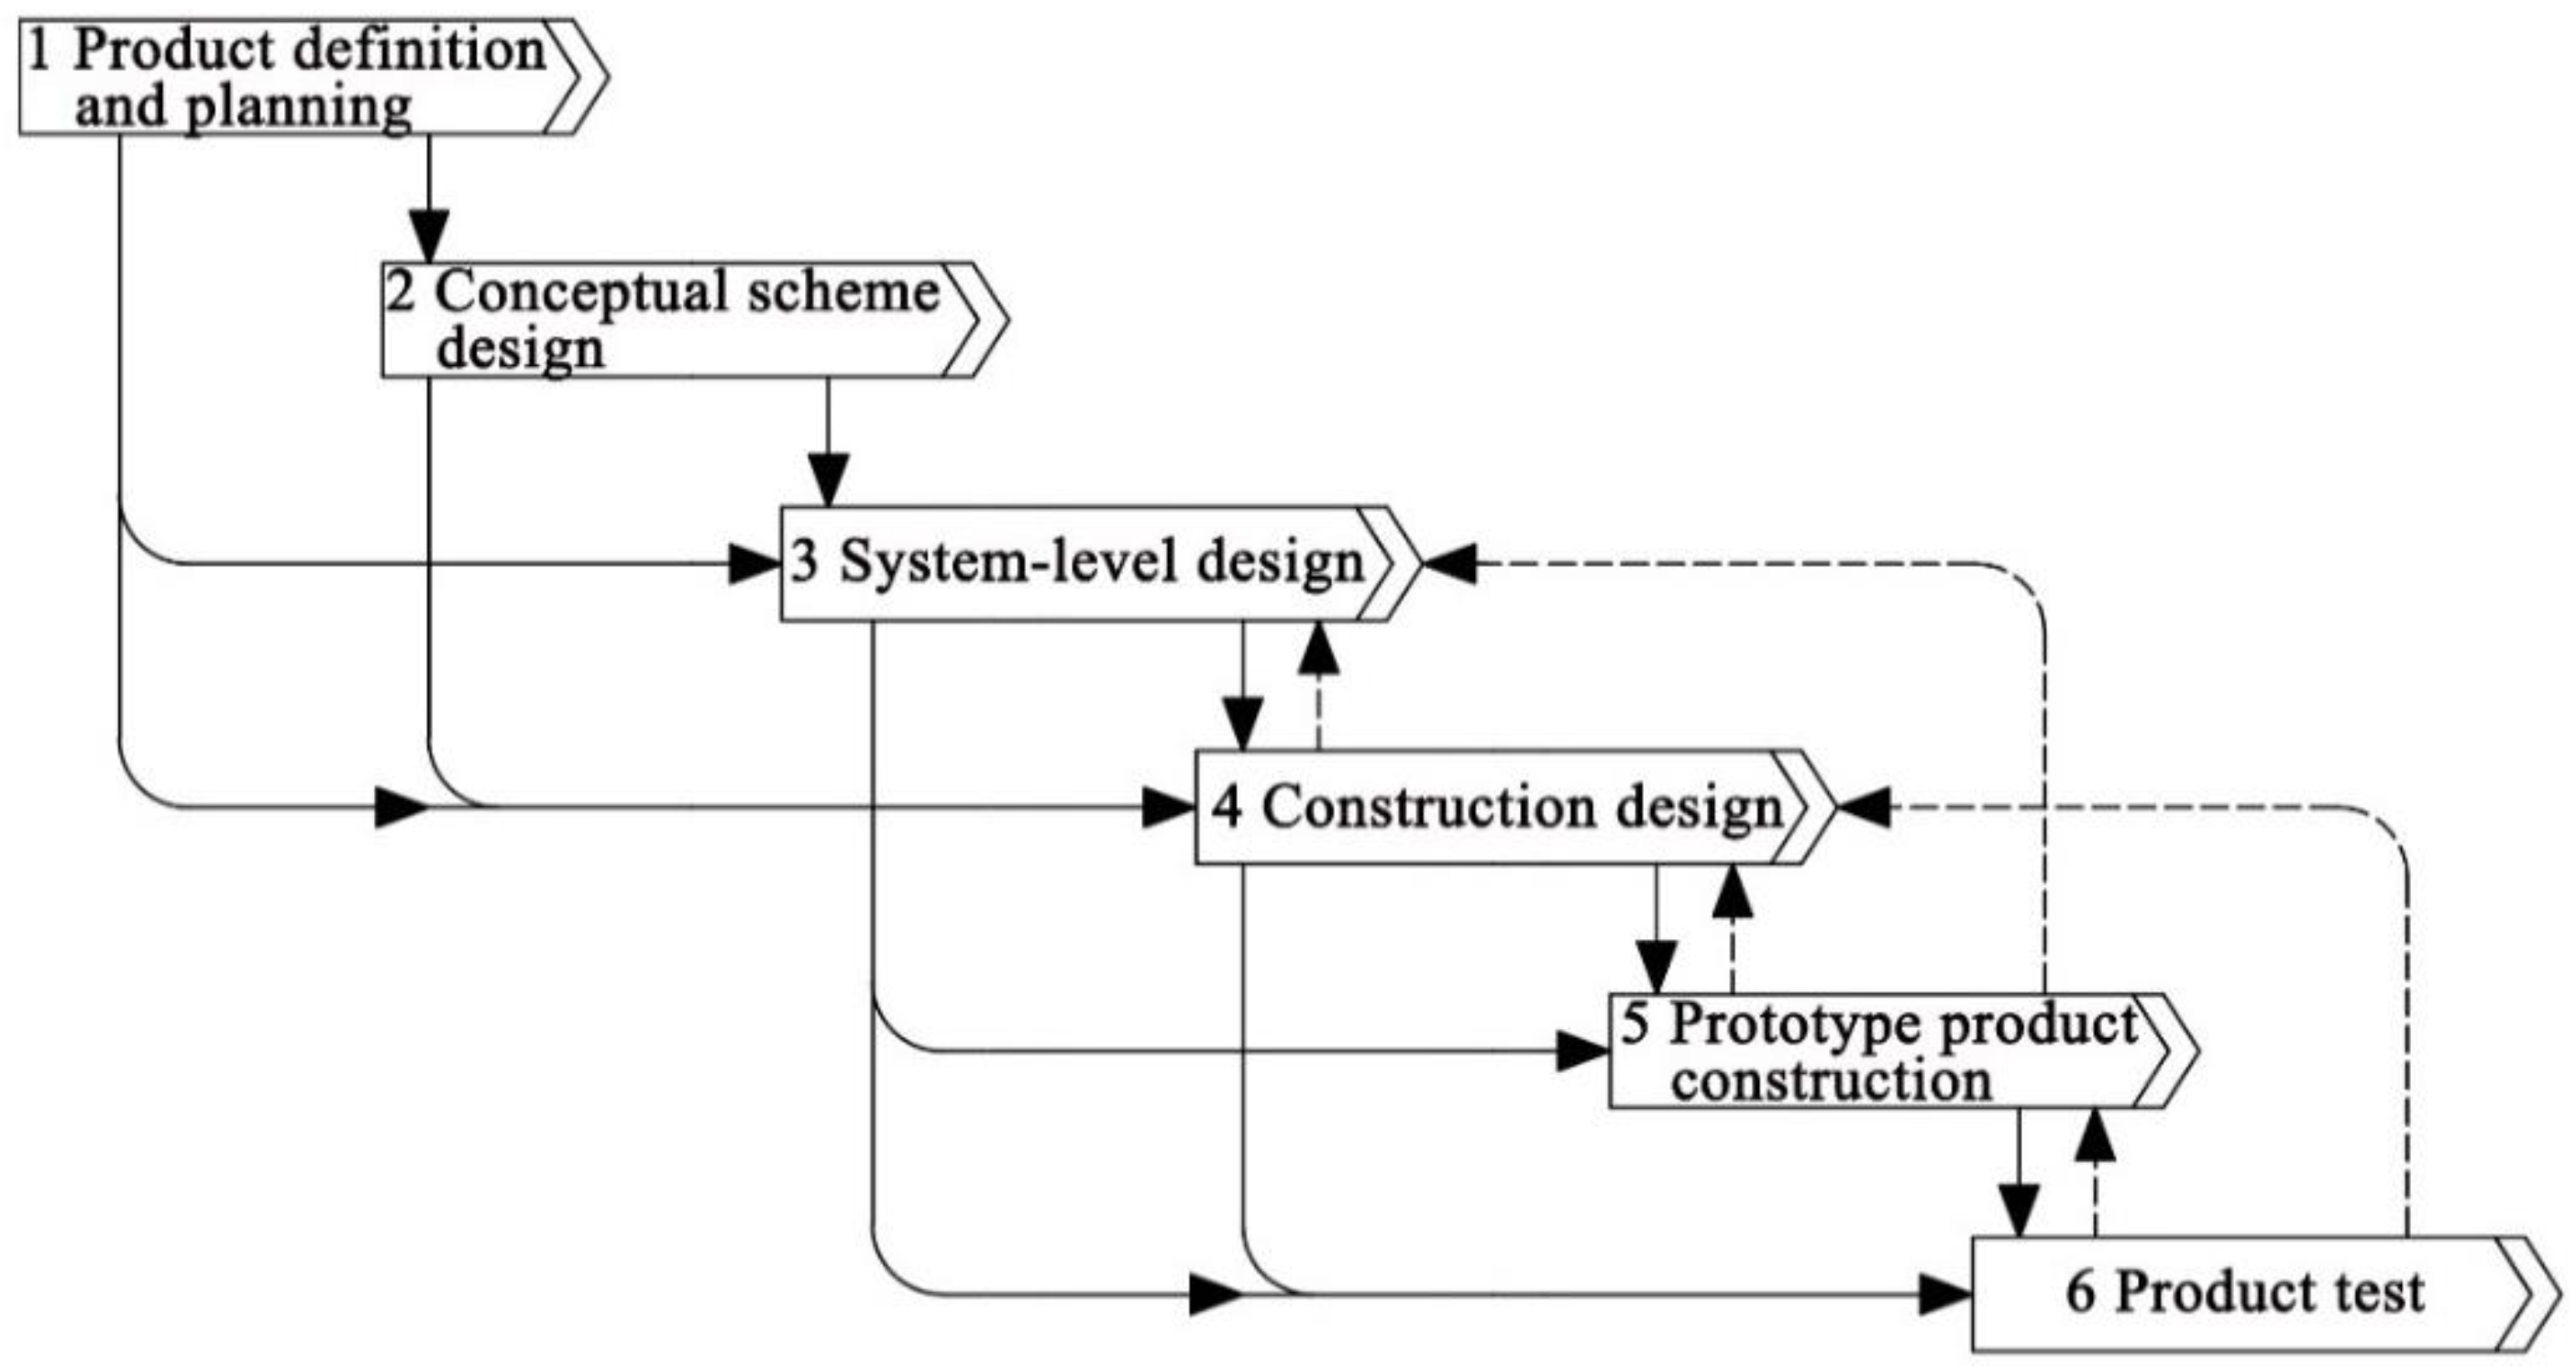
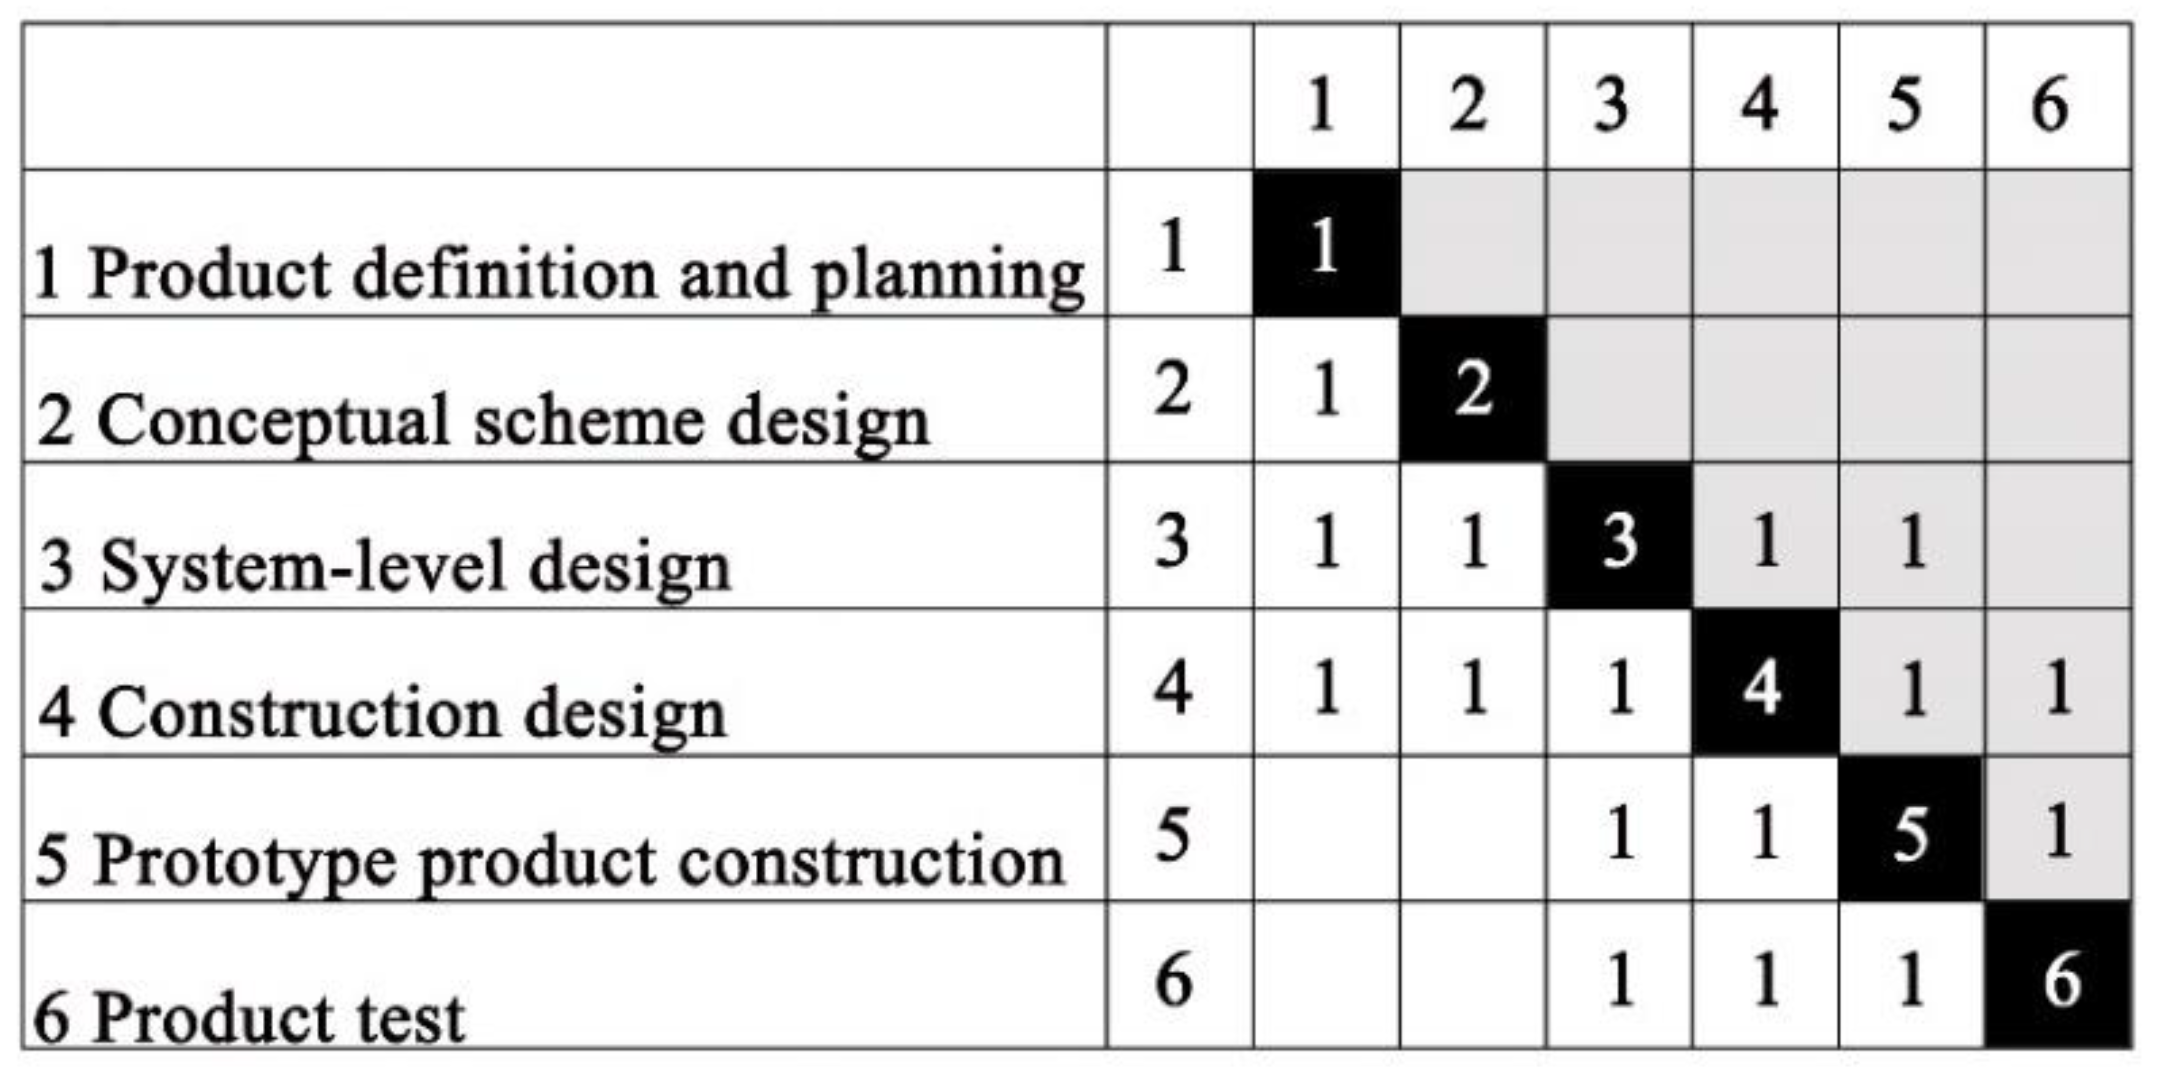
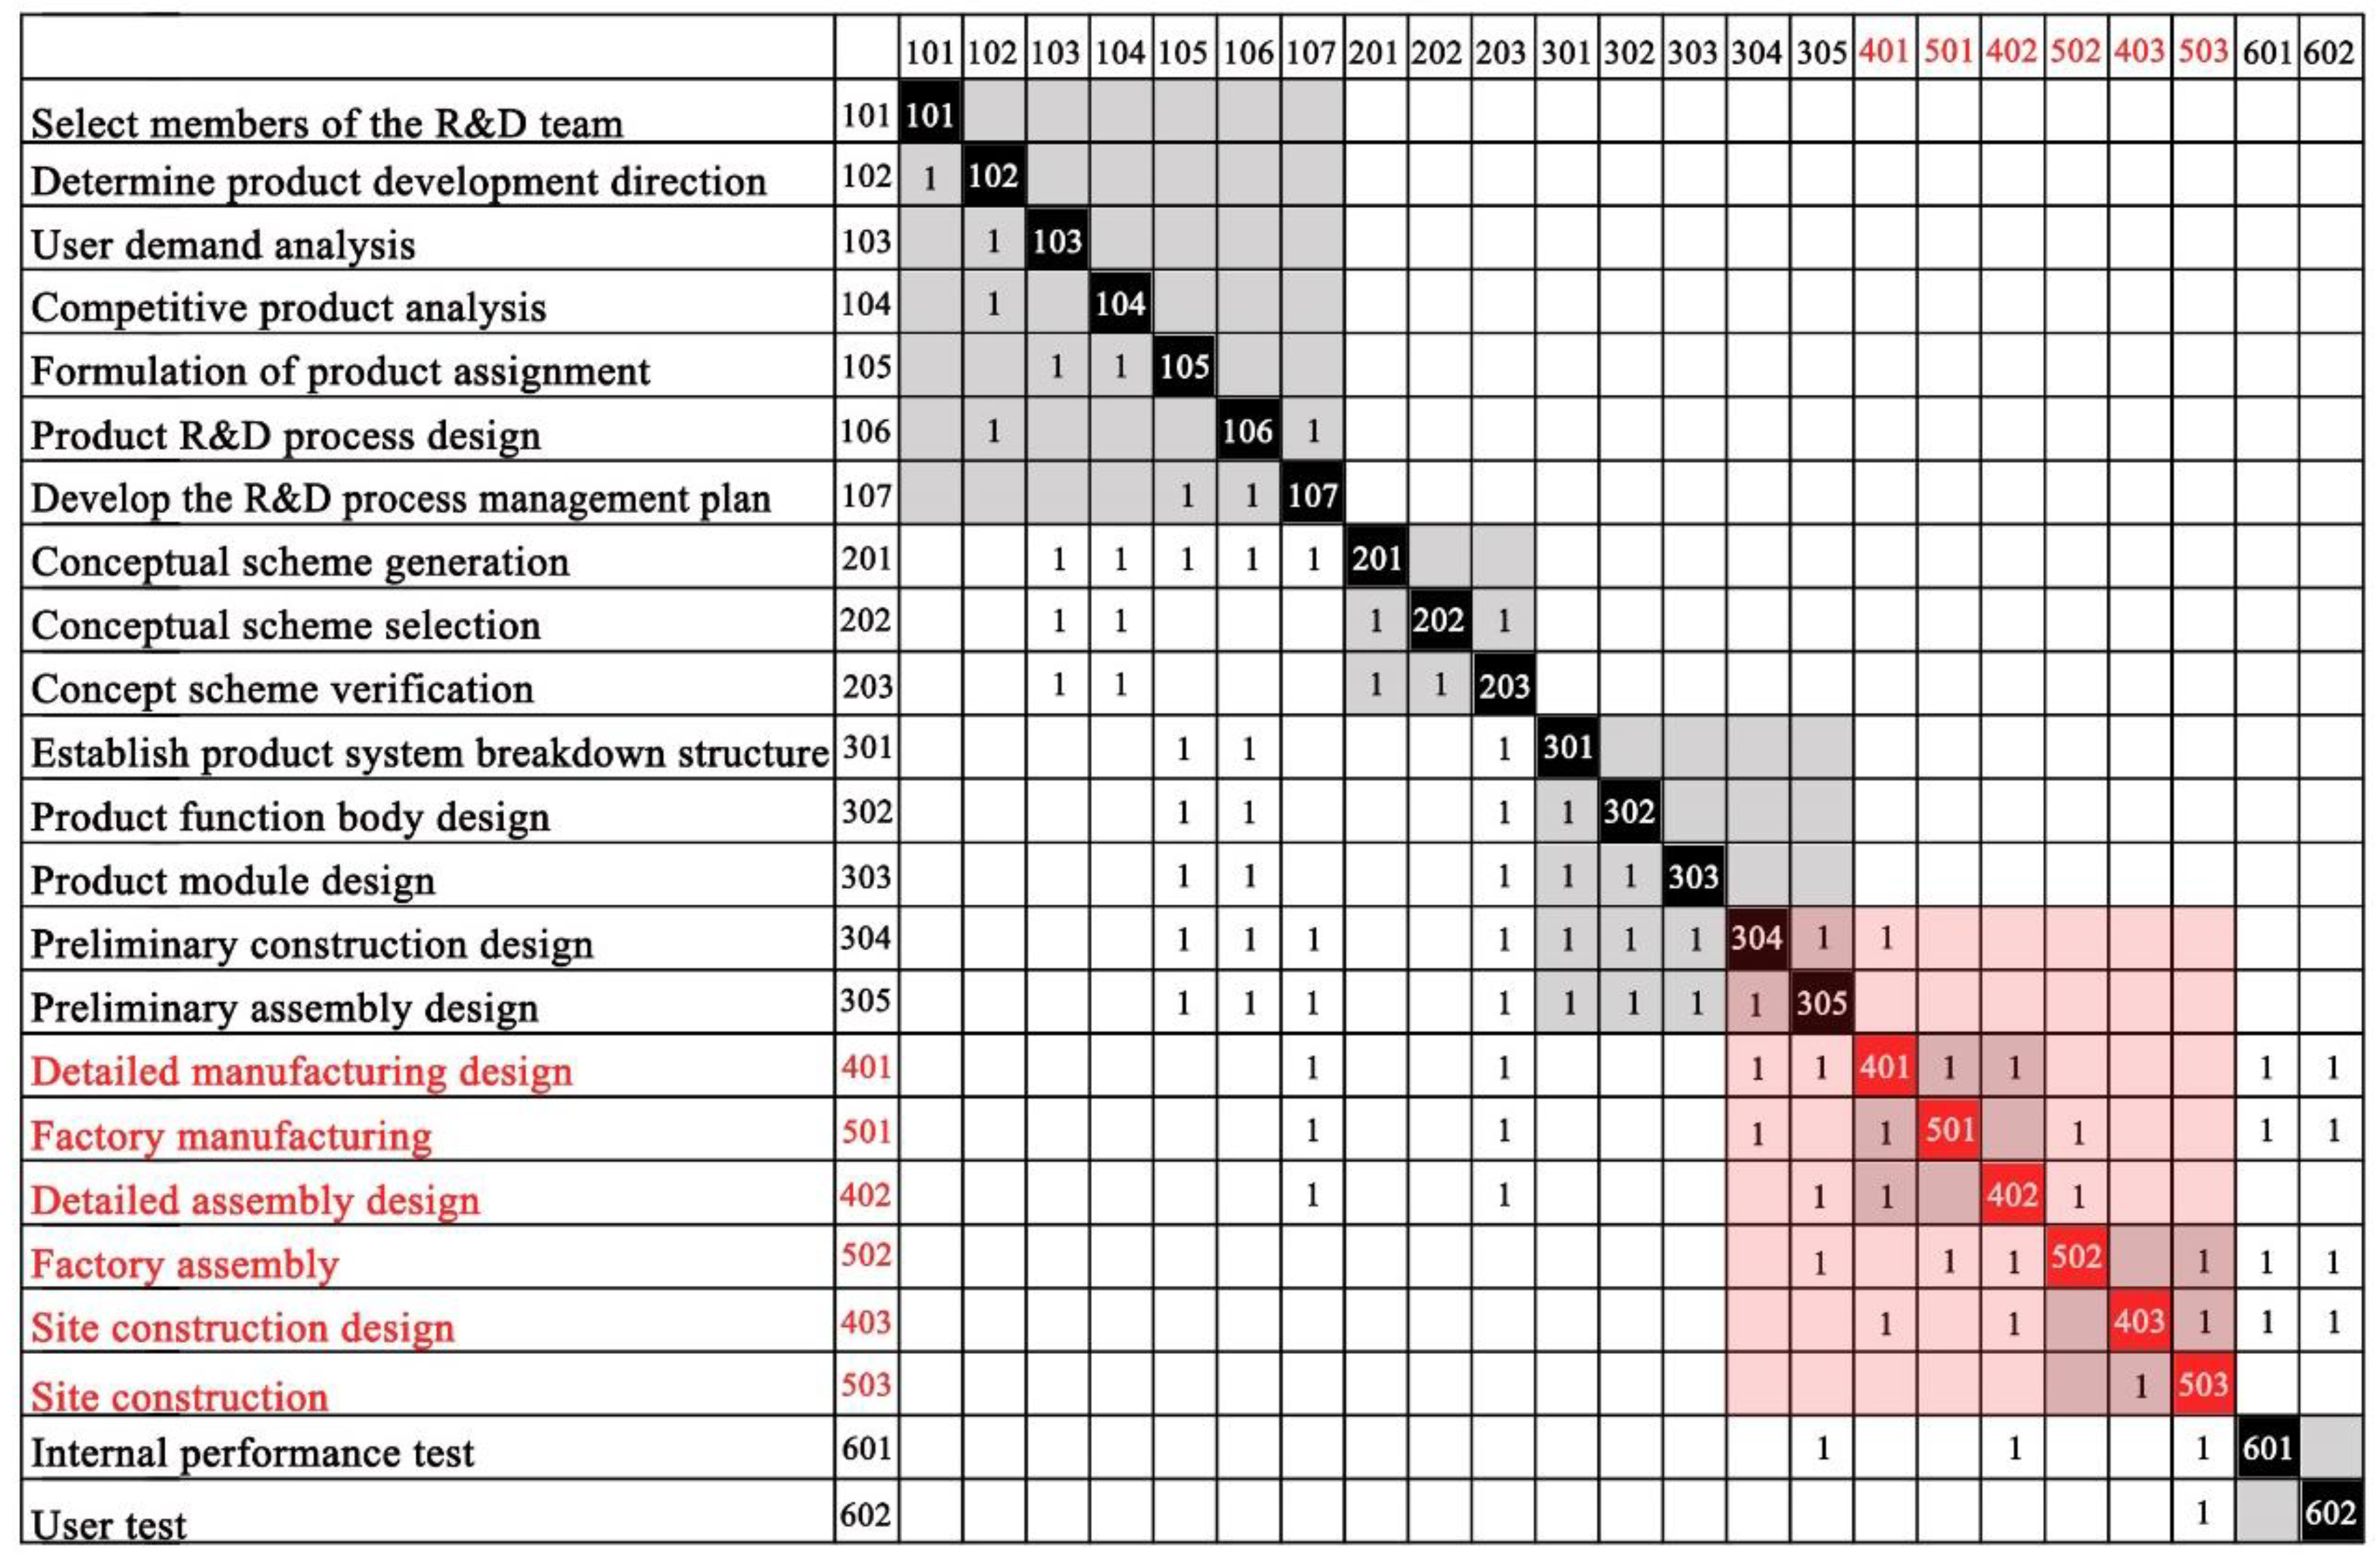
By analyzing the constraints and dependencies between R&D activities, a low-resolution binary DSM is generated based on the second level of R&D activities in the decomposition structure of the modular building R&D process. The generation method is to place the second level R&D activities on a diagonal line, and the information exchange between activities is represented by arrows and is represented by “1” in the matrix. The feedforward information (solid line) is located in the matrix below the diagonal line, and the feedback information (dashed line) is located in the matrix above the diagonal line, as shown in Figure 7. Then, the class matrix of the design flow diagram is converted into a complete binary DSM. The positions with information interaction are represented by “1”, and other positions are represented by “blank”, as shown in Figure 8.

Figure 7.
Class matrix representation of design flow diagram.
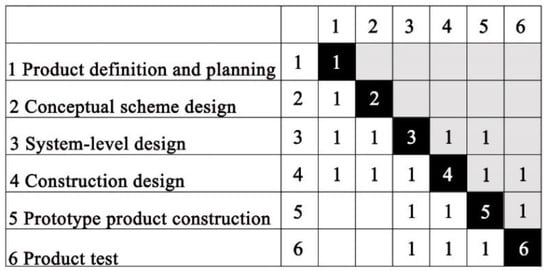
Figure 8.
Low-resolution binary DSM.
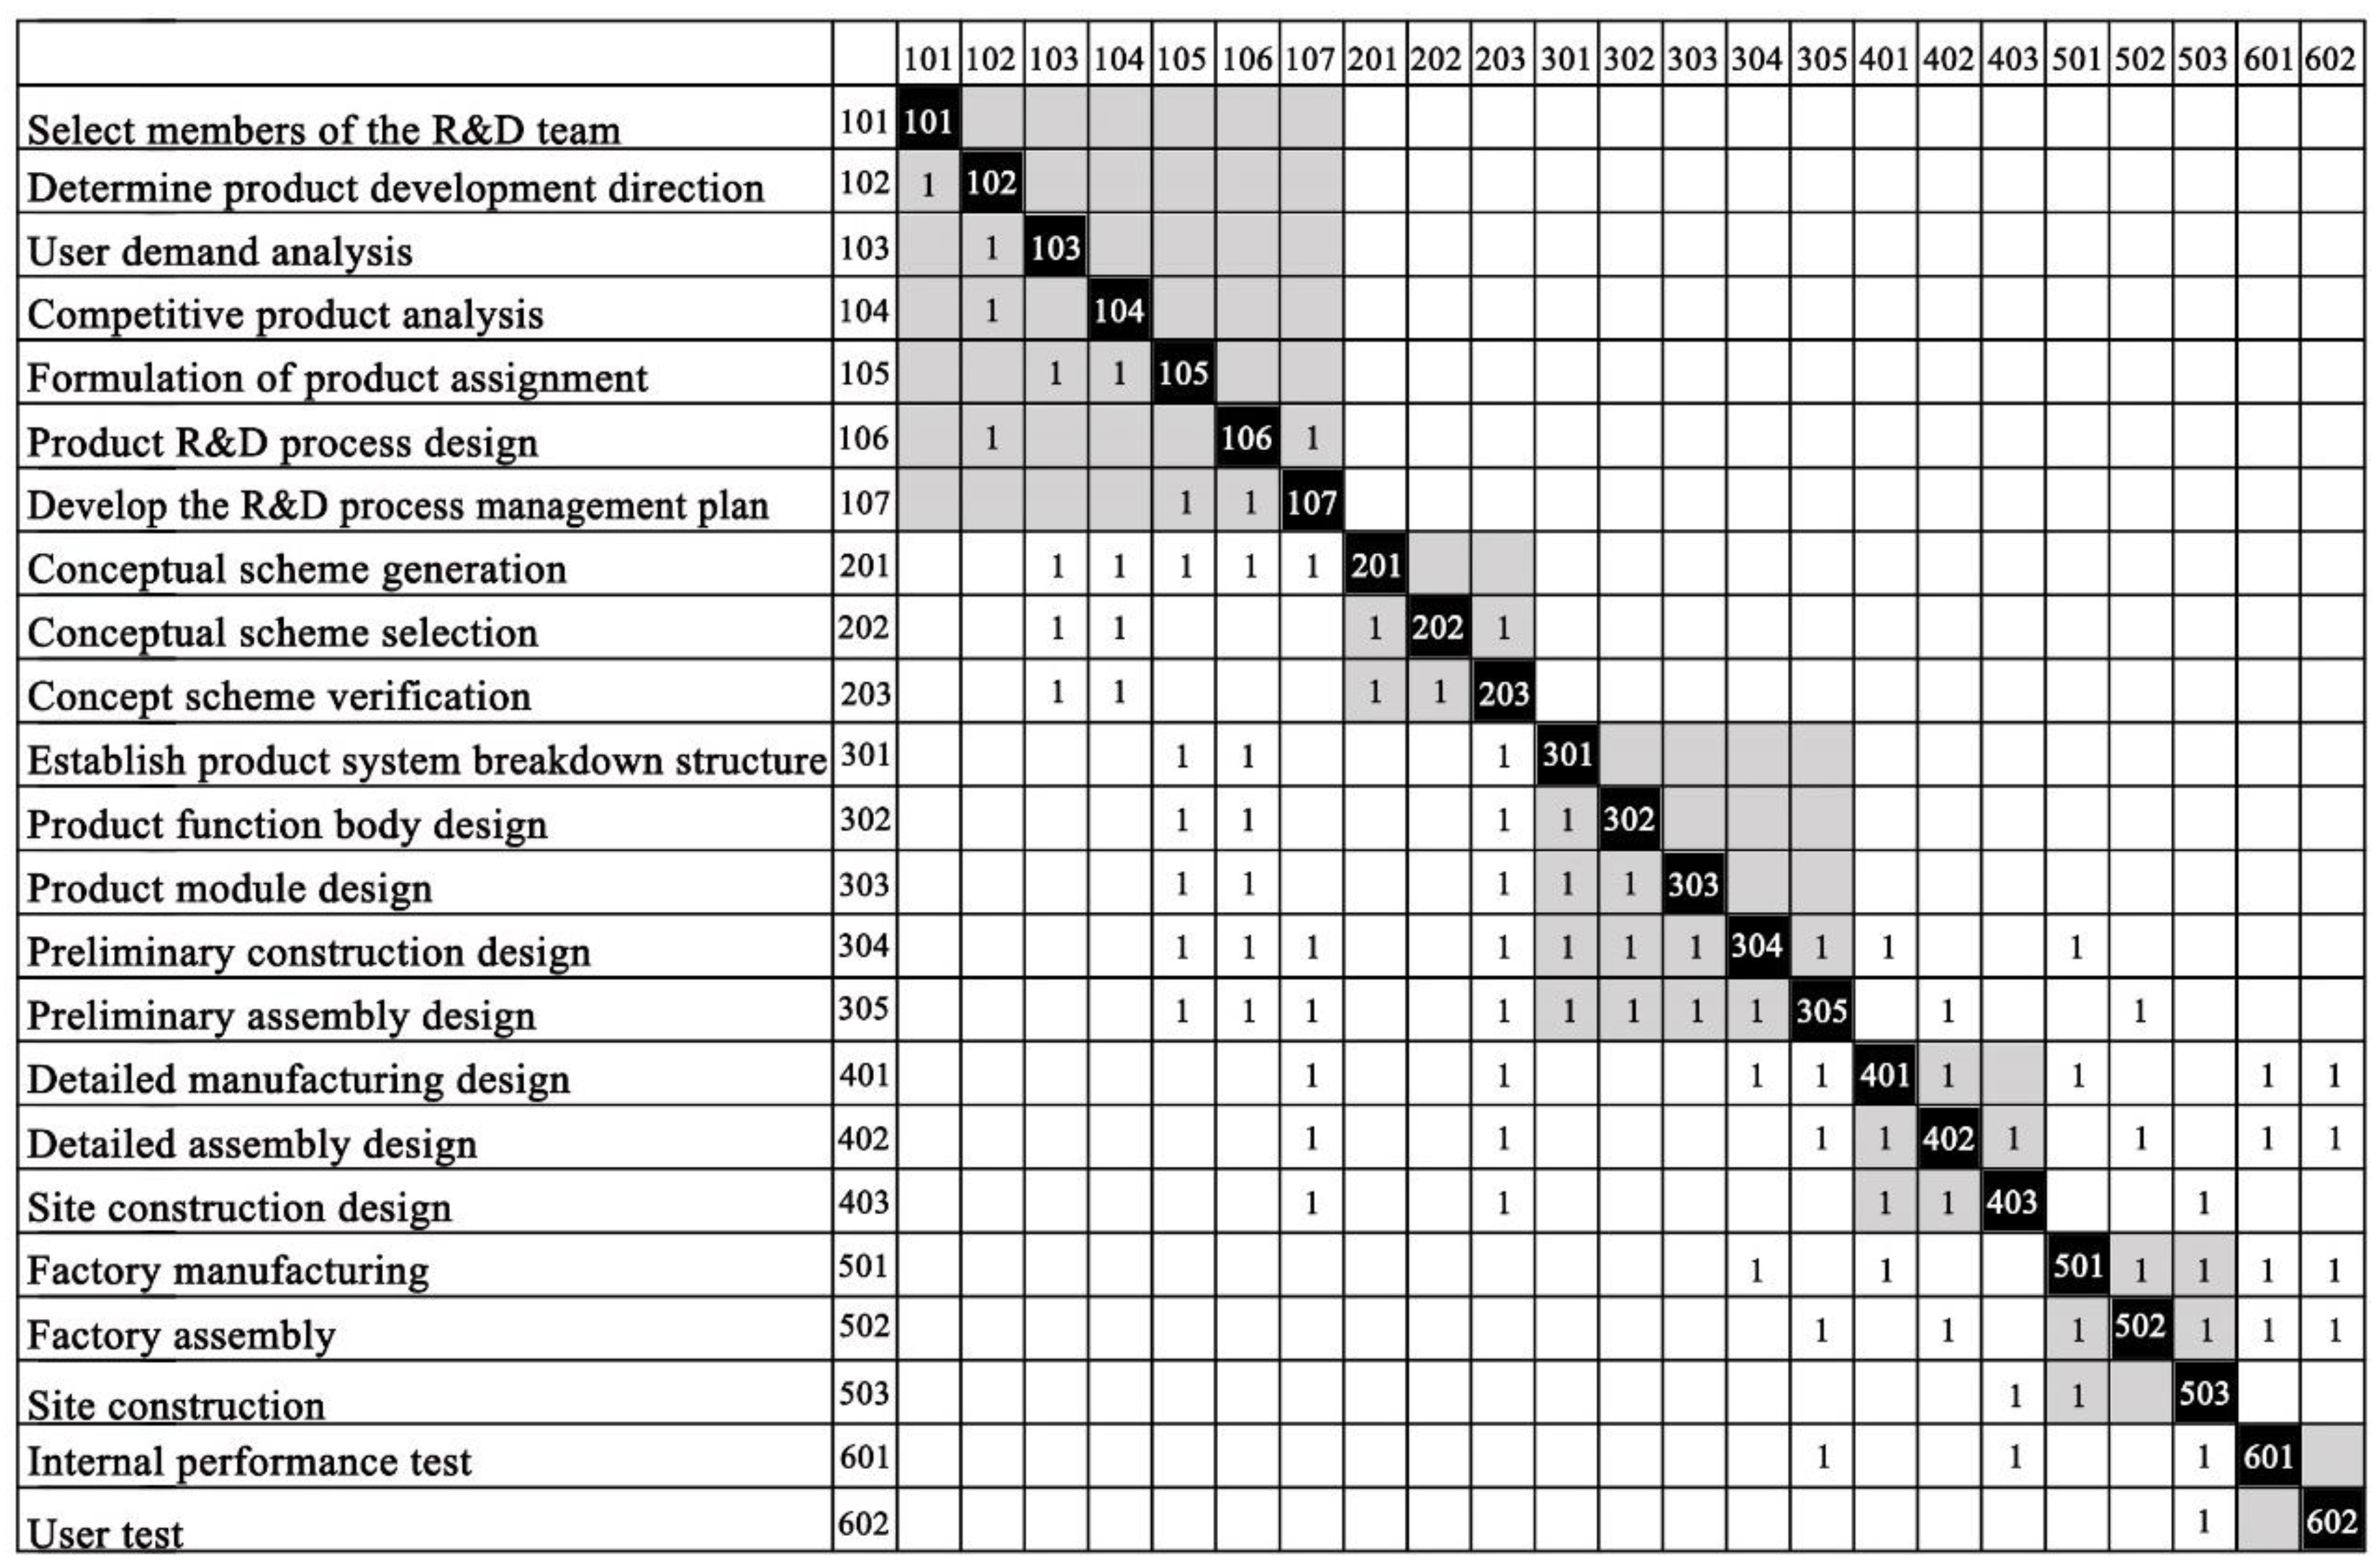
Step 2: Establish a high-resolution binary DSM through model disaggregation.
When improving the resolution of the model, the third level R&D activities in the R&D process of modular building are taken as the main body, each element in the low-resolution DSM are further decomposed and refined through information collection and confirmation of relevant knowledge in professional fields, and the elements of the low-resolution DSM are replaced and expanded with a higher resolution DSM, enhancing the level of detail in R&D activities, as shown in Figure 9.
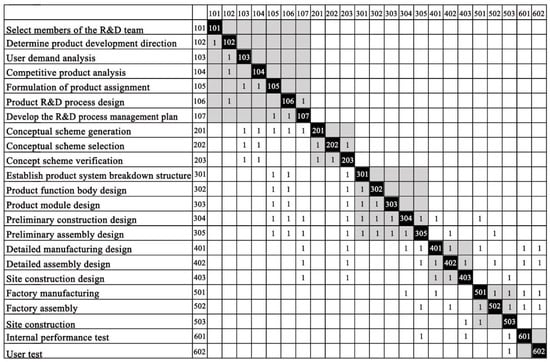
Figure 9.
High-resolution binary DSM.
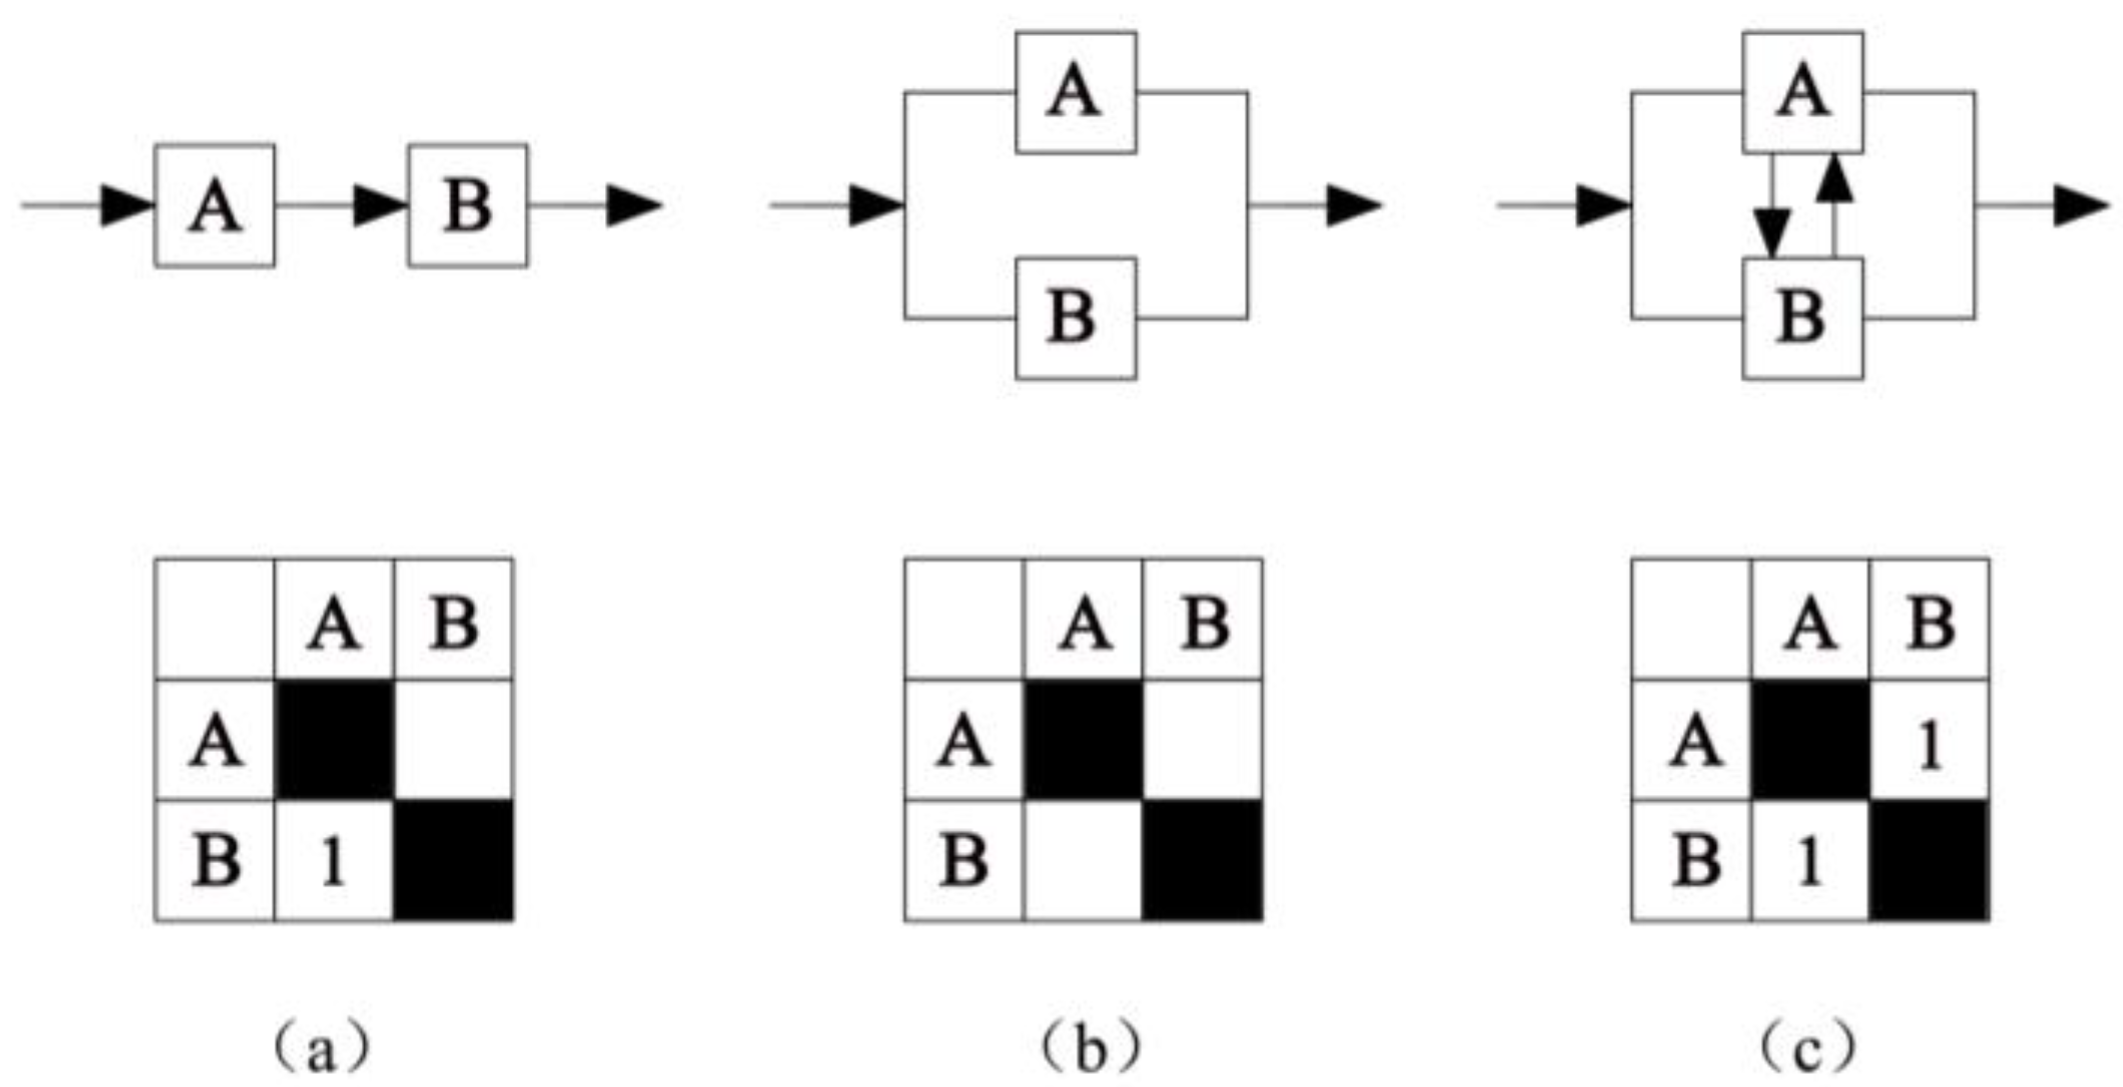
R&D activities can be divided into three categories based on their mutual information interaction and dependency, namely, serial relationships, parallel relationships, and coupling relationships, as shown in Figure 10.

Figure 10.
DSM dependencies between R&D activities. (a) Serial relationship (b) Parallel relationship (c) Coupling relationship.
Serial relationship refers to an activity that relies on another activity to input complete information before it can carry out its own activities. This information transfer is one-way. The corresponding DSM form is shown in Figure 10a. For example, activity 102/101.
Parallel relationship refers to the fact that R&D activities do not affect each other, do not require information exchange, and each activity can be executed independently. The corresponding DSM form is shown in Figure 10b. For example, activities 104/103.
Coupling relationship refers to the interdependence of R&D activities, where both parties require information input from each other to execute, and R&D activities require multiple iterations and feedback to complete. The corresponding DSM form is shown in Figure 10c. For example, activities 106/107.
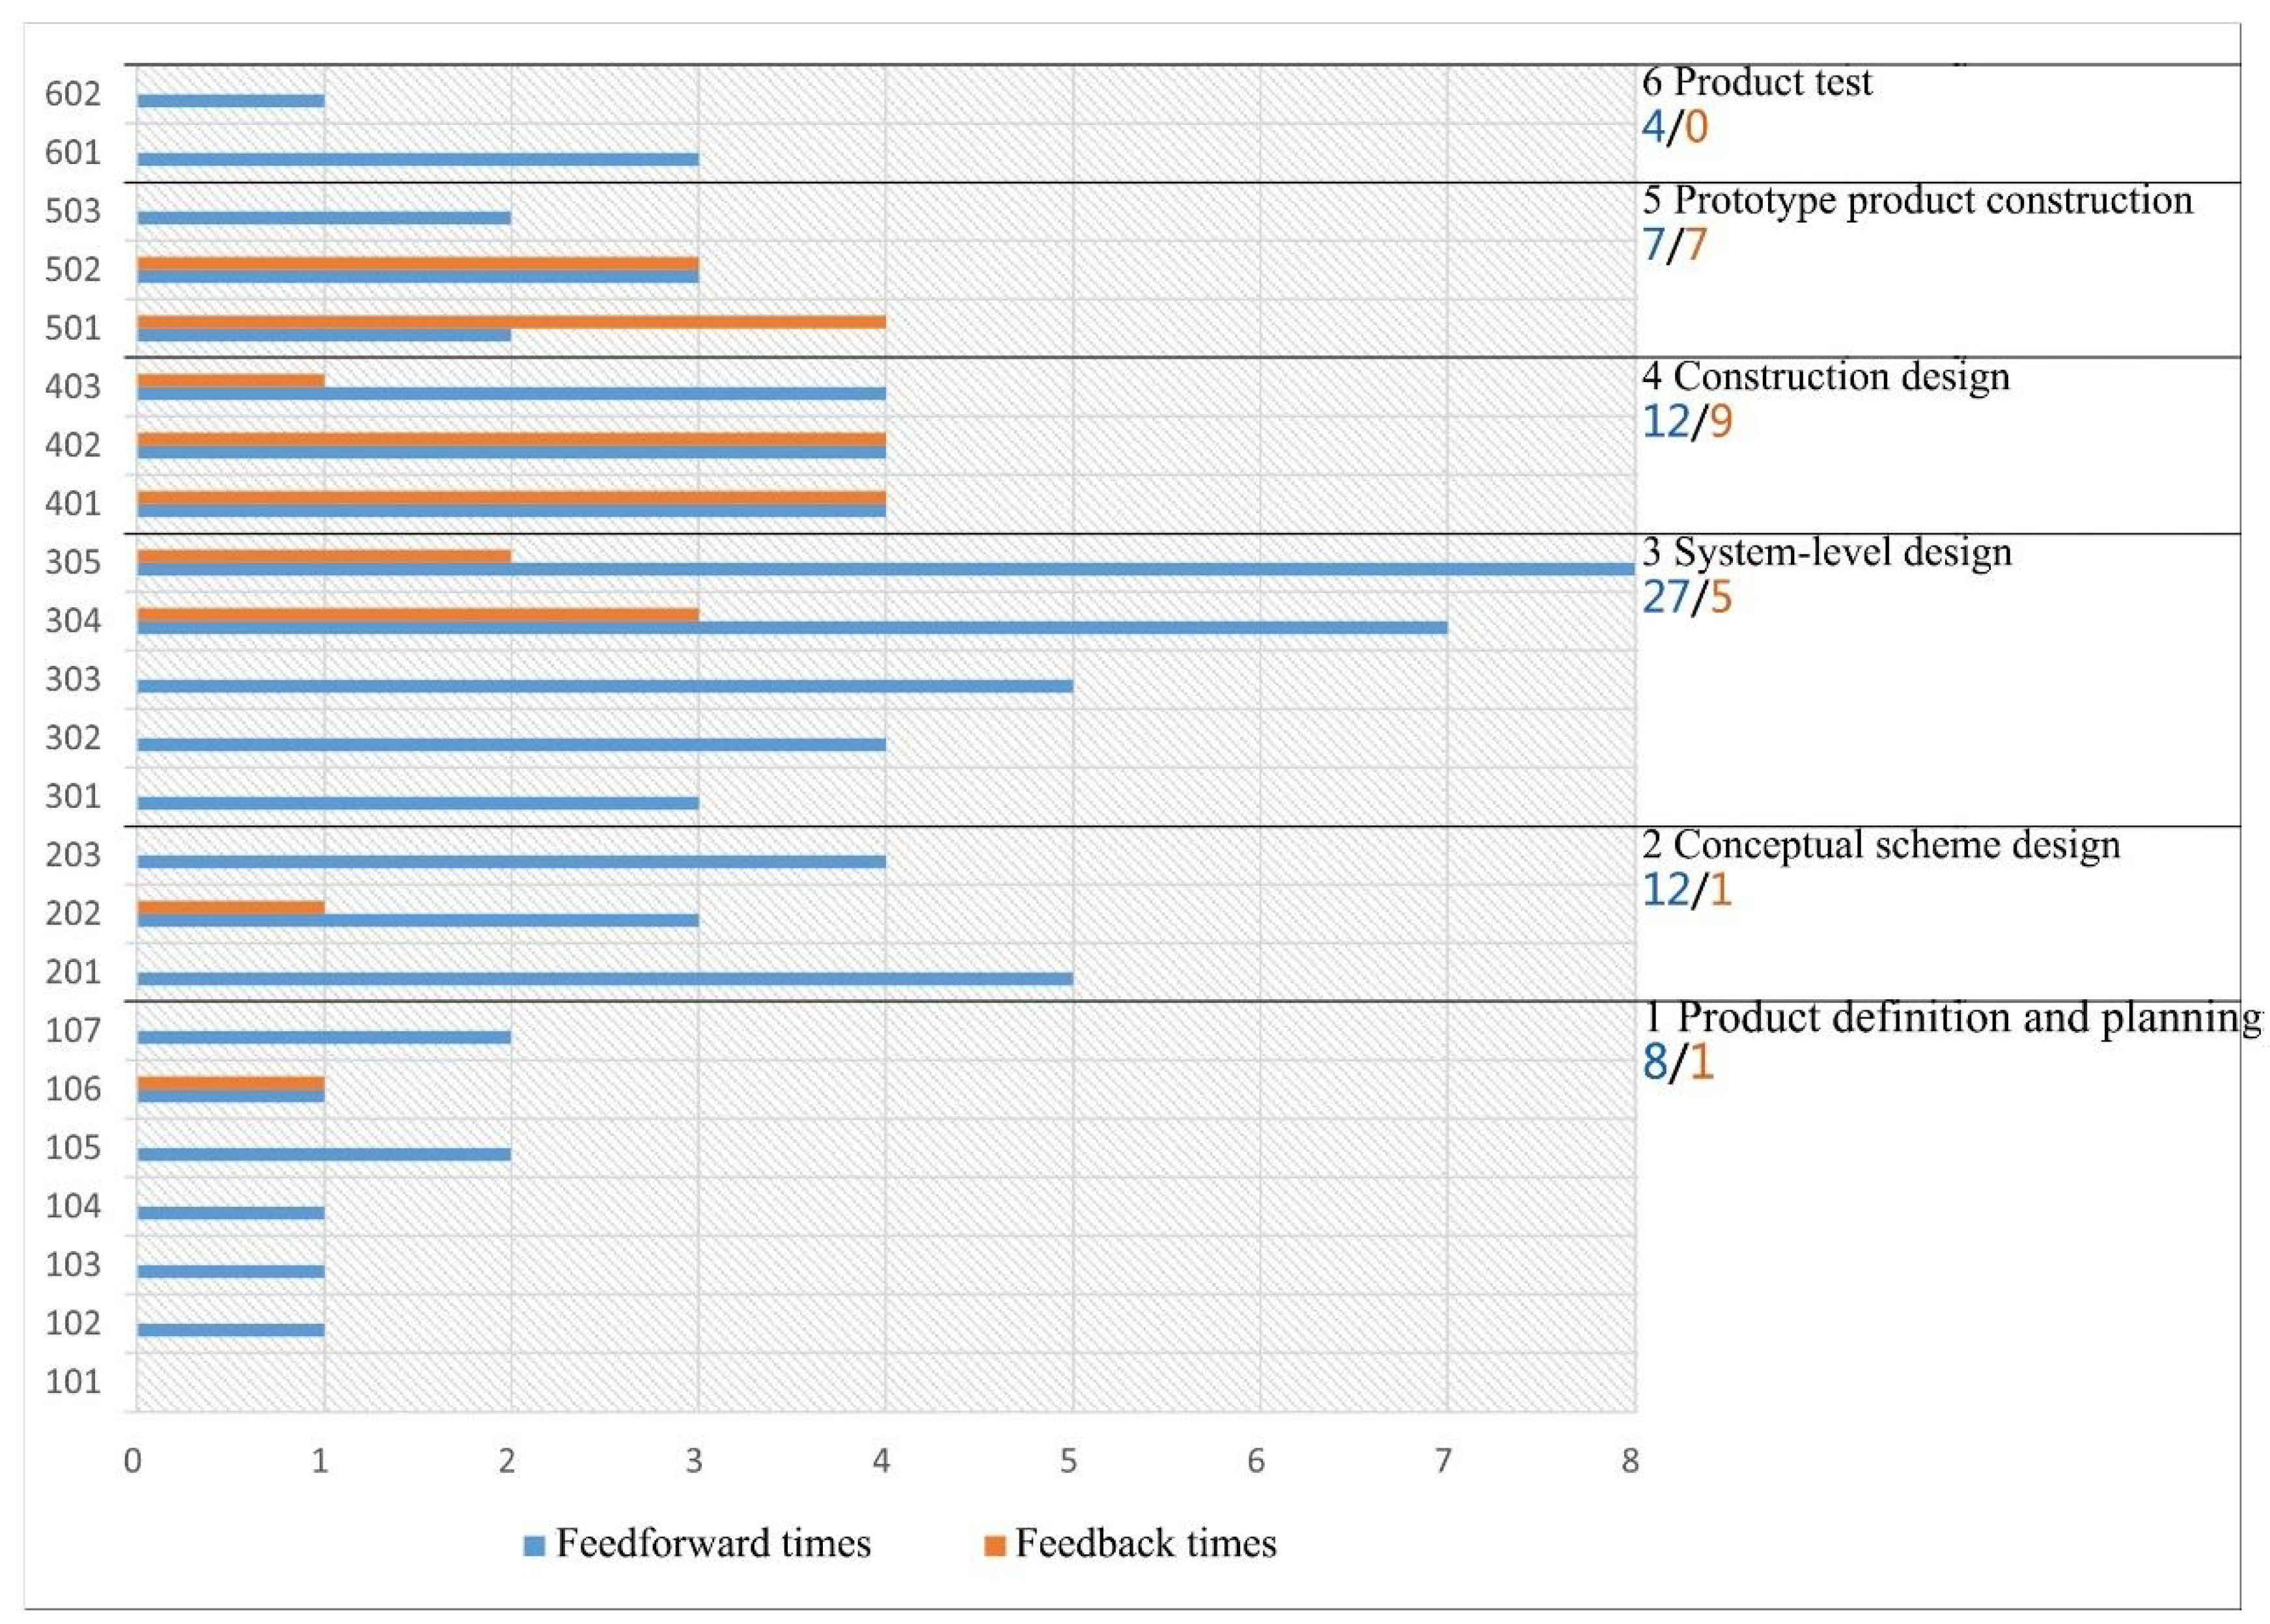
As shown in Figure 11, blue indicates the number of feedforward information for R&D activities, and red indicates the number of feedback information. There are 93 information interaction points in total, including 70 feedforward information times and 23 feedback information times. From the table, it can be found that the “3. System-level design” stage has the highest number of information interactions. It is a highly detailed and heavy workload component of product design. The frequency of feedforward and feedback information for “4. Construction design” and “5. Prototype product construction” is very close, and they are parts of product design that require repeated adjustment and iterative optimization. From this point of view, greater attention should be paid to these two stages, and consideration should be given to being comprehensive and prudent to avoid causing more rework and resource waste.
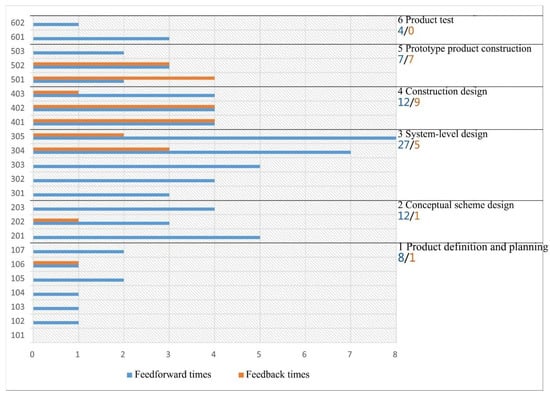
Figure 11.
Summary of DSM information interaction.
Step 3: Optimize the design process based on the high-resolution binary DSM.
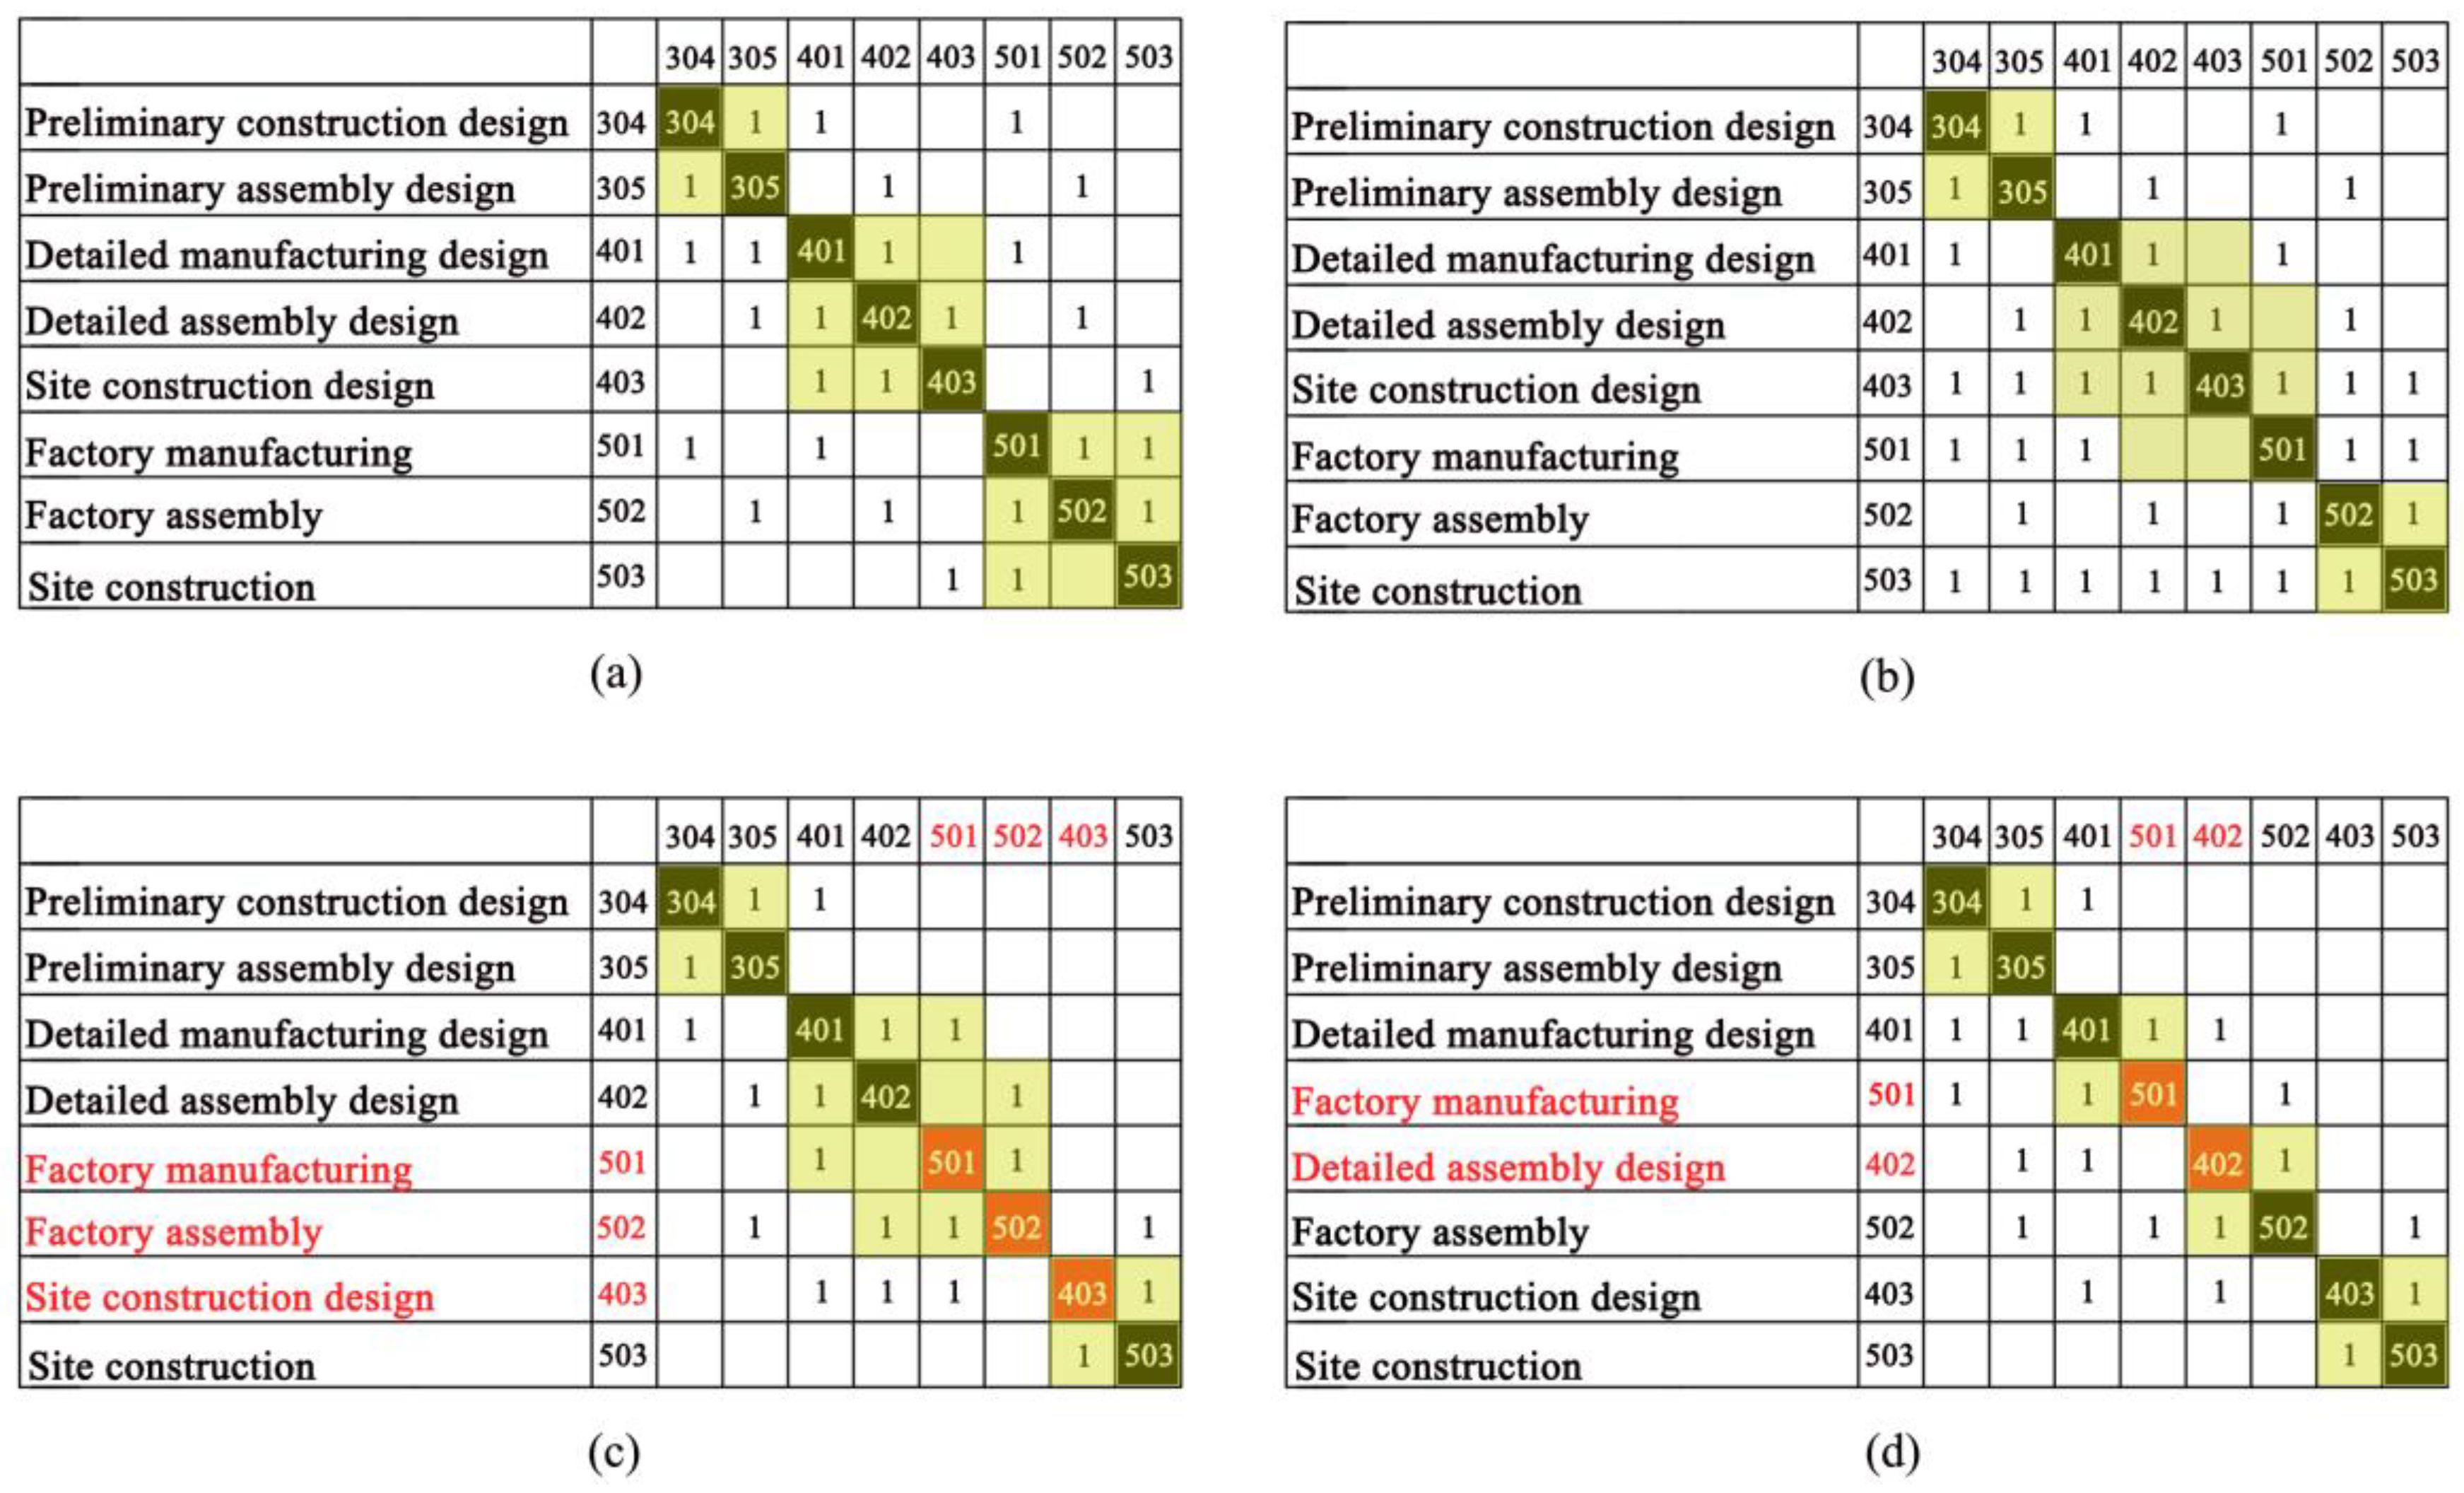
For the established high-resolution binary DSM, the partitioning algorithm and tearing algorithm are used to reorder R&D activities, obtain the optimized dependency relationship between R&D activities, establish a reasonable execution sequence of R&D activities, and transform the large-scale coupling and iteration relationship between R&D activities into a small-scale coupling parallel relationship, as shown in Figure 12.
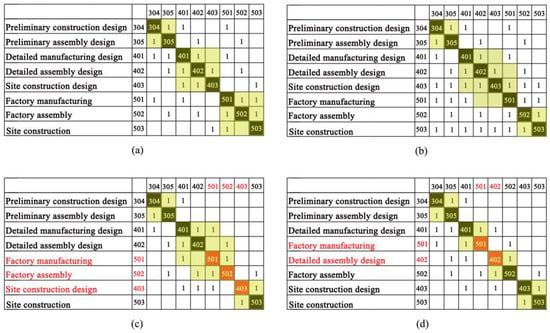
Figure 12.
Design process optimization based on high-resolution binary DSM. (a) Original coupling matrix (b) Coupling matrix after power operation (partitioning algorithm step 1) (c) Coupling matrix after normalization operation (partitioning algorithm step 2) (d) Coupling matrix after splitting algorithm.
From Figure 12a–d, complex and large-scale coupling relationships (401/402/403 and 501/502/503) are controlled locally and within a small range (401/501,402/502 and 403/503) through analytical calculations. The results of matrix optimization confirm that the design of modular buildings needs to be oriented towards both “Design” and “Construction”, emphasizing the use of “construction-oriented” design methods in the early stages of R&D, paying attention to the later stages of “501 Factory manufacturing”, “502 Factory assembly”, and “503 Site construction”, and conducting concurrent and integrated design. Ultimately, the goal is to reduce the coupling between R&D activities, reduce rework, and shorten the R&D and construction cycle.
Step 4: Establish design process models with different resolutions.
After completing the optimization of the R&D process for modular buildings, the optimized and restructured high-resolution DSM is obtained, as shown in Figure 13. On this basis, design process models with different resolutions are formed.
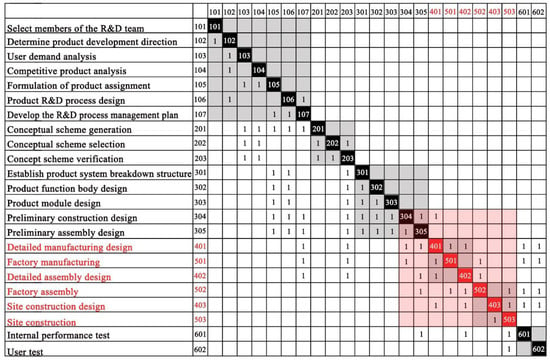
Figure 13.
High-resolution binary DSM for optimized recombination.
5. Model Simulation and Result Analysis
Taking aluminum alloy modular building as an example, the schedule and cost risks of the design process were studied through simulation, and the simulation results of different resolution models were compared and analyzed.
5.1. Example Data of Aluminum Alloy Modular Buildings
The time and cost data for various R&D activities in the design process of aluminum alloy modular buildings are shown in Table 1. This article uses the triangular distribution random number composed of the most optimistic time to, the most likely time tm, and the most pessimistic time tp to describe the uncertainty of the R&D activity time. The probability distribution function is shown in the Formulas (10) and (11):

Table 1.
Time and cost of various R&D activities in the design process of aluminum alloy modular buildings.
The R&D activity cost consists of three parts: the one-time fixed cost Cf, the labor cost per unit time Cm, and the variable cost Cv:
C = Cf + (Cm + Cv) t
5.2. Simulation Results and Analysis
5.2.1. Comparative Analysis of Schedule and Cost for Models with Different Resolutions
The distribution of simulation results for schedule and cost of different resolution models (low-resolution, high-resolution, and high-resolution optimization) is shown in Figure 14. The statistics of model simulation results are shown in Table 2 and Table 3.
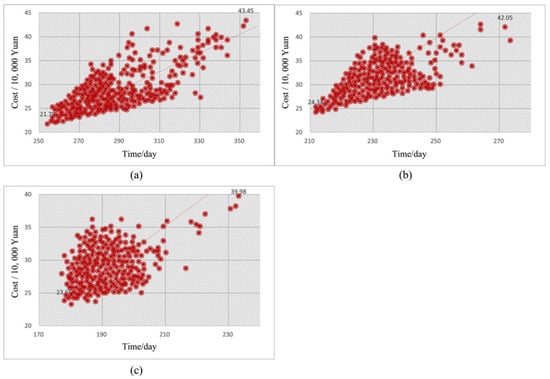
Figure 14.
Simulation results of schedule and cost in the design process of aluminum alloy modular buildings. (a) Low-resolution DSM (b) High-resolution DSM (c) High-resolution DSM optimization.
Table 2.
Schedule statistics of different resolution models (Unit: days).
Table 3.
Cost statistics of different resolution models (Unit: 10,000 Yuan).
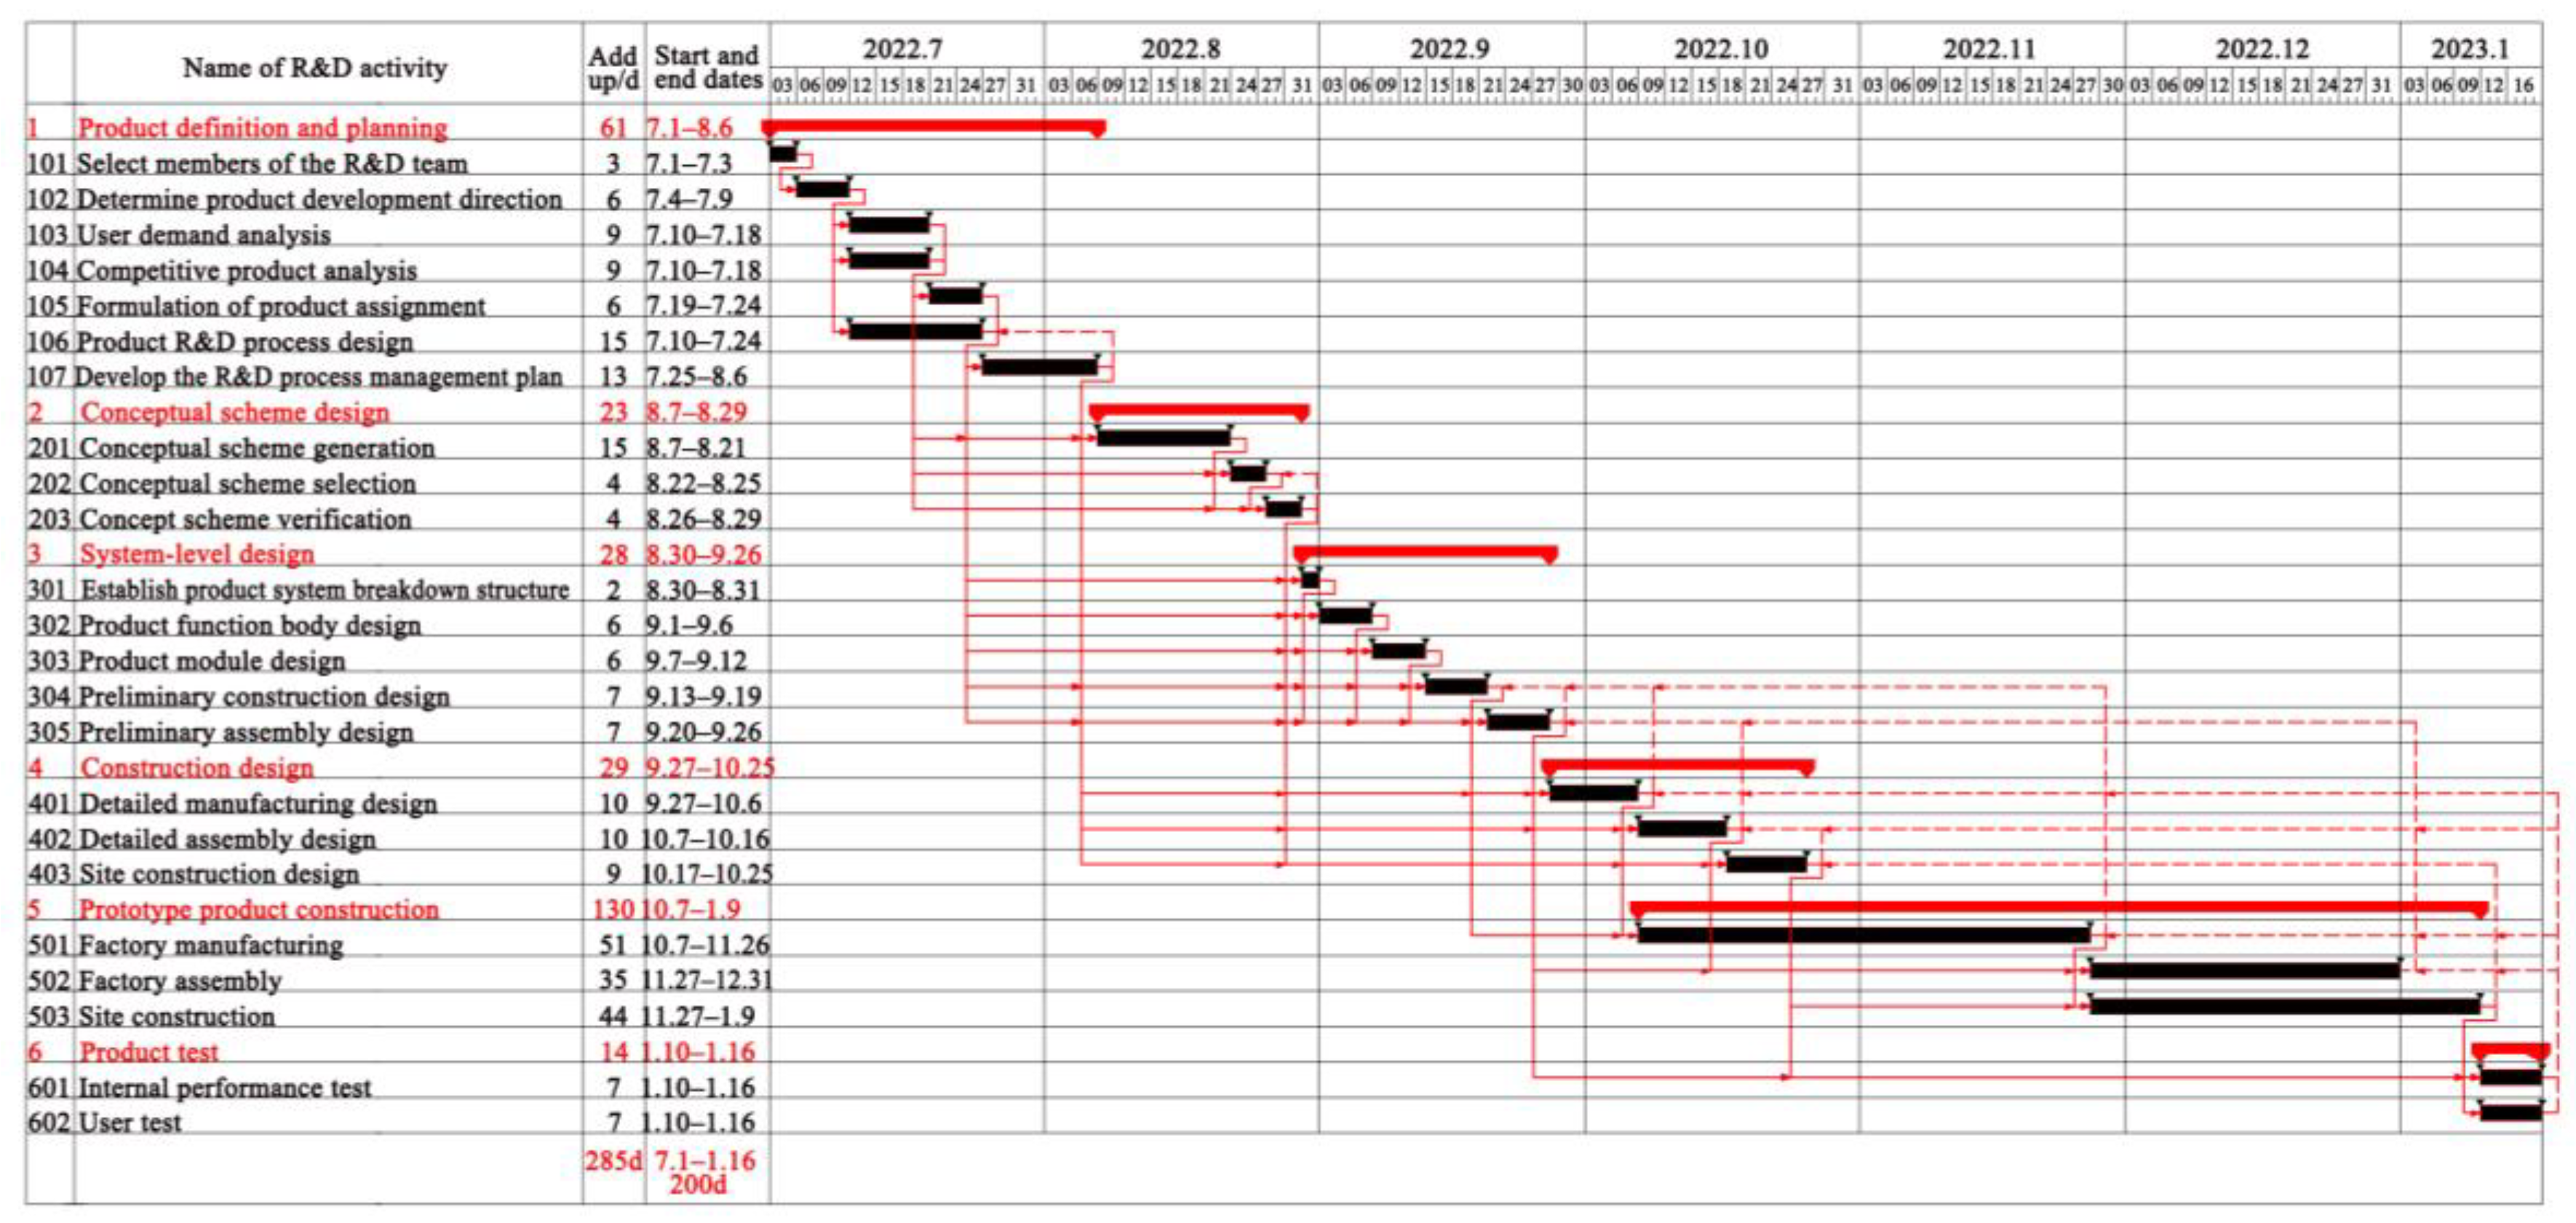
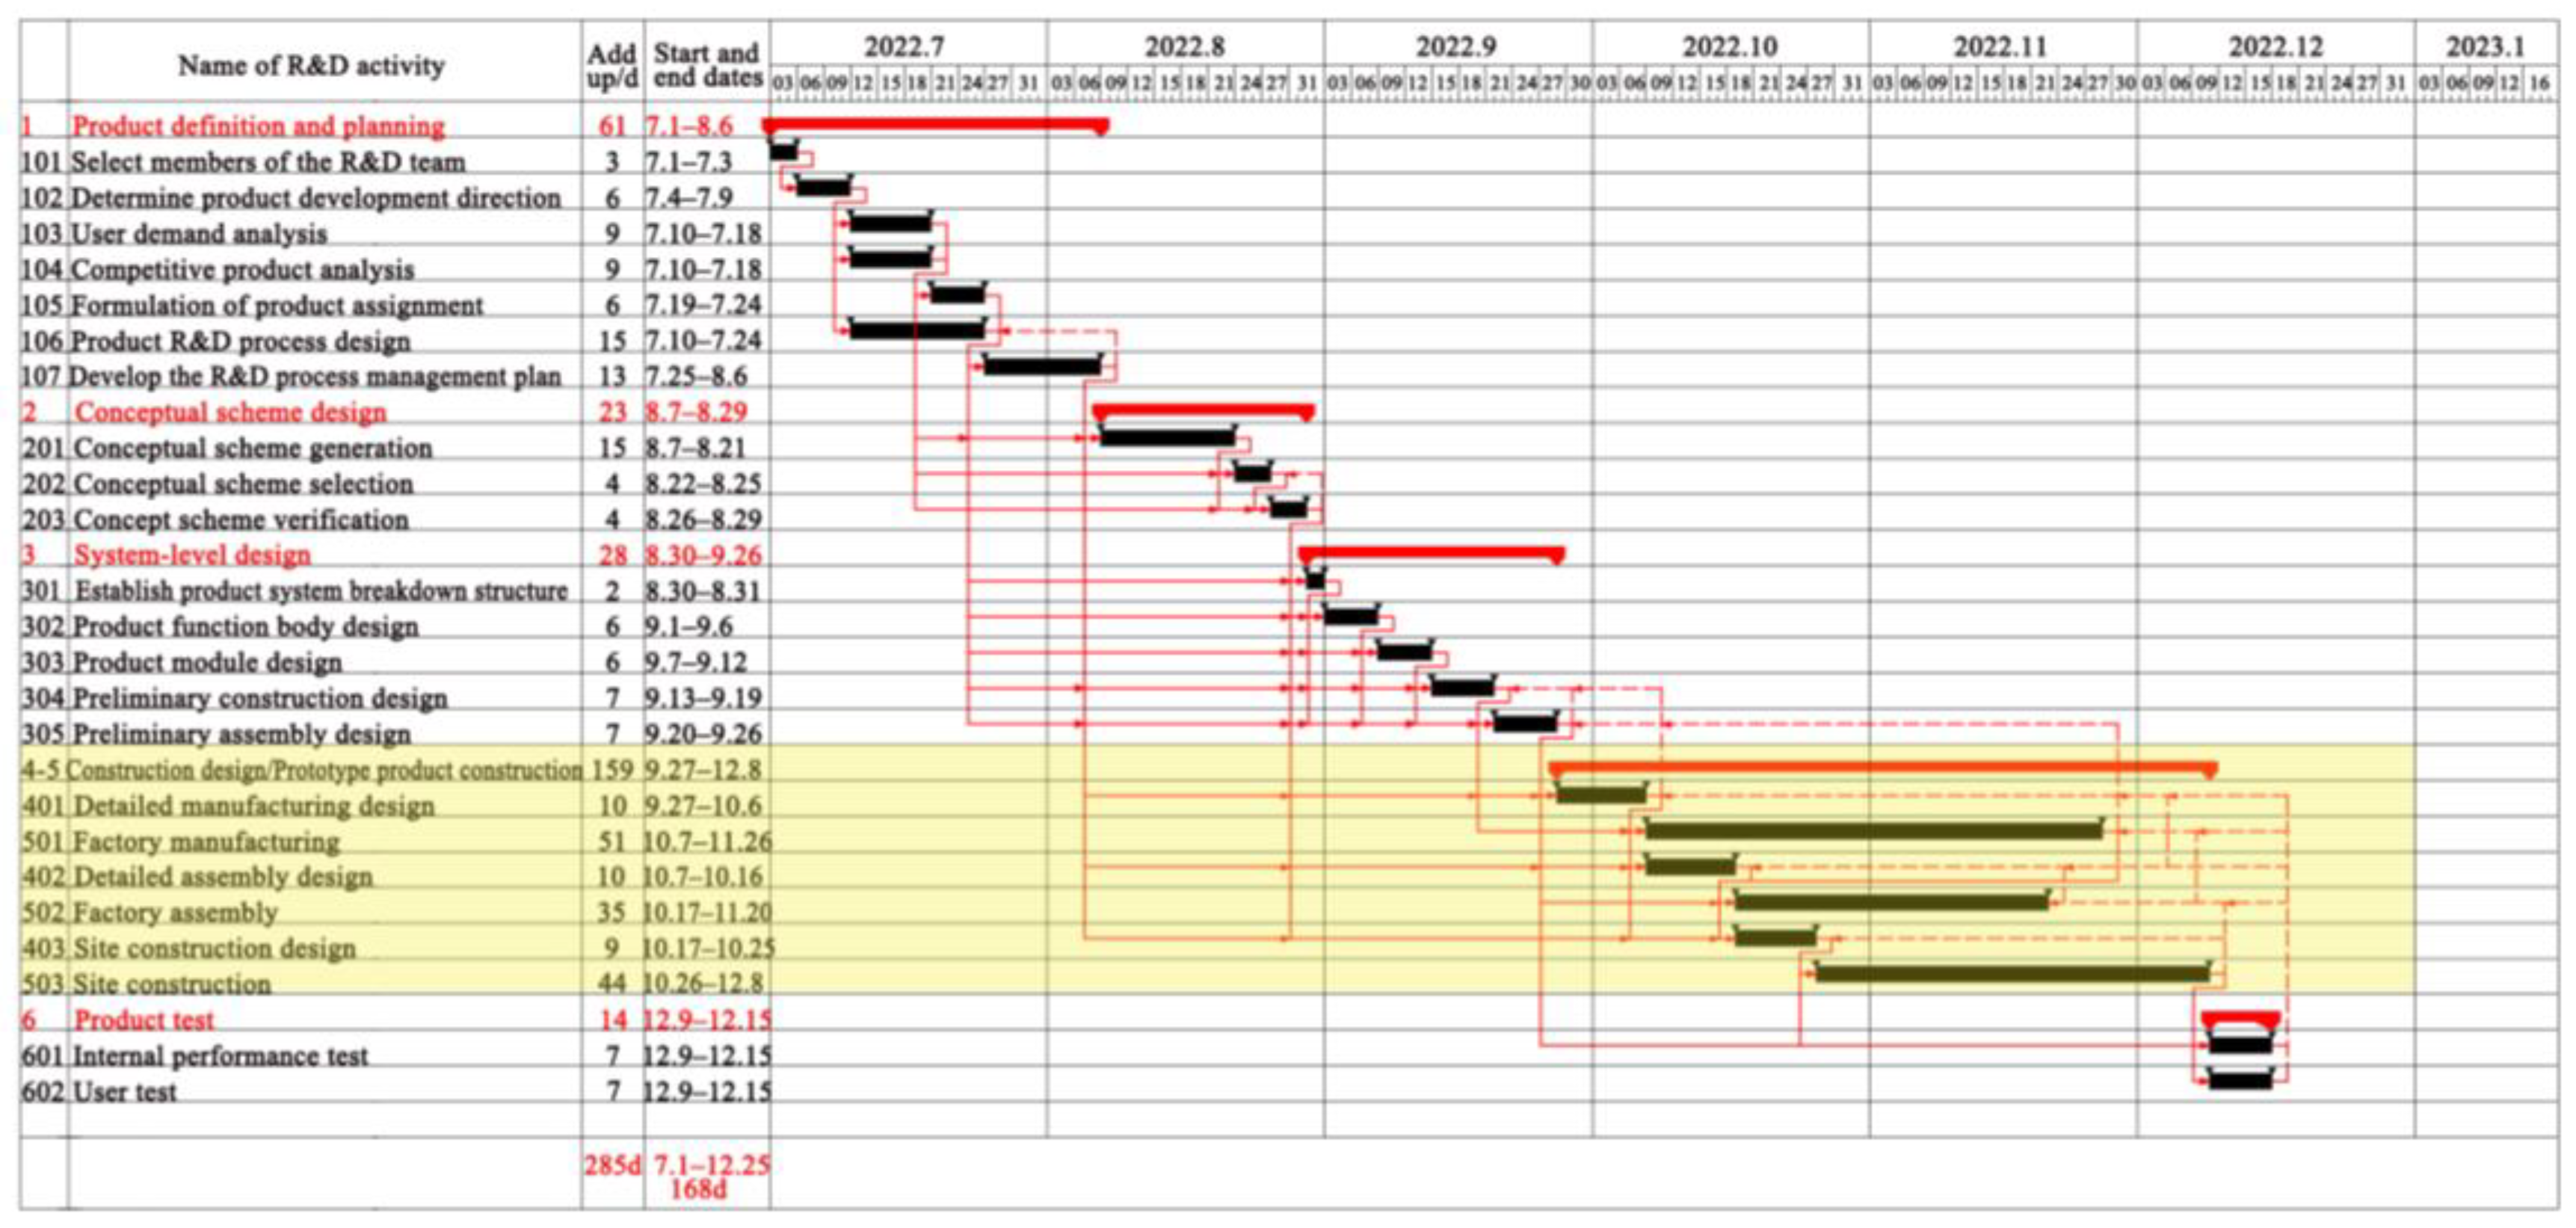
From the schedule mean value in Table 2, it can be observed that the results of the high-resolution model significantly decreased (−88.05), and the design process optimization further reduced (−29.90). The reason for the decrease in the former is that high-resolution models can recognize parallel tasks (such as activities 104 and 103), while low-resolution models are difficult to recognize, thereby significantly reducing the schedule time. There are two reasons for the decrease in the latter: one is that the resolution improvement creates conditions for the optimization of the design process; on the other hand, after optimizing the design process, the large-scale coupling relationship is transformed into a small-scale local coupling, and the information feedback within the coupling activity set is reduced, thereby shortening the R&D and construction cycle. You can refer to the actual schedule of aluminum alloy modular building R&D, as shown in Figure 15 and Figure 16. The R&D schedule of the high-resolution model was 200 days, which is close to the mean value of 195.10 days; the optimized R&D schedule was 168 days, which is close to the mean value of 165.20 days.
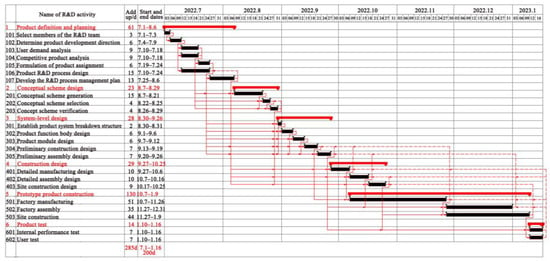
Figure 15.
R&D schedule of high-resolution model for aluminum alloy modular buildings.
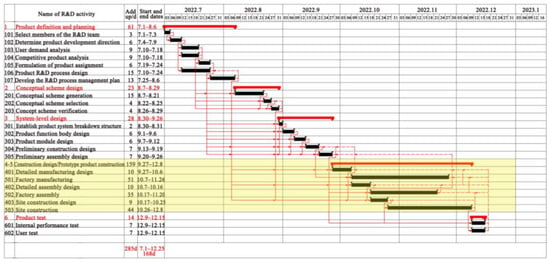
Figure 16.
R&D schedule of aluminum alloy modular buildings after high-resolution model optimization.
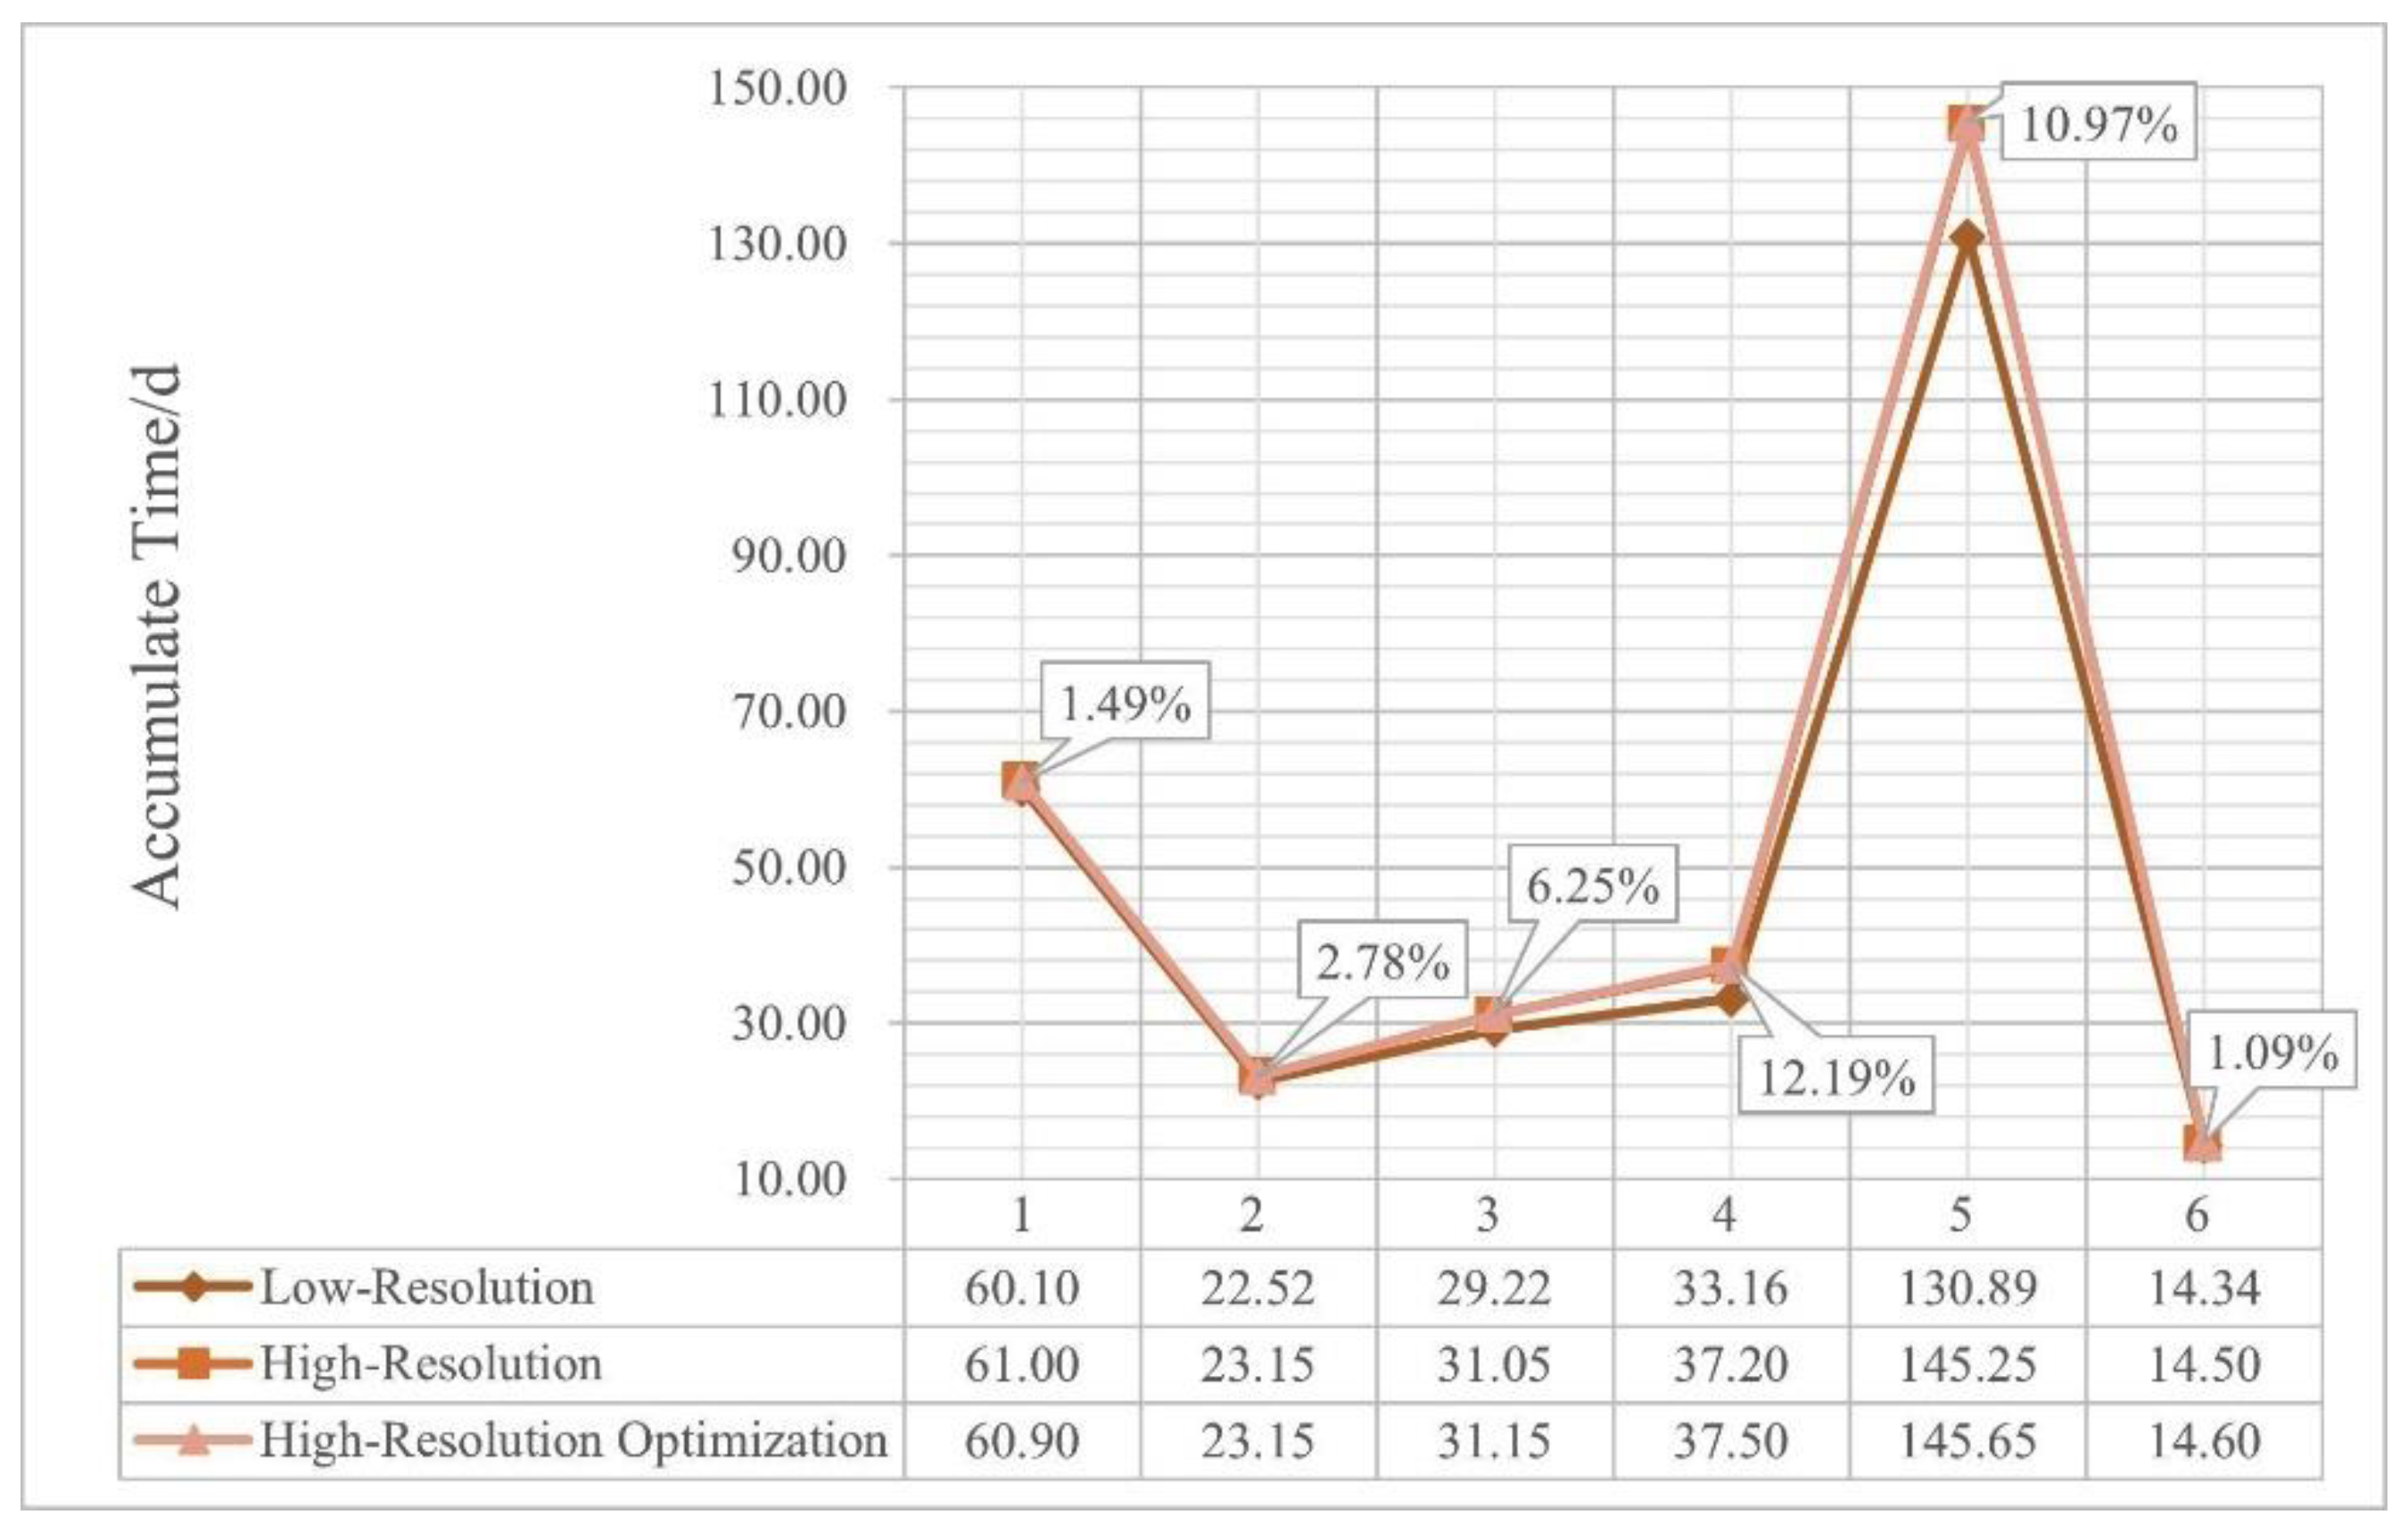
Table 4 also lists the average cumulative time spent on R&D activities for different resolution models. Accumulated time refers to the total time spent on various R&D activities, representing the actual total amount of work generated. After the resolution was improved, the average cumulative time increased. The reason is that the improvement in resolution led to a subdivision of R&D activities, resulting in an increase in the rework rate and quantity.
Table 4.
Statistics of average cumulative time spent on various R&D activities for different resolution models.
For the convenience of comparison, high-resolution R&D activities were merged according to the corresponding activities in the low-resolution model. From Figure 17, it can be seen that the average cumulative time spent in R&D stages 4 and 5 significantly increased (12.19%, 10.97% and 13.09%, 11.28%, respectively), while the average cumulative time spent in R&D stage 3 increased to a certain extent (6.25% and 6.59%). There was no significant change in R&D stages 1, 2, and 6. Combined with the aluminum alloy modular buildings, “4. Construction design” and “5. Prototype product construction” are key R&D stages, as well as the key points of multidisciplinary interaction, optimization and iteration, and repeated adjustment. “3. System-level design” is a stage with high level of detail and heavy workload. These three stages are the most complex in building design, and in order to more accurately evaluate design schedule and costs, they should be modeled and analyzed at a higher resolution. For stages 1, 2, and 6, the impact of different resolutions on schedule and cost estimates was relatively small. Considering the dependence on high-resolution models and modeling costs, low-resolution modeling can be adopted.
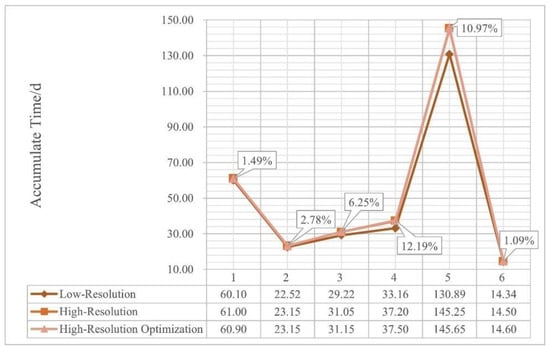
Figure 17.
Statistics of average cumulative time spent on various R&D activities for different resolution models.
5.2.2. Evaluation of Differences in Models with Different Resolutions
As outlined above, high-resolution models and high-resolution optimization models have created conditions for improving analysis accuracy and credibility. However, establishing and optimizing high-resolution models require higher costs of investigation, research, modeling, validation, and other work. Taking the aluminum alloy modular building as an example, the high-resolution model in this example includes 23 activities, and the elements of the DSM reach 232 = 529. Although the elements of the high-resolution DSM have sparsity, there are certain computational rules for converting from a low-resolution DSM to a high-resolution DSM. However, in actual design work, if further subdivision of R&D activities is carried out, the number of matrix elements that need to determine dependency relationships will rapidly increase, and the early research and modeling workload will be very large. However, if the difference values are evaluated on the basis of low-resolution models, it can to some extent correct the results of low-resolution models and reduce excessive dependence on high-resolution models.
- (1)
- Schedule variance assessment
When the probability and amount of rework in the R&D activities of high-resolution models do not exceed the corresponding low-resolution models, the schedule evaluation of high-resolution models is more accurate, while low-resolution models have a risk of overestimation. If the reducing effect of parallel R&D activities on schedule time is removed, it can be used as an alternative evaluation. Firstly, check the internal high-resolution R&D activities that can be parallel in the development of low-resolution models, as well as the R&D activities that can be parallel with external ones. Then, by removing the time reduction caused by parallel R&D activities, it can be used as an alternative evaluation value for schedule. As shown in Table 5, the time reduction for parallel R&D activities is the most likely time(tm) for the smaller R&D activity in each group. According to the estimation using the above method, the original average schedule value of the low-resolution model was 283.15 d, which was revised to 198.15 d, which is very close to the average schedule value of 195.10 d of the high-resolution model. The low-resolution model is also applicable compared to the high-resolution optimization model. Excluding the parallel time reduction of the high-resolution optimization model, the estimated value is 117.00 d, which is revised to 166.15 d, which is also close to the average schedule value of 165.20 d for the high-resolution optimization model. Therefore, through this schedule difference evaluation method, the schedule time gap with high-resolution models and high-resolution optimization models has been significantly reduced. Although the above evaluation method needs to determine the subdivision of high-resolution model R&D activities, it can reduce the workload of identifying a large number of dependencies between high-resolution model development activities and subsequent modeling and computational analysis processes.
Table 5.
Differential assessment of schedule based on low-resolution models.
- (2)
- Cost variance assessment
When the probability and amount of rework in the R&D activities of high-resolution models do not exceed the corresponding low-resolution models, the cost evaluation of high-resolution models is more accurate, while low-resolution models have the risk of underestimation. Although it is difficult to compare through a complete analytical formula, the following estimates can be made. The time spent on various R&D activities consists of basic time and rework time, while the expenses for various R&D activities are composed of basic costs and rework costs. The difference in cost for models with different resolutions mainly comes from rework costs. Table 6 shows the rework time and cost for various R&D activities of the low-resolution model.
Table 6.
Rework time and cost for various R&D activities of low-resolution models.
Based on empirical data, the rework frequency of high-resolution model R&D activities will not be lower than that of the corresponding low-resolution model, usually reaching 1.5 times [38]. For example, in the high-resolution model design of aluminum alloy building, there are three R&D activities (305, 401, 501) that may lead to rework of R&D activity 304. The low-resolution model R&D activity “3. System-level design” that R&D activity 304 belongs to has two R&D activities that may lead to rework, with a ratio coefficient of approximately 3/2 = 1.5. Therefore, by multiplying the rework cost of the low-resolution model by a certain proportional coefficient, the total cost of the low-resolution model is corrected and evaluated.
The specific estimation process is as follows: according to simulation statistics, the average total cost of the low-resolution model () is 265,000 Yuan, as shown in Table 4. The average rework cost of the high-resolution model and the high-resolution optimization model () is 38,600 Yuan and 29,700 Yuan, respectively, as shown in Table 6. Assuming the coefficient of rework cost K = 1.50~2.0, the revised estimates of the average rework cost are K• = 57,900~77,200 Yuan and 44,600~59,400 Yuan, respectively. Furthermore, the revised estimates of the total average cost are + (K − 1) × = 284,300~303,600 Yuan and 279,800~294,700 Yuan, respectively, which are close to 298,800 yuan for the high-resolution model and 28,900 Yuan for the high-resolution optimization model.
6. Discussion and Conclusions
This article took the decomposition structure of the aluminum alloy modular building system and R&D process as the research object, established a multiresolution model of the design process based on the DSM, evaluated the schedule and cost of the design process through simulation, compared the differences between different resolution models, and obtained a more reliable estimate of the schedule and cost of the design process. The analysis yielded the following conclusions:
- (1)
- The multiresolution modeling method based on the DSM is universal for the research of complex systems, and is also applicable to the risk analysis of the design process of modular building, which can effectively improve the accuracy of system analysis.
- (2)
- For the average schedule of the design process, the results of high-resolution models are significantly lower than those of low-resolution models, and the optimization of high-resolution models further reduces them. The reason comes from identifying parallel tasks, reducing coupling, and avoiding cross stage rework, thereby shortening the R&D and construction cycles.
- (3)
- By comparing the average cumulative time spent on R&D activities of models with different resolutions horizontally, it was found that due to the high level of detail and complexity in stages 3, 4, and 5 of modular buildings, they should be modeled and analyzed at higher resolutions to ensure high reliability of the results. For stages 1, 2, and 6, low resolution modeling is sufficient.
- (4)
- Considering the high workload and difficulty of modeling high-resolution models, approximate estimation methods can be used on the basis of low-resolution models to alleviate the dependence on high-resolution models and modeling costs to a certain extent.
The research limitations and future research are discussed as follows. (1) Although this article provided some suggestions and strategies for optimizing the schedule of modular building design, due to limitations in one’s own professional abilities and time constraints, the research data on modular building manufacturers are not comprehensive enough, which inevitably leads to a lack of comprehensive consideration of their design management status. The problems in modular building design still need to be explored and improved. Therefore, the optimization strategy proposed in this article may have shortcomings in practical applications and needs to be continuously adjusted and improved. (2) Modular buildings are highly integrated and of single type, and can be further expanded to prefabricated buildings with more complex design and construction processes in the future. (3) The current research focuses on multiresolution modeling of modular building design processes based on DSM. Future research can use this as a basis to further optimize approximate estimation methods, significantly reducing dependence on high-resolution models while obtaining schedule and cost results with higher reliability and lower risk levels, thus forming a complete building development and manufacturing system and improving building quality.
Author Contributions
Methodology, L.D.; Formal analysis, H.L.; Resources, S.B.; Writing—original draft, Y.W. All authors have read and agreed to the published version of the manuscript.
Funding
The authors are grateful for the Research Fund support of Nanjing Institute of Technology (YKJ201836), with a funding fee of 100,000 Yuan. The Jiangsu Province Construction System Science and Technology Project (2019ZD001132, 2019ZD001005, 2020ZD001005, 2020ZD001003), with a funding fee of 0 Yuan. The Open Research Fund of NJIT Research Center, The Key Laboratory of Carbon Neutrality and Territory Optimization, the Ministry of Natural Resources (CNT202207), with a funding fee of 30,000 Yuan.
Data Availability Statement
The data presented in this research are available upon request from the corresponding author. The data are not publicly available due to privacy.
Conflicts of Interest
The authors declare no conflict of interest.
Appendix A
Table A1.
Explanation of Terms.
Table A1.
Explanation of Terms.
| Serial Number | Technical Term | Abbreviation | Explain |
|---|---|---|---|
| 1 | design structure matrix | DSM | See Section 3.1 for details |
| 2 | research and development | R&D | / |
| 3 | low-resolution model | / | See Section 2.3 for details |
| 4 | high-resolution model | / | See Section 2.3 for details |
| 5 | multiresolution model | / | including low resolution model and high-resolution model |
References
- Zeng, S.F. Research on Optimization of New Product R&D Process of M Company. Master’s Thesis, Overseas Chinese University, Taichung City, Taiwan, 2022. [Google Scholar] [CrossRef]
- Wang, J. Research on the Optimization of the R&D Process for New Medical Device Products of ZK Company. Master’s Thesis, University of Electronic Science and Technology, Chengdu, China, 2022. [Google Scholar] [CrossRef]
- Xu, T.; Qiao, L.H.; Zhao, H.Q. A Flexible Modeling Method for Product R&D and Design Workflow Based on Petri Nets. Mod. Manuf. Eng. 2021, 484, 58–63. [Google Scholar] [CrossRef]
- Feng, L.Q.; Huang, D.L.; He, Z.; Li, W.C. Process Modularization Analysis Method for Complex Product R&D Projects. Ind. Eng. 2018, 21, 10. [Google Scholar]
- Yu, T.; Yin, H. Analysis of Product Innovation Mechanism and Process of Financial Institutions. Dongyue Analects 2015, 36, 92–96. [Google Scholar] [CrossRef]
- Gu, D.Z. Research on Product Development Process Optimization of YF Company Based on Design Structure Matrix. Master’s Thesis, Donghua University, Shanghai, China, 2020. [Google Scholar] [CrossRef]
- Zeng, J.Z. Research on Product R&D Process Optimization of S. Company. Master’s Thesis, South China University of Technology, Guangzhou, China, 2018. Available online: https://kns.cnki.net/KCMS/detail/detail.aspx?dbname=CMFD201802&filename=1018874769.nh (accessed on 17 August 2023).
- Yang, G.H.; Liu, J.H. Modeling and Optimization of Complex Product Development Processes Based on DSM and SysML. J. Comput. Aided Des. Graph. 2017, 29, 921–928. [Google Scholar]
- de Carvalho, R.A.; da Hora, H.; Fernandes, R. A process for designing innovative mechatronic products. Int. J. Prod. Econ. 2020, 231, 107887. [Google Scholar] [CrossRef]
- Liu, C. Process Product Design Based on Multimode Interaction Design; Hindawi Limited: London, UK, 2021. [Google Scholar] [CrossRef]
- Sheng, H.T.; Wei, F.J. The Research and Application of Genetic-Based Design Structure Matrix Optimization Algorithm. Chin. J. Manag. Sci. 2007, 15, 98–104. [Google Scholar] [CrossRef]
- Sinha, K.; Han, S.Y.; Suh, E.S. Design structure matrix-based modularization approach for complex systems with multiple design constraints. Syst. Eng. 2019, 23, 211–220. [Google Scholar] [CrossRef]
- Gunawan, G.; Yanuar, Y.; Waskita, F.A.; Kurniawan, A. Modularization of Ship Engine Room Using Design Structure Matrix (DSM) Based on the Genetic Algorithm. Eng. J. 2020, 24, 205–216. [Google Scholar] [CrossRef]
- Browning, T. Systems Architecting and Program Management with the Design Structure Matrix (DSM). INCOSE Int. Symp. 2013, 23, 1632. [Google Scholar] [CrossRef]
- Deng, L.N.; Zhou, Z.; Ye, X.; Liao, L.; Lei, L.Z. Deepening the Design Process of Assembled Components Based on BIM. J. Guilin Univ. Technol. 2021, 41, 797–803. [Google Scholar]
- Wang, Q.W.; Zhang, J.W.; Niu, Z.B. Process Analysis of Building Multidisciplinary Collaborative Design Based on BIM. J. Tongji Univ. (Nat. Sci. Ed.) 2018, 46, 1155–1160. [Google Scholar]
- Letizia, D.A.; Magdalena, H.; Federico, S.; Marcus, M.K. A novel BIM-based process workflow for building retrofit. J. Build. Eng. 2022, 50, 104163. [Google Scholar]
- Sigalov, K.; König, M. Recognition of process patterns for BIM-based construction schedules. Adv. Eng. Inform. 2017, 33, 456–472. [Google Scholar] [CrossRef]
- Lee, J.H.; Jun, H.J. A Study on the Adaptability of BIM-based Integrated Building Design Process in Domestic Architectural Design Firms. Korean Inst. Inter. Design. 2007, 16, 19–27. [Google Scholar]
- Cong, M. From Construction to Design. Construction, Performance, Humanities and Design Series. Ph.D. Thesis, Nanjing Southeast University, Nanjing, China, 2017; p. 206. [Google Scholar]
- Yassine, A.; Braha, D. Complex concurrent engineering and the design structure matrix method. Concurr. Eng. 2003, 11, 165–176. [Google Scholar] [CrossRef]
- Chen, W.; Sun, X.; Chen, R.; Li, H. Optimization of Control and Design of Prefabricated Components of Fabricated Buildings Based on QFD-DSM. J. Civ. Eng. Manag. 2020, 37, 39–45. [Google Scholar]
- Browning, T.R. Applying the design structure matrix to system decomposition and integration problems: A review and new directions. IEEE Eng. Manag. 2001, 48, 292–306. [Google Scholar] [CrossRef]
- Yassine, A. Introduction to Modeling and Analyzing Complex Product Development Processes Using the Design Structure Matrix (DSM) Method. Urbana 2004, 51, 1–17. [Google Scholar]
- Li, Z.K. Research on Collaborative Architectural Design Based on DSM. Master’s Thesis, Tianjin University, Tianjin, China, 2018. [Google Scholar] [CrossRef]
- Gunawan, I.; Ahsan, K. Project scheduling improvement using design structure matrix. Int. J. Proj. Organ. Manag. 2010, 2, 311–327. [Google Scholar] [CrossRef]
- Pekta, S.S.T.; Pultar, M. Modelling detailed information flows in building design with the parameter-based design structure matrix. Des. Stud. 2006, 27, 99–122. [Google Scholar] [CrossRef]
- Zhao, L.; Wang, Z. Process Optimization Calculation Model and Empirical Research of Prefabricated Buildings Based on DSM. In ICCREM 2019; American Society of Civil Engineers: Reston, VA, USA, 2019; pp. 614–621. [Google Scholar]
- Hyun, H.; Kim, H.; Lee, H.S.; Park, M.; Lee, J. Integrated Design Process for Modular Construction Projects to Reduce Rework. Sustainability 2020, 12, 530. [Google Scholar] [CrossRef]
- Ma, G.; Hao, K.; Xiao, Y.; Zhu, T. Critical chain design structure matrix method for construction project scheduling under rework scenarios. Math. Probl. Eng. 2019, 2019, 1595628. [Google Scholar] [CrossRef]
- Le, Y.; Sun, Q.; Chen, J.G.; Tang, K.W. Preliminary Progress Optimization of Large and Complex Airport Projects Based on Design Structure Matrix. J. Tongji Univ. (Nat. Sci. Ed.) 2020, 48, 1523–1529. [Google Scholar]
- Oloufa, A.A.; Hosni, Y.A.; Fayez, M.; Axelsson, P. Using DSM for modeling information flow in construction design projects. Civ. Eng. Environ. Syst. 2004, 21, 105–125. [Google Scholar] [CrossRef]
- Brady, T.K. Utilization of Dependency Structure Matrix Analysis to Assess Complex Project Designs. In Proceedings of the ASME 2002 International Design Engineering Technical Conferences and Computers and Information in Engineering Conference, Montreal, QC, Canada, 29 September–2 October 2002. [Google Scholar] [CrossRef]
- Bulloch, B.; Sullivan, J. Application of the Design Structure Matrix (DSM) to the Real Estate Development Process; Massachusetts Institute of Technology: Cambridge, MA, USA, 2009. [Google Scholar]
- Yang, J.R.; Lin, Q.Q.; Liu, W.Z.; Zhang, W.J.; Zhang, M.H. Multi resolution model aggregation and disaggregation framework for complex products. In Proceedings of the 33rd China Simulation Conference, Kunming, China, 22–24 May 2021; pp. 103–108. [Google Scholar] [CrossRef]
- Yue, M.Q.; Qi, J.X. Multi resolution modeling methods for marine weapons and equipment. Ship Electron. Eng. 2022, 42, 31–34, 53. [Google Scholar]
- Xu, Y.F.; Lv, J.W.; Xie, Z.R.; Wang, G.Q. A Multiresolution Risk Assessment Method for Complex Systems Considering Technical Risks. J. Natl. Def. Univ. Sci. Technol. 2018, 40, 161–170. [Google Scholar]
- Xu, Y.F.; Lv, J.W.; Yang, J.; Wang, G.Q. Multi resolution modeling of ship design process based on design structure matrix. J. Harbin Eng. Univ. 2019, 40, 102–111. [Google Scholar]
- Steward, D.V. The design structure system: A method for managing the design of complex systems. IEEE Eng. Manag. 1981, 28, 71–74. [Google Scholar] [CrossRef]
- Maheswari, J.U.; Varghese, K.; Sridharan, T. Application of Dependency Structure Matrix for Activity Sequencing in Concurrent Engineering Projects. J. Constr. Eng. Manag. 2006, 132, 482–490. [Google Scholar] [CrossRef]


Disclaimer/Publisher’s Note: The statements, opinions and data contained in all publications are solely those of the individual author(s) and contributor(s) and not of MDPI and/or the editor(s). MDPI and/or the editor(s) disclaim responsibility for any injury to people or property resulting from any ideas, methods, instructions or products referred to in the content. |
© 2023 by the authors. Licensee MDPI, Basel, Switzerland. This article is an open access article distributed under the terms and conditions of the Creative Commons Attribution (CC BY) license (https://creativecommons.org/licenses/by/4.0/).