

Impact of Steel Fiber Volume Fraction and Morphology on the Strength of Recycled Aggregate Concrete


Abstract
:1. Introduction
2. Experimental Program
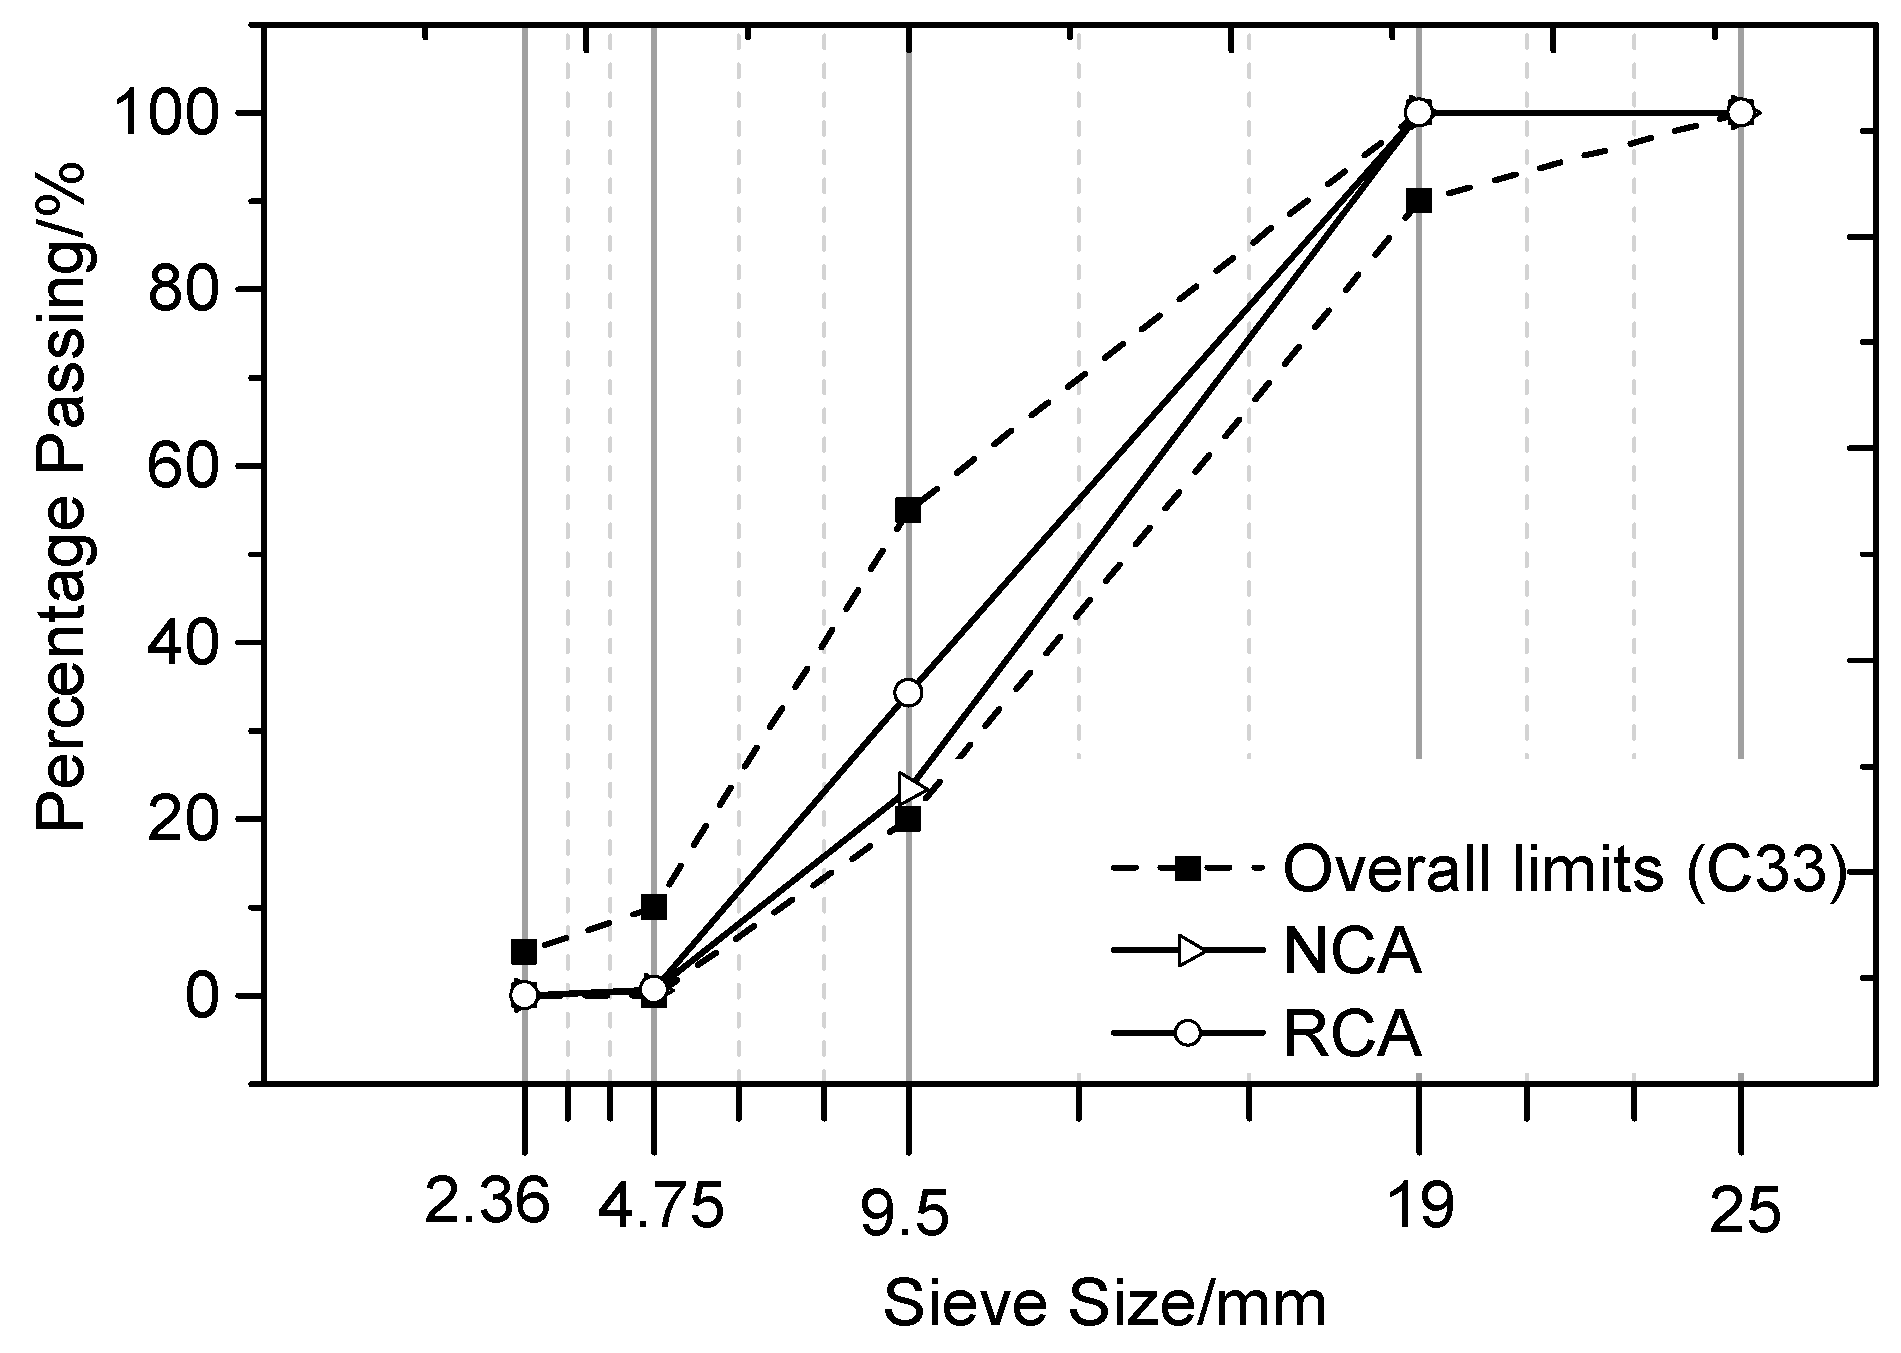
2.1. Materials
2.2. Mix Proportion
2.3. Test Specimens
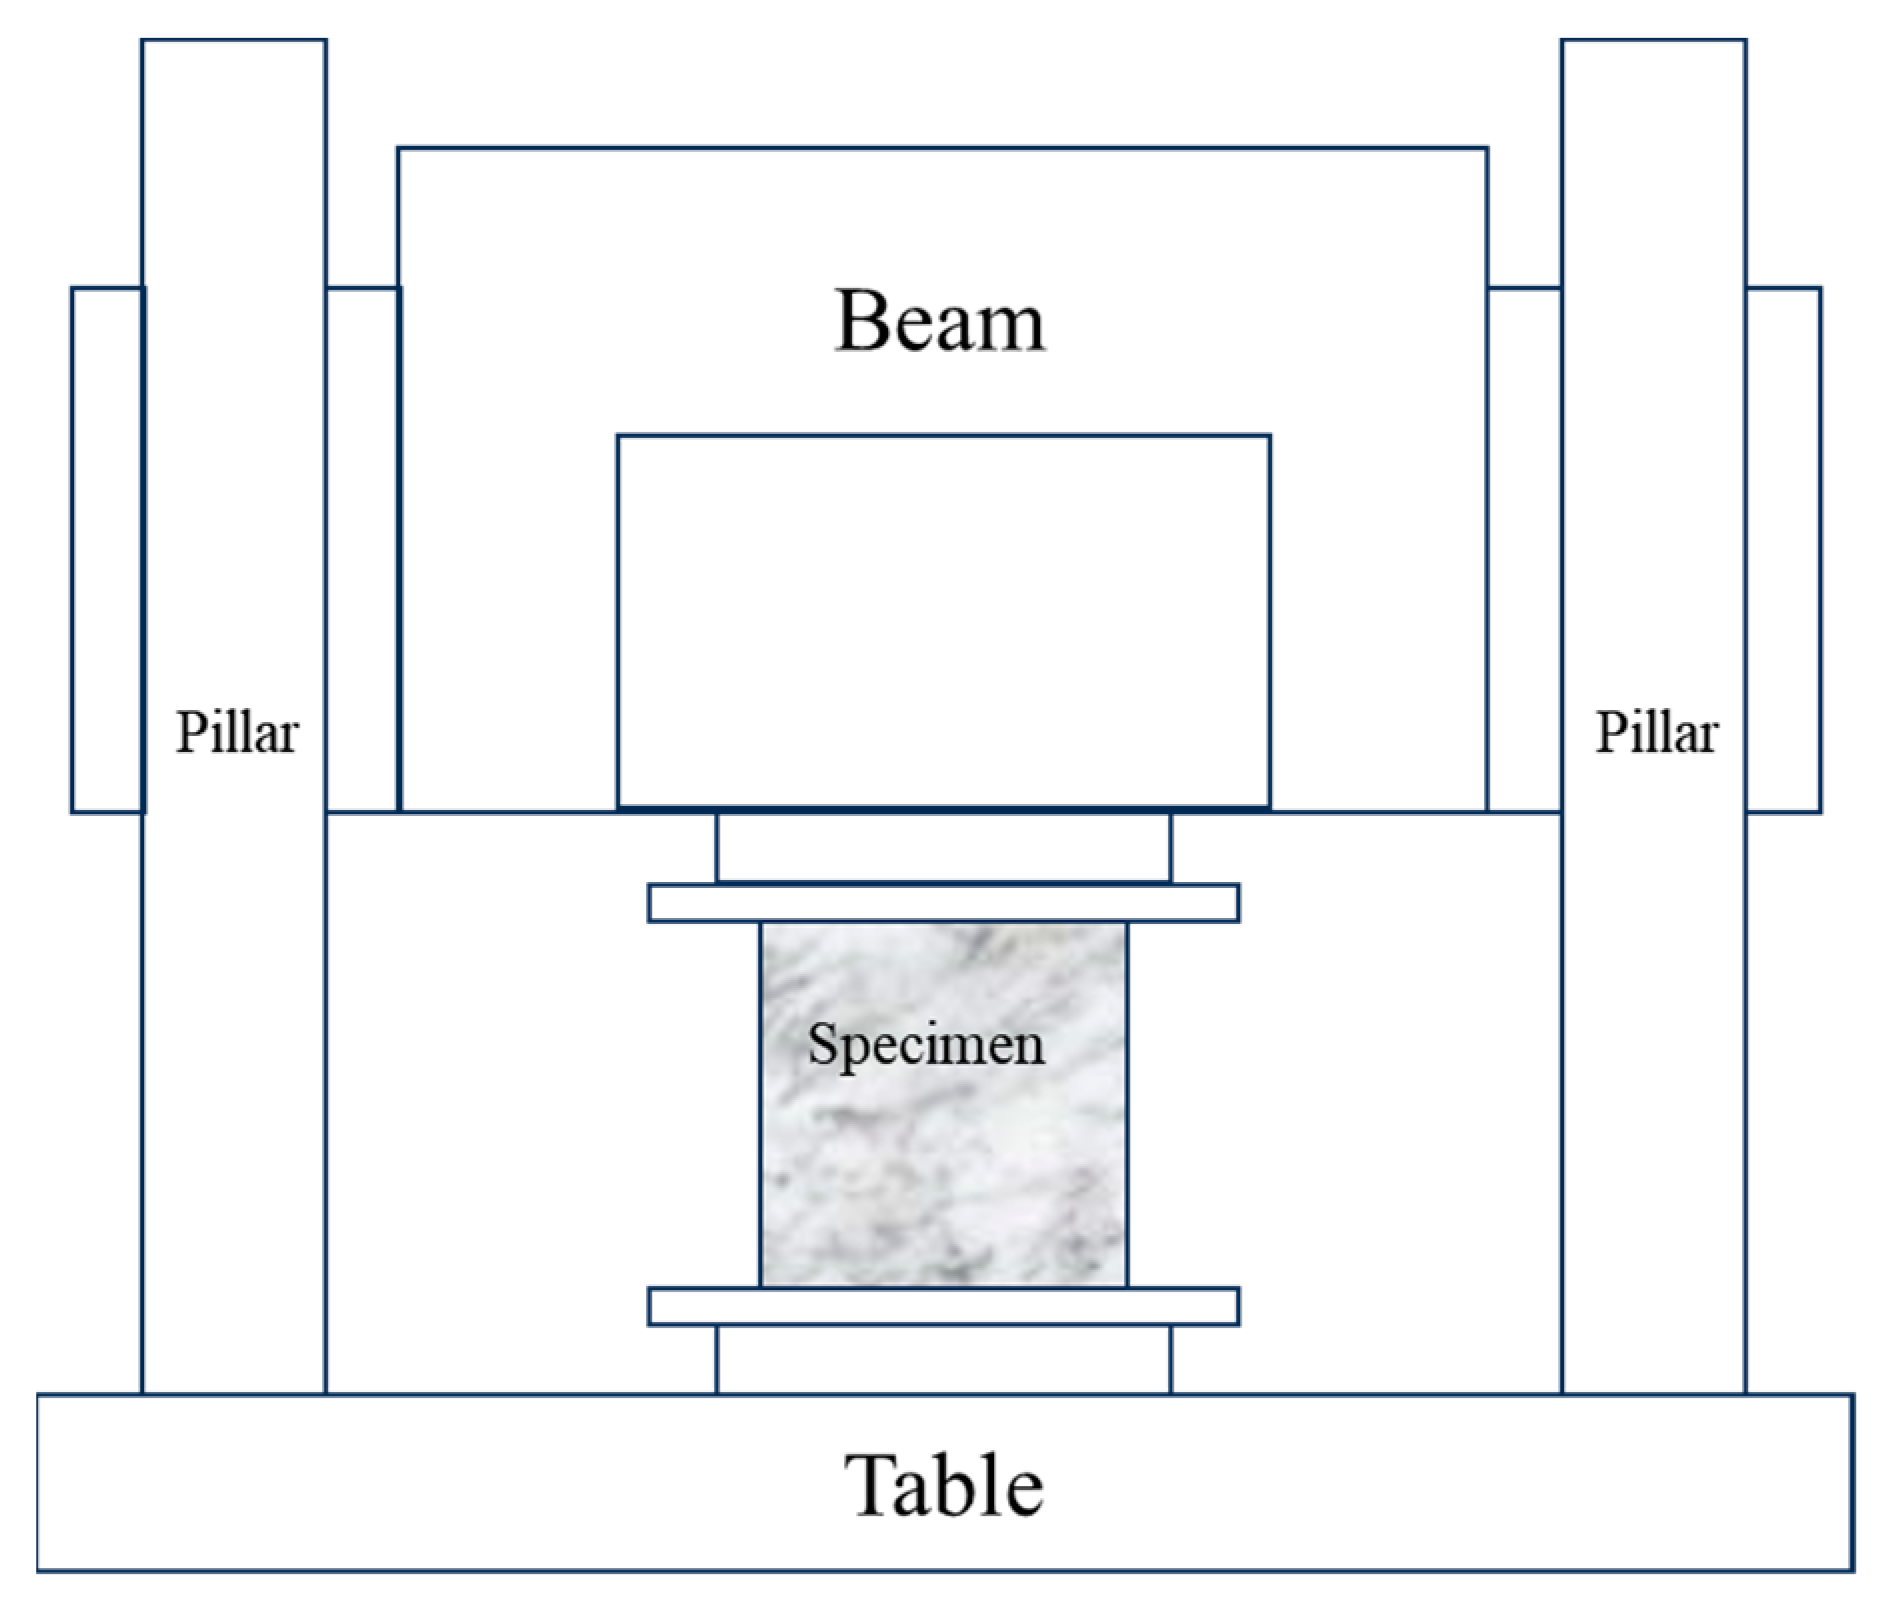
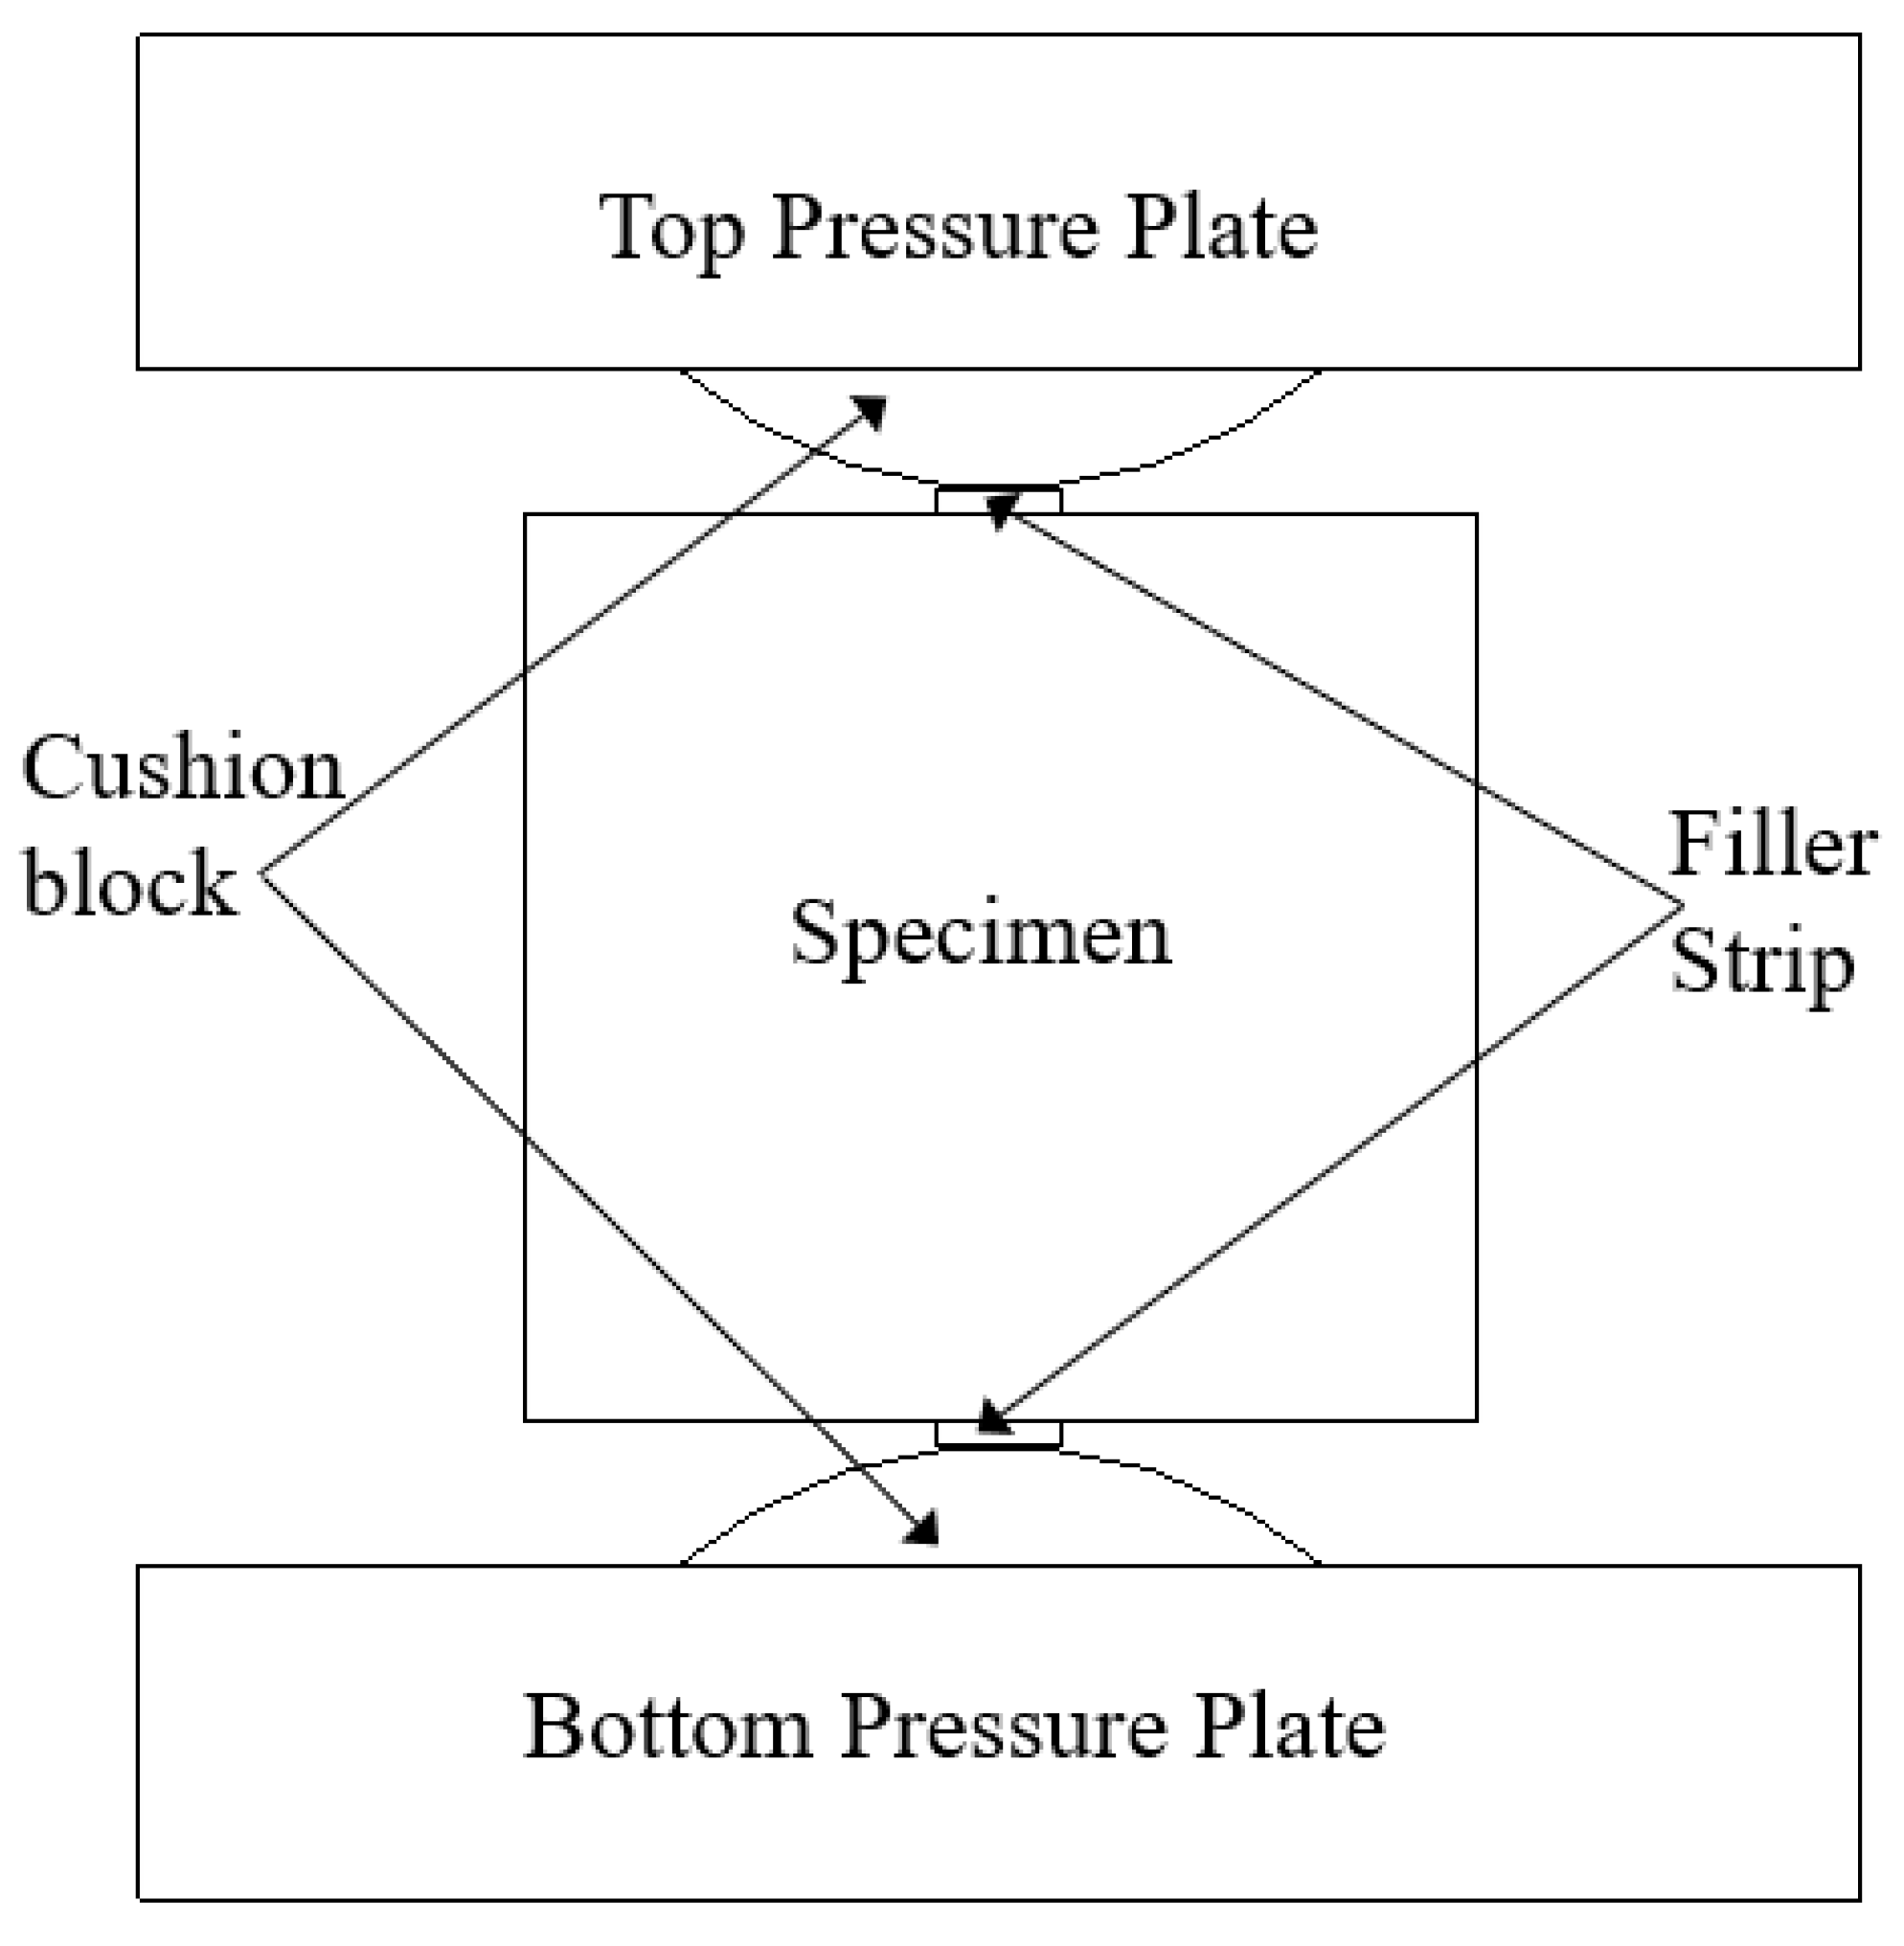
2.4. Test Methods
3. Test Results and Discussion
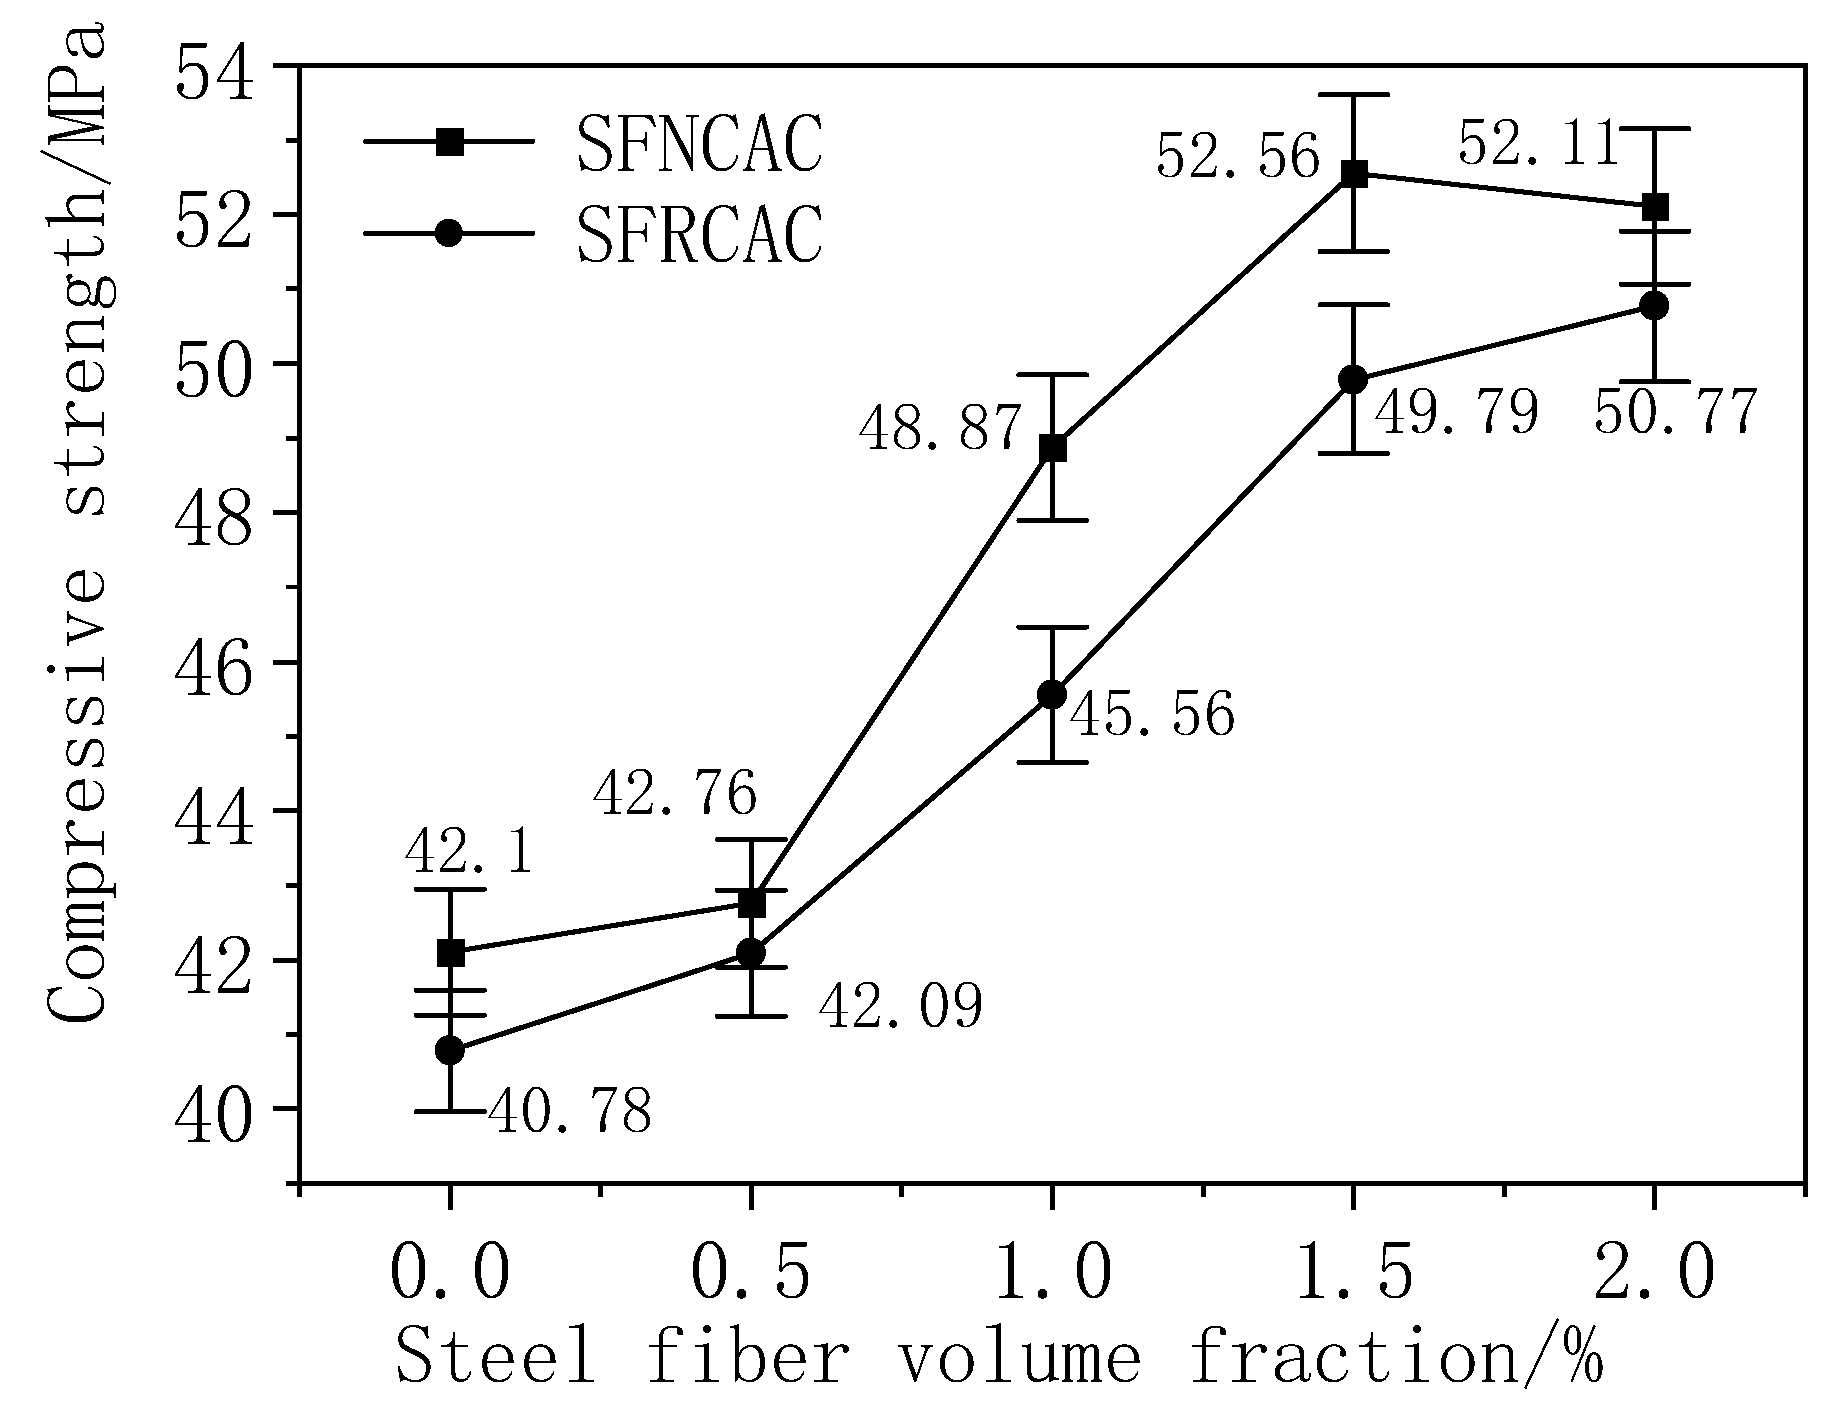
3.1. Compressive Strength
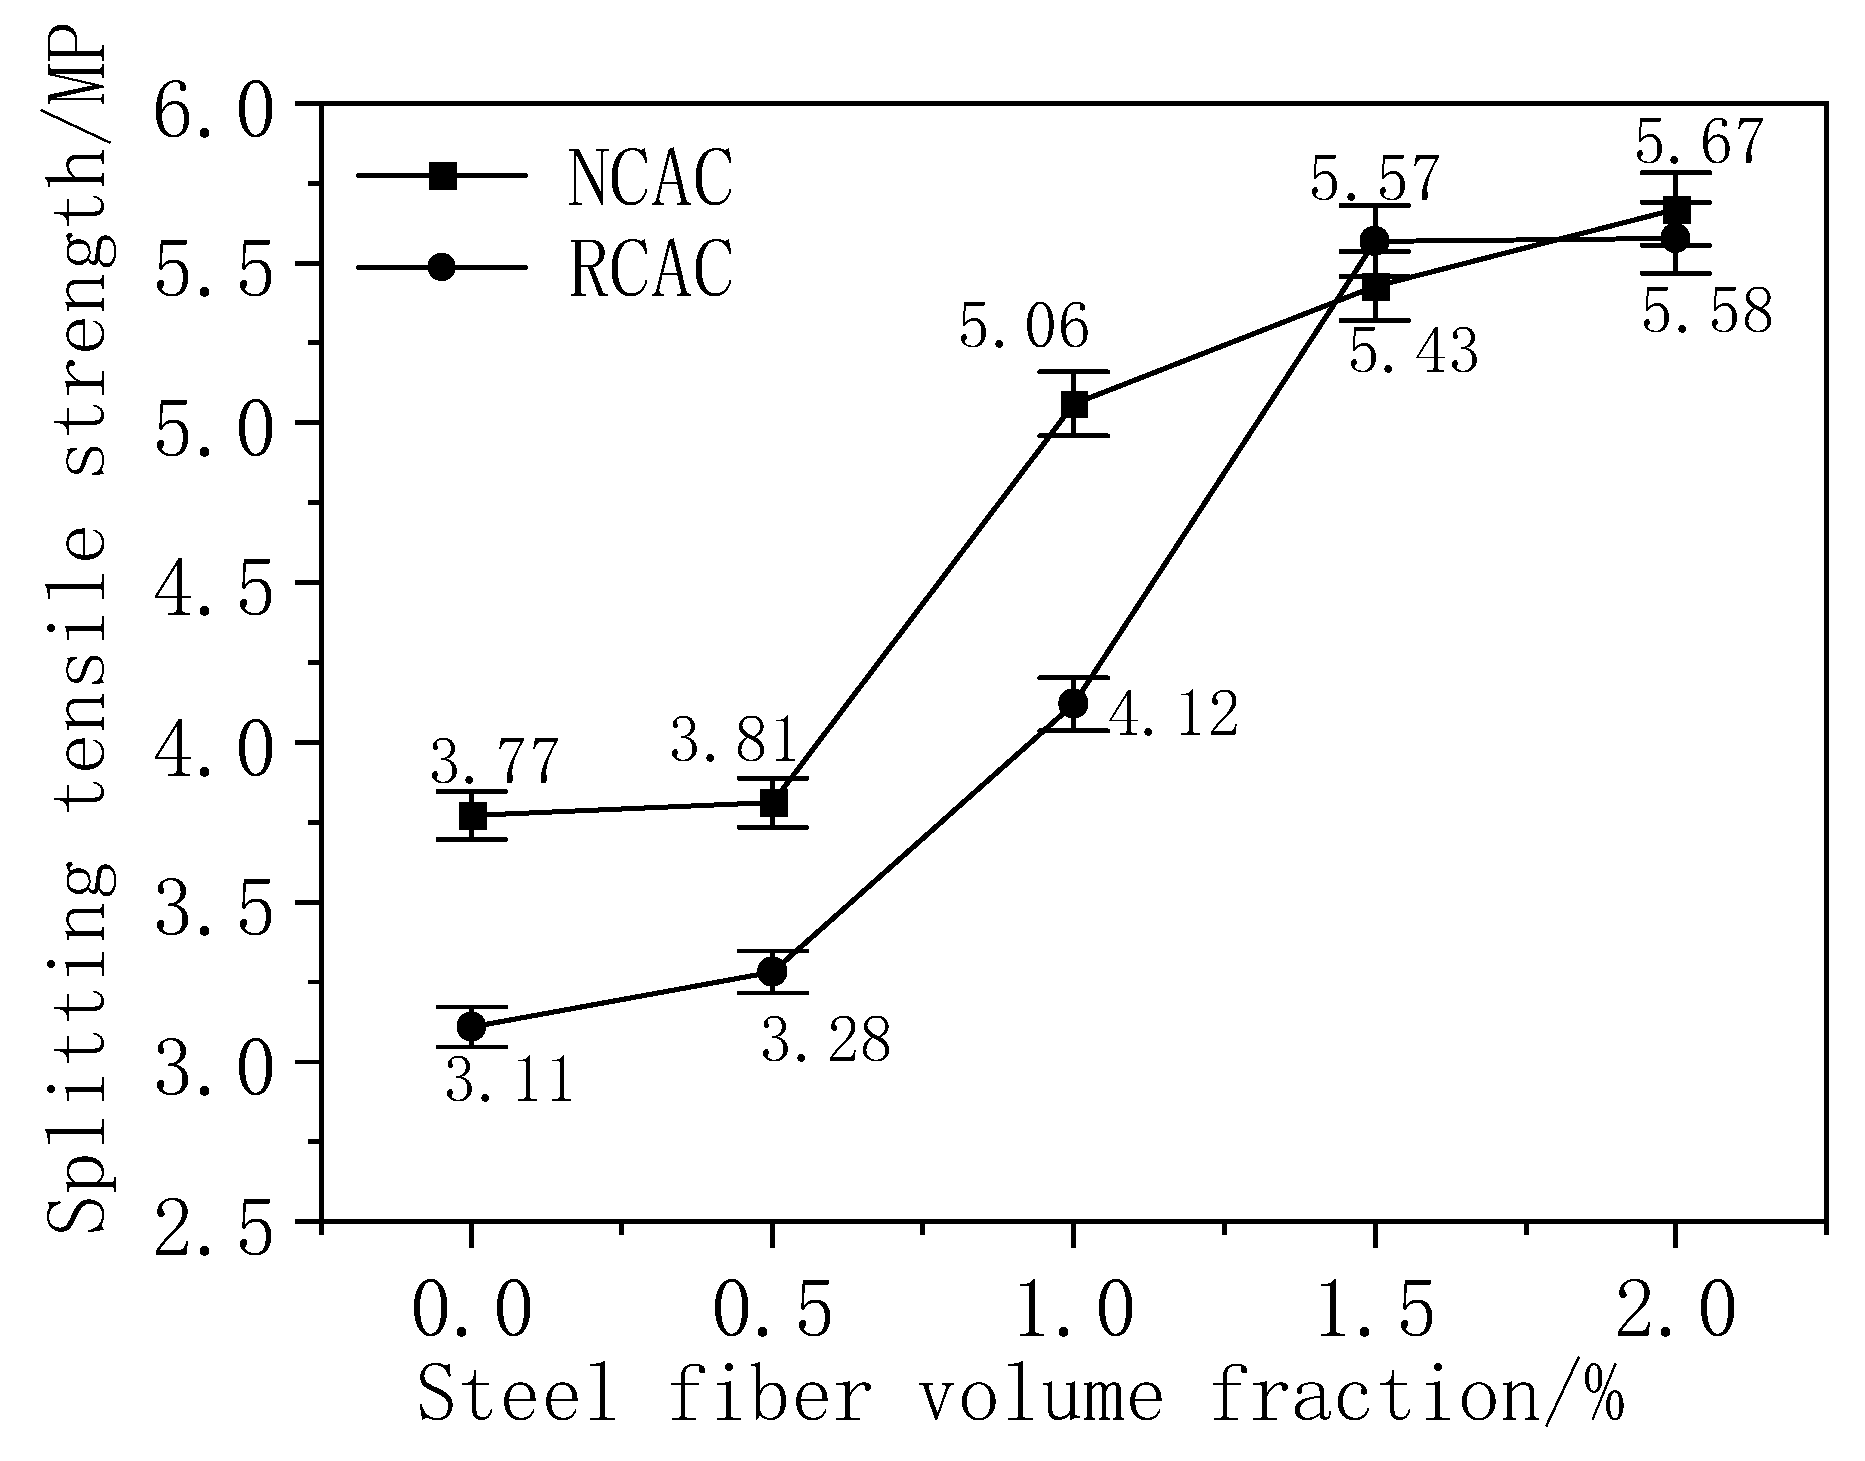
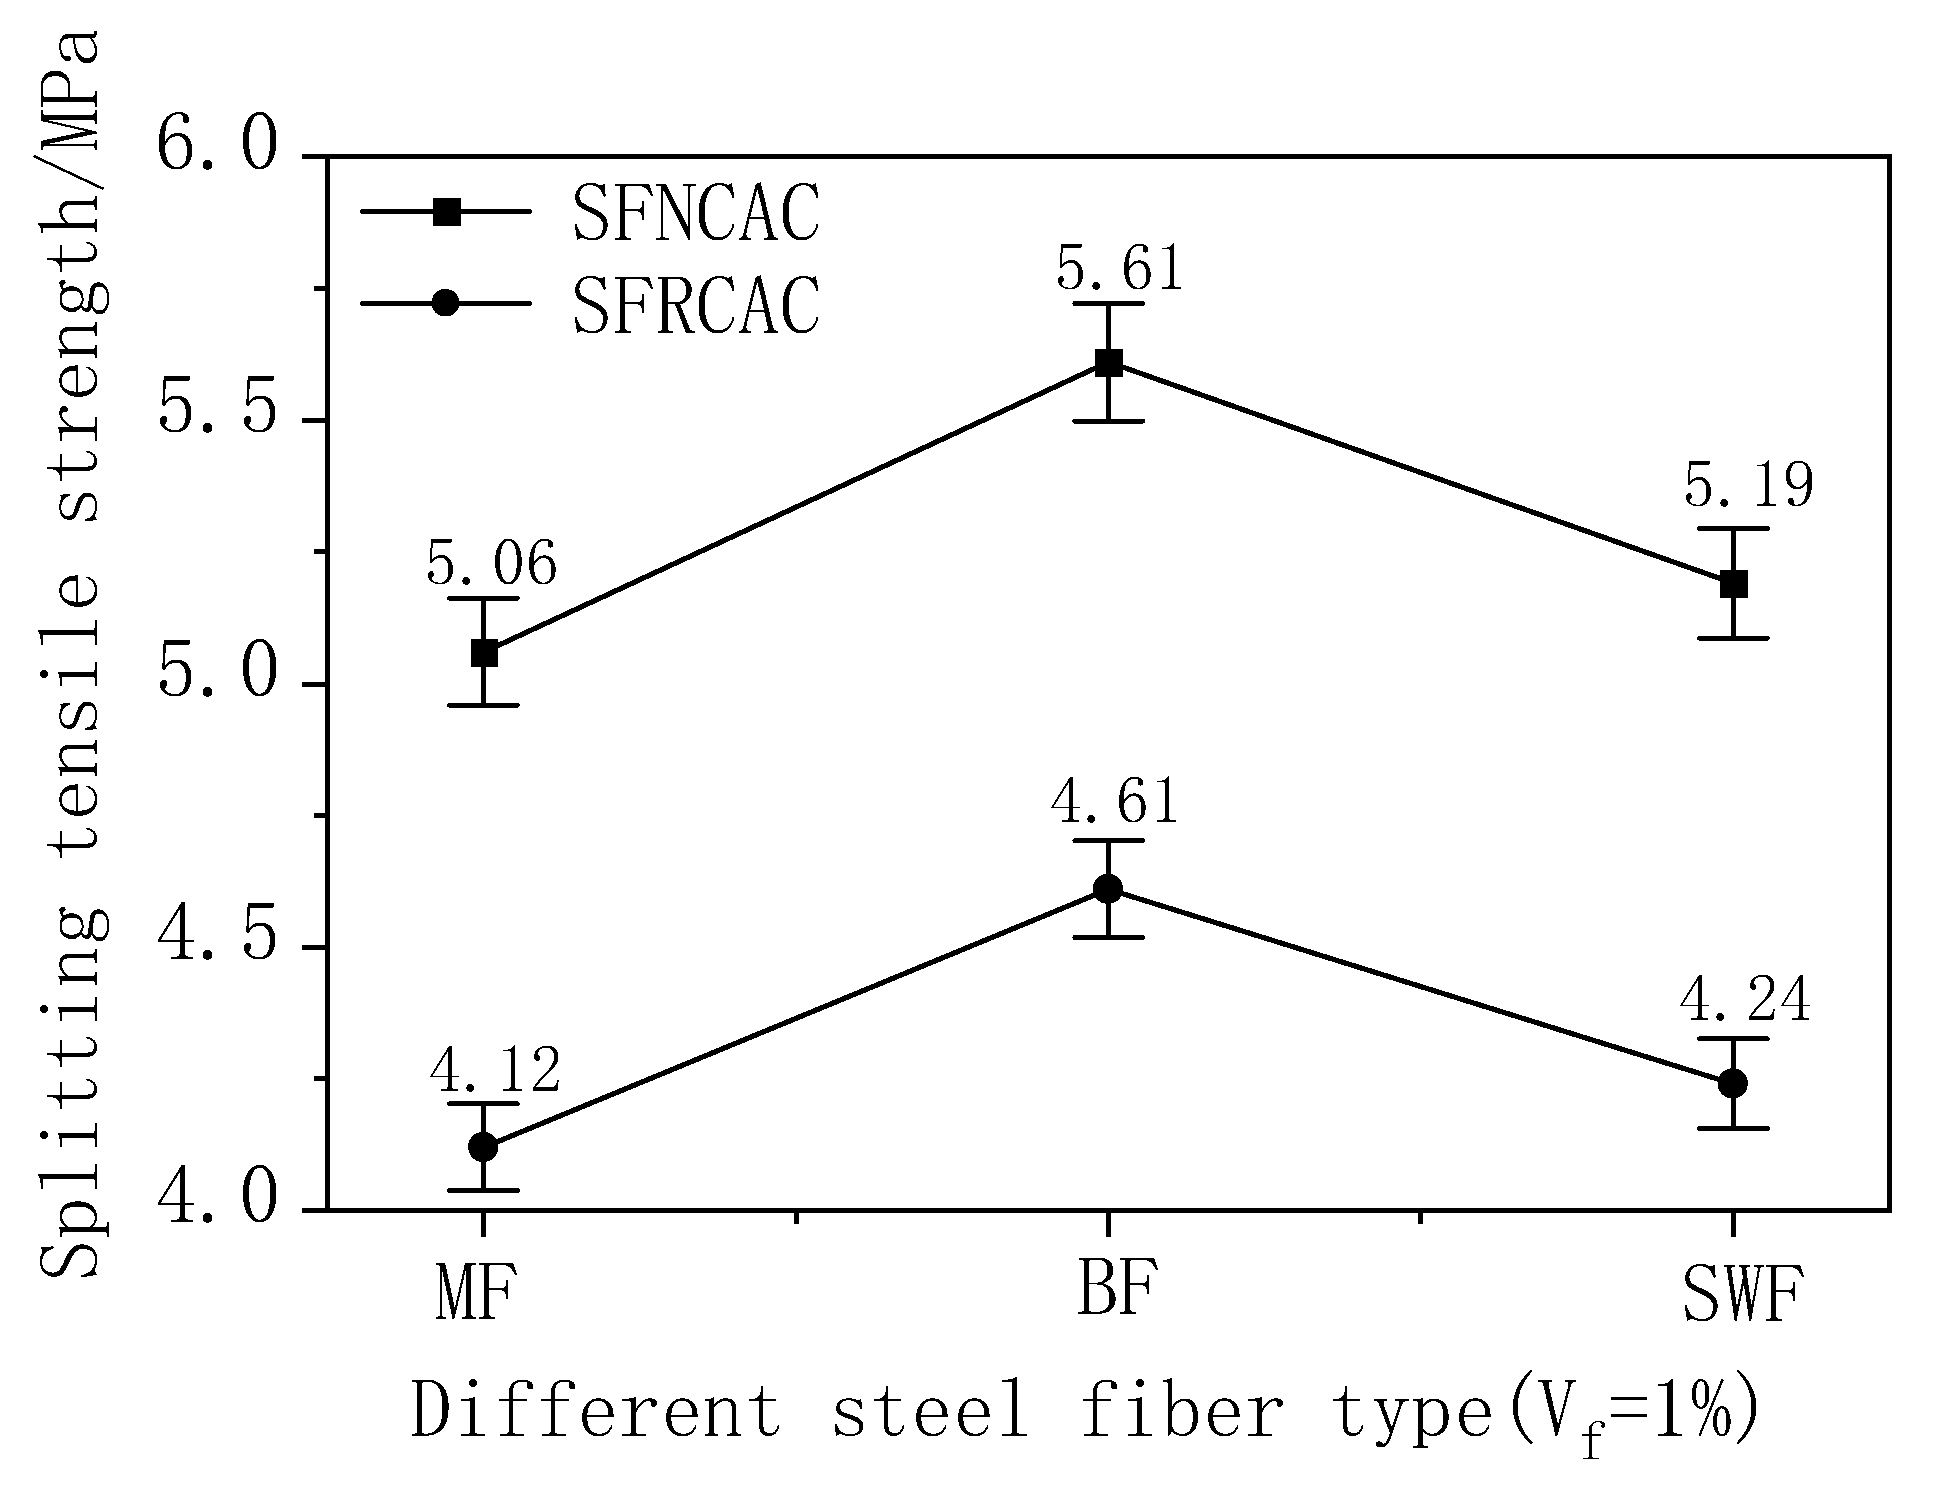
3.2. Tensile Strength
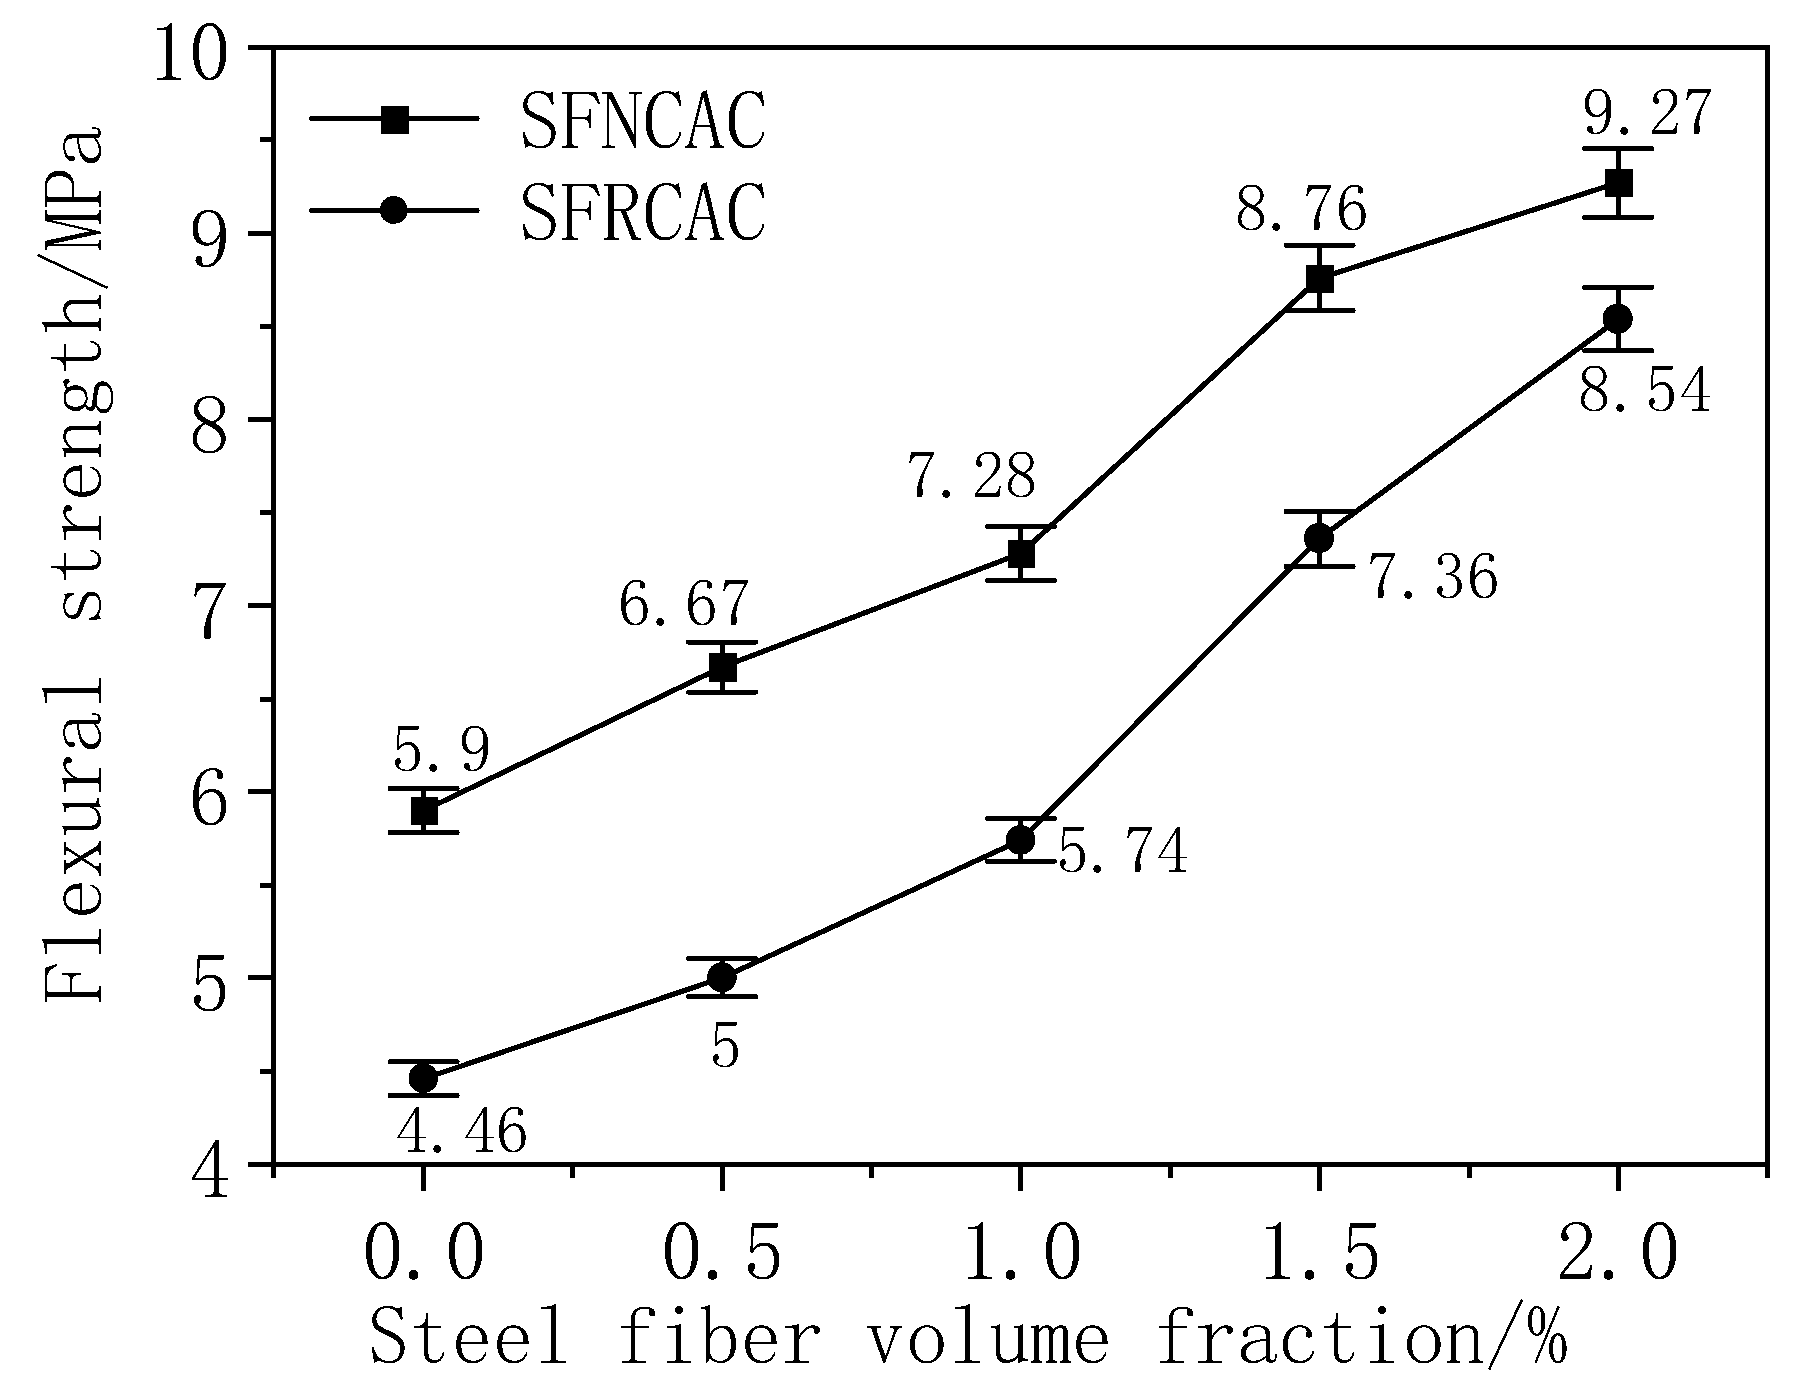
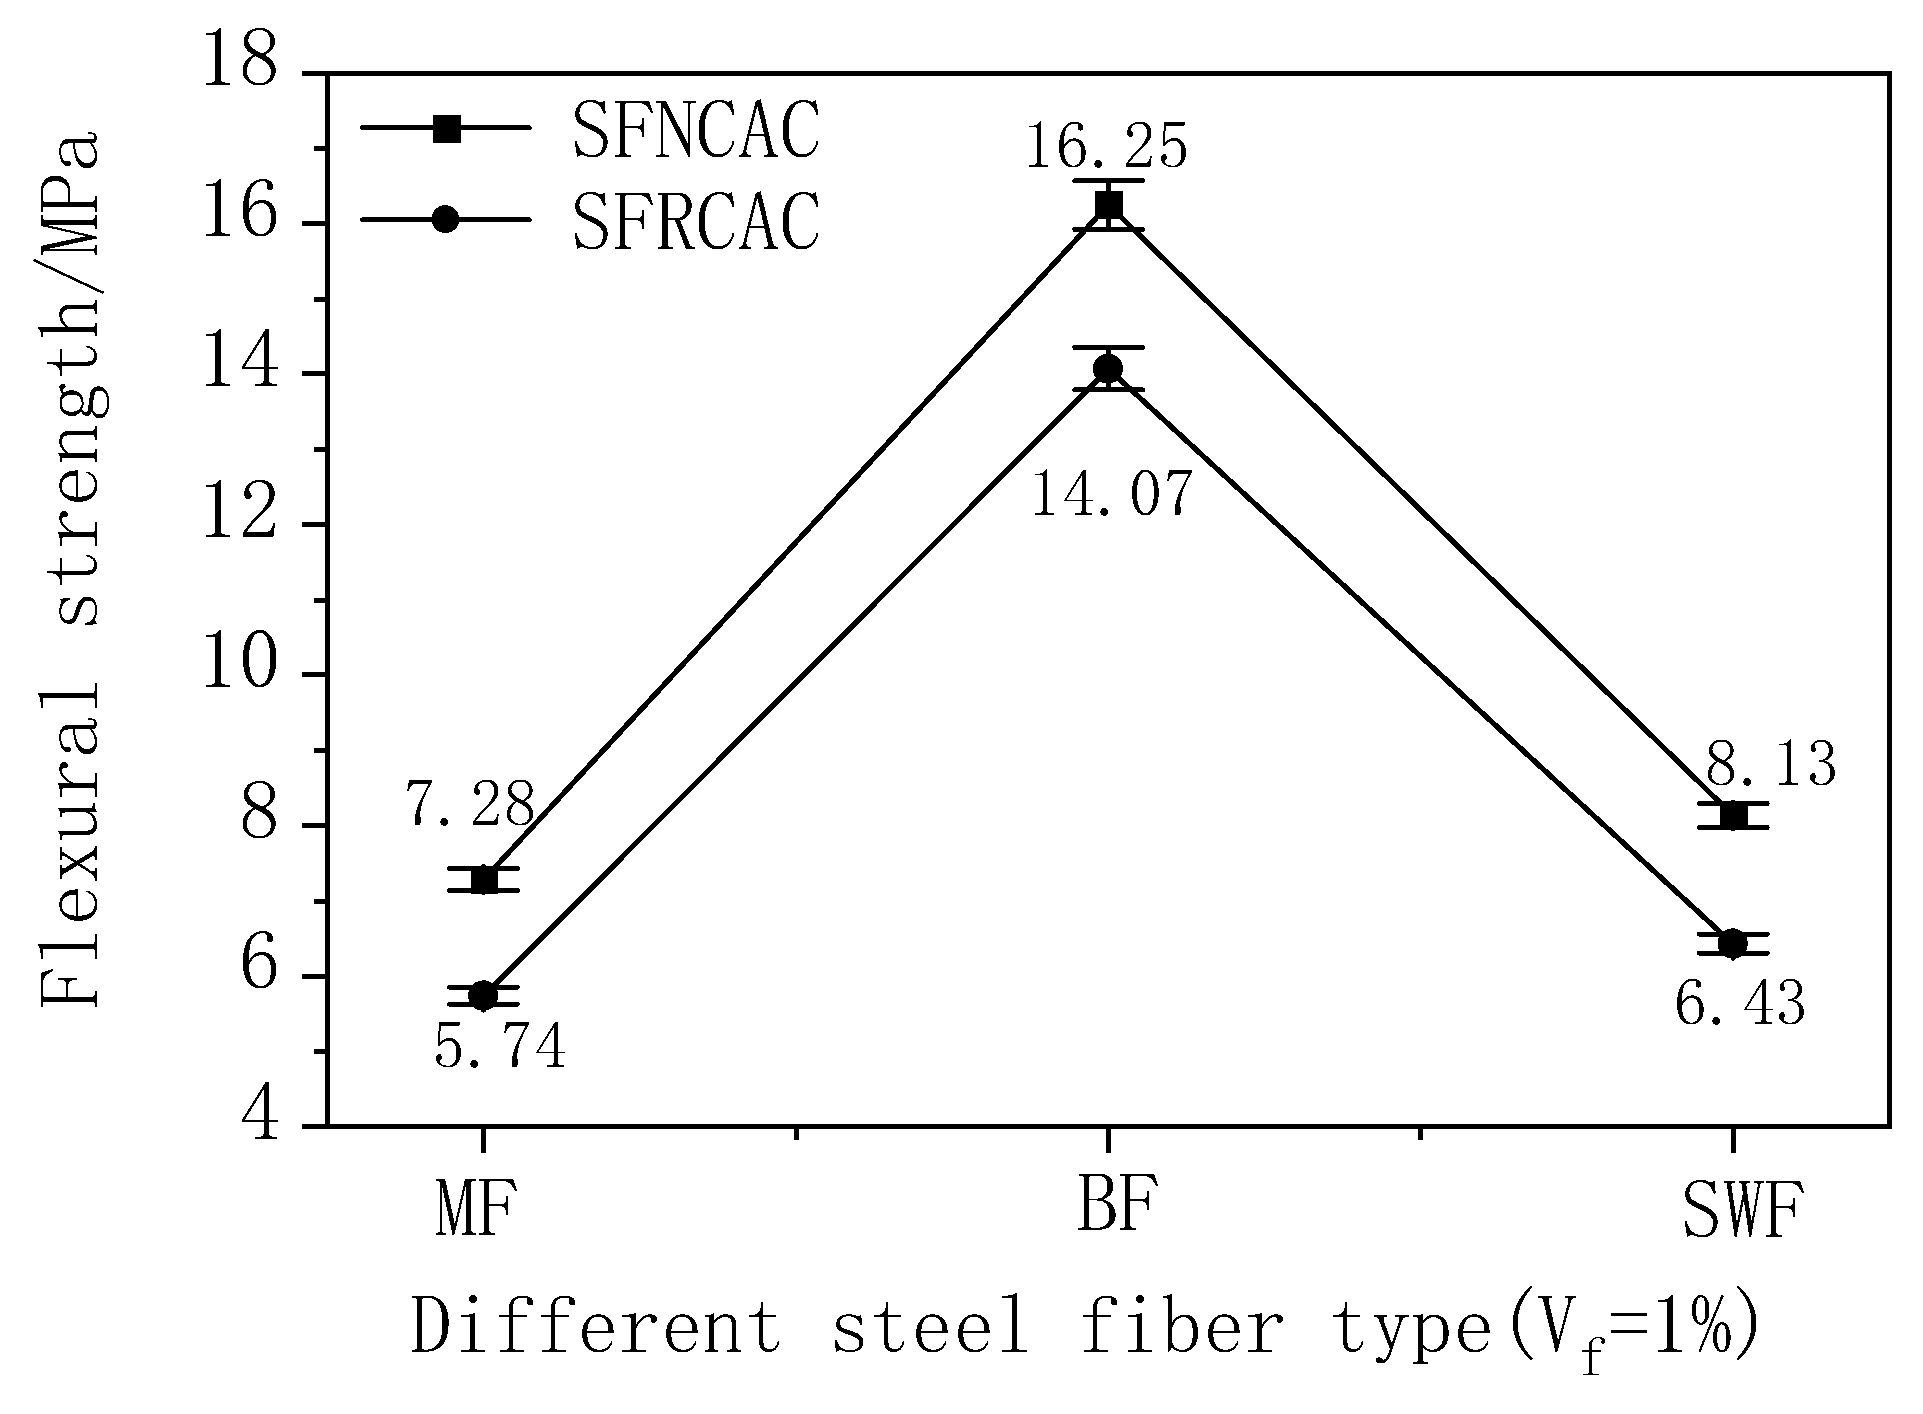
3.3. Flexural Strength
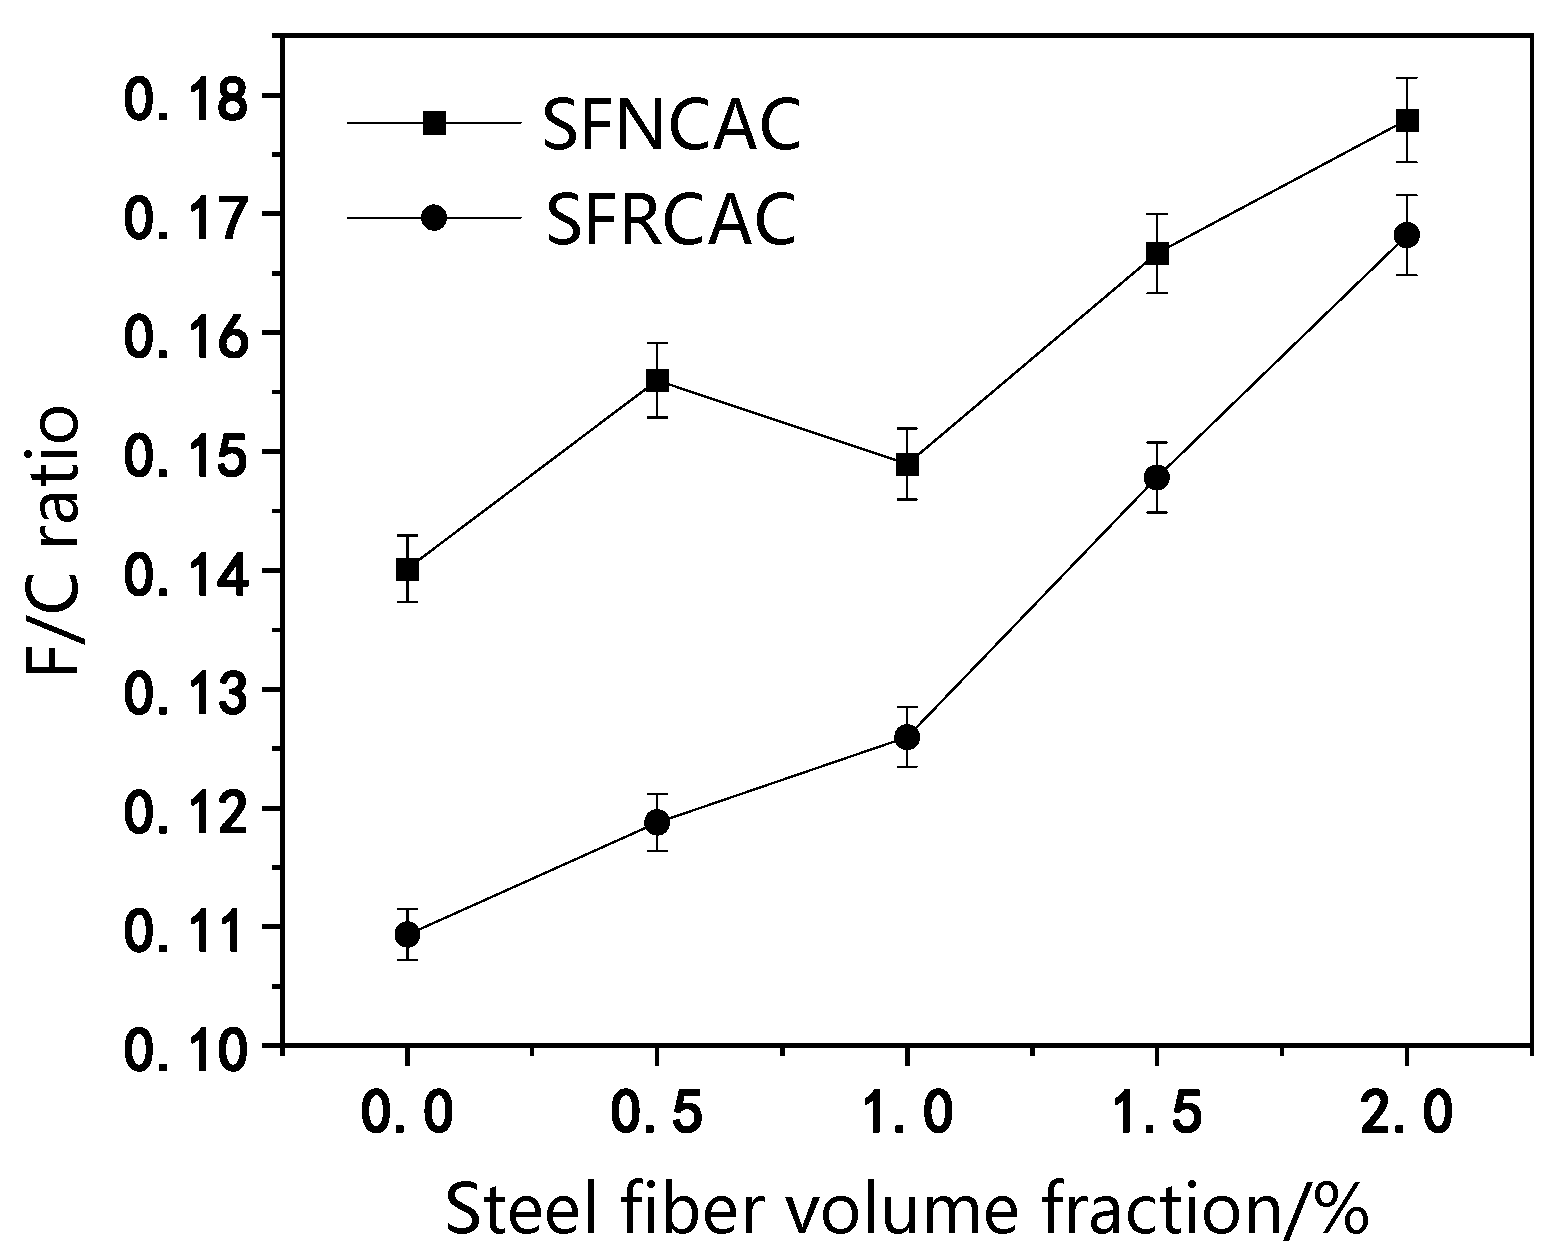
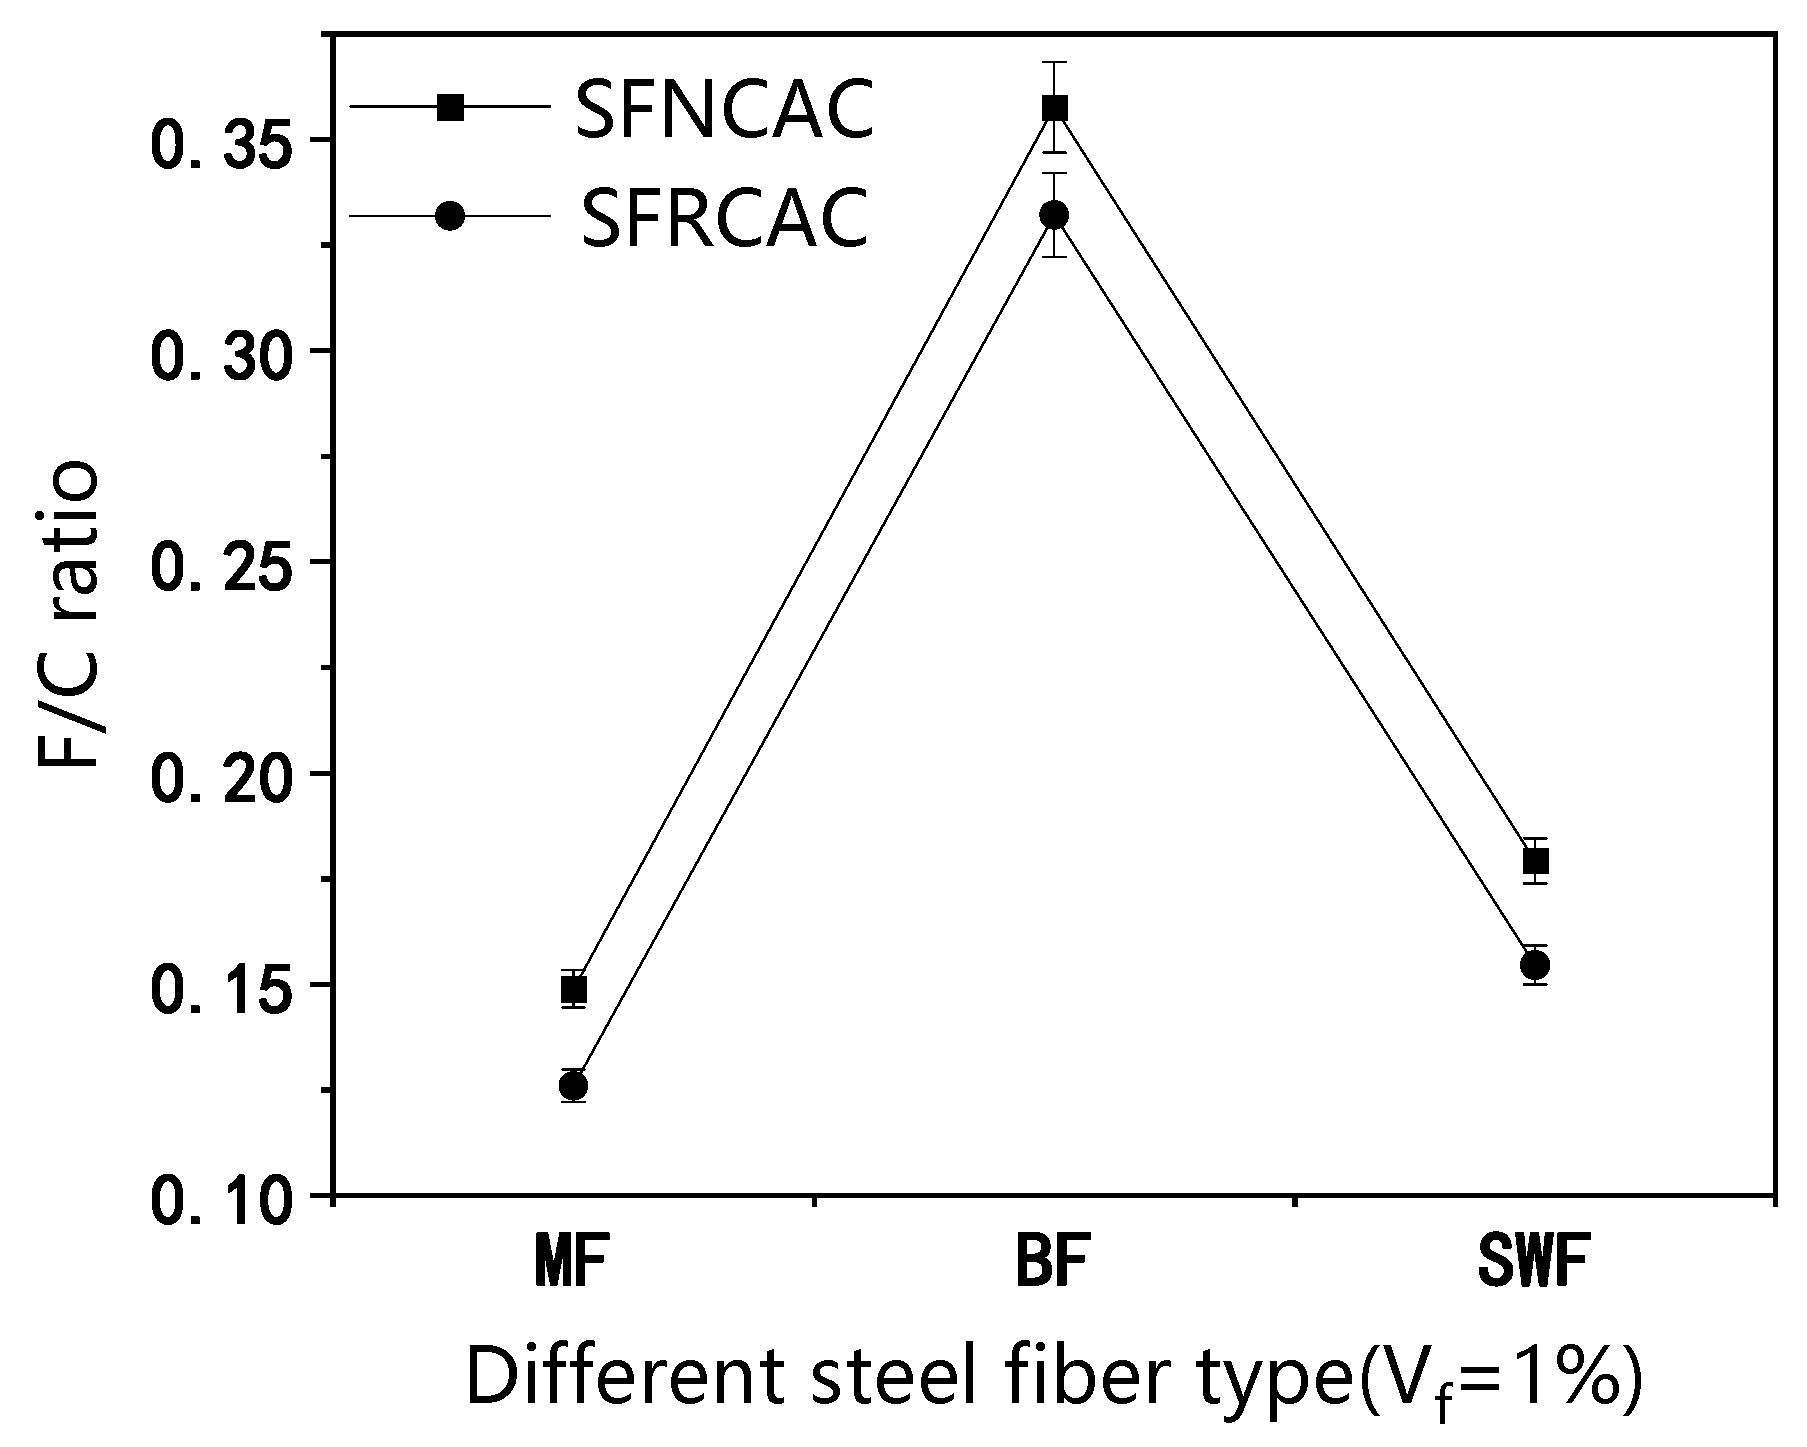
3.4. Flexural Strength to Compressive Strength Ratio
4. Reinforcing Effect of SF
4.1. Reinforcing Effect Evaluation
4.2. Reinforcing Effect Calculation
5. Value Engineering Analysis
6. Conclusions
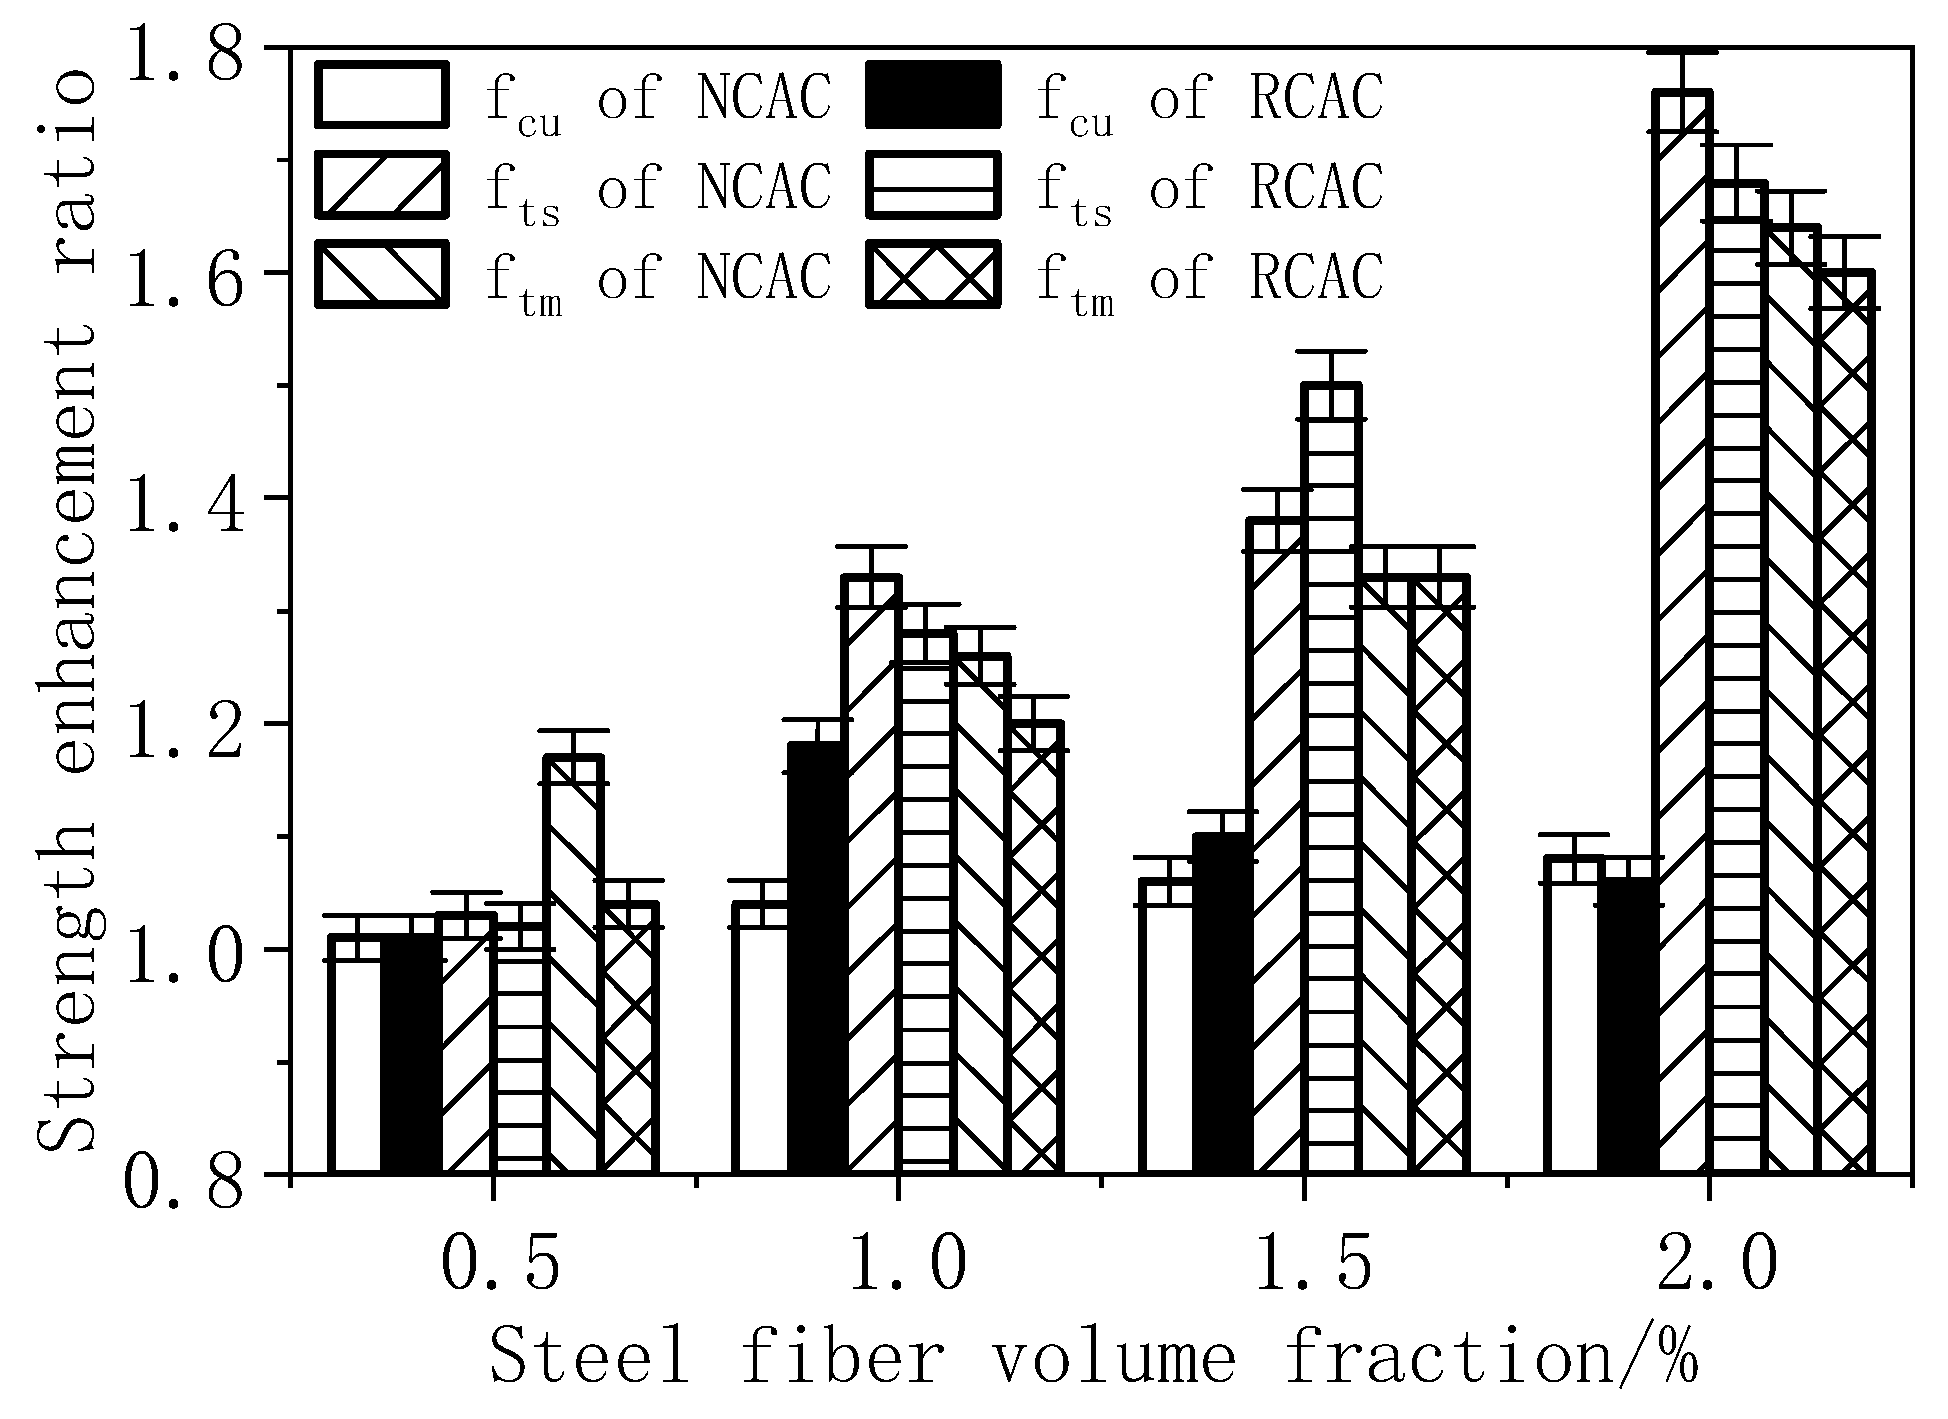
- Steel fiber has the same reinforcing effect on NCAC and RCAC. For RCAC, the suitable content range of SF is from 0.5% to 1.5% of in terms of the reinforcement effects on and . When ≤ 2%, the larger the , the higher the . The upper limit of for needs to be further studied.
- The reinforcing effect of SF on the strength of SFRCAC is related to the strength of the RCAC matrix. When all other conditions are equal, the SF with the larger diameter has the better reinforcing effect on the of RCAC; the steel fiber with the higher AR has the better reinforcing effect on the and of RCAC.
- Among the three types of steel fibers, MF and SF have similar reinforcing effects on , , and , However, the / values of SFNCAC and SFRCAC with BF are much higher than those with MF and SF because of the larger aspect ratio of the former.
- According to the value engineering analysis method, it can be inferred that although RCAC has the best cost performance, its mechanical properties are the worst, which makes it difficult to apply in practical engineering. Compared with SFNCAC, SFRCAC has lower cost and similar mechanical properties, which means that it has better cost performance.
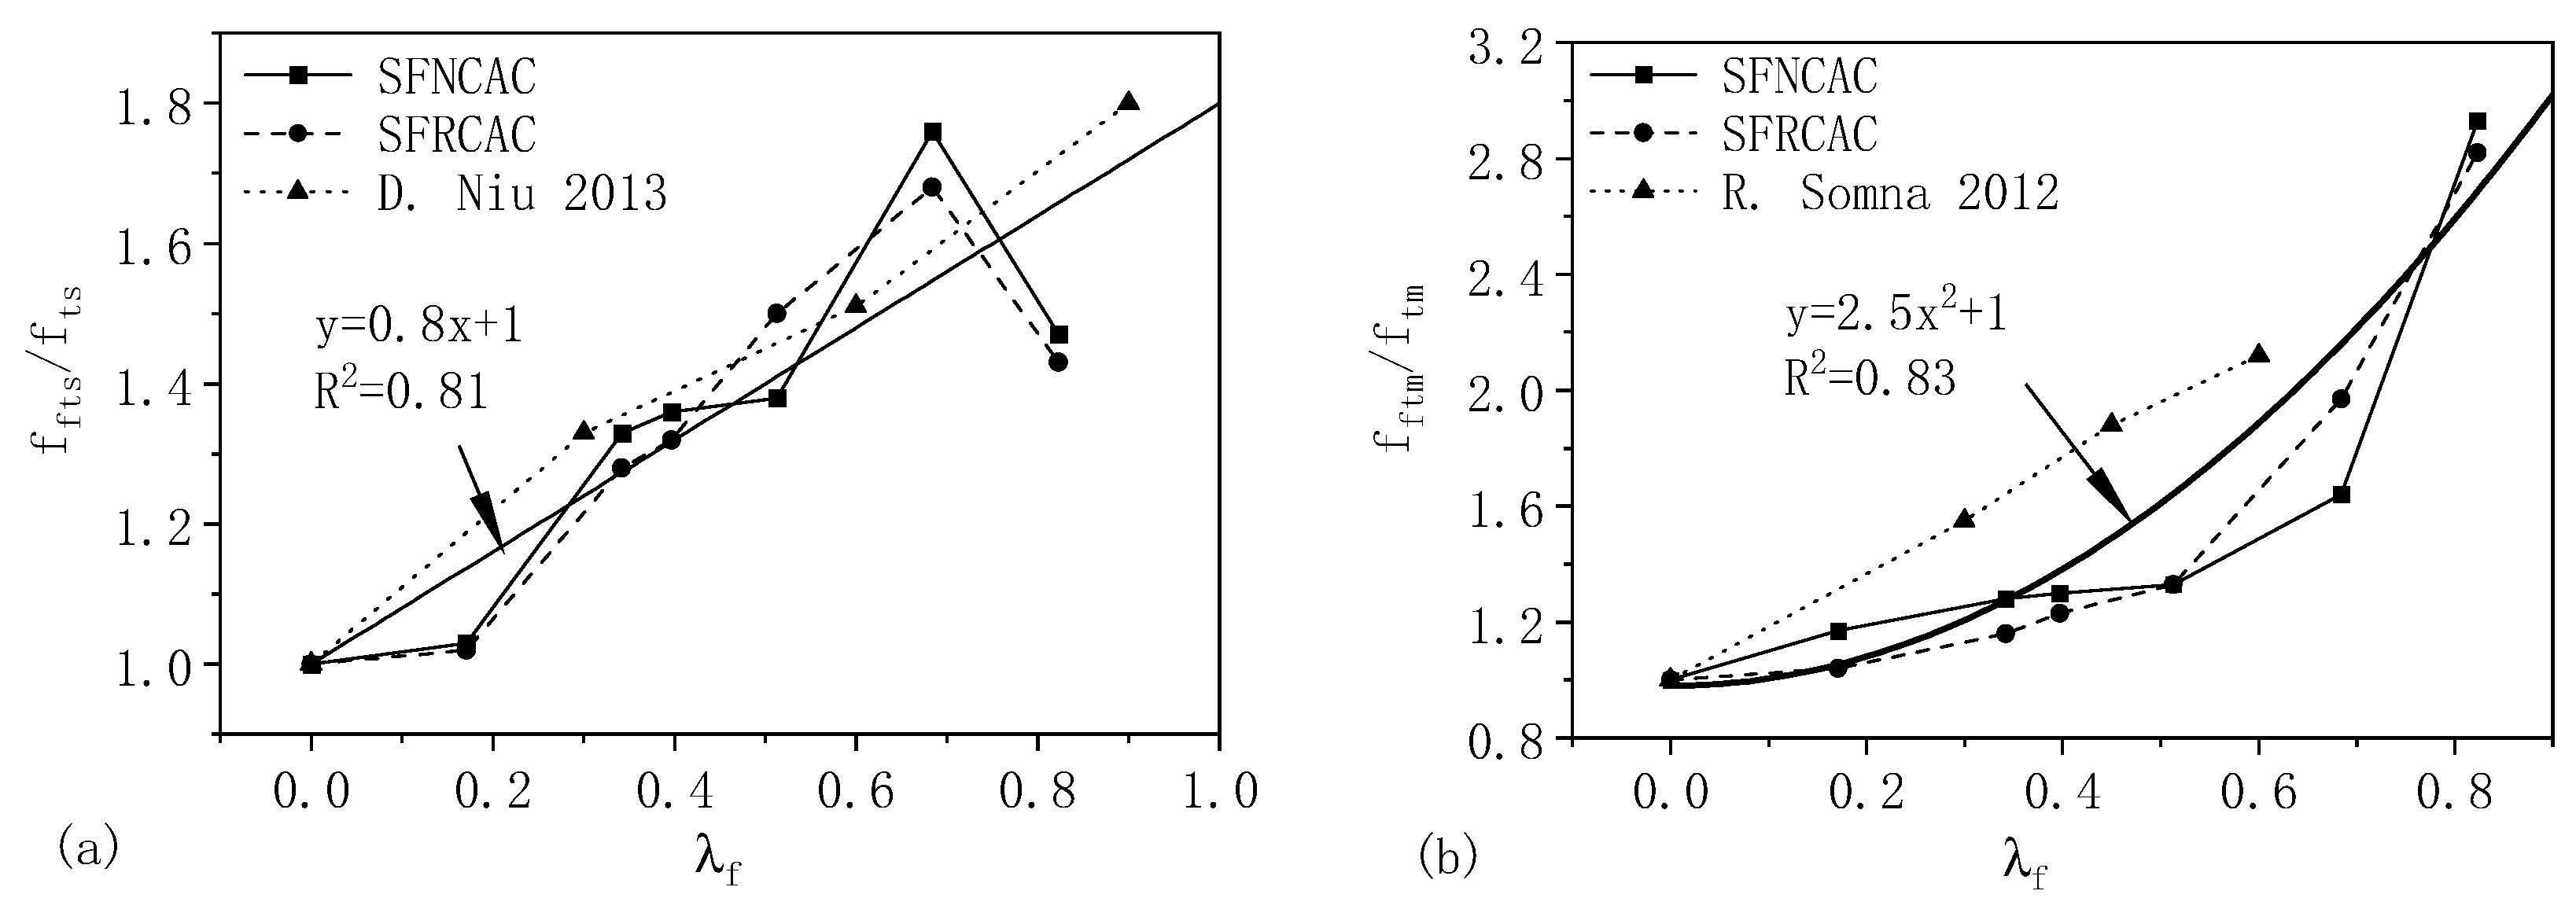
- The positive reinforcing effect of SF on the and of RCAC is much better than that on . A linear regression equation between / and , and a quadratic equation between / and of SFRCAC, were put forward. The content of steel fiber can be calculated by Equation (3) or Equation (4) when the required or of RCAC is given, respectively.
Author Contributions
Funding
Data Availability Statement
Conflicts of Interest
References
- Raman, J.V.M.; Ramasamy, V. Various treatment techniques involved to enhance the recycled coarse aggregate in concrete: A review. Mater. Today Proc. 2021, 45, 6356–6363. [Google Scholar] [CrossRef]
- Ma, Z.; Shen, J.; Wang, C.; Wu, H. Characterization of sustainable mortar containing high-quality recycled manufactured sand crushed from recycled coarse aggregate. Cem. Concr. Compos. 2022, 132, 104629. [Google Scholar] [CrossRef]
- Liu, H.; Liu, C.; Wu, Y.; Bai, G.; He, C.; Zhang, R.; Wang, Y. Hardened properties of 3D printed concrete with recycled coarse aggregate. Cem. Concr. Res. 2022, 159, 106868. [Google Scholar] [CrossRef]
- Bao, J.; Li, S.; Zhang, P.; Ding, X.; Xue, S.; Cui, Y.; Zhao, T. Influence of the incorporation of recycled coarse aggregate on water absorption and chloride penetration into concrete. Constr. Build Mater. 2020, 239, 117845. [Google Scholar] [CrossRef]
- Salesa, N.; Pérez-Benedicto, J.A.; Colorado-Aranguren, D.; López-Julián, P.L.; Esteban, L.M.; Sanz-Baldúz, L.J.; Sáez-Hostaled, J.L.; Ramis, J.; Olivares, D. Physico-mechanical properties of multi-recycled concrete from precast concrete industry. J. Clean. Prod. 2017, 141, 248–255. [Google Scholar] [CrossRef]
- Shi, C.; Li, Y.; Zhang, J.; Li, W.; Chong, L.; Xie, Z. Performance enhancement of recycled concrete aggregate—A review. J. Clean. Prod. 2016, 112, 466–472. [Google Scholar] [CrossRef]
- Kubissa, J.; Koper, M.; Koper, W.O.; Kubissa, W. Koper. Water Demand of Concrete Recycled Aggregates. Procedia Eng. 2015, 108, 63–71. [Google Scholar] [CrossRef]
- Hamad, B.S.; Dawi, A.H. Sustainable normal and high strength recycled aggregate concretes using crushed tested cylinders as coarse aggregates. Case Stud. Constr. Mater. 2017, 7, 228–239. [Google Scholar] [CrossRef]
- Bravo, M.; de Brito, J.; Evangelista, L.; Pacheco, J. Superplasticizer’s efficiency on the mechanical properties of recycled aggregates concrete: Influence of recycled aggregates composition and incorporation ratio. Constr. Build. Mater. 2017, 153, 129–138. [Google Scholar] [CrossRef]
- He, Z.; Zhang, J. Strength characteristics and failure criterion of plain recycled aggregate concrete under triaxial stress states. Constr. Build. Mater. 2014, 54, 354–362. [Google Scholar] [CrossRef]
- Omary, S.; Ghorbel, E. Wardeh. Relationships between recycled concrete aggregates characteristics and recycled aggregates concretes properties. Constr. Build. Mater. 2016, 108, 163–174. [Google Scholar] [CrossRef]
- Khodair, Y.; Bommareddy, B. Self-consolidating concrete using recycled concrete aggregate and high volume of fly ash, and slag. Constr. Build. Mater. 2017, 153, 307–316. [Google Scholar] [CrossRef]
- Ding, T.; Xiao, J.; Tam, V.W.Y. A closed-loop life cycle assessment of recycled aggregate concrete utilization in China. Waste Manag. 2016, 56, 367–375. [Google Scholar] [CrossRef] [PubMed]
- Xiao, J.; Li, W.; Fan, Y.; Huang, X. An overview of study on recycled aggregate concrete in China (1996–2011). Constr. Build. Mater. 2012, 31, 364–383. [Google Scholar] [CrossRef]
- Afroughsabet, V.; Biolzi, L.; Ozbakkaloglu, T. Influence of double hooked-end steel fibers and slag on mechanical and durability properties of high performance recycled aggregate concrete. Compos. Struct. 2017, 181, 273–284. [Google Scholar]
- Carneiro, J.A.; Lima, P.R.L.; Leite, M.N.B.; Filho, R.D.T. Compressive stress–strain behavior of steel fiber reinforced-recycled aggregate concrete. Cem. Concr. Compos. 2014, 46, 65–72. [Google Scholar] [CrossRef]
- Gao, D.; Zhang, L.; Nokken, M. Mechanical behavior of recycled coarse aggregate concrete reinforced with steel fibers under direct shear. Cem. Concr. Compos. 2017, 79, 1–8. [Google Scholar] [CrossRef]
- Li, L.; Yan, C.; Zhang, N.; Farooqi, M.U.; Xu, S.; Deifalla, A.F. Flexural fracture parameters of polypropylene fiber reinforced geopolymer. J. Mater. Res. Technol. 2023, 24, 1839–1855. [Google Scholar] [CrossRef]
- Li, L.; Qin, Y.; Cao, M.; Guan, J.; Xie, C. Bending performance and calculation of reinforced beam with hybrid fiber and CaCO3 whisker. Comput. Concr. 2023, 31, 197–206. [Google Scholar]
- Gao, D.; Zhu, W.; Fang, D.; Tang, J.; Zhu, H. Shear behavior analysis and capacity prediction for the steel fiber reinforced concrete beam with recycled fine aggregate and recycled coarse aggregate. Structures 2022, 37, 44–55. [Google Scholar] [CrossRef]
- Li, L.; Ma, Z.; Ming, X. Multiscale ab-initio modeling and experiment of nano-CaCO3 and fiber synergy on toughening low-carbon geopolymer composites. Mater. Des. 2023, 233, 112280. [Google Scholar] [CrossRef]
- Jang, S.; Yun, H. Combined effects of steel fiber and coarse aggregate size on the compressive and flexural toughness of high-strength concrete. Compos. Struct. 2018, 185, 203–211. [Google Scholar] [CrossRef]
- GB/175-2007; Common Portland Cement. China Standards Press: Beijing, China, 2007.
- ASTM C33-13; Standard Specification for Concrete Aggregates. ASTM: West Conshohocken, PA, USA, 2013.
- GB/T 25177; Recycled Coarse Aggregate for Concrete. China Standards Press: Beijing, China, 2010.
- GB/T 14685; Pebble and Crushed Stone for Construction. China Standards Press: Beijing, China, 2011.
- JGJ/T 221-2010; Technical Specification for Application of Fiber Reinforced Concrete. China National Standardization Administration: Beijing, China, 2010.
- Gao, D.; Zhao, J.; Zhu, H. Design and Application of Steel Fiber Concrete; China Construction Industry Press: Beijing, China, 2002. [Google Scholar]
- GB/T50081; Standard for Test Method of Mechanical Properties on Ordinary Concrete. China Architecture & Building Press: Beijing, China, 2002.
- ASTM C1609; Standard Test Method for Flexural Performance of Fiber-Reinforced Concrete (Using Beam with Third-Point Loading). ASTM International: West Conshohocken, PA, USA, 2012.
- Mukharjee, B.B.; Barai, S.V. Influence of incorporation of nano-silica and recycled aggregates on compressive strength and microstructure of concrete. Constr. Build. Mater. 2014, 71, 570–578. [Google Scholar] [CrossRef]
- Silva, R.V.; de Brito, J.; Dhir, R.K. Establishing a relationship between modulus of elasticity and compressive strength of recycled aggregate concrete. J. Clean. Prod. 2016, 112, 2171–2186. [Google Scholar]
- Cao, M.; Zhang, C.; Li, Y.; Wei, J. Using Calcium Carbonate Whisker in Hybrid Fiber-Reinforced Cementitious Composites. J. Mater. Civ. Eng. 2015, 27, 4014139. [Google Scholar] [CrossRef]
- Niu, D.; Jiang, L.; Bai, M.; Miao, Y. Study of the performance of steel fiber reinforced concrete to water and salt freezing condition. Mater. Des. 2013, 44, 267–273. [Google Scholar] [CrossRef]
- Kim, H.; Kim, G.; Gucunski, N.; Nam, J.; Jeon, J. Assessment of flexural toughness and impact resistance of bundle-type polyamide fiber-reinforced concrete. Compos. Part B Eng. 2015, 78, 431–446. [Google Scholar] [CrossRef]
- Somna, R.; Jaturapitakkul, C.; Chalee, W.; Rattanachu, P. Effect of the Water to Binder Ratio and Ground Fly Ash on Properties of Recycled Aggregate Concrete. J. Mater. Civ. Eng. 2012, 24, 16–22. [Google Scholar] [CrossRef]


| Name | Abridge |
|---|---|
| Steel-fiber-reinforced recycled coarse aggregate concrete | SFRCAC |
| Natural recycled coarse aggregate concrete | NCAC |
| Steel fibers | SF |
| Milling fiber | MF |
| Shear-wave fiber | SWF |
| Both-end hooked fiber | BF |
| Volume fraction | |
| Compressive strength | |
| Splitting tensile strength | |
| Flexural strength |
| Type | Specific Gravity (kg/m3) | Surface Area (m2/kg) | Standard Consistency (%) | Stability | Setting Time (Min) | Compressive Strength (MPa) | Flexural Strength (MPa) | |||
|---|---|---|---|---|---|---|---|---|---|---|
| Initial | Final | 3 d | 28 d | 3 d | 28 d | |||||
| P.O 42.5 | 3100 | 352 | 24.7 | Eligibility | 175 | 220 | 23.5 | 45 | 5.6 | 8.5 |
| Aggregate Type | Apparent Density (kg/m3) | Loose Packing Density (kg/m3) | Dry-Rodded Density (kg/m3) | Water Absorption (wt%) | Crushing Index (%) | Void Ratio (%) |
|---|---|---|---|---|---|---|
| RCA | 2640 | 1302 | 1412 | 4.85 | 17.7 | 50.3 |
| NCA | 2814 | 1568 | 1630 | 1.40 | 8.8 | 44.3 |
| Sand | 2556 | 1611 | 1486 | 0.56 | - | - |
| Type | Mean Length (lf)/mm | Mean Diameter (df)/mm | Aspect Ratio (lf/df) |
|---|---|---|---|
| Milling (MF) | 32.3 | 0.944 | 34.2 |
| Shear-wave (SWF) | 30.0 | 0.756 | 39.7 |
| Both-end hooked (BF) | 62.0 | 0.753 | 82.3 |
| Specimen No. | Water | Cement | Sand | NCA | RCA | Steel Fiber | /MPa | /MPa | /MPa |
|---|---|---|---|---|---|---|---|---|---|
| NC | 164 | 342 | 721 | 1283 | 0 | 0 | 42.10 | 3.77 | 5.90 |
| RC | 164 | 342 | 721 | 0 | 1283 | 0 | 40.78 | 3.11 | 4.46 |
| NCMF0.5 | 172 | 358 | 749 | 1171 | 0 | 39 | 42.76 | 3.81 | 6.67 |
| NCNF0.5-C | 172 | 358 | 749 | 1171 | 0 | 0 | 42.32 | 3.69 | 5.71 |
| RCMF0.5 | 172 | 358 | 749 | 0 | 1171 | 39 | 42.09 | 3.28 | 5.00 |
| RCNF0.5-C | 172 | 358 | 749 | 0 | 1171 | 0 | 41.80 | 3.22 | 4.79 |
| NCMF1.0 | 180 | 375 | 796 | 1099 | 0 | 78 | 48.87 | 5.06 | 7.28 |
| NCBF1.0 | 180 | 375 | 796 | 1099 | 0 | 78 | 45.44 | 5.61 | 16.25 |
| NCSWF1.0 | 180 | 375 | 796 | 1099 | 0 | 78 | 45.37 | 5.19 | 8.13 |
| NCNF1.0-C | 180 | 375 | 796 | 1099 | 0 | 0 | 47.05 | 3.81 | 5.78 |
| RCMF1.0 | 180 | 375 | 796 | 0 | 1099 | 78 | 45.56 | 4.12 | 5.74 |
| RCBF1.0 | 180 | 375 | 796 | 0 | 1099 | 78 | 42.63 | 4.61 | 14.07 |
| RCSWF1.0 | 180 | 375 | 796 | 0 | 1099 | 78 | 41.60 | 4.24 | 6.43 |
| RCNF1.0-C | 180 | 375 | 796 | 0 | 1099 | 0 | 38.59 | 3.22 | 4.79 |
| NCMF1.5 | 188 | 392 | 842 | 1029 | 0 | 117 | 52.56 | 5.43 | 8.76 |
| NCNF1.5-C | 188 | 392 | 842 | 1029 | 0 | 0 | 49.42 | 3.94 | 6.59 |
| RCMF1.5 | 188 | 392 | 842 | 0 | 1029 | 117 | 49.79 | 5.57 | 7.36 |
| RCNF1.5-C | 188 | 392 | 842 | 0 | 1029 | 0 | 45.12 | 3.71 | 5.53 |
| NCMF2.0 | 196 | 408 | 886 | 960 | 0 | 156 | 52.11 | 5.67 | 9.27 |
| NCNF2.0-C | 196 | 408 | 886 | 960 | 0 | 0 | 48.29 | 3.23 | 5.65 |
| RCMF 2.0 | 196 | 408 | 886 | 0 | 960 | 156 | 50.77 | 5.58 | 8.54 |
| RCNF2.0-C | 196 | 408 | 886 | 0 | 960 | 0 | 48.07 | 3.32 | 5.34 |
| Specimen Designation | NCAC | RCAC | SFNCAC | SFRCAC |
|---|---|---|---|---|
| /MPa | 48.29 | 48.07 | 52.11 | 50.77 |
| /MPa | 3.23 | 3.32 | 5.67 | 5.58 |
| /MPa | 5.65 | 5.34 | 9.27 | 8.54 |
| Strength evaluation | 19.06 | 18.91 | 22.35 | 21.63 |
| Total cost | 491.75 | 234.66 | 725.75 | 468.66 |
| Value | 0.04 | 0.08 | 0.03 | 0.05 |
Disclaimer/Publisher’s Note: The statements, opinions and data contained in all publications are solely those of the individual author(s) and contributor(s) and not of MDPI and/or the editor(s). MDPI and/or the editor(s) disclaim responsibility for any injury to people or property resulting from any ideas, methods, instructions or products referred to in the content. |
© 2023 by the authors. Licensee MDPI, Basel, Switzerland. This article is an open access article distributed under the terms and conditions of the Creative Commons Attribution (CC BY) license (https://creativecommons.org/licenses/by/4.0/).
Share and Cite
You, P.; Ma, Z.; Zhang, L.; Wang, Y.; Feng, Q.; Li, L. Impact of Steel Fiber Volume Fraction and Morphology on the Strength of Recycled Aggregate Concrete. Buildings 2023, 13, 2341. https://doi.org/10.3390/buildings13092341
You P, Ma Z, Zhang L, Wang Y, Feng Q, Li L. Impact of Steel Fiber Volume Fraction and Morphology on the Strength of Recycled Aggregate Concrete. Buildings. 2023; 13(9):2341. https://doi.org/10.3390/buildings13092341
Chicago/Turabian StyleYou, Peibo, Zhili Ma, Lijuan Zhang, Yi Wang, Qi Feng, and Li Li. 2023. "Impact of Steel Fiber Volume Fraction and Morphology on the Strength of Recycled Aggregate Concrete" Buildings 13, no. 9: 2341. https://doi.org/10.3390/buildings13092341
APA StyleYou, P., Ma, Z., Zhang, L., Wang, Y., Feng, Q., & Li, L. (2023). Impact of Steel Fiber Volume Fraction and Morphology on the Strength of Recycled Aggregate Concrete. Buildings, 13(9), 2341. https://doi.org/10.3390/buildings13092341