Article

Comparison of Local Mean Age of Air between Displacement Ventilation System and Mixing Ventilation System in Office Heating Conditions during Winter

1
School of Mechanical Engineering, Hanyang University, Seoul 04763, Republic of Korea
2
EURUS, Hwaseong-si 18545, Republic of Korea
*
Author to whom correspondence should be addressed.
Buildings 2024, 14(1), 115; https://doi.org/10.3390/buildings14010115
Submission received: 6 October 2023 / Revised: 27 December 2023 / Accepted: 29 December 2023 / Published: 1 January 2024
(This article belongs to the Topic Indoor Air Quality and Built Environment)

Abstract

:
A novel displacement ventilation system (DVS) was designed using a four-way cassette fan coil unit (FCU) and air purifiers (APs) for supplying clean air. The proposed DVS in this study involved drawing indoor air through the FCU and diffusers installed in the ceiling, controlling air temperature using the FCU, and then discharging it back into the office through the APs placed on the floor. The comparative ventilation system considered was the typical mixing ventilation system (MVS) that intakes and exhausts indoor air using diffusers installed on the ceiling. The local mean age of air was used as an index to compare indoor air quality between DVS and MVS under winter heating conditions. It was found that the DVS was more effective in improving indoor air quality in winter than the MVS. Moreover, compared to the MVS, utilizing the DVS designed in this study resulted in the advantage of a much more uniform air temperature variation in the office space. Therefore, it is anticipated that modifying the structure of an indoor space with an FCU installed in the ceiling and APs on the floor to use the DVS designed in this study would greatly assist in enhancing indoor air quality.

1. Introduction

Since the first outbreak of COVID-19 in December 2019, over 500 million people have been infected, and more than 6 million have died due to the virus [1]. The spread of the virus can be largely categorized into droplet transmission and airborne transmission. Especially, airborne transmission refers to the transport of the virus contained within droplets smaller than 5 μm, traveling as aerosols along the flow of air, leading to infections. The size of the COVID-19 virus has been observed to range from 0.06 to 0.14 μm, enabling the virus to remain suspended in the air for extended periods, thereby making it possible to be transported along indoor air currents [2,3]. Therefore, similar to the SARS-CoV outbreak in 2002 and the MERS-CoV outbreak in 2015, there has been significant concern about the potential for COVID-19 to spread through the air and infect via the respiratory system [4,5,6,7,8,9,10]. Many modern people spend more than 87% of their daily lives indoors [11]. To prevent the spread of viruses in indoor spaces, it is important to monitor various environmental factors indoors [12,13], and especially it is essential to control indoor air currents using ventilation devices. According to Li et al. [14], there is a high likelihood of the virus spreading through the air in crowded spaces if there is no proper ventilation. Numerous cases of the virus spreading in the form of airborne transmission have been reported in indoor spaces such as restaurants [14], public transportation [15], hospitals [16], airplanes [17], and offices [18] when ventilation was not properly maintained. Because indoor ventilation is very important to reduce the likelihood of virus spreading, various studies on ventilation have been conducted to improve indoor air quality [19,20,21,22,23,24,25,26,27].
Since many people spend a long time indoors during the day, not only indoor air quality but also thermal comfort are important factors that can impact human health. To maintain indoor thermal comfort, it is essential to maintain an appropriate temperature. While separate heating or cooling devices can be installed for this purpose, in many cases, the heating, ventilating, and air conditioning (HVAC) system is used to control the temperature. The mixing ventilation system (MVS) is currently the most widely used air conditioning system. MVS supplies outdoor air and mixes it with indoor air to provide improved air quality. MVS offers the benefit of quickly achieving uniform temperature and humidity levels across the entire area, making it advantageous for use in diverse environmental conditions. Particularly, MVS is useful in spaces with architectural constraints due to its structurally simple nature. In the meanwhile, the displacement ventilation system (DVS) supplies air at a low velocity near the floor and exhausts it through outlets in the upper layer [28,29]. DVS is effective in spaces where heat loads primarily come from people or machinery, and it particularly demonstrates excellent efficiency in environments like offices or residential spaces where people spend the majority of their time sitting.
Many studies have compared the performance of MVS and DVS, shedding light on the distinct effects and efficiency between these two systems. Yin et al. [30] confirmed that DVS can either provide better or worse air quality depending on the position of the exhaust outlets in patient wards, compared with MVS. Ahn et al. [31] compared the energy efficiency of MVS and DVS in partitioned office spaces, and they found that MVS was more advantageous in energy savings when diffusers were used for each partitioned zone, whereas DVS demonstrated superior energy efficiency and ventilation effectiveness when a single diffuser was used for multiple partitioned zones. Wang et al. [32] compared the characteristics of pollution exposure induced by human surface chemical reactions in a space equipped with MVS or DVS, and they concluded that using DVS led to distinct changes in pollutant concentrations in the breathing zone while MVS was relatively more influential at controlling pollution exposure. Wei et al. [33] were able to reduce the maximum mist concentration by more than 70% in a factory with high oil mist using DVS. Zhao et al. [34] investigated the ventilation performance of four different air distribution methods under summer and winter conditions, and reported that DVS showed superior performance for efficient air distribution and temperature control in classrooms compared to other methods. Rencken et al. [35] investigated the distribution of aerosol concentrations in classrooms under various conditions. They found that with a typical ventilation system, the indoor aerosol concentration is not uniform at all points, but is actually 50% higher at the level of human respiration, and emphasized the need for DVS.
As abovementioned, many studies have been conducted on the analysis of air quality based on the use of indoor airflow-generating devices. However, there is a notable lack of research focusing on improving air quality at the respiratory height of people who spend a long time indoors. This study focused on offices where workers spend a considerable amount of time. It was aimed to enhance the overall air quality in the office, especially considering the fact that workers predominantly sit for extended periods in the office, and ways to improve air quality at the height of the respiratory zone were specifically researched. In spaces where mechanical ventilation systems like MVS and DVS are not installed, a four-way cassette fan coil unit (FCU) is often used for indoor temperature control while an air purifier (AP) operates independently for the removal of indoor pollutants. In such configurations, temperature distribution is often uneven and areas with poor air quality can arise. There has been a lack of research addressing this issue, for a situation where FCU and AP are operated independently. In this study, we aimed to depart from the conventional approach of independently operating FCUs and APs and instead propose a new method of integrating these two devices to introduce a novel DVS approach. The reason for selecting the DVS approach is because there is concern that MVS may spread air containing viruses over long distances [28,30,36]. A common index for evaluating air quality is the age of air, which indicates the time taken for clean air entering the indoor space to reach a specific point. Hence, the local mean age of air (LMA) signifies how quickly fresh air is delivered to a particular location, with a lower LMA indicating better air quality at that position. To date, there has been no study comparing the LMA between MVS and DVS when warm air is supplied from the ventilation system inlet, nor has there been any papers comparing LMA based on the supplied air temperature. In this study, therefore, a DVS utilizing an FCU and multiple APs was designed to effectively utilize the buoyancy generated by the use of heating systems during the winter, thereby reducing the LMA. The air quality resulting from the use of DVS was evaluated through experiments and numerical analysis, and was compared with the air quality resulting from the typical use of MVS. Furthermore, changes in LMA based on the temperature and flowrate of the air discharged from the ventilation system were analyzed.

2. Materials and Methods

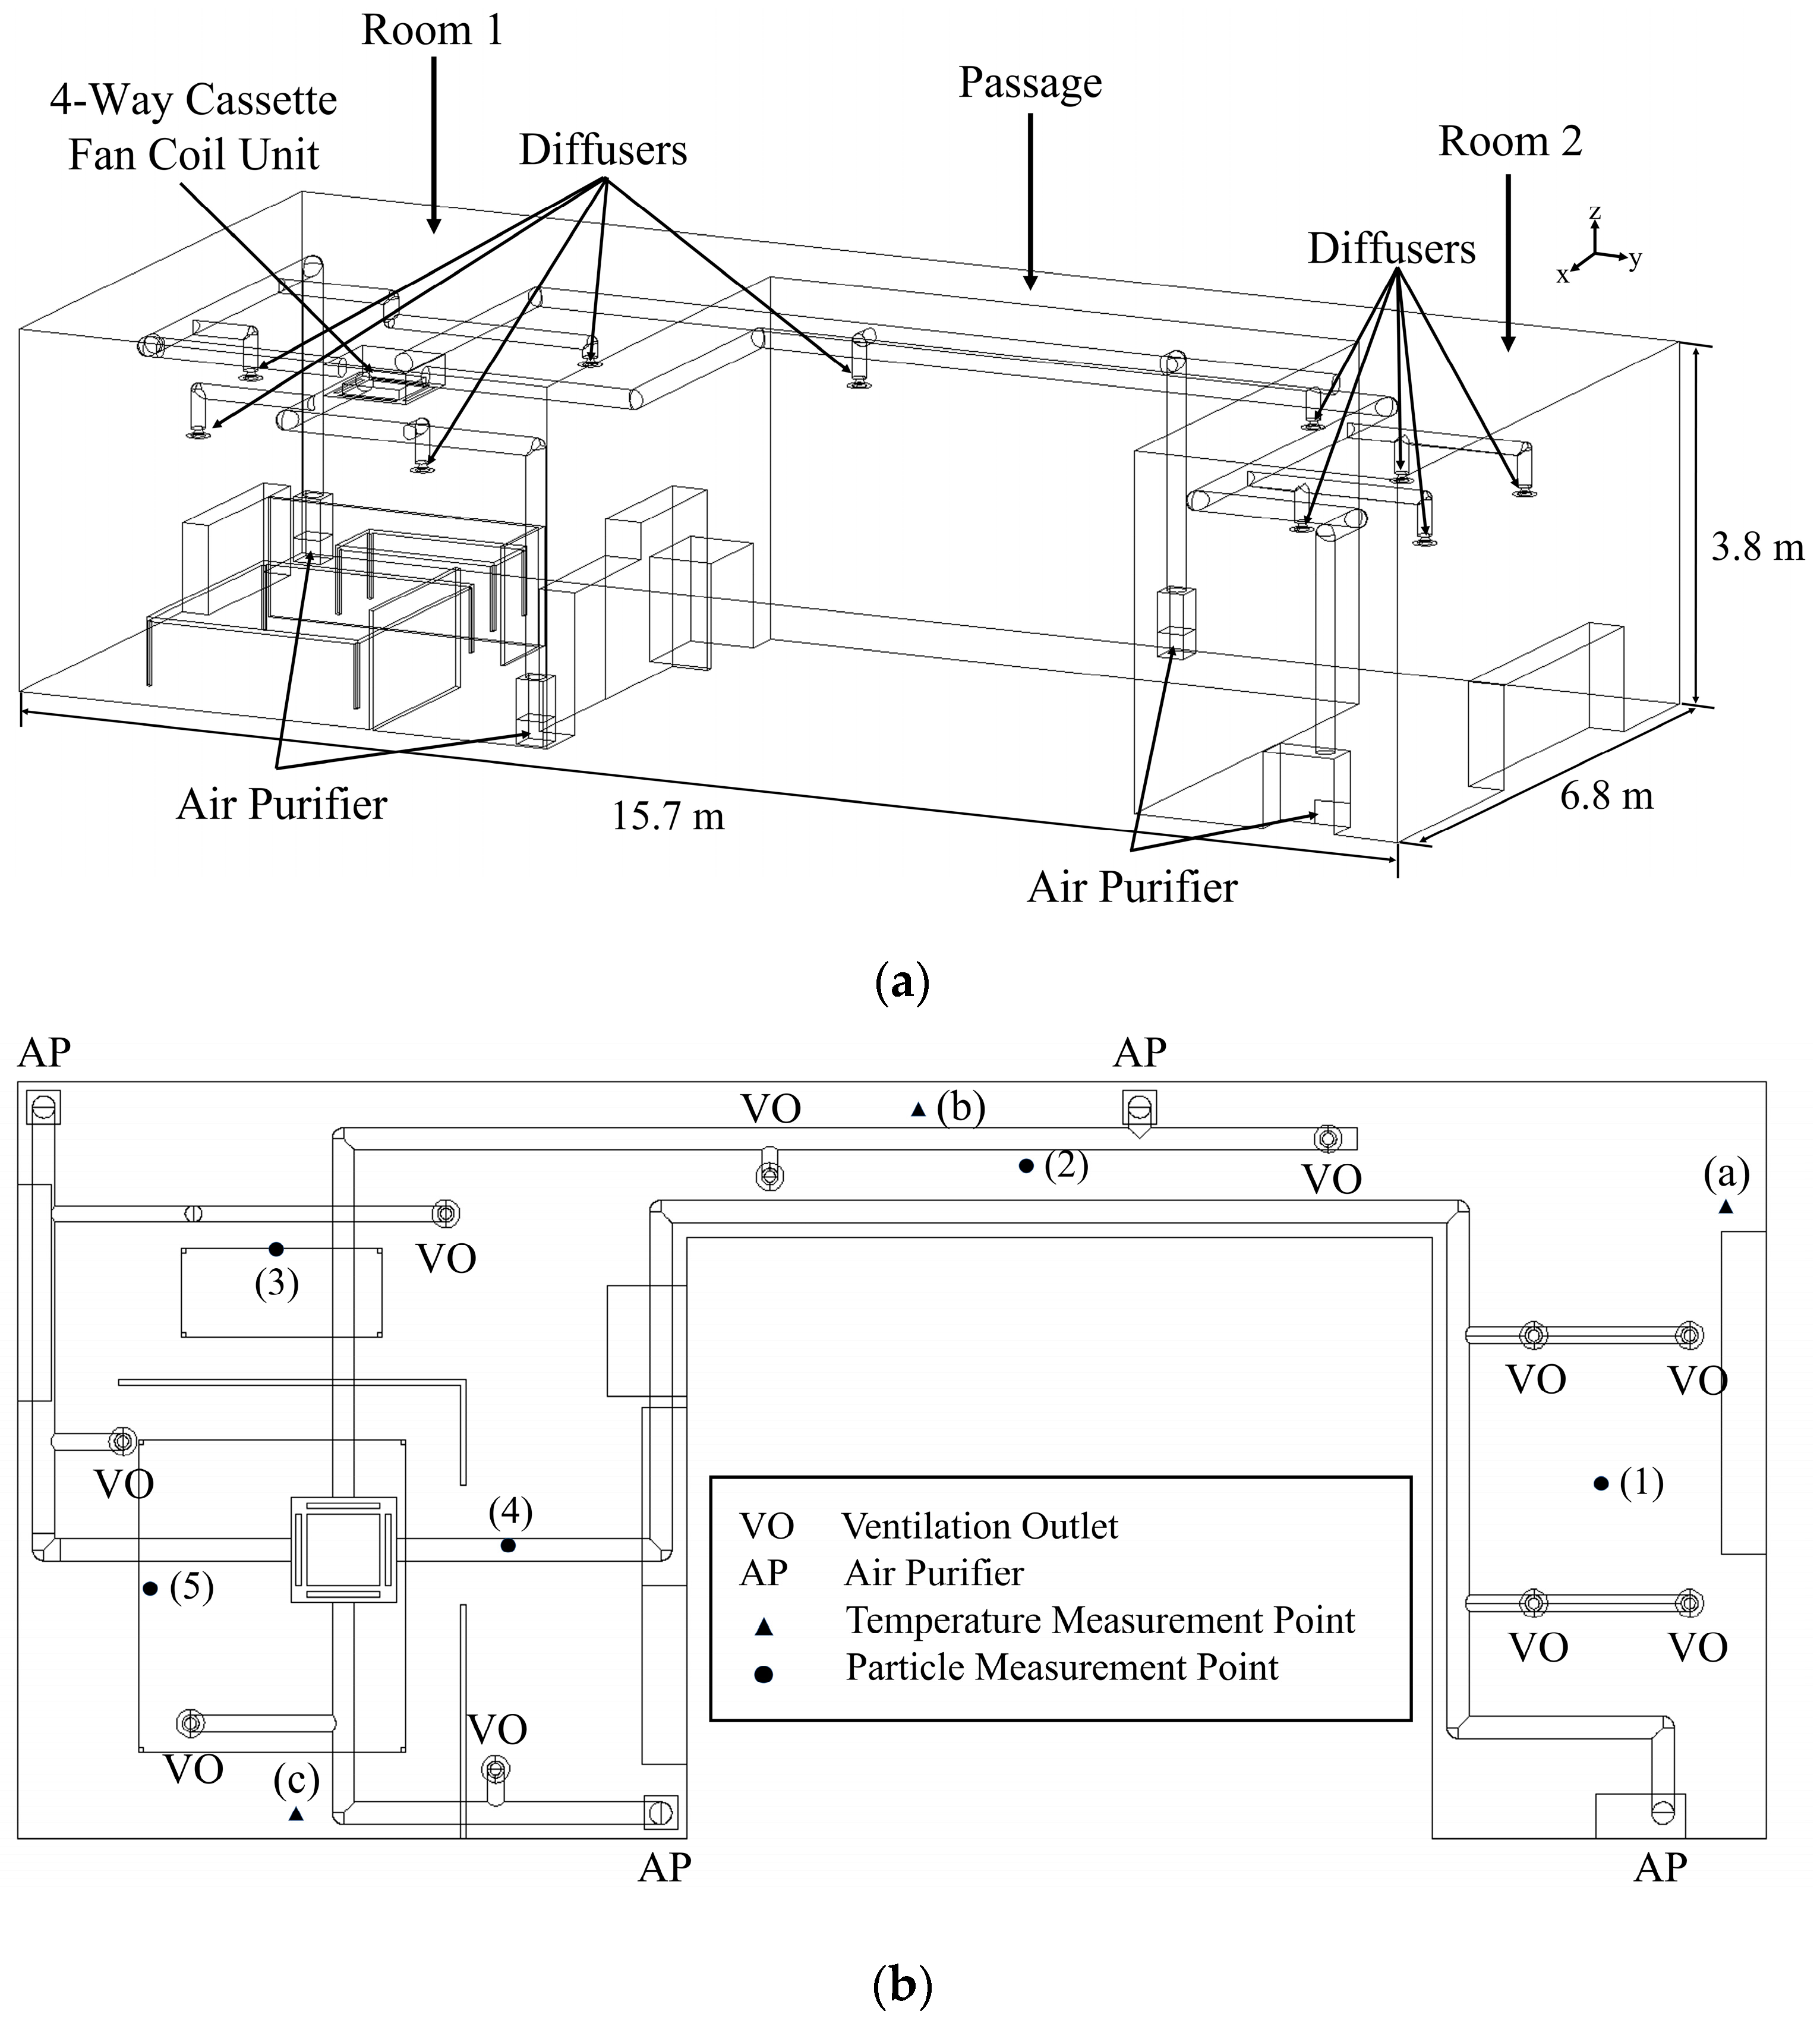
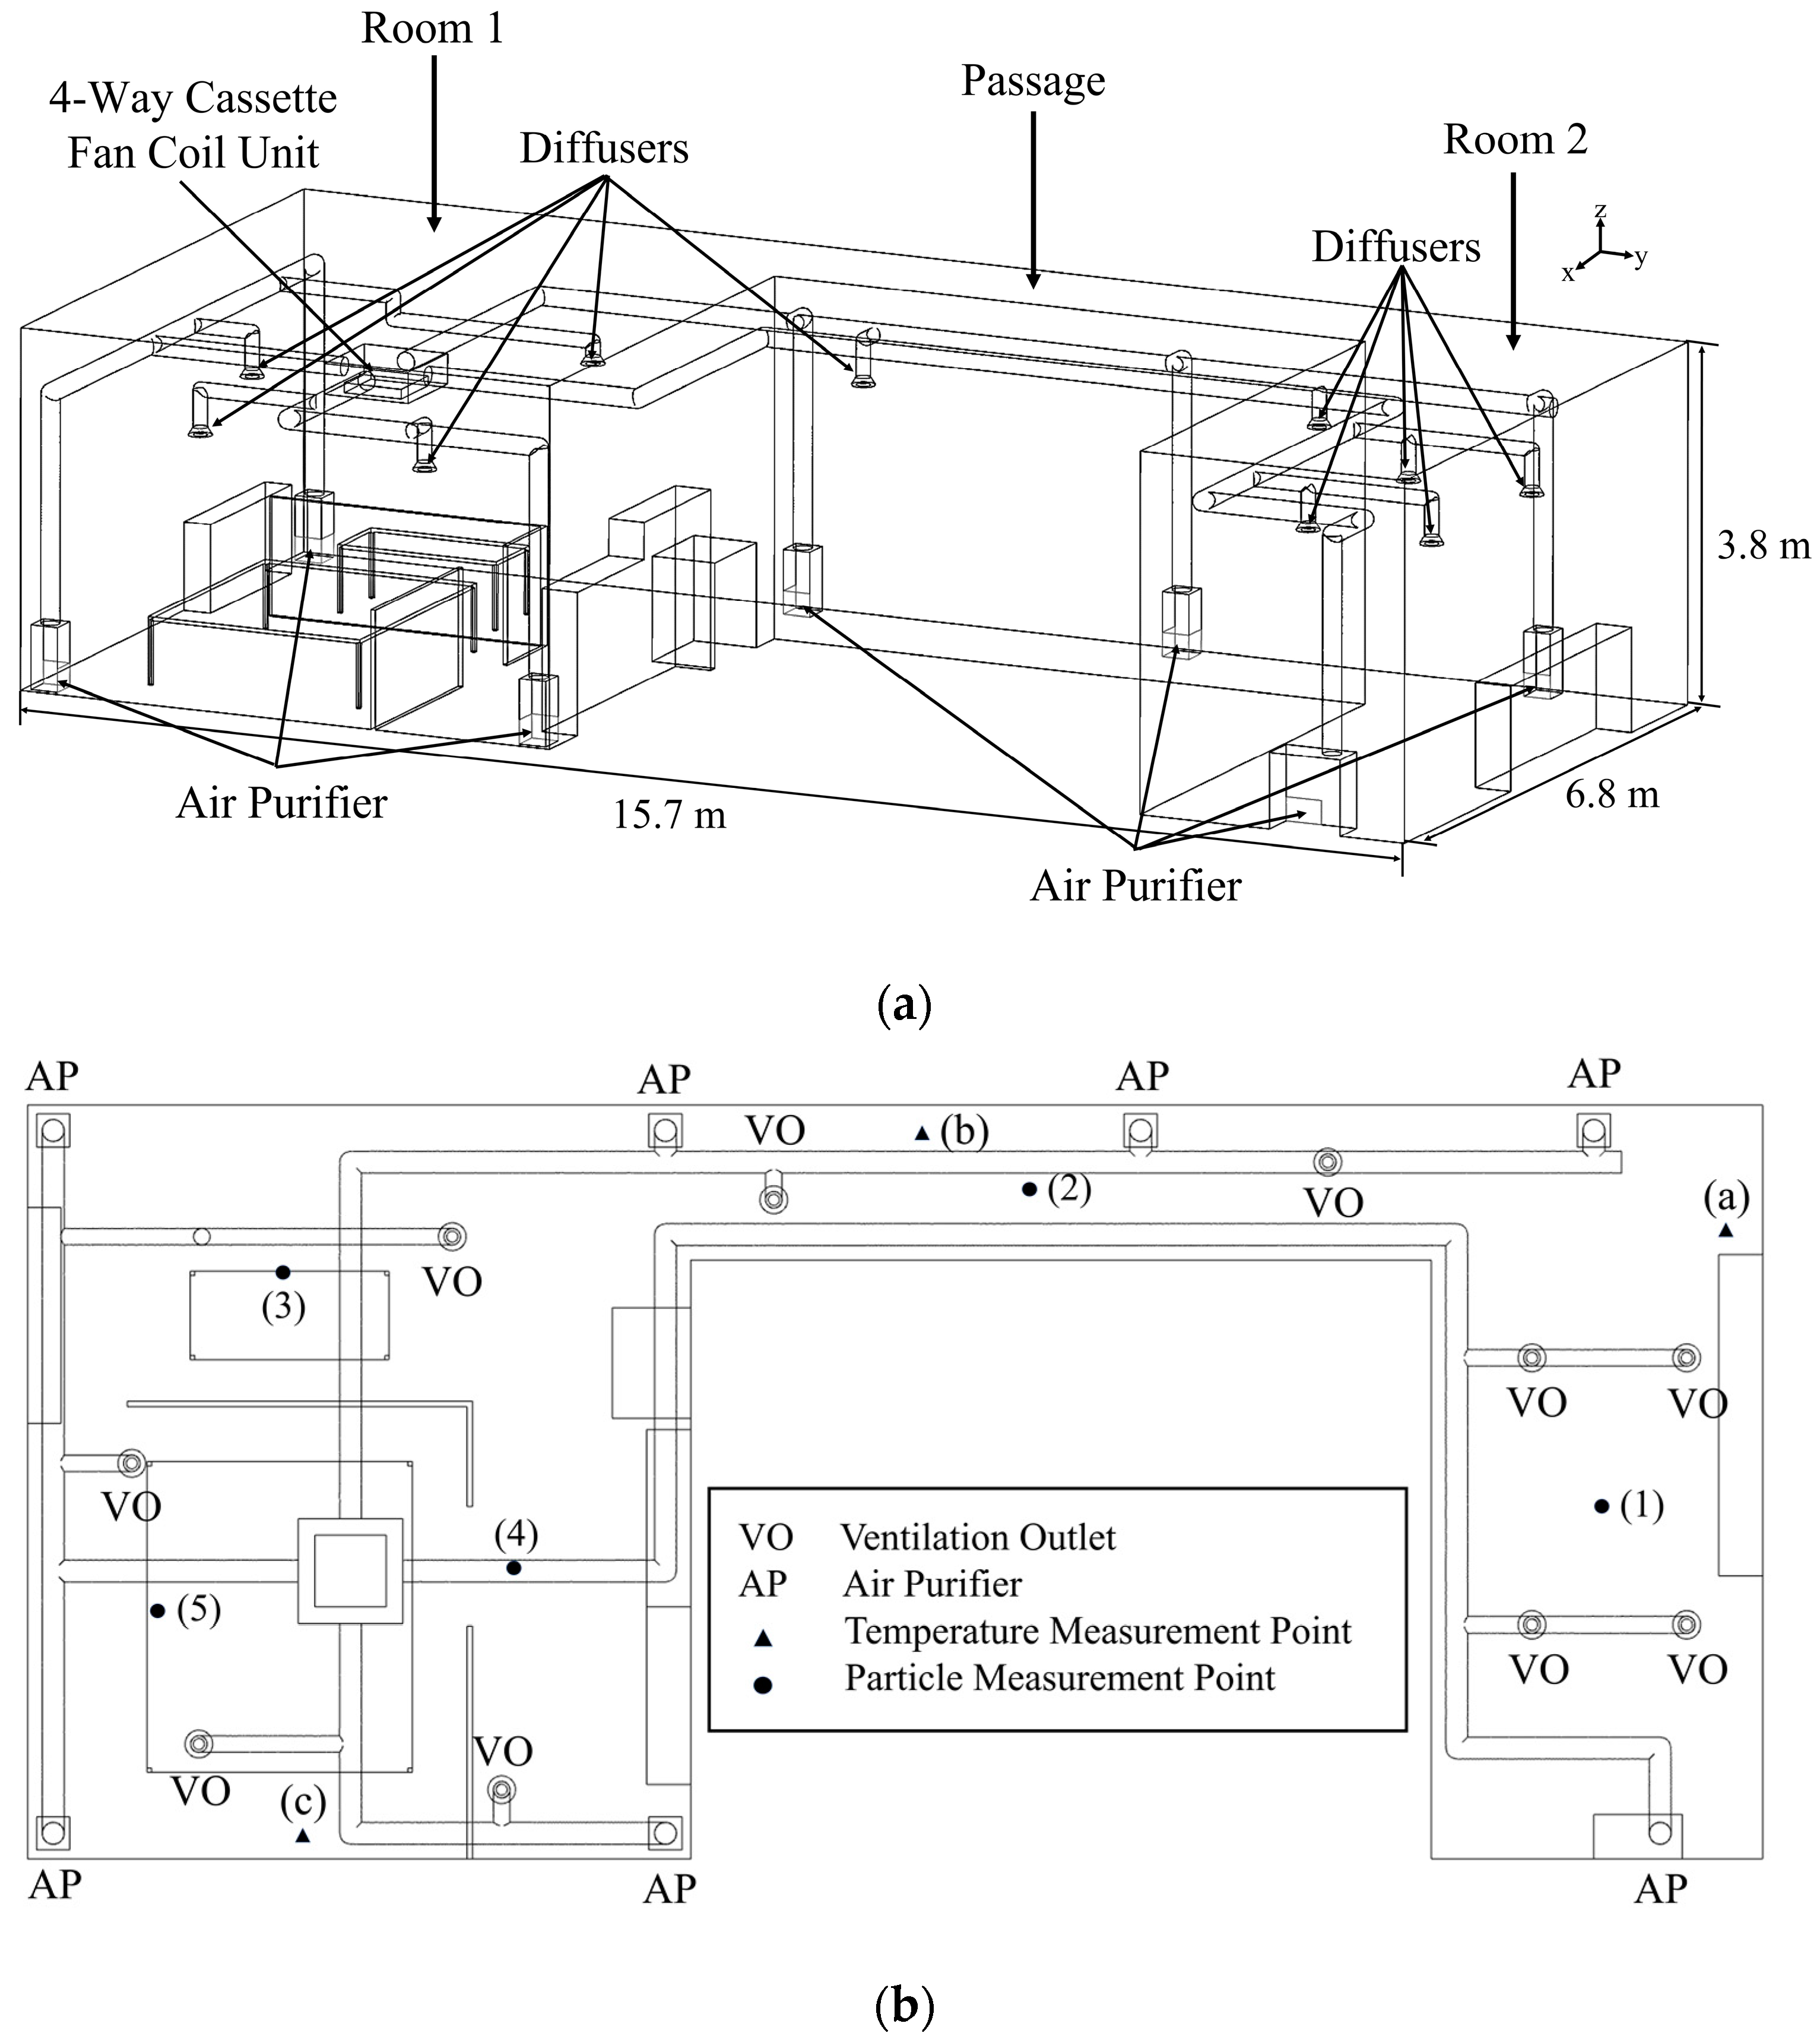
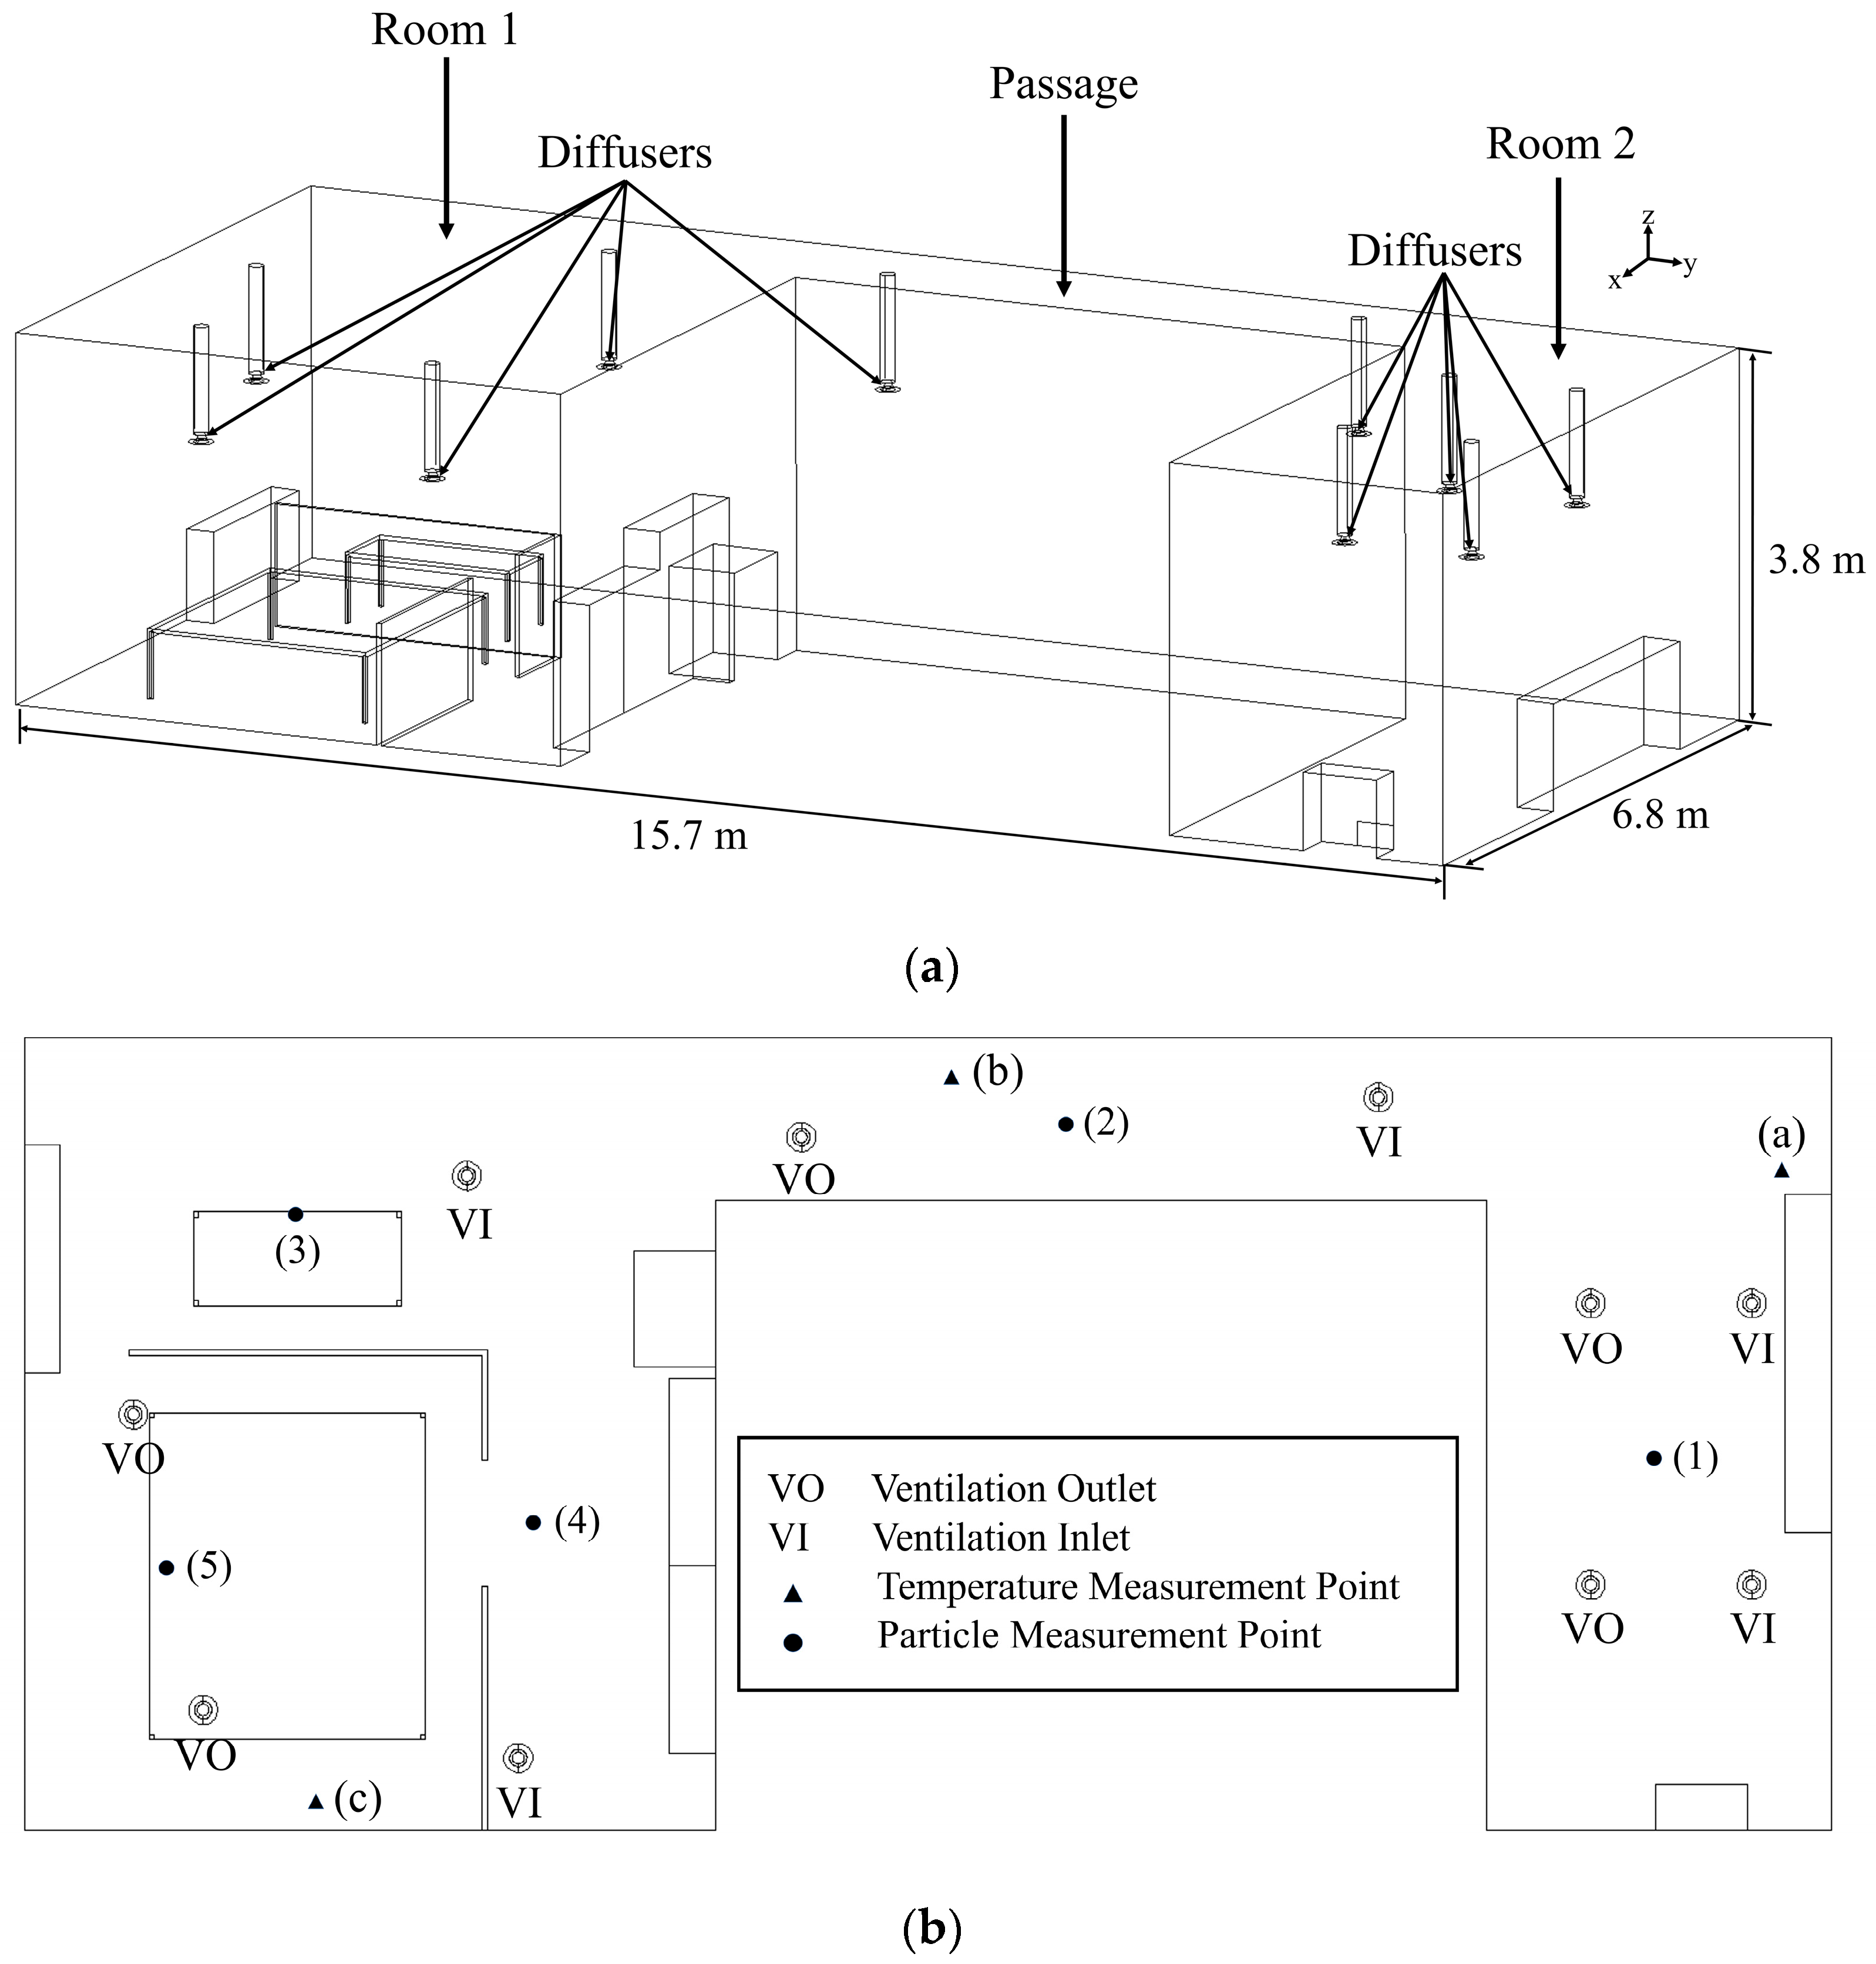
2.1. Description of Office

Based on a review of previous studies [19,20,21,22,23,24,25,26,27,28,29,30], ventilation type, ventilation flowrate, and indoor temperature were chosen as the process variables affecting ventilation efficiency. As shown in Figure 1a, the ventilation system, designed for this study as a DVS, had the ventilation inlet (VI) located near the floor while the ventilation outlet (VO) was mounted on the ceiling. The ventilation system displayed in Figure 1b, representative of a typical MVS, had both the VI and VO positioned on the ceiling. Figure 2 illustrates the structure of an actual office space where the DVS was installed. The office dimensions were 15.7 m × 6.8 m × 3.8 m, and the volume of the ventilated space was approximately 268 m3 excluding a central area blocked by walls. The office was composed of a larger space (Room 1), a smaller space (Room 2), and a corridor connecting the two spaces. In the office interior, significant considerations were given to desks, partitions, and shelves which could greatly influence the airflow. For the implementation of DVS, 10 diffusers and 1 four-way cassette fan coil unit (FCU) mounted on the ceiling and four air purifiers (APs) installed near the floor on the walls were used. The FCU used in this study was equipped with inverter technology to minimize temperature fluctuations. The modified FCU was connected to all diffusers and APs using ducts, and all these ducts were insulated to minimize thermal loss. Moreover, dampers were integrated into the air supply duct lines, allowing for automatic airflow control. The indoor air drawn through the center of the FCU and the 10 diffusers was conditioned by the FCU and then introduced into the interior through the four APs. In other words, instead of directly discharging air into the room, the FCU utilized the APs, which were connected through ducts, as VIs to release the air. Of the total ventilation flowrate drawn, 30% was accounted for by the FCU and the remaining 70% by the 10 VOs. The four APs, equipped with HEPA-grade filters, operated at identical flowrates. The APs installed in Room 1 and the corridor discharged air through all four sides, whereas the AP in Room 2 released air through just one side.
Figure 3 displays the schematic of the office equipped with the Improved DVS. Compared to the DVS in Figure 2, the diffusers used as VO in the Improved DVS of Figure 3 remained the same in terms of count and location. However, the number of APs used as VI was increased. Specifically, for the Improved DVS, two additional APs were installed in Room 1, augmenting the original two, and one additional AP was placed in Room 2, in addition to the original one. In the DVS illustrated in Figure 2, air was discharged from all four sides of each AP. In this case, the clean air coming from the wall-facing side of each AP directly collided with the wall and rose towards the ceiling, thus failing to reach the central indoor space directly. In contrast, in the Improved DVS shown in Figure 3, air was released only through the two or three sides of each AP placed on a corner or on a flat wall, excluding the side(s) facing the wall. In other words, all the air, which used to be discharged through four sides of each AP, was now being discharged through two or three sides. Consequently, the air could enter the central indoor area at a faster velocity than before, making a more direct contribution to improving indoor air quality.
Figure 4 displays a schematic of an office space with the same shape as shown in Figure 2 and Figure 3, but with an MVS applied. In the office with the MVS applied, the number and placement of the diffusers were identical to those of the DVS, but neither FCU nor AP was utilized. In both Room 1 and Room 2, four diffusers were present; for each space, two served as VIs and the other two as VOs. The corridor was equipped with two diffusers, one of which was used as a VI and the other as a VO. Consequently, the air drawn from the interior through a total of five VOs was processed by the ventilation system for particle removal and temperature adjustment, and was introduced into the interior through the five VIs. To compare the air quality between the DVS and MVS, the total ventilation flowrate and supply air temperature were set as identical for each ventilation system. As shown in Table 1, the total ventilation flowrate was varied in three levels: 640 m3/h, 910 m3/h, and 1180 m3/h. The set temperature on the indoor air control panel was changed to two values: 22 °C and 27 °C. Thus, six different cases were considered for each ventilation system.

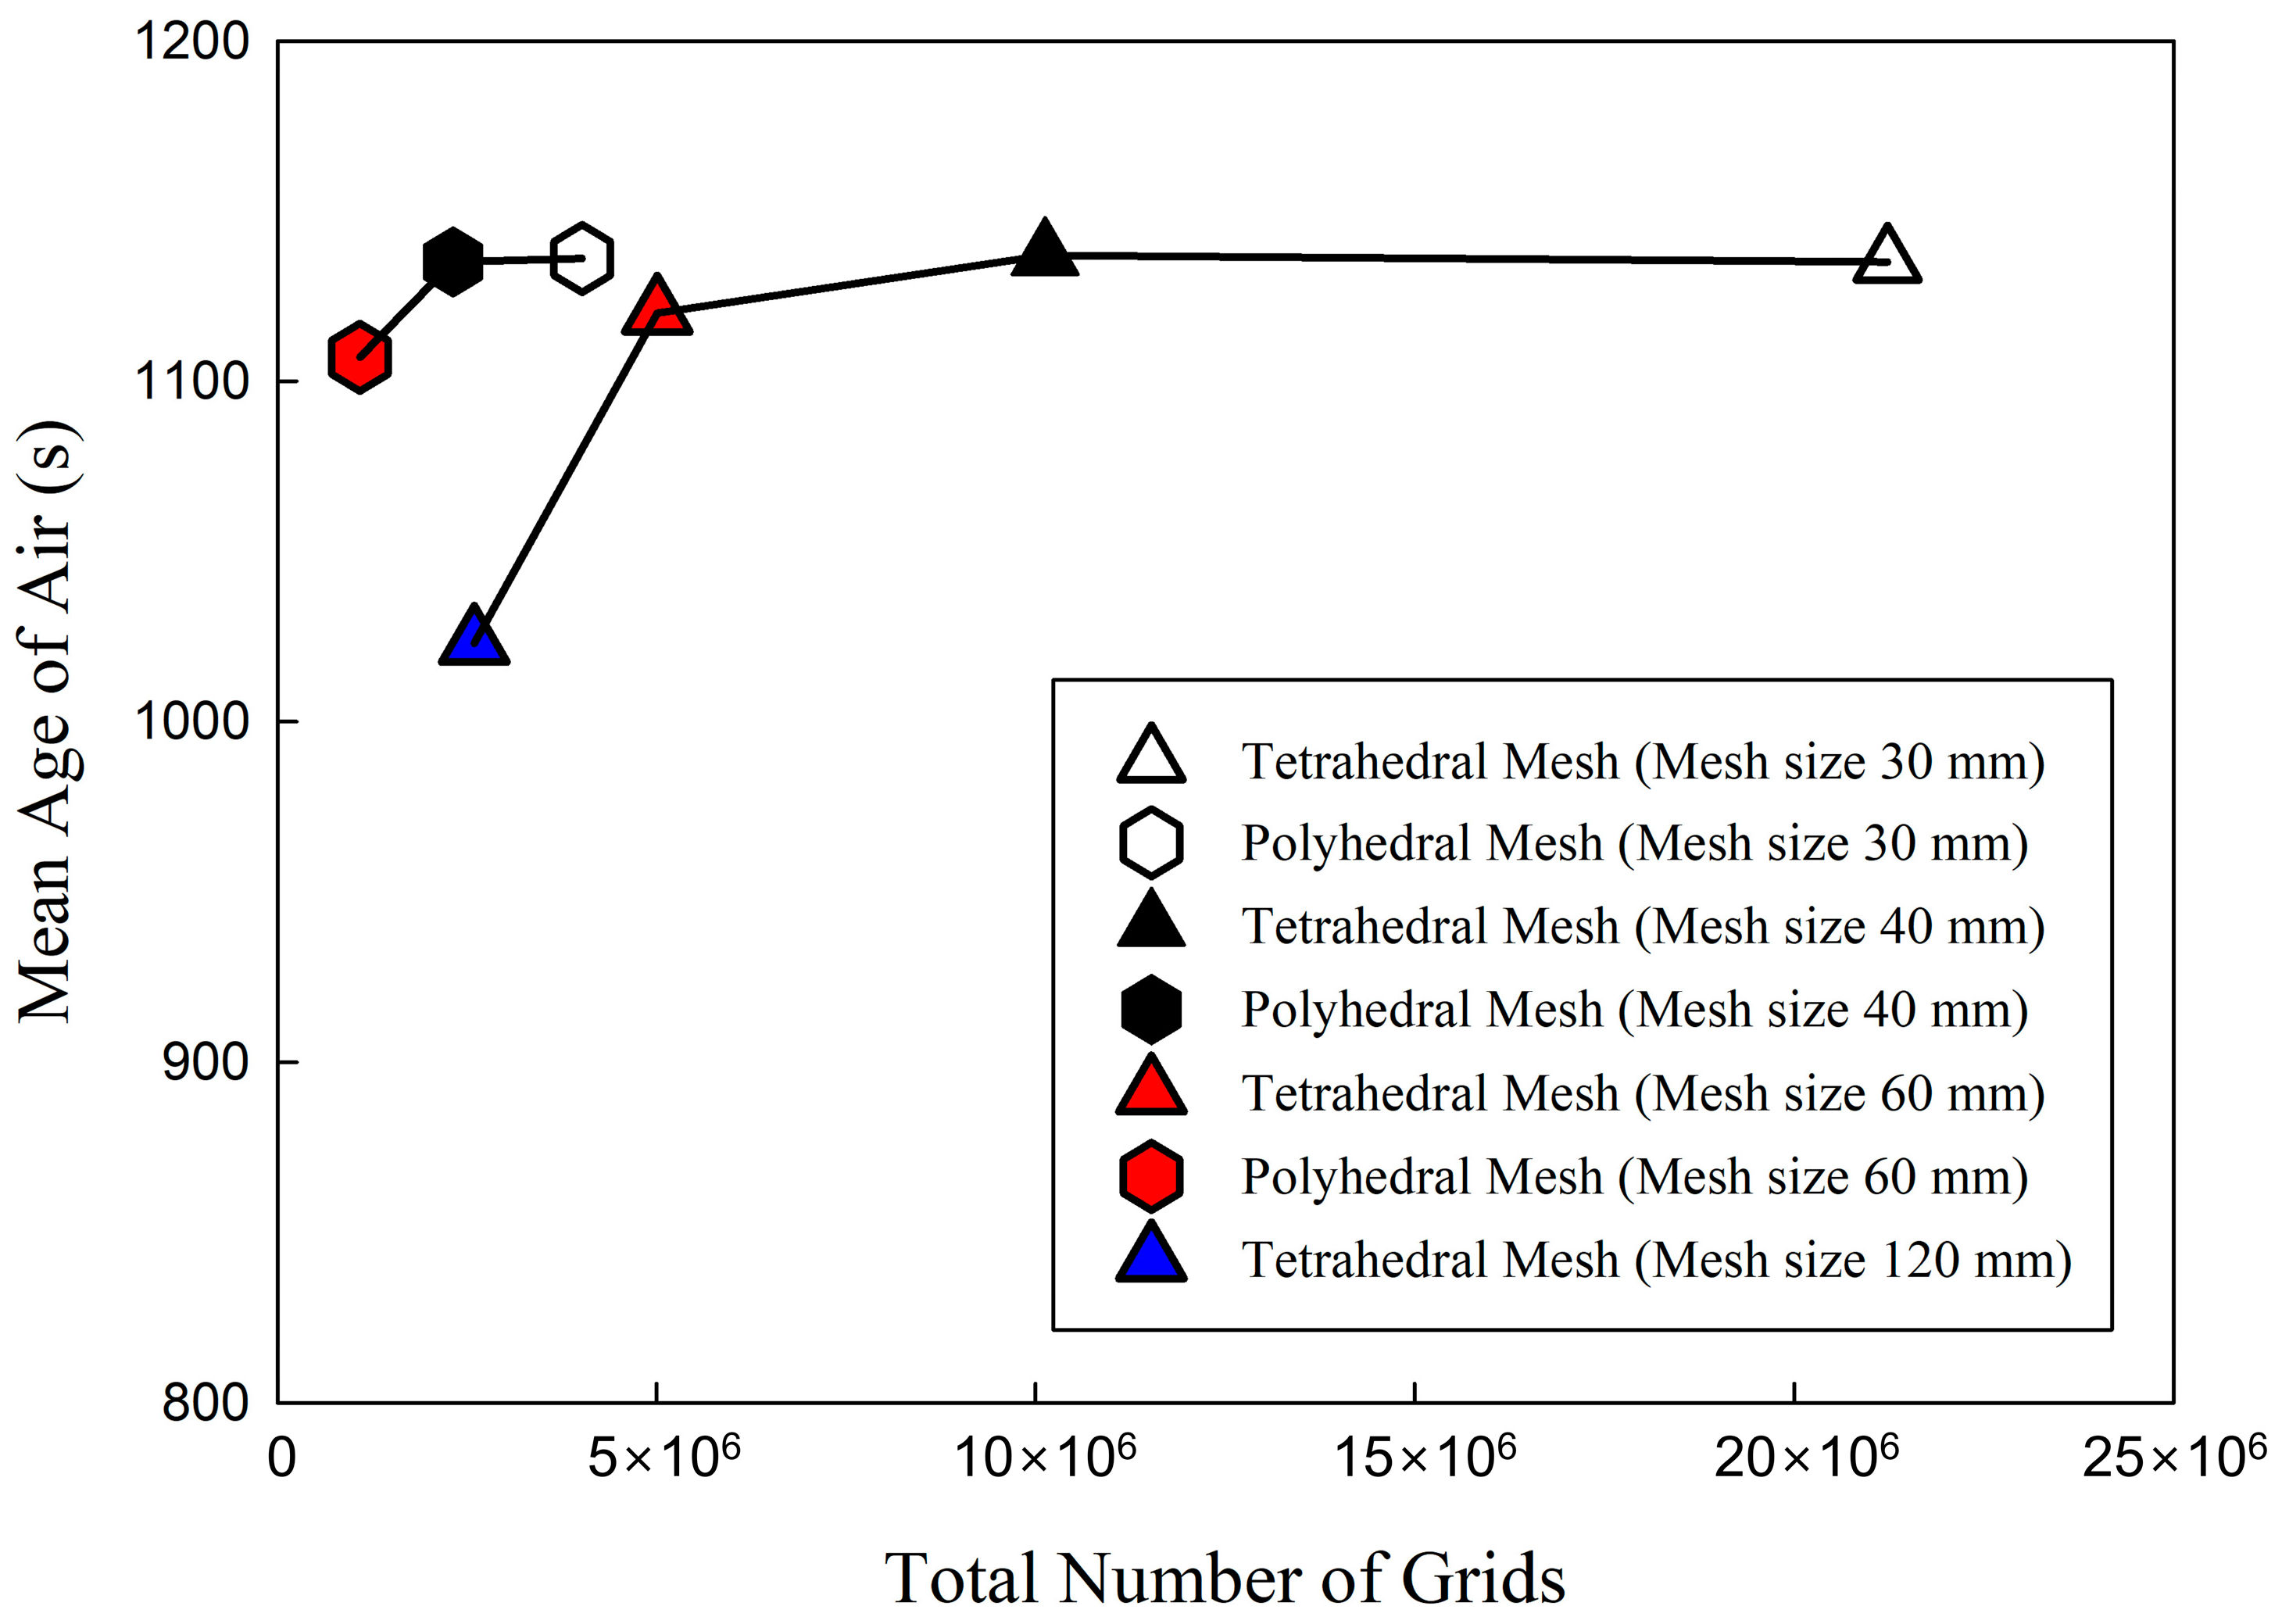
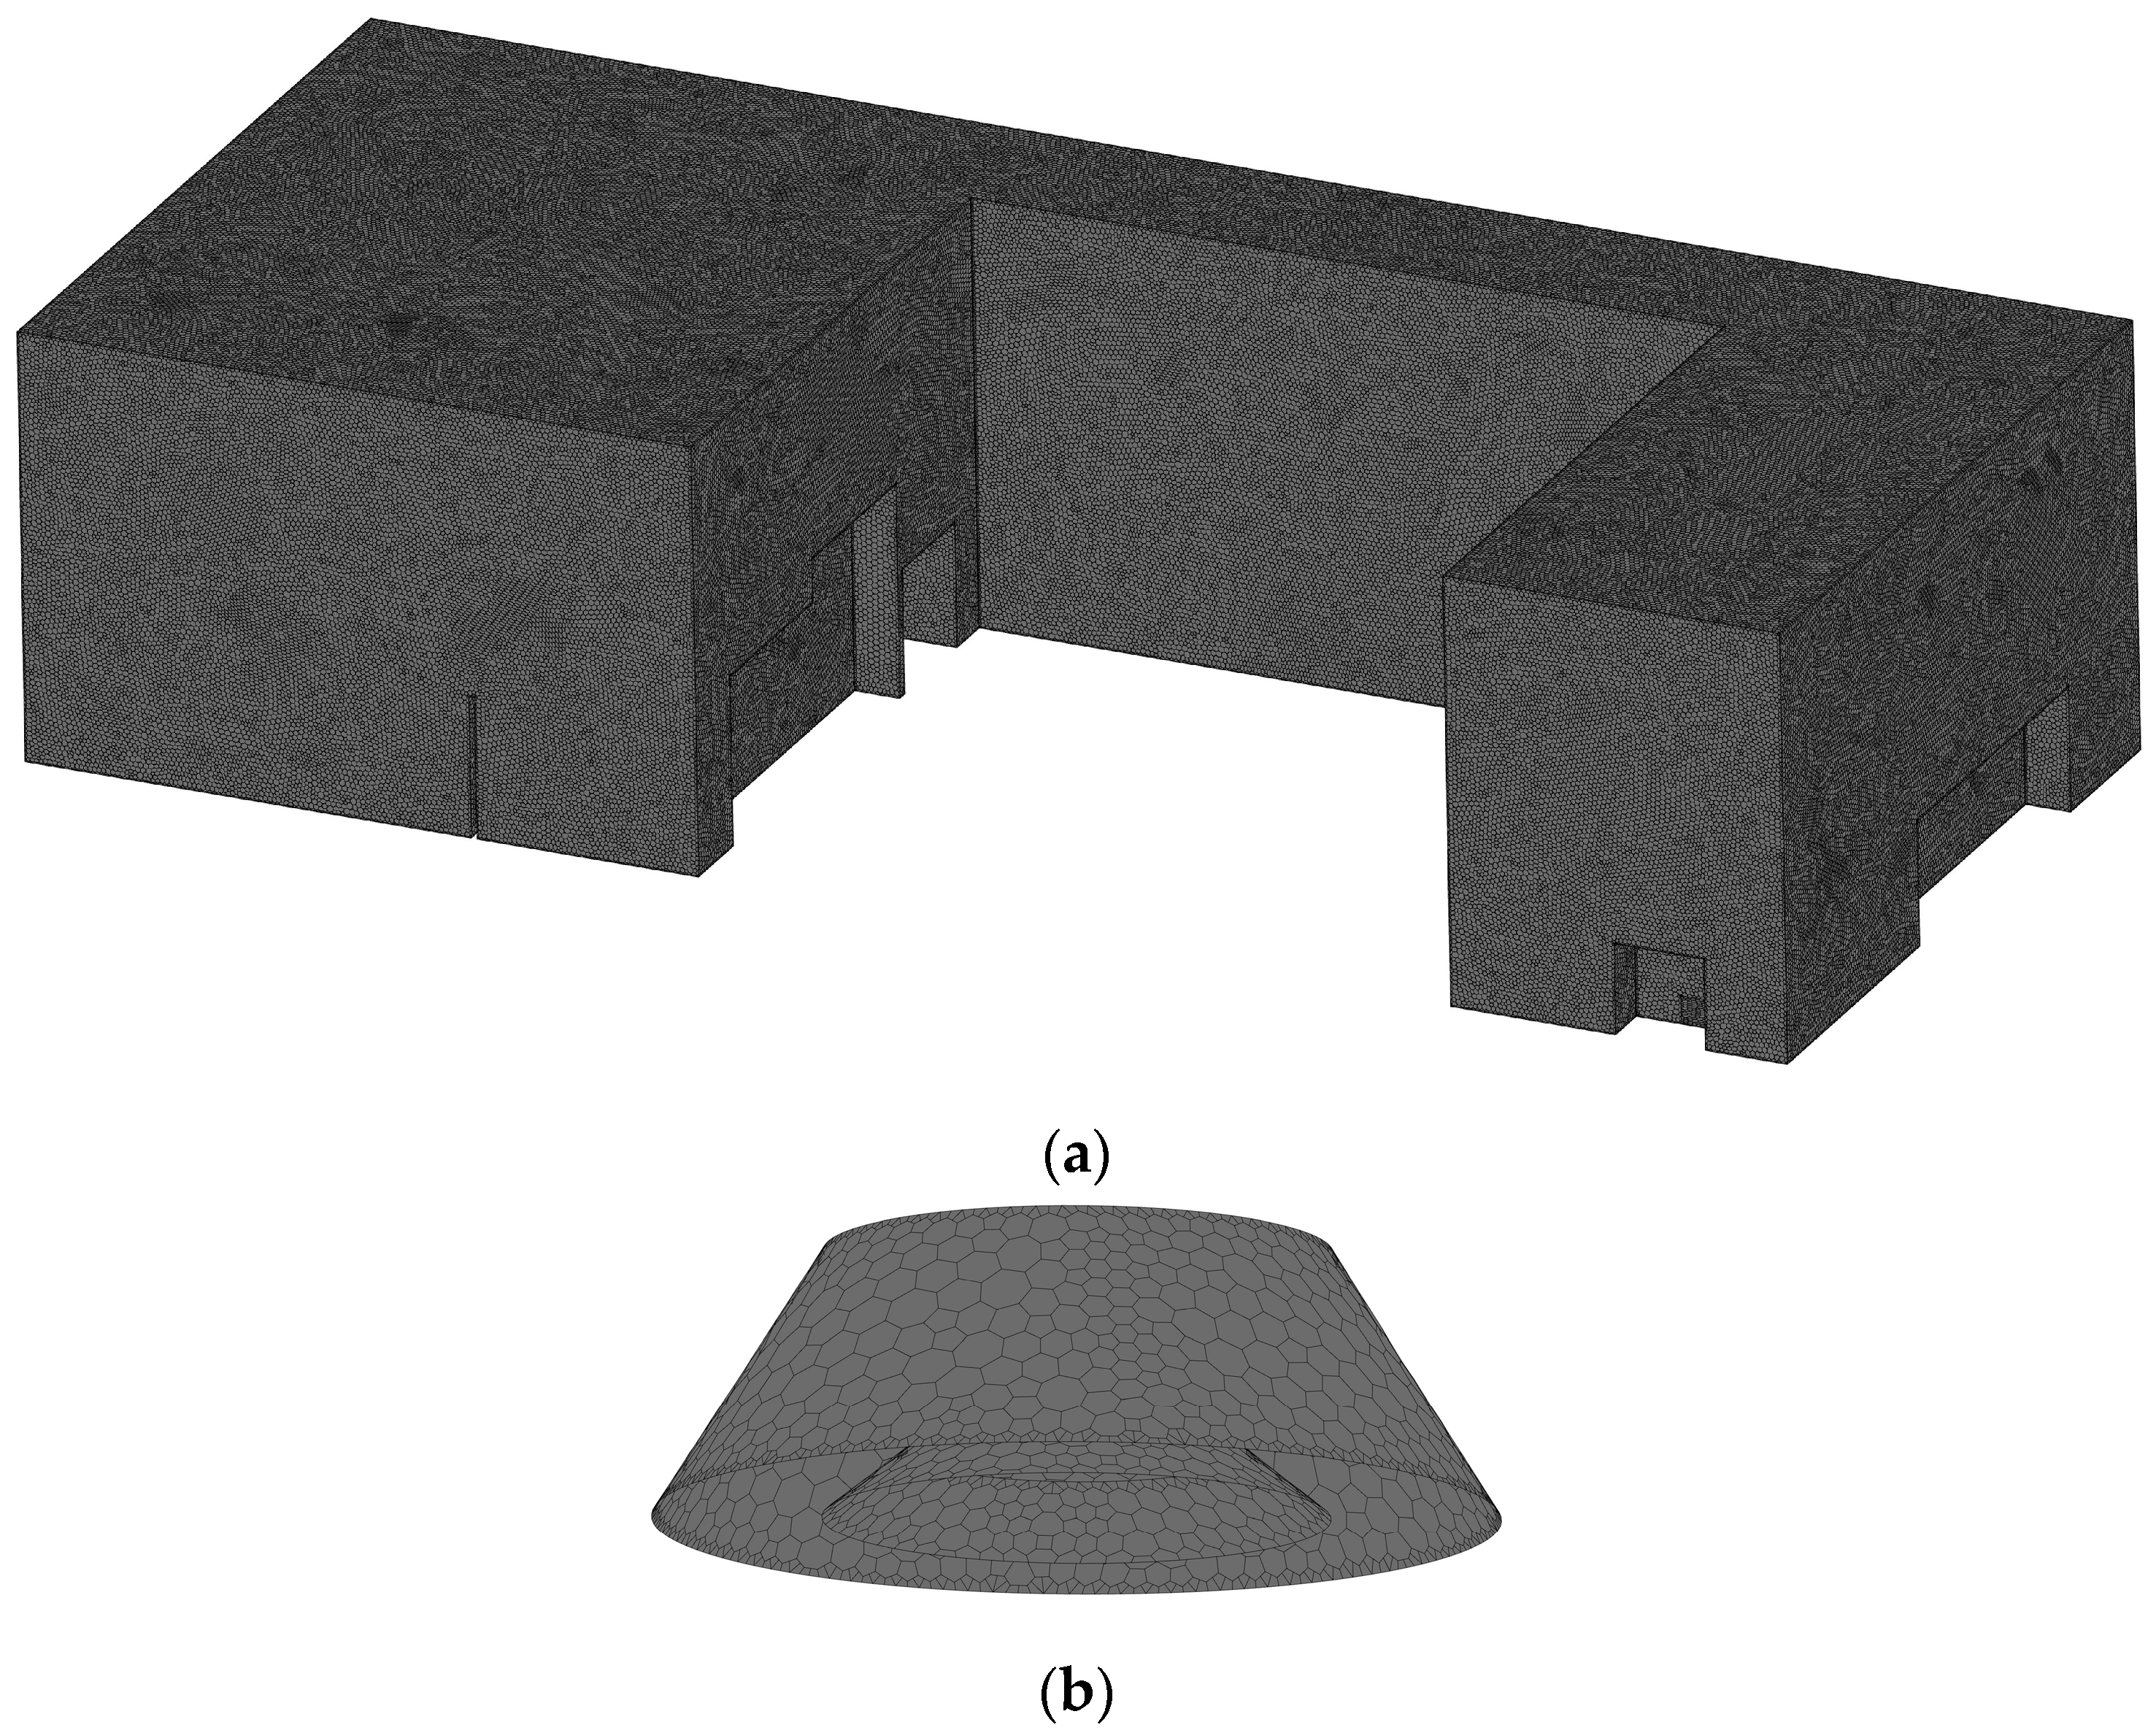
2.2. Numerical Method

To compare local mean age of air (LMA) during winter in offices with the DVS (Figure 2), Improved DVS (Figure 3), and MVS (Figure 4), simulations of the air flow and the age of air were conducted using the CFD code, ANSYS FLUENT Release 2021 R1. The flow was assumed to be three-dimensional, steady, incompressible, and turbulent. The k-ε realizable turbulence model, known to be suitable for indoor turbulent flow analysis, was employed [37,38,39]. For flow analysis, the following governing equations were solved [40].
Mass Conservation Equation:
ρ t + · ρ u = 0
Momentum Conservation Equation:
ρ u t + · ρ u u = p + ρ g + F
Energy Conservation Equation:
ρ E t + · u ρ E + p = · j h j J j + S h
Turbulent kinetic energy, k:
t ρ k + x j ρ k u j = x j μ + μ t σ k k x j + G k + G b ρ ϵ Y M + S k
Turbulent dissipation rate, ϵ :
t ρ ϵ + x j ρ ϵ u j = x j μ + μ t σ ϵ ϵ x j + ρ C 1 S ϵ ρ C 2 ϵ 2 k + ν ϵ + C 1 ϵ ϵ k C 3 ϵ G b + S ϵ
where
C 1 = max 0.43 ,   η η + 5   ,   η = S k ϵ   ,   S = 2 S i j S j i   ,   C 1 ϵ = 1.44 ,   C 2 = 1.9 ,   C 3 ϵ = t a n h υ u
Here, ρ is the density (kg/m3), u is the velocity (m/s), p is the pressure (Pa), and ρ g and F are the gravitational body force and external body force, respectively. ν is the kinematic viscosity (m2/s), E is the total energy (J/kg), h j is the specific enthalpy of species j (J/kg), J j is the dispersion motion vector for species j (kg/m2·s), S h is the energy source term, μ is the viscosity (Pa·s), μ t is the turbulent viscosity (Pa·s), G k is the turbulence kinetic energy generation term, G b is the buoyancy-induced turbulence kinetic energy generation term, and Y M is the rate of energy dissipation due to compressibility in turbulent flows. S k and S ϵ are user-defined source terms. S is the modulus of the mean rate-of-strain tensor. σ k and σ ϵ are the turbulent Prandtl numbers for k and ϵ , respectively. u is the flow velocity component perpendicular to the gravitational direction (m/s), and υ is the flow velocity component along the gravitational direction (m/s).
The convergence criterion for iterative calculations of these equations was set to 10−3. As boundary conditions for the flow analysis, a no-slip condition was imposed on all wall surfaces, a mass flow inlet condition was set for the APs or VI-diffusers discharging air into the room, and a pressure outlet–target mass flowrate condition was set for the VO-diffusers drawing air from the room. In particular, the total mass flowrates for the VIs and VOs were set to be equal. Referring to experimental results, the air temperatures discharged from the APs or VI-diffusers were set to 33 °C and 35 °C when the indoor temperature control panel was set to 22 °C and 27 °C, respectively. The temperatures of all indoor wall surfaces were set to 20 °C and 23 °C when the indoor temperature control panel settings were 22 °C and 27 °C, respectively.
The LMA was determined by solving the following Passive Scalar Transport Equation [41,42]:
x i ρ u i Φ J ˙ Φ x i = ρ
J ˙ = ρ D m + ρ D i Φ x i
Here, ui is the velocity (m/s), Φ is the age of air (s), j is the diffusion term (kg/m2·s), Dm is the molecular diffusivity (m2/s), and Di is the turbulent diffusivity (m2/s). A convergence criterion of 10−12 was applied to these equations. Considering that HEPA-grade filters were used in the APs and ventilation devices, the age of air at the outlet of the APs or VI-diffusers was set to zero.
To determine the type and size of the grid for analysis, a grid independence test was conducted. Consideration was given to both tetrahedral mesh and polyhedral mesh as grid types, and the mesh size was varied within the range of 30–120 mm. Figure 5 illustrates the average age of air over the entire volume of the calculation domain as a function of the number of grids. In the case of the polyhedral mesh, it was observed that the average age of air changed by 0.26% when the mesh size was reduced from 40 mm to 30 mm. It was found that using a tetrahedral mesh required a significantly higher number of grids compared to the polyhedral mesh. Therefore, to reduce computation time, the polyhedral mesh was chosen as the grid type, and the grid size was determined to be 40 mm. Figure 6a displays the grid system created for the office space using the polyhedral mesh, and the number of grids determined through the grid independence test was approximately 2.32 million. Considering the need for a denser grid configuration around diffusers where air was either discharged or drawn in, the grid size for the diffusers was set to 7.5 mm. Figure 6b shows the grid configuration for the diffusers installed on the ceiling.

2.3. Experimental Method

To ascertain the LMA in the office space where a DVS with VIs installed on the floor and VOs on the ceiling was applied (see Figure 2), an experiment was conducted during the winter, with both heating and ventilation operating simultaneously. Experiments were conducted under the conditions of Case C and Case D as presented in Table 1, and the total ventilation flowrate was set to 910 m3/h. The ventilation flowrate was checked by measuring the speed of air discharged from all AP surfaces using a velocity meter (Model AMI310, KIMO, Montpon, Dordogne, France). As indicated by the triangular points (▲) in Figure 2b, temperatures were measured using T-type thermocouples at one location each in Room 1, Room 2, and the corridor. At each location, temperature measurements were conducted at heights of 1.1 m, 2.2 m, and 3.0 m, taking into account the laboratory height of 3.8 m, using relatively evenly spaced intervals. The indoor temperature was set to either 22 °C or 27 °C on the FCU control panel, and during the experiment, the air temperature within the office was measured to range between 22 and 24 °C or 25 and 29 °C for each respective setting. Furthermore, when the indoor set temperature on the FCU control panel was 22 °C or 27 °C, the temperature of the air discharged through the APs used as VI was measured to be 33 ± 0.7 °C or 35 ± 0.9 °C, respectively. During the course of the experiment, the temperature of the office wall surfaces was measured to be 20 °C and 23 °C when the set temperatures on the indoor temperature control panel were 22 °C and 27 °C, respectively.
To experimentally determine the age of air, the step-down method was employed, which progressively reduces the particle number concentration starting from an initial value [43]. In Figure 2b, at the five locations indicated by circular points (●), i.e., three in Room 1, one in Room 2, and one in the corridor, particle number concentrations were measured using five optical particle counters (OPC; Model 1.108, Grimm Co., Ltd., Ainring, Bayern, Germany). Taking into consideration the respiratory height of an adult seated in an office chair, the height for particle number concentration measurement was set at 1.1 m from the floor [36,44]. Incense was burned inside the office to produce a large number of particles, and multiple air circulators were employed to ensure an even distribution of particle number concentration throughout the indoor space. Once a uniform distribution of particle number concentration was achieved, the air circulators were turned off and a waiting period of approximately 15 min was observed to allow the indoor air currents to stabilize. Subsequently, both the ventilation equipment and the FCU were activated. After achieving a stabilized air current, changes in particle number concentration were measured for over 80 min. This experiment was repeated three times for each case.
Figure 7 illustrates the changes in particle number concentration measured at five locations under the condition of Case C, as an example of results obtained after the stabilization of air currents with the DVS in operation. The y-axis values are normalized using the particle number concentration at the initial time. Although the rate of decrease in particle number concentration varied at each location, the concentration was observed to decrease exponentially at all positions. The faster the reduction in particle number concentration, the quicker the improvement in air quality due to the introduction of clean air. Therefore, the following equation was used to represent the measured particle number concentration results [42,43]:
C = C 0 + A exp t τ
where C represents the particle number concentration over time (m−3), C0 denotes the convergence value of particle number concentration after a long duration (m−3), A is the initial particle number concentration (m−3), t is the measurement time (s), and τ signifies the age of air (s).

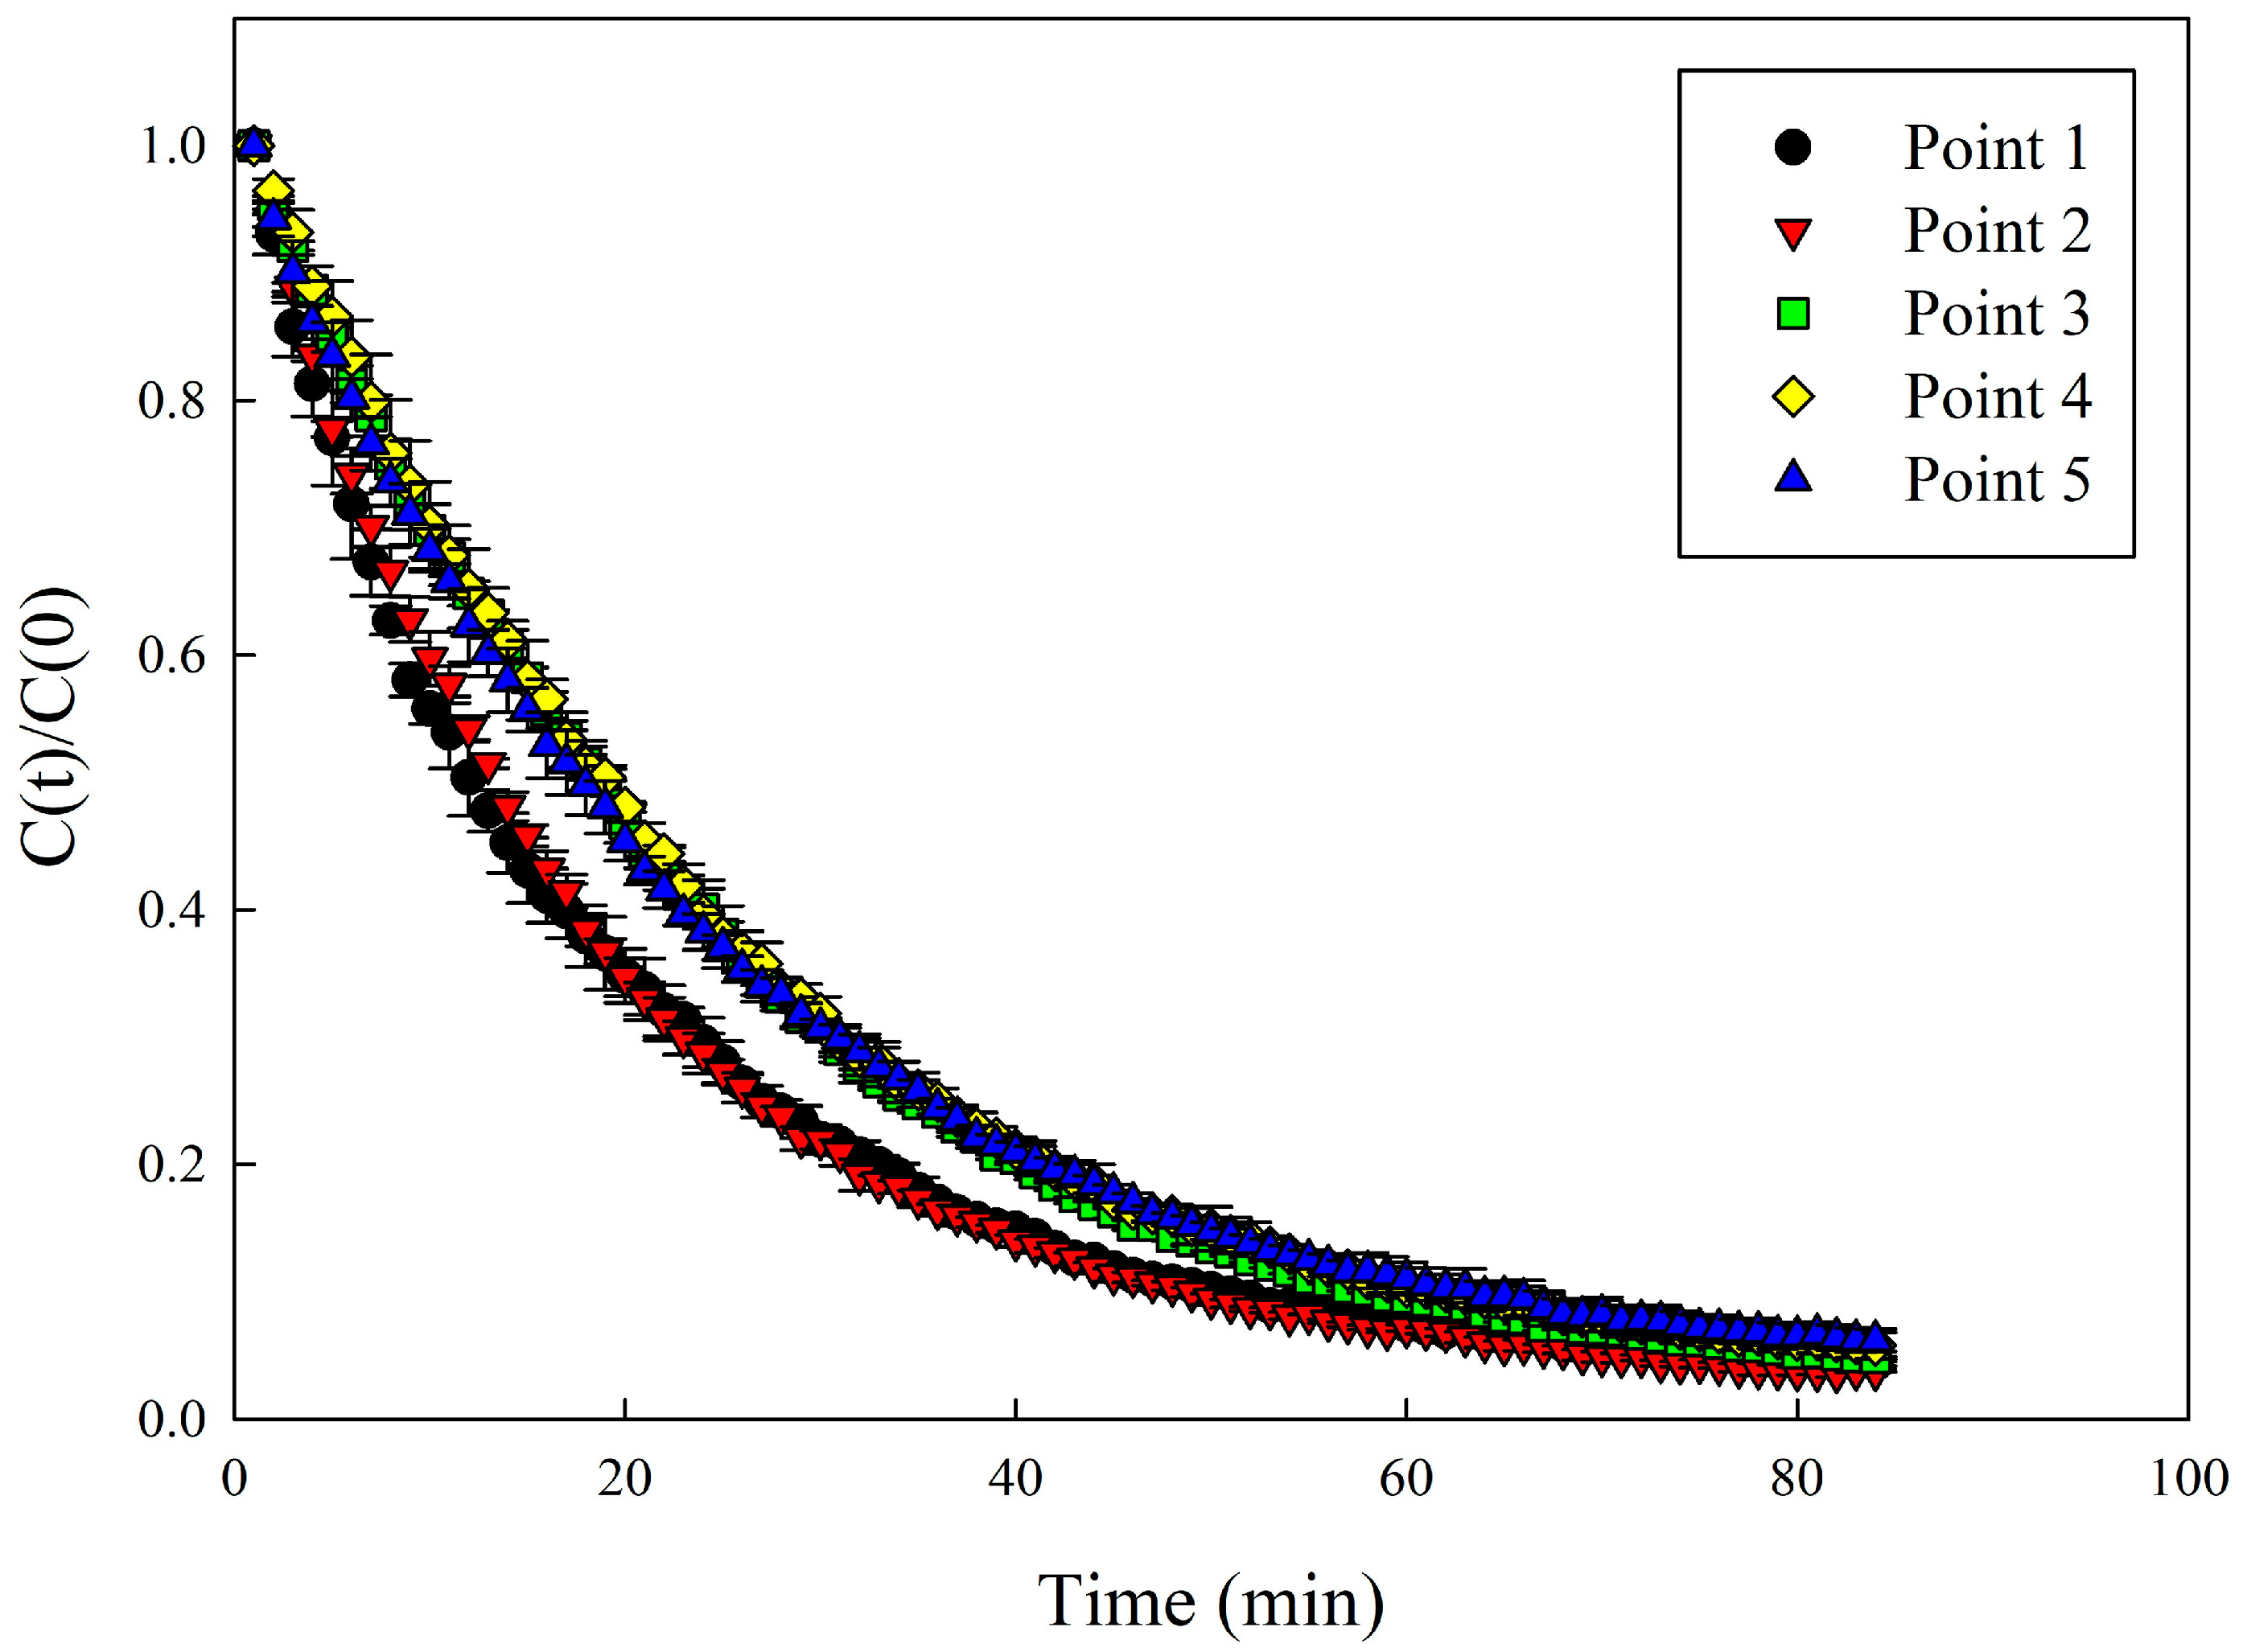
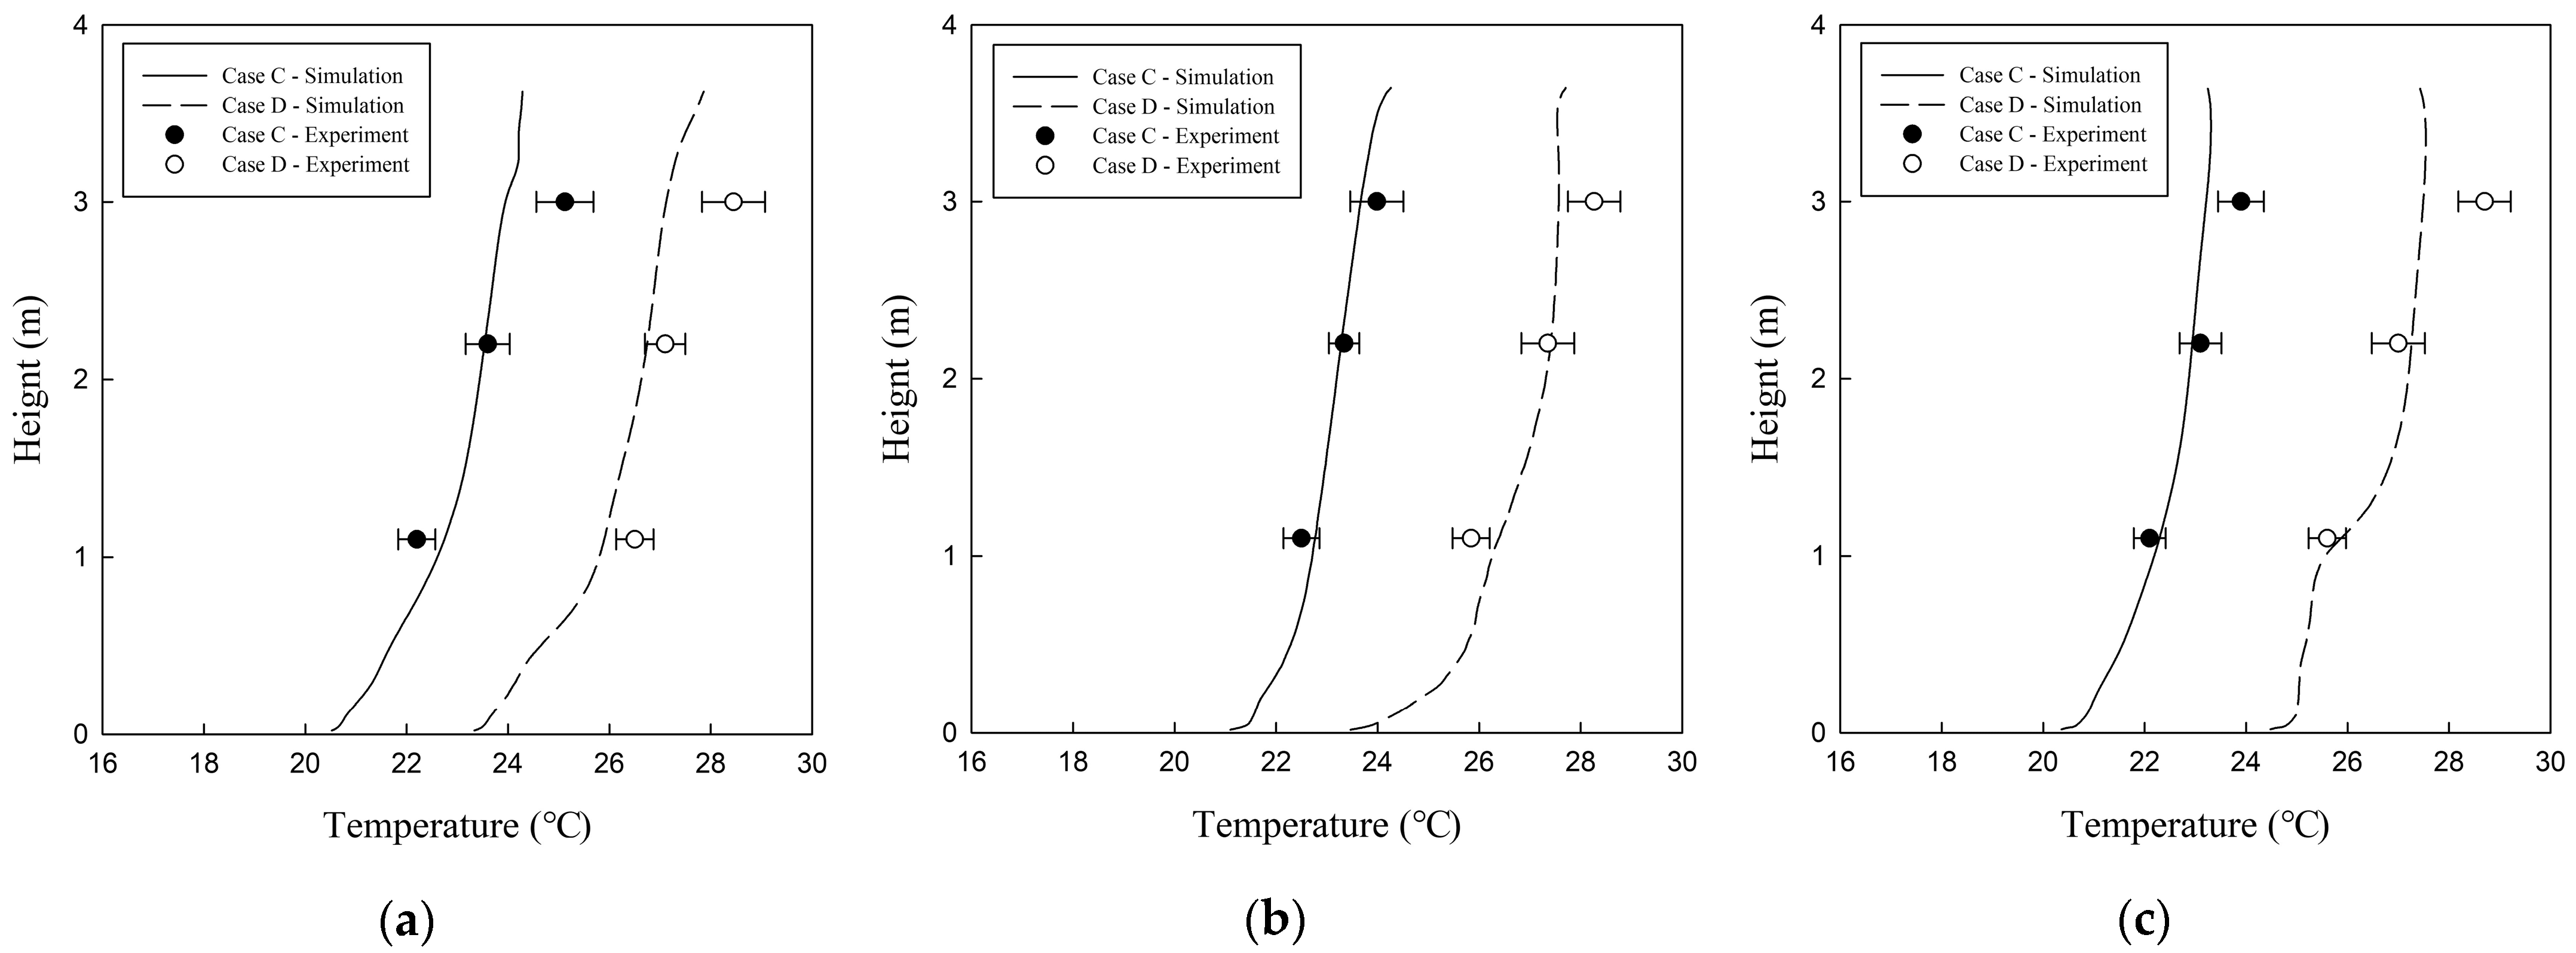
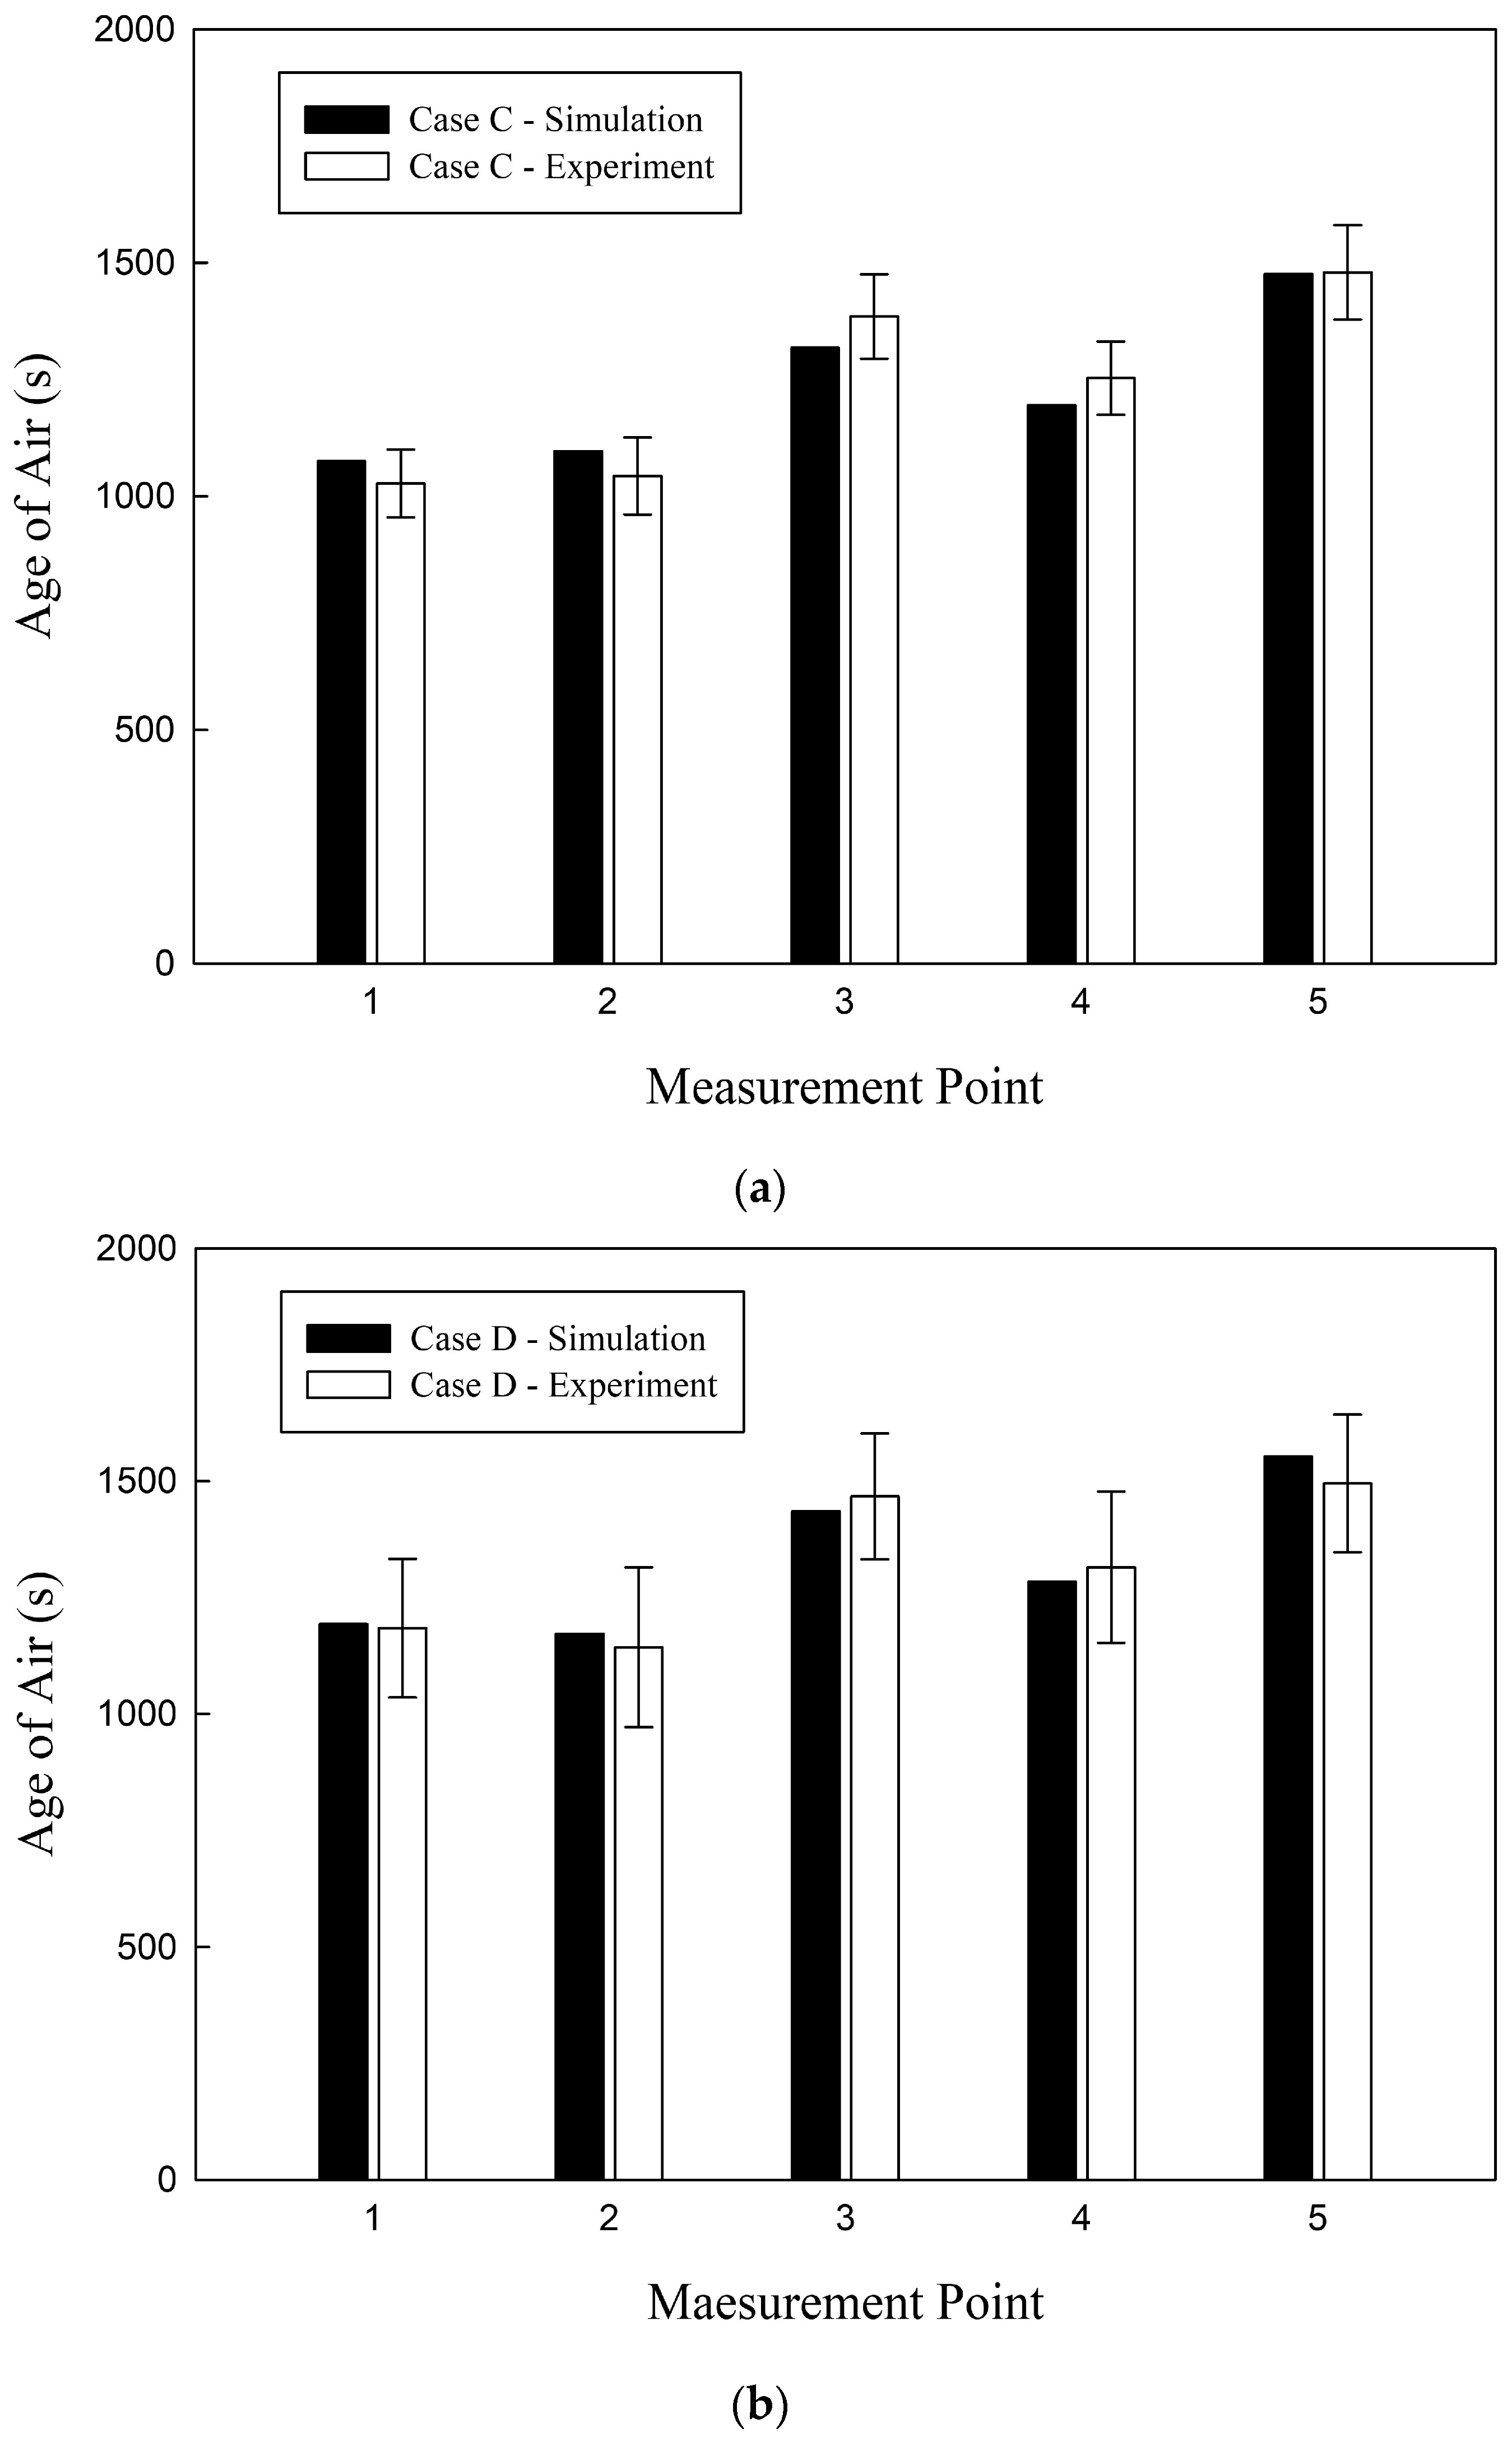
3. Results and Discussion

As shown in Figure 8, the temperatures at the measurement locations for Case C and Case D, where DVS was applied, were compared between the experiment and simulation. At the three measurement locations, the temperature was found to be distributed closely to the indoor temperature set by the FCU control panel, and as the height increased, the temperature slightly rose. This is because warm air rose upward due to buoyancy. Under the conditions of the indoor set temperature of both 22 °C and 27 °C, the temperatures at the measurement sites were observed to match well between the experiment and simulation. From this, it was confirmed that the simulation accurately interpreted the convective heat transfer characteristics due to complex turbulent flow [45]. On the other hand, Figure 9a,b compares the LMA at the five locations between the experiment and simulation, where particle number concentrations were measured for Case C and Case D, respectively. The experimental measurements and simulation predictions matched well, and the error was found to be within 10%. Based on the above temperature and LMA comparison results, the high prediction accuracy of the simulation method used in this study was confirmed. Therefore, the airflow, temperature, and age of air for the DVS cases listed in Table 1 were predicted using the simulation method. The MVS shown in Figure 4 is the most widely used ventilation system. Hence, simulation methods for the MVS are well established in many previous studies. Accordingly, the MVS cases listed in Table 1 were analyzed by referencing the analysis techniques of preceding studies [42,46].
Figure 10 displays the temperature distribution in the office for Cases C, D, I, and J, where the ventilation flowrate was set to 910 m3/h. Vertical cross-sections in Room 1 and Room 2 were located at the center along the length and width, and horizontal cross-sections were positioned at a height of 1.1 m from the floor, taking into consideration the respiratory location of a seated adult. In Case C, as shown in Figure 10a,c, where DVS or Improved DVS was applied, a relatively uniform temperature distribution ranging from 20 to 24 °C was observed from the floor to the ceiling across the entire office space, except for the area surrounding the APs used as VO; this can also be corroborated by the results in Figure 8. For Case D, as illustrated in Figure 10b,d, even though it employed the same ventilation method as Case C, the temperature in the office space was distributed higher, ranging from 24 to 28 °C, due to the higher set temperature on the FCU control panel. Nevertheless, in Case D, a relatively uniform temperature distribution was still formed across the entire office space, excluding the area near the APs. Meanwhile, Figure 10e,f show the results for the Case I and Case J, respectively, when a typical MVS was applied; although the average temperature ranges in the entire office space were similar to those of Case C and Case D, a difference was noted in the temperature distribution based on height, with a greater temperature deviation compared to Cases C and D where DVS was implemented. The reason for this difference is that warm air was emitted from the floor-mounted APs and rose due to buoyancy in the cases where DVS was applied, causing convection across the entire office space, while the warm air discharged from the ceiling-mounted VI-diffusers did not reach the floor due to its relatively lower density in the cases with MVS, causing convection mostly in the upper area of the office space. In this way, it is anticipated that the DVS and Improved DVS, which exhibited a more uniform temperature distribution, can be beneficial for enhancing thermal comfort in indoor environments such as office spaces.
Figure 11 displays the simulated results of the LMA distribution at a height of 1.1 m from the floor, which is assumed to be the location of the respiratory system when an adult is seated. Figure 11a,b, corresponding to offices where DVS was applied, showed similar LMA distributions, but Case C demonstrated lower values than Case D. These results can be attributed to the indoor air temperatures and the temperatures of air discharged from the APs: 22–24 °C and 33 ± 0.7 °C for Case C, and 25–29 °C and 35 ± 0.9 °C for Case D. The larger temperature difference in Case C compared to Case D led to greater buoyancy, causing the air to circulate more quickly indoors. However, for both Cases C and D where DVS was used, flow stagnation was observed in areas far from the APs, resulting in higher LMA, especially in the center of Room 1 where the office partition hindered smooth airflow, causing particularly high LMA predictions. To address this issue, the Improved DVS shown in Figure 3 was conceived. Figure 11c,d presents the simulation results for offices with Improved DVS applied for Cases C and D, and due to significant reduction in flow stagnation, the LMA peak value was considerably lower compared to the same cases with DVS. The reason behind these outcomes can be attributed to the Improved DVS, which overcame the limitations of the previously mentioned DVS approach by increasing the number of APs, thus allowing clean air to be supplied from multiple locations including the area surrounded by partitions. This reduced air-stagnant spots located too far from the APs and ensured that clean air could even be supplied to partitioned spaces. Meanwhile, Figure 11e,f illustrates the LMA distribution for offices with MVS applied for Cases I and J, respectively. Although Room 1 had twice the ventilation flowrate applied compared to Room 2, since the number of VIs was the same, the jet velocity from a single diffuser doubled, leading to the prediction that Room 1 would generally show a lower LMA distribution. Comparing the MVS-applied cases, Case J, set at 27 °C, showed a higher LMA value than Case I at 22 °C, due to the discharged air from the VI being warmer (i.e., relatively lower in density), which inhibited clean air from effectively reaching the lower office area. When comparing Cases C and I, which had the same ventilation flowrate and set temperature but different ventilation systems, DVS displayed an average 8.9% lower LMA than MVS. However, comparing Figure 11a,e, in the case of DVS, areas within Room 1 that were distant from the APs and obstructed by partitions showed even higher peak LMA values than when MVS was applied. On the other hand, as shown in Figure 11c, the case with the Improved DVS displayed an average LMA 14.5% lower compared to Case I in Figure 11e, and also predicted a lower peak LMA in Room 1. This trend was similarly observed when comparing Cases D and J, with the Improved DVS showing the best indoor air quality among the tested ventilation systems. Thus, subsequent content did not consider DVS, but compared and analyzed Improved DVS and MVS.
Figure 12a compares the average LMA values at a height of 1.1 m from the floor for all considered cases, and Improved DVS showed lower average LMA values than MVS. Notably, the LMA difference between Improved DVS and MVS was more significant when the ventilation flowrate was lower and less significant when it was higher. For instance, when the FCU set temperature was 22 °C, the relative difference in LMA between Improved DVS and MVS was 18.6, 14.5, and 8.6% for ventilation flowrates of 640 m3/h, 910 m3/h, and 1180 m3/h, respectively. This is because, in the case of MVS, when the ventilation flowrate was low, clean air at a higher temperature supplied from the ceiling-mounted VIs could not effectively descend to the respiratory level at 1.1 m, resulting in a relatively higher LMA. This emphasizes the efficiency of the DVS approach in maintaining better air quality even at low ventilation flowrates. As the ventilation flowrate became higher, the increased discharge speed allowed the clean air to reach closer to the floor, thus reducing the LMA difference with Improved DVS. Under fixed ventilation system and ventilation flowrate conditions, the higher the FCU set temperature, the greater the average LMA. This is believed to be because the temperature difference between indoor air and the air discharged from the VIs was relatively larger when the FCU set temperature was 22 °C than when it was 27 °C, resulting in faster air circulation due to greater buoyancy. Meanwhile, considering the average height of Korean adult males [47], the average LMA value at a height of 1.7 m from the floor was additionally analyzed, and the results are presented in Figure 12b. The trend in the average LMA value comparison shown in Figure 12b was similar to the results at a height of 1.1 m in Figure 12a. However, the relative difference in the average LMA value between Improved DVS and MVS at a height of 1.7 m decreased. For instance, with an FCU set temperature of 22 °C, the discrepancies between Improved DVS and MVS were 8.0, 2.9, and 0.8% for ventilation flowrates of 640 m3/h, 910 m3/h, and 1180 m3/h, respectively. Nevertheless, Improved DVS was still predicted to provide better indoor air quality than MVS.
While Figure 12a,b compared the LMS values at specific heights, Figure 13 took into account the possibility of people of various heights engaging in various activities in the office. It compared the average LMA values within the entire volume corresponding to the height range 0–1.8 m, assuming this to be the range where a person’s respiratory system could be located. Consistent with the trends in the average LMA at heights of 1.1 m and 1.7 m, the average LMA for the entire space corresponding to heights 0–1.8 m was also predicted to be lower when the FCU set temperature was lower and when the ventilation flowrate was higher. Again, Improved DVS appeared to be better than MVS in enhancing indoor air quality within the entire volume corresponding to the height range 0–1.8 m under heating conditions.

4. Conclusions

The DVS in this study utilized floor-placed APs as VI and ceiling-mounted FCU and diffusers as VO, designed to promote smooth upward air circulation from the floor to the ceiling during the winter season. Considering the location of the respiratory system when people are sitting or standing in the office, the LMA values at specific heights between DVS and MVS were evaluated and compared. Experiments were conducted in an office equipped with the proposed DVS, operating the FCU under heating conditions in winter, and measuring air temperature and the age of air at various locations within the office. These experimental results were compared with numerical analysis outcomes to validate the reliability of the numerical techniques. Utilizing the validated numerical approach, the distribution of the age of air in the office was simulated under various temperature and ventilation flowrate conditions. Then, indoor air quality was compared between DVS and MVS.
It was observed that the LMA changed when the set temperature of the FCU varied, given that the ventilation system and ventilation flowrate remained constant. The lower the set temperature, the greater the temperature difference between the air discharged through the VI and the indoor air. As a result, buoyancy acted more strongly when the FCU set temperature was 22 °C compared to 27 °C, leading to the better circulation of indoor air and a lower LMA. This suggests the potential for guidelines on ventilation performance based on indoor temperature settings during the winter months. In other words, when the ventilation system operates under heating conditions, it is assessed that lowering the indoor temperature setting within a certain range for thermal comfort can improve indoor air quality.
In the initial model of the DVS for this study, it was observed that clean air emitted from the APs could not circulate smoothly within the office space due to obstacles like partitions and would become stagnant. To address this, the Improved DVS was proposed by increasing the number of APs placed in the office space and adjusting the air outlet surface of the AP. With the use of Improved DVS, the stagnation of the air was alleviated, resulting in an increased uniformity of LMA distribution throughout the office space. Thus, the Improved DVS demonstrated a more uniform LMA distribution while lowering the average and maximum LMA values, even compared to the MVS with the same ventilation flowrate and heat supply. The reason for this result is that, in the case of MVS, warm air supplied from the VIs installed on the ceiling could not effectively reach the lower space due to its lower density, leading to air circulation primarily in the upper area. In contrast, for the Improved DVS, warm air supplied from the VIs placed on the floor rose due to buoyancy, allowing for smooth air circulation throughout the indoor space. This smooth air circulation of the Improved DVS, when compared to MVS, also resulted in smaller temperature deviations at different indoor heights, thereby enhancing thermal comfort. The Improved DVS structure devised in this study has the advantage of being easily implemented in indoor spaces where FCU is already installed on the ceiling, simply by restructuring and adding APs. This is expected to be greatly beneficial in improving indoor air quality in various spaces. In the future, it will be necessary to evaluate the performance of Improved DVS under cooling conditions in the summer and studies are planned to accumulate data on different indoor space configurations and devise strategies for expanding its application range. Future studies also need to be conducted to evaluate the energy efficiency of Improved DVS by considering the energy consumption and ventilation strategy. Furthermore, the actual system design needs to be developed to comply with safety standards and regulations provided by organizations like the American Society of Heating, Refrigerating and Air-Conditioning Engineers (ASHRAE), the National Fire Protection Association (NFPA), and others.

Author Contributions

Conceptualization, I.-H.A., H.-W.L. and S.-J.Y.; methodology, I.-H.A., H.-W.L. and S.-J.Y.; software, I.-H.A., S.-H.P., Y.-H.L., C.-H.L., S.-B.S. and S.-H.C.; validation, I.-H.A. and S.-J.Y.; formal analysis, I.-H.A. and S.-J.Y.; investigation, I.-H.A., S.-H.P., Y.-H.L., C.-H.L., S.-B.S., S.-H.C. and S.-J.Y.; resources, H.-W.L. and S.-J.Y.; data curation, I.-H.A. and S.-J.Y.; writing—original draft preparation, I.-H.A.; writing—review and editing, S.-J.Y.; supervision, S.-J.Y.; funding acquisition, S.-J.Y. All authors have read and agreed to the published version of the manuscript.

Funding

This work was supported by the BK21 FOUR (Fostering Outstanding Universities for Research) program through the National Research Foundation (NRF) funded by the Ministry of Education of Korea.

Institutional Review Board Statement

Not applicable.

Informed Consent Statement

Not applicable.

Data Availability Statement

Data are contained within the article.

Conflicts of Interest

The authors declare no conflicts of interest.

References

  1. World Health Organization. WHO Coronavirus (COVID-19) Dashboard. 2022. Available online: https://covid19.who.int (accessed on 24 August 2022).
  2. Zhu, N.; Zhang, D.; Wang, W.; Li, X.; Yang, B.; Song, J.; Zhao, X.; Huang, B.; Shi, W.; Lu, R.; et al. A novel coronavirus from patients with pneumonia in China, 2019. N. Engl. J. Med. 2020, 382, 727–733. [Google Scholar] [CrossRef] [PubMed]
  3. Fears, A.C.; Klimstra, W.B.; Duprex, P.; Hartman, A.; Weaver, S.C.; Plante, K.S.; Mirchandani, D.; Plante, J.A.; Aguilar, P.V.; Fernández, D.; et al. Persistence of severe acute respiratory syndrome coronavirus 2 in aerosol suspensions. Emerg. Infect. Dis. 2020, 26, 2168–2171. [Google Scholar] [CrossRef] [PubMed]
  4. Yu, I.T.; Li, Y.; Wong, T.W.; Tam, W.; Chan, A.T.; Lee, J.H.; Leung, D.; Ho, T. Evidence of airborne transmission of the severe acute respiratory syndrome virus. N. Engl. J. Med. 2004, 350, 1731–1739. [Google Scholar] [CrossRef] [PubMed]
  5. Tellier, R.; Li, Y.; Cowling, B.J.; Tang, J.W. Recognition of aerosol transmission of infectious agents: A commentary. BMC Infect. Dis. 2019, 19, 101. [Google Scholar] [CrossRef] [PubMed]
  6. Morawska, L.; Milton, D.K. It is time to address airborne transmission of coronavirus disease 2019 (COVID-19). Clin. Infect. Dis. 2020, 71, 2311–2313. [Google Scholar] [CrossRef] [PubMed]
  7. Lee, S.Y.; Choi, S.H.; Park, J.E.; Hwang, S.; Kwon, K.T. Crucial role of temporary airborne infection isolation rooms in an intensive care unit: Containing the COVID-19 outbreak in South Korea. Crit. Care 2020, 24, 238. [Google Scholar] [CrossRef]
  8. Prather, K.A.; Marr, L.C.; Schooley, R.T.; McDiarmid, M.A.; Wilson, M.E.; Milton, D.K. Airborne transmission of SARS-CoV-2. Science 2020, 370, 303–304. [Google Scholar]
  9. Miller, S.L.; Nazaroff, W.W.; Jimenez, J.L.; Boerstra, A.; Buonanno, G.; Dancer, S.J.; Kurnitski, J.; Marr, L.C.; Morawska, L.; Noakes, C. Transmission of SARS-CoV-2 by inhalation of respiratory aerosol in the Skagit Valley Chorale superspreading event. Indoor Air 2021, 31, 314–323. [Google Scholar] [CrossRef]
  10. Tang, L.; Liu, M.; Ren, B.; Chen, J.; Liu, X.; Wu, X.; Huang, W.; Tian, J. Transmission in home environment associated with the second wave of COVID-19 pandemic in India. Environ. Res. 2022, 204, 111910. [Google Scholar] [CrossRef]
  11. Klepeis, N.E.; Nelson, W.C.; Ott, W.R.; Robinson, J.P.; Tsang, A.M.; Switzer, P.; Behar, J.V.; Hern, S.C.; Engelmann, W.H. The National Human Activity Pattern Survey (NHAPS): A resource for assessing exposure to environmental pollutants. J. Expo. Sci. Environ. Epidemiol. 2001, 11, 231–252. [Google Scholar] [CrossRef]
  12. Chen, C.; Jiang, M.; Luo, X.; Tai, H.; Jiang, Y.; Yang, M.; Xie, G.; Su, Y. Ni-Co-P hollow nanobricks enabled humidity sensor for respiratory analysis and human-machine interfacing. Sens. Actuators B Chem. 2022, 370, 132441. [Google Scholar] [CrossRef]
  13. Chen, C.; Xie, G.; Dai, J.; Li, W.; Cai, Y.; Li, J.; Zhang, Q.; Tai, H.; Jiang, Y.; Su, Y. Integrated core-shell structured smart textiles for active NO2 concentration and pressure monitoring. Nano Energy 2023, 116, 108788. [Google Scholar] [CrossRef]
  14. Li, Y.; Qian, H.; Hang, J.; Chen, X.; Cheng, P.; Ling, H.; Wang, S.; Liang, P.; Li, J.; Xiao, S.; et al. Probable airborne transmission of SARS-CoV-2 in a poorly ventilated restaurant. Build. Environ. 2021, 196, 107788. [Google Scholar] [CrossRef] [PubMed]
  15. Shen, Y.; Li, C.; Dong, H.; Wang, Z.; Martinez, L.; Sun, Z.; Handel, A.; Chen, Z.; Chen, E.; Ebell, M.H.; et al. Community outbreak investigation of SARS-CoV-2 transmission among bus riders in Eastern China. JAMA Intern. Med. 2020, 180, 1665–1671. [Google Scholar] [CrossRef] [PubMed]
  16. Rickman, H.M.; Rampling, T.; Shaw, K.; Martinez-Garcia, G.; Hail, L.; Coen, P.; Shahmanesh, M.; Shin, G.Y.; Nastouli, E.; Houlihan, C.F. Nosocomial transmission of coronavirus disease 2019: A retrospective study of 66 hospital-acquired cases in a London teaching hospital. Clin. Infect. Dis. 2021, 72, 690–693. [Google Scholar] [CrossRef] [PubMed]
  17. Blomquist, P.B.; Bolt, H.; Packer, S.; Schaefer, U.; Platt, S.; Dabrera, G.; Gobin, M.; Oliver, I. Risk of symptomatic COVID-19 due to aircraft transmission: A retrospective cohort study of contact-traced flights during England’s containment phase. Influenza Other Respir. Viruses 2021, 15, 336–344. [Google Scholar] [CrossRef] [PubMed]
  18. Sami, S.; Vuong, N.; Miller, H.; Priestley, R.; Payne, M.; Licata-Portentoso, G.; Drobeniuc, J.; Petersen, L.R. SARS-CoV-2 Infection and Mitigation Efforts among Office Workers, Washington, DC, USA. Emerg. Infect. Dis. 2021, 27, 669. [Google Scholar] [CrossRef]
  19. Lee, J.; Park, S.H.; Sung, G.B.; An, I.H.; Lee, K.R.; Hong, S.P.; Yook, S.J.; Koo, H.B. Effect of air cleaner on reducing concentration of indoor-generated viruses with or without natural ventilation. Aerosol Sci. Technol. 2021, 55, 1288–1303. [Google Scholar] [CrossRef]
  20. Bramiana, C.N.; Aminuddin, A.M.R.; Ismail, M.A.; Widiastuti, R.; Pramesti, P.U. The Effect of window placement on natural ventilation capability in a Jakarta high-rise building unit. Buildings 2023, 13, 1141. [Google Scholar] [CrossRef]
  21. Noh, K.C.; Yook, S.J. Evaluation of clean air delivery rates and operating cost effectiveness for room air cleaner and ventilation system in a small lecture room. Energy Build. 2016, 119, 111–118. [Google Scholar] [CrossRef]
  22. Szekeres, S.; Kostyák, A.; Szodrai, F.; Csáky, I. Investigation of ventilation systems to improve air quality in the occupied zone in office buildings. Buildings 2022, 12, 493. [Google Scholar] [CrossRef]
  23. Akbari, V.; Salmanzadeh, M. Numerical evaluation of the effect of air distribution system and location on performance of a portable air cleaner. Sci. Technol. Built Environ. 2019, 25, 34–45. [Google Scholar] [CrossRef]
  24. Aziz, M.A.; Gad, I.A.; El Shahat, F.A.; Mohammed, R.H. Experimental and numerical study of influence of air ceiling diffusers on room air flow characteristics. Energy Build. 2012, 55, 738–746. [Google Scholar] [CrossRef]
  25. Ning, M.; Mengjie, S.; Mingyin, C.; Dongmei, P.; Shiming, D. Computational fluid dynamics (CFD) modelling of air flow field, mean age of air and CO2 distributions inside a bedroom with different heights of conditioned air supply outlet. Appl. Energy 2016, 164, 906–915. [Google Scholar] [CrossRef]
  26. Méndez, C.; San José, J.F.; Villafruela, J.M.; Castro, F. Optimization of a hospital room by means of CFD for more efficient ventilation. Energy Build. 2008, 40, 849–854. [Google Scholar] [CrossRef]
  27. Ren, C.; Xi, C.; Wang, J.; Feng, Z.; Nasiri, F.; Cao, S.J.; Haghighat, F. Mitigating COVID-19 infection disease transmission in indoor environment using physical barriers. Sustain. Cities Soc. 2021, 74, 103175. [Google Scholar] [CrossRef]
  28. Behne, M. Indoor air quality in rooms with cooled ceilings.: Mixing ventilation or rather displacement ventilation? Energy Build. 1999, 30, 155–166. [Google Scholar] [CrossRef]
  29. Park, H.J.; Holland, D. The effect of location of a convective heat source on displacement ventilation: CFD study. Build. Environ. 2001, 36, 883–889. [Google Scholar] [CrossRef]
  30. Yin, Y.; Xu, W.; Gupta, J.K.; Guity, A.; Marmion, P.; Manning, A.; Gulick, B.; Zhang, X.; Chen, Q. Experimental study on displacement and mixing ventilation systems for a patient ward. HVAC&R Res. 2009, 15, 1175–1191. [Google Scholar]
  31. Ahn, H.; Rim, D.; Lo, L.J. Ventilation and energy performance of partitioned indoor spaces under mixing and displacement ventilation. In Building Simulation; Springer: Berlin/Heidelberg, Germany, 2018; pp. 561–574. [Google Scholar]
  32. Wang, J.; Yang, J.; Yu, J.; Xiong, F. Comparative characteristics of relative pollution exposure caused by human surface chemical reaction under mixing and displacement ventilation. Build. Environ. 2018, 132, 225–232. [Google Scholar] [CrossRef]
  33. Wei, G.; Chen, B.; Lai, D.; Chen, Q. An improved displacement ventilation system for a machining plant. Atmos. Environ. 2020, 228, 117419. [Google Scholar] [CrossRef]
  34. Zhao, W.; Mustakallio, P.; Lestinen, S.; Kilpeläinen, S.; Jokisalo, J.; Kosonen, R. Numerical and experimental study on the indoor climate in a classroom with mixing and displacement air distribution methods. Buildings 2022, 12, 1314. [Google Scholar] [CrossRef]
  35. Rencken, G.K.; Rutherford, E.K.; Ghanta, N.; Kongoletos, J.; Glicksman, L. Patterns of SARS-CoV-2 aerosol spread in typical classrooms. Build. Environ. 2021, 204, 108167. [Google Scholar] [CrossRef] [PubMed]
  36. Kaczmarczyk, J.; Melikov, A.; Fanger, P.O. Human response to personalized ventilation and mixing ventilation. Indoor Air 2004, 14, 17–29. [Google Scholar] [CrossRef] [PubMed]
  37. Kacira, M.; Sase, S.; Okushima, L. Optimization of vent configuration by evaluating greenhouse and plant canopy ventilation rates under wind-induced ventilation. Trans. ASAE 2004, 47, 2059–2067. [Google Scholar] [CrossRef]
  38. Zhang, X.; Weerasuriya, A.U.; Tse, K.T. CFD simulation of natural ventilation of a generic building in various incident wind directions: Comparison of turbulence modelling, evaluation methods, and ventilation mechanisms. Energy Build. 2020, 229, 110516. [Google Scholar] [CrossRef]
  39. Yin, H.; Li, Y.; Deng, X.; Han, Y.; Wang, L.; Yang, B.; Li, A. Performance evaluation of three attached ventilation scenarios for tiny sleeping spaces. Build. Environ. 2020, 186, 107363. [Google Scholar] [CrossRef]
  40. ANSYS FLUENT 12.0 User’s Guide. Available online: https://www.afs.enea.it/project/neptunius/docs/fluent/html/ug/main_pre.htm (accessed on 1 September 2022).
  41. Bartak, M.; Cermak, M.; Clarke, J.A.; Denev, J.; Drkal, F.; Lain, M.; Macdonald, I.A.; Majer, M.; Stankov, P. Experimental and numerical study of local mean age of air. In Proceedings of the 7th International Building Performance Simulation Association Conference, Rio de Janeiro, Brazil, 13–15 August 2001; pp. 773–779. [Google Scholar]
  42. Lee, J.; Noh, J.H.; Noh, K.C.; Kim, Y.W.; Yook, S.J. Effect of a system air conditioner on local air quality in a four-bed ward. Aerosol Air Qual. Res. 2021, 21, 200533. [Google Scholar] [CrossRef]
  43. Noh, J.H.; Lee, J.; Noh, K.C.; Kim, Y.W.; Yook, S.J. Effects of hospital ward curtains on ventilation in a four-bed hospital ward. Aerosol Air Qual. Res. 2018, 18, 2643–2653. [Google Scholar] [CrossRef]
  44. NHANES National Health and Nutrition Examination Survey III. Body Measurements (Anthropometry) Manual. 1988. Available online: https://stacks.cdc.gov/view/cdc/53134 (accessed on 15 September 2022).
  45. Liu, X.; Liu, X.; Zhang, T. Influence of air-conditioning systems on buoyancy driven air infiltration in large space buildings: A case study of a railway station. Energy Build. 2020, 210, 109781. [Google Scholar] [CrossRef]
  46. Park, S.H.; Lee, K.R.; Yook, S.J.; Koo, H.B. Enhancement and homogenization of indoor air quality in a classroom using a vertical airflow ventilation scheme. Toxics 2022, 10, 545. [Google Scholar] [CrossRef] [PubMed]
  47. KOSIS. Distribution of Average Height by Gender by Age and Province by Province: General. Available online: https://kosis.kr/statHtml/statHtml.do?orgId=350&tblId=DT_35007_N130&conn_path=I2 (accessed on 28 February 2023).
Figure 1. Schematic of ventilation systems: (a) DVS; (b) MVS.
Buildings 14 00115 g001
Figure 2. Schematic of an office with DVS: (a) isometric view; (b) top view.
Buildings 14 00115 g002
Figure 3. Schematic of an office with Improved DVS: (a) isometric view; (b) top view.
Buildings 14 00115 g003
Figure 4. Schematic of an office with MVS: (a) isometric view; (b) top view.
Buildings 14 00115 g004
Figure 5. Grid independent test result according to grid type and number of cells.
Buildings 14 00115 g005
Figure 6. Grid system used for simulation: (a) office space; (b) diffuser.
Buildings 14 00115 g006
Figure 7. Decay of particle number concentration with time (Case C).
Buildings 14 00115 g007
Figure 8. Comparison of temperature distribution between experiment and simulation: (a) Point a; (b) Point b; (c) Point c.
Buildings 14 00115 g008
Figure 9. Comparison of the age of air between experiment and simulation: (a) Case C; (b) Case D.
Buildings 14 00115 g009
Figure 10. Simulation results of temperature distribution in the office: (a) Case C with DVS; (b) Case D with DVS; (c) Case C with Improved DVS; (d) Case D with Improved DVS; (e) Case I with MVS; and (f) Case J with MVS.
Buildings 14 00115 g010aBuildings 14 00115 g010b
Figure 11. Simulation results of the distribution of the age of air in the office: (a) Case C with DVS; (b) Case D with DVS; (c) Case C with Improved DVS; (d) Case D with Improved DVS; (e) Case I with MVS; and (f) Case J with MVS.
Buildings 14 00115 g011aBuildings 14 00115 g011b
Figure 12. Comparison of the area-averaged age of air between Improved DVS and MVS according to ventilation flowrate: (a) at 1.1 m height; (b) at 1.7 m height.
Buildings 14 00115 g012aBuildings 14 00115 g012b
Figure 13. Comparison of the volume-averaged age of air between Improved DVS and MVS according to ventilation flowrate (in the height range 0–1.8 m).
Buildings 14 00115 g013
Table 1. Cases of ventilation system type, ventilation flowrate, and temperature setting.
Case Ventilation TypeVentilation Flowrate (m3/h)Temperature Setting (°C)
ADVS64022
B27
C91022
D27
E118022
F27
GMVS64022
H27
I91022
J27
K118022
L27
Disclaimer/Publisher’s Note: The statements, opinions and data contained in all publications are solely those of the individual author(s) and contributor(s) and not of MDPI and/or the editor(s). MDPI and/or the editor(s) disclaim responsibility for any injury to people or property resulting from any ideas, methods, instructions or products referred to in the content.

