Article

Abrasion and Maintenance of High-Strength Fiber-Reinforced Pervious Concrete

1
Department of Construction Engineering, Chaoyang University of Technology, Taichung 413, Taiwan
2
Department of Civil Engineering, National Central University, Taoyuan 320, Taiwan
*
Author to whom correspondence should be addressed.
Buildings 2024, 14(1), 127; https://doi.org/10.3390/buildings14010127
Submission received: 27 November 2023 / Revised: 23 December 2023 / Accepted: 31 December 2023 / Published: 3 January 2024

Abstract

:
This study examines the properties of ordinary and high-strength fiber-reinforced pervious concrete, aiming for a 28-day compressive strength exceeding 40 MPa with a target porosity close to 15%. Utilizing glass fiber (at 0.25% and 0.5% volume ratios) and steel fiber (at 1% and 2%), the study conducts mechanical and abrasion resistance testing on pervious concrete specimens. Sand dust clogging experimental simulations assess permeability coefficients for both application and maintenance purposes, revealing optimized maintenance, including vacuum cleaning and high-pressure washing, can restore water permeability to over 60%. The specific mix designs demonstrate high-strength pervious concrete achieves a 28-day compressive strength ranging from 40 to 52 MPa, with corresponding porosities ranging from 7% to 16%. Results highlight the significant impact of the ASTM C1747 impact abrasion test, where ordinary pervious concrete exhibits a cumulative impact abrasion rate reaching 60%, contrasting with approximately 20% for other high-strength specimens.

1. Introduction

Currently, three prevalent materials are used for porous paving: porous asphalt concrete, pervious concrete, and permeable bricks [1,2]. Porous asphalt is the most commonly utilized, but its dark color and low albedo contribute to a heat island effect in urban areas. In contrast, porous concrete, especially when closer to a gray shade, increases albedo, exhibiting poor heat absorption and offering water permeability. This not only regulates surface runoff during heavy rainfall but also mitigates the heat island effect in urban settings [3,4].
The predominant damage to pervious pavements is surface-related, encompassing the peeling of aggregate particles and wear. These damages are categorized into six types—joint damage, hairline cracks, material deterioration, pore closure, abrasion, and surface spalling, as illustrated in Table 1 [5]. These damage types play a crucial role in assessing the condition of pervious pavements and devising appropriate maintenance plans [6,7].
To evaluate the service life and maintenance needs of pervious pavements, the ASTM C944 [8] load-bearing rotary cutting surface abrasion test is widely applied. This rapid and straightforward method, involving a rotating knife applying pressure on the concrete surface, assesses wear-resistant quality. The Cantabro Test is also employed to gauge the durability and wear resistance of hot mix asphalt concrete, with potential applicability to pervious concrete [9,10].
Beyond maintenance, the raw materials used in pervious concrete production impact its resistance to abrasion and tear [11,12,13,14]. Factors such as concrete and aggregate hardness, slurry hardness, and bonding capacity influence wear resistance. It is crucial to balance strength and toughness to avoid brittleness, and studies by Dong et al. [9] highlight that concrete incorporating fiber and latex exhibits excellent wear resistance. Newly poured permeable concrete’s ability to resist wear is directly proportional to the increase in tamping times. Various studies [15,16,17,18] emphasize the influence of particle sizes and compressive strengths on surface wear, indicating higher strength and smaller particle size correlate with better wear resistance. Recent research [16,17,18] also focused on developing test methods related to the durability of pervious concrete pavements, emphasizing the direct proportionality of wear resistance to the number of compactions, as noted by Kia et al. [19].
To ensure the enduring functionality of pervious concrete pavements, meticulous maintenance is essential. Latif et al. [20] propose a comprehensive strategy involving routine, preventive, and corrective measures. Maintenance technologies, as documented in relevant literature, encompass water spraying [21,22,23], sandblasting [21], sweeping [21,22], and vacuuming [22,23,24,25], among other techniques. Extreme weather events can impact pavements significantly, with storms causing substantial clay deposits that impede drainage efficiency and may lead to blockages [26]. However, these deposits are generally manageable through simple cleaning procedures such as sweeping.
The ACI Committee [27] advocates vacuum cleaning followed by high-pressure cleaning as the most effective maintenance approach. However, it is crucial to consider pavement characteristics when determining the most efficient method due to the varied porosity of different pavement types. Divergent perspectives among researchers [28,29,30] highlight the need for tailored treatments for optimal outcomes depending on the specific pavement type.
Permeable concrete pavements often face pore clogging in practical applications, primarily due to the infiltration of common materials like dust, soil, paving fragments, and waste grease into the pores. This compromises permeability and shortens service life. Tests, including the rotational cutting method of ASTM C944 [8], the abrasion impact test of ASTM C1747 [31], and the plugging simulation test method proposed by Omkar and Milani [32], can replicate these phenomena.
Simulated tests for abrasion impact and clogging of enhanced pervious concrete pavements are limited. Typically lacking reinforcement, pervious concrete’s base is less capable of withstanding tensile forces during cracking. This study aims to enhance the mechanical properties of abrasion impact by adding reinforcing fiber materials and designing high-strength pervious concrete proportions. Huang et al. [33] proposed the increase in the volume fraction of carbon fiber, aramid fiber, and polypropylene fiber had a positive impact on the tensile and flexural strength of HFRC. At the same time, the compressive strength of HFRC decreases linearly with the increase in the mixed fiber volume fraction. Chen et al. [34] demonstrated natural fibers could reduce concrete cracking and increase tensile strength. Fibers enhance internal stress distribution and improve the stability of concrete; however, tensile strength is reduced. Additionally, the study investigates improvements in maintenance through a clogging simulation test, thereby advancing the technology of strengthening the design of high-strength fiber-reinforced pervious concrete pavement.
The presented paper addresses a critical aspect of permeable pavements and their maintenance, specifically focusing on pervious concrete. The impact of this research on the scientific community is noteworthy for several reasons: (1) advancement in pavement materials and technologies, (2) environmental considerations, (3) comprehensive assessment of pavement damage, (4) influence of raw materials on wear resistance, (5) incorporation of reinforcing fibers, (6) maintenance strategies and challenges, (7) contributions to fiber-reinforced concrete knowledge. In summary, this introduction contributes new insights into the field of pavement engineering, sustainability, and materials science, providing valuable insights for researchers, practitioners, and policymakers involved in urban infrastructure development and maintenance.

2. Materials and Methods

This study employs high-strength pervious concrete, targeting a strength of approximately 40 MPa, while the control group consists of ordinary pervious concrete with a strength of about 15 MPa. Both groups, regardless of strength level, incorporate glass fiber (at volume ratios of 0.25% and 0.5%) and steel fiber (at 1% and 2%) to induce a stiffening effect in permeable concrete. A comprehensive evaluation covers compressive strength, flexural strength, porosity, clogging resistance, permeability coefficient, wear resistance, and impact tests on the pervious concrete. Maintenance procedures involve using high-pressure water jets or robust vacuuming on clogged pervious concrete, with subsequent measurements taken to assess the effectiveness of water permeability recovery.

2.1. Materials and Mix Design

In this study, both ordinary and high-strength pervious concrete use Portland Type II cement sourced from a local cement company. The cement composition includes a tricalcium aluminate (C3A) content of 5.78%, tricalcium silicate (C3S) content of 62.00%, dicalcium silicate (C2S) content of 10.80%, and tetracalcium aluminium ferrite (C4AF) content of 8.70%. The specific surface area of the cement is measured at 0.38 m2/g. The silica fume (SF) used in the study features a SiO2 content exceeding 94% and a specific surface area of 22.04 m2/g. Both the cement and SF exhibit a loss on ignition of less than 3%.
For the coarse aggregate, coded as N and used in ordinary-strength permeable concrete, the particle size ranged from 9.5 to 4.75 mm. In high-strength permeable concrete, Yilan stone was utilized, sourced from a building materials store, with two particle sizes: 3.64 mm (coded as H1.2) and 3.03 mm (coded as H1). Table 2 provides the grading and screening analysis for the three coarse aggregates. Three types of coarse aggregate are shown in Figure 1. No fine aggregate is employed in this study.
In both high-strength and ordinary-strength permeable concrete, glass fiber (at volume ratios of 0.25% and 0.5%) and steel fiber (at 1% and 2%) are incorporated. Additionally, alkali-resistant (AR) glass zirconium fiber, commercially available at local paint stores, is introduced. This fiber contains zirconium dioxide (ZrO2) and is designed for compatibility with cement alkaline environments. The steel fiber utilized had a diameter of 1.9 mm and a length of 30 mm, presenting as a hooked-end fiber produced through cold drawing. Detailed physical and mechanical properties of both types of fibers are provided in Table 3 [4].
Table 4 presents the 15 mix designs for permeable concrete being used in this study. Mix #1 (N0) consists of a pure concrete mix. Mix #2 (NS1) includes 1% steel fibers, and Mix #3 (NS2) contains 2% steel fibers. Mix #4 (NG1) incorporates 0.25% fiberglass, and Mix #5 (NG2) includes 0.5% fiberglass. These first five mix designs are all for ordinary-strength permeable concrete. The slump of ordinary permeable concrete is nearly zero, and the water-cement ratio is 0.3 [4].
To justify the choice of proportions studied, the following approach was used: (a) reference to previous studies, (b) consideration of material characteristics, (c) mix designs for different strength categories, (d) particle size consideration, (e) slump and water-cement ratio, (f) technical indicators and design goals, and (g) verification of technical requirements. By addressing these points, the research, material properties, and technical requirements were established to satisfy the rationale and appropriateness of the selected mix designs in Table 4.
The subsequent five mix designs are for high-strength permeable concrete, utilizing 3.03 mm stone based on its maximum particle size. Mix #6 (H10) comprises a fiber-free concrete mix. Mix #7 (H1S1) includes 1% steel fiber, and Mix #8 (H1S2) contains 2% steel fiber. Mix #9 (H1G1) incorporates 0.25% fiberglass, while Mix #10 (H1G2) includes 0.5% fiberglass. The final five mix designs are for high-strength permeable concrete using 3.64 mm stone based on its maximum particle size. Mix #11 (H1.2) comprises a fiber-free concrete mix. Mix #12 (H1.2S1) contains 1% steel fiber, and Mix #13 (H1.2S2) includes 2% steel fiber. Mix #14 (H1.2G1) incorporates 0.25% fiberglass, and Mix #15 (H1.2G2) contains 0.25% fiberglass. The slump of high-strength permeable concrete is close to zero, and the water-cement ratio is 0.14. The design of high-strength permeable concrete aims for a 28-day compressive strength exceeding 40 MPa and a porosity as close to 15% as possible to meet technical specifications [4].

2.2. Test Specimens and Methods

Concrete samples are available in three sizes: (1) Cylinder specimens with a diameter of 100 mm and a height of 200 mm, prepared in accordance with ASTM C39/39M-16 [27] to investigate the development of compressive strength. (2) Beam specimens measuring 100 mm × 100 mm × 350 mm designed for assessing flexural strength. (3) For wear testing, cylindrical Φ15 cm × 5 cm PVC pipes are employed as molds for the test specimens. The sample is filled in 2 layers, with each layer compacted 25 times. After 1 day, the permeable concrete specimens are demolded and cured in room temperature water for 7, 28, or 90 days. Subsequently, they undergo compressive strength and other tests.
The objective of this study is to assess the impact of incorporating glass fiber and steel fiber in ordinary or high-strength permeable concrete. The focus is on determining whether these additives can enhance wear resistance and ease of maintenance in terms of clogging.

2.2.1. Porosity and Permeability Coefficient Test

The porosity measurement was conducted using the drainage volume method specified by the Japan Concrete Association, as indicated in Formula (1). Initially, the specimen was immersed in a constant-temperature water bath for 24 h, and the saturated weight at surface dryness was recorded. Subsequently, the specimen was dried in an oven at 110 °C for 24 h, weighed in water, and the connected porosity (P1) was calculated [4].
P 1 = 1 ( W 1 W 2 ) V 1 × 100 %
where P 1 : represents connected porosity (%), W 1 : is the weight of the specimen in water, W 2 : the weight of the saturated-surface-dry specimen, and V 1 : the volume of the specimen.
The water permeability coefficient (K) was determined through the falling head test, following the procedure outlined in ACI 522R-10 [9], a method derived from soil mechanics suitable for low permeability soil (K < 10−2 cm/s). The test setup, inspired by Hong et al. [12], involved an acrylic pipe with a 9.5 mm inner diameter at the upper end connected to the PVC pipe of the pervious concrete specimen (see Figure 1). Post-testing, the K value was calculated using Formula (2).
K = A 1 A 2 × L t × l n ( h 1 h 2 )
where K : represents permeability coefficient (cm/s), A 1 : is the cross-sectional area of pipe (cm2), A 2 : is the cross-sectional area of specimen (cm2), h 1 : is the initial head height (cm), h 2 : the final head position (cm), L : represents height of specimen (cm), and t : is the time for water to flow from h 1 to h 2 (s).

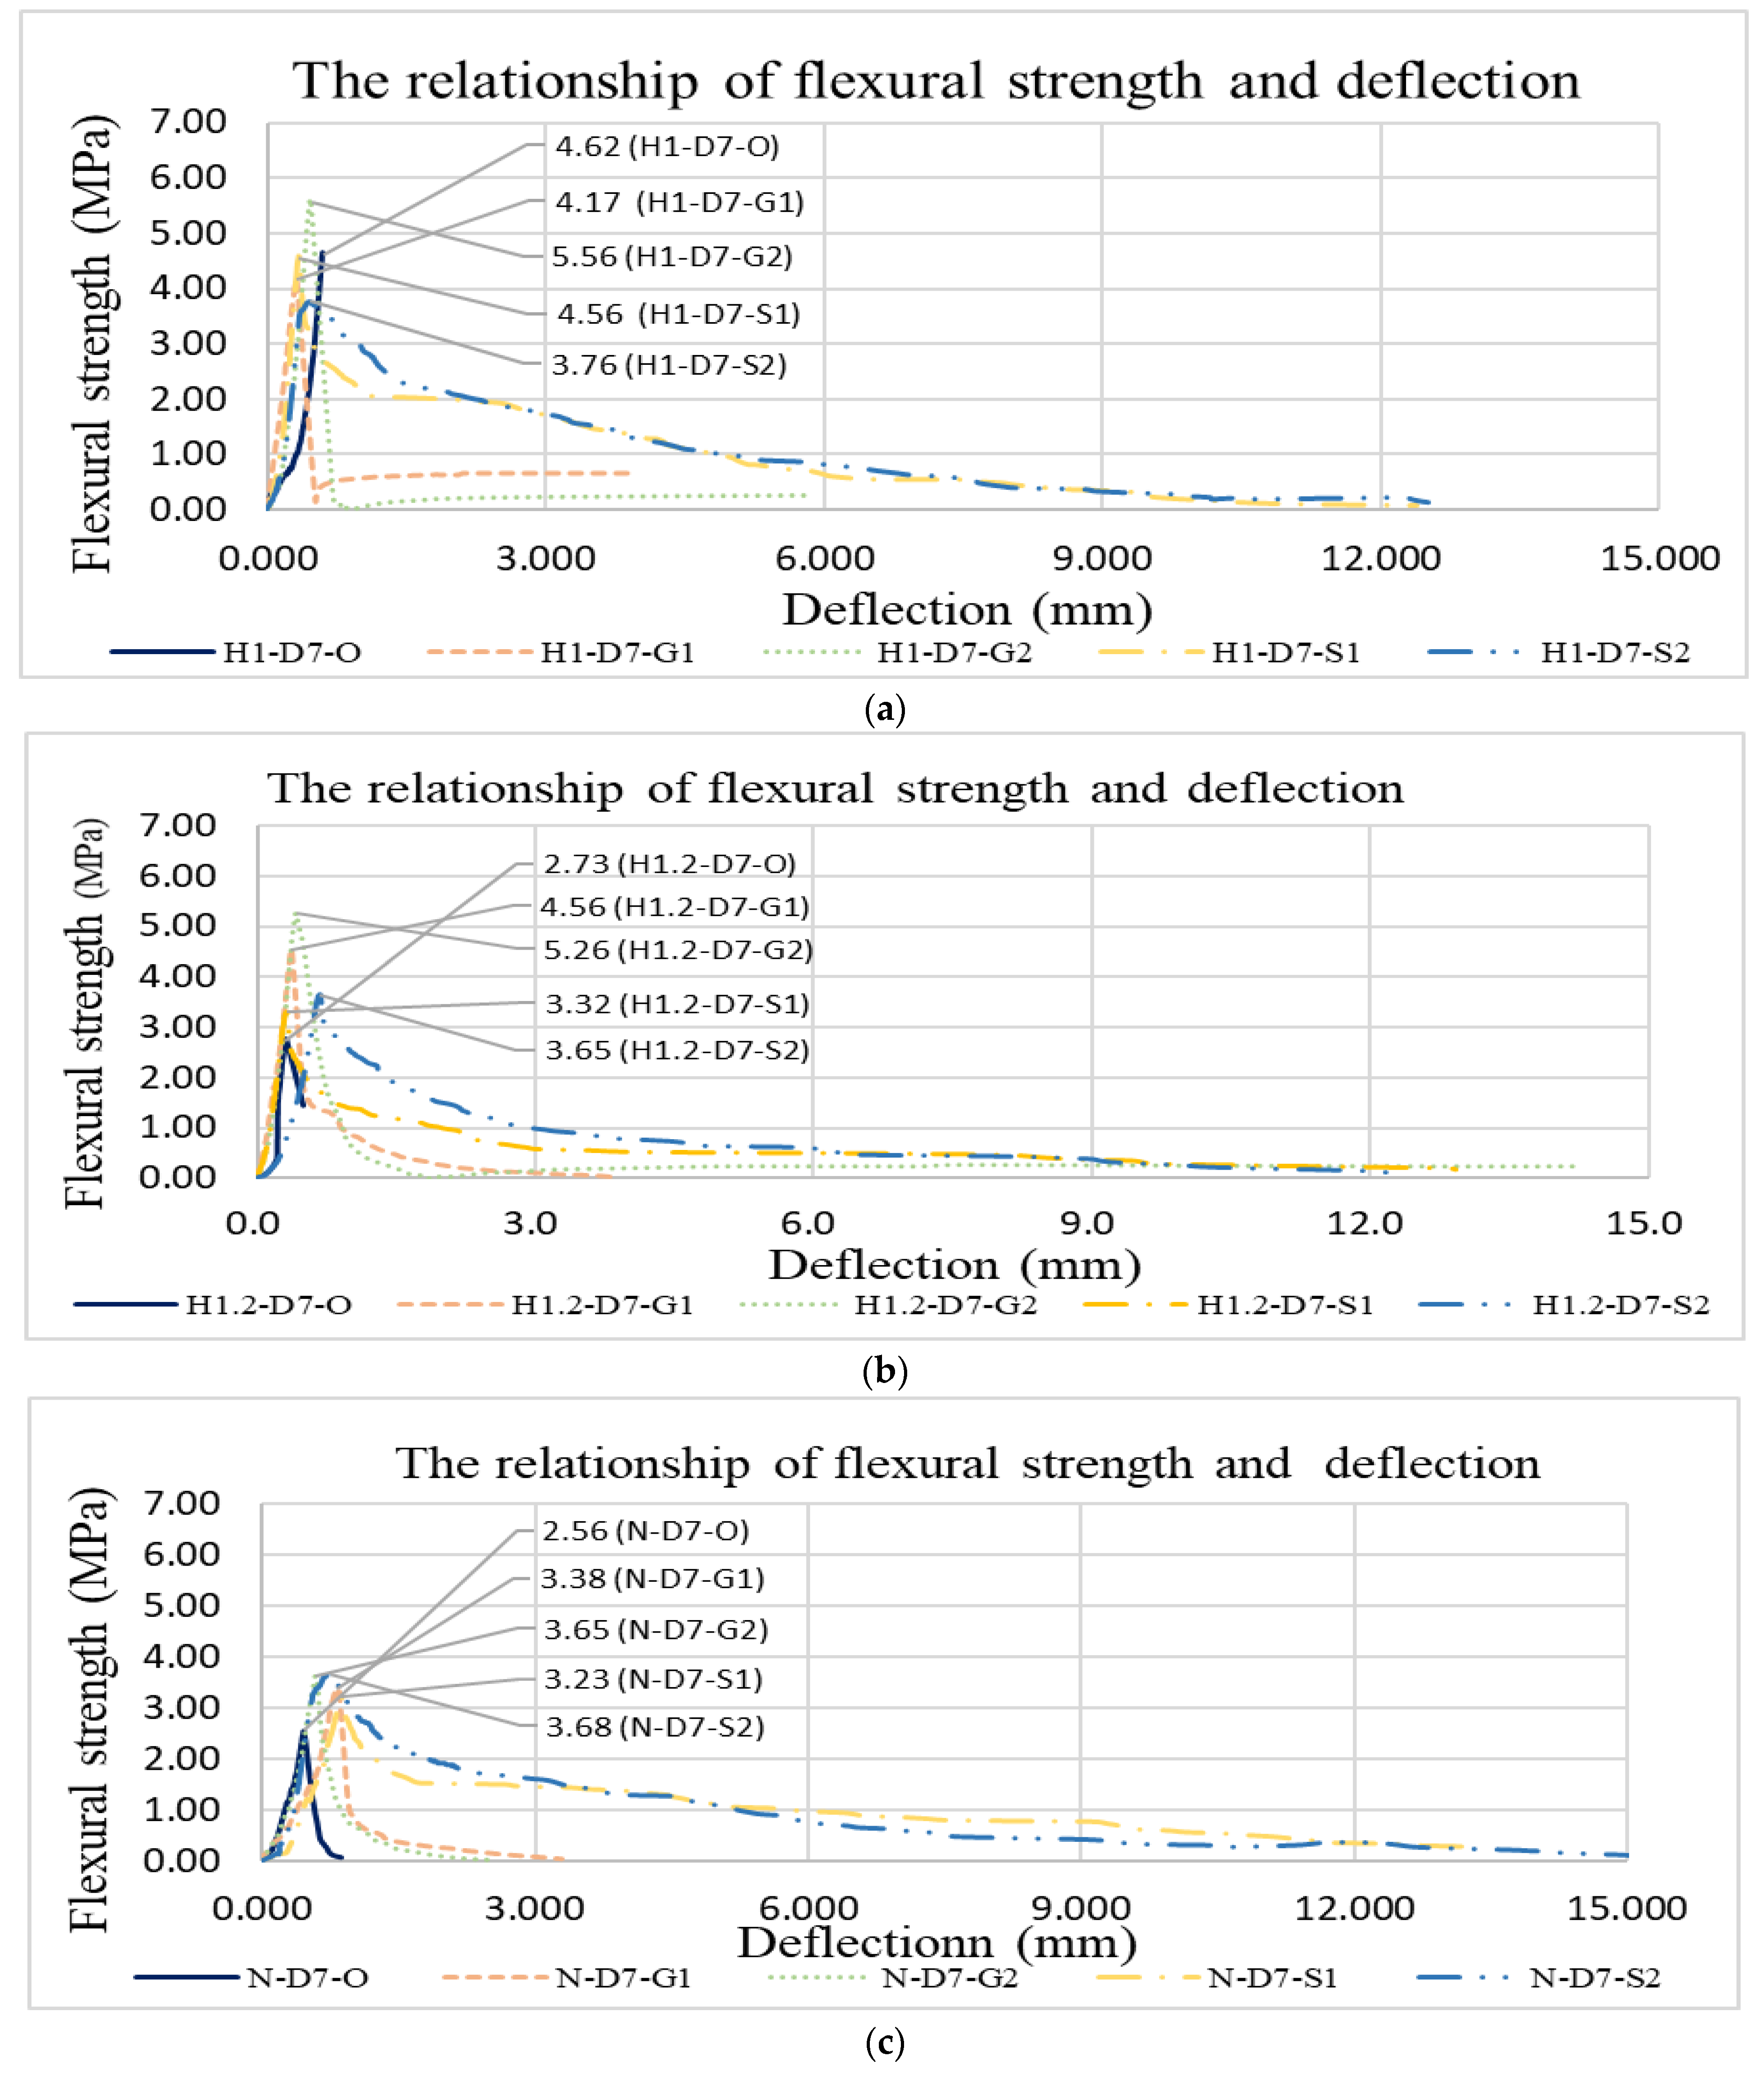
2.2.2. Flexural Strength Test

The test was conducted in accordance with the ASTM C78/C78M-18 [35] three-point load bending test specification. After the test, the flexural strength of the beam was calculated using Formula (3).
R = P L b d 2
In the formula, R: is the bending failure load (N), P: is the maximum load (N), L: is the span between supporting rods (mm), b: the width of sample (mm), and d: represents the depth of sample (mm).

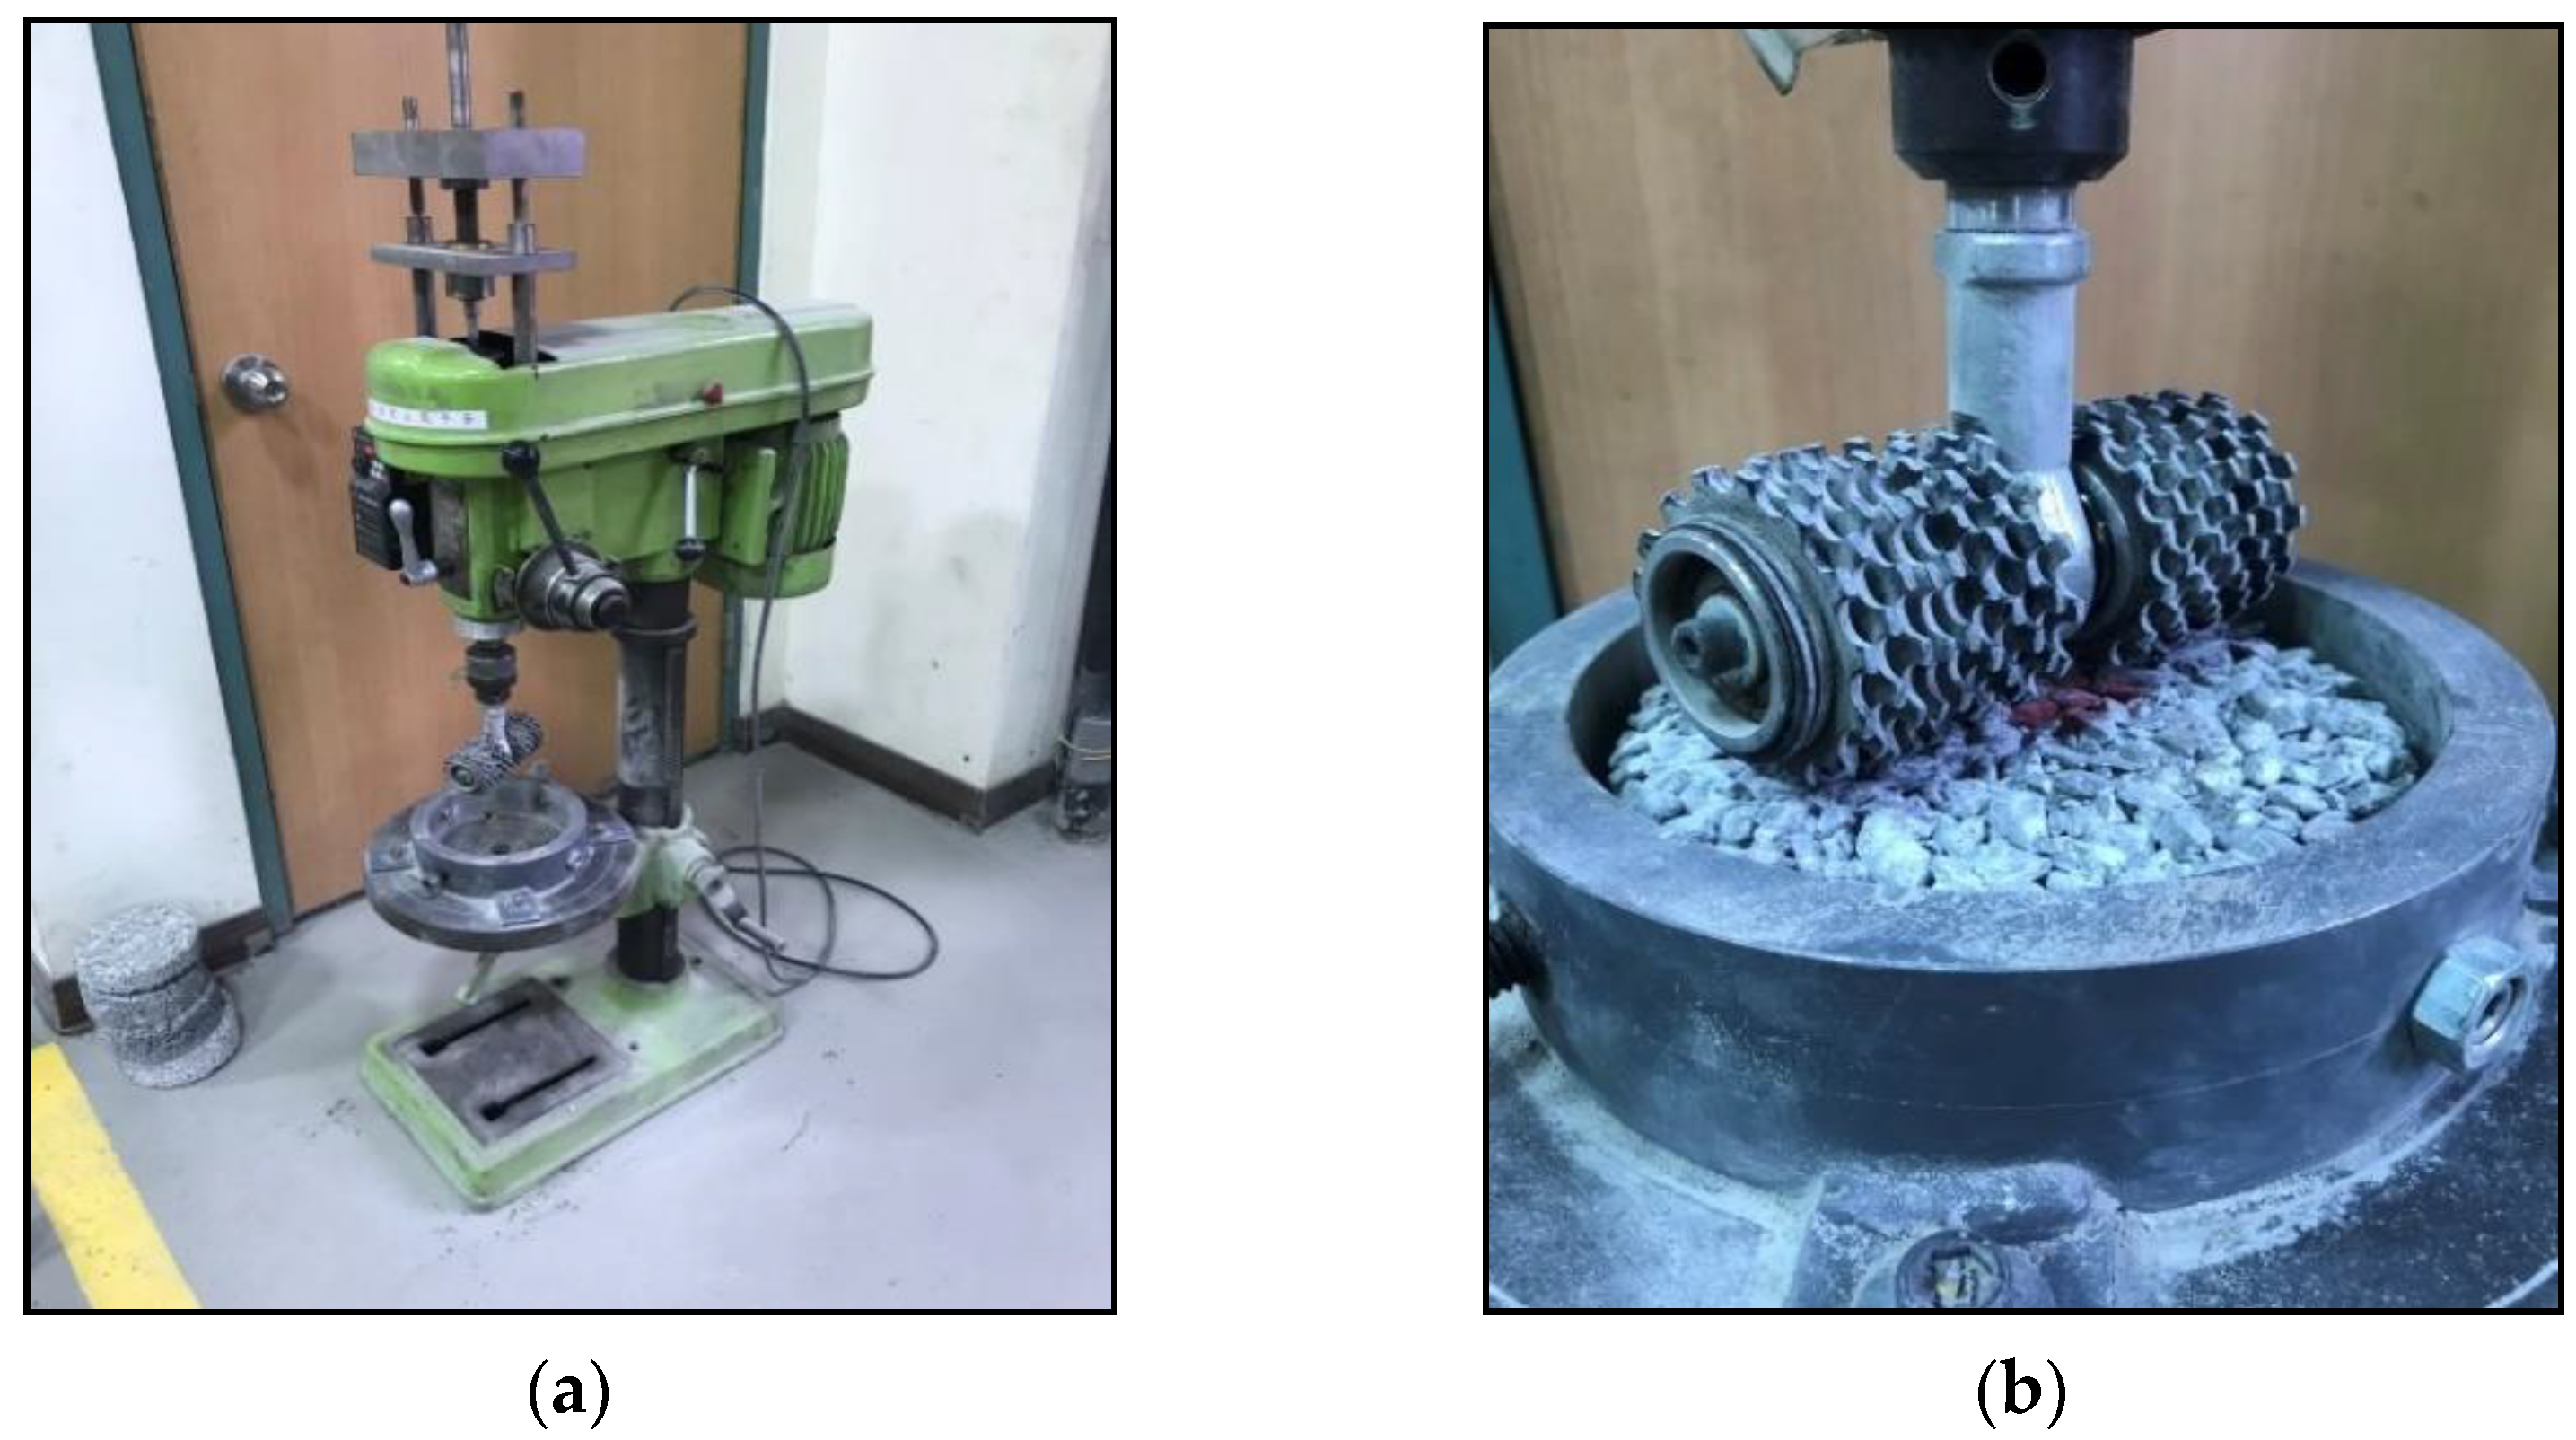
2.2.3. Abrasion Test

This study conducted two different abrasion tests on permeable concrete: the concrete surface abrasion test ASTM C944 [8] and the concrete impact abrasion test ASTM C1747 [31]. The former assesses the abrasion resistance of the test object’s surface. This involved using a drill press or a similar apparatus equipped with a chuck capable of securely holding and rotating the abrading cutter at a speed of 200 revolutions per minute (r/min), while applying a force of either a normal load of 98 ± 1 N or a double load of 197 ± 2 N to the test specimen surface. Furthermore, a balance with a minimum capacity of 4 kg and an accuracy of at least 0.1 g was employed in the research. Two different mass blocks (98N and 197N) are used to apply pressure to the rotating blade for surface grinding. Each test lasts for 2 min, and each load is tested three times, totaling 6 min. After each grinding session, the surface sand and dust need to be cleaned and patted dry. Subsequently, the cleaned surface is weighed to calculate the weight loss. This test instrument is shown in Figure 2a, the maximum rotation speed is 200 rpm, and the rotating blade above the instrument base is composed of several steel sheets, as shown in Figure 2b.
The latter test method is adapted from the ASTM C131/C131M-14 [36] coarse aggregate wear test. In this test, a 15 cm × 5 cm cylindrical concrete specimen is placed in the Los Angeles abrasion tester. The iron barrel is motor-driven to rotate without the placement of an iron ball. During the test, the concrete specimen rubs against the barrel wall while freely falling and hitting the inner wall of the iron barrel to achieve wear loss. The test requires a fixed speed; specifically, the test speed is set at 33 revolutions per minute. After 500 revolutions, the test is concluded, and the weight loss is measured. To explore the wear characteristics of the two tests, a cylindrical specimen with the same dimensions (15 cm × 5 cm) was used. For the impact test, the specimen was taken out and weighed every 166 revolutions, totaling three measurements over approximately 500 revolutions. The weight loss calculation formulas for the two tests are as follows:
W e i g h t   l o s s   ( % ) = ( M i M t ) M i × 100 %
In the formula, Mi represents the weight of specimen before wear (g), and Mt: the weight of specimen after wear (g).

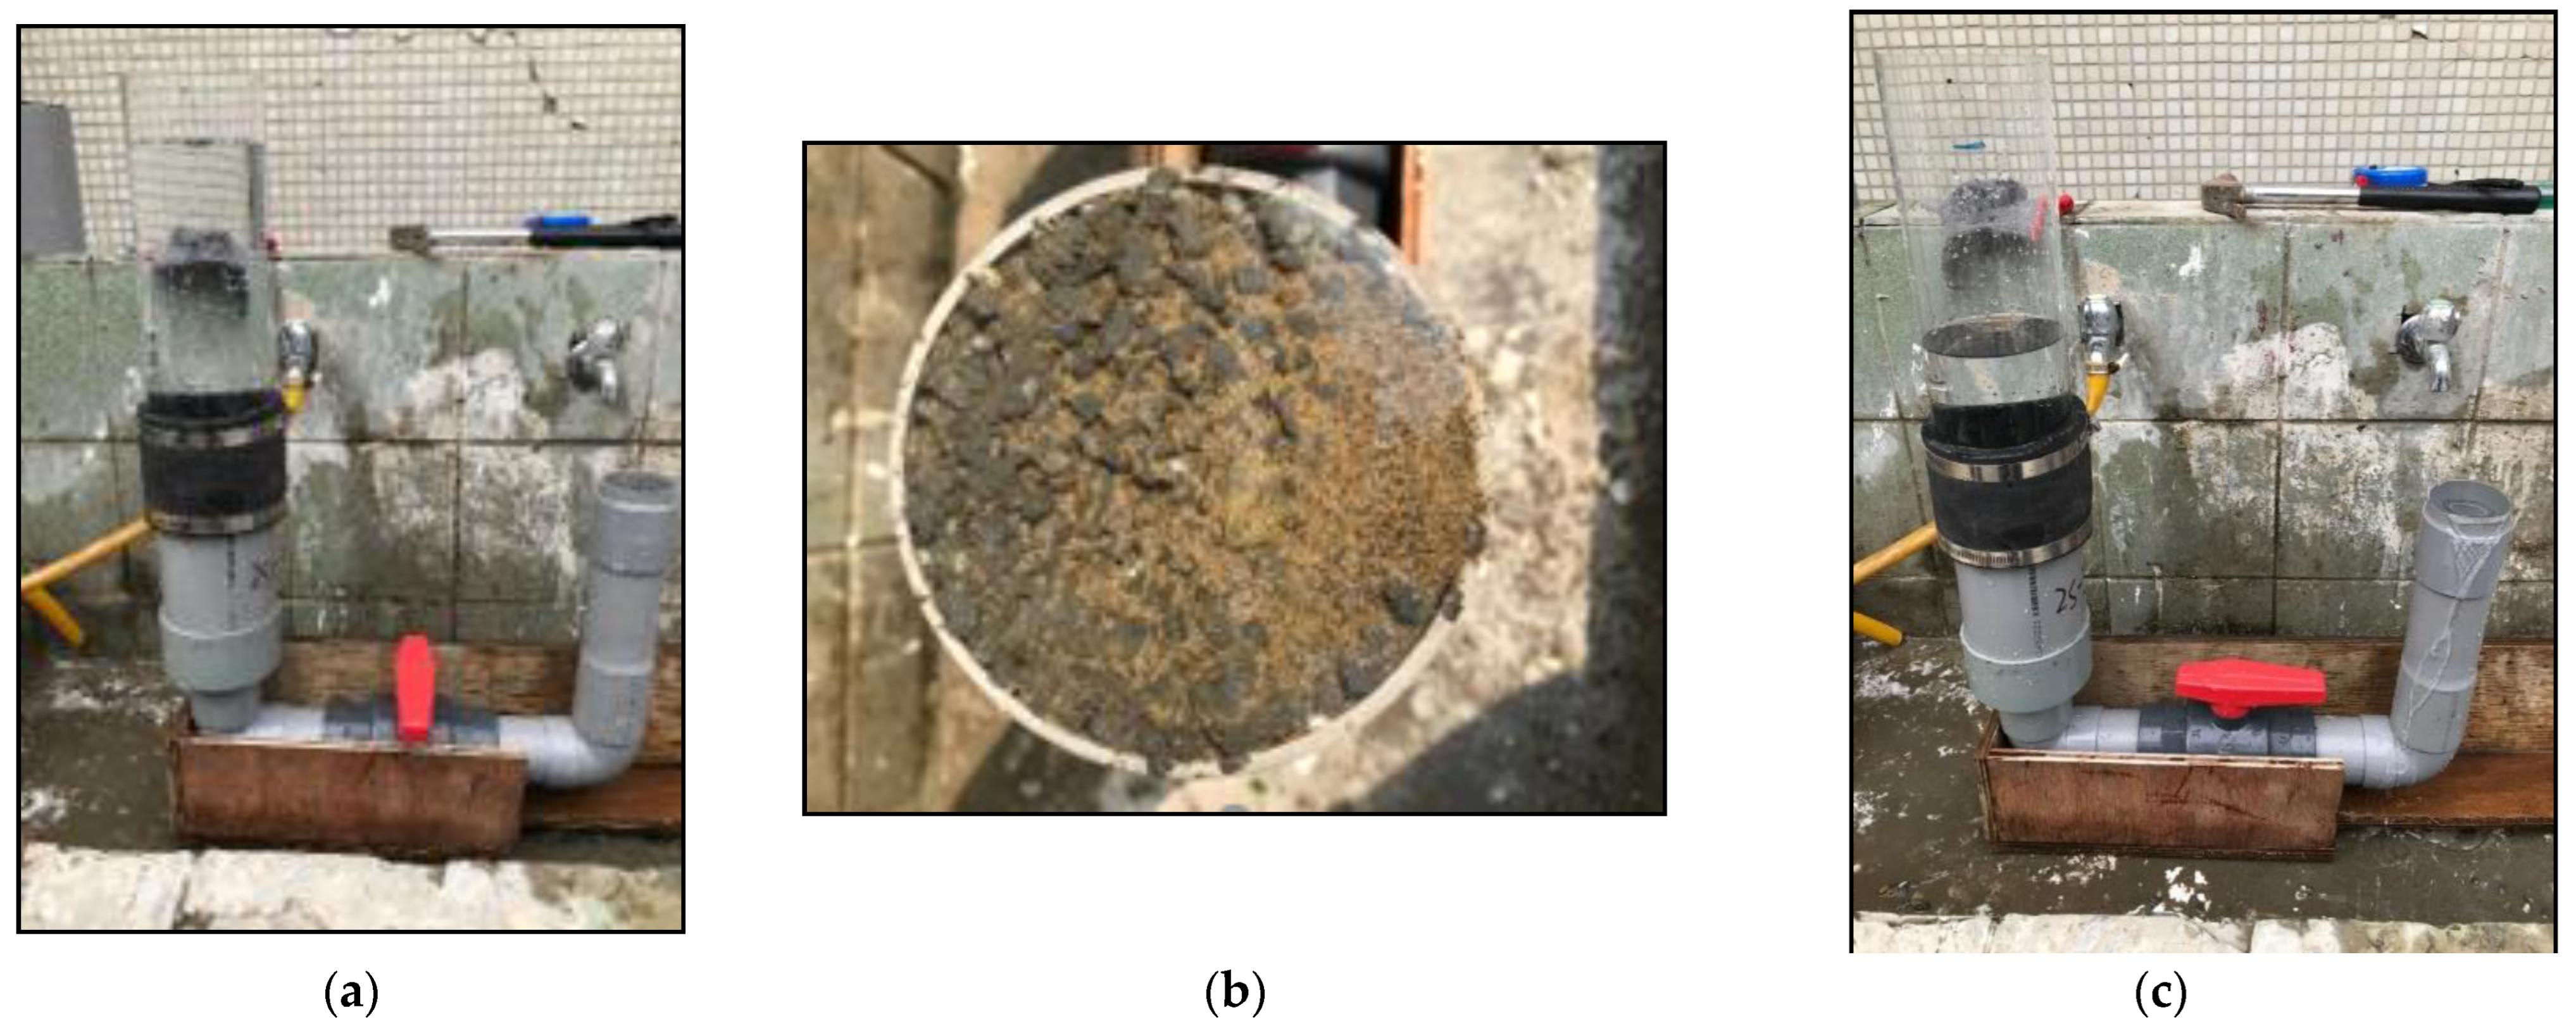
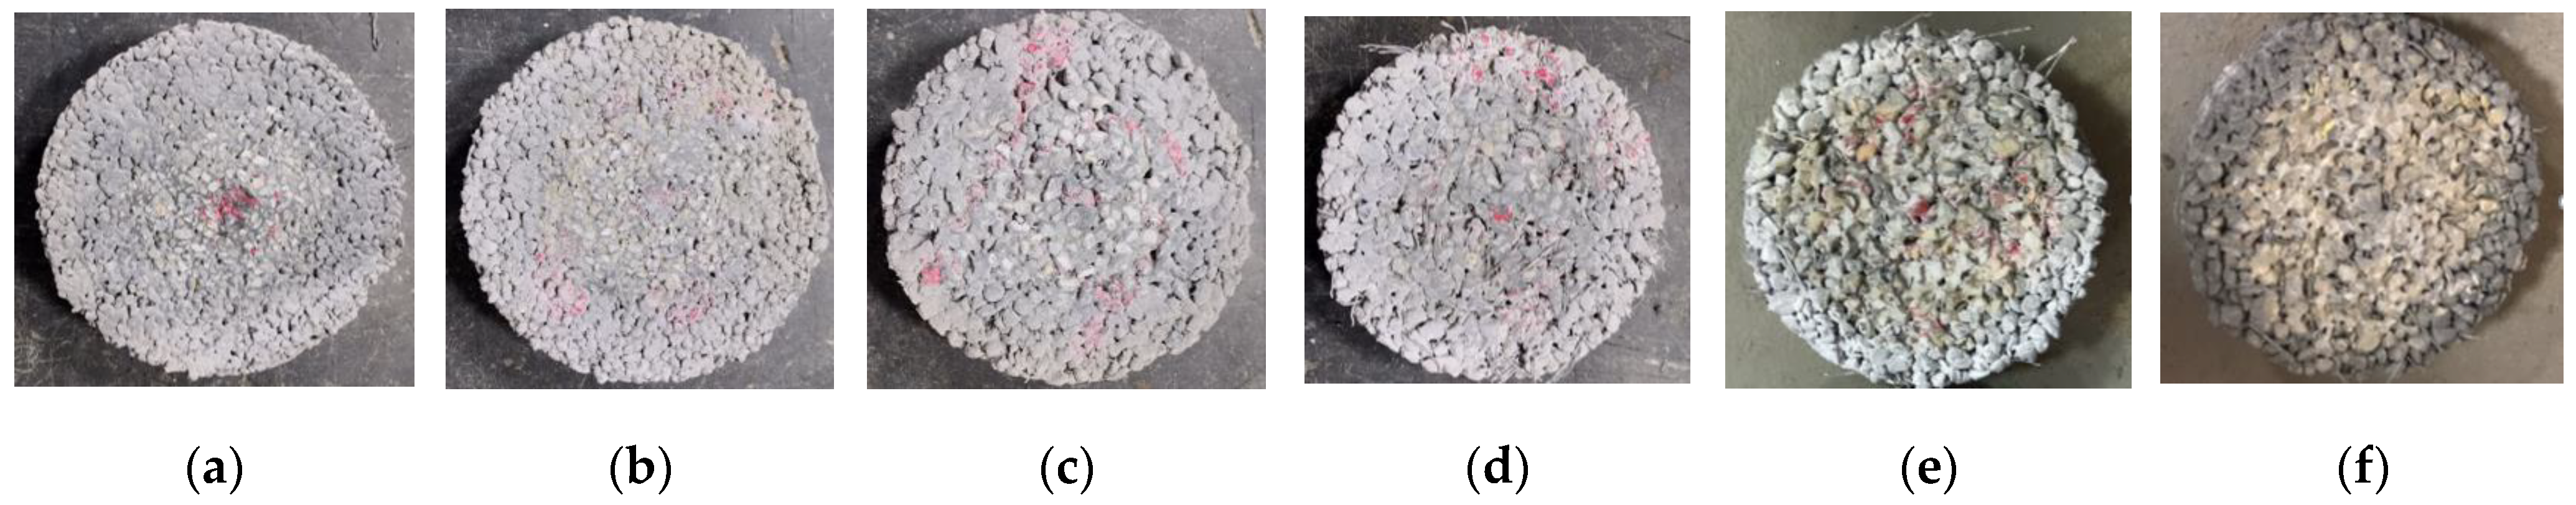
2.2.4. Clogged and Maintenance Tests

The sand and soil grading used for the clogged test was established following the methodology outlined by L. Chu and T. F. Fwa [4]. Based on the monitoring data provided by the local environmental protection unit, the annual average dust volume was approximately 65.16 tons per square kilometer. When extrapolated over a span of four years, this amounted to the basic clogging unit of approximately 260.64 tons per square kilometer. This value is equivalent to simulating the clogging of a φ9.5 cm × 15 cm cylindrical specimen with 2 g of sand over a four-year period.
However, when considering the dust clogging amount after the pavement’s service life, it is three times higher. The clogging simulation involved the use of a high-sand-containing fluid to mimic rainwater carrying a substantial amount of sand. After blocking the permeable concrete, the effects of vacuum maintenance and high-pressure water column maintenance were tested. The test sequence is outlined as follows:
(a) Utilize a PVC variable head tester to pour water into permeable concrete and inspect for any side leakage. In the event of water leakage, seal it with oily clay.
(b) Once there is no water leakage, fill the system with water, ensuring the permeable concrete being tested reaches a saturated water state. Open the valve to measure the initial permeability coefficient, as is depicted in Figure 3a.
(c) Apply sand to the surface and pour water. Upon reaching the water level h1, open the valve and wait for the water to drop to the water level h2. Measure the time, as is illustrated in Figure 3b,c.
(d) After recording the data, calculate the water permeability coefficient using the water permeability Formula (2).
(e) Commence maintenance once the service life of the permeable concrete is attained. Maintenance methods encompass high-pressure water washing and vacuum cleaner maintenance.

3. Results and Discussion

The focus of this research is on the abrasion and maintenance of high-strength fiber pervious concrete. The test results and discussions encompass material testing of fiber-reinforced pervious concrete, wear testing involving two different strengths and fibers, and clogging and maintenance assessments.

3.1. Results of the Material Testing of Fiber-Reinforced Pervious Concrete

The study conducted basic material quality tests on fiber-reinforced pervious concrete, including permeability coefficient, porosity, compressive strength, and flexural strength, with fifteen different mixes, with two and six specimens, respectively. The results of 15 fiber-reinforced pervious concrete mixes are presented in Table 5. The ACI 522R-10 [27] standard specifies a permeability coefficient of approximately 0.1 cm/s or higher and a porosity range of 18–35% for pervious concrete. The water permeability coefficients of various mix proportions and aggregates in this study meet the minimum standard. Among them, high-strength permeable concrete is denser and therefore exhibits a porosity lower than 18%. Both high-strength and ordinary-strength pervious concrete reinforced with steel fibers exhibited increased porosity and permeability coefficients compared to the control group, consistent with findings in existing literature [1,4].
In engineering applications, fibers are frequently employed to mitigate surface cracks caused by concrete shrinkage and to provide the tensile force required for cracking when the concrete is under compression. This helps in delaying cracking and damage at the bottom of the concrete [4]. Generally, permeable concrete has low compressive strength, but high-strength permeable concrete, utilizing a lower water-cement ratio and smaller aggregates, benefits from enhanced compressive strength and a higher elastic modulus. Overall, higher fiber content tends to increase the compressive or flexural strength of concrete specimens. The average flexural strength of high-strength pervious concrete specimens is approximately 7 MPa, while that of ordinary pervious concrete specimens is around 3.5 MPa. The results show the flexural strength of ordinary pervious concrete increases with the addition of fibers, but the flexural strength of high-strength pervious concrete specimens (H1S1, H1G1, H1.2S1, H1.2S2, H1.2G1) does not significantly improve. This may be due to the low slump of high-strength pervious concrete and the reduction of water-cement ratio from 0.3 to 0.14 [4]. Although high-strength fiber pervious concrete incorporates large amounts of superplasticizer, achieving a uniform mix remains challenging. When fibers are unevenly dispersed or clump together, weak joints form in hardened concrete, leading to a decrease in flexural strength.

3.2. Results of Pervious Concrete Abrasion Test

In recent years, permeable concrete has seen increased usage in pavements. Beyond strength and permeability, wear resistance stands out as a crucial factor. Two prevalent laboratory test methods are employed to assess the wear resistance and impact resistance of permeable concrete: the Los Angeles impact abrasion test and the loaded surface wheel abrasion test. These tests are conducted at curing ages of 7, 28, and 90 days. Throughout the testing process, a single specimen undergoes single (98 N) and double (197 N) load wear tests, respectively. Following the completion of the ASTM C944 [8] surface abrasion test, the same specimen is placed in the Los Angeles tester to undergo the ASTM C1747 [31] impact abrasion test.

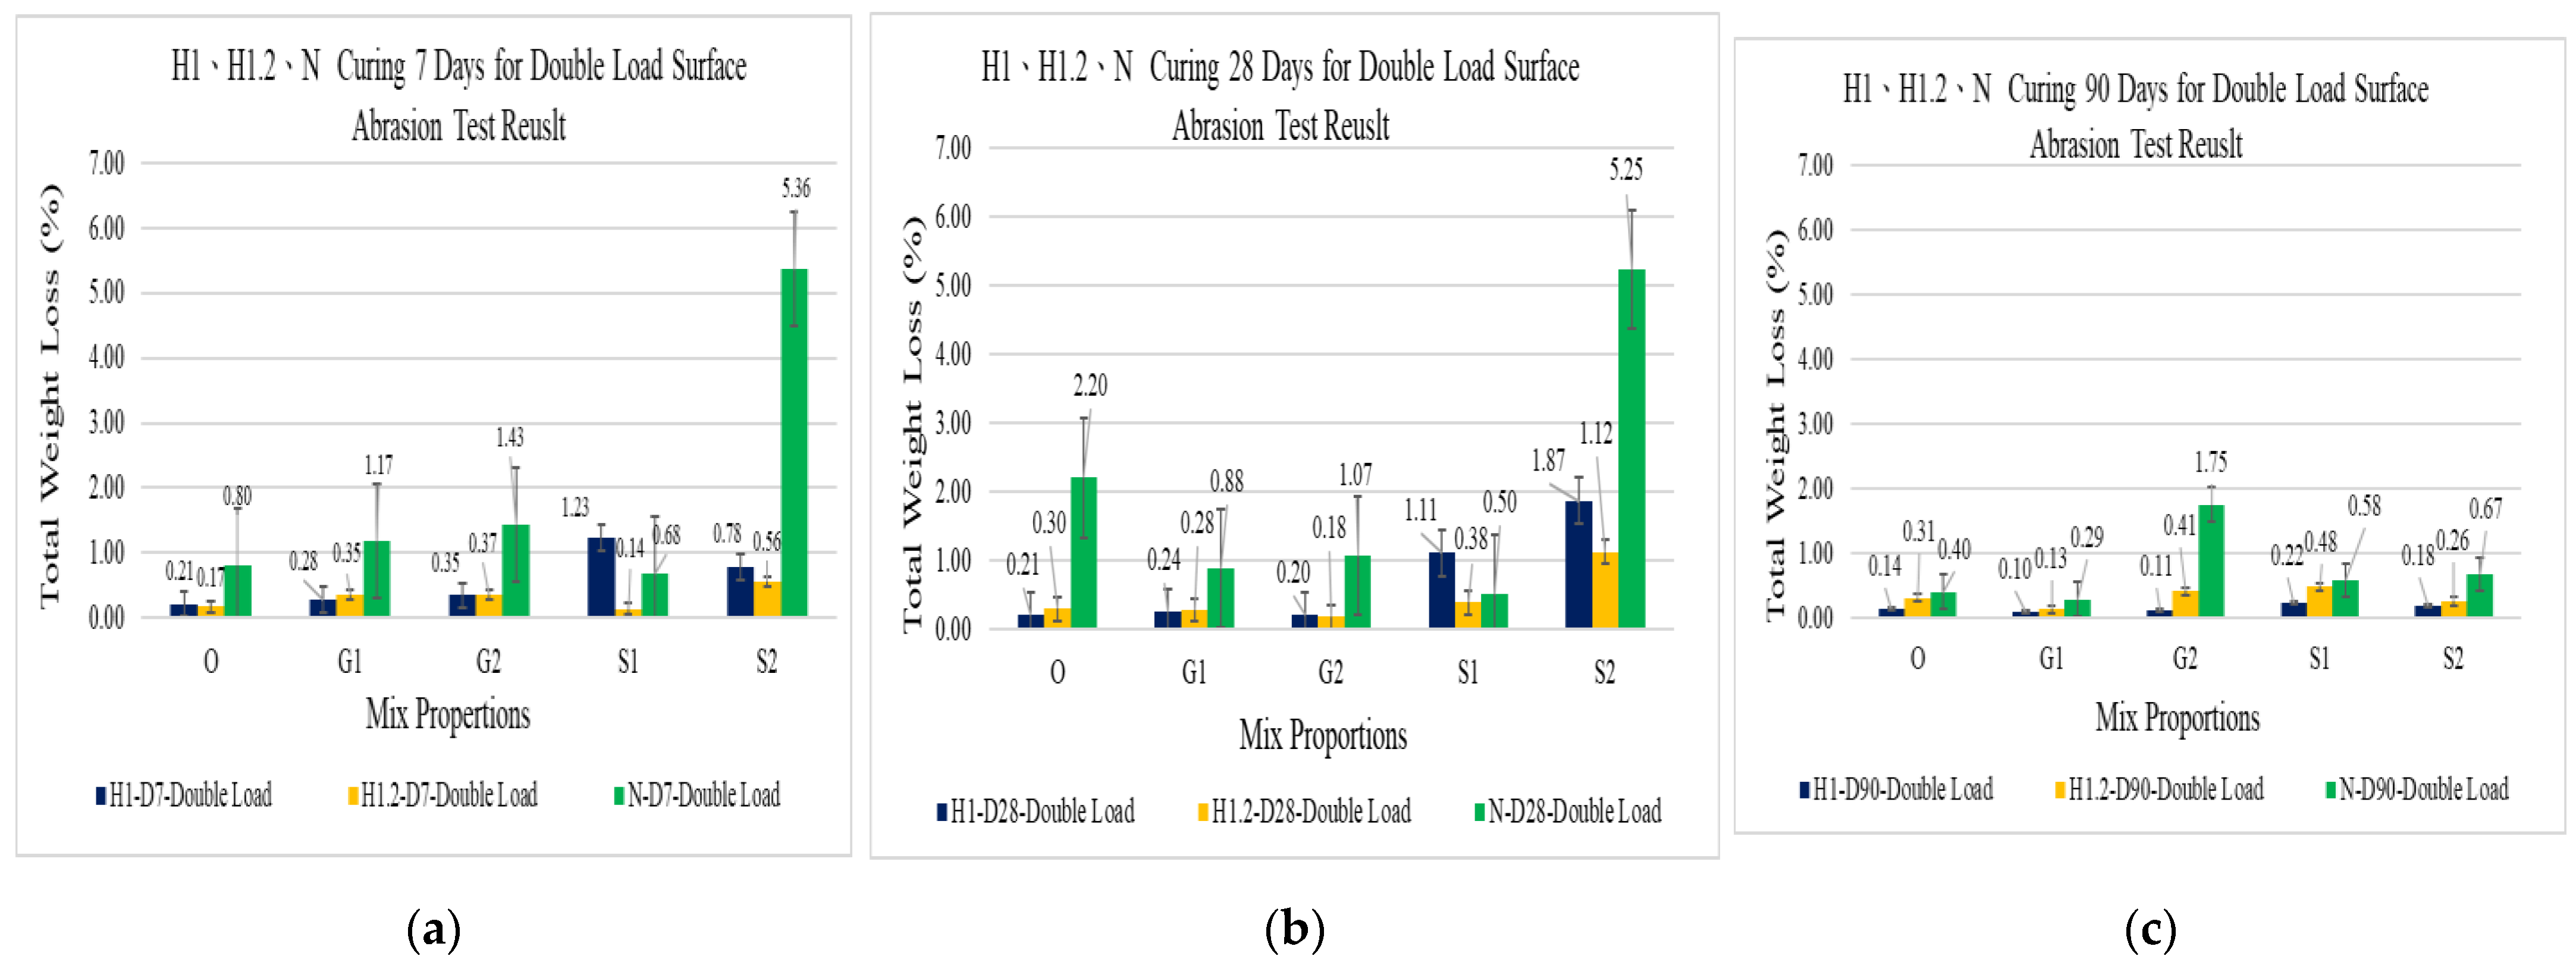
3.2.1. ASTM C944 Surface Abrasion Test

Figure 4 shows the final cumulative abrasion rate results of 28-day-old pervious concrete subjected to single and double loads. It is found the overall cumulative abrasion rate of high-strength pervious concrete is significantly lower than that of ordinary-strength pervious concrete. And the cumulative abrasion rate of double load is higher than the abrasion rate of single load. Among them, the pervious concrete NS2 specimen has the highest cumulative abrasion rate (about 5%), which should be due to the highest porosity and low strength. The cumulative abrasion rates of other test specimens are mostly less than 1%. The photos of each test specimen after the abrasion test are shown in Figure 5.
Figure 6 shows the final cumulative abrasion rate results of pervious concrete being cured under dual loads for 7 days, 28 days, and 90 days. Research [37] has found increasing the curing period improved strength and surface abrasion resistance. The final cumulative abrasion rate of pervious concrete cured under dual loads for 90 days was only about half that of early curing.

3.2.2. ASTM C1747 Impact Abrasion Test

The Los Angeles test originally focused primarily on aggregate wear but has evolved to incorporate examinations of the wear resistance index of permeable concrete. This test distinguishes itself from surface wear tests as it subjects the test body’s surface to both rolling wear and impacts from dead weight. The cumulative damage inflicted by the drum wall amounts to 500 rotations. Wu et al. [10] observed, over multiple rolling wear tests in the Los Angeles tester, the wear at each instance gradually decreased. The corners of the specimen suffered increasingly severe damage as a result of peeling caused by impacts and friction between the barrel walls. As the specimen transforms into an oval shape, the risk of breakage rises, especially if the specimen’s strength or the bond between the slurry and aggregate is insufficient [9].
As per ASTM C1747 standards, any specimen that remains on the 25 mm sieve after the test is considered the residual amount after abrasion. The remaining material is categorized as the abrasion amount.
Figure 7 illustrates the total abrasion rate results for 15 types of permeable concrete subjected to impact abrasion at 500 rpm in Los Angeles after 28 days of age. The findings indicate a significantly lower cumulative impact abrasion rate for high-strength permeable concrete compared to general-strength permeable concrete. Specifically, the cumulative impact abrasion rate for general permeable concrete N0 and NS2 specimens is alarmingly high at 60%, resulting in specimen breakage post-impact abrasion test. This outcome is attributed to their elevated porosity and diminished strength. In contrast, the cumulative impact wear rate for the remaining specimens is approximately 20%. Visual representations of each sample post-impact wear test are provided in Figure 8.
Figure 9 shows the final cumulative impact abrasion rate results of permeable concrete cured for 7 days and 90 days. It was found increasing curing time increased strength and improved impact abrasion resistance for most specimens. However, the impact abrasion rate of ordinary pervious concrete NS2 specimens after 90 days of age is higher than that of 7 days of age. This may be due to the fact that the NS2 specimen has the highest porosity and the occurrence of steel fiber knotting, resulting in serious damage to the specimen after the impact abrasion test [38].

3.2.3. Relationship between Surface Abrasion and Impact Abrasion Test

The experimental results in the above two sections indicate the abrasion resistance of permeable concrete is significantly influenced by the strength and porosity of pervious concrete. Additional factors include curing time, aggregate size, fiber reinforcement, and surface smoothness. Permeable concrete with low strength, large porosity, insufficient curing time, and large aggregate size exhibits poor abrasion resistance, aligning with findings in the literature [9,10]. Sherwani et al. [38] concluded increasing the pore content reduced the compressive strength of pervious concrete, consequently diminishing its abrasion resistance.
The relationship between surface abrasion and impact abrasion tests for pervious concrete is analyzed separately for ordinary-strength and high-strength. Figure 10 illustrates the relationship between surface abrasion and impact abrasion tests for ordinary pervious concrete at 7 days, 28 days, and 90 days. Ordinary pervious concrete at these curing stages exhibits R-squared values of 0.933 to 0.999, indicating a robust relationship between surface abrasion and the Los Angeles abrasion test. Notably, the surface abrasion rate of N0 samples of ordinary pervious concrete can be reduced from 5.4% (7 days curing) to 0.7% after 90 days of curing, with the Los Angeles abrasion rate decreasing from 54% (7 days curing) to 42%.
The relationship between surface abrasion and impact abrasion test of high-strength pervious concrete at 7 days, 28 days, and 90 days is shown in Figure 11. High-strength pervious concrete at 7 days, 28 days, and 90 days has R-squared values of 0.880 to 0.995 correspondingly showing a very strong relationship between surface abrasion and Los Angeles abrasion test. The results also showed after the high-strength pervious concrete H1S2 sample was cured for 90 days, the surface abrasion rate could be reduced from 0.8% (7 days of curing) to 0.18%, and the Los Angeles abrasion rate could be reduced from 34% (7 days of curing) to 16%.

3.2.4. Comprehensive Section

Based on the results obtained above, we attempted an appropriate discussion and analysis. A comparative evaluation of different fibers is conducted to determine the most suitable formula. However, it was observed in 15 pervious concrete mixtures, the strength factor had a greater impact. Higher strength resulted in greater density, leading to reduced porosity, permeability, surface abrasion, and impact abrasion. For example, ordinary pervious concrete specimens exhibit a permeability coefficient as high as 1.84 cm/s and an impact wear rate of 60%, whereas high-strength specimens show a permeability coefficient of approximately 0.12 cm/s and an impact wear rate of 20%. The lower permeability coefficient in high-strength concrete also makes it prone to blockage by sand dust, necessitating regular maintenance. Concerning the incorporation of glass fiber and steel fiber into pervious concrete, determining the most suitable formulation is found to be challenging due to differences in factors such as water-cement ratio, fiber mix, age, and aggregate particle size [39].
Using the flexural toughness calculation method provided by Lee et al. [4] and based on the flexural strength and displacement diagram shown in Figure 12a–c, the H1-G2 specimen (0.5% glass fiber) exhibited the maximum flexural strength, followed by H1.2-G2, H1-O, H1-S1, H1.2-G1, and H1-G1 specimens. When subjected to a flexural load, the S2 and S1 specimens with steel fibers had a larger displacement, followed by the G2 and G1 specimens with glass fibers. The minimum displacement was observed in the fiber-free specimens (denoted as O). Additionally, the area enclosed by the flexural load and displacement curve from 0 mm to 2 mm of displacement could be used to calculate the flexural toughness of permeable concrete beams, a parameter greatly increased by the addition of steel fibers.

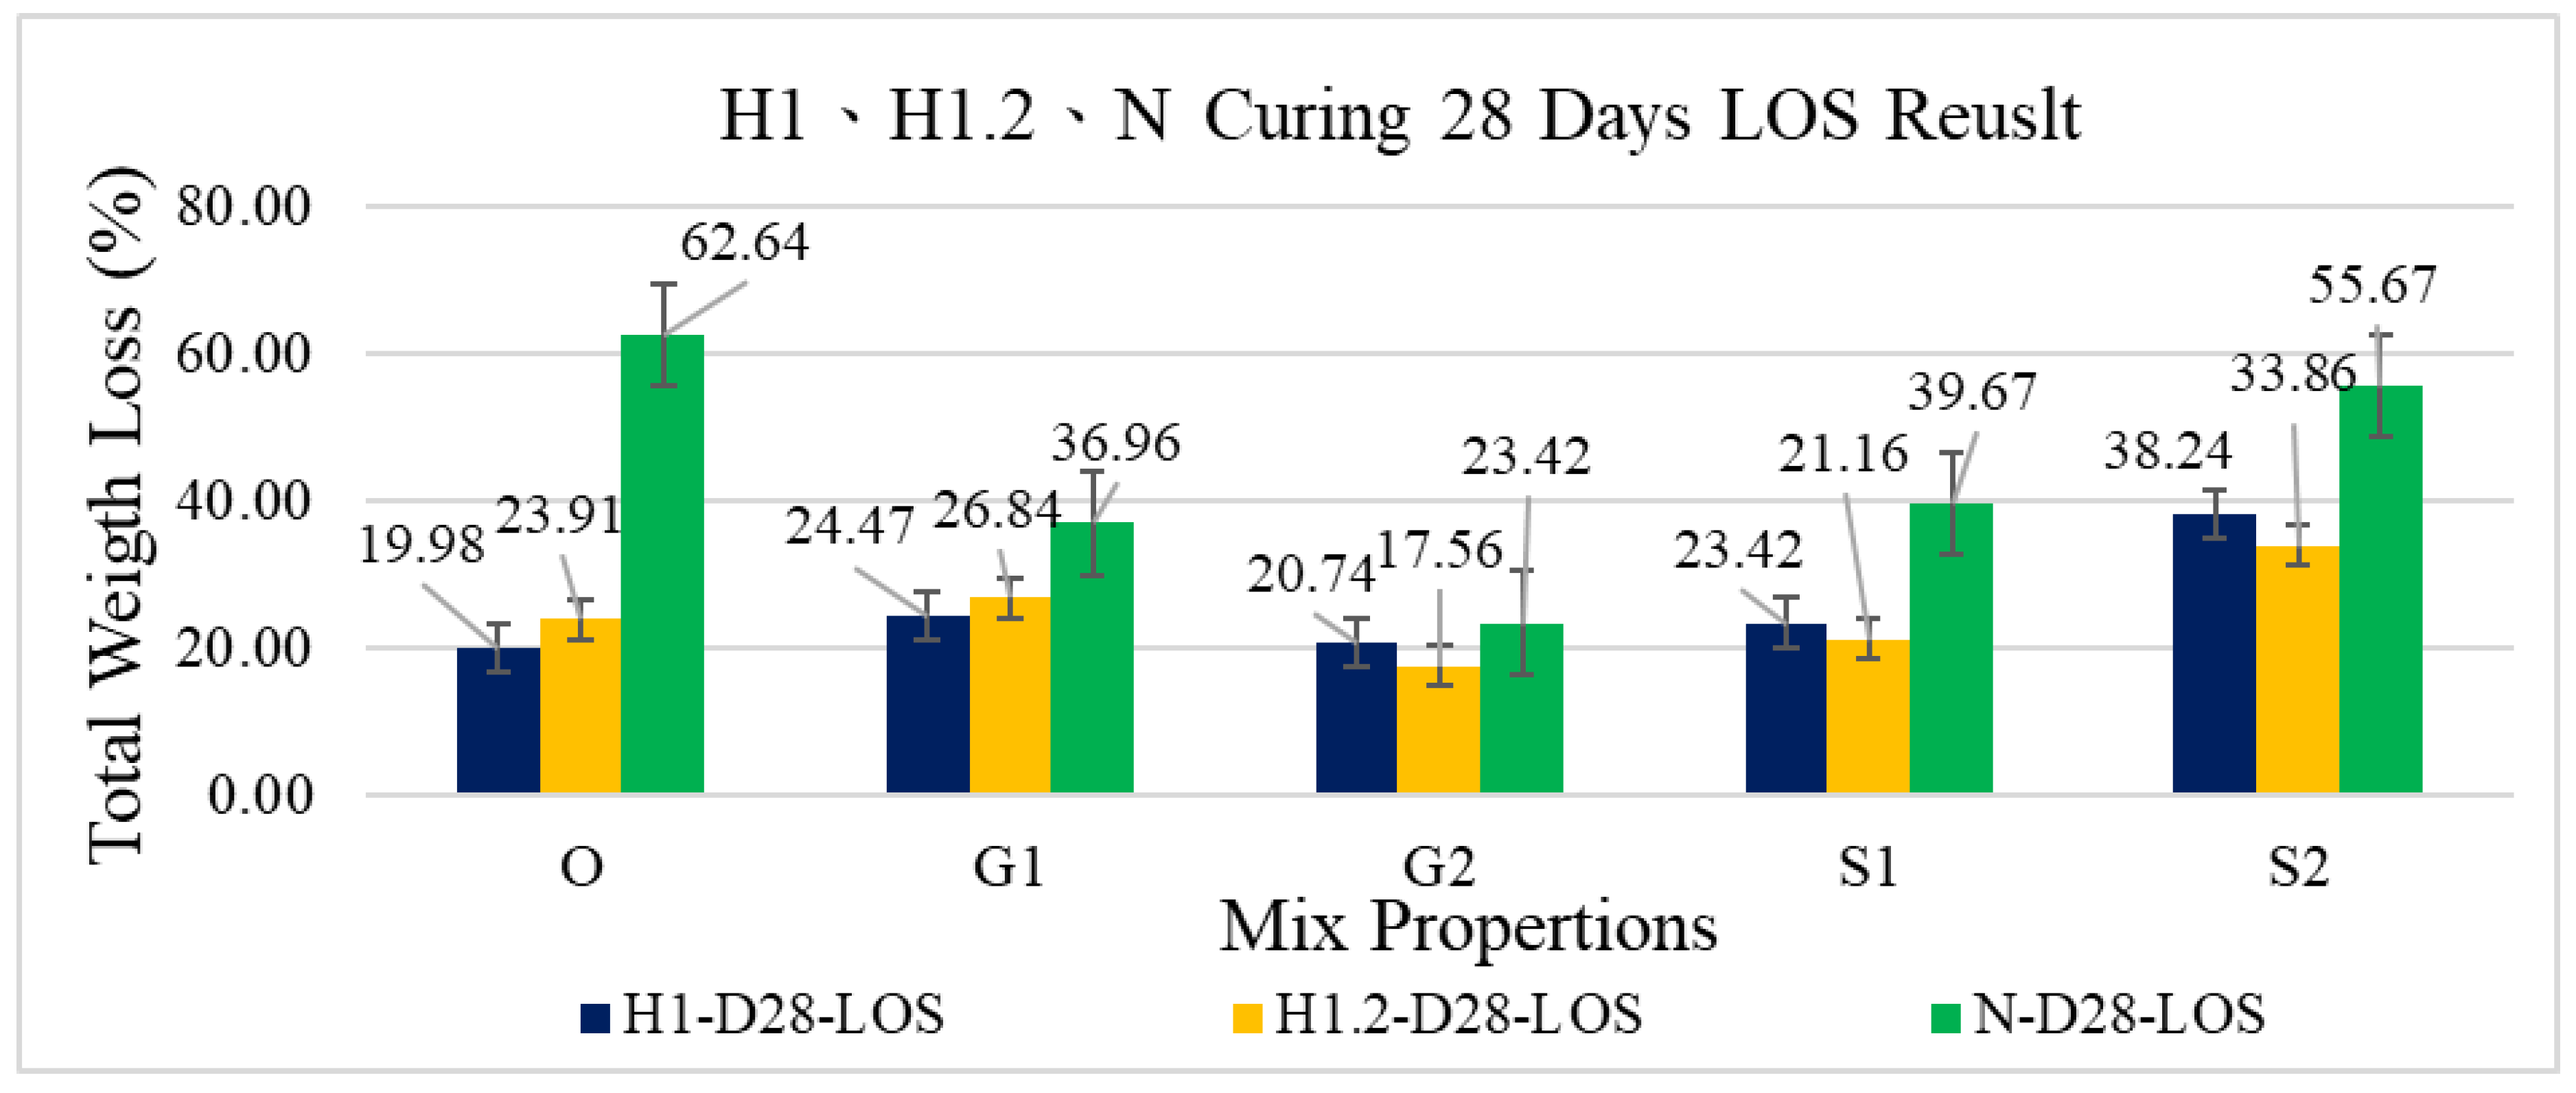
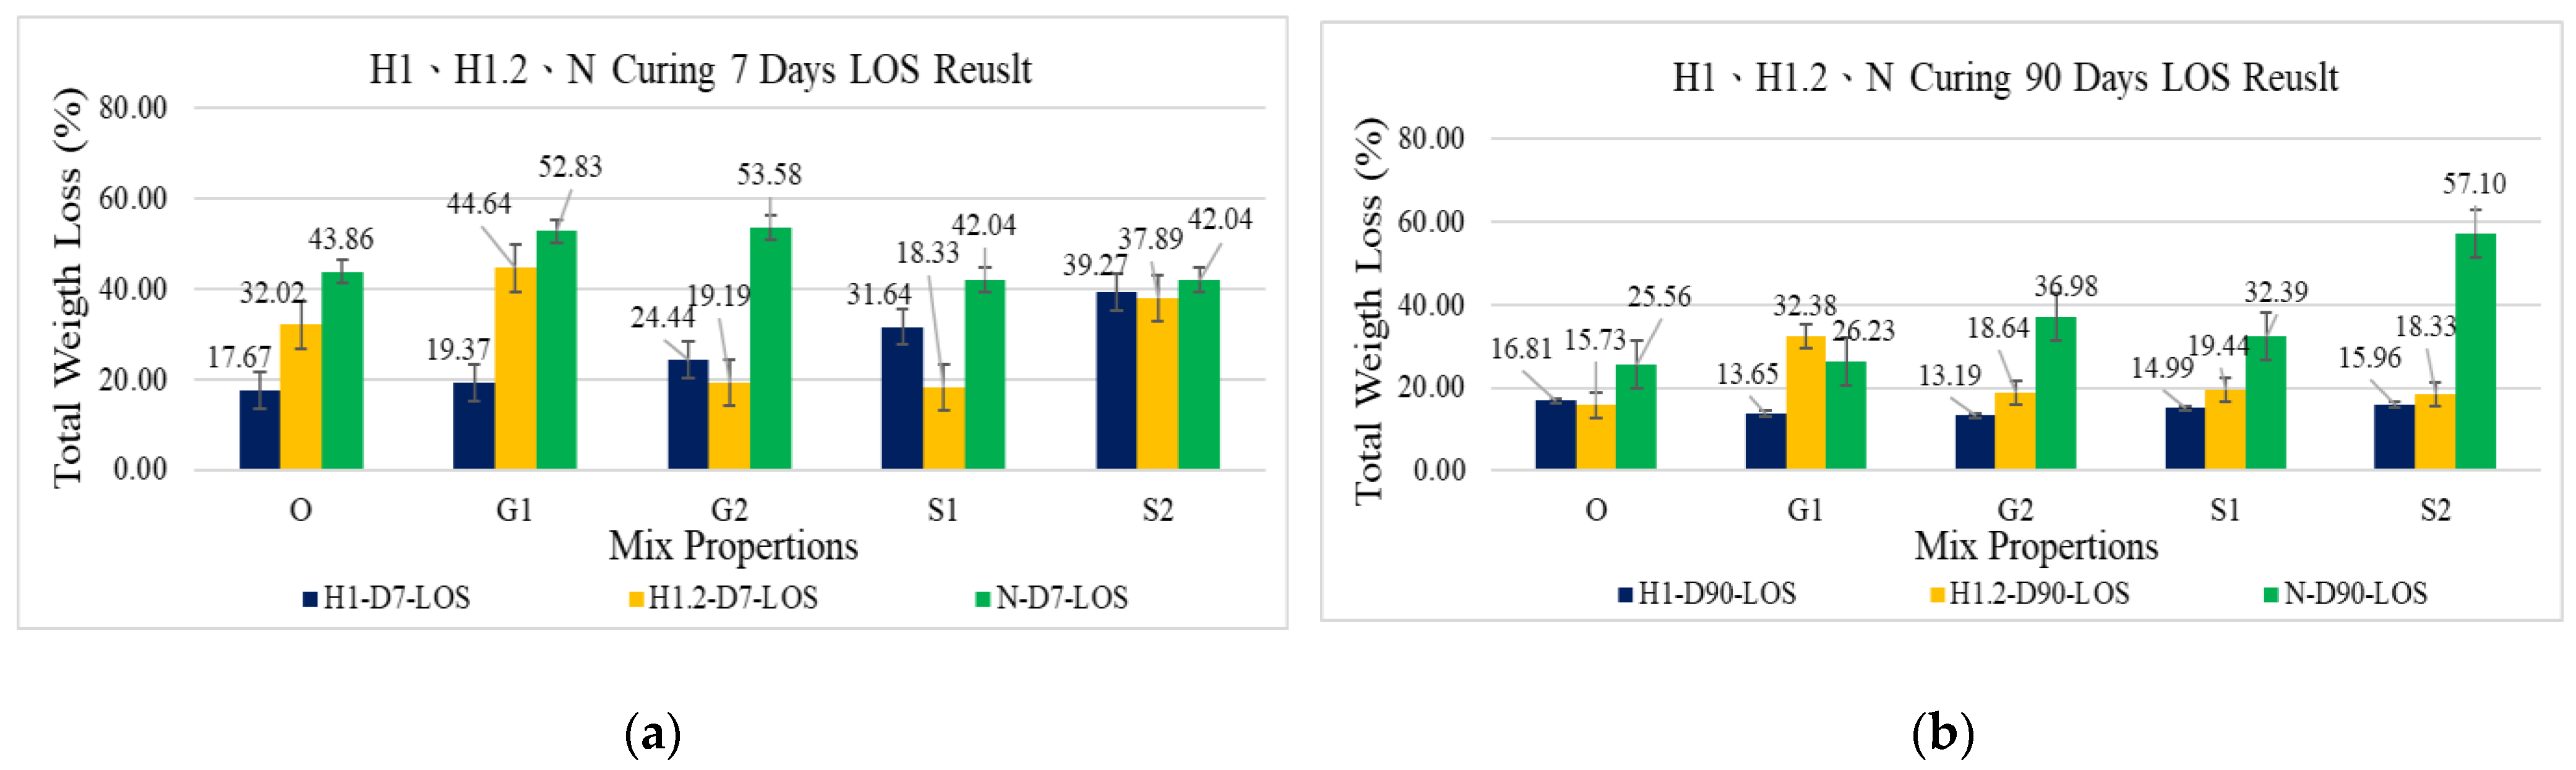
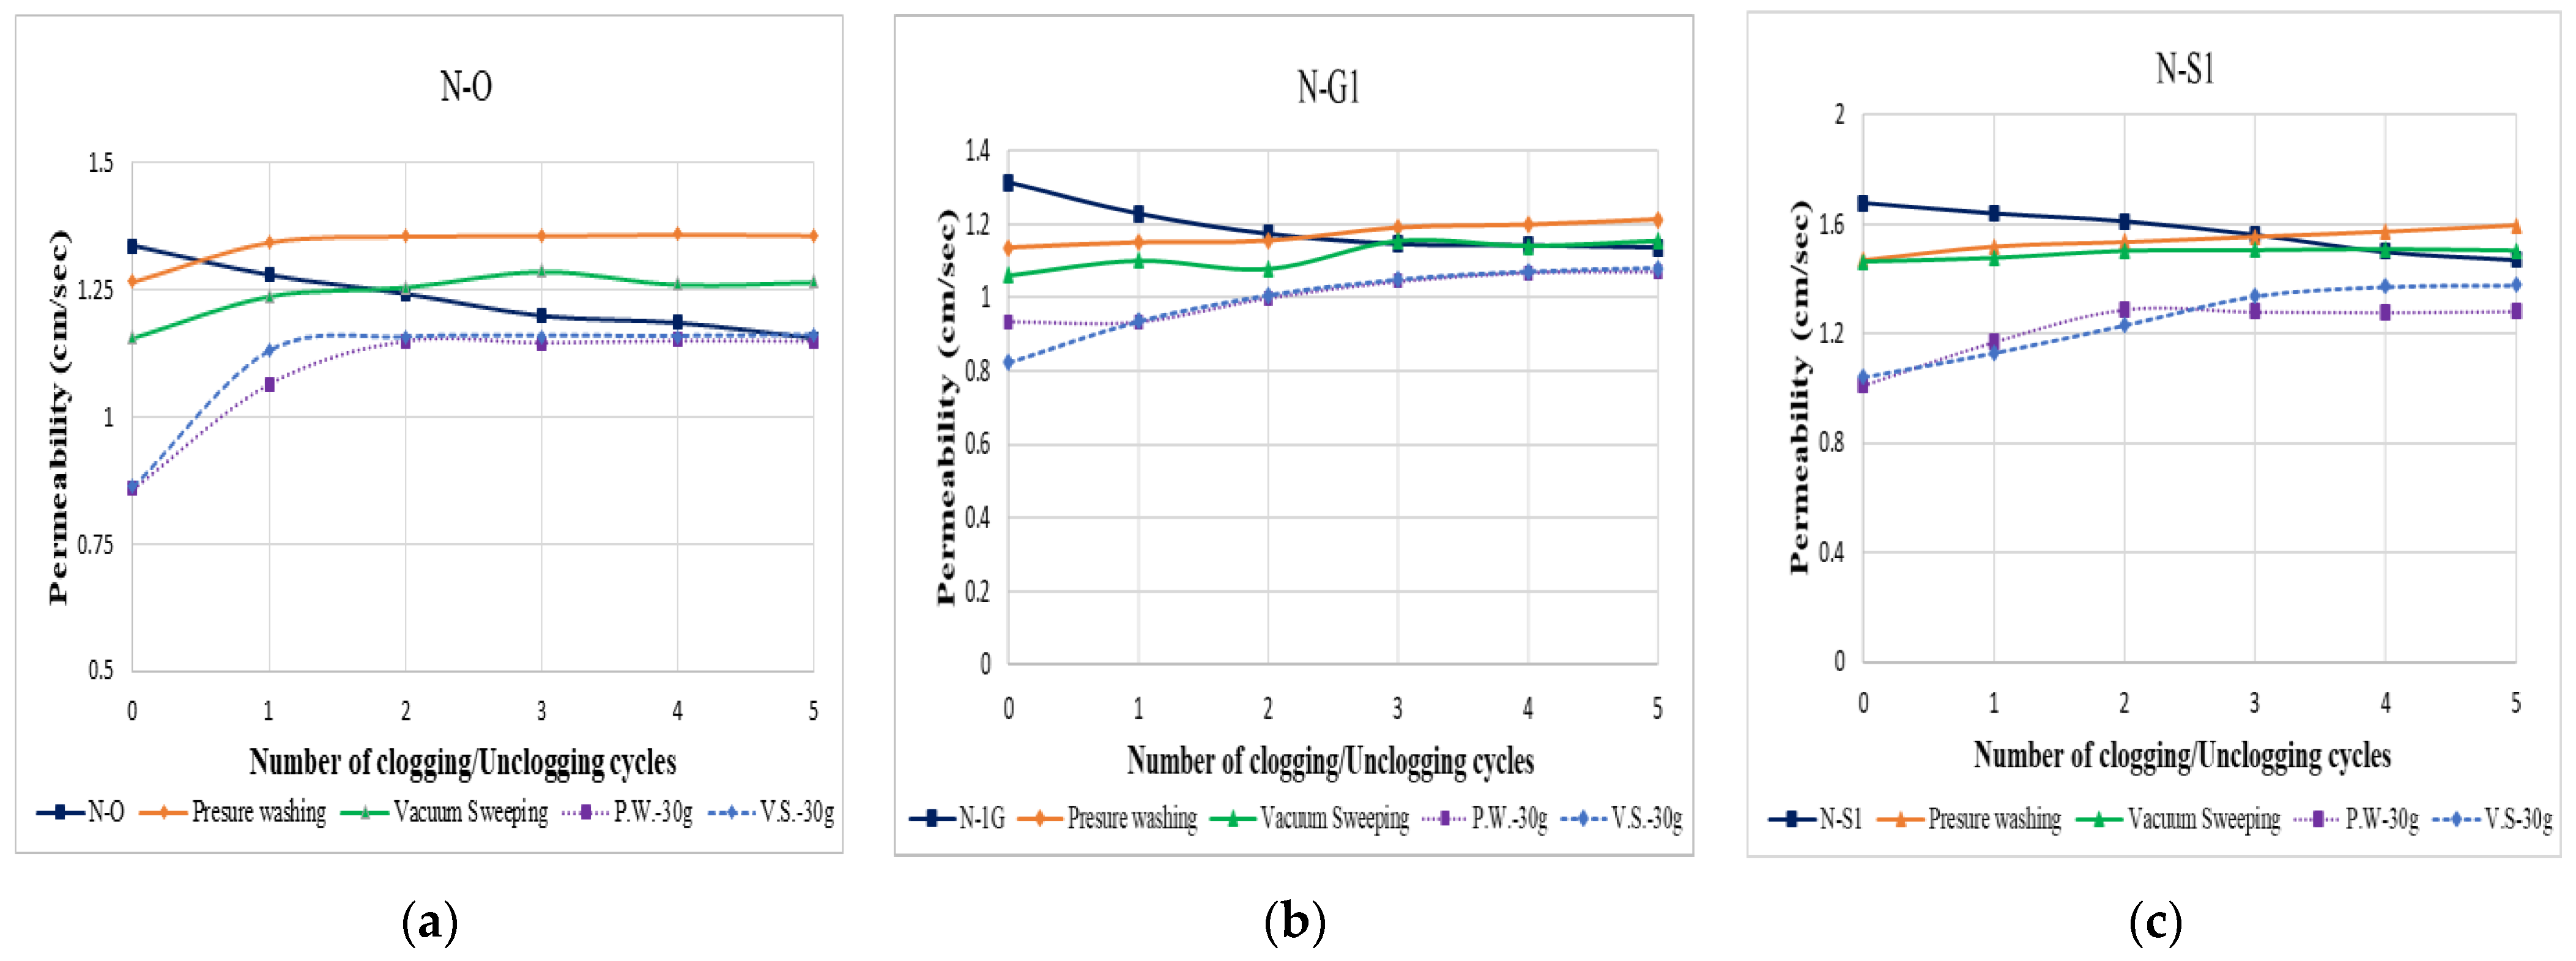
3.3. Results of Clogged and Maintenance Tests

Simulate the dust content for twenty years (four years is one cycle, five cycles in total), and perform high-pressure water column maintenance until there is no significant change in the water permeability coefficient. This is used as the initial water permeability coefficient for dust suction maintenance. Then, three times the twenty-year amount of dust was applied to the surface of the specimen to simulate the impact of high mud and sand water intruding into the permeable concrete surface on the water permeability coefficient. After high-pressure water column maintenance, the same amount of sand was applied to the specimen to protect the surface of the specimen by vacuuming, and the two types of high-pressure water column and dust suction maintenance effects were compared [39].
Figure 13 shows the dust clogging and maintenance test results of ordinary pervious concrete with or without adding glass fiber or steel fiber. It was found when the amount of dust blockage reached twenty years (five cycles) of the pavement service life, it was still not enough to block the permeable concrete and cause it to lose its water permeability. After the dust clogging test, the water permeability coefficient of ordinary pervious concrete with or without the addition of glass fiber or steel fiber can still reach more than 1 cm/sec. Comparing high-pressure water washing and vacuum maintenance, we found high-pressure water washing had better effect.
Figure 14 shows the dust clogging and maintenance test results of high-strength pervious concrete with or without adding glass fiber or steel fiber. It was found when the amount of dust blockage reached twenty years (five cycles) of the pavement’s service life, a certain high-strength pervious concrete sample (H10) was severely clogged, and their permeability coefficient dropped to less than 0.1 cm/s. Comparing high-pressure water washing and vacuum maintenance, we found the maintenance effects of the two were good and there was not much difference. The above is consistent with the poor maintenance effect of high-strength permeable concrete clogging in the literature [13]. It is speculated the strong water column drives the sand dust into deeper pores to cause clogging. The clogging simulation test results show vacuum cleaning of high-strength permeable concrete specimens has better maintenance results, restoring 60% to 75% of the overall permeability, while high-pressure washing only increases the permeability by 4% to 6%. Pressure washing of clogged pervious concrete pavement can restore 80–90% of permeability [39].
Figure 15 depicts the results of the dust clogging test for pervious concrete with or without the addition of glass fiber or steel fiber. The findings indicate when the dust clogging reaches the pavement service life of twenty years (five cycles), the permeability coefficient of ordinary pervious concrete decreases by 10–15%. High-strength pervious concrete experiences more severe clogging, with the permeability coefficient of H1 specimens dropping by 20–40% and H1.2 specimens dropping by 20–60%. This aligns with the literature [9] regarding the enhancement of porosity after adding fiber.
Upon reaching the pavement’s service life, when comparing water permeability with the control group, the fiber-containing group consistently maintains better residual water permeability despite sand dust blockage.

4. Conclusions

This study centers on the abrasion and maintenance aspects of fiber-reinforced pervious concrete, encompassing basic material testing, abrasion testing, and evaluations of clogging and maintenance. The key findings are as follows:
  • It reveals specific mix ratio designs contribute to high-strength pervious concrete with impressive 28-day compressive strength (40–52 MPa) and corresponding porosity (7–16%). Surface abrasion tests indicate high-strength specimens exhibit significantly lower cumulative wear rates (less than 1%) compared to ordinary pervious concrete (approximately 5%). The ASTM C1747 impact abrasion test also supports this trend, with high-strength samples displaying a cumulative impact wear rate of about 20% versus 60% for ordinary pervious concrete.
  • The study establishes a robust correlation between surface abrasion and impact abrasion tests for both ordinary and high-strength pervious concrete. In a simulated dust clogging test, ordinary pervious concrete remained largely unblocked after twenty years, while high-strength pervious concrete, despite having a lower permeability coefficient, could recover over 60% water permeability after maintenance.
  • The comparison of high-pressure water washing and vacuum blockage maintenance indicates high-pressure water washing is more effective for ordinary pervious concrete, while there is little difference between the two methods for high-strength pervious concrete.
  • This study highlights the significance of abrasion resistance and maintenance in pervious concrete, the challenges in formulating optimal fiber-based mixtures, and the positive influence of steel fibers on flexural toughness in pervious concrete beams. Additionally, the research unveils the environmental impact of fiber-reinforced permeable concrete, showcasing benefits such as controlling rainwater runoff, reducing road puddles, replenishing groundwater levels, and enhancing sound and heat absorption capabilities. Pervious concrete, with its reduced need for cement mortar and support for vegetation growth, emerges as an eco-friendly alternative. This not only addresses environmental concerns but also contributes to urban resilience by improving groundwater recharge and alleviating the heat island effect in urban areas.

Author Contributions

Conceptualization, M.-G.L. and Y.-C.W.; Methodology, W.-C.W.; Investigation, M.-G.L. and Y.-C.H.; Writing—original draft, Y.-C.H.; Writing—review & editing, M.-G.L.; Visualization, W.-C.W. All authors have read and agreed to the published version of the manuscript.

Funding

The authors acknowledge the financial support provided by the Ministry of Science and Technology of Taiwan, grant number [111-2121-M-324-003].

Data Availability Statement

Data are contained within the article.

Conflicts of Interest

The authors declare no conflict of interest.

References

  1. Zhong, R.; Wille, K. Compression Response of Normal and High Strength Pervious Concrete. Constr. Build. Mater. 2016, 109, 177–187. [Google Scholar] [CrossRef]
  2. Aamer Rafique Bhutta, M.; Tsuruta, K.; Mirza, J. Evaluation of High-Performance Porous Concrete Properties. Constr. Build. Mater. 2012, 31, 67–73. [Google Scholar] [CrossRef]
  3. Meng, X.; Chi, Y.; Jiang, Q.; Liu, R.; Wu, K.; Li, S. Experimental Investigation on the Flexural Behavior of Pervious Concrete Beams Reinforced with Geogrids. Constr. Build. Mater. 2019, 215, 275–284. [Google Scholar] [CrossRef]
  4. Lee, M.-G.; Wang, W.-C.; Wang, Y.-C.; Lin, Y.-C.; Hsieh, Y.-C. Mechanical Properties of High Strength Pervious Concrete with Steel Fiber or Glass Fiber. Buildings 2022, 12, 620. [Google Scholar] [CrossRef]
  5. Kevern, J.T. Operation and Maintenance of Pervious Concrete Pavements. In Proceedings of the 90th Annual Meeting of the Transportation Research Board, Washington, DC, USA, 23–27 January 2011. [Google Scholar]
  6. Tang, C.-W.; Cheng, C.-K.; Ean, L.-W. Mix design and engineering properties of fiber-reinforced pervious concrete using lightweight aggregates. Appl. Sci. 2022, 12, 524. [Google Scholar] [CrossRef]
  7. Tang, B.; Fan, M.; Yang, Z.; Sun, Y.; Yuan, L. A comparison study of aggregate carbonation and concrete carbonation for the enhancement of recycled aggregate pervious concrete. Constr. Build. Mater. 2023, 371, 130797. [Google Scholar] [CrossRef]
  8. ASTM C944/C944M-19; Standard Test Method for Abrasion Resistance of Concrete or Mortar Surfaces by the Rotating-Cutter Method. ASTM International: West Conshohocken, PA, USA, 2019; pp. 1–5.
  9. Dong, Q.; Wu, H.; Huang, B.; Shu, X.; Wang, K. Development of a Simple and Fast Test Method for Measuring the Durability of Portland Cement Pervious Concrete; PCA R&D 2010, Serial No. SN3149; Portland Cement Association: Washington, DC, USA, 2010. [Google Scholar]
  10. Wu, H.; Huang, B.; Shu, X.; Dong, Q. Laboratory Evaluation of Abrasion Resistance of Portland Cement Pervious Concrete. J. Mater. Civ. Eng. 2011, 23, 5. [Google Scholar] [CrossRef]
  11. Sangthongtong, A.; Semvimol, N.; Rungratanaubon, T.; Duangmal, K.; Joyklad, P. Mechanical Properties of Pervious Recycled Aggregate Concrete Reinforced with Sackcloth Fibers (SF). Infrastructures 2023, 8, 38. [Google Scholar] [CrossRef]
  12. Kia, A.; Wong, H.S.; Cheeseman, C.R. High-strength clogging resistant permeable pavement. Int. J. Pavement Eng. 2021, 22, 271–282. [Google Scholar] [CrossRef]
  13. Lee, J.-W.; Yang, E.; Jang, J. Effect of clogging and cleaning on the permeability of pervious block pavements. Int. J. Pavement Eng. 2022, 23, 3147–3156. [Google Scholar] [CrossRef]
  14. Chu, L.; Fwa, T.F. Laboratory Characterization of Clogging Potential of Porous Asphalt Mixtures. TRR J. Transp. Res. Board 2018, 2672, 12–22. [Google Scholar] [CrossRef]
  15. Rahman, S. Development of Durability Performance Related Test Methods for Pervious Concrete Pavement. Master’s Thesis, University of Waterloo, Waterloo, ON, Canada, 2015. [Google Scholar]
  16. Adresi, M.; Yamani, A.; Tabarestani, M.K.; Rooholamini, H. A comprehensive review on pervious concrete. Constr. Build. Mater. 2023, 407, 133308. [Google Scholar] [CrossRef]
  17. Merten, F.R.M.; Dutra, V.F.P.; Strieder, H.L.; Graeff, Â.G. Clogging and maintenance evaluation of pervious concrete pavements with recycled concrete aggregate. Constr. Build. Mater. 2022, 342, 127939. [Google Scholar] [CrossRef]
  18. Sandoval, G.F.; Pieralisi, R.; de Souza Risson, K.D.; de Moura, A.C.; Toralles, B.M. Clogging phenomenon in Pervious Concrete (PC): A systematic literature review. J. Clean. Prod. 2022, 36510, 132579. [Google Scholar] [CrossRef]
  19. Kia, A.; Wong, H.S.; Cheeseman, C.R. Clogging in permeable concrete: A review. J. Environ. Manag. 2017, 193, 221–233. [Google Scholar] [CrossRef] [PubMed]
  20. Ab Latif, A.; Putrajaya, R.; Ing, D.S. A Review of Porous Concrete Pavement: Compressive Strength and Clogging Investigation. J. Adv. Res. Appl. Sci. Eng. Technol. 2023, 29, 128–138. [Google Scholar]
  21. Drake, J.; Bradford, A. Assessing the potential for restoration of surface permeability for permeable pavements through maintenance. Water Sci. Technol. 2013, 68, 1950–1958. [Google Scholar] [CrossRef]
  22. Chopra, M.; Kakuturu, S.; Ballock, C.; Spence, J.; Wanielista, M. Effect of Rejuvenation Methods on the Infiltration Rates of Pervious Concrete Pavements. J. Hydrol. Eng. 2010, 15, 426–433. [Google Scholar] [CrossRef]
  23. Sandoval, G.F.B.; de Moura, A.C.; Jussiani, E.I.; Andrello, A.C.; Toralles, B.M. Proposal of maintenance methodology for pervious concrete (PC) after the phenomenon of clogging. Constr. Build. Mater. 2020, 248, 118672. [Google Scholar] [CrossRef]
  24. Mata, L.A.; Leming, M.L. Vertical distribution of sediments in pervious concrete pavement systems. ACI Mater. J. 2012, 109, 149–155. [Google Scholar]
  25. Vancura, M.E.; MacDonald, K.; Khazanovich, L. Location and depth of pervious concrete clogging material before and after void maintenance with common municipal utility vehicles. J. Transp. Eng. 2012, 138, 332–338. [Google Scholar] [CrossRef]
  26. Haselbach, L.M. Potential for Clay Clogging of Pervious Concrete under Extreme Conditions. J. Hydrol. Eng. 2010, 15, 67–69. [Google Scholar] [CrossRef]
  27. ACI 522R-10; Pervious Concrete. American Concrete Institute: Farmington Hills, MI, USA, 2010; pp. 1–25.
  28. Rama, M.; Shanthi, M. Experimental Study on Sedimentation Removal of Pervious Concrete. Arch. Civ. Eng. 2018, 64, 181–195. [Google Scholar] [CrossRef]
  29. Haselbach, L.M.; Freeman, R.M. Vertical porosity distributions in pervious concrete pavement. ACI Mater. J. 2006, 103, 452–458. [Google Scholar]
  30. Sandoval, G.F.B.; Galobardes, I.; De Moura, A.C.; Toralles, B.M. Hydraulic behavior variation of pervious concrete due to clogging. Case Stud. Constr. Mater. 2020, 13, e00354. [Google Scholar] [CrossRef]
  31. ASTM C1747/C1747M−13; Standard Test Method for Determining Potential Resistance to Degradation of Pervious Concrete by Impact and Abrasion. ASTM International: West Conshohocken, PA, USA, 2013; pp. 1–4.
  32. Deo, O.; Sumanasooriya, M.; Neithalath, N. Permeability Reduction in Pervious Concretes due to Clogging: Experiments and Modeling. J. Mater. Civ. Eng. 2010, 22, 741–751. [Google Scholar] [CrossRef]
  33. Huang, H.; Yuan, Y.; Zhang, W.; Zhu, L. Property Assessment of High-Performance Concrete Containing Three Types of Fibers. Int. J. Concr. Struct. Mater. 2021, 15, 39. [Google Scholar] [CrossRef]
  34. Chen, L.; Chen, Z.; Xie, Z.; Wei, L.; Hua, J.; Huang, L.; Yap, P.S. Recent developments on natural fiber concrete: A review of properties, sustainability, applications, barriers, and opportunities. Dev. Built Environ. 2023, 16, 100255. [Google Scholar] [CrossRef]
  35. ASTM C78/C78M-18; Standard Test Method for Flexural Strength of Concrete (Using Simple Beam with Third-Point Loading). ASTM International: West Conshohocken, PA, USA, 2018; pp. 1–5.
  36. ASTM C131/C131M-14; Standard Test Method for Resistance to Degradation of Small-Size Coarse Aggregate by Abrasion and Impact in the Los Angeles Machine. ASTM International: West Conshohocken, PA, USA, 2020; pp. 1–5.
  37. Sandoval, G.F.B.; Galobardes, I.; Campos, A.; Toralles, B. Assessing the phenomenon of clogging of pervious concrete (Pc): Experimental test and model proposition. J. Build. Eng. 2020, 29, 101203. [Google Scholar] [CrossRef]
  38. Sherwani, A.F.; Faraj, R.; Younis, K.H.; Daraei, A. Strength, abrasion resistance and permeability of artificial fly-ash aggregate pervious concrete. Case Stud. Constr. Mater. 2021, 14, e00502. [Google Scholar] [CrossRef]
  39. Lee, M.G.; Wang, Y.C.; Wang, W.C.; Yatsenko, E.A.; Wu, S.Z. Clogging Resistance of High Strength Pervious Concrete. In Lecture Notes in Civil Engineering; Springer International Publishing: Cham, Switzerland, 2022; Volume 193, pp. 347–357. [Google Scholar]
Figure 1. Three types of coarse aggregate (a) H1, (b) H1.2, and (c) N.
Buildings 14 00127 g001
Figure 2. Concrete surface abrasion test (a) test instrument and (b) rotating blade.
Buildings 14 00127 g002
Figure 3. Clogging simulation test (a) close valve, (b) dust clogging, and (c) open valve.
Buildings 14 00127 g003
Figure 4. Surface abrasion test after curing for 28 days: (a) single load and (b) double load.
Buildings 14 00127 g004
Figure 5. Surface abrasion photos (a) H1O, (b) H1G1, (c) H1.2G1, (d) H1.2S2, (e) NS2, and (f) NS1.
Buildings 14 00127 g005
Figure 6. Surface abrasion test at double load and curing for (a) 7 days, (b) 28 days, and (c) 90 days.
Buildings 14 00127 g006
Figure 7. Impact abrasion test after curing for 28 days.
Buildings 14 00127 g007
Figure 8. Impact abrasion photos (a) H1 specimen before test, (b) H1 specimen after test, (c) H1G1 specimen after test, (d) H1S1 specimen after test, and (e) N0 specimen after test.
Buildings 14 00127 g008
Figure 9. Impact abrasion test after curing for (a) 7 days and (b) 90 days.
Buildings 14 00127 g009
Figure 10. Relationship between surface abrasion and impact abrasion test of ordinary pervious concrete after curing for (a) 7 days, (b) 28 days, and (c) 90 days.
Buildings 14 00127 g010
Figure 11. Relationship between surface abrasion and impact abrasion test of high-strength pervious concrete after curing for (a) 7 days, (b) 28 days, and (c) 90 days.
Buildings 14 00127 g011
Figure 12. Flexural strength and displacement diagram for fiber pervious concrete (a) H1 high-strength, (b) H1.2 high-strength, and (c) ordinary-strength.
Buildings 14 00127 g012
Figure 13. Permeability coefficient of ordinary pervious concrete after clogged and maintenance tests (a) N0, (b) NG1, (c) NS1.
Buildings 14 00127 g013
Figure 14. Permeability coefficient of high-strength pervious concrete after clogged and maintenance tests (a) H10, (b) H1G1, (c) H1S1.
Buildings 14 00127 g014
Figure 15. Permeability coefficient of pervious concrete after the clogged tests (a) N, (b) H1, (c) H1.2.
Buildings 14 00127 g015
Table 1. Identifying raveling distress in pervious concrete pavement [5].
Pavement ConditionDescriptionRemediation Strategies
1—NewA smooth uniform surfaceNone required
2—Light ravelingPresence of a few loose particles on the surfaceVacuuming or sweeping to remove loose particles
3—Moderate raveling25% loss of surface particles with no ruttingVacuuming and continuous monitoring, targeted milling, localized removal and replacement
4—Severe raveling50% or greater loss of surface particles with localized ruttingMilling, overlay application, localized removal and replacement
5—Total failure100% loss of surface particles with significant ruttingFull removal and replacement, application of structural overlay
Table 2. Three coarse aggregate gradation and sieve analysis.
Aggregate Sieve SizeIndividual FractionPassing by Mass (%)Cumulative Retained by Mass (%)
NH1H1.2NH1H1.2NH1H1.2
9.5 mm000100100100000
#4 (4.75 mm)72.305.027.710095.072.305.0
#8 (2.36 mm)22.592.593.55.27.51.594.892.598.5
#162.07.01.53.20.5096.899.5100
#301.20.502.00098.0100100
#502.000000100100100
#100000000100100100
Pan000000100100100
Fineness modulus5.624.925.14
Table 3. Glass fiber and steel fiber specification [4].
SpecificationGlass FiberSteel Fiber
Length (mm)3630
Diameter (mm)1.90.75
Aspect ratio6740
Specific gravity2.687.8
Melting point (°C)8601500
Tensile strength (MPa)17001225
Elastic modulus (GPa)72200
Table 4. Fifteen mix designs for normal and high-strength pervious concretes (kg/m3) [4].
MixCementAggregateWaterSFSteel FiberGlass FiberHRWR
N0340153010000 (0)02.0
NS1145278 (S1)
NS21374156 (S2)
NG13401523100006.8 (G1)2.0
NG2151613.6 (G2)
H104751484681190 (0)013.7
H1S1140678 (S1)
H1S21328156 (S2)
H1G147514776811906.8 (G1)13.7
H1G2147013.6 (G2)
H1.24751484681190 (0)012.5
H1.2S1140678 (S1)
H1.2S21328156 (S2)
H1.2G147514776811906.8 (G1)12.5
H1.2G2147013.6 (G2)
Table 5. Pervious concrete of permeability coefficient, porosity, and strength.
MixPermeability Coefficient (cm/s)Porosity (%)Compressive Strength (MPa)Flexural Strength (MPa)
N01.4118.5814.883.02
NS11.5618.9313.144.06
NS21.8421.7817.604.11
NG11.1918.9115.493.44
NG21.4919.8512.603.22
H100.149.2335.077.13
H1S10.3612.0333.096.57
H1S20.527.3352.767.26
H1G10.1813.9642.746.16
H1G20.148.5041.517.63
H1.20.1211.0433.936.68
H1.2S10.4211.9326.826.12
H1.2S20.6516.6545.875.95
H1.2G10.239.2336.085.59
H1.2G20.298.1344.718.48
Disclaimer/Publisher’s Note: The statements, opinions and data contained in all publications are solely those of the individual author(s) and contributor(s) and not of MDPI and/or the editor(s). MDPI and/or the editor(s) disclaim responsibility for any injury to people or property resulting from any ideas, methods, instructions or products referred to in the content.

