Article

Moment Redistribution in UHPC Continuous Beams Reinforced with High-Strength Steel Bars: Numerical Investigation and Prediction Model

1
School of Civil Engineering and Transportation, Northeast Forestry University, No. 26 Hexing Road, Harbin 150040, China
2
School of Civil Engineering, Harbin Institute of Technology, Harbin 150090, China
3
Key Lab of Structures Dynamic Behavior and Control of the Ministry of Education, Harbin Institute of Technology, Harbin 150090, China
*
Author to whom correspondence should be addressed.
Buildings 2024, 14(1), 149; https://doi.org/10.3390/buildings14010149
Submission received: 24 November 2023 / Revised: 24 December 2023 / Accepted: 30 December 2023 / Published: 7 January 2024
(This article belongs to the Section Building Materials, and Repair & Renovation)

Abstract

:
Considering moment redistribution in the design of ultra-high-performance concrete (UHPC) statically indeterminate structures can fully exploit the load-bearing potential of members, simplify reinforcement details, and save construction costs. Due to the excellent properties of ultra-high-performance concrete (UHPC) that distinguish it from conventional concrete, new characteristics of the moment redistribution manifest in UHPC structures. In this study, a finite element (FE) analytical model was developed to simulate and analyze the bending behavior and moment redistribution of UHPC continuous beams reinforced with high-strength steel bars. The simulation and test results exhibited excellent agreement with the experimental research. Based on the FE model, a fine analysis for nine simulated two-span UHPC continuous beams was conducted with a detailed discussion of the failure modes, load-displacement curves, variations of support reaction forces, tensile strains of steel bars, and the whole process of moment redistribution. Subsequently, the variation rules of moment redistribution in UHPC continuous beams were explored by an extensive parametric study of 108 simulated beams. The studied parameters included a neutral axis depth factor, concrete strength, yielding strength of reinforcement, beam depth, span–depth ratio, reinforcement ratio between the mid-span and intermediate support section, as well as load forms. According to the numerical results, new formulas for estimating the two-stage moment redistribution in UHPC continuous beams with high-strength reinforcement were established. Finally, a comparison of moment redistribution between normal concrete continuous beams and UHPC continuous beams was performed. It can be observed that the elastic moment distribution in UHPC continuous beams was comparatively smaller, while the plastic moment distribution was relatively larger than those of normal concrete continuous beams. Overall, the degree of the total moment distribution in UHPC structures was greater than that of normal concrete structures due to the high ductility of UHPC. The research in this study may provide a technical reference for the practical engineering of UHPC.

1. Introduction

Ultra-high-performance concrete (UHPC) is a unique cementitious-based material that is fabricated based on a densified system with ultra-fine particles (DSP) [1,2] and has excellent mechanical properties, ductility, and durability [3]. Numerous studies have been conducted on the characteristics of UHPC at the material property level, and the results have shown the superior performance of UHPC over conventional concrete, such as higher strength in both compression and tension, a more sustained post-cracking strength, better ductility, and stronger corrosion resistance [4,5]. Based on these advantages, the application of UHPC in structural components can achieve smaller cross sections, longer span lengths, lower permeability, and more convenient construction [6,7,8,9,10]. In addition, the high performance of UHPC can be more fully utilized in combination with high-strength reinforcement materials, such as high-strength steel bars, FRP materials, etc. [11]. Therefore, in-depth investigation is required to better understand the mechanical mechanisms and characteristics of the UHPC members and structures reinforced with high-strength reinforcements.
In practical engineering and structures, most of the components are statically indeterminate members with redundant constraints. Moment redistribution is a distinguished feature of concrete statically indeterminate members, while bearing load, wherein the internal forces are transferred from critical cross sections to the others due to the development of concrete cracks and plastic hinges. Considering the moment redistribution in structural design can help to exploit the load-bearing potential of members and prevent the overcrowding of steel bar layout in certain regions [12], thus saving materials and costs. This is of great significance for UHPC since it has higher material costs.
The moment redistribution in normal concrete has been well understood and corresponding provisions have been stipulated in national codes (i.e., EN 1992-1-1:2011 [13] AS 3600-2018 [14], the British BS 8100-1:97 [15], DIN 1045-3: 2008 [16], CSA-A23.3-19 [17], ACI 318-19 [18], and CECS 51-93 [19]). It is generally believed that the neutral axis depth factor c/d (ratio of neutral axis depth-to-section effective depth) is the main factor influencing the moment redistribution since it can well characterize the ductility of cross sections by considering the reinforcement amounts and material strengths. However, many studies have demonstrated that the moment redistribution in statically indeterminate structures is not only related to the ductility of a certain section but also can be affected by any other factors that lead to a relative variation of flexural stiffness between the cross sections. Zhao G Y et al. (1982) [20] studied the effect of load forms on moment redistribution and reported that the degree of moment redistribution is minimized under a single point load. Li L et al. (2018) [21] carried out a nonlinear analysis to study the influence of the c/d, span–depth ratio, load forms, and concrete strength grade on the moment redistribution. In addition, many other factors that affect the moment redistribution, such as beam depth, strength grade of reinforcement, and the longitudinal reinforcement ratio between the mid-span and intermediate support, have been studied by Xu J et al. (2013) [22], Kheyroddin A et al. (2007) [23], Scott R H et al. (2005) [24], and D Farahbod F et al. (2007) [25]. Relevant studies on the influencing factors are summarized in Table 1.
Moreover, the current research on moment redistribution is mainly focused on normal concrete continuous beams. For the UHPC continuous members reinforced with high-strength steel bars, the higher strength, stronger ductility, and more densified matrix of the materials may contribute to a variation in member responses involving crack developments, tension stiffening effects, and the rotation capacity of plastic hinges. Owing to the enhanced yield strength of reinforcement, the process in which the concrete reaches tensile plasticity and the tensile steel bars yield is prolonged compared to that of normal concrete members. Simultaneously, the larger ultimate compressive strains of UHPC lead to an elongated plastic development process from the formation of the plastic hinges to the bending failure. Therefore, the moment redistribution in UHPC continuous beams reinforced with high-strength reinforcements can be divided into two stages, namely, the pre-and post-formation of plastic hinges.
In this study, numerical investigations were performed to simulate and analyze the bending behavior and moment redistribution of UHPC continuous beams, taking into account various variables such as concrete strengths, the yielding strengths of steel bars, the neutral axis depth factors of intermediate support sections, beam depths, span–depth ratios, longitudinal reinforcement ratios between the mid-span and intermediate support sections, and load forms. Based on the numerical results, two-stage relationships between the degrees of moment redistribution and influencing parameters of UHPC continuous beams were proposed which can provide a technical reference for practical engineering design.

2. Finite Element Modeling and Implementation

2.1. Establishment of Finite Element Model

2.1.1. Element Types and Meshing

The numerical analysis was performed with the FE-software ABAQUS 6.14./Standard to simulate the behavior of moment redistribution in two-span UHPC continuous beams with fibers. The establishment of the FE model is depicted in Figure 1. The concrete and loading plates were simulated by three-dimensional eight-node solid elements (C3D8R) with one integration point so that the integration issues could be solved quickly and accurately. Two-node linear three-dimensional truss elements (T3D2) that can only withstand the tensile force but not the bending moment were used to model the steel reinforcement. To achieve a higher calculation accuracy and better convergence, a sensitivity analysis of dissimilar mesh sizes was conducted, and a mesh size of 25 mm was adopted for the beams.

2.1.2. Material Constitutive Relationships

In this study, the inelastic behavior of concrete was defined by the concrete damaged plasticity (CDP) model, in which strain softening (or stiffening) and uncoupled damage were identified, as shown in Figure 2. The constitutive relationship of concrete consists of two parts, namely, the elastic phase and the plastic phase. In the elastic phase, the concrete stresses are linearly correlated with the strains. In the plastic phase, two damage variables (dc and dt) are introduced to describe concrete degradation under compression and tension, respectively. The values of the variables range from 0 to 1, with 0 denoting no damage and 1 denoting complete damage [26]. According to the energy equivalent method, the damage factor dk can be obtained by Equation (1), and the method for calculating the compression or tension damage parameters is shown in Equation (2).
d k = 1 σ E 0 ε
{ ε k i n = ε k ε 0 k e l ε 0 k e l = σ k E 0 ε 0 k p l = ε k i n d k ( 1 d k ) σ k E 0
where ε k i n is the inelastic strain in tension or compression, εk is the total strain, ε 0 k e l is the elastic strain, ε 0 k p l is the plastic strain, and dk is the damage factor.
The CDP model adopts the non-associated flow rule, and the Drucker–Prager hyperbolic function is used for the plastic potential function in ABAQUS. The plasticity constants of concrete include the dilation angle (ψ), flow potential eccentricity (e), stress ratio (σbo/σco), viscosity coefficient (μ), and invariant stress ratio (Kc), which are critical to the prediction accuracy of the model. Table 2 lists the values of these parameters in this model [27]. Because UHPC-containing steel fiber is the most commonly used UHPC, this paper adopts the UHPC constitutive relationship containing steel fiber to simulate the tensile and compression characteristics of UHPC. The compression performance of UHPC was simulated using the uniaxial compression constitutive model suggested in the literature [28], as illustrated in Equation (3):
y = { A x x 2 1 + ( A 2 ) x ( 0 x 1 ) B x 1 + ( B 2 ) x + x 2 ( x > 1 )
where y = σc/fc, x = εc/εc0, σc is the stress of UHPC under compression, fc is the compressive strength of concrete, εc is the strain of UHPC under pressure, and εc0 is the peak compressive strain of UHPC. The value of parameter A ranges from 1.11 ≤ A ≤ 1.138, and that of parameter B ranges from 0.193 ≤ B ≤ 0.312.
The uniaxial tensile constitutive model proposed in the literature [29] is used to simulate the tensile properties of UHPC, as shown in Equation (4):
y = { x 0.92 x 1.09 + 0.08 ( 0 x 1 ) x 0.1 ( x 1 ) 2.4 + x ( x > 1 )
where y = σt/ft, x = εt/εt0, σt is the stress of UHPC under compression, ft is the compressive strength of the prismatic axis, εt is the strain of UHPC during tension, and εt0 is the peak tensile strain of UHPC.
The properties of high-strength reinforcement were modeled with an elastic-plastic strengthening constitutive relationship, as shown in Figure 3, and the corresponding equation is given by Equation (5):
σ s = { E S ε S f y + f u f y ε u ε y ( ε s ε y ) ( 0 < ε s ε y ) ( ε y < ε s ε u )
where σs is the tensile stress of the steel bar; εs is the tensile strain of the steel bar; fy is the yield stress of the steel bar; εy is the yield strain of the steel bar; fu is the tensile strength of the steel bar; and εu is the ultimate tensile strain of the steel bar. Es = 200 GPa is the elastic modulus and the hardening modulus E′ = 0.01Es [30].

2.1.3. Boundary Conditions and Interaction Properties

The simulated boundary conditions are shown in Figure 4. The finite element models were loaded by controlling the center displacement at the midpoints of the bottom surface of the plates in the mid-span. The midpoints were restrained from movement in the longitudinal, transverse, and vertical directions (z, y, and x directions, respectively). The end support plates were restrained from movement in the transverse and vertical directions (y and x directions, respectively) and free to move in the longitudinal direction (z direction) while the intermediate support plate was restrained from movement in the longitudinal, transverse, and vertical directions (z, y, and x directions, respectively). A tie connection was used between the UHPC continuous beams and plates and supports, reference points (RP) were set on the upper surface of the plates, and the two were connected by coupling, which used an embedded element to establish the connection between the reinforcement and UHPC.

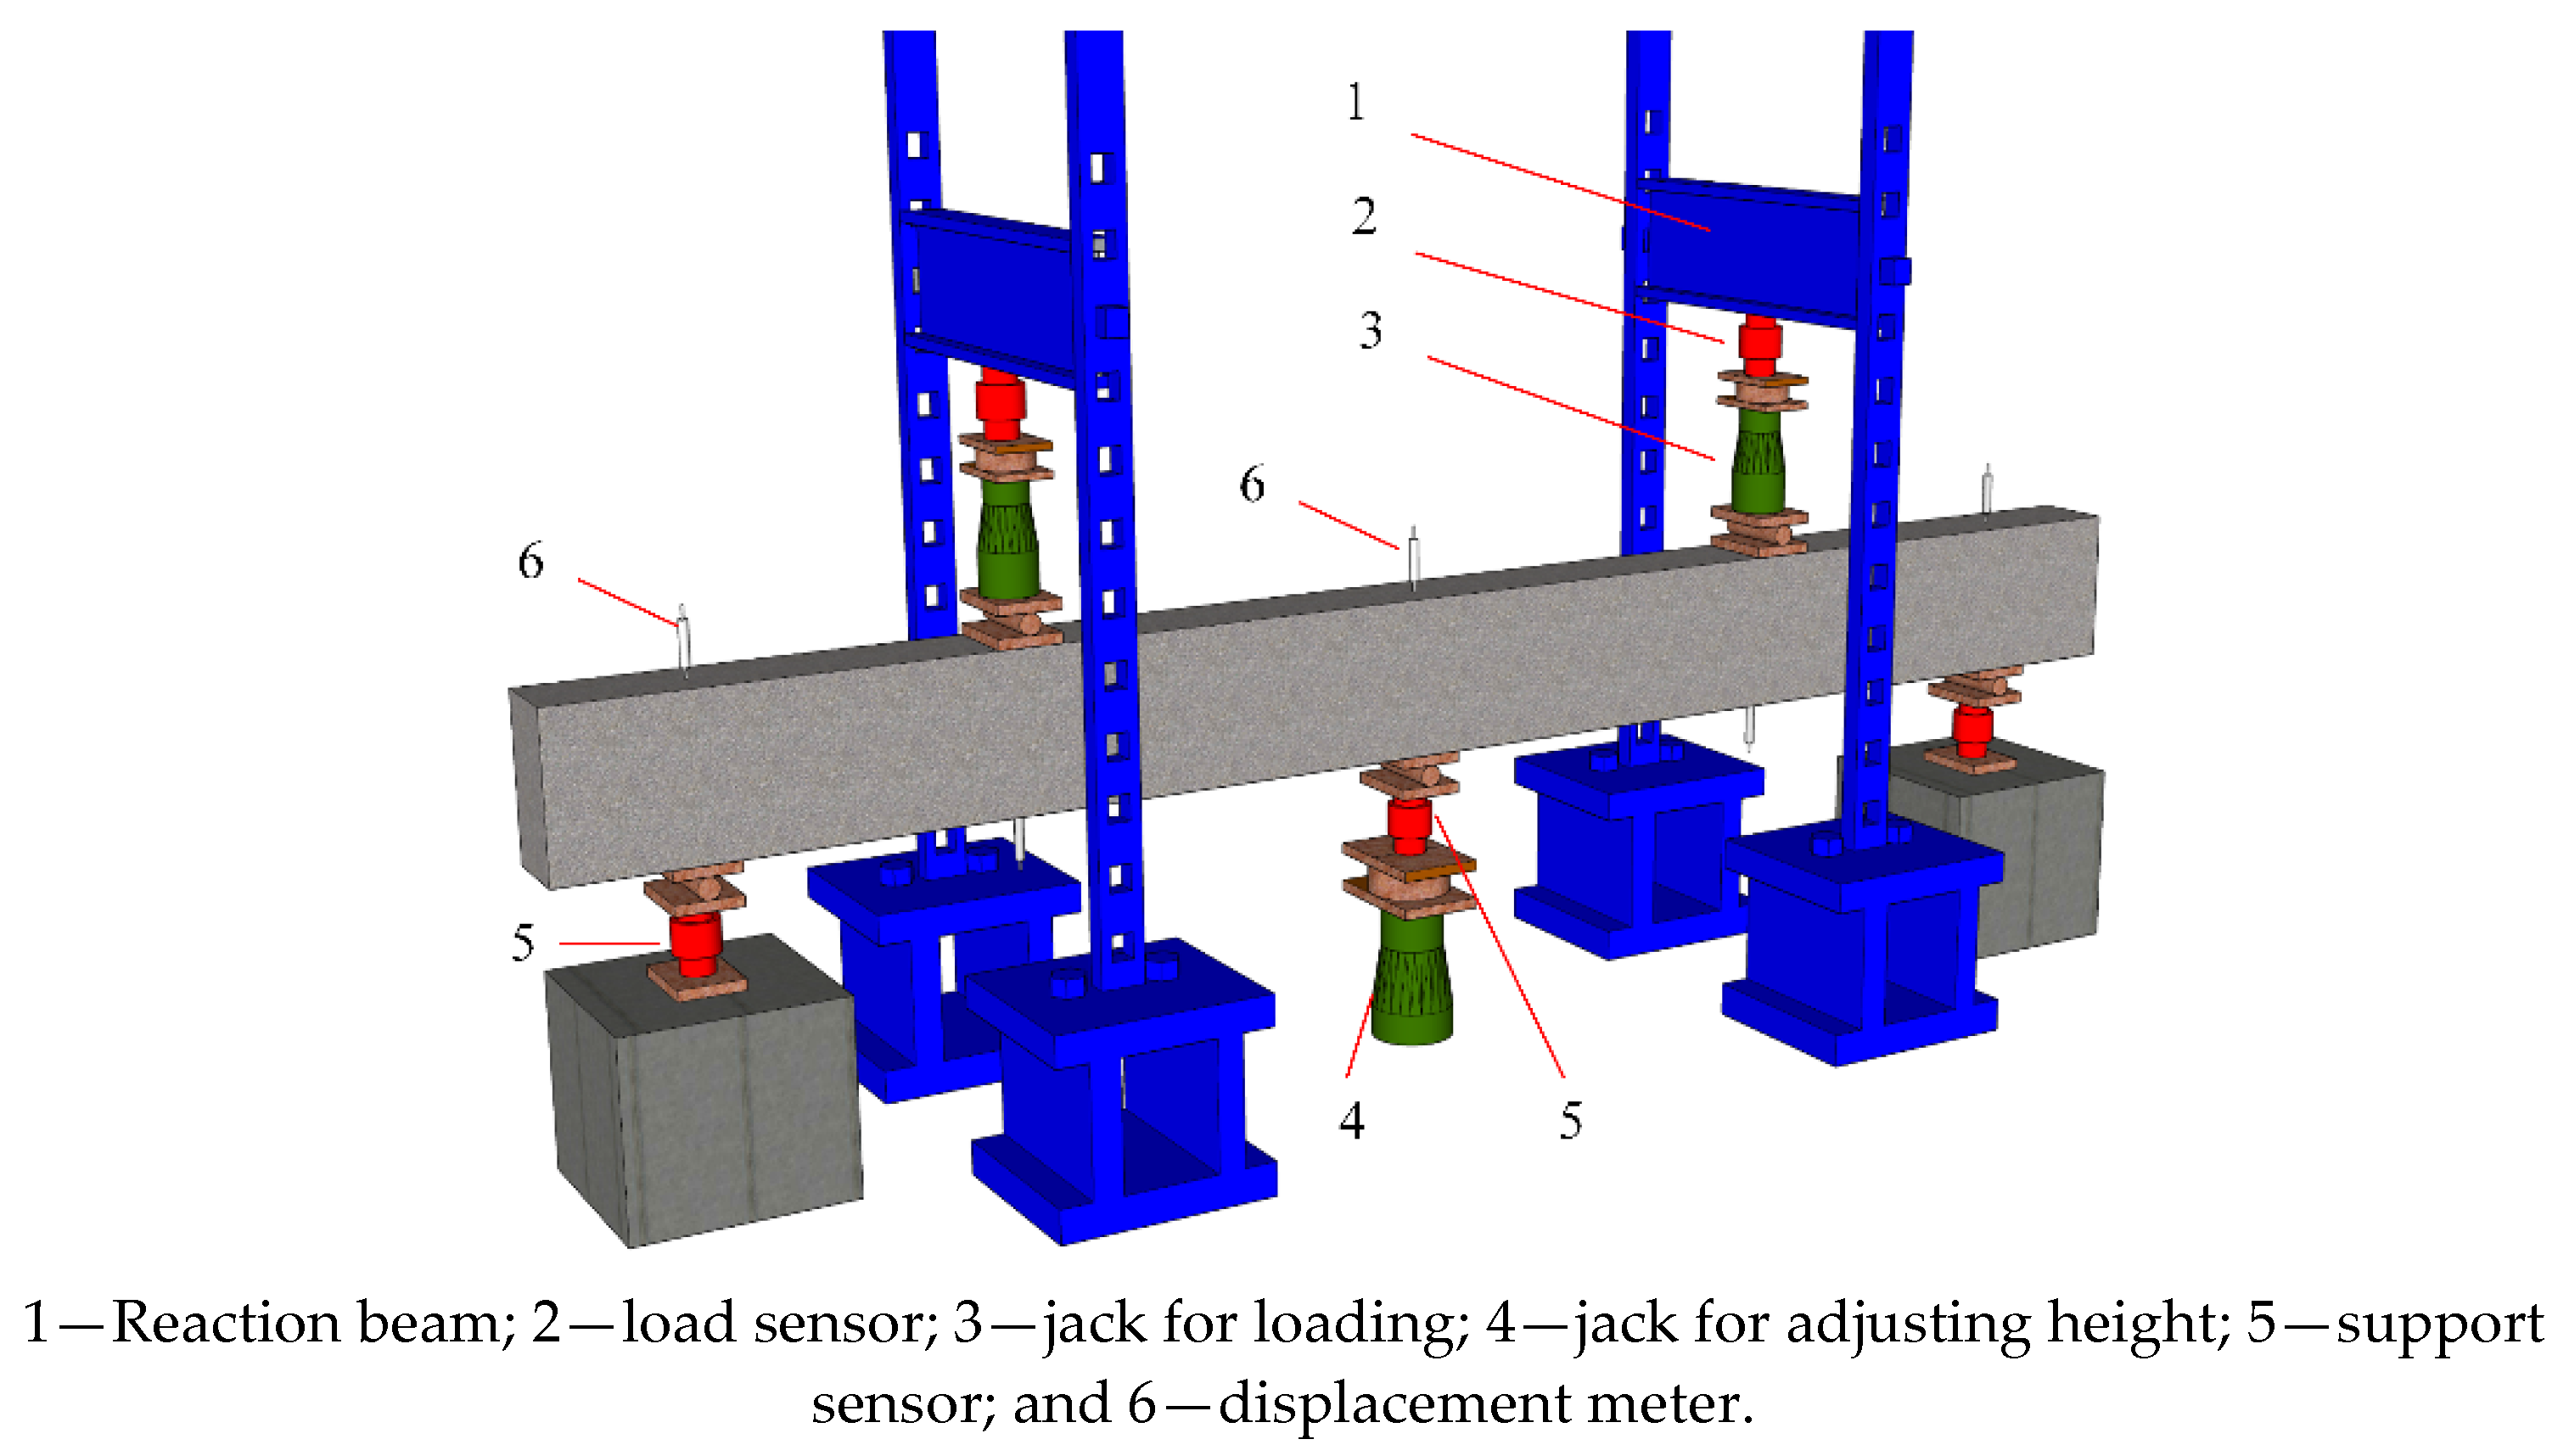
2.2. Model Verification

In order to validate the accuracy of the established FE models, the experimental research of five two-span UHPC continuous beams conducted by Li [31] was selected herein to compare with the numerical results. The test beams were designated as LL-1~LL-5, with a cross-section of 180 mm × 220 mm and a span of 3400 mm. Figure 5 depicts the reinforcement configuration for the LL-1 beam, and the reinforcement configuration details for each beam are listed in Table 3. All the specimens were subjected to single-point loads in the mid-span. The test device diagram is shown in Figure 6. The mechanical characteristics of the UHPC materials and steel bars measured in the literature [31] are displayed in Table 4 and Table 5, respectively. The specific values are the average values measured by the test. Figure 7 depicts the comparisons between the LL–1beam damages obtained from the experiments and FE simulation.

Load-Displacement Curve

The load-displacement curves of the mid-span cross-section for the five UHPC beams were compared with the simulated results, as shown in Figure 8. It can be seen that for the same load values, the displacements of the simulated beams were smaller than those of the test beams. This is due to the homogeneous material composition of the simulated beams, thus resulting in a greater overall stiffness. The comparisons between the test values and the simulated values of the ultimate loads are listed in Table 6. They reveal that the difference falls within a range of 3.51~15.21%, indicating that the FE model has a good level of accuracy in predicting the behavior of the UHPC beams.

3. Finite Element Analysis of Moment Redistribution in Continuous UHPC Beams with High Strength Reinforcement
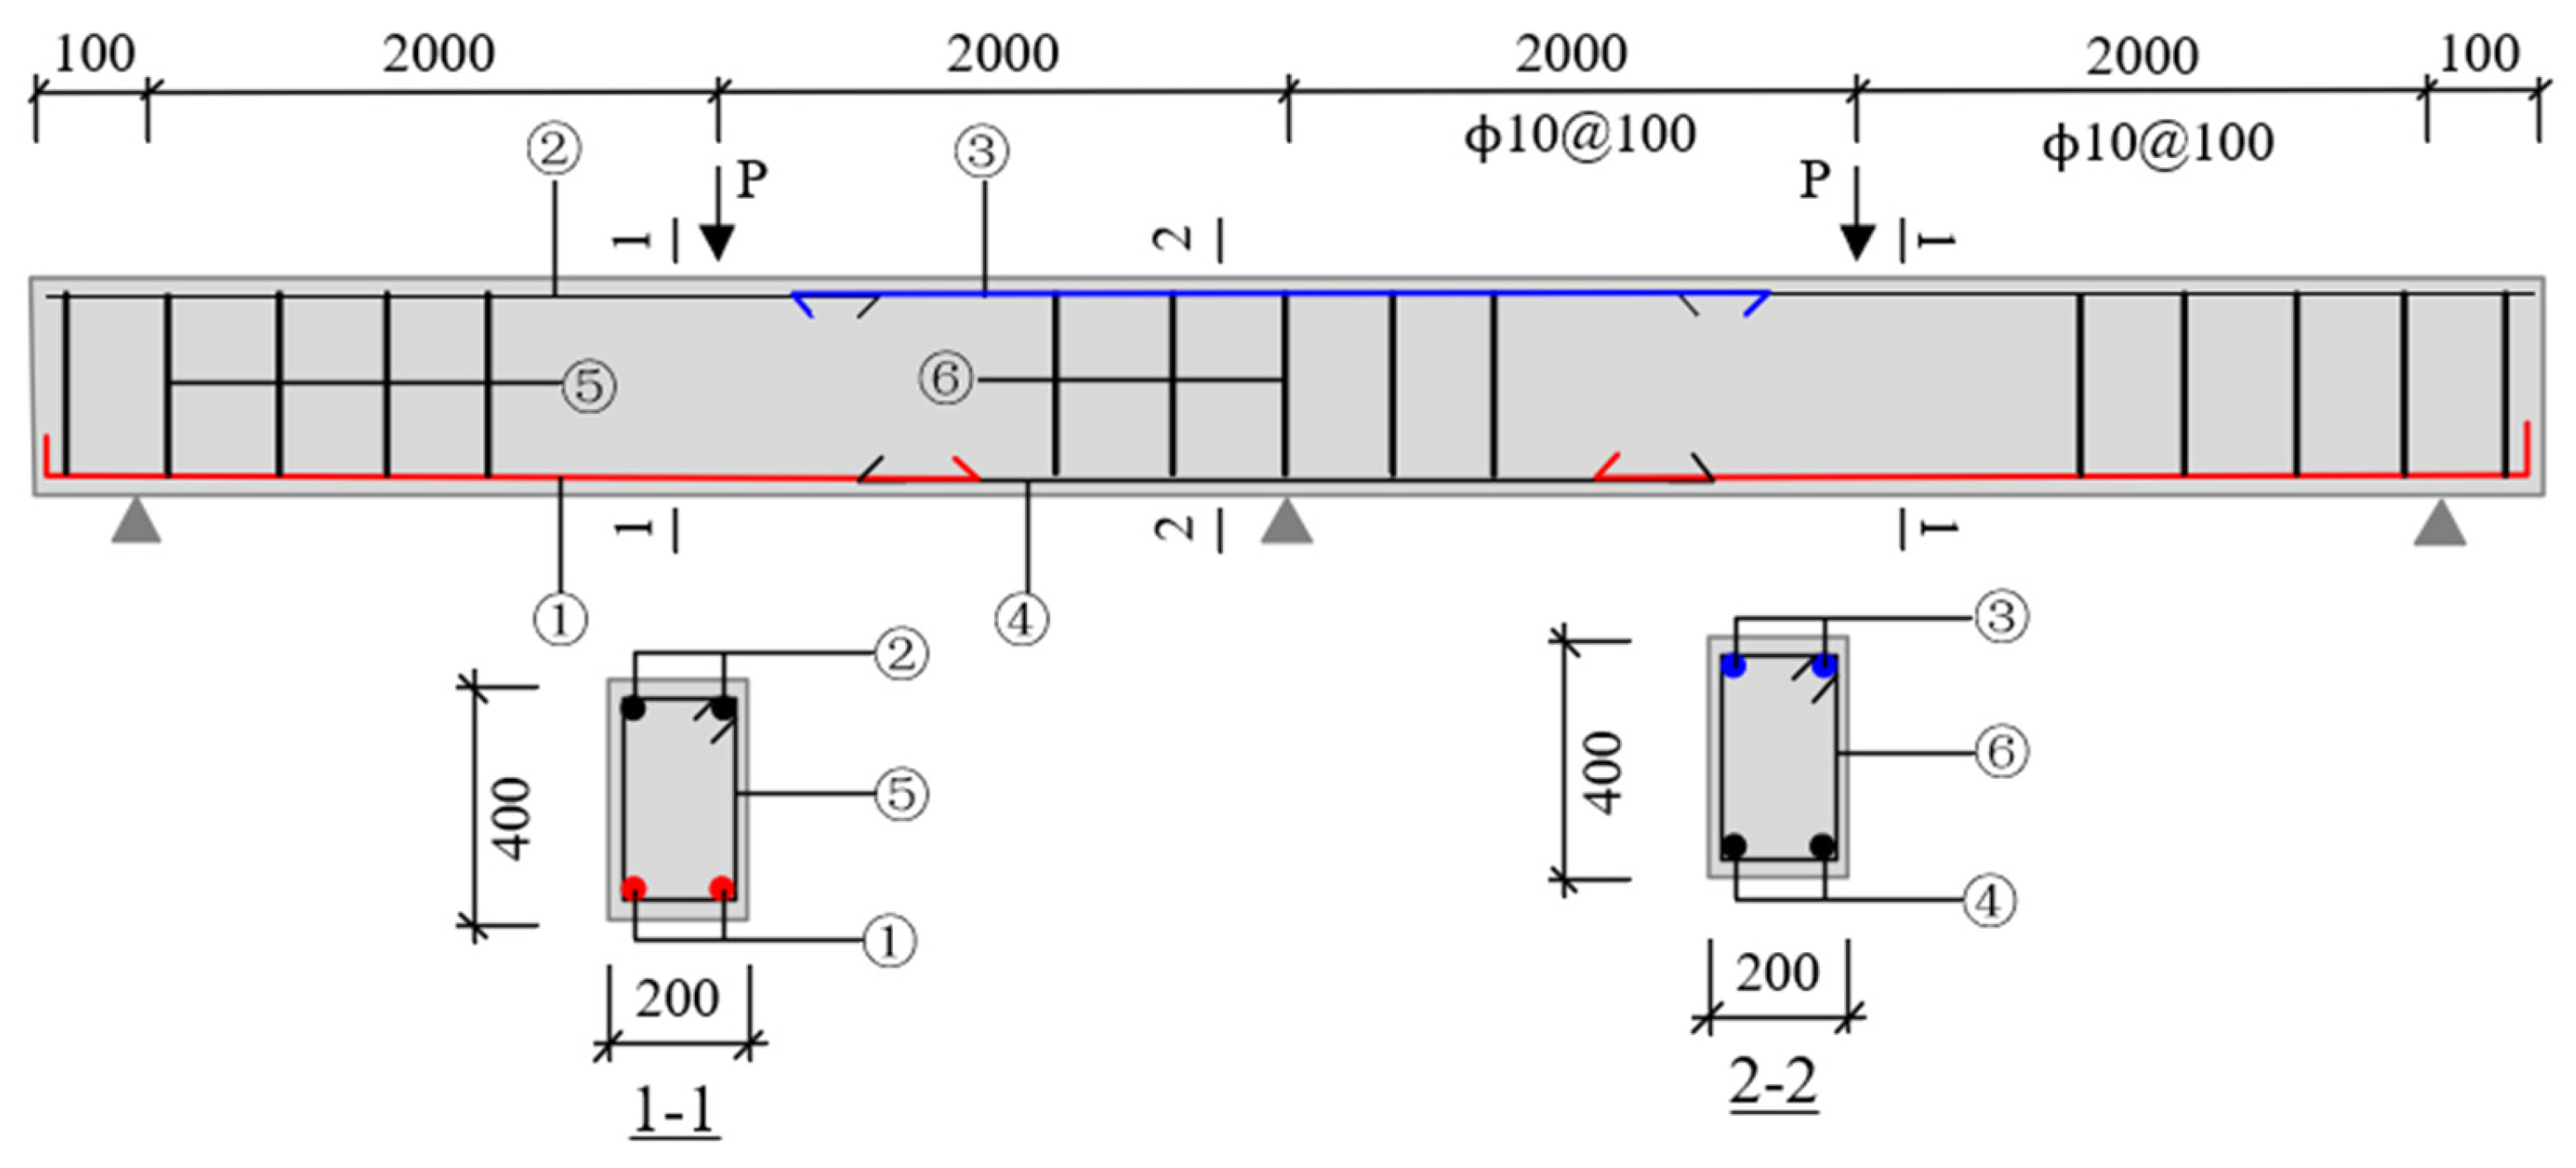
3.1. Model Design

To investigate the moment redistribution in UHPC statically indeterminate structures, a fine analysis for nine simulated two-span UHPC continuous beams was conducted. The strength grade of the concrete was used as UHC150, of which the cubic compressive strength, tensile strength, and elastic modulus were equal to 150 MPa, 10 MPa, and 41 GPa, respectively. All the simulated specimens had the same rectangular cross-section of 200 mm × 400 mm with a single span length of 4000 mm. Table 7 provides the design parameters of the nine UHPC beams, and a consistent coding system was used to label the specimens. In the notation of 0.05A-UHC150-400-10-1-①, the superscript “0.05” denotes the neutral axis depth factor of the cross-section c/d, “A” indicates the strength grade of the steel bar, UHC150 represents the strength grade of UHPC, the third number of 400 indicates the strength grade of reinforcement is HRB400, the following numbers “10 and 1” indicate the span–depth ratio is 10 and the longitudinal reinforcement ratio between the mid-span and intermediate support is 1, and the last number represents the load form (i.e., ①, ②, ③ denote the single point load in mid-span, three-point load, and uniform load, respectively). Table 8 lists the mechanical properties of reinforcing steel materials which are the average values measured by the test in reference [33]. Details of the specimen L-1 are shown in Figure 9.

3.2. Analysis of Results

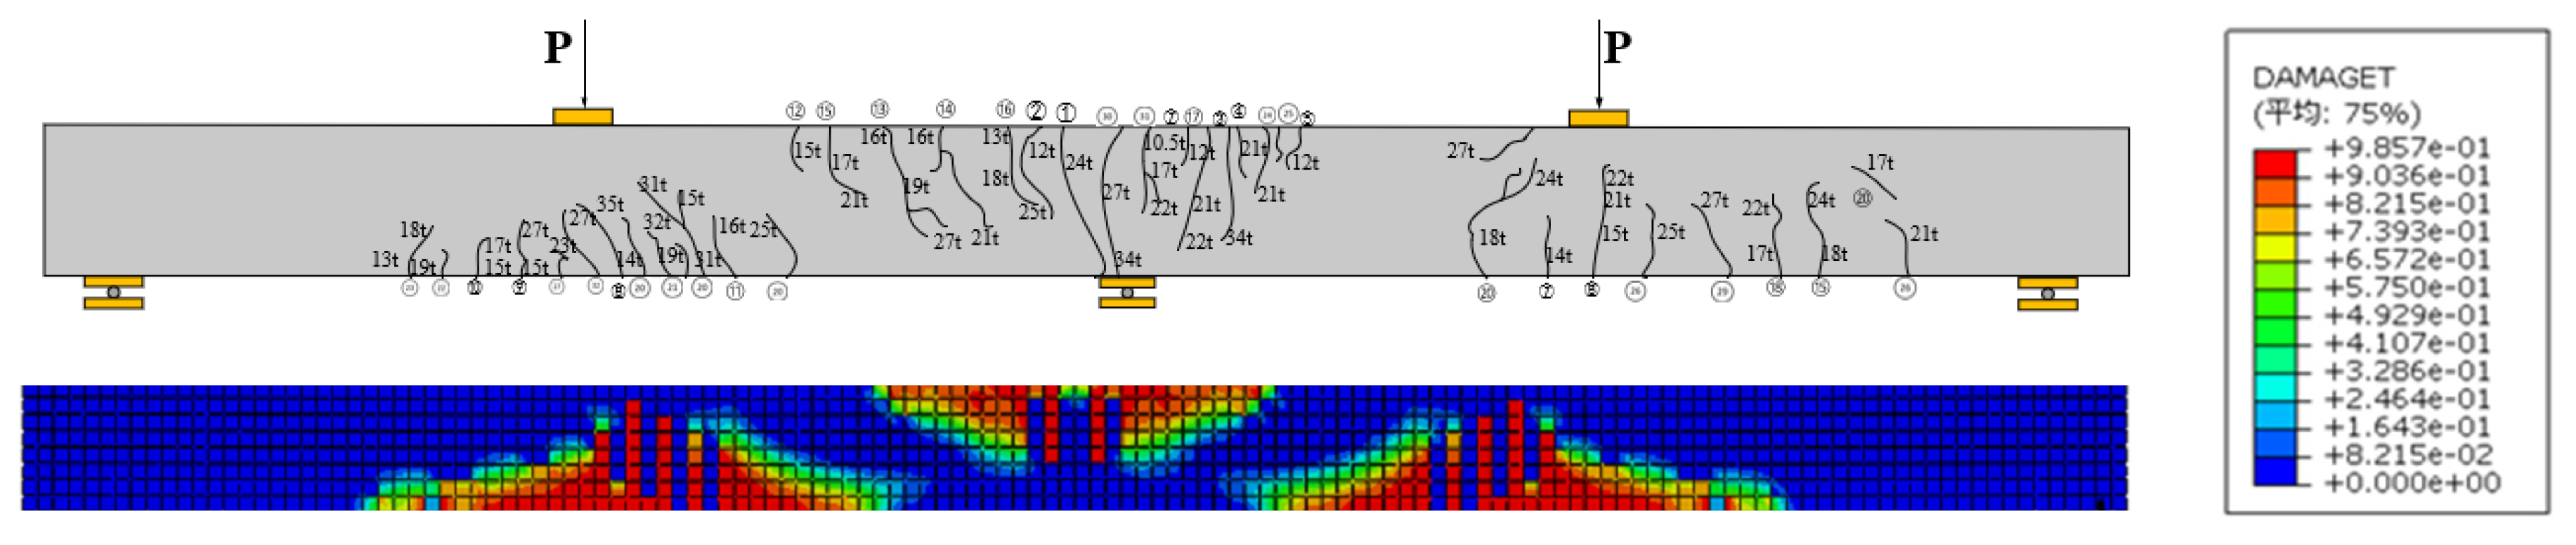
3.2.1. Analysis of Damage Patterns

To visually illustrate the failure behavior of the UHPC continuous beams, the DAMAGET programs of the representative simulated specimen 0.05A-UHC150-400-10-1-① are depicted in Figure 10, roughly reflecting the distribution and development of cracks caused by tensile damage. The larger the values of DMAGET, the more severe the concrete cracking. Three characteristic points, namely, the initiation of the concrete crack, yielding of the longitudinal reinforcement, and attainment of the ultimate load were captured, as shown in Figure 10. It can be seen that the concrete cracks occurred first in the uppermost part of the critical section at the intermediate support section. This was consistent with the moment distribution of the continuous beams where the largest value of bending moment was achieved at the intermediate support section. As the external load increased, cracks formed in the mid-span and gradually developed towards the compression zone in both the intermediate support and mid-span sections. With the development of cracks, the stiffness of each cross section varied constantly, resulting in the evolution of moment redistribution in the continuous beams. When the longitudinal steel bars yielded, as shown in Figure 10b, the tensile damage of the concrete was relatively obvious, and the deformation of the beam was accelerated. At the ultimate load, the areas of tensile damage were enlarged near the mid-span and intermediate support regions, and the maximum tensile damage values were reached, indicating the failure of the model.

3.2.2. Load-Displacement Curve of UHPC Continuous Beams

Figure 11 presents a comparison between the load-displacement curves of the nine simulated UHPC continuous beams with different neutral axis depth factors and reinforcement strength grades. The loads corresponding to the three characteristic points in Section 3.2.1 are marked as Pcr, Py, and Pu in Figure 11. Initially, it can be observed that the load-displacement curves are linear in elasticity until reaching the cracking load Pcr. Due to the identical concrete strength of the nine UHPC continuous beams, the cracking loads Pcr of the nine specimens are similar. As the loads continued to increase, the development of the cracks led to a reduction in the flexural stiffness of the beams and the load-displacement curves exhibited nonlinear behavior. When the yielding loads Py were reached, plastic hinges were formed, and the displacements increased rapidly with the increase in loads. By comparing the load-displacement curves of the beams with a constant c/d, it can be found that the beams reinforced with higher-strength steel bars can sustain greater yielding loads, as shown in Figure 11. Moreover, for the beams with the same strength grade of reinforcement, the ultimate loads Pu were improved by four times as c/d increased from 0.05 to 0.25.

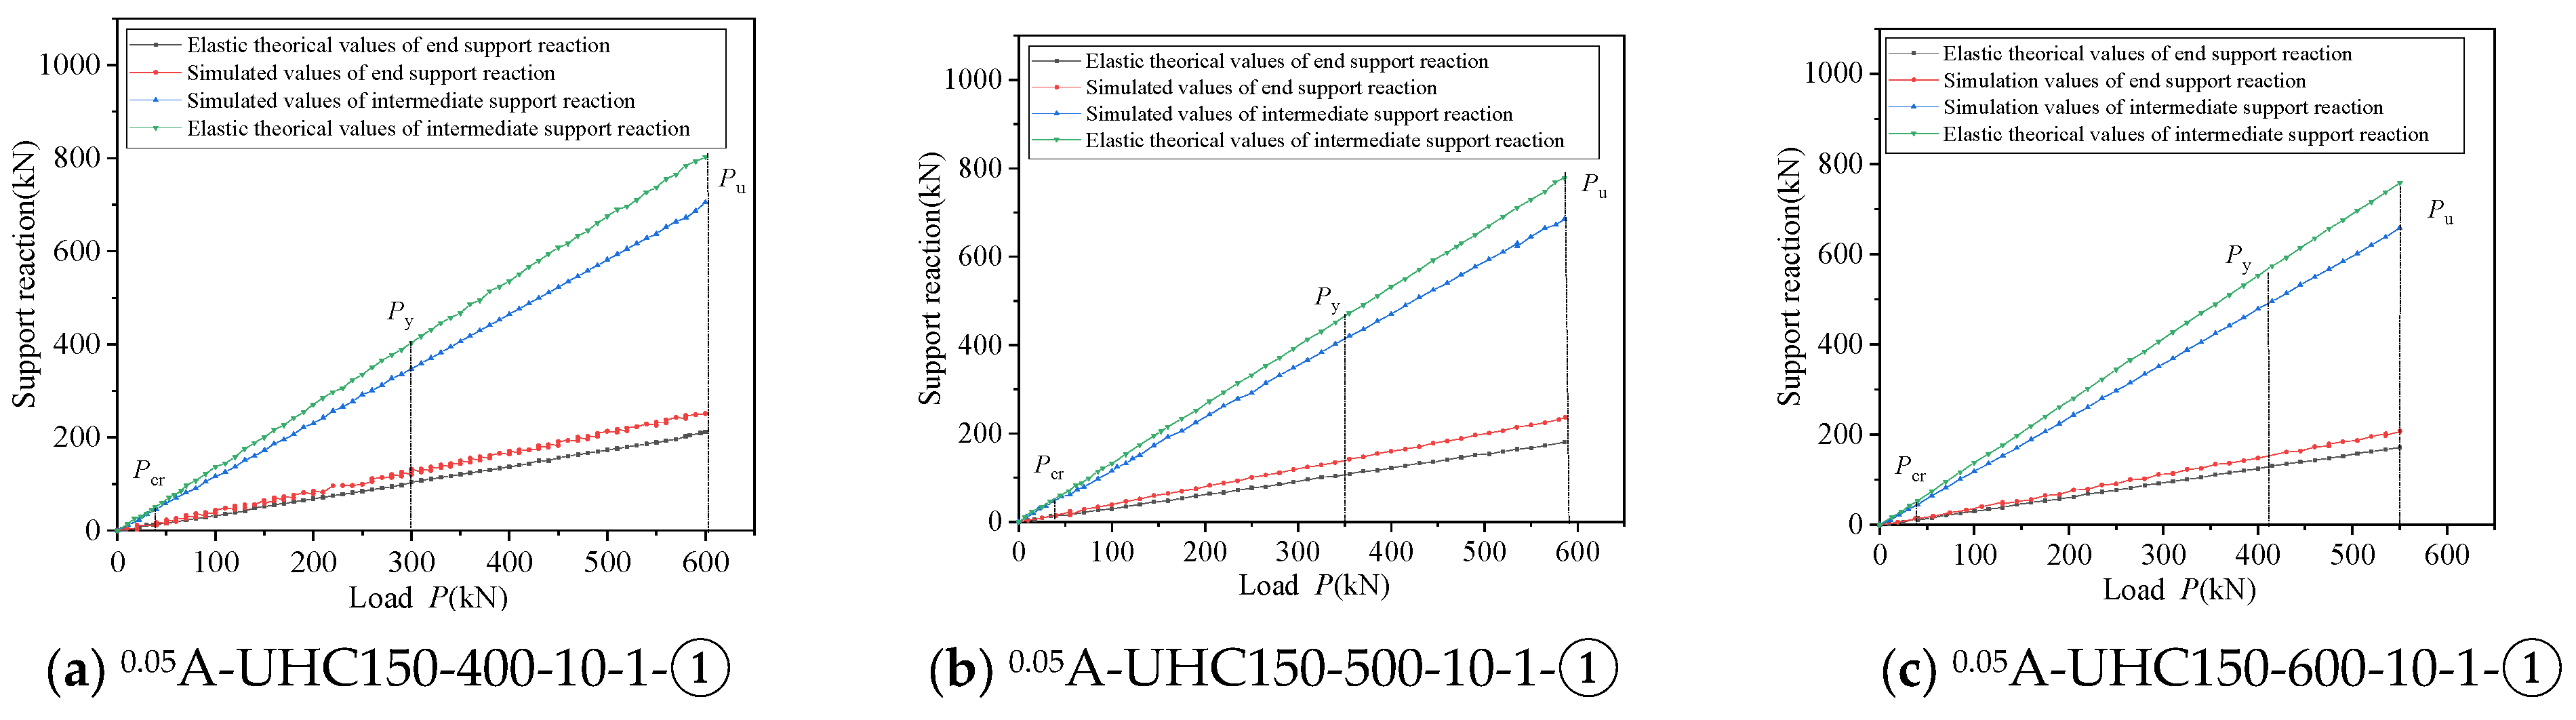
3.2.3. Support Reaction Forces of UHPC Continuous Beams

Through finite element analysis, the support reaction forces of the nine simulated UHPC continuous beams at each analysis step can be obtained. Based on the elastic calculation theory, the elastic theoretical values of the support reaction forces can be calculated by combining them with the external loads. Figure 12 illustrates a comparison between the elastic theoretical values and simulated values of the intermediate support reaction and end support reaction, with respect to the external loads. It can be observed that at the initial stage of loading, the elastic theoretical values of the support reactions were close to their simulated counterparts. After the concrete cracking (Pcr), the deviations between the elastic theoretical values and simulated ones became more pronounced with the increase in external loads. At the ultimate state, the simulated values of the intermediate support reaction and end support reaction were 0.86~0.89 times and 1.21~1.31 times those of the elastic theoretical values, respectively, which indicated that the elastic theoretical bending moments at the intermediate support section were greater than the simulated ones and that a moment redistribution occurred from the intermediate support area to the mid-span area. Additionally, it can be found that the deviations between the simulated and elastic theoretical support reactions were diminished with the increase in c/d. When c/d remained constant, an increase in the yield strength of the steel bars prolonged the process of the concrete cracking to the yielding of steel bars.

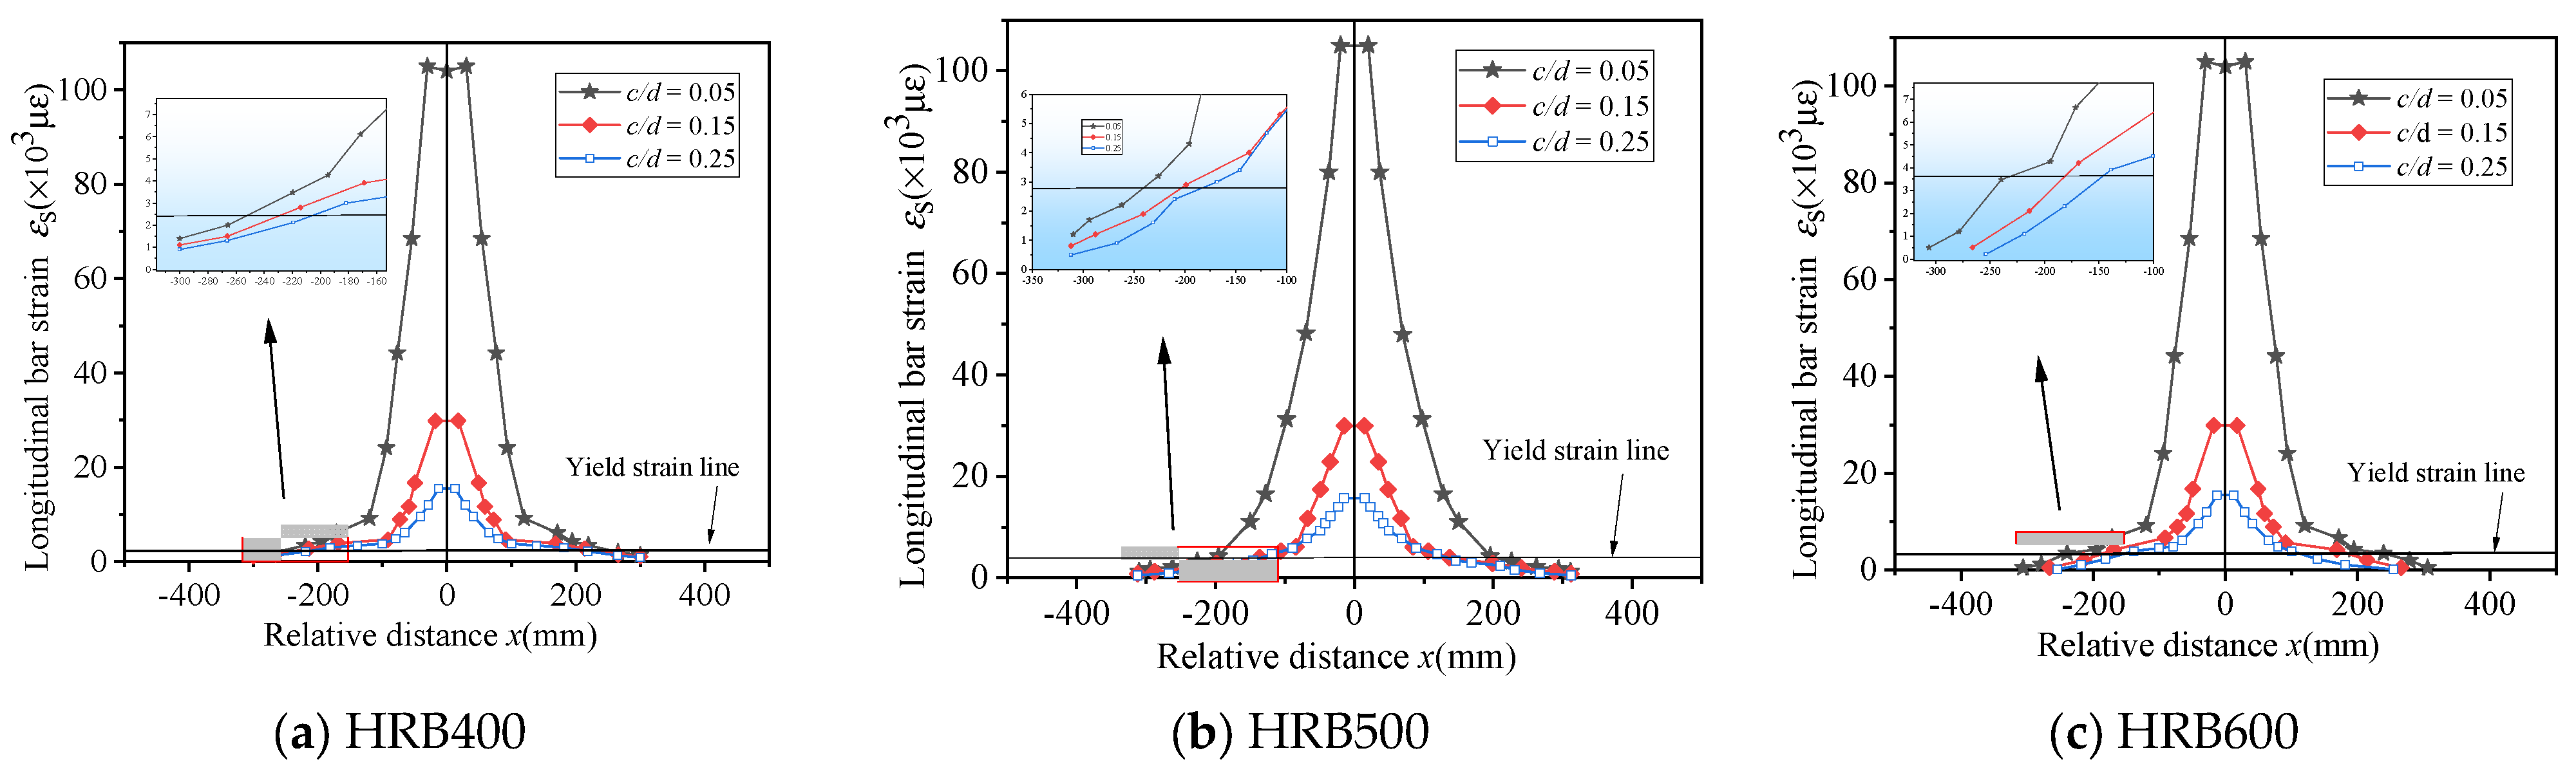
3.2.4. Strain Analysis of Longitudinal Steel Bars in UHPC Continuous Beams

It is evident that a plastic hinge will be formed in the intermediate support region of a continuous beam when subjected to a concentrated load at mid-span, which is attributed to the maximum moment occurring at the cross-section of the intermediate support. By finite element analysis, the strain distributions of the steel bars in the negative moment zone can be determined when the concrete in the compression zone reaches the ultimate compressive strains, as shown in Figure 13. The origin point of the coordinate system represents the center of the intermediate support, with the vertical axis representing the tensile strains of reinforcement and the horizontal axis measuring the relative distances to the center point. As depicted in Figure 13, the variation in tensile strains is consistent with the laws of moment distribution. The closer to the center of intermediate support, the greater the tensile strains observed. Moreover, it can be seen that the rebar strains exhibited abrupt variations and significant increases over the short distances near the intermediate supports. This is attributed to the formation of plastic hinges in this region, resulting in a sudden increase in rebar strains with little changes in the bending moment. From the simulation results, it can be found that an increase in c/d at the intermediate supports led to a decrease in the lengths of the plastic hinge region (half the length of the line segment at the intersection of the longitudinal bars strain curve and the yield strain line). This phenomenon can be explained by the increase in c/d making the tensile strains of the steel bars decline at the flexural failure, thus weakening the strain penetration of the steel bars.

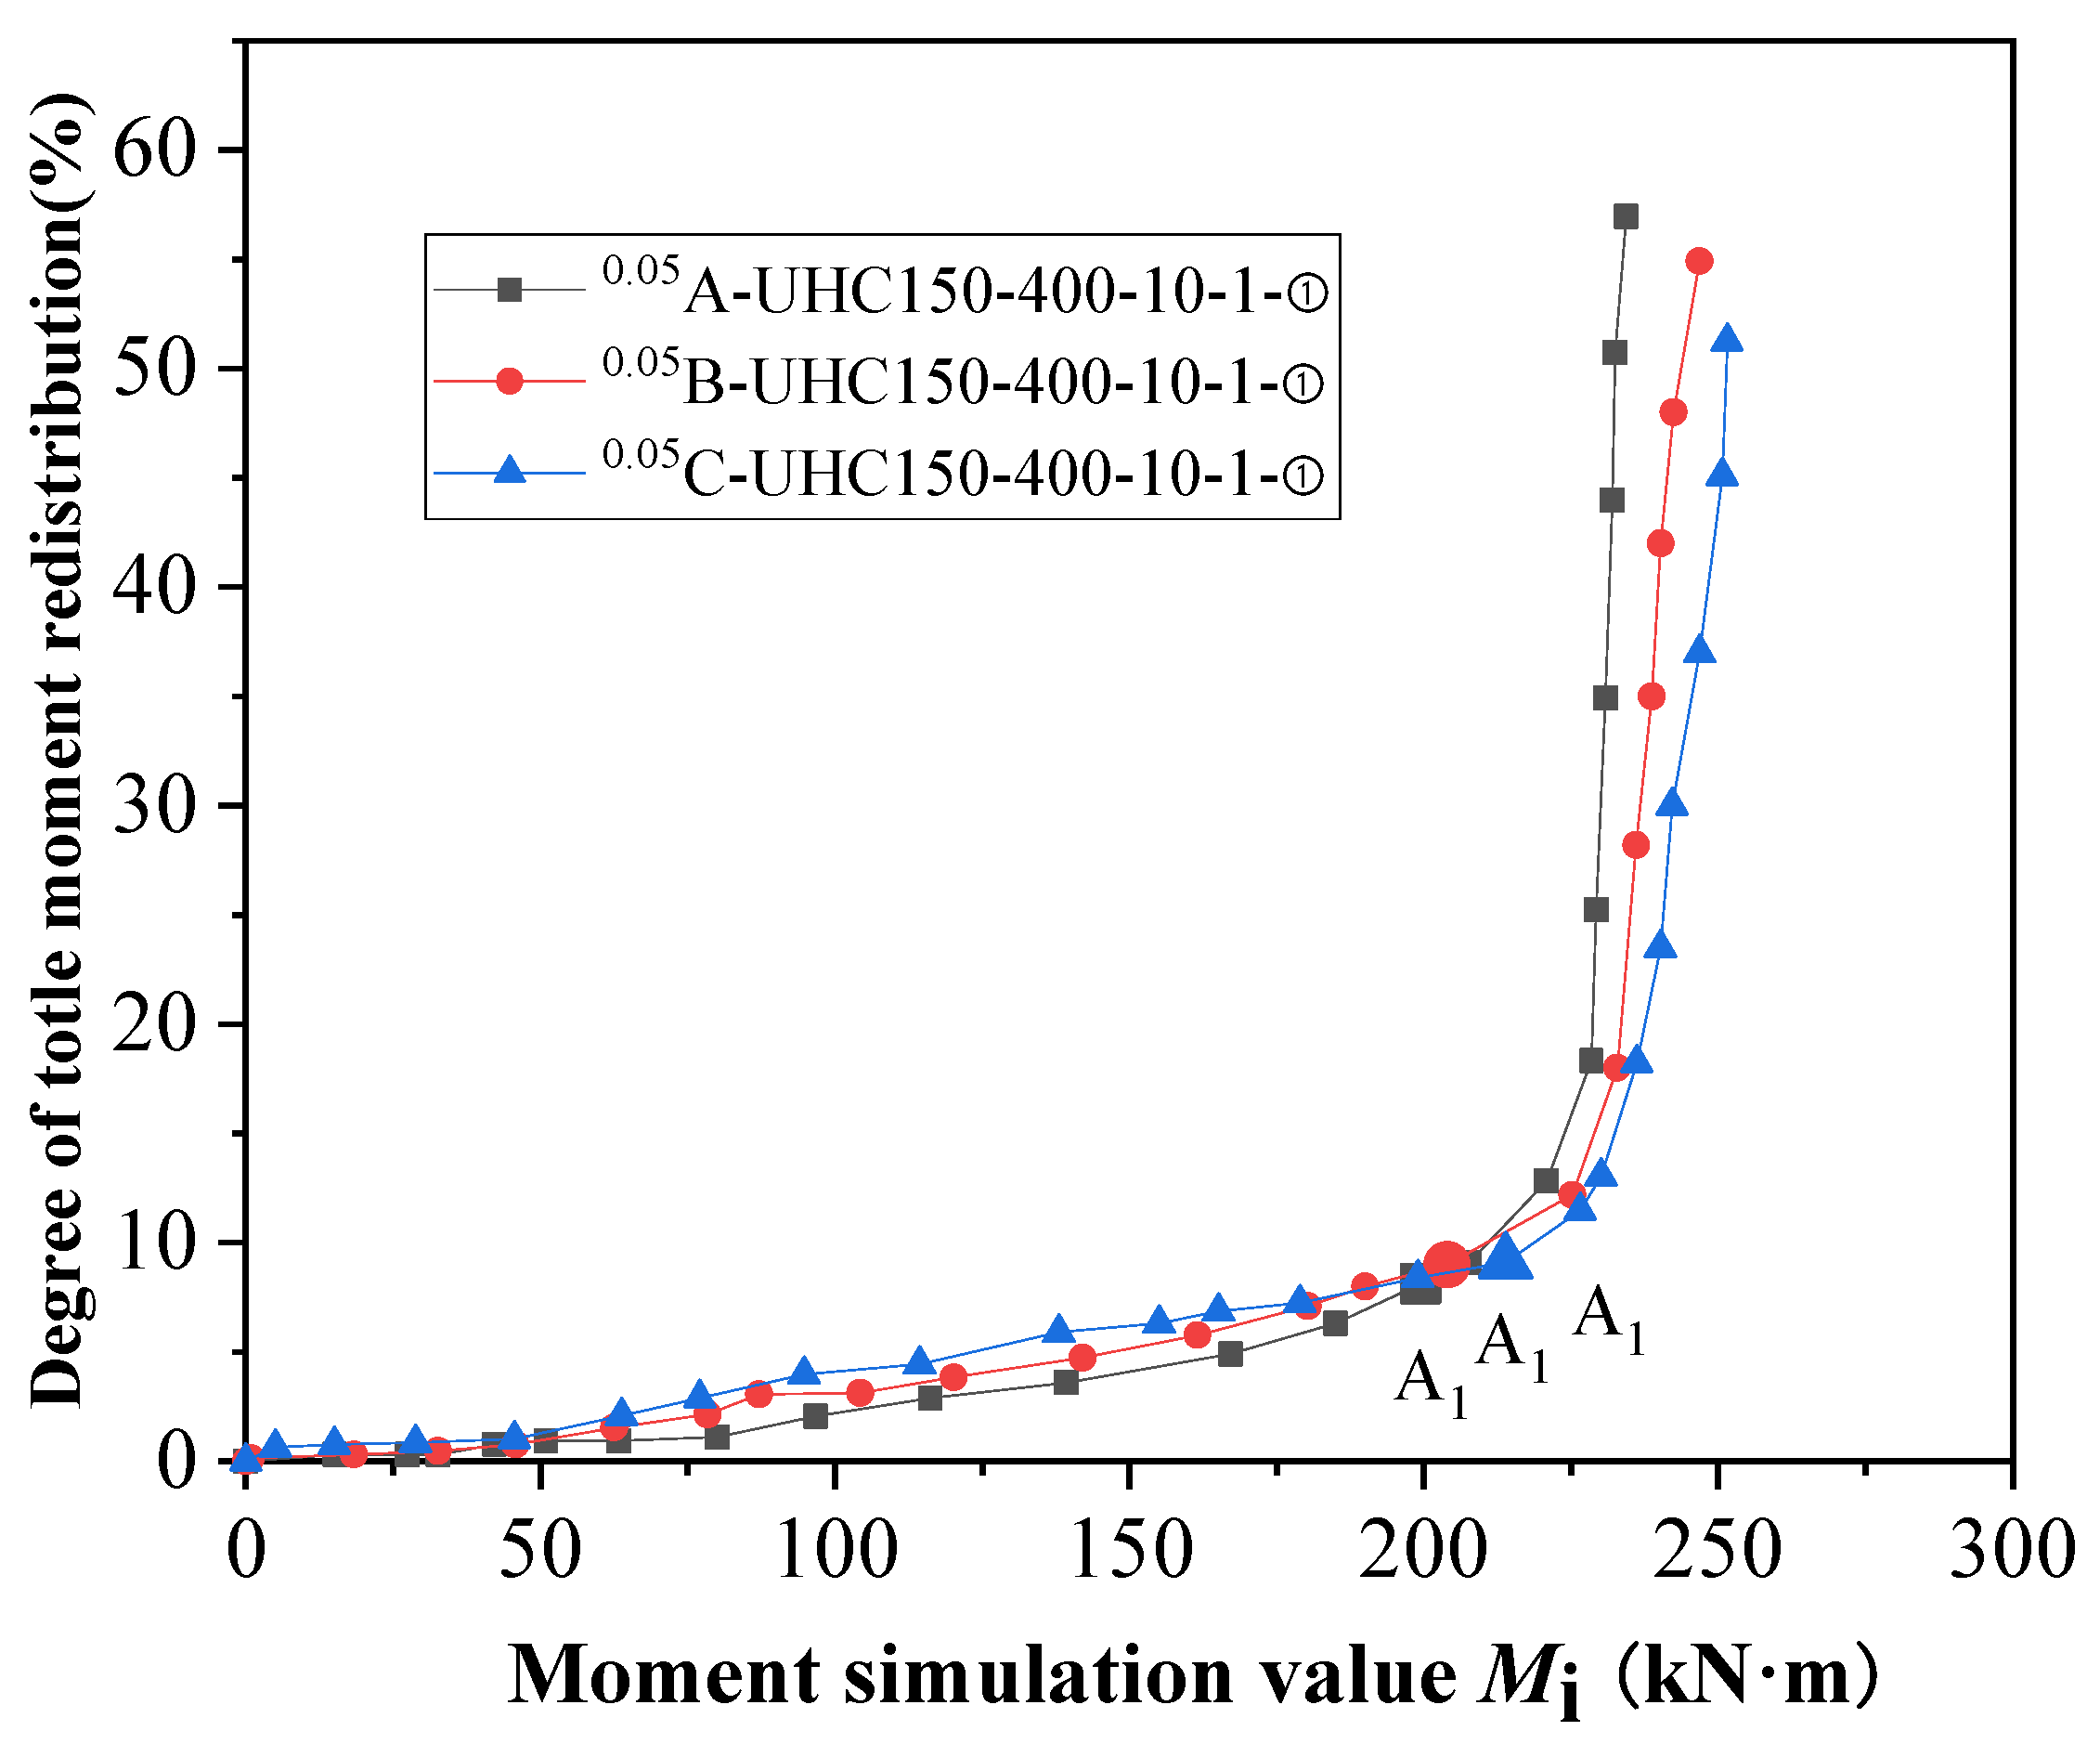
3.2.5. The Whole Process of Moment Redistribution in UHPC Continuous Beams

The tensile properties of UHPC are significantly superior to conventional concrete and exhibit remarkable strain-hardening characteristics. Consequently, the moment redistribution in UHPC continuous beams initiates from the tensile plastic stage. Based on the support reaction forces obtained in Section 3.2.3, the degrees of moment redistribution at each step of loading can be calculated with the external loads, as shown in Equation (6):
β i = M e , i M t , i M e , u
where Me,i, Mt,i represent the values of the elastic theoretical moments and simulated moments, respectively, for the intermediate support section at step i calculated from the corresponding loads; Me,u represents the elastic theoretical moment values when the concrete in the compression zone reaches ultimate compressive strain.
In order to investigate the development process of moment redistribution in UHPC continuous beams, three simulated beams (0.05A-UHC150-400-10-1-①, 0.05B-UHC150-400-10-1-①, and 0.05C-UHC150-400-10-1-①) were selected for analysis. Figure 14 shows the variations in the degree of moment redistribution βi with the simulated bending moment Mi in the whole loading process. It can be observed that the development of the moment redistribution was gentle before the yielding of steel bars (points A1, A2, A3), and the degrees of the moment redistribution were considerable, accounting for 22.2~29.6% of the total moment redistribution. After the formation of the plastic hinges, the slopes of the variation curves increased obviously, indicating a rapid increase in the degree of moment redistribution with the rotation of the plastic hinges.
Based on the above analysis, it can be observed that the moment redistribution process in UHPC continuous beams reinforced with high-strength steel bars can be divided into two stages, the first stage was termed elastic moment redistribution, which was accompanied by the progress of concrete cracks while the tensile reinforcement was still behaving elastically, and the second stage was termed plastic moment redistribution, developing after the yielding of the tensile reinforcement.

4. Parameter Analysis

To further reveal the variation regular of the two-stage moment redistribution in UHPC continuous beams reinforced with high-strength steel bars, an expansion parametric study of 108 simulated UHPC specimens was conducted as below. The design parameters for the UHPC beams are presented in Table 9, including the concrete grade (UHC120, UHC130, UHC140, and UHC150), longitudinal reinforcement grade (HRB400, HRB500, and HRB600), neutral axis depth factor of the critical section (0.05, 0.15, 0.25, and 0.35), beam depth (400 mm, 500 mm, 600 mm, and 700 mm), beam span–depth ratio (8, 10, 12 and 14), the longitudinal reinforcement ratio between the mid-span and intermediate support (1, 1.2, 1.4, and 1.6), and load form (single point load, three-point load, and uniform load). The properties of UHPC are listed in Table 10.

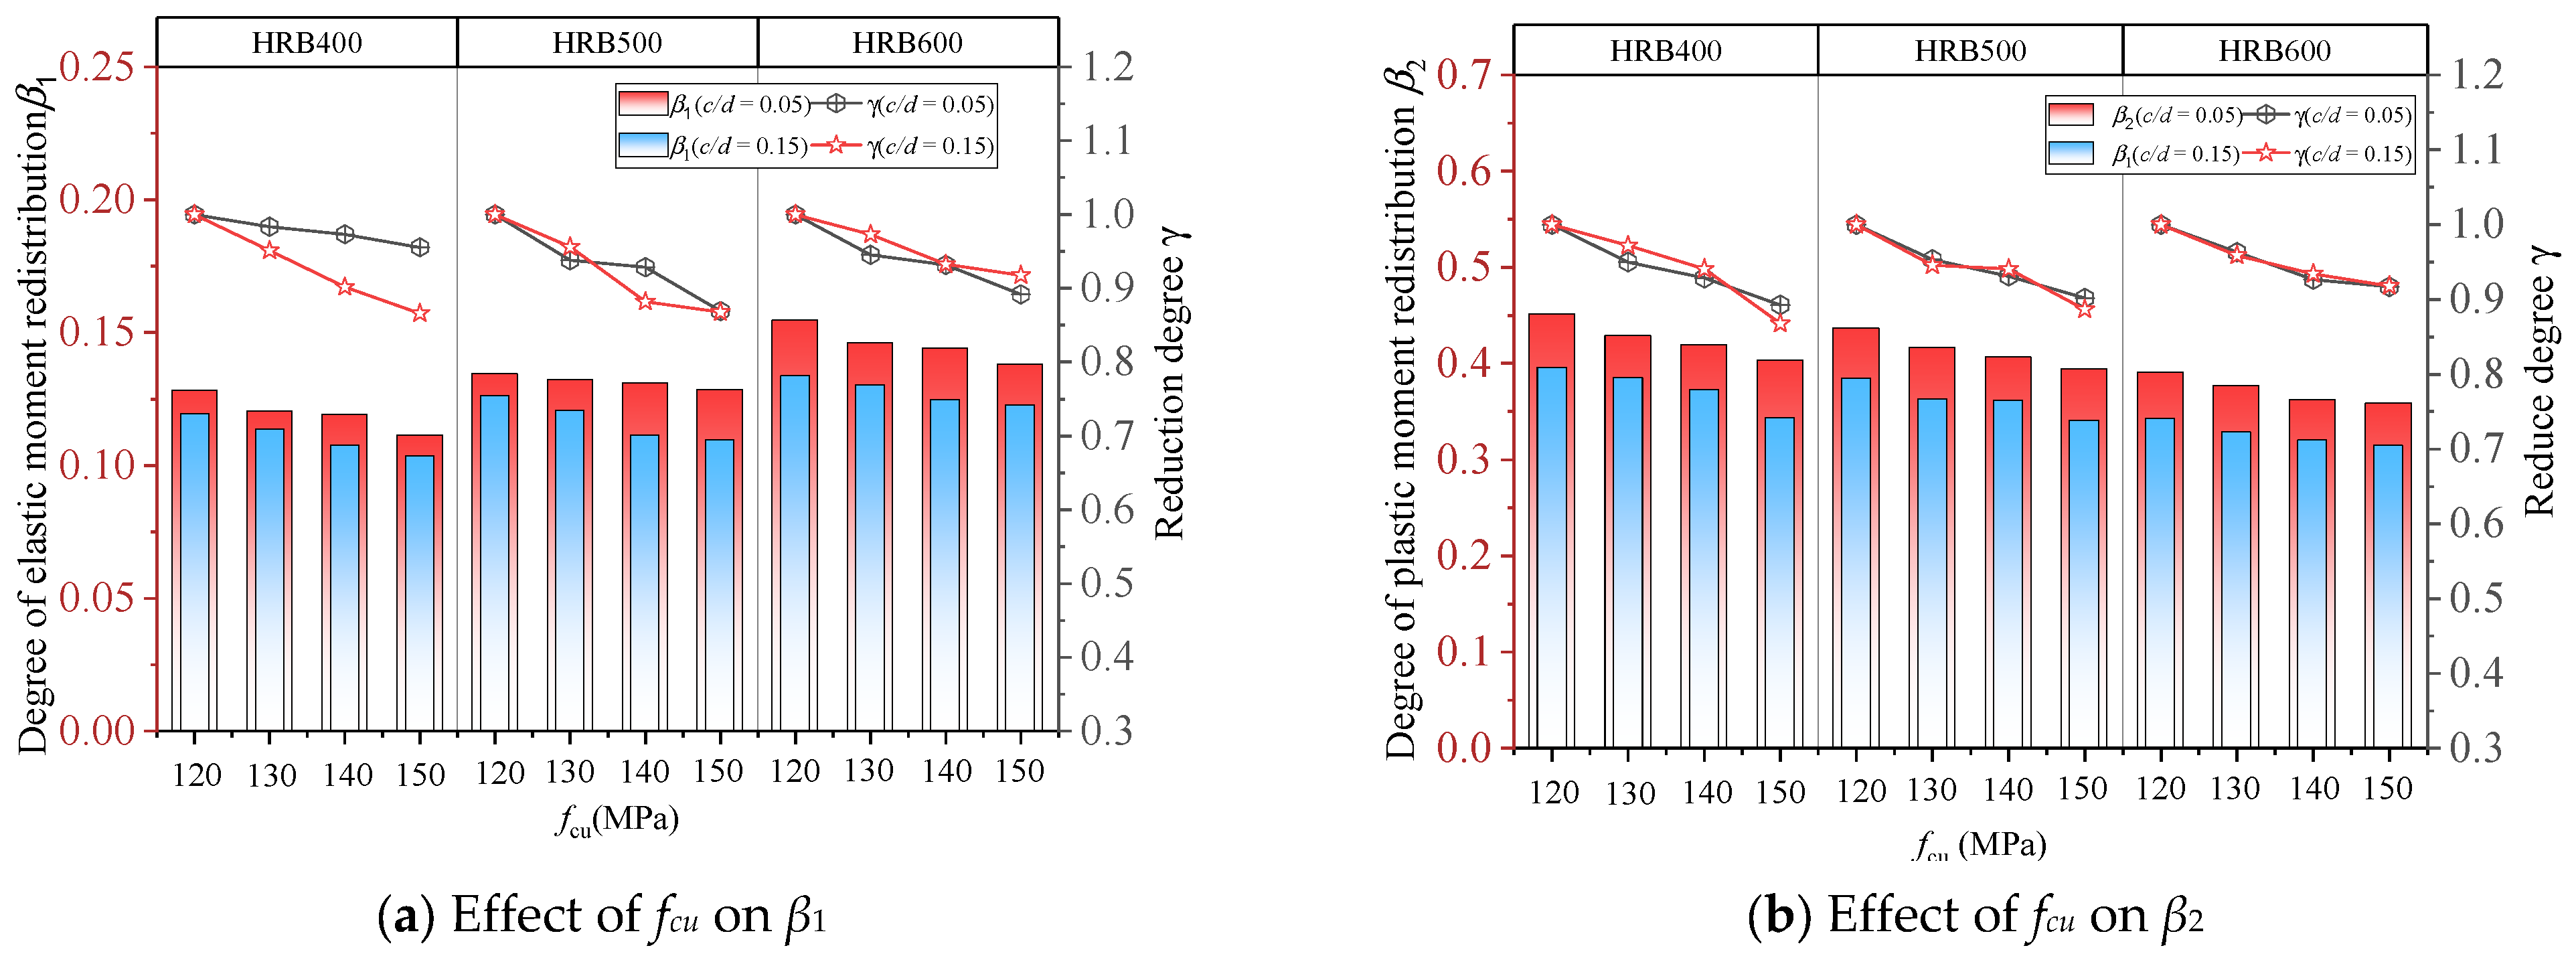
4.1. Effect of UHPC Strength Grade fcu

To analyze the degrees of two-stage moment redistribution in UHPC continuous beam, six groups (24) of simulated UHPC beams with concrete strength grades ranging from UHC120 to UHC150 were compared. Except for the UHPC compressive strength, the control variables of each group were the same, including a cross-sectional dimension of 200 mm × 400 mm, a span-to-depth ratio of 10, tensile longitudinal reinforcement grade of HRB400, HRB500, and HRB600, neutral axis depth factor of 0.05 and 0.15, and single point loading at mid-span. Figure 15a,b demonstrates that as the concrete compressive strength increased, the degrees of elastic moment redistribution β1 and plastic moment redistribution β2 decreased by 8.2~12.8% and 5.1~12.3%, respectively. The reason for the reduction in elastic moment redistribution is that the increased strength of UHPC results in the slower development of concrete cracks, which leads to minimal changes in the relative stiffness of each section of the members. Furthermore, for a given c/d and fy, a higher concrete strength corresponds to greater reinforcement ratios and a weaker ductility of the cross-section, thereby reducing the plastic moment redistribution, as depicted in Figure 15b.

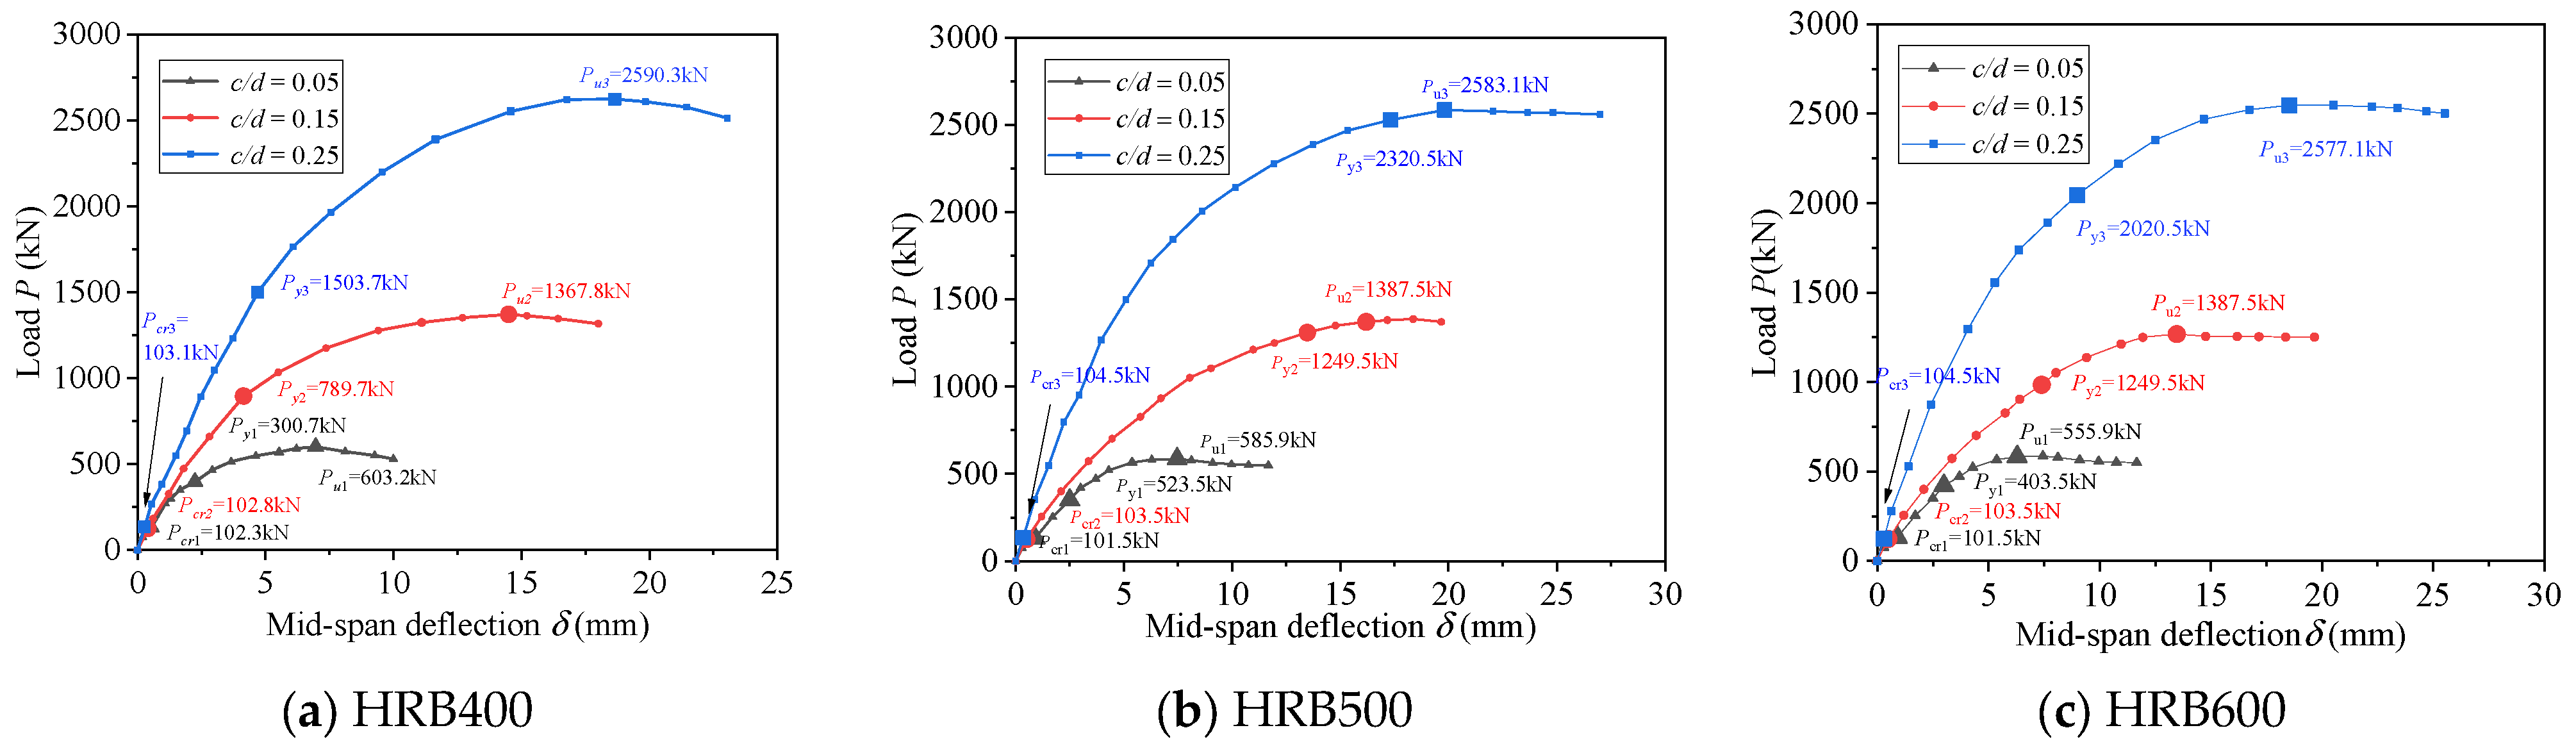
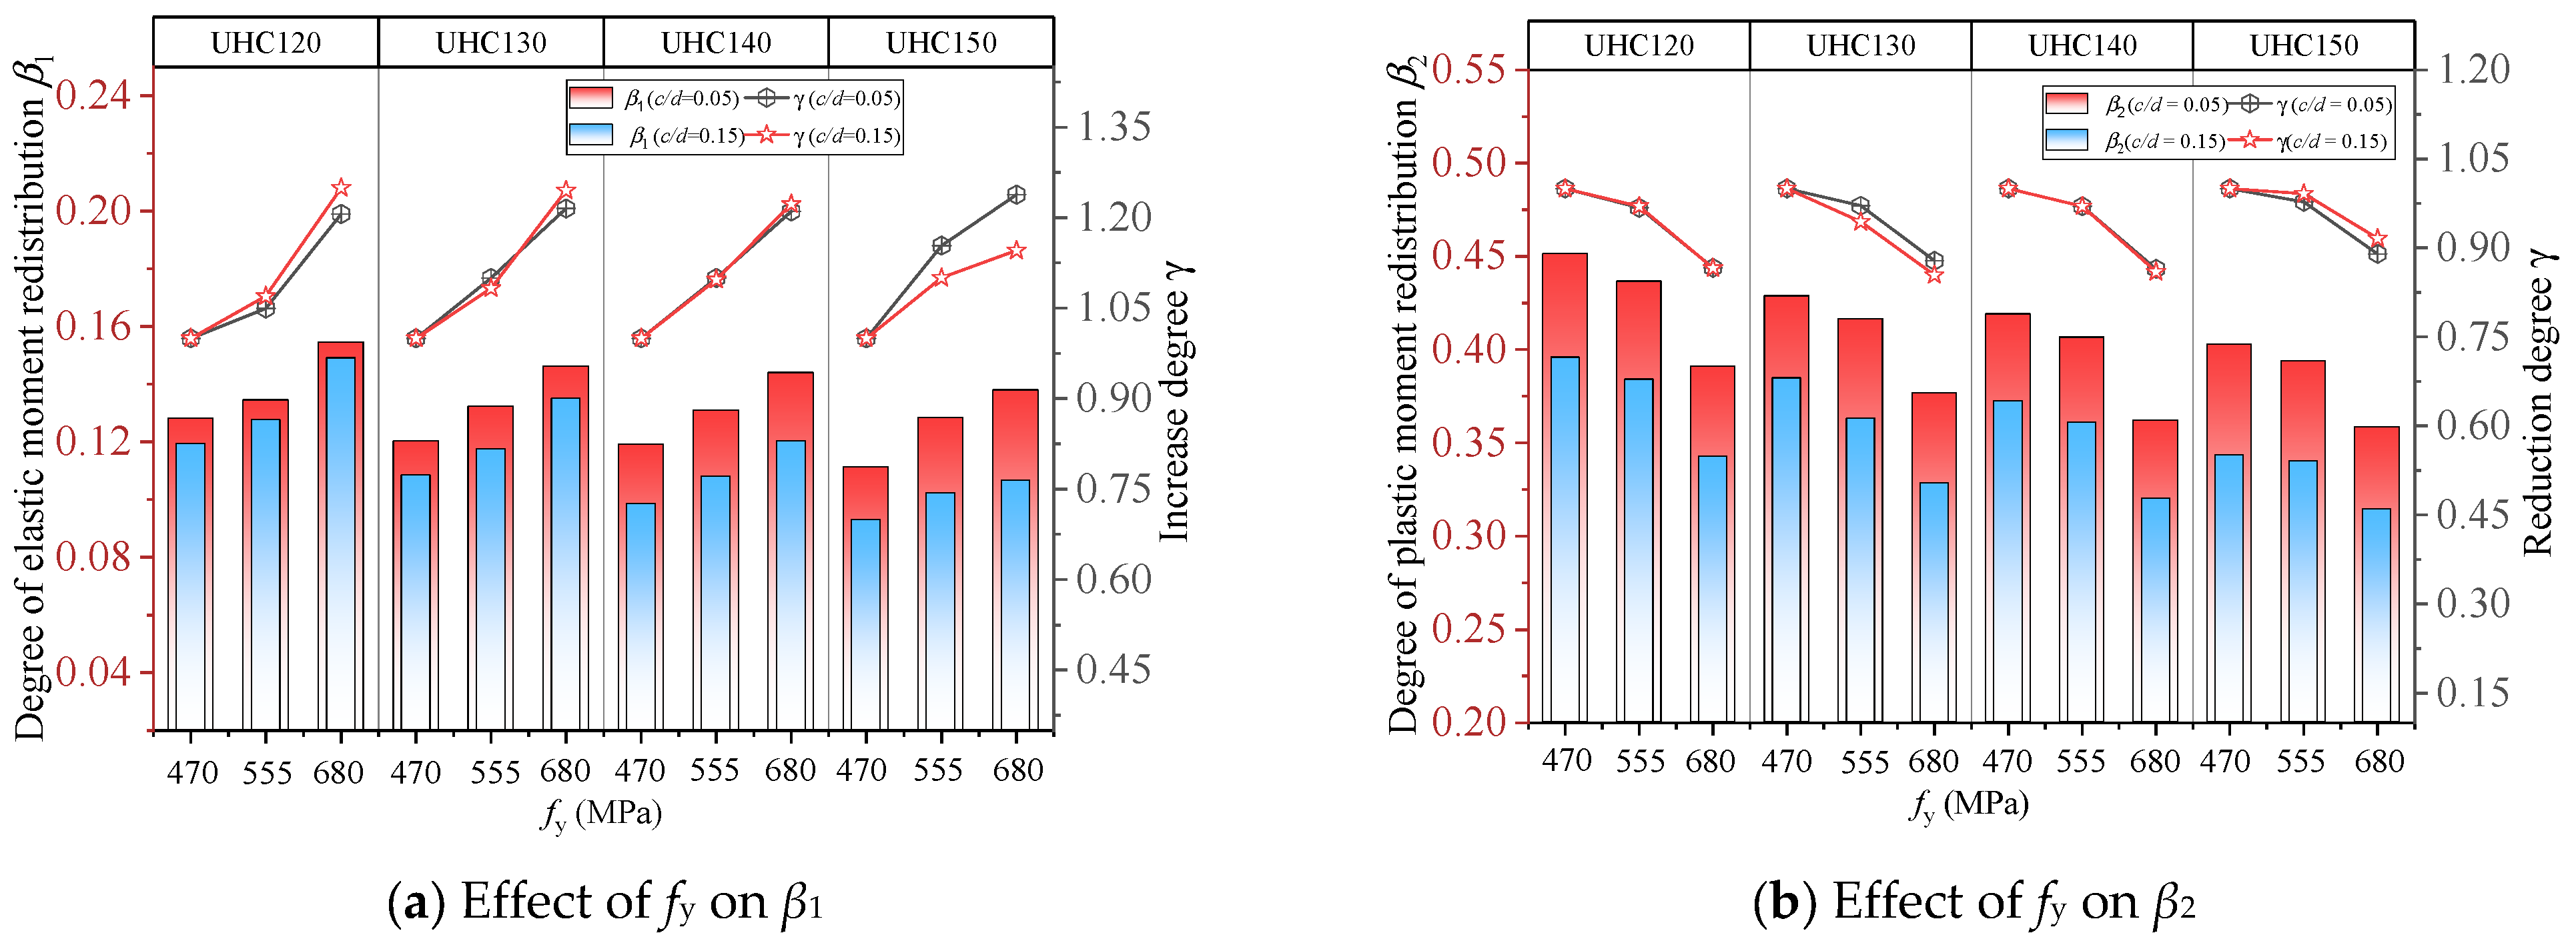
4.2. Effect of Strength Grade of Reinforcement fy

Eight groups (24) of UHPC two-span beams with various strength grades of HRB400, HRB500, and HRB600 were simulated to analyze the effect of the yield strength of reinforcement on the two-stage moment redistribution. The other design variables were constant, including a c/d ratio of 0.05 and 0.15 and UHPC strength grade of UHC120, UHC130, UHC140, and UHC150. As shown in Figure 16, the degree of elastic moment redistribution β1 increased from 6.37% to 25.38% as the yield strength of reinforcement improved from 470 MPa to 680 MPa. It can be interpreted that when the other parameters are constant, an increase in the yield strength of the steel bars may prolong the cracking-to-yielding process of the specimens, which leads to a significant increase in β1. Conversely, a decrease in β2 ranging from 9.8% to 15.9% could be obtained with the improvement in the reinforcement grade, as shown in Figure 16b. At the ultimate limit state, an equivalent ultimate curvature for the section can be achieved with the same ultimate compressive strain and c/d. However, the yield curvature of the section is increased by reinforcement with steel bars with a higher yield strength. Therefore, the plastic curvature and plastic hinge rotation of the cross-section are reduced, leading to a decrease in the degree of plastic moment redistribution.

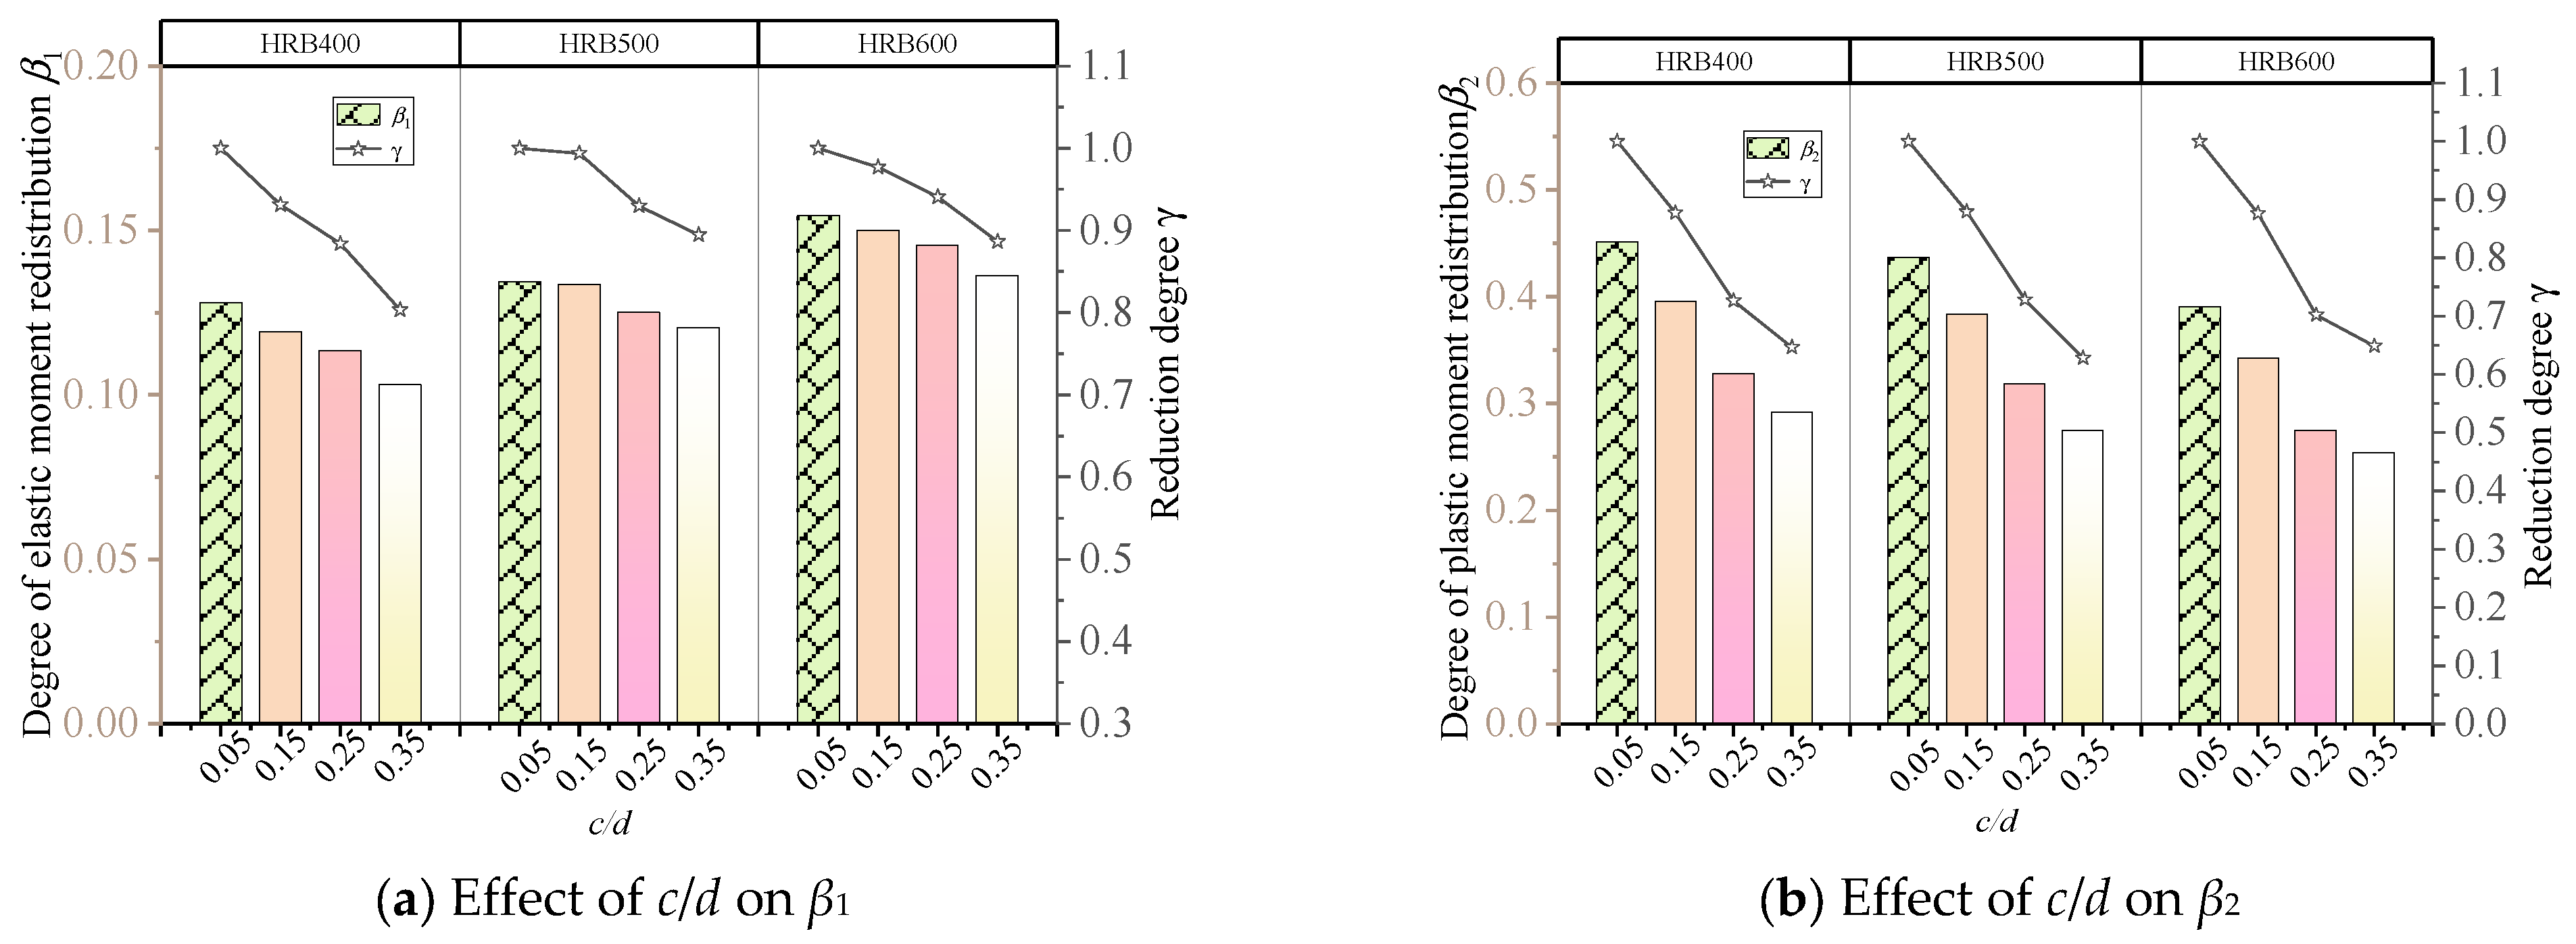
4.3. Effect of Neutral Axis Depth Factor c/d

Figure 17 shows the degrees of two-stage moment redistribution in six groups (24) of simulated beams in which the neutral axis depth factors c/d of the intermediate support section were varied as 0.05, 0.15, 0.25, and 0.35. Each group of specimens shared identical variables except for the differing c/d. It can be observed that both the two stages of moment redistribution decreased with an increase in c/d, which exhibited a reduction of 3.2% to 21.4% in the first stage and 30.4% to 35.6% in the second stage, respectively. This can be attributed to the fact that a larger c/d will weaken the degree of stiffness reduction in cross-section caused by concrete cracking, thus leading to a decline in the elastic moment redistribution when other conditions are constant. Moreover, larger yield curvatures and lower ultimate curvatures will be obtained with an increase in c/d, resulting in a reduction in the rotation capacity of the plastic hinges formed at the intermediate support region, and consequently reducing the degrees of plastic moment redistribution.

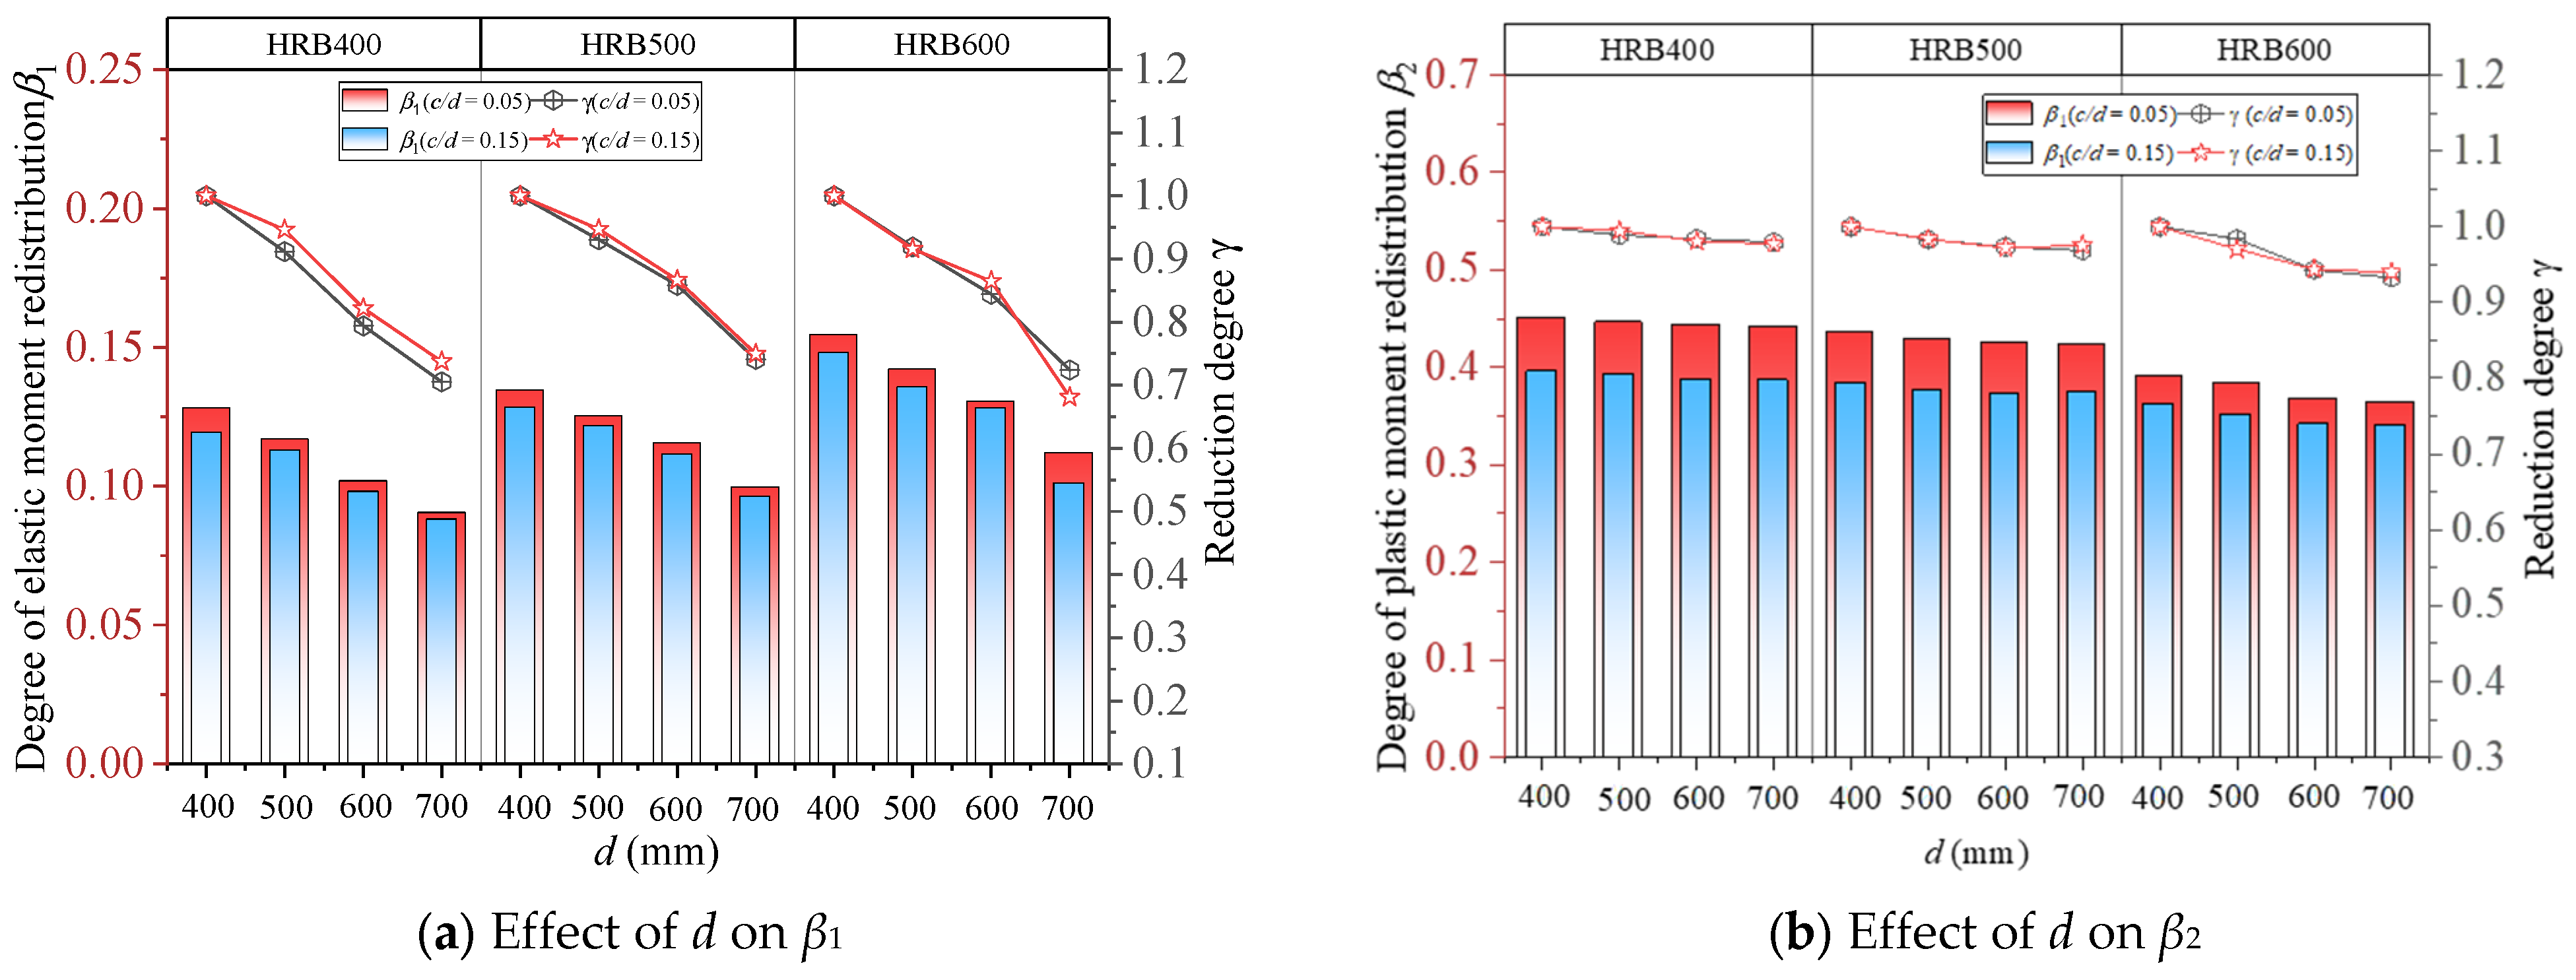
4.4. Effect of Beam Depth d

It is well known that the depth of cross-section d is closely related to the flexural stiffness of the members, which is considered to have an effect on the moment redistribution in continuous beams. In view of this, six groups (24) of simulated beams with varying beam depths at 400 mm, 500 mm, 600 mm, and 700 mm were analyzed. In each comparison group, the span-to-depth ratio, the reinforcement strength grades (e.g., HRB400, HRB500, and HRB600), and the neutral axis depth factor (e.g., 0.05 and 0.15) of the simulated specimens were fixed. In the loading process, the flexural stiffness decreased gradually with the development of concrete cracking and rotation of plastic hinges. However, an increase in the cross-sectional depth resulted in a larger flexural stiffness, which may weaken the effect of stiffness reduction caused by the concrete cracking under the same conditions. Therefore, as shown in Figure 18a,b, when the cross-sectional depth d increased from 400 mm to 700 mm, the elastic moment redistribution β1 and plastic moment redistribution β2 decreased by 25.1% to 31.9% and 1.2% to 8.1%, respectively.

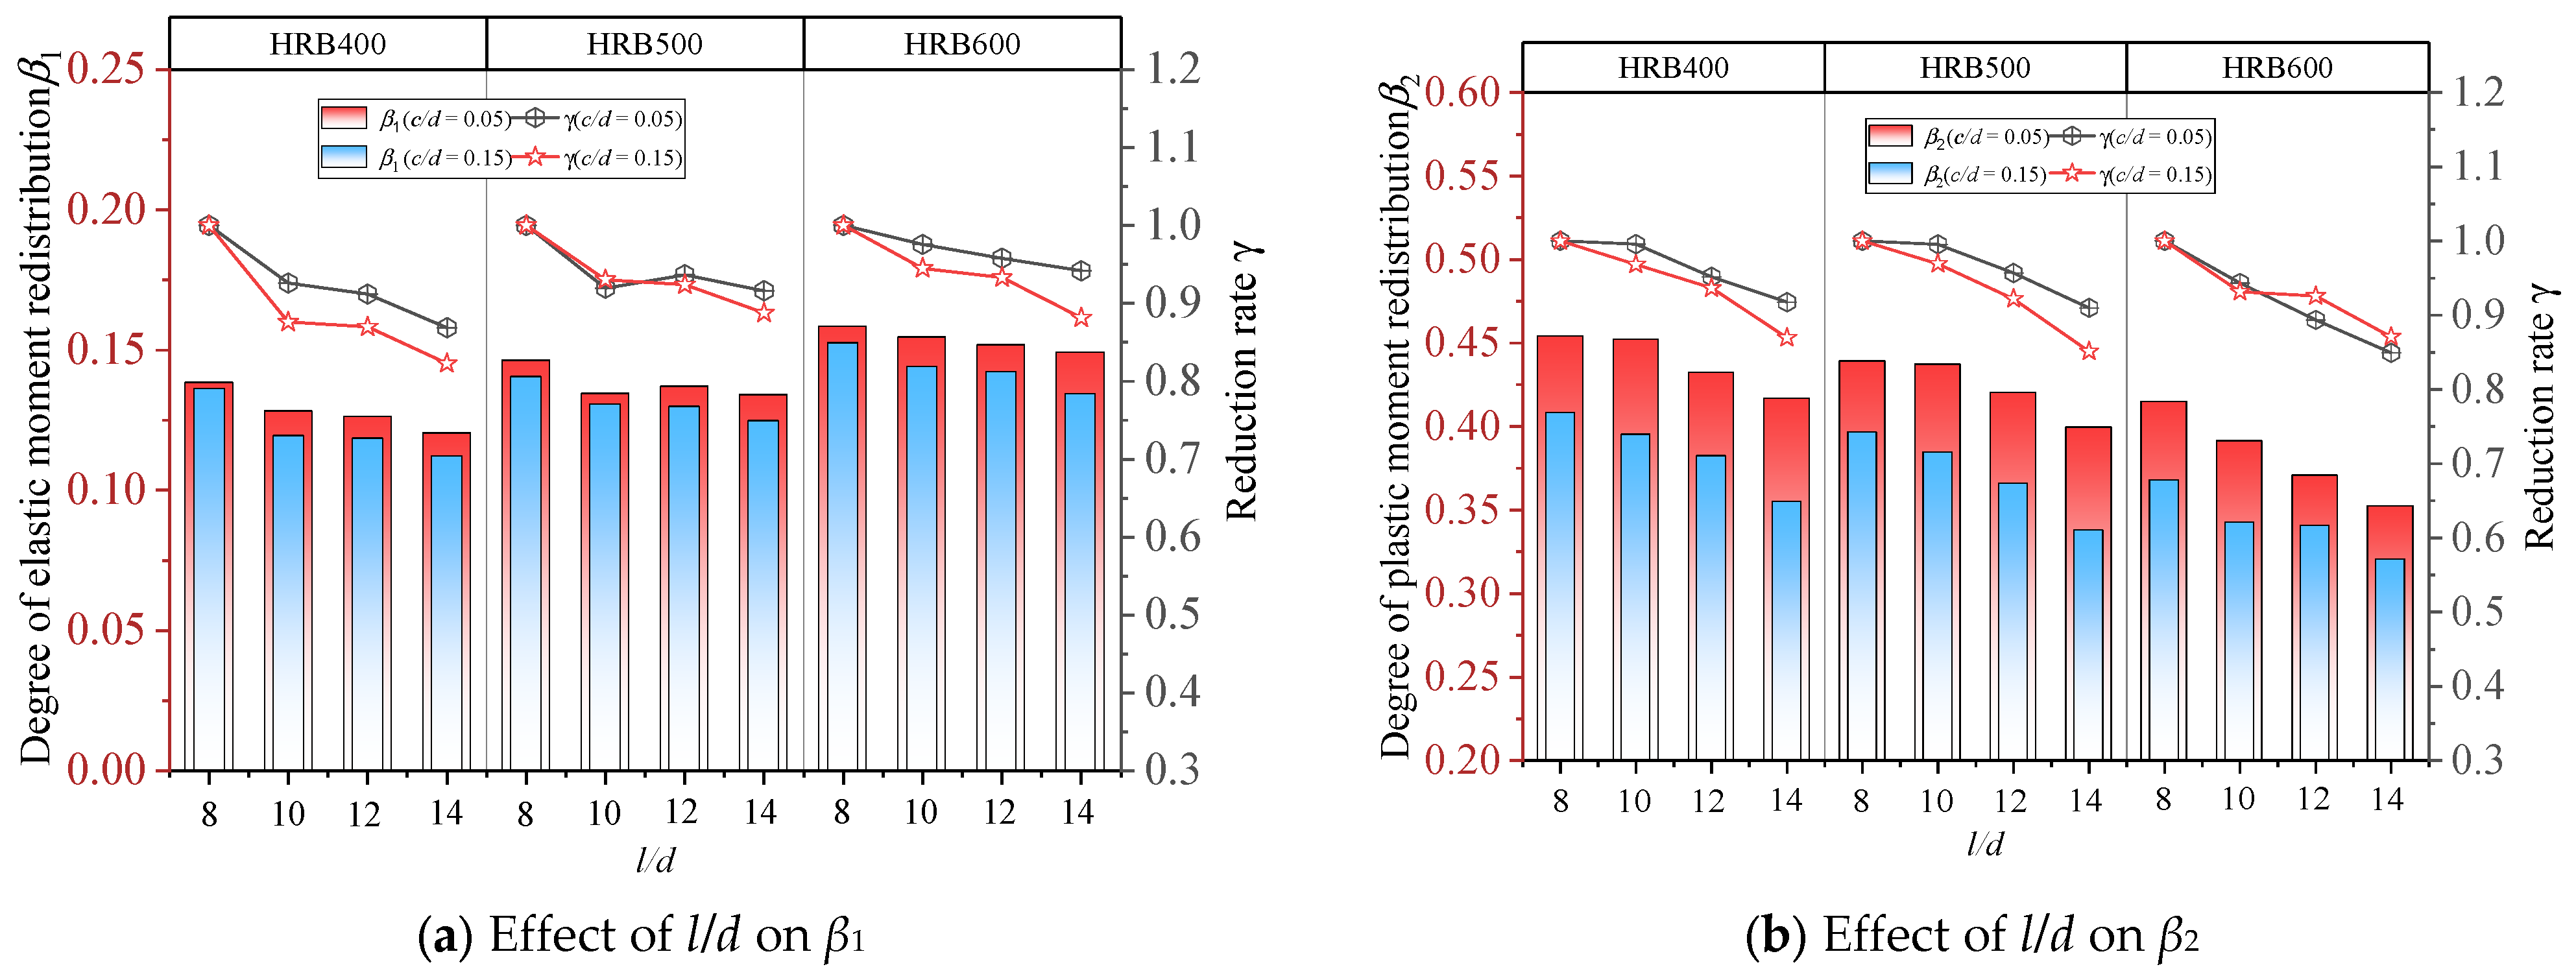
4.5. Effect of Span–Depth Ratio l/d

The span–depth ratio l/d is another factor affecting the ductility of beams. To study the effect of l/d on the moment redistribution in UHPC continuous beams, a comparison between six groups (24) of simulated beams with span–depth ratios of 8, 10, 12, and 14 was conducted while maintaining a constant dimension of the beam section. Theoretically, for the specimens under the same conditions, larger deformations and plastic hinge rotations can be obtained with a greater span–depth ratio, which may be thought to have a beneficial effect on moment redistribution. However, as the span–depth ratio increased from 8 to 14, a decreasing trend in both the elastic and plastic moment redistribution was presented in Figure 19a,b, wherein β1 decreased by 5.25% to 17.85% and β2 decreased by 9.95% to 13.13%. The ultimate bending moments of the specimens in each comparison group were the same due to the identical design parameters of the cross-section. A decrease in the span–depth ratio may increase the variation gradient of bending moments in the beam spans, which contributes to the full development of cracks, thus increasing the elastic moment redistribution. On the other hand, the rotation capacity of the plastic hinge is crucial to the plastic moment redistribution. For a certain plastic rotation capacity, the members with a smaller span–depth ratio can achieve greater moment redistribution than those with a larger span–depth ratio. Therefore, it can be seen that β2 decreased with an increase in l/d even though the specimens with a larger span–depth ratio possess more excellent rotation capacity.

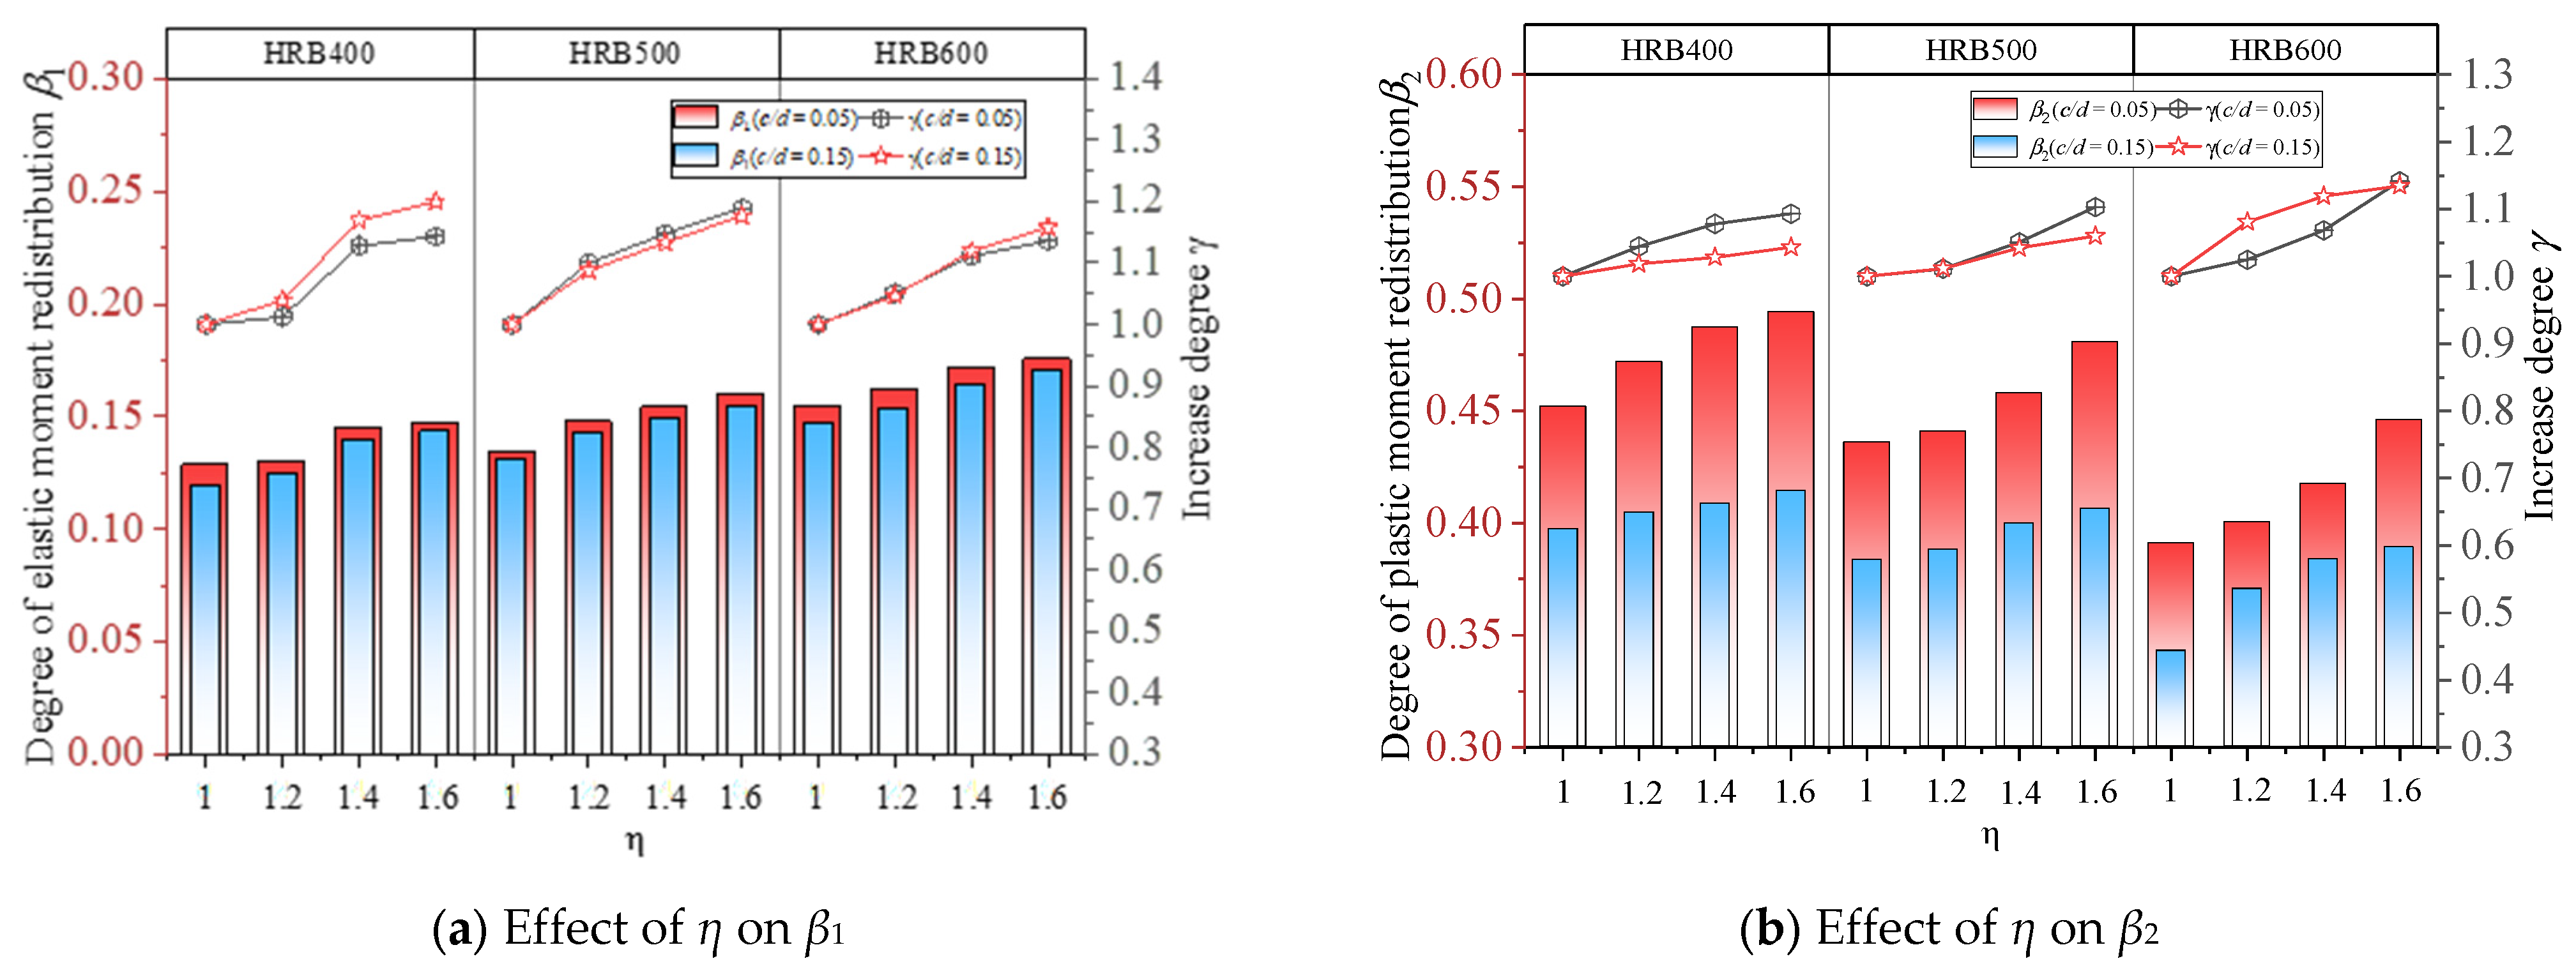
4.6. Effect of Ratio of Longitudinal Reinforcement Ratio between the Mid-Span and Intermediate Support η

Moment redistribution is an overall behavior of continuous beams that is not related to the characteristics of only one critical cross-section. The longitudinal reinforcement ratios between the mid-span and intermediate support η can be used to represent the different reinforcement arrangements in specimens. Figure 20a,b describes the effect of η on the degrees of two-stage moment redistribution in a total of six groups (24) of simulated beams. All the control variables in the selected specimens remained constant, except η varied as 1, 1.2, 1.4, and 1.6, respectively. It can be seen that the degrees of two-stage moment redistribution increased by 13.27% to 20.81% and 4.31% to 13.48%, respectively, as η increased from 1.0 to 1.6. This can be explained when considering that a larger η may lead to a remarkable reduction in stiffness at the intermediate support regions caused by concrete cracking and improve the rotation capacity of the plastic hinges within the intermediate support region, thus increasing the transfer of bending moments from the intermediate support regions to mid-span regions.

4.7. Effect of Load Form

There are various forms of loads subjected to the structures in practical engineering. In this study, 12 groups (36) of UHPC two-span beams with three different load forms, including a single-point load at mid-span, three-point load, and uniform load, were selected for analysis. The other design parameters of the specimens were kept constant. Figure 21a,b illustrates the variations of the two-stage moment redistribution with respect to the load forms. It can be observed that the degrees of elastic and plastic moment redistribution (β1 and β2) decreased sequentially for the UHPC continuous beams subjected to the single-point load, three-point load, and uniform load forms, respectively. The reason for this is that the distributions of bending moments along the beams differ with the different load forms, which leads to a difference in the development of concrete cracks and the behavior of plastic hinges. For the same specimens, the gradients of the bending moments in the beam subjected to the uniform loads were the most gentle, thus resulting in relatively well-distributed cracks and smaller lengths of the plastic hinge region. Therefore, the beams under uniform loads experience the minimum moment redistribution, as shown in Figure 21.

5. Establishment of Prediction Model

Based on the above analysis of 108 simulated UHPC continuous beams, the predicted formula for the degrees of the elastic and plastic moment redistribution can be established by considering the influential factors such as concrete compressive strength fc, yield strength of reinforcement fy, neutral axis depth factor c/d, span-to-depth ratio l/d, the longitudinal reinforcement ratios between the mid-span and intermediate support η, and the loading forms, as shown in the following Equations (7) and (8):
β 1 = α p 1 α s 1 [ 0.033 0.00047 f c 0.073 ( c / d ) + 33.406 / d + 0.382 ( l / d ) 1 + 0.032 η ] × 10 2
β 2 = α p 2 α s 2 [ 0.345 0.00062 f c 0.533 ( c / d ) + 4.829 / d + 0.906 ( l / d ) 1 + 0.063 η ] × 10 2
where αs1 and αs2 are the influence coefficients of reinforcement strength grade on the degree of the two-stage moment redistribution, respectively, and their expressions are as follows:
α s 1 = 0.01 f y 100 + 0.0661
α s 2 = 3.2 f y 100 + 0.4866
where αp1 and αp2 represent the coefficients reflecting the effect of loading forms on the degree of two-stage moment redistribution. For a single point load, αp1 = 1.1, αp2 = 1.05; for a three-point load, αp1 = 1, αp2 = 1; and for a uniform load, αp1 = 0.93, αp2 = 0.96.
The comparisons between the calculated values of Equations (7) and (8) and the simulated values of the degree of two-stage moment redistribution are illustrated in Figure 22. For the degree of elastic moment redistribution (β1), the coefficient of determination R2 for the calculated values is 0.92, for the degree of plastic moment redistribution (β2), the coefficient of determination R2 for the calculated values is 0.96.

6. Comparison of Moment Redistribution in NC Continuous Beams and UHPC Continuous Beams

The degree of the two-stage moment redistribution in continuous beams with normal concrete (NC) and UHPC were compared. The calculation methods suggested in the literature [33] were used for NC continuous beams, and the formulas proposed in this study were applied to UHPC continuous beams. Twelve comparison groups were set up, and the design parameters of the specimens in each comparison group, such as neutral axis depth factor, reinforcement strength grade, span-to-depth ratio, and load form, were the same except for the types of concrete. The comparison results are depicted in Table 11 and Figure 23. It can be concluded that the ratio of the degree of elastic moment redistribution (βu1/βn1) between UHPC continuous beams and normal concrete continuous beams increases from 0.600 to 0.824 as the neutral axis depth factor of the cross-section increases. This can be attributed to the denser matrix and higher tensile strength of UHPC, resulting in less pronounced stiffness changes caused by crack development in UHPC continuous beams, thus leading to a lower degree of elastic moment redistribution compared to conventional concrete continuous beams. The range βu2/βn2, which represents the degree of plastic moment redistribution of UHPC continuous beams relative to conventional concrete continuous beams, varied from 1.075 to 1.996. This is due to the significantly higher ultimate compressive strain (5500 με) of UHPC compared to normal concrete (3300 με), resulting in a larger degree of plastic moment redistribution in control cross-sections of UHPC continuous beams than that observed in normal concrete beams. Except for specimens with a neutral axis depth factor of 0.1 and reinforcement strength grade of HRB400, when considering high-strength reinforcement (400 MPa–600 MPa) and cross-section neutral axis depth factors ranging from 0.1~0.35, the total degree of moment redistribution is greater for UHPC continuous beams than for normal concrete ones. Therefore, the appropriate enhancement of moment redistribution is crucial for the plastic design of UHPC continuous beams incorporating high-strength steel bars, while considering moment redistribution.

7. Conclusions

In this paper, a numerical study of UHPC two-span beams with high-strength reinforcement was carried out by using ABAQUS finite element software. A fine analysis for nine simulated two-span UHPC continuous beams was conducted with a detailed discussion of the failure modes, load-displacement curves, variations of support reaction forces, tensile strains of steel bars, and the whole process of the moment redistribution. Subsequently, the variation rules of the moment redistribution in UHPC continuous beams were explored by an extensive parametric study of 108 simulated beams. The studied parameters included the neutral axis depth factor, concrete strength, yielding strength of reinforcement, beam depth, span–depth ratio, reinforcement ratio between the mid-span and intermediate support section, as well as load forms. Based on the numerical results, new formulas for estimating the two-stage moment redistribution of UHPC continuous beams with high-strength reinforcement were developed. The following conclusions can be drawn:
(1)
For the nine UHPC simulated continuous beams, the simulated values of the intermediate support reaction and end support reaction gradually deviated from those of the elastic theoretical values with the increase in load, indicating that moment redistribution in high-strength reinforced UHPC continuous beams occurs during the whole process of loading. Moreover, the development of moment redistribution was relatively gentle and long before the formation of plastic hinges, of which the degrees were considerable, accounting for 22.2~29.6% of the total moment redistribution. After the formation of the plastic hinges, a rapid increase in the degree of moment redistribution could be captured with the rotation of the plastic hinges. Therefore, two-stage moment redistribution was proposed, namely, elastic moment redistribution and plastic moment redistribution.
(2)
The elastic moment redistribution initiated from UHPC reaching tensile plasticity and evolved with the development of concrete cracks. An increase in the yield strength of the reinforcement and the ratio of the reinforcement between the mid-span and intermediate support led to a higher degree of elastic moment redistribution. Moreover, increasing the neutral axis depth factor, concrete compressive strength, span-to-depth ratio, and beam depth had an adverse effect on elastic moment redistribution.
(3)
The plastic hinges were first formed at the intermediate support regions where the tensile rebar strains exhibited a concentrated increase. With an increase in the neutral axis depth factor, the plastic hinge lengths and rotations decreased, leading to a decrease in plastic moment redistribution. Additionally, the degrees of plastic moment redistribution decreased with the increase in the span-to-depth ratio and yield strength of the reinforcement.
(4)
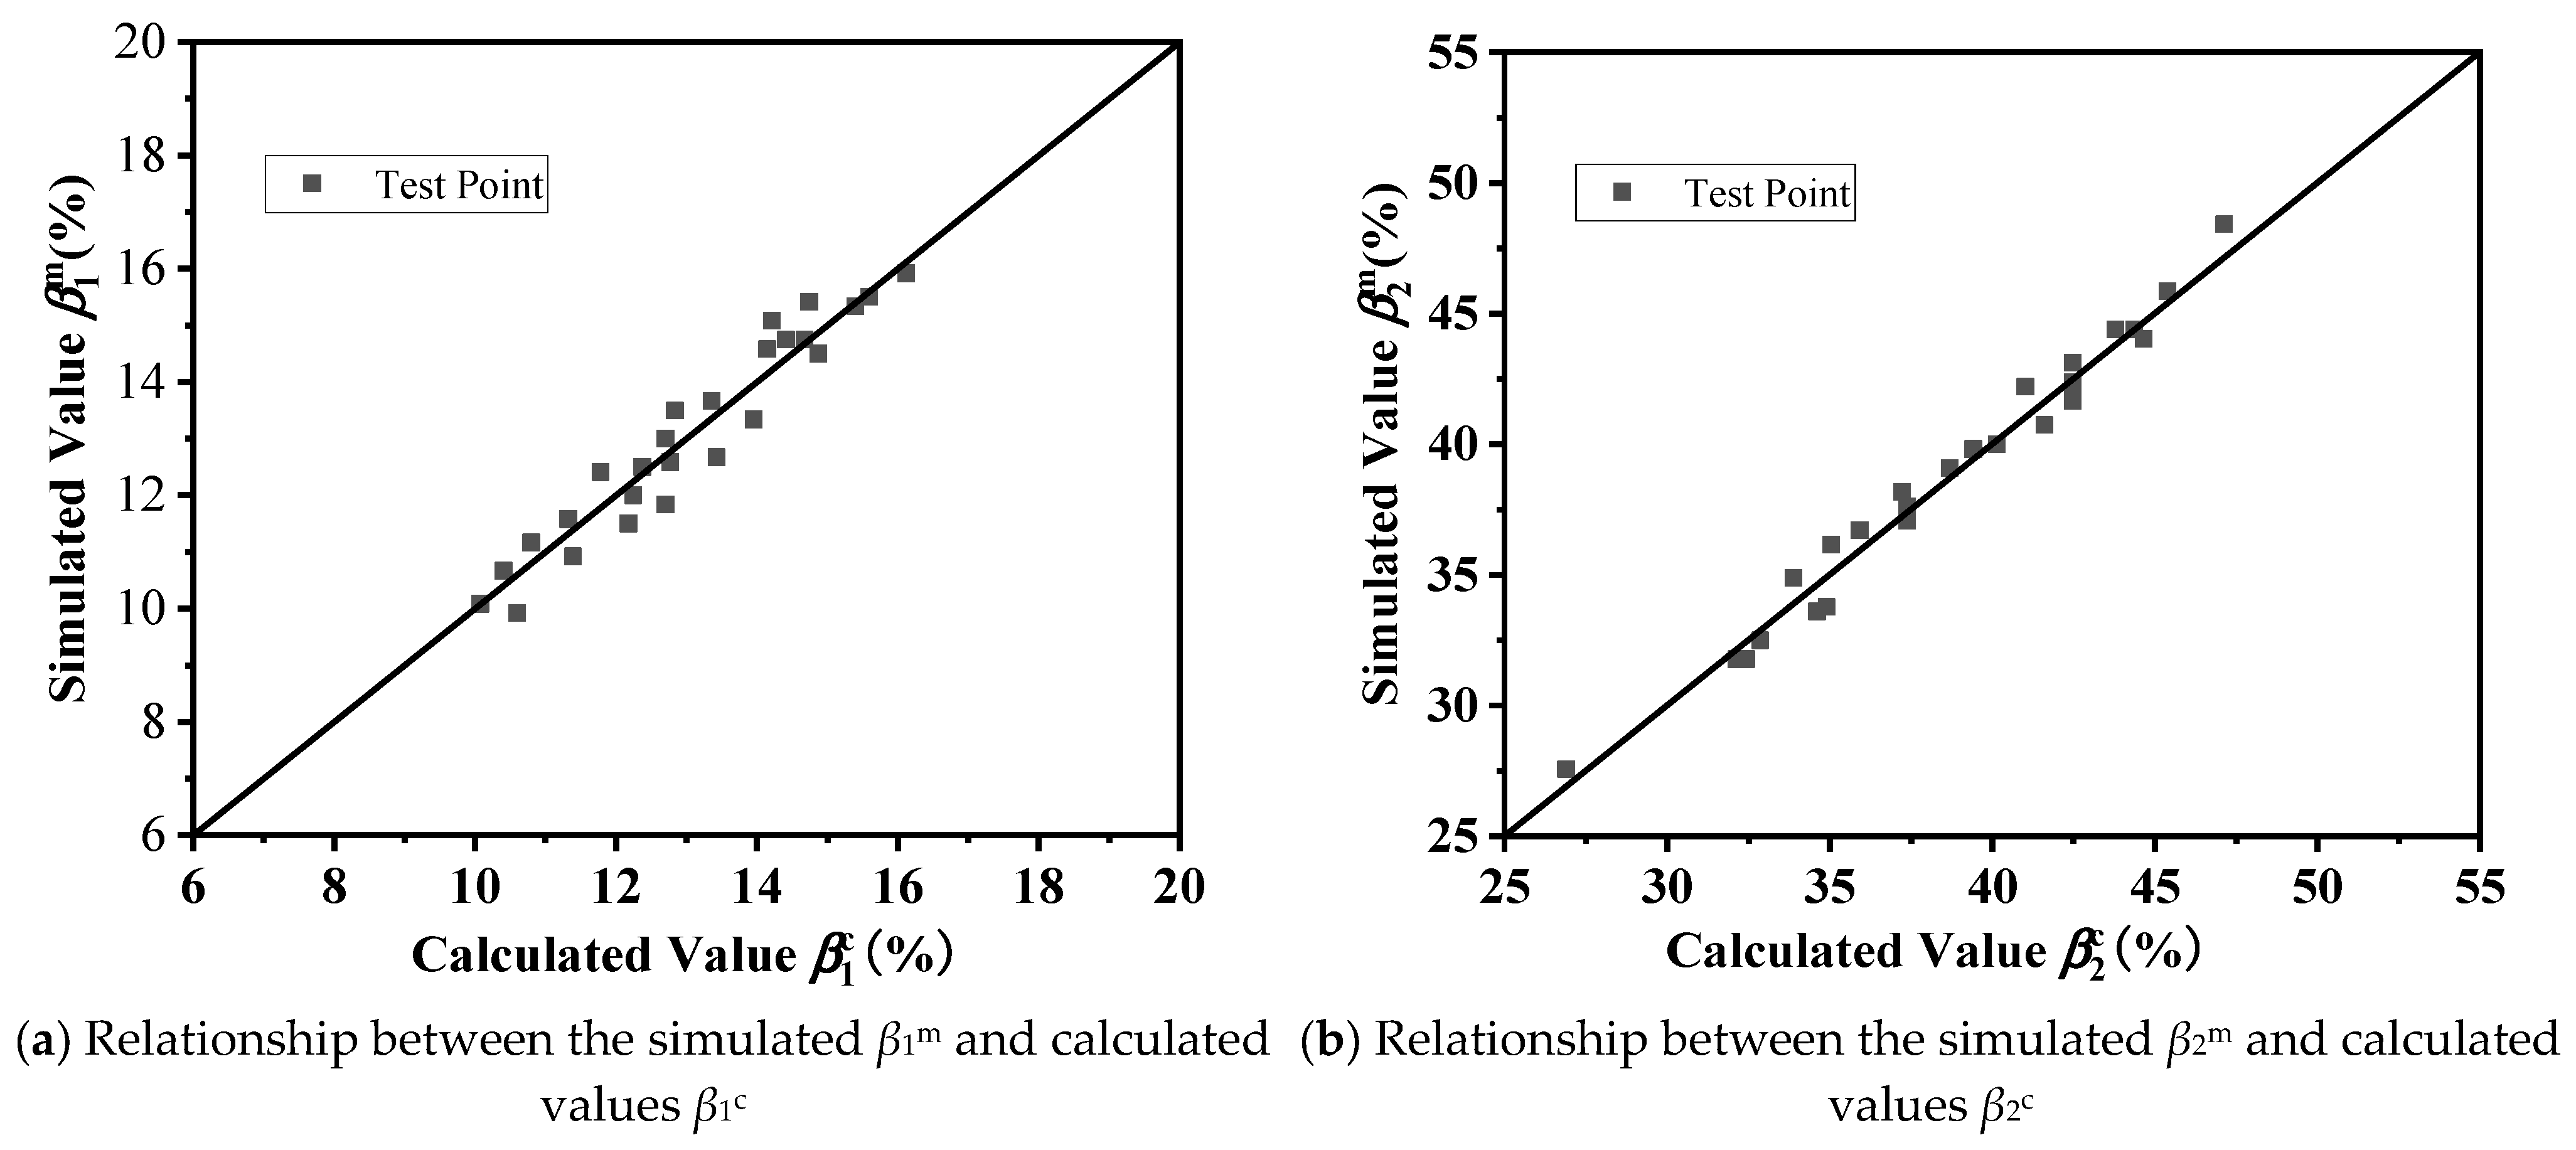
Based on the above parametric finite element analysis results, formulas for calculating the degrees of elastic and plastic moment redistribution were established for high-strength reinforced UHPC continuous beams under different loading conditions using each key parameter as an independent variable.
(5)
Compared to normal concrete beams in identical conditions, the elastic moment distribution in UHPC two-span continuous beams was comparatively smaller while the plastic moment distribution was relatively larger. Overall, due to the high ductility of UHPC, the degrees of the total moment distribution in UHPC structures were greater than those of normal concrete structures.

Author Contributions

L.L.: Resources, Supervision, Project administration, Funding acquisition, Visualization, and Writing—review and editing. B.L.: Term, Conceptualization, Methodology, Software, Validation, Formal analysis, Investigation, Data Curation, Writing—original draft, and Writing—review and editing. W.Z.: Conceptualization, Methodology, and Writing—review and editing. All authors have read and agreed to the published version of the manuscript.

Funding

The authors gratefully acknowledge financial support from the National Natural Science Foundation of China (52208148).

Data Availability Statement

Data are contained within the article.

Conflicts of Interest

The authors declare that they have no known competing financial interests or personal relationships that could appear to influence the work reported in this paper.

References

  1. Roy, D.M. Advanced cement systems including CBC, DSP, MDF. In Proceedings of the 9th International Congress on the Chemistry of Cement, New Delhi, India, 1992; Volume 1, pp. 357–380. [Google Scholar]
  2. Sedran, F.D.L. Optimization of ultra-high-performance concrete by the use of a packing model. Cem. Concr. Res. 1994, 24, 997–1009. [Google Scholar]
  3. Xu, M.; Liang, X.; Wang, P.; Wang, Z. Theoretical investigation on normal section flexural capacity of uhpc beams. Eng. Mech. 2019, 36, 70–78. [Google Scholar]
  4. Azmee, N.M.; Shafiq, N. Ultra-high performance concrete: From fundamental to applications. Case Stud. Constr. Mater. 2018, 9, e00197. [Google Scholar] [CrossRef]
  5. Sohail, M.G.; Kahraman, R.; Al Nuaimi, N.; Gencturk, B.; Alnahhal, W. Durability characteristics of high and ultra-high performance concretes. J. Build. Eng. 2021, 33, 101669. [Google Scholar] [CrossRef]
  6. Abushanab, A.; Alnahhal, W.; Sohail, M.G.; Alnuaimi, N.; Kahraman, R.; Altayeh, N. Mechanical and durability properties of ultra-high performance steel FRC made with discarded materials. J. Build. Eng. 2021, 44, 103264. [Google Scholar] [CrossRef]
  7. Zhang, Y.; Zhu, Y.; Yeseta, M.; Meng, D.; Shao, X.; Dang, Q.; Chen, G. Flexural behaviors and capacity prediction on damaged reinforcement concrete (RC) bridge deck strengthened by ultra-high performance concrete (UHPC) layer. Constr. Build. Mater. 2019, 215, 347–359. [Google Scholar] [CrossRef]
  8. Zhu, Y.; Zhang, Y.; Hussein, H.H.; Chen, G. Numerical modeling for damaged reinforced concrete slab strengthened by ultra-high performance concrete (UHPC) layer. Eng. Struct. 2019, 209, 110031. [Google Scholar] [CrossRef]
  9. Shaikh, F.U.A.; Luhar, S.; Arel, H.Ş.; Luhar, I. Performance evaluation of ultra high performance fiber reinforced concrete—A review. Construct. Build. Mater. 2020, 232, 117152. [Google Scholar] [CrossRef]
  10. Wu, Z.; Shi, C.; He, W.; Wang, D. Uniaxial Compression Behavior of Ultra-High Performance Concrete with Hybrid Steel Fiber. J. Mater. Civ. Eng. 2016, 28, 06016017. [Google Scholar] [CrossRef]
  11. Aboukifa, M.; Moustafa, M.A. Experimental seismic behavior of ultra-high performance concrete columns with high strength steel reinforcement. Eng. Struct. 2021, 232, 111885. [Google Scholar] [CrossRef]
  12. Aydogan, M.S.; Alacali, S.; Arslan, G. Prediction of moment redistribution capacity in reinforced concrete beams using gene expression programming. Structures 2023, 47, 2209–2219. [Google Scholar] [CrossRef]
  13. EN 1992-1-1-2011; Eurocode 2: Design of Concrete Structures: Part 1-1: General Rules and Rules for Buildings. European Committee for Standardization: Brussels, Belgium, 2011.
  14. AS 3600-2018; Concrete Structures. Australia Standards: Sydney, Australia, 2018.
  15. BS 8110-1:1997; Structure Use of Concrete. British Standards Institution: London, UK, 1997.
  16. DIN 1045-3; Concrete Reinforced and Prestressed Concrete Structures. German Institute of Standard (Deutesches Institut fur Normung): Berlin, Germany, 2008.
  17. CSA A23.3-19; Design of Concrete Structures. Canadian Standards Association: Toronto, ON, Canada, 2019.
  18. ACI 318-19; Building Code Requirements for Structural Concrete. American Concrete Institute: Farmington Hills, MI, USA, 2019.
  19. CECS 51:93; Design Code for Reinforced Concrete Continuous Beams and Frames Considering Redistribution of Internal Forces. China Planning Press: Beijing, China, 1993.
  20. Zhao, G.Y.; Wu, J.G. Study on the limit of bending moment modulation in reinforced concrete continuous beams. Build. Struct. 1982, 37–42. [Google Scholar]
  21. Li, L.; Wang, K.Y.; Wang, Y. Study on bending moment modulation of high-strength reinforced concrete continuous beams. J. Build. Struct. 2018, 39, 263–271. [Google Scholar]
  22. Xu, J. Study on Reasonable Values of Moment Modulation Coefficients for Reinforced Concrete Frame Beams. Master’s Thesis, Huazhong University of Science and Technology, Wuhan, China, 2013. [Google Scholar]
  23. Kheyroddin, A.; Naderpour, H. Plastic hinge rotation capacity of reinforced concrete beams. Int. J. Civ. Eng. 2007, 5, 30–47. [Google Scholar]
  24. Scott, R.H.; Whittle, R.T. Moment redistribution effects in beams. Mag. Concr. Res. 2005, 57, 9–20. [Google Scholar] [CrossRef]
  25. Mostofinejad, D.; Farahbod, F. Parametric study on moment redistribution in continuous RC beams using ductility demand and ductility capacity concept. Iran. J. Sci. Technol. 2007, 31, 459. [Google Scholar]
  26. Li, L.; Li, B.; Guo, N.; Zheng, W. Experimental and numerical investigations on moment redistribution in reinforced concrete frames subjected to vertical loads. Eng. Struct. 2022, 261, 114289. [Google Scholar] [CrossRef]
  27. Hibbitt, H.D.; Karlsson, B.I.; Sorensen, E.P. ABAQUS User’s Manual; Dassault Systemes Simulia Corp.: Providence, RI, USA, 2011. [Google Scholar]
  28. Guo, X.Y.; Kang, J.F.; Zhu, J.S. Uniaxial Compression Constitutive Relation of Ultra-High-Performance Concrete. J. Southeast Univ. 2017, 47, 369–376. [Google Scholar]
  29. Su, J.Z.; Fu, Y.F.; Huang, Q.W. Bending test and finite element analysis study of reinforced ultra-high performance concrete beams. Sino-Foreign Highw. 2017, 0379, 99–105. [Google Scholar]
  30. Lu, X.Z.; Jiang, J.J. Nonlinear finite element analysis of spatial forces in prestressed steel-concrete composite two-way floor slabs. Ind. Archit. 2003, 33, 57–59. [Google Scholar]
  31. Li, L.; Zheng, W.Z. Tests on plastic properties of continuous beams of reactive powder concrete. J. Harbin Inst. Technol. 2010, 42, 193–199. [Google Scholar]
  32. GB 50010-2010; Code for Design of Concrete Structures. China Construction Industry Press: Beijing, China, 2010.
  33. Li, L. Study of moment redistribution in continuous beams and frames with high-strength hot-rolled steel bars as tensile longitudinal bars. Harbin Inst. Technol. 2019. [Google Scholar] [CrossRef]
Figure 1. Continuous beam simulation diagram.
Buildings 14 00149 g001
Figure 2. Stress–strain relationship in the CDP model.
Buildings 14 00149 g002
Figure 3. Stress–strain curve of reinforcement.
Buildings 14 00149 g003
Figure 4. Boundary conditions of the simulated beam.
Buildings 14 00149 g004
Figure 5. Configuration of the beam section reinforcement of LL-1.
Buildings 14 00149 g005
Figure 6. Continuous beam test device diagram.
Buildings 14 00149 g006
Figure 7. Comparisons between the LL–1beam damages obtained from the experiments and FE simulation.
Buildings 14 00149 g007
Figure 8. Comparisons of load-displacement curves.
Buildings 14 00149 g008
Figure 9. Details of the specimen L-1 (mm).
Buildings 14 00149 g009
Figure 10. DAMAGET Cloud Map.
Buildings 14 00149 g010
Figure 11. Load-displacement curves for UHPC continuous beams.
Buildings 14 00149 g011
Figure 12. Comparison between the elastic theoretical values and simulated values of the intermediate support reaction and end support reaction.
Buildings 14 00149 g012aBuildings 14 00149 g012b
Figure 13. The variation in the tensile strains of UHPC continuous beams.
Buildings 14 00149 g013
Figure 14. The relationship between the simulated moment Mi and the degree of total moment redistribution β.
Buildings 14 00149 g014
Figure 15. Variation in the two-stage moment redistribution with fcu.
Buildings 14 00149 g015
Figure 16. Variation in the two-stage moment redistribution with fy.
Buildings 14 00149 g016
Figure 17. Variation of the two-stage moment redistribution with c/d.
Buildings 14 00149 g017
Figure 18. Variation in the two-stage moment redistribution with d.
Buildings 14 00149 g018
Figure 19. Variation in the two-stage moment redistribution with l/d.
Buildings 14 00149 g019
Figure 20. Variation in the two-stage moment redistribution with η.
Buildings 14 00149 g020
Figure 21. Variation in the two-stage moment redistribution with load form.
Buildings 14 00149 g021
Figure 22. Relationship between the simulated and calculated values of β1 and β2.
Buildings 14 00149 g022
Figure 23. Relationship between the concrete type and β1, β2. Note: S1, S2, and S3 indicate the strength grade of steel reinforcement for HRB400, HRB500, and HRB600, respectively. S1-0.1 indicates the strength grade of steel reinforcement for HRB400 with a neutral axis depth factor of 0.1.
Buildings 14 00149 g023
Table 1. Summary of the influencing factors of moment redistribution.
fcfyc/ddl/dηLoading Form
D Farahbod F et al. (2007) [25]
Zhao G Y et al. (1982) [20]
Li L et al. (2018) [21]
Xu J et al. (2013) [22]
Kheyroddin A et al. (2007) [23]
Scott R H et al. (2005) [24]
EN 1992-1-1:2011 [13]
AS 3600-2018 [14]
BS 8100-1:97 [15]
DIN 1045-3: 2008 [16]
CSA-A23.3-19 [17]
ACI 318-19 [18]
CECS 51-93 [19]
Note: “✓ “ reflects the influences on the degree of moment redistribution that have been researched in the literature. Fc: concrete strength grade; fy: yielding strength of reinforcement; c/d: neutral axis depth factor of the intermediate support section; d: depth of the beam section; l/d: span–depth ratio; and η: ratio of the longitudinal reinforcement ratio between the mid-span and intermediate support.
Table 2. The CDP model damage parameters.
ψeσb0/σb0Kcμ
36°0.11.160.66670.001
Table 3. Reinforcement configuration parameters.
Specimens
No.
Beam Length (mm)Section Size (mm)Longitudinal Steel Bars in Intermediate SupportMid-Span Longitudinal BarsStirrups
LL-13400180 × 2201Buildings 14 00149 i00314 + 2Buildings 14 00149 i003223Buildings 14 00149 i00322Buildings 14 00149 i00212@80
LL-23400180 × 2202Buildings 14 00149 i003223Buildings 14 00149 i00322Buildings 14 00149 i00212@80
LL-33400180 × 2202Buildings 14 00149 i003183Buildings 14 00149 i00322Buildings 14 00149 i00212@80
LL-43400180 × 2202Buildings 14 00149 i003143Buildings 14 00149 i00322Buildings 14 00149 i00212@80
LL-53400180 × 2202Buildings 14 00149 i002103Buildings 14 00149 i00322Buildings 14 00149 i00212@80
Note: Buildings 14 00149 i001, Buildings 14 00149 i002, and Buildings 14 00149 i003 are HPB235, HRB335, and HRB400 grade steel bars according to the Code for the design of concrete structures [32].
Table 4. UHPC material properties.
Compressive/Tensile Strength (MPa)Elastic Modulus (MPa)Peak Strain (με)Ultimate Strain (με)
Compression10241,23735605500
Tension10.19249
Table 5. Mechanical properties of rebar.
RebarBuildings 14 00149 i0016Buildings 14 00149 i00210Buildings 14 00149 i00212Buildings 14 00149 i00314Buildings 14 00149 i00318Buildings 14 00149 i00322
Yield strength fy (N·mm−2)275.0356.0364.0476.5467.6478.3
Ultimate strength fu (N·mm−2)310.5560.0578.0615.6624.7613.2
Yield strain εy (με)131017562401210023802163
Table 6. Comparisons of the ultimate load between the test values and simulated values.
Specimens
No.
Test Value in Left Span
PuL (kN)
Test Value in Right Span
PuR (kN)
Value of Simulation Ps (kN)Maximum Error (%)
LL-13483603634.31
LL-23173423448.52
LL-33013223226.98
LL-430026330315.21
LL-52852852953.51
Table 7. Design parameters of UHPC continuous beams.
SpecimenSteel
Grade
c/dArea of Longitudinal Reinforcement for Center Support AS1 (mm2)Area of Longitudinal Reinforcement in Span AS2 (mm2)
0.05A-UHC150-400-10-1-①HRB4000.05506506
0.05B-UHC150-400-10-1-①HRB5000.05405405
0.05C-UHC150-400-10-1-①HRB6000.05337337
0.15A-UHC150-400-10-1-①HRB4000.1522932293
0.15B-UHC150-400-10-1-①HRB5000.1518361836
0.15C-UHC150-400-10-1-①HRB6000.1515771577
0.25A-UHC150-400-10-1-①HRB4000.2539653965
0.25B-UHC150-400-10-1-①HRB5000.2532353235
0.25C-UHC150-400-10-1-①HRB6000.2527752775
Table 8. Mechanical properties of the reinforcing steel materials.
Steel GradeYield Strength
fy (MPa)
Tensile Strength
fu (MPa)
Yield Strain εy (με)Elasticity Modulus Es (GPa)
HPB3003865221930200
HRB4004705832300200
HRB5005556952775200
HRB6006808523400200
Table 9. Design parameters of the simulated specimens.
Specimen No.Concrete
Grade
Longitudinal
Reinforcement Grade
Neutral Axis Depth Factor of Critical SectionBeam DepthBeam Span–
Depth Ratio
Longitudinal Reinforcement Ratio between the Mid-Span and Intermediate SupportLoad Form
0.05A-UHC120-400-10-1-①UHC120HRB4000.05400101
0.05B-UHC120-400-10-1-①HRB500
0.05C-UHC120-400-10-1-①HRB600
0.15A-UHC120-400-10-1-①HRB4000.15
0.15B-UHC120-400-10-1-①HRB500
0.15C-UHC120-400-10-1-①HRB600
0.05A-UHC130-400-10-1-①UHC130HRB4000.05400101
0.05B-UHC130-400-10-1-①HRB500
0.05C-UHC130-400-10-1-①HRB600
0.15A-UHC130-400-10-1-①HRB4000.15
0.15B-UHC130-400-10-1-①HRB500
0.15C-UHC130-400-10-1-①HRB600
0.05A-UHC140-400-10-1-①UHC140HRB4000.05400101
0.05B-UHC140-400-10-1-①HRB500
0.05C-UHC140-400-10-1-①HRB600
0.15A-UHC140-400-10-1-①HRB4000.15
0.15B-UHC140-400-10-1-①HRB500
0.15C-UHC140-400-10-1-①HRB600
0.05A-UHC150-400-10-1-①UHC150HRB4000.05400101
0.05B-UHC150-400-10-1-①HRB500
0.05C-UHC150-400-10-1-①HRB600
0.15A-UHC150-400-10-1-①HRB4000.15
0.15B-UHC150-400-10-1-①HRB500
0.15C-UHC150-400-10-1-①HRB600
0.25A-UHC120-400-10-1-①UHC120HRB4000.25400101
0.25B-UHC120-400-10-1-①HRB500
0.25C-UHC120-400-10-1-①HRB600
0.35A-UHC120-400-10-1-①HRB4000.35
0.35B-UHC120-400-10-1-①HRB500
0.35C-UHC120-400-10-1-①HRB600
0.05A-UHC100-500-10-1-①UHC120HRB4000.05500101
0.05B-UHC120-500-10-1-①HRB500
0.05C-UHC120-500-10-1-①HRB600
0.15A-UHC100-500-10-1-①HRB4000.15
0.15B-UHC120-500-10-1-①HRB500
0.15C-UHC120-500-10-1-①HRB600
0.05A-UHC120-600-10-1-①UHC120HRB4000.05600101
0.05B-UHC120-600-10-1-①HRB500
0.05C-UHC120-600-10-1-①HRB600
0.15A-UHC120-600-10-1-①HRB4000.15
0.15B-UHC120-600-10-1-①HRB500
0.5C-UHC120-600-10-1-①HRB600
0.05A-UHC120-700-10-1-①UHC120HRB4000.05700101
0.05B-UHC120-700-10-1-①HRB500
0.05C-UHC120-700-10-1-①HRB600
0.15A-UHC120-700-10-1-①HRB4000.15
0.15B-UHC120-700-10-1-①HRB500
0.15C-UHC120-700-10-1-①HRB600
0.05A-UHC120-400-8-1-①UHC120HRB4000.0540081
0.05B-UHC120-400-8-1-①HRB500
0.05C-UHC120-400-8-1-①HRB600
0.15A-UHC120-400-8-1-①HRB4000.15
0.15B-UHC120-400-8-1-①HRB500
0.15C-UHC120-400-8-1-①HRB600
0.05A-UHC120-400-12-1-①UHC120HRB4000.05400121
0.05B-UHC120-400-12-1-①HRB500
0.05C-UHC120-400-12-1-①HRB600
0.15A-UHC120-400-12-1-①HRB4000.15
0.15B-UHC120-400-12-1-①HRB500
0.15C-UHC120-400-12-1-①HRB600
0.05A-UHC120-400-14-1-①UHC120HRB4000.05400141
0.05B-UHC120-400-14-1-①HRB400
0.05C-UHC120-400-14-1-①HRB400
0.15A-UHC120-400-14-1-①HRB4000.15
0.15B-UHC120-400-14-1-①HRB400
0.15C-UHC120-400-14-1-①HRB400
0.05A-UHC120-400-10-1.2-①UHC120HRB4000.05400101.2
0.05B-UHC120-400-10-1.2-①HRB500
0.05C-UHC120-400-10-1.2-①HRB600
0.15A-UHC120-400-10-1.2-①HRB4000.15
0.15B-UHC120-400-10-1.2-①HRB500
0.15C-UHC120-400-10-1.2-①HRB600
0.05A-UHC120-400-10-1.4-①UHC120HRB4000.05400101.4
0.05B-UHC120-400-10-1.4-①HRB500
0.05C-UHC120-400-10-1.4-①HRB600
0.15A-UHC120-400-10-1.4-①HRB4000.15
0.15B-UHC120-400-10-1.4-①HRB500
0.15C-UHC120-400-10-1.4-①HRB600
0.05A-UHC120-400-10-1.6-①UHC120HRB4000.05400101.6
0.05B-UHC120-400-10-1.6-①HRB500
0.05C-UHC120-400-10-1.6-①HRB600
0.15A-UHC120-400-10-1.6-①HRB4000.15
0.15B-UHC120-400-10-1.6-①HRB500
0.15C-UHC120-400-10-1.6-①HRB600
0.05A-UHC120-400-10-1-②UHC120HRB4000.05400101
0.05B-UHC120-400-10-1-②HRB500
0.05C-UHC120-400-10-1-②HRB600
0.15A-UHC120-400-10-1-②HRB4000.15
0.15B-UHC120-400-10-1-②HRB500
0.15C-UHC120-400-10-1-②HRB600
0.05A-UHC130-400-10-1-②UHC130HRB4000.05400101
0.05B-UHC130-400-10-1-②HRB500
0.05C-UHC130-400-10-1-②HRB600
0.15A-UHC130-400-10-1-②HRB4000.15
0.15B-UHC130-400-10-1-②HRB500
0.15C-UHC130-400-10-1-②HRB600
0.05A-UHC120-400-10-1-③UHC120HRB4000.05400101
0.05B-UHC120-400-10-1-③HRB500
0.05C-UHC120-400-10-1-③HRB600
0.15A-UHC120-400-10-1-③HRB4000.15
0.15B-UHC120-400-10-1-③HRB500
0.15C-UHC120-400-10-1-③HRB600
0.05A-UHC130-400-10-1-③UHC130HRB4000.05400101
0.05B-UHC130-400-10-1-③HRB500
0.05C-UHC130-400-10-1-③HRB600
0.15A-UHC130-400-10-1-③HRB4000.15
0.15B-UHC130-400-10-1-③HRB500
0.15C-UHC130-400-10-1-③HRB600
Table 10. Mechanical properties of UHPC.
Concrete
Grade
Cubic Compressive
Strength
fcu (MPa)
Cylinder Compressive
Strength
fc (MPa)
Tensile
Strength
ft (MPa)
Elasticity Modulus Ec (GPa)
UHC120120105.69.1939.5
UHC130130114.410.141.1
UHC140140123.310.942.6
UHC15015013211.844.2
Note: f c = 0.88 f c u ,   f t = 2.14 f c 0.5 12.8 33, and E c = 3840 f c 0.5 34.
Table 11. Comparison of the degree of moment redistribution between UHPC beams and normal concrete beams.
Specimens No.Strength Grade of Reinforcement fyNeutral Axis Depth Factor c/dNormal ConcreteUHPCβu1/βn1βu2/βn2Total Degree of Moment Redistribution/%
βn1/%βn2/%βu1/%βu2/%Normal ConcreteUHPC
S1-0.1HRB4000.120.0636.3312.3742.350.6251.07556.3954.72
S2-0.1HRB50021.9032.1713.4041.020.6001.17554.0754.42
S3-0.1HRB60024.1527.0715.4336.680.6261.25051.2152.11
S1-0.15HRB4000.1519.3231.2911.9339.580.6171.26550.6151.51
S2-0.15HRB50021.0927.7013.3638.390.6341.38648.7951.75
S3-0.15HRB60023.2523.3115.4034.260.6621.47046.5649.66
S1-0.25HRB4000.2516.9422.9911.3232.780.6681.42639.9344.1
S2-0.25HRB50018.4920.3512.5031.800.6761.56238.8444.3
S3-0.25HRB60020.3917.1314.5327.450.7131.60337.5241.98
S1-0.35HRB4000.3513.3717.0610.2929.180.7701.71130.4339.47
S2-0.35HRB50014.5915.1012.0227.430.8241.81629.6939.45
S3-0.35HRB60016.0912.7112.6125.360.7841.99628.837.97
Note: βn1 represents the degree of elastic moment redistribution of normal concrete, βn2 represents the degree of plastic moment redistribution of normal concrete, βu1 represents the degree of elastic moment redistribution of UHPC, and βu2 represents the degree of plastic moment redistribution of UHPC.
Disclaimer/Publisher’s Note: The statements, opinions and data contained in all publications are solely those of the individual author(s) and contributor(s) and not of MDPI and/or the editor(s). MDPI and/or the editor(s) disclaim responsibility for any injury to people or property resulting from any ideas, methods, instructions or products referred to in the content.

