Article

Fracture Disaster Assessment of Model Concrete Piles in Loess Slope Engineering under Non-Uniform Lateral Loading

1
Institute of Geotechnical Engineering, Xi’an University of Technology, Xi’an 710048, China
2
China Railway Liu Yuan & Xi’an Survey, Design and Research Institute Co., Ltd. of CREC, Xi’an 710054, China
3
School of Management, Xi’an University of Architecture & Technology, Xi’an 710055, China
4
Shaanxi Transportation Holding Group Co., Ltd., Xi’an 710075, China
5
The Second Engineering Co., Ltd. of China Railway 17th Bureau Group, Xi’an 710024, China
*
Author to whom correspondence should be addressed.
Buildings 2024, 14(1), 173; https://doi.org/10.3390/buildings14010173
Submission received: 20 November 2023 / Revised: 19 December 2023 / Accepted: 8 January 2024 / Published: 10 January 2024
(This article belongs to the Section Building Materials, and Repair & Renovation)

Abstract

:
Existing model tests for reinforcing loess slopes with stabilizing piles are often challenged by simulation inaccuracies in lateral loading modes and scaling. Addressing these concerns, this study conducts model tests and numerical simulations to scrutinize the damage characteristics of concrete piles in two varying loess slope conditions under non-uniform lateral loading. The tests were designed to strictly maintain the similarity ratio of the concrete piles. The results reveal a no table 20% reduction in lateral bearing capacity due to the penetration of a potential sliding surface, exacerbating the stress on the piles. Furthermore, compared to uniform loess slopes, the presence of a sliding surface leads to a 38.4% increase in the height of the stress concentration point, resulting in earlier crack formation in the piles. These findings offer substantial theoretical and practical insights, highlighting the critical need for accurate model simulation in slope stabilization research and providing a basis for improving engineering practices.

1. Introduction

The rapid expansion of global infrastructure has led to an increase in slope engineering projects, where anti-slide piles have emerged as a primary solution for slope reinforcement [1,2]. The paramount issue at present is the assurance of slope stability and safety when supported by such piles [3,4], rendering the investigation of the force, deformation, and damage characteristics of stabilizing piles in reinforced slopes of profound theoretical and practical importance.
Field tests have been extensively utilized, as demonstrated by Li et al. [5], who carried out field investigations to deduce the load transfer laws between soil and stabilizing piles and to disclose the distribution of earth pressure on fully embedded stabilizing piles under potential sliding surface conditions. These findings provide a valuable reference for the design of slope reinforcements. Similarly, the interaction between high slopes and long stabilizing piles has been explored by Li et al. [6], offering significant insights into the selection of optimal reinforcement solutions in slope stability.
Despite the reliability of in situ test results, the effective control of slope boundaries remains a challenge. Model tests, being more economical and offering greater boundary control than in situ tests, have been favored by some researchers. These tests, coupled with numerical simulations, have opened up avenues for addressing the complexities of slope stability and the damage characteristics of stabilizing piles under various conditions.
In the realm of model tests, Xin et al. [7] conducted large-scale experiments to determine the damage mechanisms of miniaturized stabilizing piles, contributing valuable insights into the damage processes. Li et al. [8] performed a dynamic centrifuge modeling test using a kind of model concrete pile to study the dynamic crack of the stabilizing pile. Dai et al. [9] proposed a three-dimensional and threefold nonlinear numerical modeling method, and comparisons also show that the computed displacements and maximum moments agreed well with the measurements regardless of whether the pile was working in the elastic or damaged plastic state, and even the advent of cracking was identical with the test. Zhang et al. [10] concluded through centrifugal tests that the bending deformation and failure of stabilizing piles occurred more easily near the sliding zone. Fan et al. [11] investigated the dynamic response of slopes reinforced with double-row stabilizing piles and prestressed anchor cables, highlighting the nuances in load sharing between different stabilizing pile configurations. Centrifugal model tests coupled with numerical analyses by Ren et al. [12] provided a framework for evaluating the stability of natural reinforced soil-filled slopes. Ye et al. [13] revealed support mechanism differences based on pile spacing, enhancing the understanding of reinforcement performance in double-row stabilizing pile systems. Through model testing, Li et al. [14] derived force characteristics of H-type stabilizing piles under curved landslide conditions and proposed a generalized expression for the distribution of landslide thrust behind piles. Liu et al. [15] utilized transparent soil particle velocimetry to disclose deformation processes in slopes reinforced with stabilizing piles, emphasizing the application of single- or double-row piles based on deformation requirements and project importance.
Theoretical and numerical simulations have also played a pivotal role. Zhang et al. [16] focused on the reliability of slopes reinforced with piles, considering the spatial variability of rock parameters. Liu et al. [17] developed a theoretical model to enhance riverbank slope stability by optimizing geogrid and pile reinforcements. Other scholars have investigated the impacts of pile reinforcement on slope stability and seismic performance through numerical simulations, offering practical criteria and recommendations for engineering applications [18,19,20]. Chen et al. [21] analyzed the acceleration response and internal force dynamics within a pile anchor framework, providing suggestions for load sharing in practice.
These studies have significantly advanced the field of slope stability and the mechanics of stabilizing piles. Nevertheless, there remains a dearth of experimental simulation data concerning the fracture behavior of stabilizing piles under stringent scaling conditions. To address this, Li et al. [22] introduced a model concrete pile, validating its seismic dynamic fracture damage characteristics in liquefiable foundations [23], thereby laying the groundwork for the pile models discussed herein.
This paper extends the foundations laid by previous studies to model concrete stabilizing piles in reinforced slopes. The damage mechanism under non-uniform lateral loading and safety evaluation in the presence of a sliding surface are not sufficiently clear, leading to their limited application in model tests. To fill this gap, the current research conducts model tests and numerical simulations of slopes reinforced with model concrete piles under non-uniform lateral loading. The fracture damage characteristics of the piles in the reinforced loess slopes are analyzed, and the influence of potential sliding surfaces on the fracture damage of the piles in slope engineering is evaluated.

2. Model Test of Loess Slope Reinforced by Model Concrete Piles

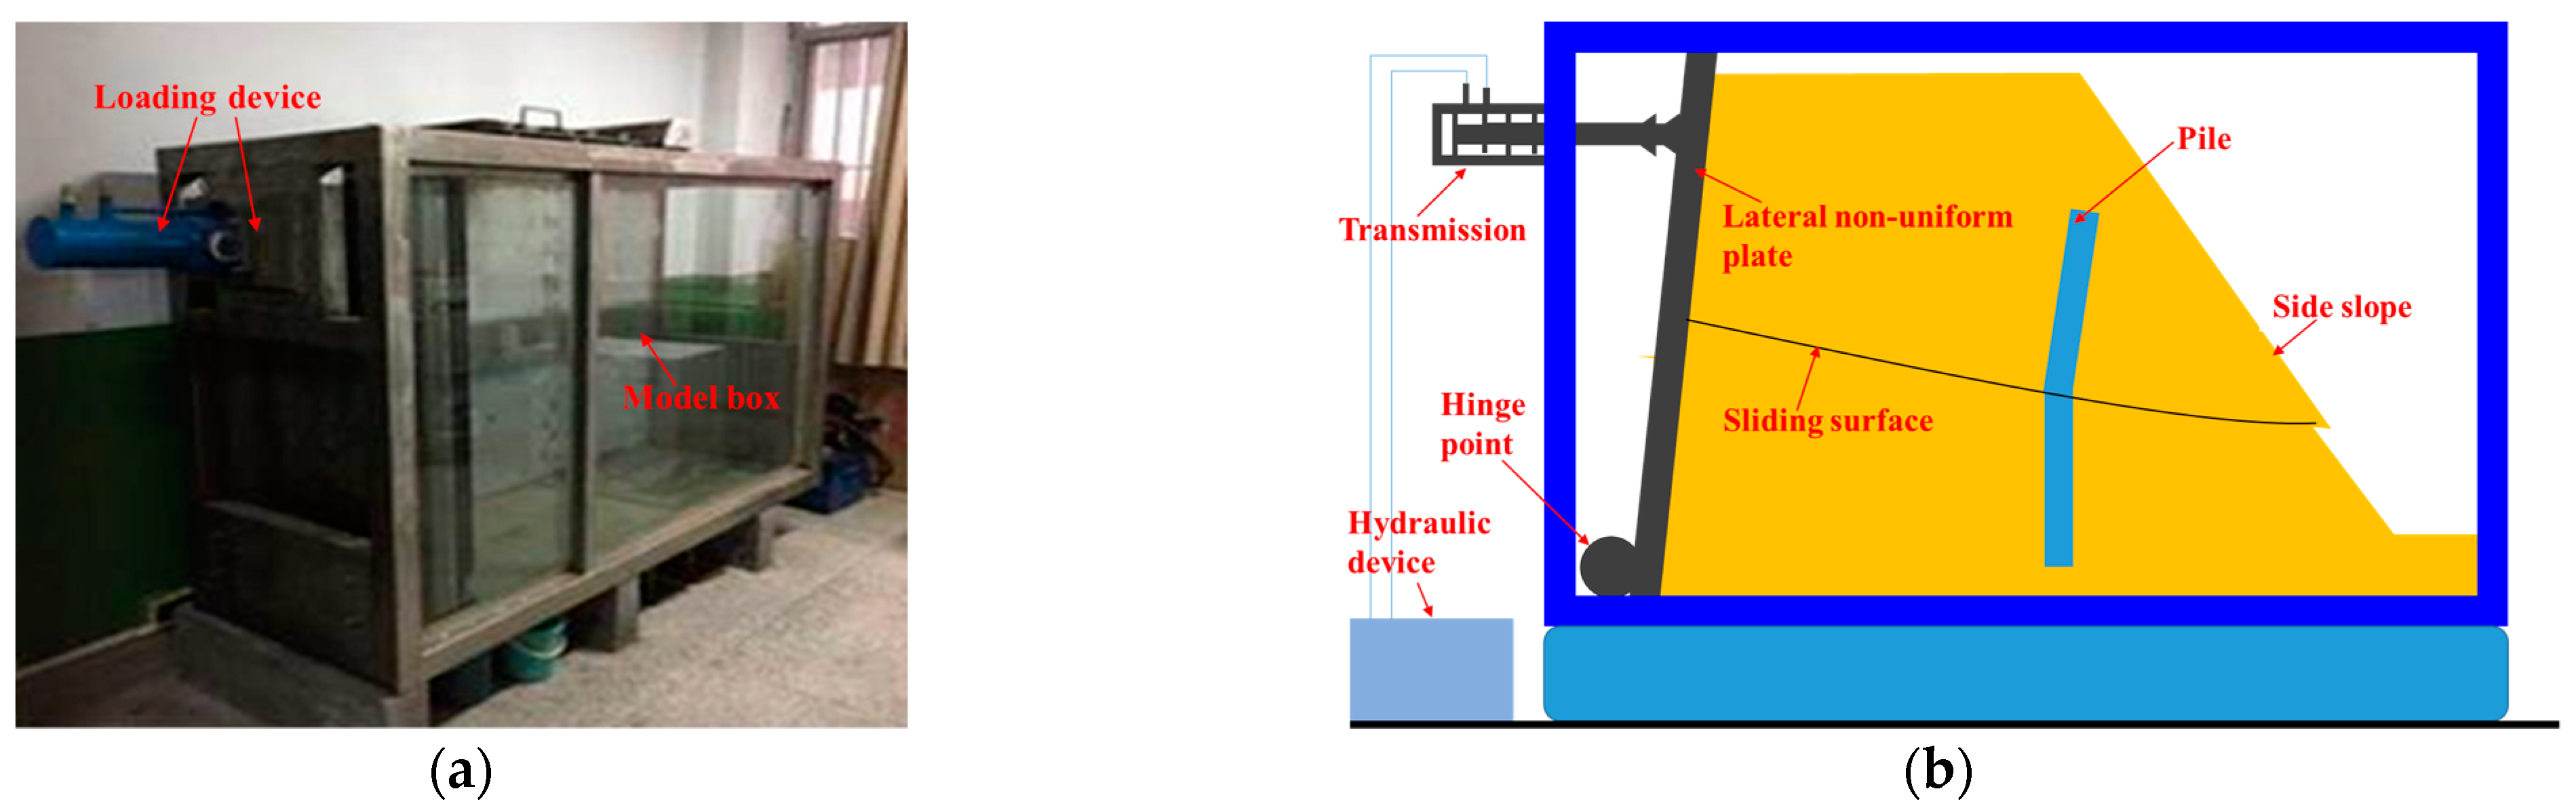
2.1. Lateral Non-Uniform Loading System

The model test system employed in this study is shown in Figure 1a. The model box (length × width × height) is 2.4 m × 0.64 m × 1.5 m, featuring toughened transparent glass on the front side and stainless steel for the remaining sides.
Lateral non-uniform loading was achieved by securing a hydraulic cylinder jack within the left frame. The upper portion of the lateral rigid plate was hinged to the moving piston within the hydraulic cylinder, while the lower part was hinged at the base of the model box. Activation of the hydraulic cylinder resulted in the rightward displacement of the top of the lateral rigid plate, while the bottom rotated around the hinge point, as illustrated in Figure 1b. The top displacement of the lateral rigid plate was limited to 10 cm for each test condition, and loading was progressively applied from 0 to 10 cm displacement to simulate slope deformation characteristics during sliding.

2.2. Experiments Test System

In this model test, an array of sensors and associated software were utilized to acquire experimental data, earth pressure gauges, displacement sensors, strain gauges, and a strain acquisition instrument in Figure 2. Specifically, the strain gauge, earth pressure gauge, and displacement sensor are coupled to the computer via the static strain acquisition instrument. Equally, the computer is equipped with the appropriate software corresponding to the static strain acquisition instrument, and the corresponding data are retrieved by the software. Conclusively, the data are outputted in excel format, and subsequent processing and analysis are performed.

2.3. Model Slope and Model Concrete Piles

The loess slope, reinforced with model concrete piles, was constructed by layered filling to achieve the target density and moisture content, with the loess parameters detailed in Table 1. The density parameters and water content parameters of the soil are selected in reference [24,25]. In the process of the layered filling of the slope model, the density and moisture content of the soil layer are measured and checked constantly.
Adhering to a 1:20 scale model of the prototype slope, the stabilizing pile models were fabricated using model concrete [22]. The pile length of each pile model was 0.9 m, and the cross-sectional area was a square with a 0.05 m side length.
Initially, the model concrete mix ratio was determined through some concrete raw materials (Figure 3a), as presented in Table 2. Then, the model concrete compression test was conducted, and the test strength exceeded the strength of C20 concrete (Figure 3b). In addition, the diameter and strength of the iron wire were tested through an iron wire tensile test (Figure 3c), as shown in Table 3.
Subsequently, the reinforcement layout for the model concrete stabilizing pile was ascertained based on theoretical calculations, as depicted in Figure 4a. The cross-sectional side length of the model pile was set at 50.0 mm. Longitudinal reinforcement was simulated using four iron wires with a diameter of 2.8 mm in Table 3, and stirrups were adopted for iron wires with a diameter of 0.8 mm in Table 3, resulting in a reinforcement ratio of 0.49% within the model concrete pile. The production process of the model concrete stabilizing pile, which includes mold construction, stretching reinforcement bars, concrete pouring, and 28 days curing with the measured elastic modulus of 30.3 GPa, is shown in Figure 4b.
Three-point bending tests on the reinforced model concrete piles were conducted using a rock press device to evaluate deflection deformation and ultimate load-bearing capacity. The setup for the three-point bending experiment is shown in Figure 5a, the pile cracking process is captured in Figure 5b, and the loading curves for two model piles are plotted in Figure 5c. The ultimate bending moment associated with the cracking damage of the model pile is recorded in Table 4.

2.4. Test Plan

Two test cases were designed for the model tests of loess slopes reinforced with model concrete stabilizing piles: Case 1, featuring homogeneous soil as shown in Figure 6a, and Case 2, incorporating a pre-set potential sliding surface simulated by a double-layer polyethylene plastic film, as depicted in Figure 6b. The construction process for the model test is illustrated in Figure 6c. In order to accurately capture strain readings from the model concrete stabilizing piles, a total of 12 strain gauges were strategically placed on both sides of the model, as indicated in Figure 7a. The arrangement of the strain gauges on the model concrete stabilizing pile is visually documented in Figure 7b. Additionally, mini-earth pressure gauges were installed within the slope to monitor internal stress distribution, as shown in Figure 7c,e, and displacement sensors were positioned at the top and surface of the slope to track movement, as demonstrated in Figure 7d,f. This instrumentation facilitated a comprehensive analysis of the force–deformation characteristics of the model concrete stabilizing piles under lateral non-uniform loading conditions.

3. Analysis of Test Results and Data

3.1. Slope Model Deformation Results

In the two model tests involving loess slopes reinforced with model concrete stabilizing piles (Cases 1 and 2), a six-level loading regime was employed. The incremental increase in lateral thrust displacement at the top of the slope’s left side followed a 1 cm gradation per level, ranging from 1 to 6 cm, as depicted in Figure 8.
The displacement responses were monitored using three displacement sensors installed on the model slope surface, with the monitoring curves presented in Figure 9. In Case 1, a gradient in horizontal displacement was observed from the top to the bottom of the slope: 28 mm at the shoulder, 22 mm in the middle, and 18 mm at the toe. In Case 2, it was noted that there was an increase of 28.6%, 36.4%, and 27.8% at the corresponding measuring points compared to Case 1. The slopes in both Case 1 and Case 2 had experienced substantial deformation, indicative of an unstable damage state, but the enhanced horizontal displacement in Case 2 was attributed to the sliding surface’s potential to cause shear slip.

3.2. Earth Pressure Monitoring Results

The model tests for the slopes reinforced with stabilizing piles in Cases 1 and 2 included the deployment of 16 earth pressure gauges, labeled A1 to A8 and B1 to B8, adjacent to the model piles. Monitoring curves for the earth pressure in front of the pile are shown in Figure 10a, where readings from A1 to B1 in both cases were approximately equal. However, measurements at A2 and A4 in Case 1 exceeded those at B2 and B4 in Case 2, while A3 in Case 1 presented lower values than B3 in Case 2. The data behind the pile, represented in Figure 10b, indicate similar earth pressures at A7, A8, B7, and B8 across both cases. Notably, A5 in Case 1 registered higher than B5 in Case 2, and A6 in Case 1 was significantly lower than B6 in Case 2. This pattern of earth pressure is attributed to the pre-set sliding surface in Case 2 exacerbating landslide effects, causing the stabilizing pile to tilt and separate from the anterior soil above the sliding surface while compressing the posterior soil.

3.3. Monitoring Results of Strain on the Surface of Pile

In the model tests of the slope reinforced with stabilizing piles (Case 1 and Case 2), nine strain gauges (C1~C9) were deployed at equal intervals from top to bottom on the surface of the stabilizing pile. Figure 11 shows the strain response monitoring curves of the piles along the height during the step-by-step lateral loading in six-level loading mode.
Figure 11 shows that the maximum value of the measuring strain gauges in the piles in Case 1 reached the damage strain value (in Table 4) of the stabilizing pile under the five-level loading condition, while those in Case 2 reached the same damage strain value under the four-level loading condition.
On the one hand, the data results indicate that cracking failure occurred near the position of the maximum value in strain gauges, and its damage discrimination has been verified in checking the cracking position of pile during the model’s excavation; on the other hand, it also indicates that the pre-set sliding surface exacerbated a landslide damage effect.

3.4. Analysis of Bending Moment and Damage Mode of Model Concrete Pile

Stress values at various points on the concrete model stabilizing pile were deduced from the strain gauge data, enabling the calculation of the bending moments using Equations (1)–(4):
σ = E ε ,
σ = M y / I z ,
y = h / 2 ,
M = 2 E I ε / h .
where EI is the flexural stiffness of the stabilizing pile (N·m2); ε is the surface strain of the stabilizing pile; and h is the thickness of the pile’s cross-section (m).
The distribution of bending moments along the pile’s height for both cases, during the incremental lateral loading, is illustrated in Figure 12.
Although the damage ultimate bending moment was consistent in both cases, as indicated in Table 4, the onset of pile cracking differed: occurring at the fifth-level in Case 1 and the fourth-level in Case 2. This implies a 20% reduction in the lateral loading displacement at failure for Case 2, suggesting that the sliding surface penetration resulted in a significant decrease in lateral bearing capacity.
Variations in the location of pile cracks were observed under non-uniform lateral loading; in Case 1, they appeared closer to the middle of the anchorage segment, while in Case 2, they manifested near the upper part of the anchorage segment and adjacent to the sliding surface. This indicates a 38.4% increase in the height of the cracking position in Case 2, attributed to stress concentration caused by the sliding surface.
Upon concluding the tests, excavation of the model slope was conducted, and the change in the pile’s bending moment was recorded, leading to the schematic representation of damage under non-uniform lateral loading conditions shown in Figure 13. The forward tilting of the stabilizing pile, increased pile–soil extrusion deformation, and soil in front of the pile formed a disengaging area above. As loading progressed, the pile endured increasing thrust until failure ensued. Compared to Case 1, the stress concentration from the sliding surface in Case 2 elevated the cracking point, expanded the disengaging area behind the pile, and induced new disengaging areas due to the shearing effect heightened by the sliding surface penetration.

4. Numerical Simulation of Loess Slope Reinforced with Stabilizing Pile

4.1. Numerical Model and Parameters

Two numerical models of the slope reinforced with stabilizing piles were developed in ABAQUS 2022 (Figure 14a,b), corresponding to the model test (Figure 6a,b). The potential sliding surface is formed by setting the direct friction coefficient between the two surfaces. The friction coefficient at the potential sliding surface is 0.5, and the hard contact is selected for normal contact. The Mohr–Coulomb strength criterion was utilized for the loess, and an elastic model represented the concrete stabilizing pile, with parameters listed in Table 5.
To emulate the lateral non-uniform loading mode equivalent to that in the tests, step-by-step inverted triangular displacement boundary conditions were applied to the numerical model’s left side. The maximum displacement at the top was set to 6 cm, replicating the six-level loading mode of the model tests (Figure 14c). The numerical simulation applied an inverted triangular displacement with a peak of 6 cm at the upper part, thereby reconstructing the loading process corresponding to the model tests’ lateral non-uniform displacement.

4.2. Stress Results of Slope Reinforced with Stabilizing Piles in Simulations

The maximum principal stress within the stabilizing pile in the calculation was observed from Figure 15, reaching 1.541 MPa in the lateral six-level loading in Case 1 and 1.617 MPa in lateral five-level loading in Case 2. Both values exceeded the standard value (1.54 MPa) of tensile strength of C20 concrete, indicating a likelihood of cracking in the pile. The location of the maximum principal stress concentration in the numerical simulations aligns closely with the model test results. It is noted that the slight variance in maximum principal strain between the two cases is due to the inability of the numerical simulation to replicate the cracking behavior of the pile model, given the elastic characteristics assigned to the pile in these simulations.

4.3. Bending Moment Results of Slope Reinforced with Stabilizing Piles in Simulations

Reflecting on the bending characteristics of model concrete stabilizing piles under lateral non-uniform loading conditions, the bending moments along the pile height were extracted from the numerical calculations for both cases (Figure 16). The maximum of the pile’s bending moment within the stabilizing pile in the calculation can be observed in Figure 16a,b, reaching 263 N·m in the lateral six-level loading in Case 1 and 272 N·m in lateral five-level loading in Case 2. Both values exceeded the ultimate bending moment (227 N·m in Table 4) of the model concrete pile, indicating cracking in the pile. The trends in the distribution of the pile’s bending moments, as determined numerically, generally concur with the model test results (Figure 12), effectively revealing the damage characteristics of the piles under varying load conditions.
However, some discrepancies between the numerical and experimental results are acknowledged. These differences are attributed to the elastic nature of the pile in the numerical model, which cannot be attributed to simulated damage and simulated disengagement in the soil surrounding the pile. But the trend of pile breakage can still be judged by the increasing magnitude and its distribution of the pile’s bending moments.
The numerical simulation thus provides a complementary perspective to the model tests, reinforcing the understanding of the fracture behavior of stabilizing piles within reinforced slopes. Despite limitations in replicating the exact crack propagation process, the simulation can serve as a valuable tool for predicting stress distribution and potential failure points in stabilizing piles under non-uniform lateral loading scenarios.

5. Conclusions

This study has conducted model tests and numerical simulations on slopes reinforced with model concrete piles, incorporating conditions both with and without a pre-set sliding surface, under non-uniform lateral loading. The conclusions are as follows:
(1)
The introduction of non-uniform lateral loading leads to different fracture behaviors in the model concrete piles. Cracks within piles reinforcing the homogeneous slope were observed during the fifth level of loading, whereas in the slope with a pre-set sliding surface, cracking occurred at the fourth level. This signifies that the penetration of the sliding surface contributes to a substantial 20% reduction in the lateral bearing capacity of the reinforced slope.
(2)
The location of cracks along the pile height varies under non-uniform lateral loading between the two slope conditions. In the homogeneous slope, cracking is predominantly located near the midpoint of the anchorage segment, whereas in the slope with the pre-set sliding surface, cracks manifest in the upper portion of the anchorage segment and in proximity to the sliding surface. Notably, the stress concentration induced by the sliding surface elevates the pile’s cracking position by 38.4% along its height when compared to the homogeneous loess slope.
(3)
The pre-set sliding surface is found to amplify the forces acting on the stabilizing piles. Consequently, the piles in the reinforced slope with the sliding surface are at a heightened risk compared to those without. This underscores the necessity for robust design considerations for stabilizing piles in scenarios where a potential sliding surface is present.
These findings have significant implications for the design and assessment of slope reinforcement strategies, particularly in the presence of potential sliding surfaces. This research highlights the critical role of considering non-uniform loading conditions and the subsequent stress distribution within stabilizing piles to ensure the stability and safety of reinforced slopes.

Author Contributions

W.B., analyses and writing; R.L. (Rongjian Li), analyses; G.L., model test; R.L. (Rongjin Li), model test; H.J., data; L.W., numerical simulation; C.B., numerical simulation. All authors have read and agreed to the published version of the manuscript.

Funding

This research was supported by the National Natural Science Foundation of China (No. 41877278), the Key R&D program of Shaanxi Province (2020ZDLGY07-03).

Data Availability Statement

The data presented in this study are all available in the article.

Conflicts of Interest

Authors Guoqiang Lin and Chaoneng Bai were employed by the company China Railway Liu Yuan & Xi’an Survey, Design and Research Institute Co., Ltd., of CREC. Author Hao Jiang was employed by the company Shaanxi Transportation Holding Group Co., Ltd. Author Laizhu Wang was employed by the company The Second Engineering Co., Ltd. of China Railway 17th Bureau Group. The remaining authors declare that the research was conducted in the absence of any commercial or financial relationships that could be construed as a potential conflict of interest.

References

  1. Editorial Department of China Journal of Highway and Transport. Review on China’s subgrade engineering research 2021. China J. Highw. Transp. 2021, 34, 1–49. (In Chinese) [Google Scholar]
  2. Chen, G.F.; Guo, F.; Zhang, G.D.; Liu, J.; Ding, L.J. Anti-slide pile structure development: New design concept and novel structure. Front. Earth Sci. 2023, 11, 1133127. [Google Scholar] [CrossRef]
  3. Jin, H.H.; Ren, Q.Y.; Xiao, S.Q. Study on the evolution law of internal force and deformation and optimized calculation method for internal force of cantilever anti-slide pile under trapezoidal thrust load. Buildings 2023, 13, 322. [Google Scholar] [CrossRef]
  4. Liu, X.Y.; Cai, G.J.; Liu, L.L.; Zhou, Z.J. Investigation of internal force of anti-slide pile on landslides considering the actual distribution of soil resistance acting on anti-slide piles. Nat. Hazards 2020, 102, 1369–1392. [Google Scholar] [CrossRef]
  5. Li, Z.; Zhu, Z.G.; Liu, L.L.; Sun, L. Distributions of earth pressure and soil resistance on full buried single-row anti-sliding piles in loess slopes in northern Shaanxi based on in-situ model testing. Bull. Eng. Geol. Environ. 2022, 81, 127. [Google Scholar] [CrossRef]
  6. Li, H.; Du, Q.W. Stabilizing a post-landslide loess slope with anti-slide piles in Yan’an, China. Environ. Earth Sci. 2021, 80, 739. [Google Scholar] [CrossRef]
  7. Xin, J.P.; Tang, X.S.; Zheng, Y.R.; Zhang, D. Large-scale model tests of single-row and triple-row anti-slide micro piles. Rock Soil Mech. 2015, 36, 1050–1056. (In Chinese) [Google Scholar]
  8. Li, R.J.; Luo, H.; Liu, J.D.; Wang, Y.L. Damage mechanism of stabilizing piles suffered from liquefaction based on dynamic numeric analyses. J. Vibroeng. 2017, 19, 1147–1157. [Google Scholar] [CrossRef]
  9. Dai, Z.H.; Yang, J.H.; Dai, R.; Zhu, Q.C. Three-dimensional and threefold nonlinear numerical modeling for slope-stabilizing pile. KSCE J. Civ. Eng. 2022, 26, 4390–4406. [Google Scholar] [CrossRef]
  10. Zhang, C.Y.; Yin, Y.P.; Yan, H.; Zhu, S.N.; Li, B.; Hou, X.F.; Yang, Y.T. Centrifuge modeling of multi-row stabilizing piles reinforced reservoir landslide with different row spacings. Landslides 2022, 20, 559–577. [Google Scholar] [CrossRef]
  11. Fan, G.; Zhang, J.J.; Qi, S.C.; Wu, J.B. Dynamic response of a slope reinforced by double-row anti-sliding piles and pre-stressed anchor cables. J. Mt. Sci. 2019, 16, 226–241. [Google Scholar] [CrossRef]
  12. Ren, Y.; Li, T.B.; Yang, L.; Wei, D.Q.; Tang, J.L. Stability analysis of ultra-high-steep reinforced soil-filled slopes based on centrifugal model tests and numerical calculation. Chin. J. Geotech. Eng. 2022, 44, 836–844. (In Chinese) [Google Scholar]
  13. Ye, J.B.; Yu, J.; Lin, Z.C.; Liu, S.Y.; Tu, B.X. Model test of cantilever double-row anti-slide pile using horizontal pushing method. China Civ. Eng. J. 2019, 52, 193–201. (In Chinese) [Google Scholar]
  14. Li, Y.H.; Zhang, X.; Zhang, D.H.; Wang, W.Z. Model test on mechanical behavior of h-type anti-slide pile under curved landslide. Eng. Mech. 2022. (In Chinese). Available online: http://kns.cnki.net/kcms/detail/11.2595.O3.20221202.1550.002.html (accessed on 19 November 2023).
  15. Liu, Q.; Wu, N.S.; Huang, Z.B.; Xu, X.T.; Xu, X. Visualization model test of dual-structure slope reinforced by anti-sliding piles. J. For. Eng. 2023, 8, 172–179. (In Chinese) [Google Scholar]
  16. Zhang, W.G.; Wang, Q.; Chen, F.Y.; Chen, L.L.; Wang, L.Q.; Wang, L.; Zhang, Y.M.; Wang, Y.Q.; Zhu, X. Reliability analysis of slope and random response of anti-sliding pile considering spatial variability of rock mass properties. Rock Soil Mech. 2021, 42, 3157–3168. (In Chinese) [Google Scholar]
  17. Liu, Z.; Liu, P.Z.; Zhou, C.Y.; Li, Y.S.; Zhang, L.H. Modeling Riverbank Slope Reinforcement Using Anti-Slide Piles with Geocells. J. Mar. Sci. Eng. 2021, 9, 394. [Google Scholar] [CrossRef]
  18. Wang, S.C.; Sang, C.Q. Numerical analysis of stability of broken line slope strengthened by anti-slide pile. Highway 2022, 67, 73–81. (In Chinese) [Google Scholar]
  19. Hu, M.; Chen, X.J.; Liu, Y. A large-deformation finite-element analysis of slope based on energy mutation criterion. Eng. J. Wuhan Univ. 2022, 55, 1102–1111. (In Chinese) [Google Scholar]
  20. Hu, S.C.; Pei, Q.; Ding, Y.; Sun, H. Seismic performance of anchor cable anti-slip pile reinforced slopes under rare earthquakes. Coal Technol. 2022, 41, 73–76. (In Chinese) [Google Scholar]
  21. Chen, J.F.; Du, C.C.; Chen, S.X.; Shi, Z.M.; Peng, M. Mechanical mechanism of slopes stabilized with anti-slide piles and prestressed anchor cable frame beams under seismic loading. Earth Sci. 2022, 47, 4362–4372. (In Chinese) [Google Scholar]
  22. Li, R.J.; Yu, Y.Z.; Lu, H.; Li, G.Z. Design of model concrete piles to reinforced slopes for dynamic centrifuge tests. J. Tsinghua Univ. Sci. Technol. 2009, 49, 66–70. (In Chinese) [Google Scholar]
  23. Li, R.J.; Yu, Y.Z.; Lu, H.; Li, G.Z. Study on characteristics of dynamic failure of stabilizing piles in slope on liquefiable soil foundation. J. Hydraul. Eng. 2010, 41, 446–451. (In Chinese) [Google Scholar]
  24. Cheng, Y.X.; Huo, A.D.; Zhao, Z.X.; Peng, J.B. Analysis of loess fracture on slope stability based on centrifugal model tests. Bull. Eng. Geol. Environ. 2021, 80, 3647–3657. [Google Scholar] [CrossRef]
  25. Xu, L.; Dai, F.C.; Tu, X.B.; Javed, I.; Woodard, M.J.; Jin, Y.L.; Tham, L.G. Occurrence of landsliding on slopes where flowsliding had previously occurred: An investigation in a loess platform, North-west China. Catena 2013, 104, 195–209. [Google Scholar] [CrossRef]
Figure 1. Model test system device: (a) loading device; (b) loading principle.
Buildings 14 00173 g001
Figure 2. Test instrument: (a) earth pressure gauges; (b) displacement sensor; (c) strain gauges; (d) static strain acquisition instrument.
Buildings 14 00173 g002
Figure 3. Stabilizing piles production material selection process: (a) concrete raw materials; (b) model concrete compression test; (c) iron wire tensile test.
Buildings 14 00173 g003
Figure 4. Making model concrete piles: (a) reinforcement of section; (b) production process (mm).
Buildings 14 00173 g004
Figure 5. Three-point bending test: (a) rock press and loading process; (b) pile cracking; (c) the diagram of load–deflection.
Buildings 14 00173 g005
Figure 6. Experimental conditions of stabilizing pile reinforced model for loess slopes: (a) Case 1; (b) Case 2; (c) model making process (m).
Buildings 14 00173 g006
Figure 7. Layout design of tests: (a) strain gauge layout; (b) arrangement of strain gauges; (c) earth pressure gauges in Case 1; (d) displacement sensors in Case 1; (e) earth pressure gauges in Case 2; (f) displacement sensors in Case 2 (m).
Buildings 14 00173 g007
Figure 8. Model changes from the initial state to the ultimate state: (a) loading initial state in Case 1; (b) loading end state in Case 1; (c) loading initial state in Case 2; (d) loading end state in Case 2.
Buildings 14 00173 g008
Figure 9. Monitoring curve of model slope horizontal displacement: (a) Case 1; (b) Case 2.
Buildings 14 00173 g009
Figure 10. Earth pressure monitoring curve on both sides of the stabilizing piles: (a) earth pressure data (front of the stabilizing pile); (b) earth pressure data (behind the stabilizing pile).
Buildings 14 00173 g010
Figure 11. Strain monitoring curves of stabilizing piles along height from the initial state to the ultimate state in six-level loading mode: (a) Case 1; (b) Case 2.
Buildings 14 00173 g011
Figure 12. Schematic diagram of pile bending moment distribution from the initial state to the ultimate state in six-level loading mode: (a) Case 1; (b) Case 2.
Buildings 14 00173 g012
Figure 13. Schematic diagram of damage mode of model concrete stabilizing pile: (a) Case 1; (b) Case 2.
Buildings 14 00173 g013
Figure 14. Numerical model of slope reinforced with stabilizing pile: (a) Case 1; (b) Case 2. (c) The boundary conditions of the numerical model.
Buildings 14 00173 g014
Figure 15. Maximum principal stress of stabilizing pile: (a) Case 1 (lateral six-level loading); (b) Case 2 (lateral five-level loading).
Buildings 14 00173 g015
Figure 16. Numerical simulation of pile’s bending moment from the initial state to the ultimate state in six-level loading mode: (a) Case 1 (lateral six-level loading); (b) Case 2 (lateral five-level loading).
Buildings 14 00173 g016
Table 1. Physical and mechanical parameters of loess.
Basic Parametersρ/(g/cm3)w/(%)c/(kPa)φ/(°)
Loess soil1.45101626
Table 2. The mix proportion of model concrete.
MaterialWaterCementFine SandMedium SandFine AggregateMedium Aggregate
Particle size (mm)--0–0.50.5–1.251.25–2.02.0–5.0
Mass (g)718128011005299951511
Table 3. The strength of model steel bars.
Iron Wire CategoryDiameter (mm)Yield Strength (MPa)Ultimate Strength (MPa)
Iron wire for stirrup0.8296331
Iron wire for longitudinal reinforcement bar2.8336400
Table 4. The ultimate bending moment of model concrete piles.
PilesCross Section Length (mm)Reinforcement Ratio (%)Damage Strain (×10−6)Average Strain (×10−6)Ultimate Bending Moments (N·m)Average Bending Moments (N·m)
Pile No.1500.49326340215227
Pile No.2500.49354239
Table 5. Material physical parameters of numerical model.
Homogenous Materialρ/(g/cm3)c/(kPa)φ/(°)E/(MPa)μ
Loess1.451626300.3
Stabilizing pile2.230,3000.17
Disclaimer/Publisher’s Note: The statements, opinions and data contained in all publications are solely those of the individual author(s) and contributor(s) and not of MDPI and/or the editor(s). MDPI and/or the editor(s) disclaim responsibility for any injury to people or property resulting from any ideas, methods, instructions or products referred to in the content.

