Article

Experimental Study on the Seismic Performance of Brick Walls Strengthened by Small-Spaced Reinforced-Concrete–Masonry Composite Columns

1
Key Lab of Building Structural Retrofitting and Underground Space Engineering of the Ministry of Education, School of Civil Engineering, Shandong Jianzhu University, Jinan 250101, China
2
Shandong Academy of Building Research Co., Ltd. (SDABR), Jinan 250031, China
*
Author to whom correspondence should be addressed.
Buildings 2024, 14(1), 184; https://doi.org/10.3390/buildings14010184
Submission received: 4 December 2023 / Revised: 7 January 2024 / Accepted: 9 January 2024 / Published: 11 January 2024
(This article belongs to the Section Building Materials, and Repair & Renovation)

Abstract

:
Through low-cycle reciprocating tests on 11 masonry wall specimens strengthened using reinforced-concrete–masonry composite columns, the effects of the position of the composite column, height-to-width ratio, column reinforcement ratio, and axial load ratio on their load-carrying capacity, stiffness, ductility, and energy dissipation capacity were investigated. It was experimentally found that, by strengthening brick walls with RC–masonry composite columns, the concrete and masonry parts can work together effectively, the failure mode shifts from shear to flexural failure, and the strengthened walls exhibit improved bearing capacity, ductility, and energy dissipation performance compared to unstrengthened masonry walls. It is suggested the composite columns can be placed at the ends of the wall if a strengthening measure is required. For walls with height-to-width ratios greater than 1, placing composite columns in the middle of a wall has little effect on the bearing capacity and stiffness of the wall but can improve the ductility of the wall. The height-to-width ratio is a primary factor influencing the structural performance of masonry walls strengthened using composite columns. A smaller height-to-width ratio leads to higher load-carrying capacity and stiffness but may result in reduced ductility. In comparison, the impact of the column reinforcement ratio and axial load ratio is relatively weaker. The flexural capacity of the masonry wall after strengthening can be obtained using the calculation method for concrete members subjected to a combined action of flexure and compression, in which the compressive strength of the masonry is considered.

1. Introduction

Earthquakes are major natural disasters that have caused heavy casualties and economic losses throughout human history. Masonry structures have a long history and are widely used in many countries around the world, especially in developing and underdeveloped countries, due to the easy availability of materials, simple construction, and low cost. Many of these masonry structures are located in high-seismic areas and are unreinforced. Due to their poor seismic performance and aging construction, these buildings have poor stability during earthquakes, leading to failures of structural elements or even overall collapse. The failure and collapse of a large number of masonry structures, many of which were attributed to the shear failures of load-bearing longitudinal walls and the walls between windows, are direct causes of casualties and property losses [1,2,3,4,5]. Therefore, it is necessary to strengthen existing masonry structures to improve their seismic performance. Figure 1 shows examples of damage to unreinforced masonry buildings during the 2008 Wenchuan earthquake in China.
In order to mitigate the risks of failure of masonry walls during earthquakes, extensive research has been conducted over the past few decades to develop an efficient, economical, and durable retrofitting method aimed at enhancing their seismic performance. These methods include (1) the surface strengthening method [6,7,8,9,10,11,12,13], using various materials as reinforcing surfaces including steel mesh embedded in cement mortar, high-ductility engineered cementitious composite (ECC) layers, and textile-reinforced mortar (TRM) layers, etc.; (2) the strip strengthening method [14,15,16,17,18,19,20,21,22,23], primarily using steel strips or fiber-reinforced polymer (FRP) strips; and (3) seismic retrofitting methods, adopting base isolation and energy dissipation principles [24,25,26,27,28,29].
The surface strengthening method can effectively enhance the strength, stiffness, and ductility of the retrofitted walls and prevent brittle failure [6,7,8,9,10,11,12,13]. For existing buildings, during retrofitting construction, the entire wall surface needs to be cleared, which can significantly impact the wall and the facilities installed on it. In comparison, the strip strengthening method can mitigate this impact. Strengthening with strips such as steel plates and FRP can enhance the compressive strength, ductility, and shear strength of masonry walls and improve their energy dissipation capacity [14,15,16,17,18,19,20,21,22,23]. However, the steel strip does not perform well in fire and the bonding failure between the FRP and the substrate masonry may occur under high temperatures [30,31]. Seismic retrofitting methods, such as base isolation and energy dissipation, can significantly reduce the seismic response of buildings and minimize corresponding structural damages [24,25,26,27,28,29]. However, high technical requirements have to be fulfilled for employing these seismic retrofitting methods, and relative structural design is challenging. Additionally, the relatively high cost restricts their widespread applications, particularly in regions with a less developed economy and technology.
Reinforced concrete, known for its relatively high strength, cost-effectiveness, and fire resistance, is widely used in underdeveloped regions where unreinforced masonry structures are prevalent. Researchers have conducted investigations on the mechanical performance of masonry structures restrained using concrete end columns. Ibrar et al. [32] conducted research on restrained masonry walls with a height-to-width ratio of 1:1. Two different end-column sizes, namely 75 mm and 150 mm, were considered. The research indicated that an increase in end-column cross-section area led to improvements in both the stiffness and ductility of the wall specimens. However, this end-column size variation did not affect the lateral strength of the wall and the pattern of crack distribution. Ahmadizadeh et al. [33] employed steel and concrete for confining stone masonry walls. These investigations demonstrated the advantages of employing steel and concrete confining elements to enhance the in-plane strength and ductility of stone masonry walls, with concrete elements proving significantly more effective. Wijaya et al. [34] conducted experiments on four 3 m × 3 m restrained walls, exploring different connection methods between concrete columns and the walls. These methods included serrated connections, short anchors between the columns and the walls, and continuous anchors between columns. Using serrated connections and short anchors reduced the restraint performance of the wall due to the vertical cracks on the wall–column connection surfaces. Continuous anchoring improved the restraint, resulting in greater load-carrying capacity and ductility of the specimens.
The aforementioned studies mainly focused on setting concrete columns at the ends of the masonry walls, without examining the structural performance of the masonry walls with concrete columns set in the middle. To investigate the structural performance of masonry walls strengthened by concrete columns at different spacing, Marinilli et al. [35] constructed and tested four concrete block walls with dimensions of 2.3 m in height and 3.0 m in width, each having concrete columns placed at different intervals. The findings indicated that incorporating confining columns with the same nominal transverse area into walls resulted in enhanced initial stiffness, increased system ductility, improved damage distribution in the masonry panels, especially with a reduced spacing of confining columns, and a tendency to improve the strength of the walls. It is noted that their experiment was not conducted on normal brick masonry walls, and the influences of the height-to-width ratio, column reinforcement ratio, and axial load on the structural performance of the walls were not considered.
Based on economically and technologically underdeveloped areas, targeting seismic reinforcement of existing unreinforced brick masonry buildings, this study focuses on the structural behaviors of unreinforced fired clay brick walls strengthened using reinforced concrete layers with a certain width on both sides of the walls at regular intervals, forming reinforced-concrete–masonry composite columns with internal and external ties. Experimental studies were conducted to evaluate the effectiveness and the influences of the reinforced-concrete–masonry composite columns in strengthening the walls. Eleven masonry wall specimens were designed with height-to-width ratios of 1.5:1, 1:1, and 1:2, and concrete columns with varying reinforcement ratios were placed at both the ends and the middle of the walls. Low-cycle reciprocating tests were conducted on these specimens with different axial load ratios, through which the effects of the position of the composite column, height-to-width ratio, column reinforcement ratio, and axial load ratio on their load-carrying capacity, stiffness, ductility, and energy dissipation capacity were investigated. Finally, the optimal position of composite columns to strengthen masonry walls and the calculation model for their flexural capacity were obtained, providing a solution for seismic retrofitting of unreinforced masonry structures.

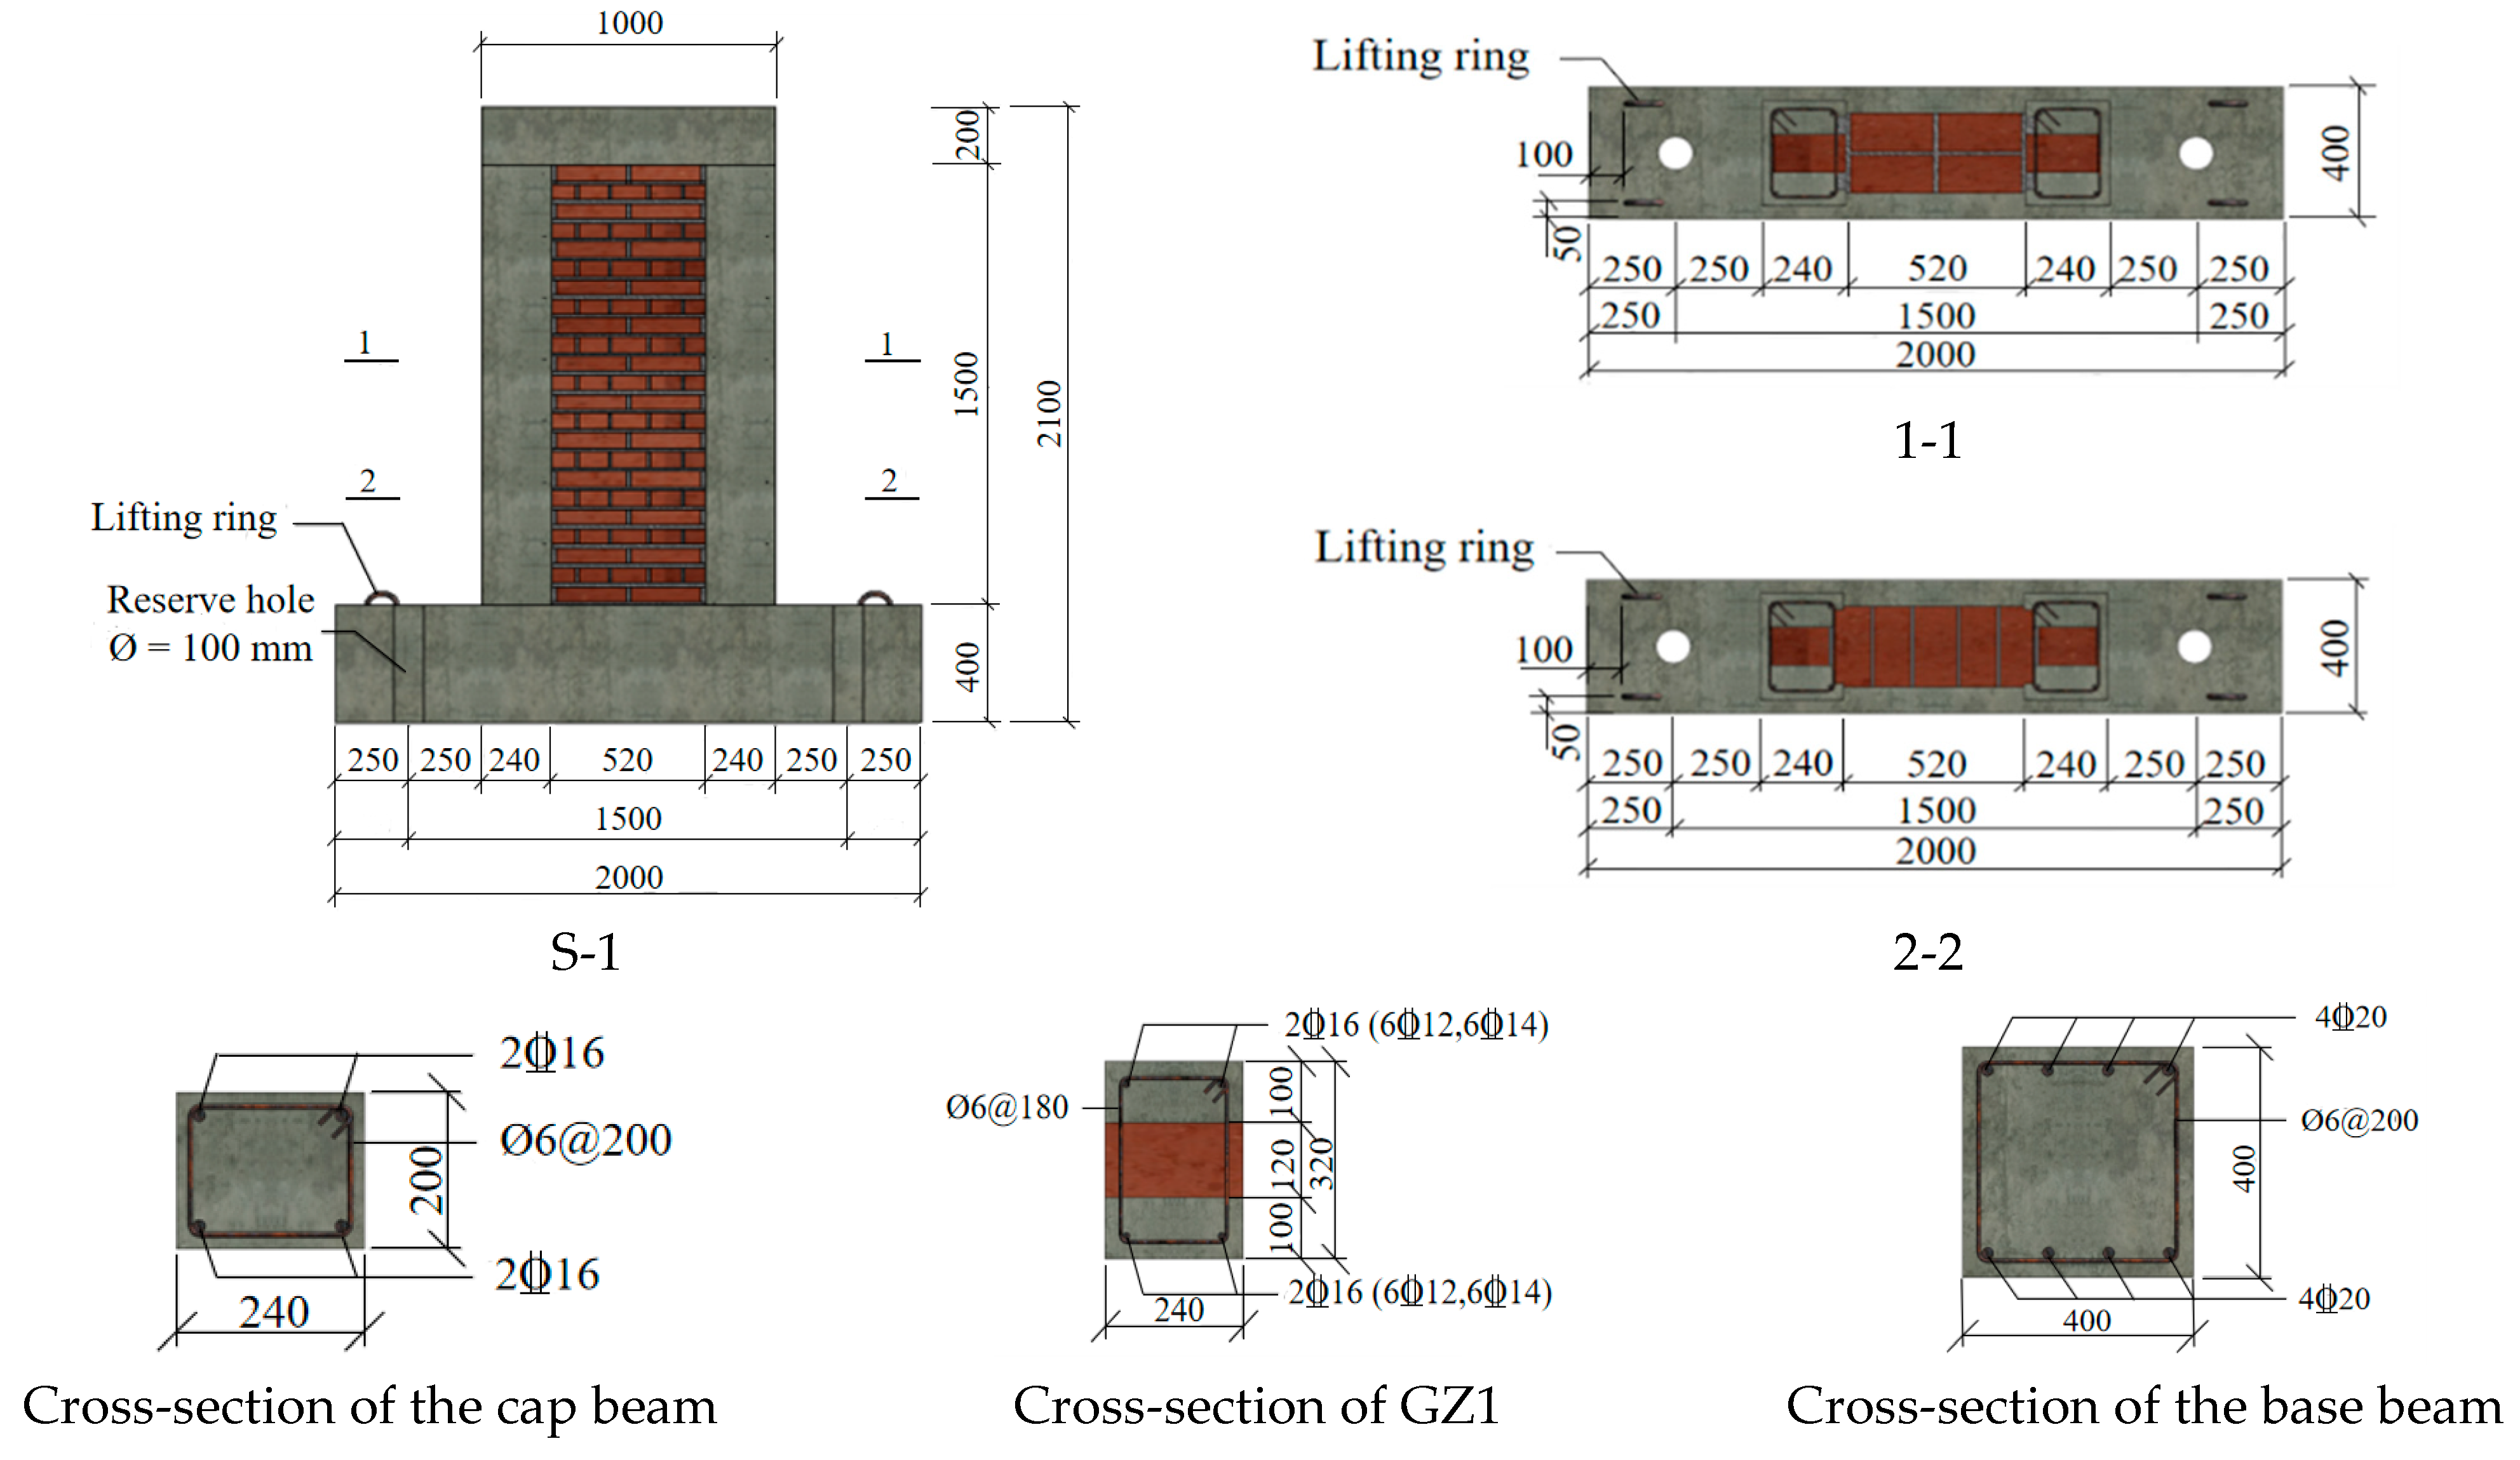
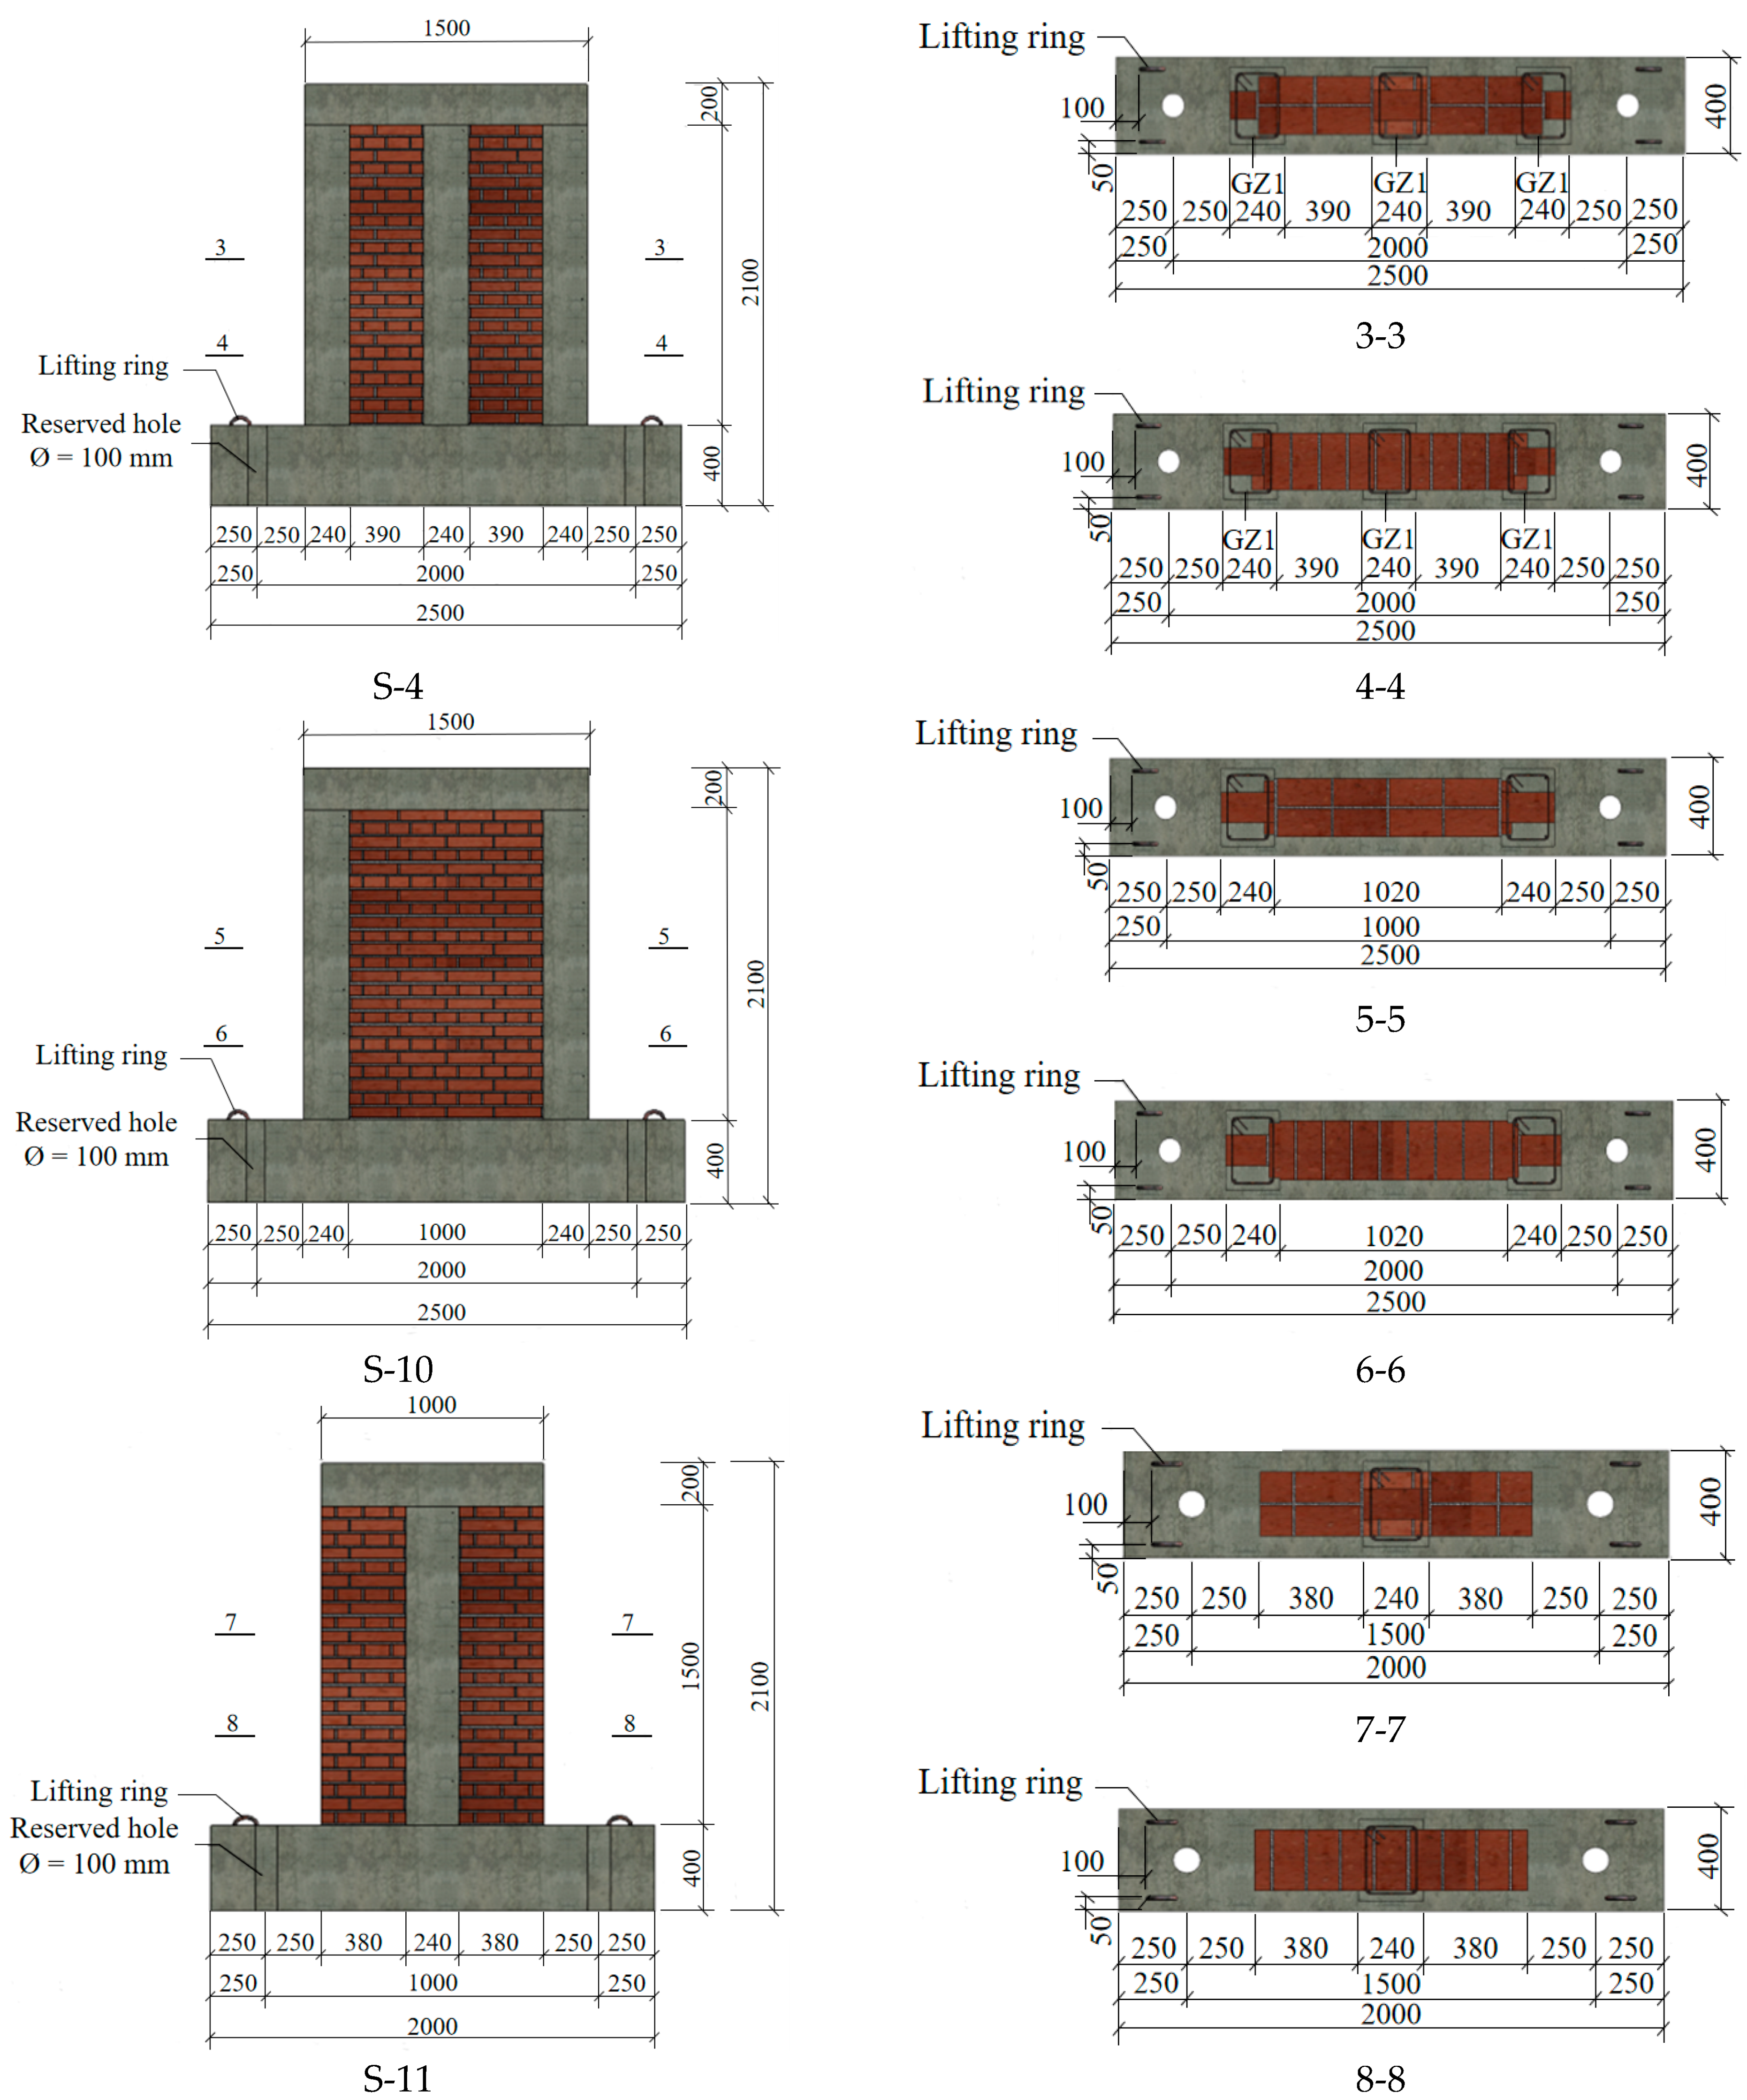
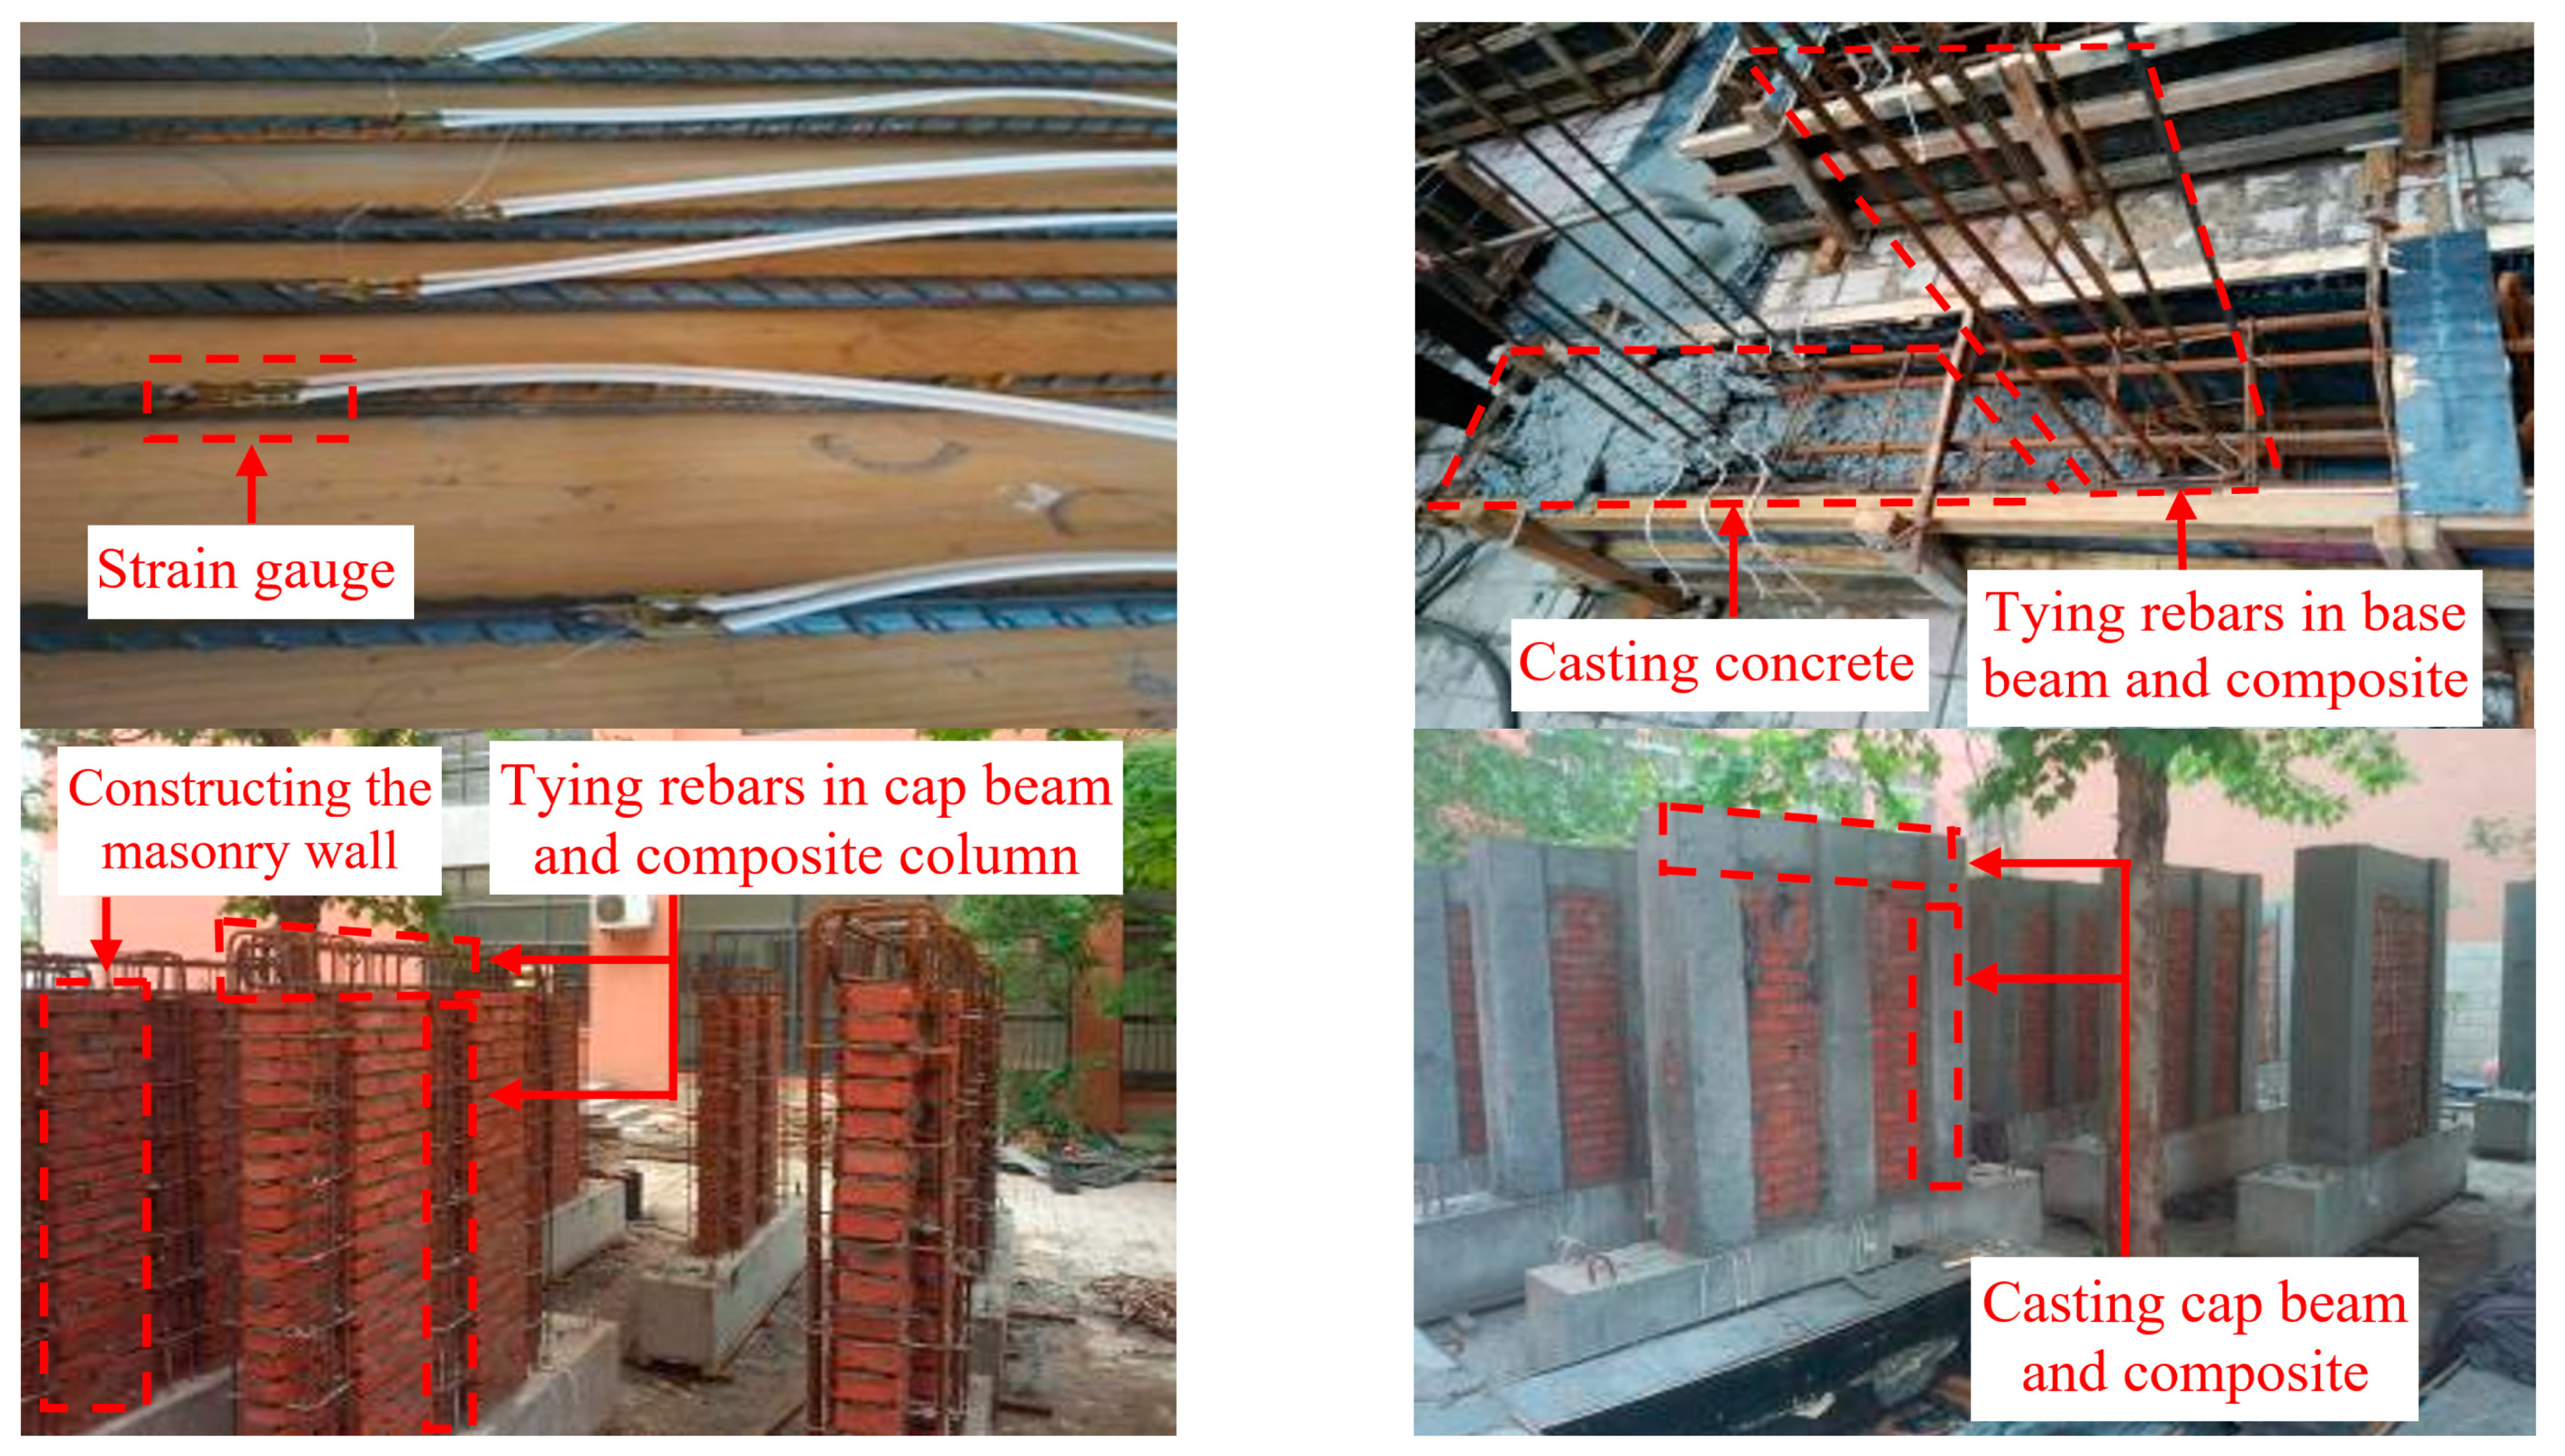
1.1. Specimen Design

A total of 11 specimens were designed in this experiment, with their basic parameters shown in Table 1. These specimens were used to simulate the structural behavior of the wall between windows, the longitudinal load-bearing wall, and the transverse load-bearing wall with height-to-width ratios of 1.5:1, 1:1, and 1:2 under the vertical loads from one, two, and three stories, respectively. For specimens S-1 to S-3, a composite column was arranged at each end of the wall. For S-4 to S-9, three composite columns were arranged at both ends and in the middle of the wall. For S-10, serving as a comparison of S-5, two composite columns were arranged at the ends of the wall, and for S-11, serving as a comparison of S-1, only one composite column was arranged in the middle of the wall so as to analyze the influence of the location of composite columns on the structural performance of the wall. The longitudinal rebars of composite columns were chosen from three options: 4φ 12, 6φ 12, and 6φ 14. During construction, 60 mm of the brick wall was removed from each side of the wall, and then 100 mm of RC was cast on each side to form RC–masonry composite columns. Figure 2 shows the construction details of the specimens.
To consider the influence of the foundation and floors on the structural behavior, a 400 × 400 mm RC base beam was arranged at the base of the wall, and a 240 × 200 mm cap beam was arranged at the top. The brick wall was constructed using M5 mortar, and M10 mortar was used as bedding mortar between the base of the wall and the base beam. MU10 sintered bricks with the dimensions of 240 × 115 × 53 mm were laid in a Flemish bond pattern to form walls with a thickness of 240 mm. C30 concrete was used for RC columns, cap beams, and base beams. The strengths of concrete, brick, and masonry mortar samples are shown in Table 2, and the mechanical properties of rebars are listed in Table 3.
The sequence of specimen preparation was as follows: processing rebars and attaching strain gages → arranging and tying rebars of the base beam and vertical rebars of the composite column → casting the concrete of the base beam→ constructing the masonry wall → arranging and tying the rebar of the cap beam and the stirrups of the composite column → casting the concrete of the composite column and the cap beam. The process of specimen production is shown in Figure 3.

1.2. Loading Regime

The loading device in the test was divided into vertical and horizontal components. The vertical loading device used a hydraulic jack, and the horizontal loading device employed an MTS hydraulic servo actuator. The specimen was anchored on the test bench using ground anchor bolts. A distribution steel beam was installed at the top. The hydraulic jack was aligned with the center of the steel beam, and a vertical load was applied to simulate the vertical uniform compressive stress. To eliminate the influence of horizontal friction, pulleys were installed between the hydraulic jack and the distribution beam. The horizontal load was displacement-controlled and applied at the top of the wall. Figure 4 shows a schematic diagram of the loading system.
During the test, the hydraulic jack was pressurized to achieve a certain level of the vertical load. Then, a stabilizer was used to keep the vertical load constant. Afterward, a horizontal low-cycle reciprocating load was applied using an actuator with a certain pattern of displacement increments. In this test, the maximum displacement was 0.5 mm in the first cycle and 1.0 mm in the second cycle. Thereafter, the horizontal displacement was incremented by 0.5 mm for each cycle until cracks occurred, and then the displacement was incremented by 2.0 mm in each subsequent cycle. After the ultimate load was reached, the load began to decrease with the increase in the displacement. When the horizontal load fell to 85% of the ultimate load, the loading was stopped, and the test ended. The loading scheme adopted in this study is shown in Figure 5.

2. Experimental Observations and Results

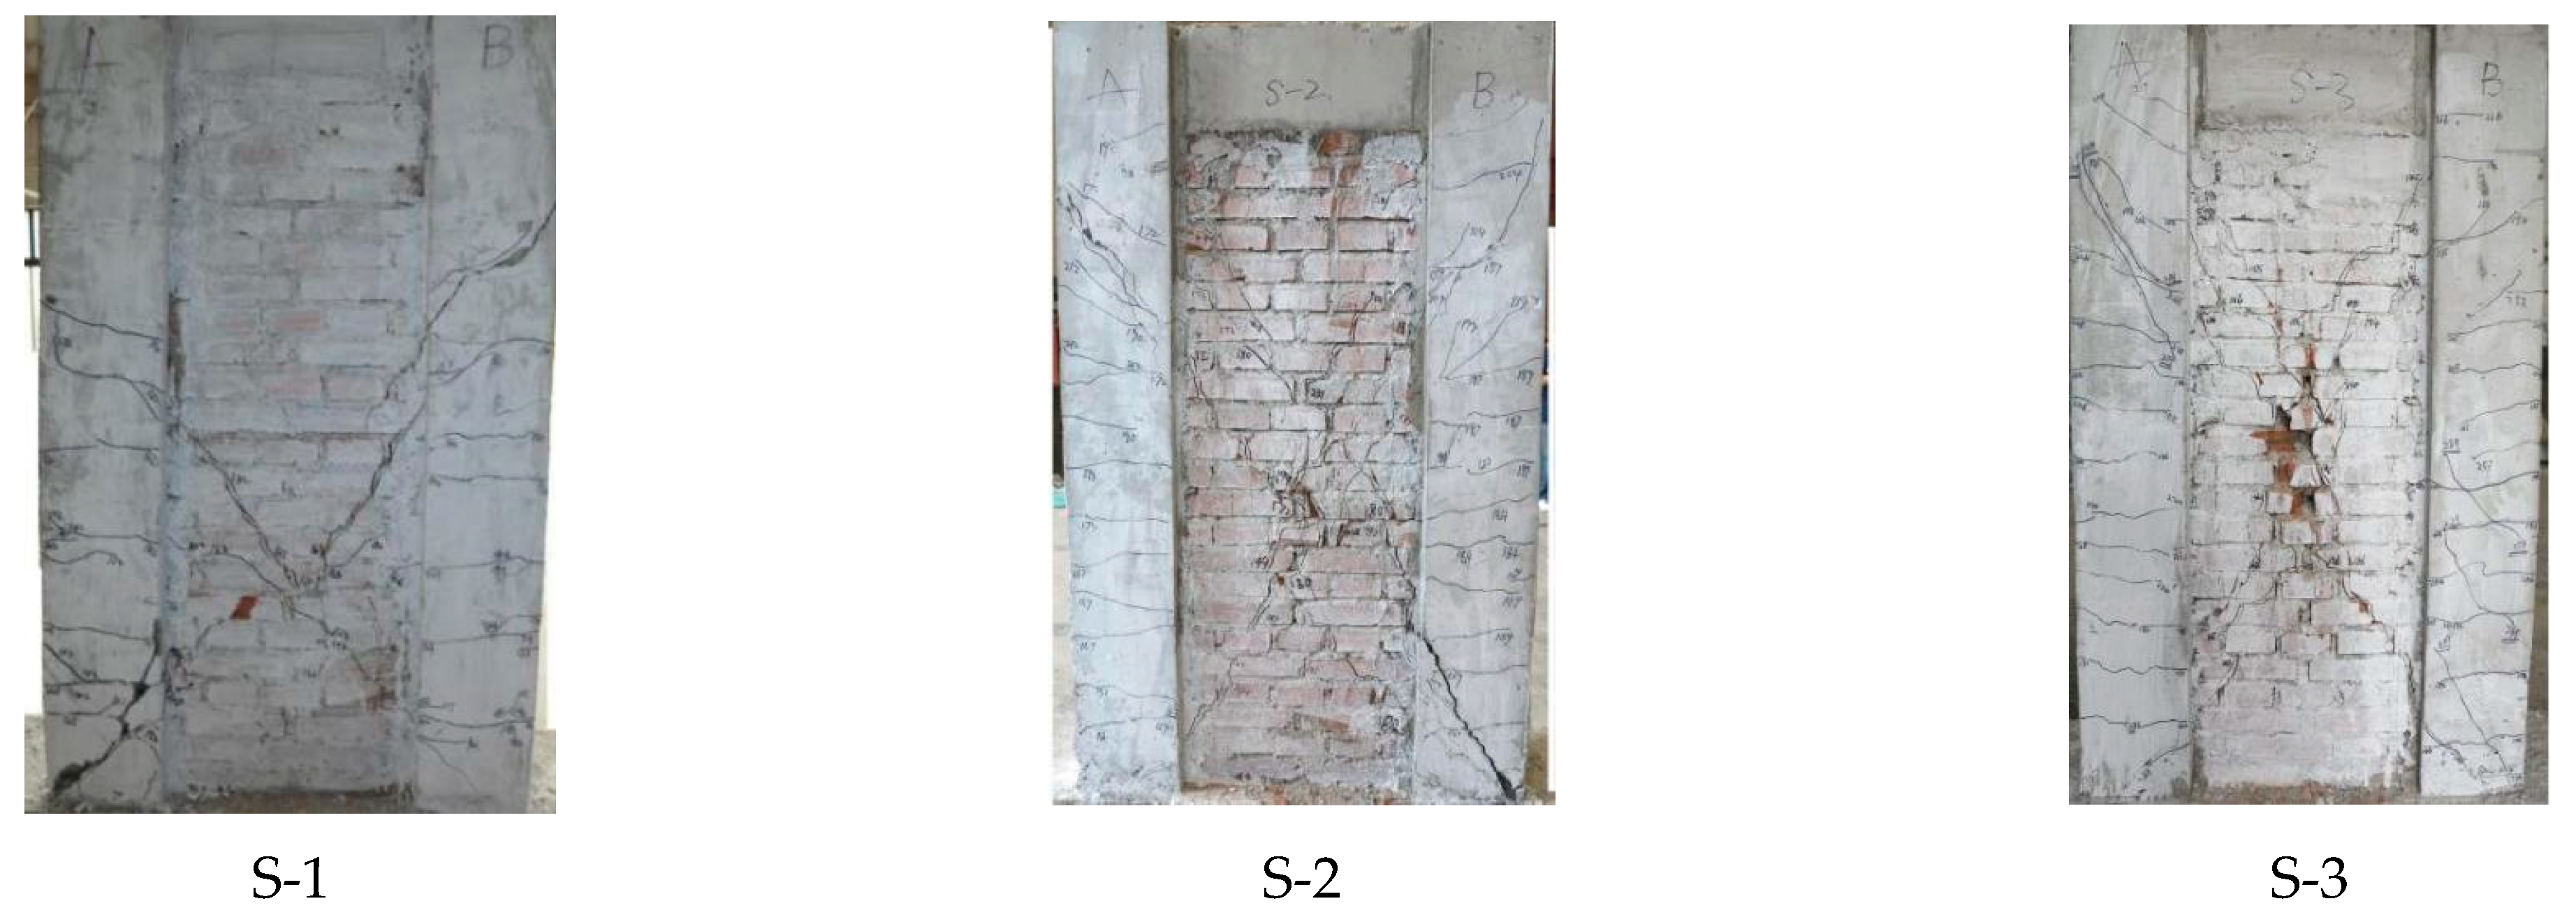
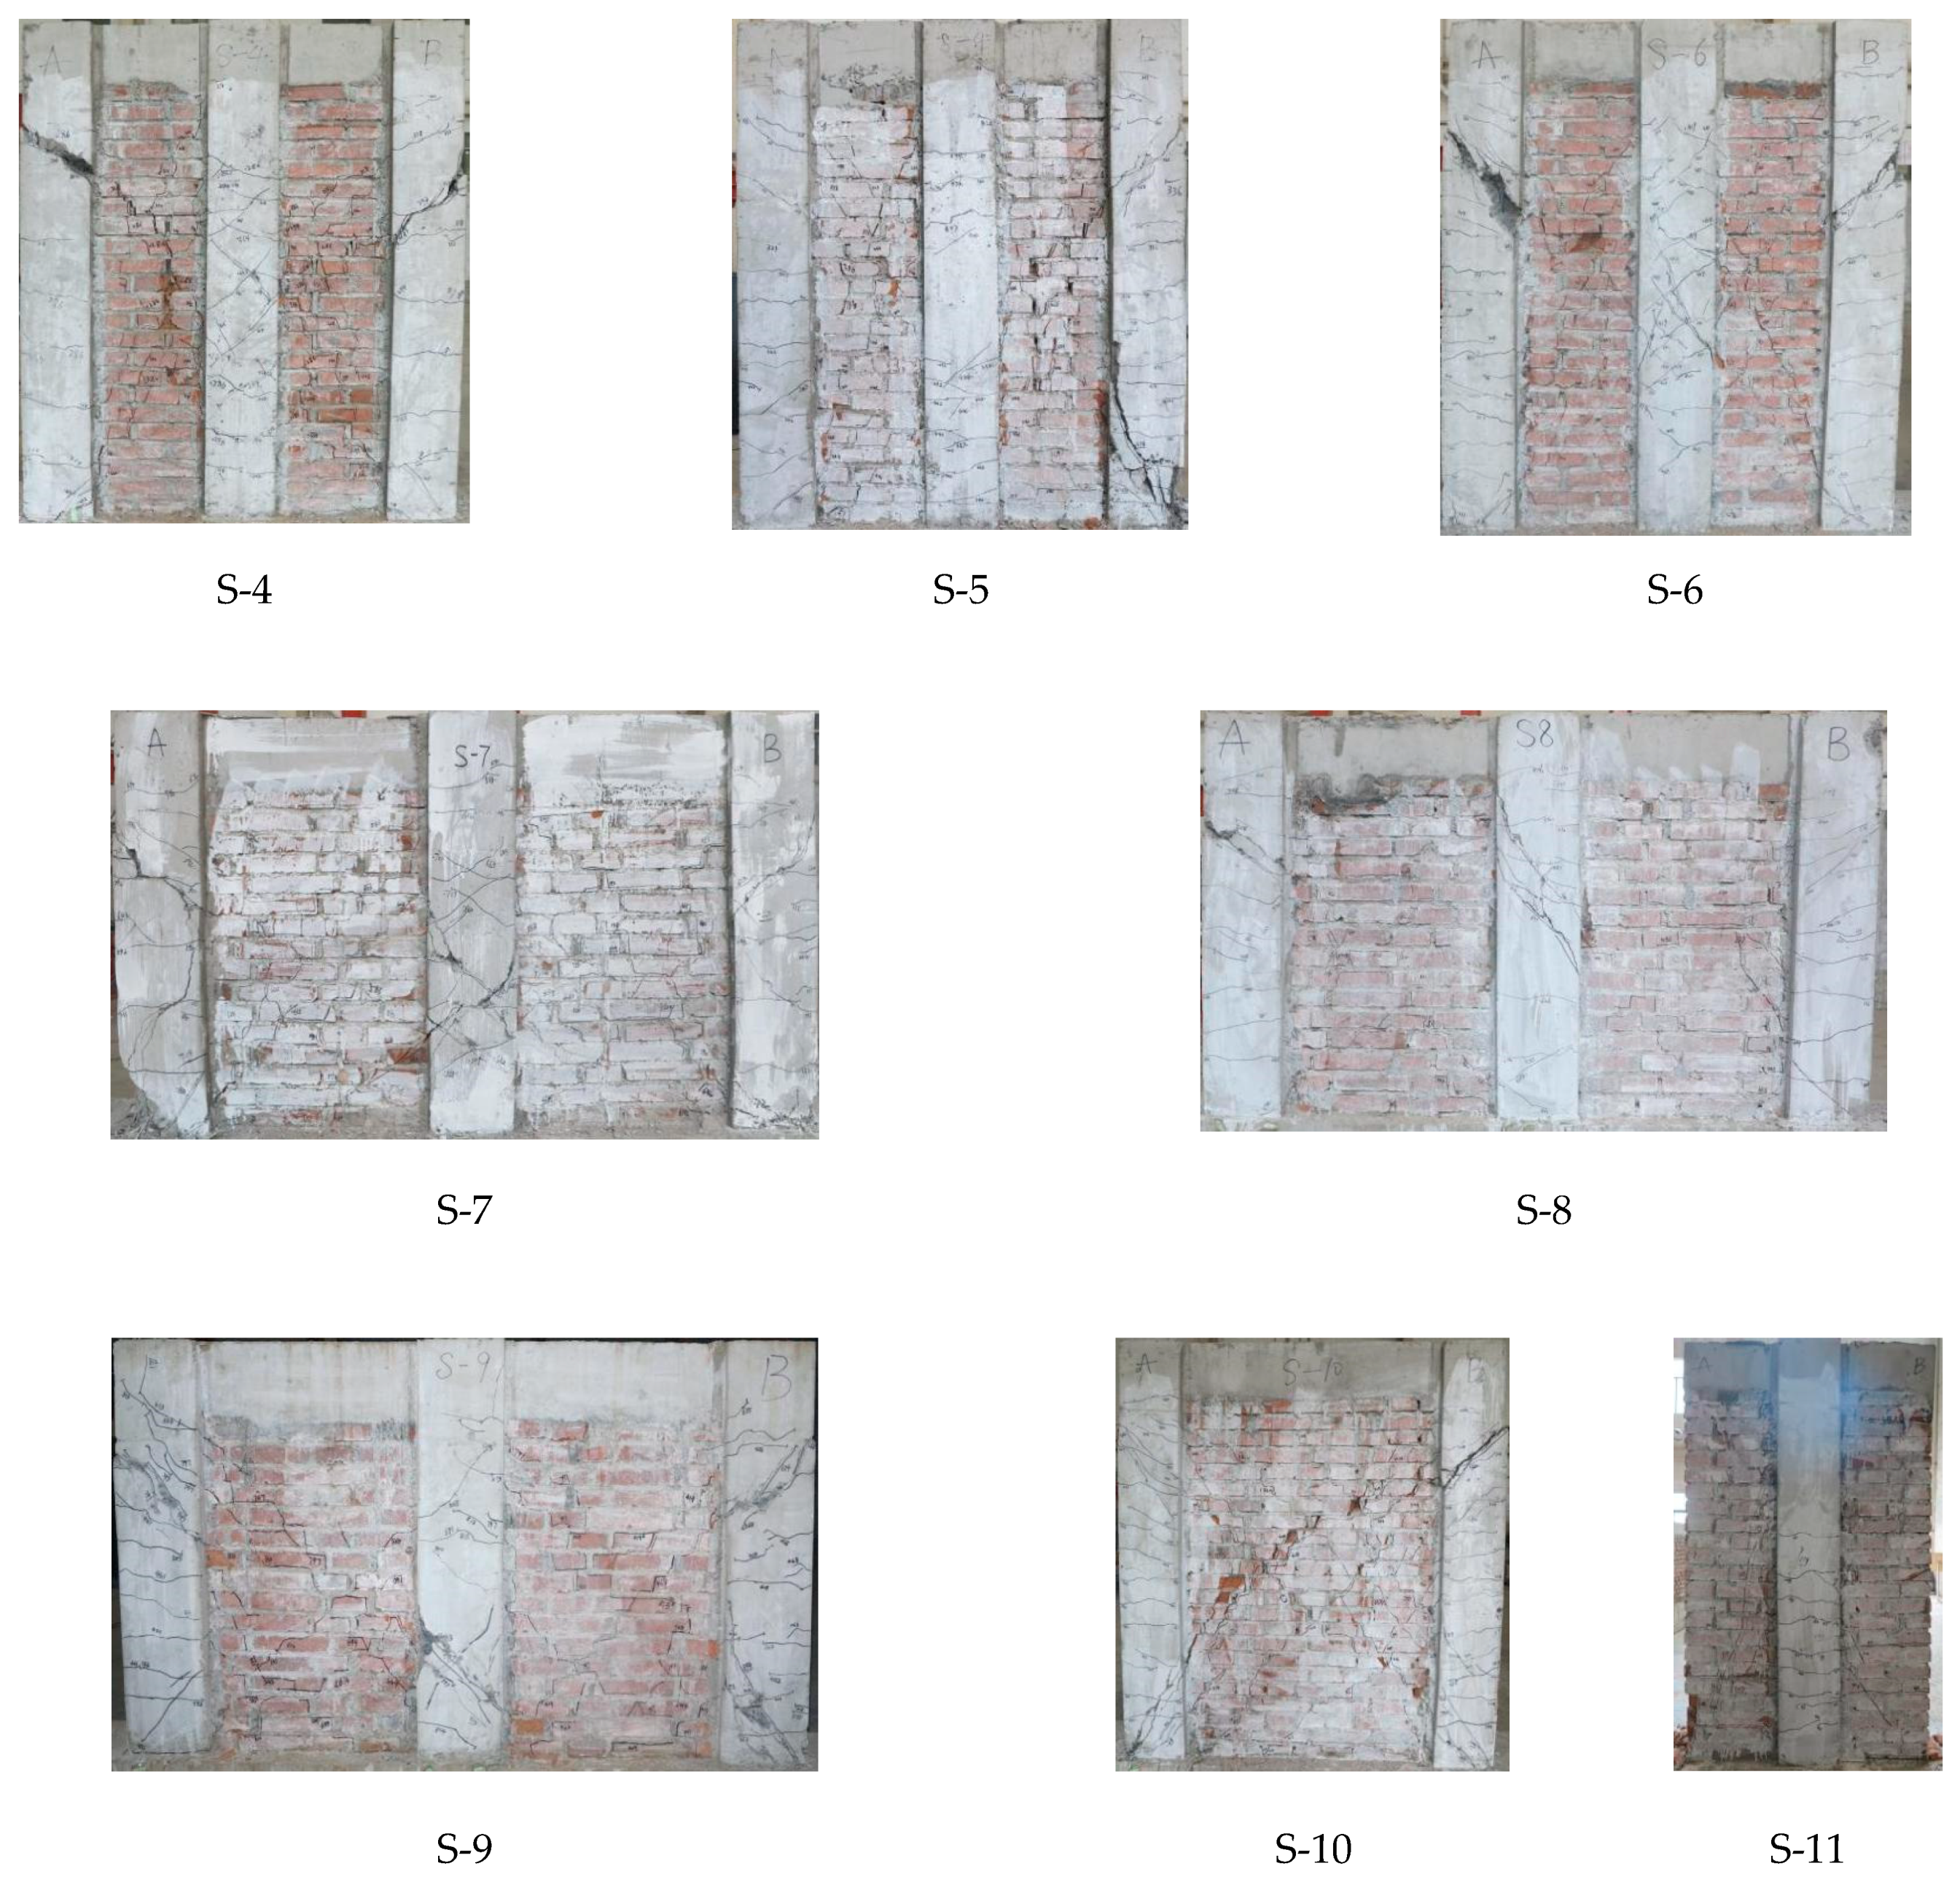
2.1. Occurrence and Development of Wall Cracks

During the initial loading stage of the test, no cracks appeared on the wall surface, and the stress of the wall changed approximately linearly with the displacement; in this case, the wall was in the elastic deformation stage. When the load increased to 30–50% of the ultimate load, fine horizontal cracks first appeared at the connection between the base of the composite column at the end of the wall and the base beam. Then, with the further increase in the load and displacement, the horizontal cracks of the composite column at the end gradually became longer and wider and gradually increased in number upward along the column until reaching the top of the column. When the load reached 70–80% of the ultimate load, cracks began to appear in the wall. Almost at the same time, diagonal shear cracks appeared in the middle and lower sections of the middle composite column. Wall cracks occurred in three ways. First, independent diagonal cracks appeared in the middle of the wall during the loading process, such as those in specimens S-2, S-3, and S-6. Second, horizontal cracks extended from the middle and upper parts of the end columns, such as those in specimens S-1, S-4, S-5, S-8, S-9, and S-10. Third, cracks extended from the middle column, such as those in specimen S-7. As the load and displacement continued to increase, the diagonal cracks in the wall and the column extended with each other. When the load reached a certain value, the cracks were essentially fully developed, and new cracks rarely appeared. One or two intersecting diagonal cracks coalesced diagonally and developed completely, forming an X-shaped main crack.
In specimen S-11, cracks first appeared on the left side of the wall, about two bricks above the base of the wall, and then developed and extended toward the middle composite column. With the increase in the displacement-controlled load, multiple horizontal cracks appeared in the wall and in the middle and lower part of the composite column, and at the same time, diagonal stepped cracks occurred in the wall. Eventually, the bricks on both sides of the base of the wall were crushed, and the maximum bearing capacity of the structure was reached.

2.2. Failure Mode and Bearing Capacity of the Wall

After the formation of the X-shaped main crack, compression cracks quickly appeared in the concrete at the base of the end column, and the bearing capacity of the specimen reached its limit at this time. Then, the bearing capacity of all members decreased, and the cracks further developed until the end of the test, at which time the edge concrete at the base of the end column showed compression damage in most of the specimens. The bond failure or slip between concrete and masonry in the composite column did not occur in the test. Figure 6 shows the failure mode of each specimen. In summary, all specimens experienced flexural failure. The load-bearing capacity and displacement test results of each specimen are presented in Table 4.

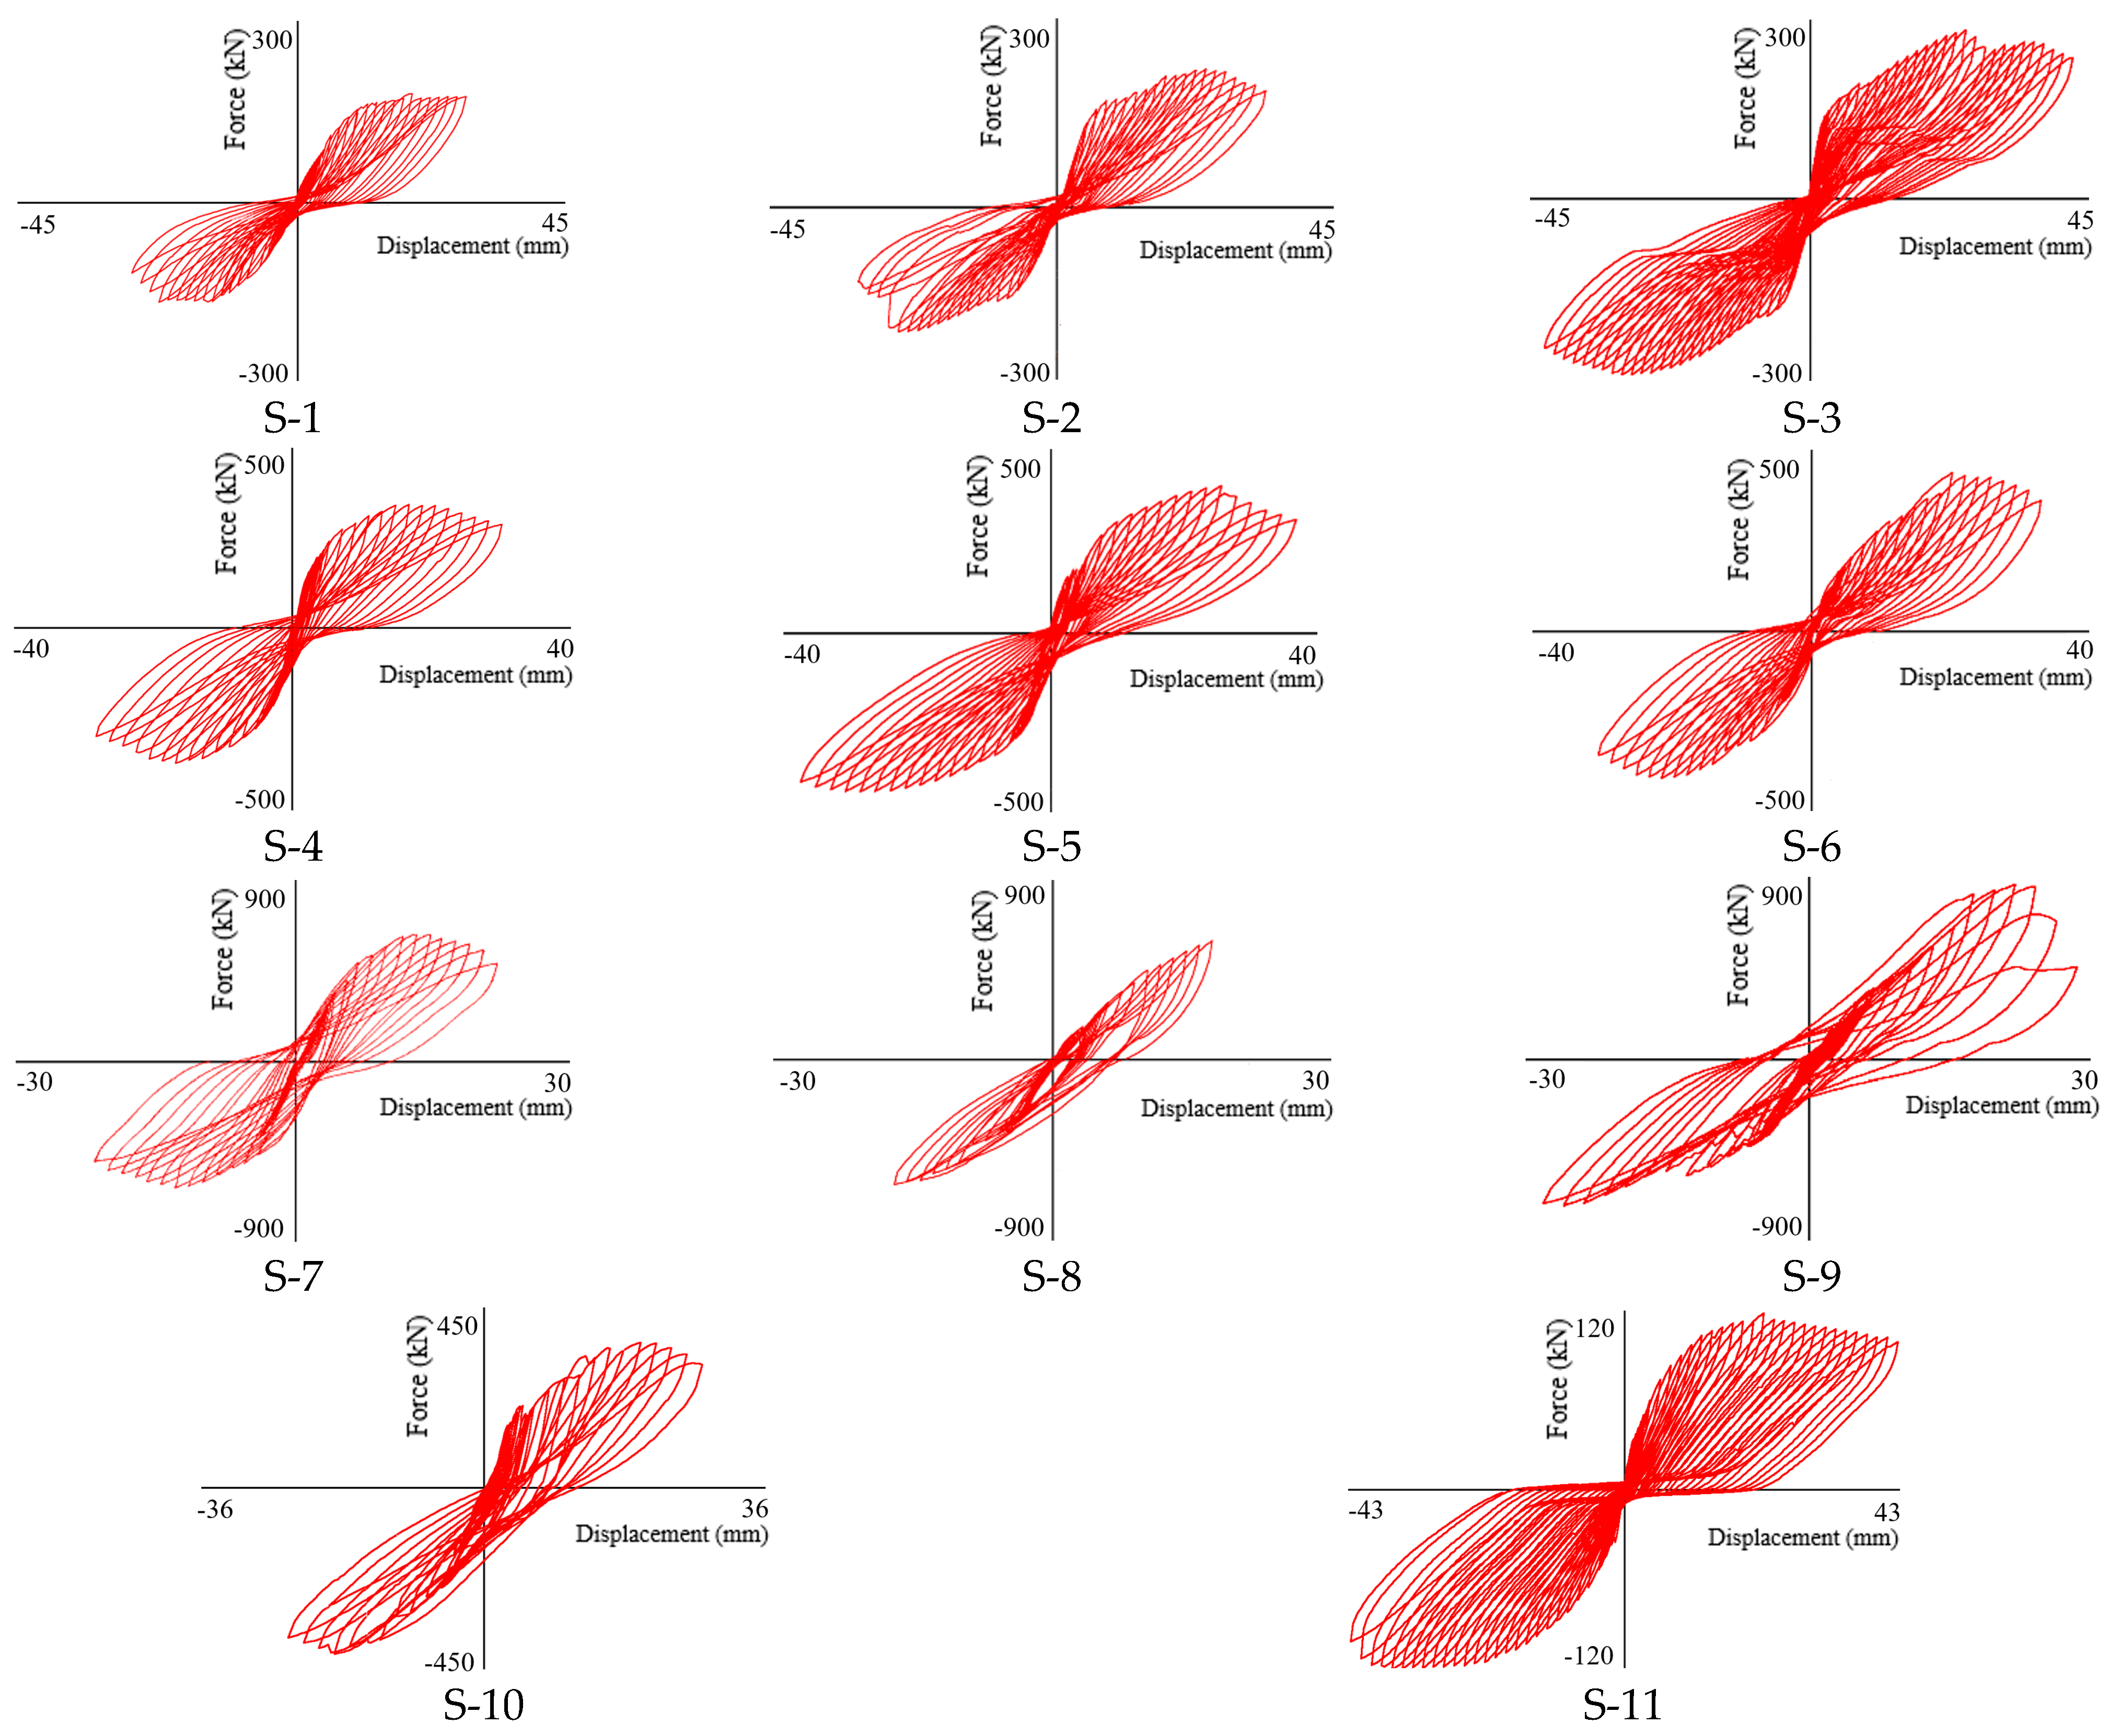
2.3. Hysteresis Curves

The hysteresis curves of these specimens are shown in Figure 7.

3. Test Result Analysis

3.1. Hysteresis Curves

Before the specimens cracked, all the walls were in the elastic stage, and the load-displacement curves exhibited an approximately linear increase trend. The hysteresis curves were nearly a straight line, and the area enclosed by the hysteresis loop was small.
After cracking, the stiffness of the specimens decreased, and their plastic deformation gradually increased. Along with the increase in loading, cracks gradually developed. Due to the opening and closing of inclined cracks, the specimens experienced significant displacement even under relatively small loading, causing slippage and “pinching” phenomena in the hysteresis curves.
After reaching the ultimate load, the bearing capacity decreased gradually, the plastic deformation of the wall continued to increase, the energy dissipation capacity of the wall reached its maximum, the energy dissipation capacity decreased gradually, and the rate of increase in the hysteresis loop area began to decrease. In this case, the increase in the hysteresis loop area was mainly manifested in the concrete damage of the composite column and the tension of the rebars.
As seen in the above hysteresis curves, after cracking, the presence of the composite column resulted in a long process of sustained and increasing strength in the specimens, thus resisting the collapse caused by the brittle failure of the wall under earthquake action. The mechanics characteristic is consistent with the research findings of concrete block walls having concrete columns placed at different intervals [35].
Comparing the hysteresis curves of S-1 and S-11, it is shown that adding a composite column could result in a decreased degree of “pinching” in the hysteresis curve with increased plumpness, which allowed for better absorption of seismic energy and enhanced the seismic energy dissipation capacity of the specimen.

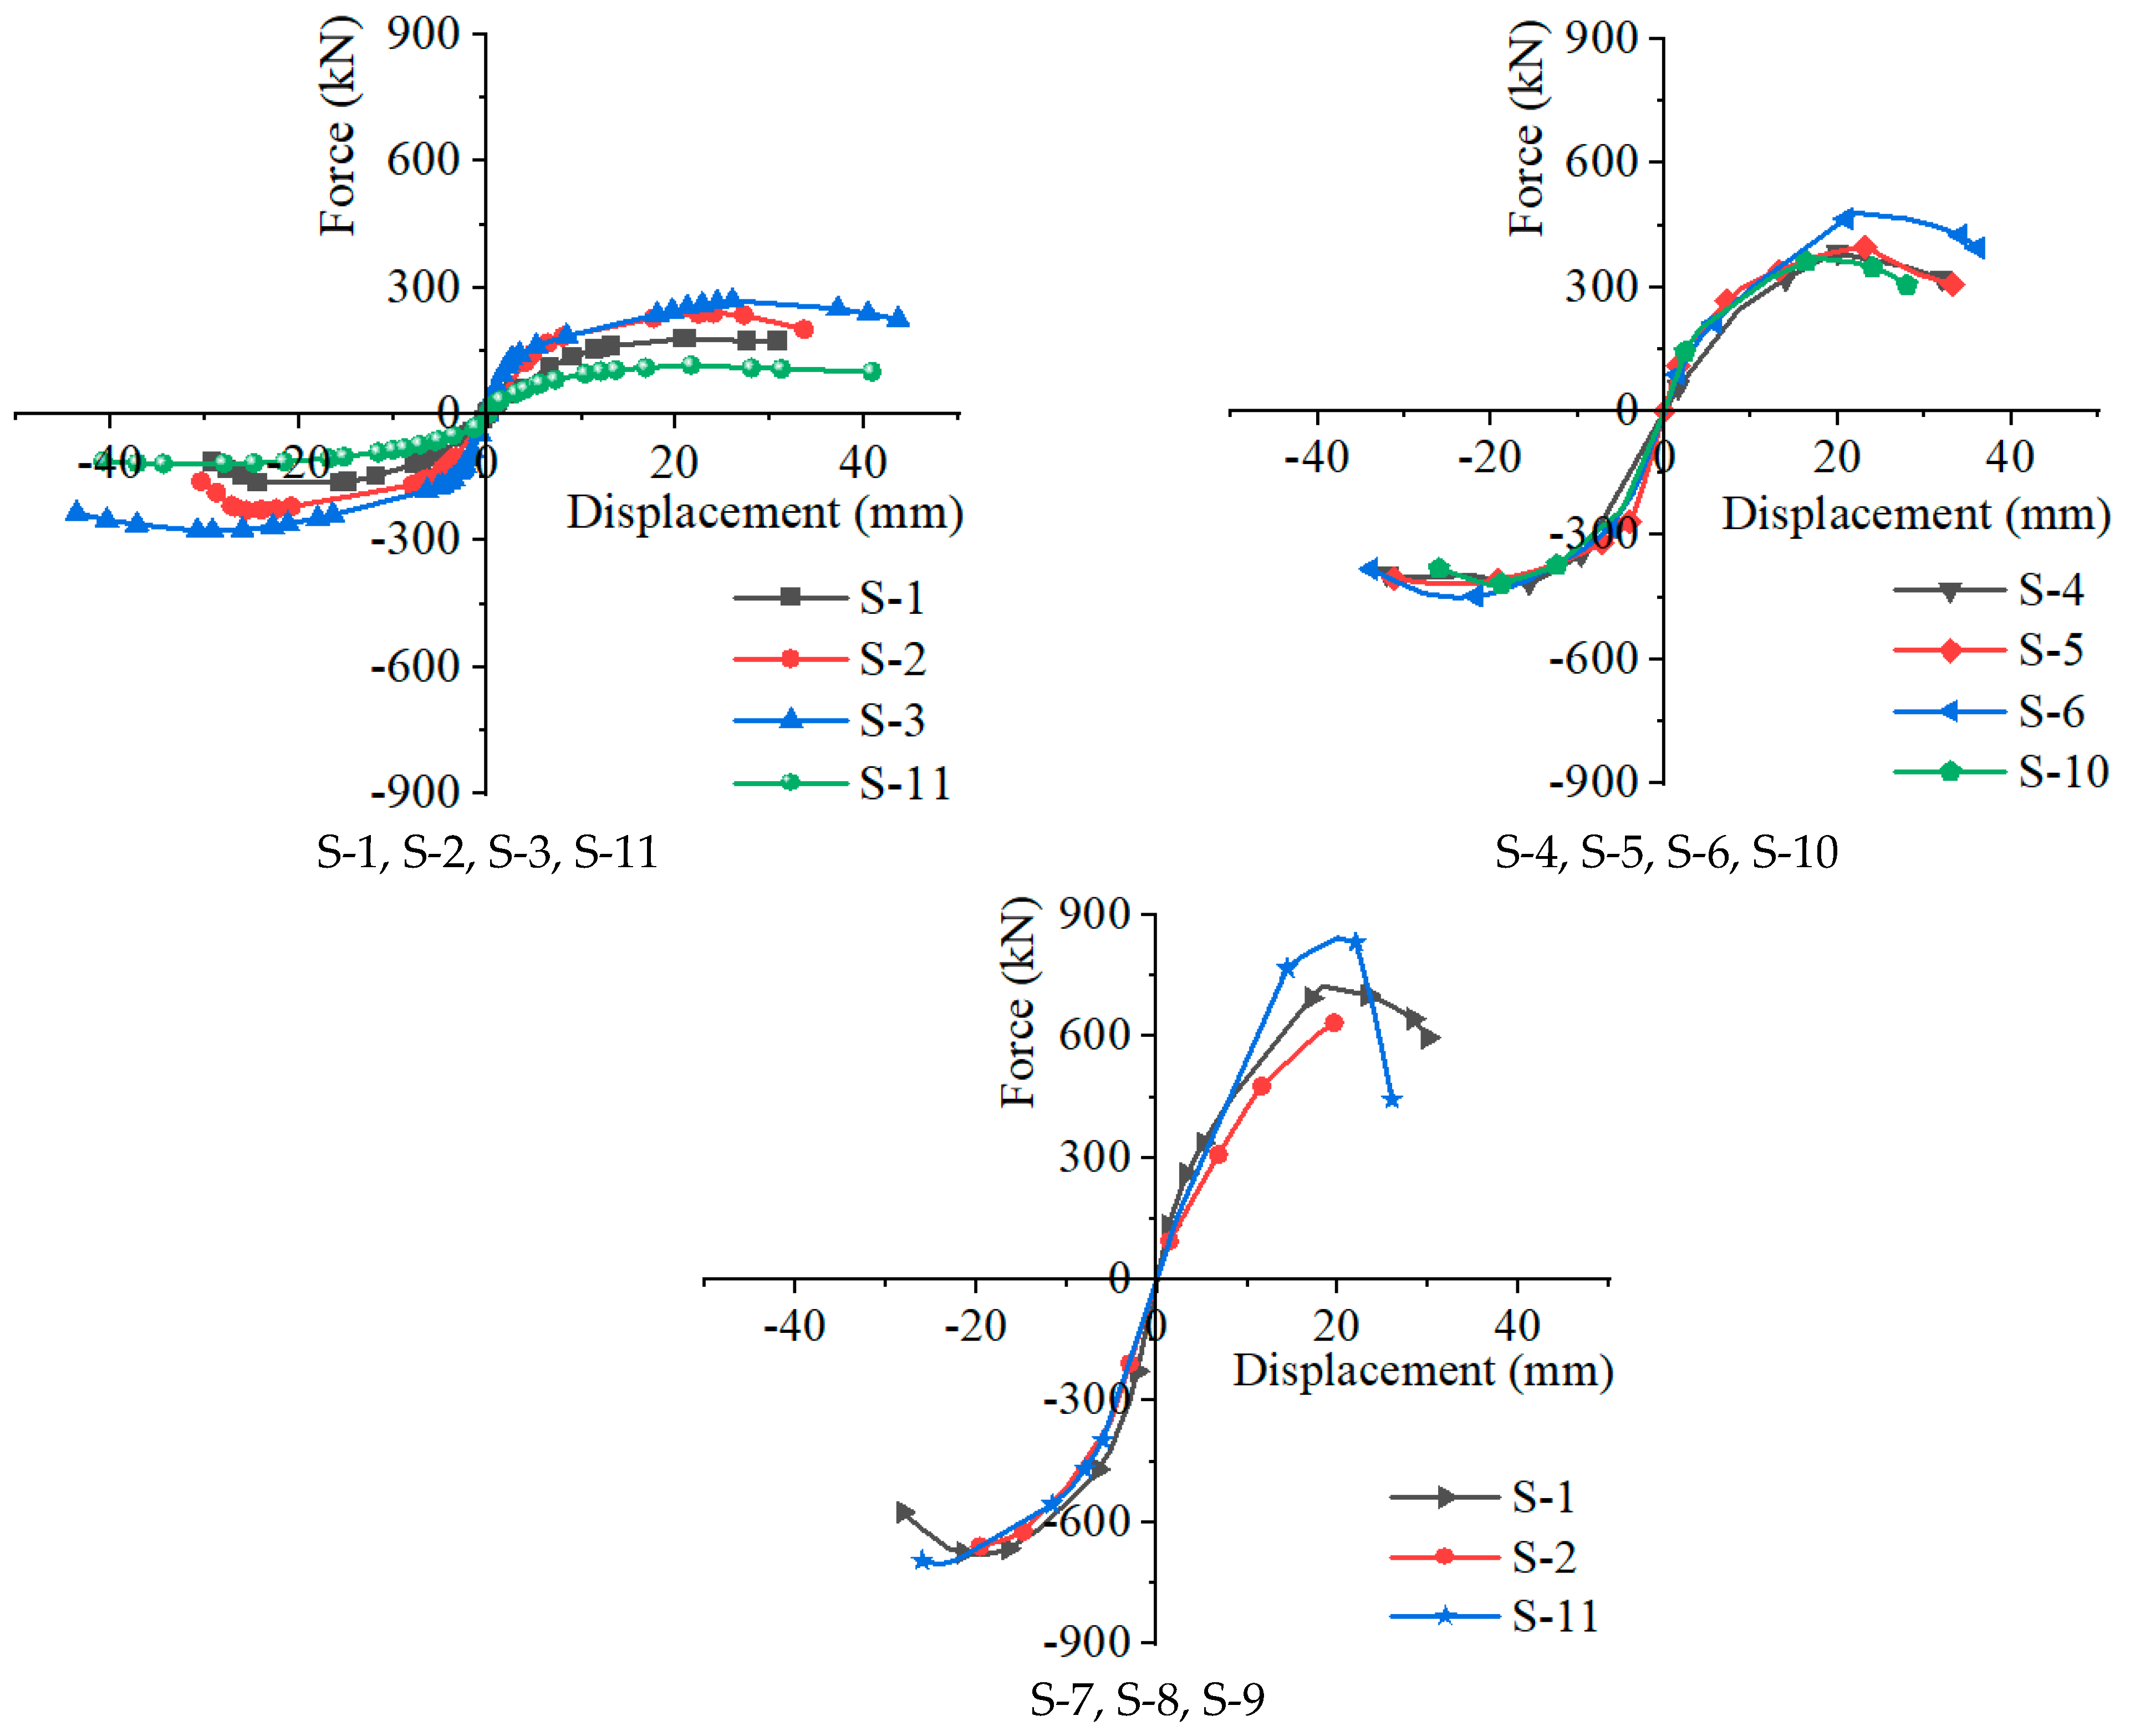
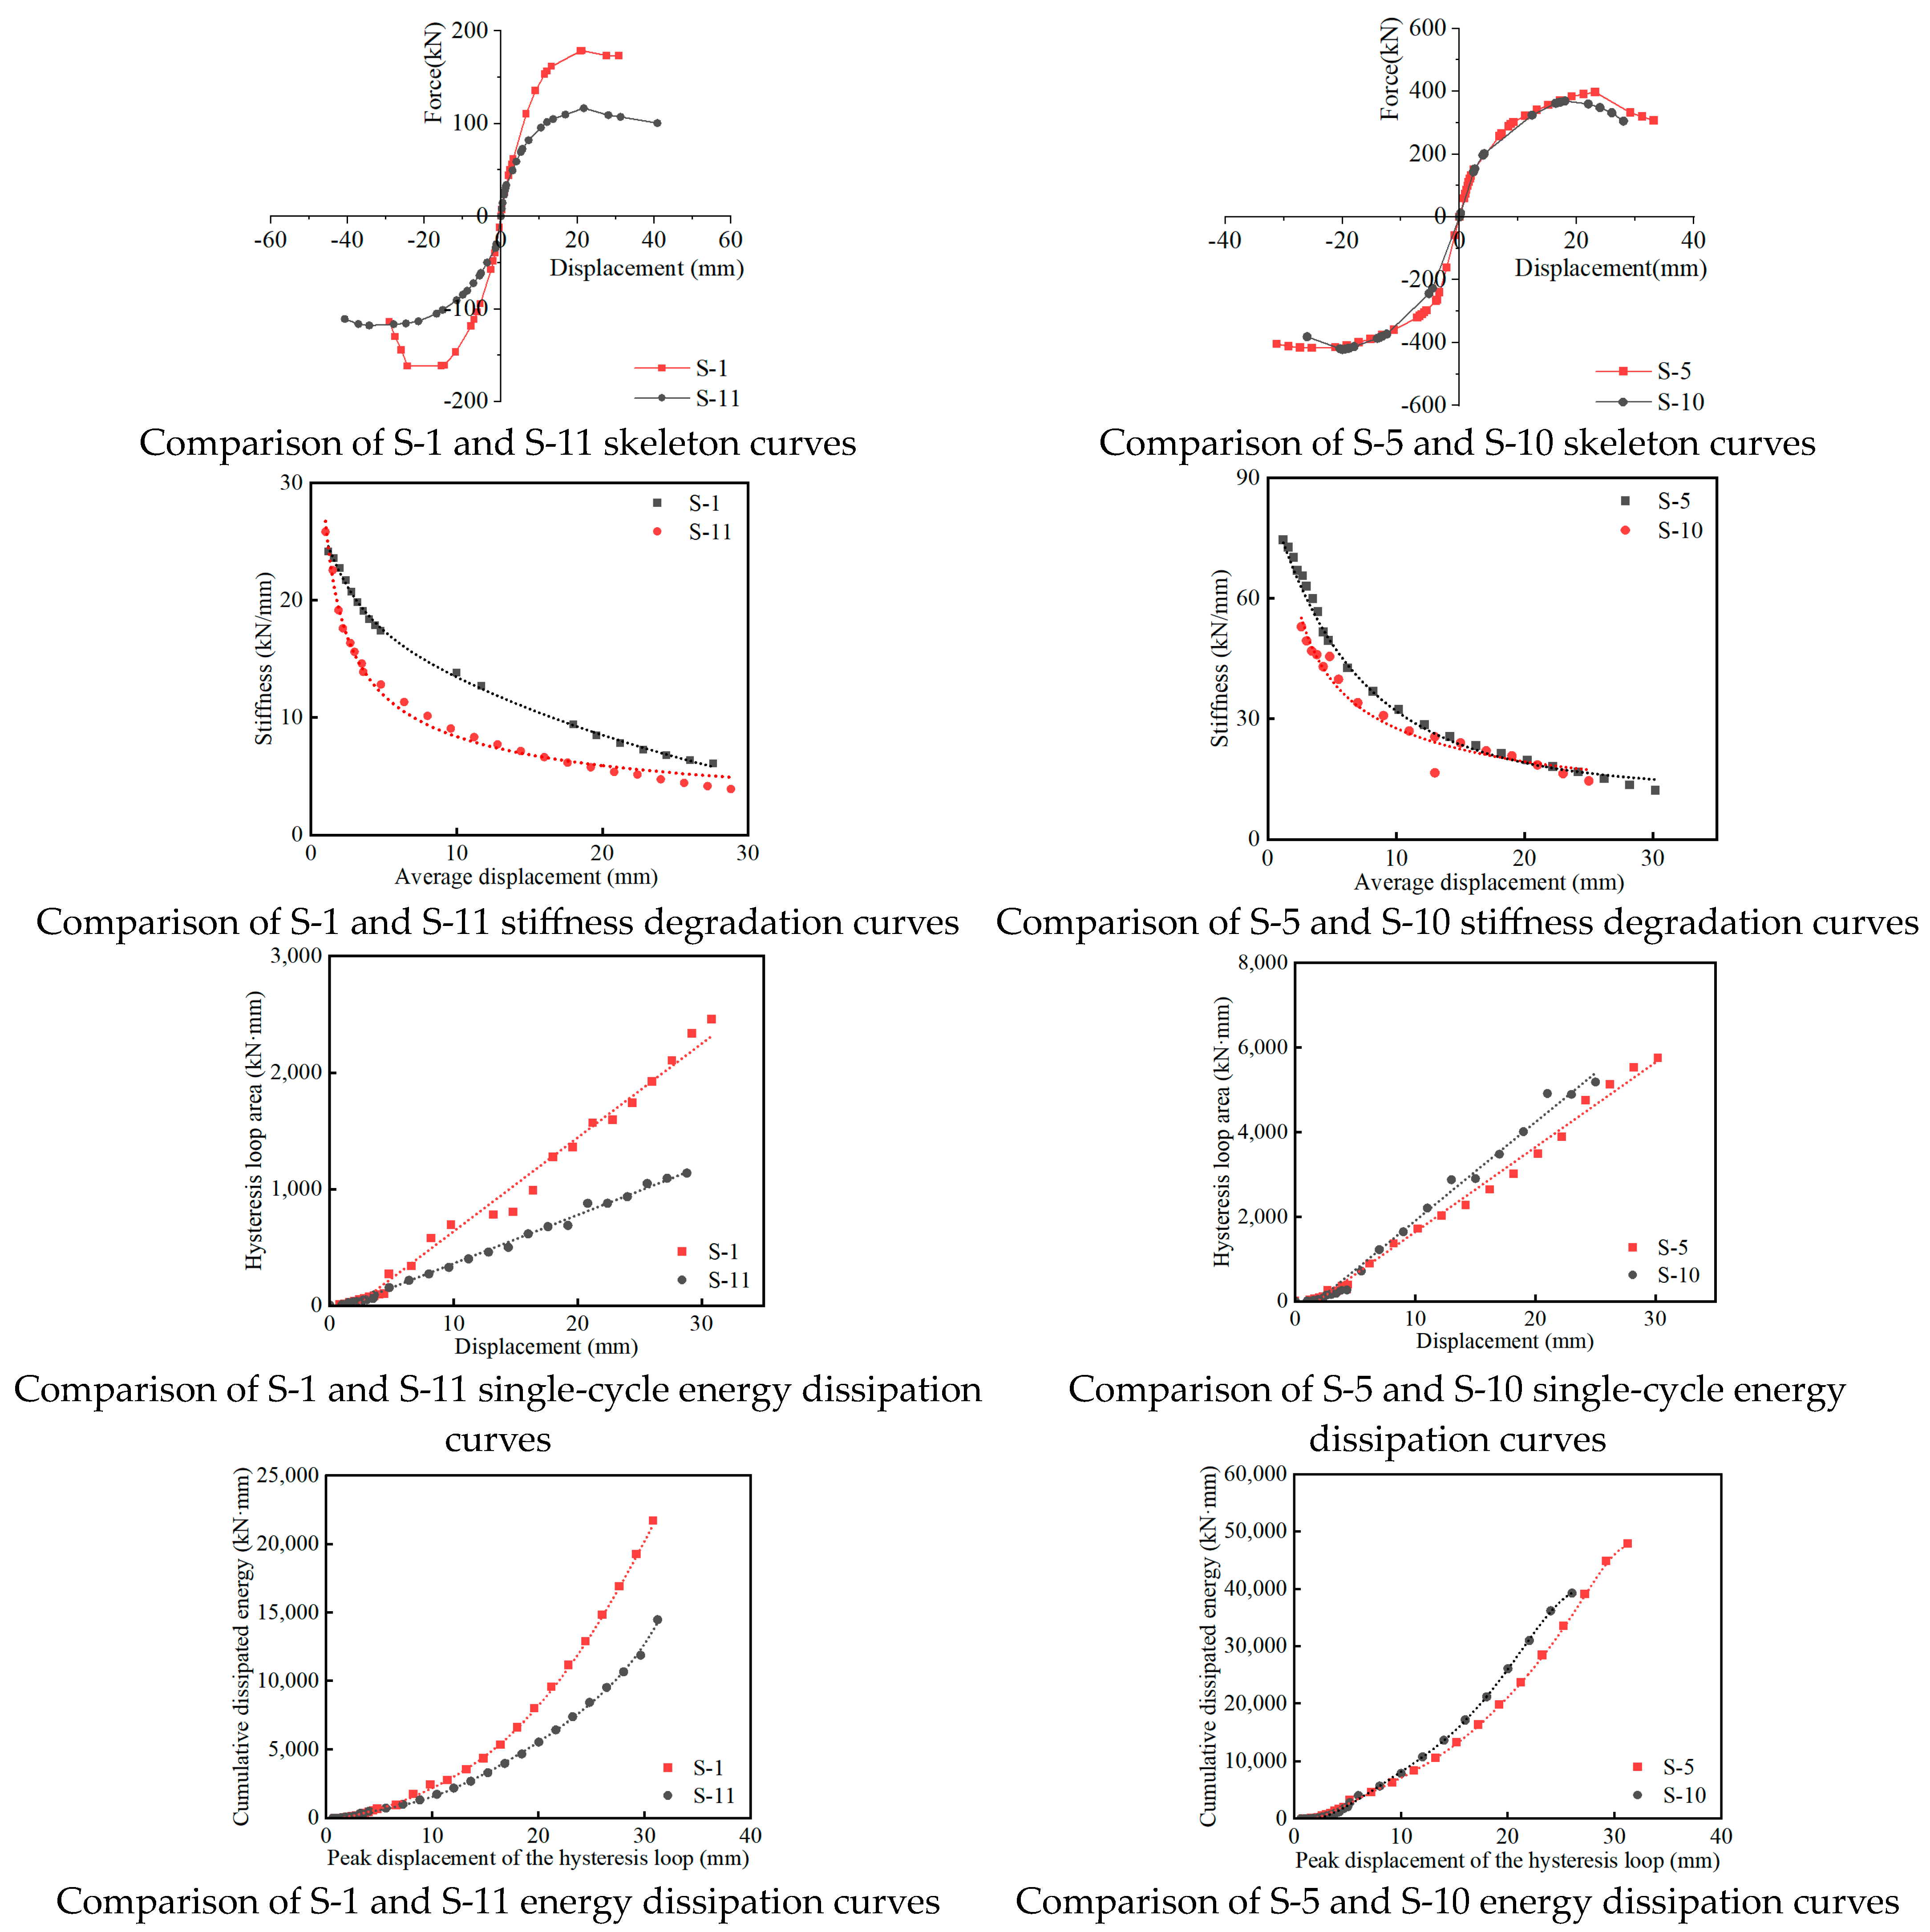
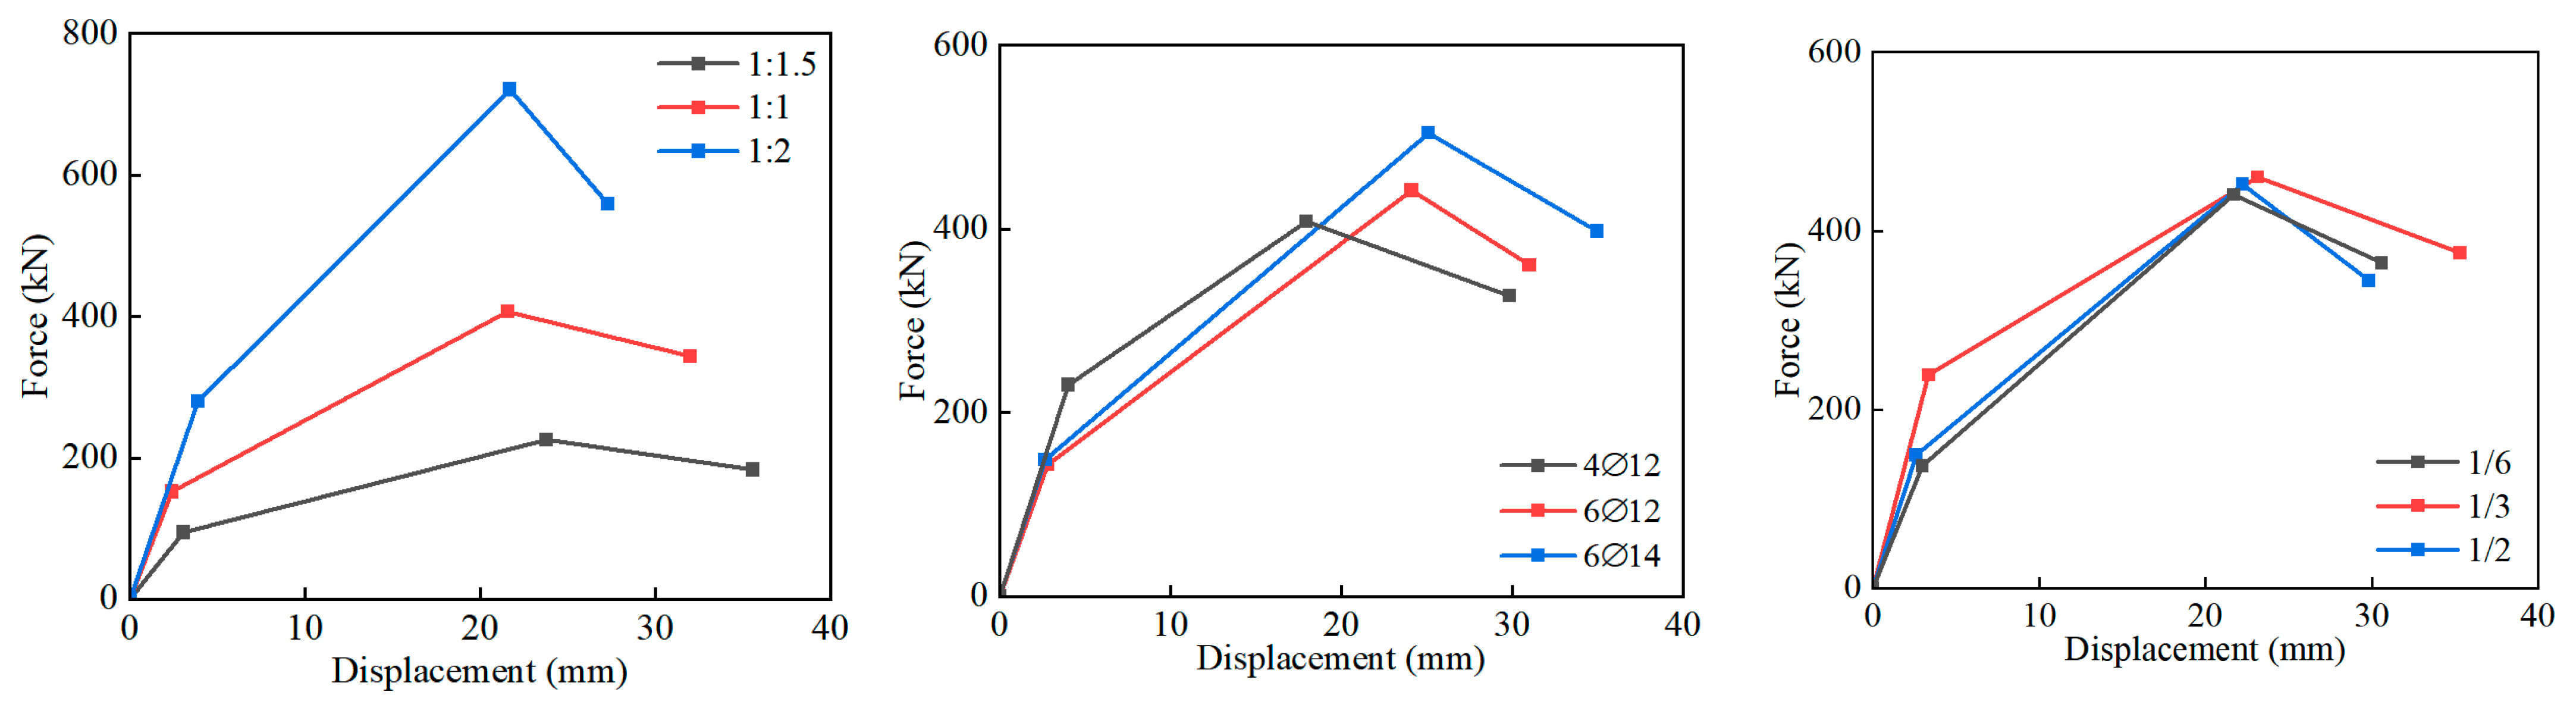
3.2. Skeleton Curves

The skeleton curves of the specimens are shown in Figure 8.
During the initial loading phase, when the specimens were in the elastic working stage without cracking, the skeleton curves were generally linear. After cracking, due to the crack propagation, the stiffness of the specimens decreased with gradual increases in their plastic deformations. Note that, when wall cracks appeared, the shear capacities of the specimens were significantly weakened, leading to further reduction in their stiffness and noticeable bending of the skeleton curves. After reaching the ultimate load, the load-carrying capacities of the specimens decreased along with increased deformations, which was exhibited as the declination of the skeleton curves until the final failures.
The specimens with high height-to-width ratios were primarily subjected to bending as their shear span ratios were also large. The appearance of the wall shear cracks led to a further decrease in the stiffness of the specimens yet had relatively small impacts on their load-carrying capacities. Therefore, even after wall cracking, the specimens still possessed a certain level of bending resistance and deformation capacity. Good ductility was achieved for these specimens with a pronounced yielding stage in the curves.

3.3. Analysis of the Influence of the Location and Spacing of Composite Columns

Figure 9 compares the skeleton curves, stiffness degradation curves, single-cycle energy dissipation curves, and cumulative energy dissipation curves between specimens S-1 and S-11 and between S-5 and S-10.
A comparison of the S-1 and S-11 curves in conjunction with the test phenomena and failure modes of the specimens shows that before cracking, the specimens were in the elastic stage, the composite columns participated in load bearing to a small extent, and the stiffness and energy dissipation capacity of the specimens were essentially the same. After cracking, the stiffness of the specimens decreased, and the composite columns arranged at the end were more conducive to bearing the bending moment generated by the horizontal load. Therefore, S-1 had a small stiffness degradation, a large energy dissipation capacity, and a high bearing capacity. Compared with that of S-11, the load-bearing capacity of S-1 increased by 45%, the stiffness in the elastic–plastic stage of S-1 increased by approximately 40%, and the total energy dissipation capacity of S-1 increased by approximately 50%.
A comparison of the S-5 and S-10 curves shows that the skeleton curves of the two are essentially the same. Since the specimens failed in bending, the addition of a middle composite column had little effect on its bearing capacity and stiffness. However, in the failure stage, due to the enhanced confinement effect of the middle column on the masonry wall, the ultimate displacement and cumulative energy dissipation capacity of S-5 were higher than those of S-10 at failure.
In summary, the arrangement of the composite column at the end of the wall can substantially increase the bearing capacity, stiffness, and energy dissipation capacity of the wall; in comparison, when a flexural failure occurs, the arrangement of the composite column in the middle of the wall has little effect on the bearing capacity and stiffness of the wall but can improve the ductility of the wall.
Therefore, it is generally suggested the composite columns can be placed at the ends of the wall if a strengthening measure is required. For walls with height-to-width ratios less than 1, it is recommended to add composite columns in the middle to enhance their shear capacity and ductility.

3.4. Influencing Factors of Load-Carrying Capacity

Taking the cracking load, ultimate load, and failure load as the boundaries, the skeleton curve can be simplified to a trilinear curve with elastic, elastic–plastic, and failure stages to analyze the initial stiffness, stiffness degradation, load-bearing capacity, and energy consumption under earthquake action.
Comparing the results of S-1 to S-9 and conducting the range analysis, the patterns of the influence of the aspect ratio, the composite column reinforcement ratio, and the axial load ratio on the trilinear skeleton curve are obtained, as shown in Figure 10.
As shown in Figure 10, the aspect ratio has the greatest influence on the structure: a smaller aspect ratio leads to larger bearing capacity and stiffness. After wall cracking, the degree of stiffness degradation was small. In comparison, during the damage phase, the rate of stiffness degradation was relatively fast, and the ductility was comparatively poor.
The reinforcement ratio of composite columns has a relatively small effect on the structure. The bearing capacity and ultimate displacement of the specimen increased with the increase in the reinforcement ratio which had no obvious effect on the degradation pattern of stiffness. The axial load ratio has the weakest influence on the structure: after cracking, members with a small axial load ratio experience a small degree of stiffness degradation, but their load-bearing capacity decreases. The deformation is reduced under the ultimate load.

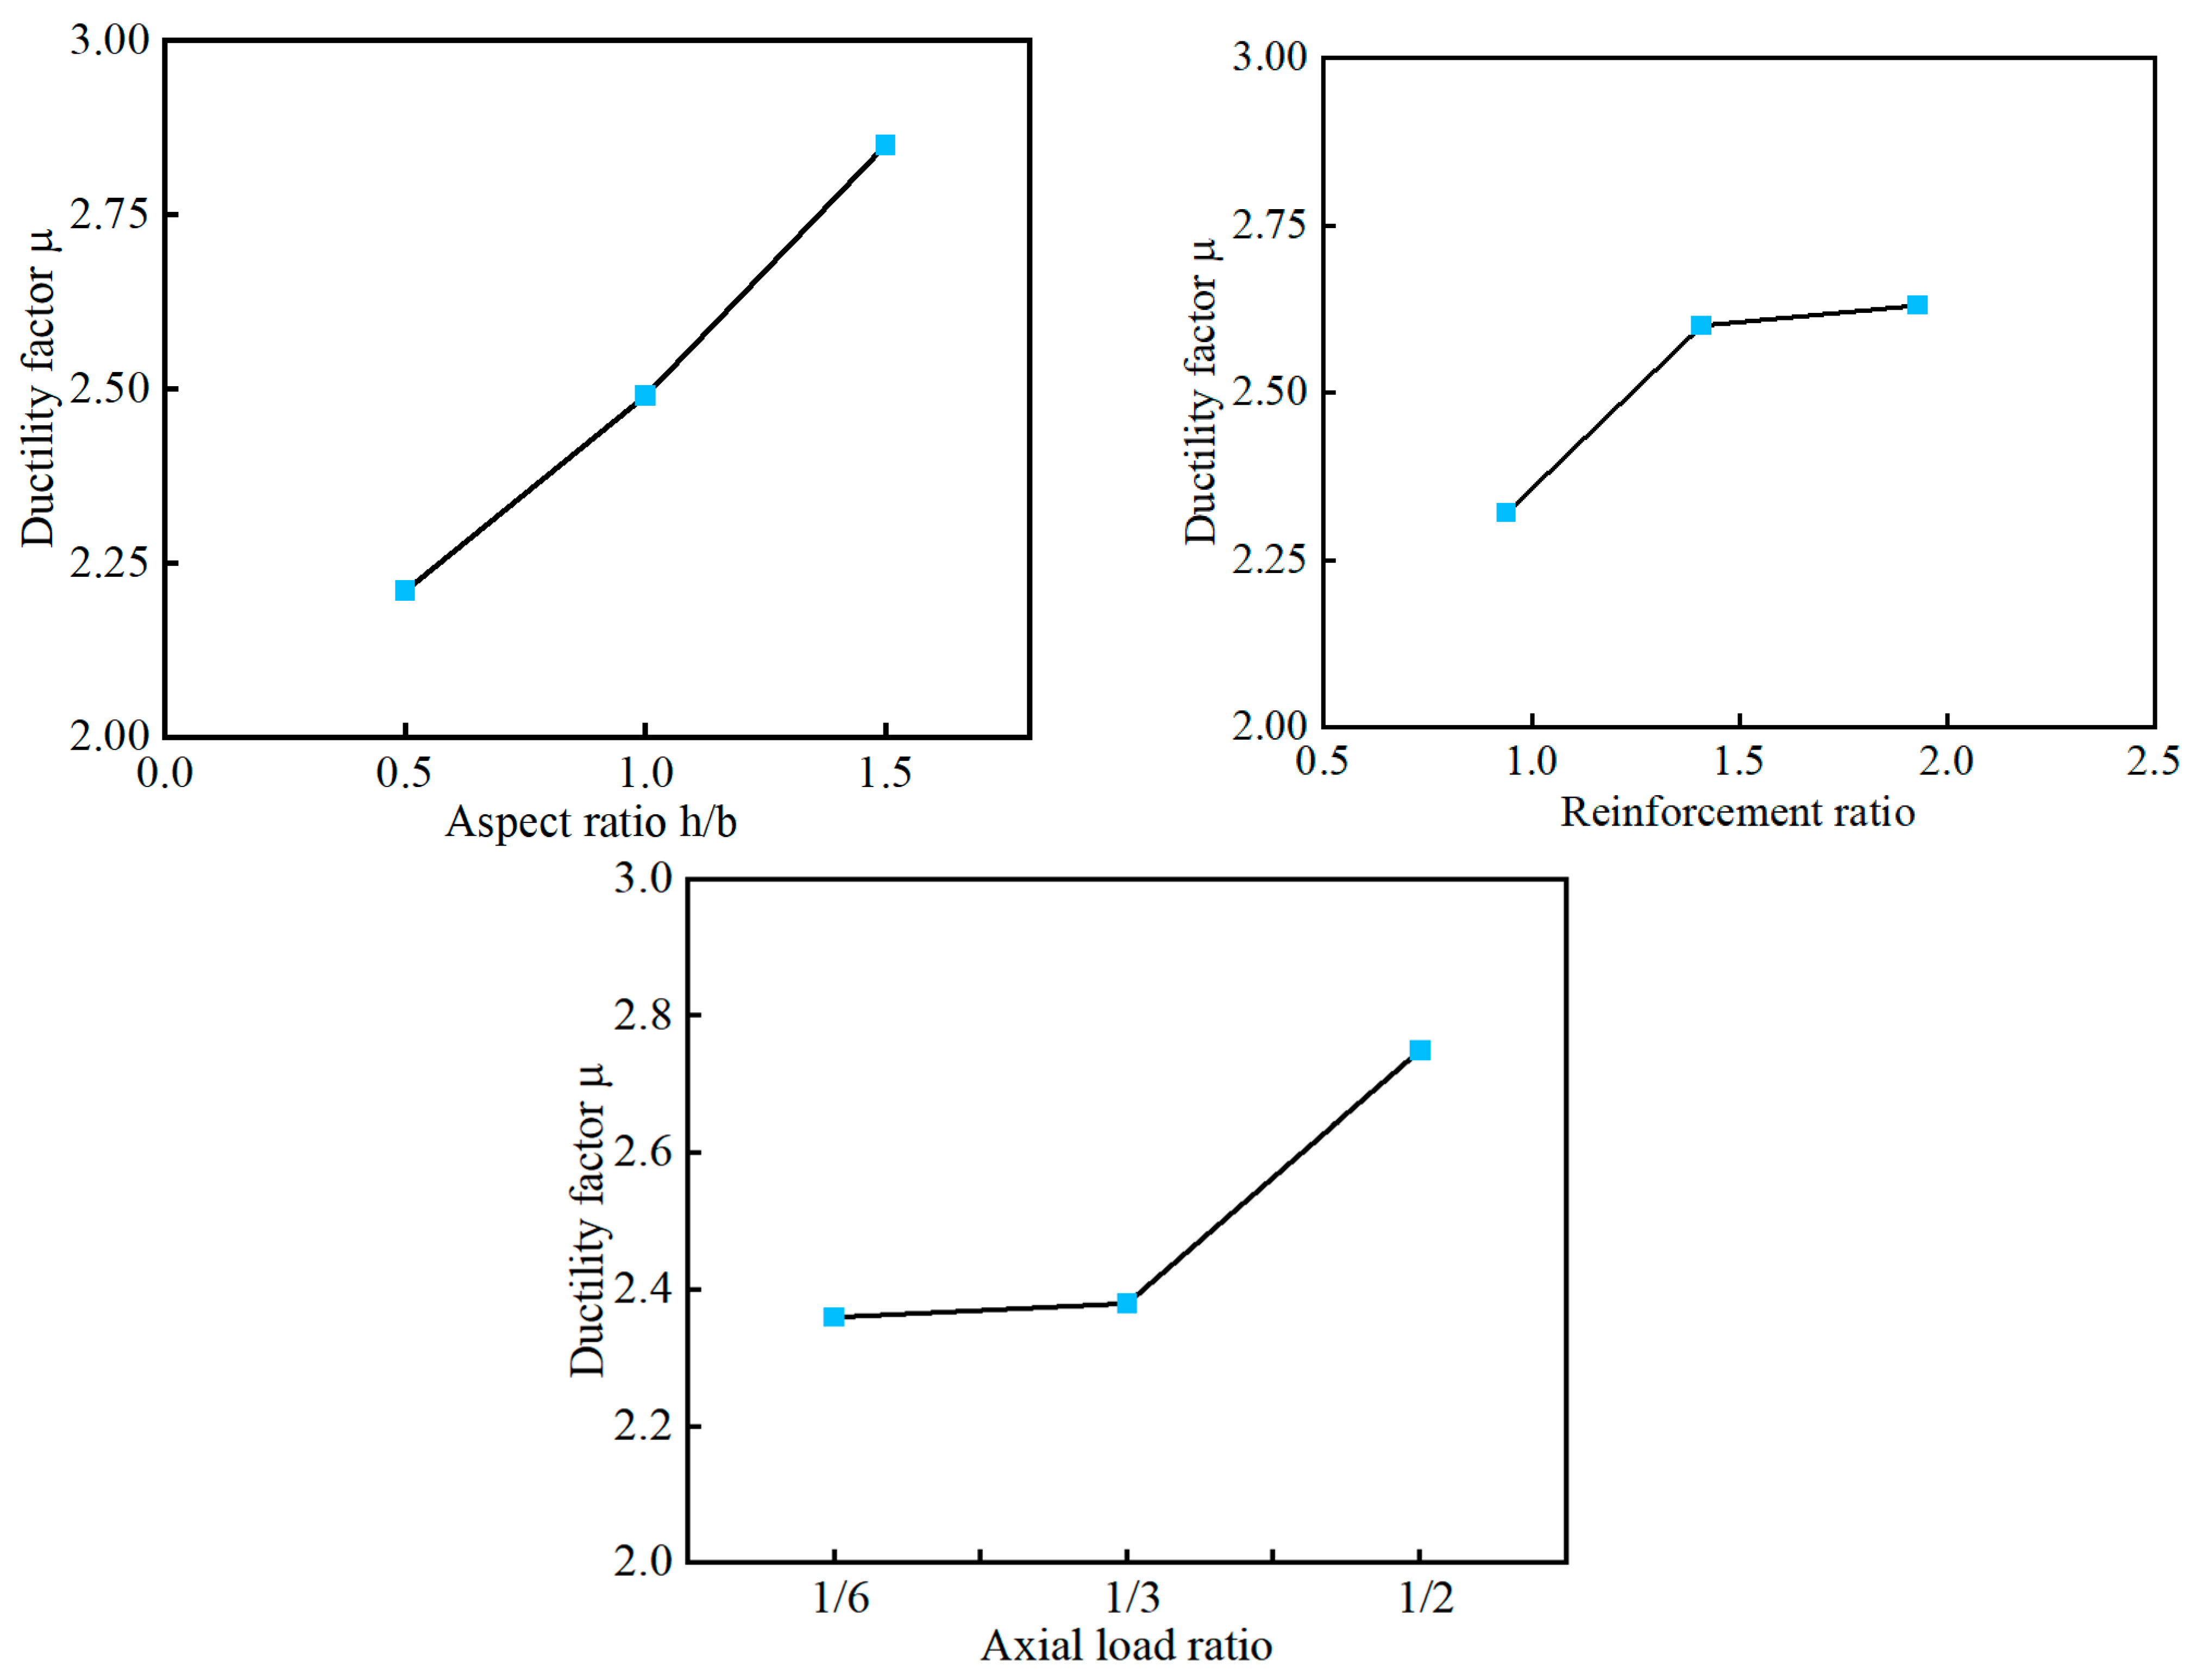
3.5. Ductility Analysis of Masonry Walls Strengthened with Composite Columns

The displacement ductility factor of a specimen refers to the ratio of the ultimate displacement to the yield displacement. In this test, when the load decreased to 85% of the ultimate load, the bearing capacity of the specimen did not decrease significantly, but there was a large deformation. Therefore, the ultimate displacement is taken as the displacement when the load is reduced to 85% of the ultimate load. The yield displacement is determined from the skeleton curve using the energy method. The displacement ductility factor µ of each specimen is shown in Table 5. The displacement ductility factor of pure masonry walls is generally about 2.0 [36,37], and the ductility of the wall after the addition of composite columns is improved compared with that of pure masonry walls.
Improving ductility can enhance the seismic energy dissipation capacity of a structure. The presence of composite columns not only increases the ductility of the masonry wall but also provides restraints to it, thereby preventing overall collapse due to brittle failures.
According to orthogonal analysis, the influence of each factor on ductility is shown in Figure 11. The aspect ratio has the greatest influence on ductility; as the aspect ratio increases, the ductility of the specimen improves, and the aspect ratio is roughly linearly related to the member ductility factor. The reinforcement ratio of the composite column has a relatively pronounced influence on ductility when it is small, but the influence weakens as it increases. The influence of the axial load ratio on ductility is generally positive, i.e., the increase in the axial load ratio improves the ductility of the specimens.

4. Calculation and Analysis of the Flexural Capacity

4.1. Calculation Assumptions

The following assumptions are made:
(1)
The cross-section deformation conforms to the plane section assumption;
(2)
The masonry and concrete in the composite column work together without relative slip;
(3)
The tensile strength of concrete and masonry is ignored;
(4)
The constitutive model of materials is accepted.
Yankelevsky and Reinhardt and Teng et al. conducted relevant studies on the stress–strain relationship of concrete under cyclic tension and compression loads. Their results showed that the envelope of the stress–strain curve of concrete under cyclic loading is very close to the stress–strain curve under monotonic loading [38,39]. To facilitate the analysis, the stress–strain relationship of concrete used in the present study is expressed as follows [40]:
{ σ c = f c [ 2 ε c ε 0 ( ε c ε 0 ) 2 ] ε c ε 0 σ c = f c ε c u ε c > ε 0
where f c is the peak uniaxial compressive stress of concrete; ε 0 is the strain corresponding to the peak stress, which is set to 0.002; and ε c u is the ultimate compressive strain of concrete, which is set to 0.0033.
Like that of concrete, the stress–strain curve envelope of a masonry structure under cyclic loading is very close to the stress–strain curve under monotonic loading [37,39,41,42,43]. The existence of lateral confinement is beneficial to the compressive strength of masonry [44,45], but its influence on the compression capacity of the concrete part of the composite column is limited. Therefore, the beneficial effect of the existence of lateral constraints on the compressive strength of masonry is ignored, and the stress–strain relationship of brick masonry proposed by Shi with the average compressive strength of masonry as the basic variable is used [43]:
σ = f m ( 1 e 460 f m ε )
The ultimate compressive strain is
ε u l t = l n 10 460 f m
A calculation based on the measured material strength gives f m = 3.3 MPa, which is substituted into Equation (2), giving the ultimate compressive strain of masonry ε u l t = 0.0028. Considering that the ultimate strain of masonry can be increased by the constraint of concrete in the composite column on the core masonry, the ultimate compressive strain of masonry is approximately the same as that of concrete at 0.0033 in the calculation.
The rebars used in this test had a clear yield plateau, and therefore an ideal elastic–plastic model is used for the rebars.

4.2. Calculation Diagram and Calculation Formula for Bearing Capacity

During the failure stage in the test, the tensile rebars in the end column yielded, and the edge concrete at the base of the column was crushed. The compression zone consists of a concrete part and a masonry part, which are considered equivalent to a uniform distribution to simplify the calculation. The calculation diagram is shown in Figure 12.
The height of the equivalent compression zone of concrete is based on Reference [46], and it is assumed that when the height of the compression zone is between hb and 2.5 hb, the height of the equivalent compression zone varies linearly between 0.8 hb and hb. Hence, the height of the equivalent compression zone of concrete is obtained as follows:
{ x c h b x c 2.5 h b h b < x c < 2.5 h b x = 0.8 x c x = h b x = h b 0.2 ( 2.5 h b x c 1.5 h b )
The equivalent stress is fc.
According to Reference [40], when the edge of the compression zone of the masonry reaches the ultimate compressive strain, the height of the equivalent compression zone of the masonry part is x = 0.77 xc, and the equivalent stress of the masonry is 0.79 fm.
Based on force equilibrium,
N = f y A s f m A m f y A s 1 σ s A s 2
V u H = N ( B 2 a ) f c A c z c f m A m z m f y A s ( B a a )
where N is the vertical compression; H is the height of the specimen; B is the width of the specimen; fc and fm are the compressive strengths of concrete and masonry, respectively, and fy and fy’ are the yield strength and compressive strength of rebar; σ s is the stress of the tensile rebars in the middle column and is determined according to the plane section assumption; A s and A s are the areas of rebars in compression and tension zones, respectively; A c a n d A m are the areas of concrete and masonry in the compression zone, respectively (related to the compression zone height xc); a is the distance from the centroid of the end column to the tensile edge of the section; zc and zm are the distances from the resultant force of concrete and the resultant force of masonry to the centroid of the end column (related to the compression zone height xc), respectively; and a ' is the distance from the centroid of compressive rebars to the compressive edge of the section.
The calculation formulas are the same as those of RC compression–flexure members, except for the additional terms related to compression on masonry.

4.3. Comparison and Analysis of Calculation Results

Based on the material strength tests, fc = 30.8 MPa, fm = 3.3 MPa, and fy = 575 MPa for 12 mm rebars, and fy = 457 MPa for 14 mm rebars.
The theoretically calculated values and the test values of the flexural capacity of each specimen are compared in Table 6. It is noted that specimen S-8 slipped during the loading process, which led to an eccentric vertical load, thereby resulting in a small test bearing capacity and hence a large difference between the calculated and test values. After removing S-8, the ratio of the test value to the calculated value had an average of 0.95 and a coefficient of variation of 0.10.
Table 6 shows that the test values are smaller than the calculated values, especially for members with a high axial load ratio, mainly due to the fact that during the test, the horizontal friction between the vertical loading device and the specimen could not be completely eliminated, resulting in a relatively small horizontal loading.

5. Conclusions

Through low-cycle reciprocating tests on 11 masonry wall specimens strengthened using reinforced-concrete–masonry composite columns, the effects of the position of the composite column, height-to-width ratio, column reinforcement ratio, and axial load ratio on their load-carrying capacity, stiffness, ductility, and energy dissipation capacity were investigated. The following conclusions were drawn:
(1)
By strengthening brick walls with RC–masonry composite columns, the concrete part in the composite column, the masonry part in the composite column, and the wall outside of the column can work together effectively; the failure mode of the wall changes from shear to flexural failure; the bearing capacity, ductility, and energy dissipation properties of the strengthened masonry wall are improved compared to those of the original masonry wall.
(2)
The aspect ratio of the specimen has the greatest influence on the structural behavior. Smaller aspect ratios result in higher load-bearing capacity and stiffness but poorer ductility. Increasing the reinforcement ratio of the composite column leads to higher load-bearing capacity and ductility of the specimen. The axial load ratio has the weakest impact on the structure. Members with a small axial load ratio have a low load-bearing capacity, and their stiffness degradation is less significant after cracking.
(3)
Installing composite columns at the end of a wall can substantially increase the bearing capacity, stiffness, and energy dissipation capacity of the wall. For walls with height-to-width ratios greater than 1, placing composite columns in the middle of a wall has little effect on the bearing capacity and stiffness of the wall but can improve the ductility of the wall. Therefore, it is generally suggested the composite columns can be placed at the ends of the wall if a strengthening measure is required. For walls with height-to-width ratios less than 1, where the shear span ratios are relatively small, it is recommended to add composite columns in the middle to enhance their shear capacity and ductility.
(4)
The calculation of the flexural capacity of a wall strengthened by composite columns can be carried out by treating the strengthened wall as a concrete compression–flexure member while taking into account the compressive strength of masonry in compression.
The influence of placing composite columns in the middle of walls with a height-to-width ratio of 1 on their structural performance was investigated in this study. For walls with a height-to-width ratio greater than 1, the effect of adding composite columns is to be further investigated in future research.

Author Contributions

Conceptualization, K.Z. and F.X.; methodology, F.X. and K.Z.; validation, J.Z. and X.C.; formal analysis, F.X.; investigation, J.Z. and X.C.; resources, K.Z.; data curation, K.Z. and F.X.; writing—original draft preparation, K.Z., F.X., J.Z. and X.C.; writing—review and editing, K.Z.; visualization, X.C.; supervision, K.Z.; project administration, K.Z.; funding acquisition, K.Z. All authors have read and agreed to the published version of the manuscript.

Funding

This research was funded by the Ministry of Education, Key Laboratory of Building Structural Retrofitting and Underground Space Engineering, with support under grant number XTP201918.

Institutional Review Board Statement

Not applicable.

Informed Consent Statement

Not applicable.

Data Availability Statement

The data presented in this study are available on request from the corresponding author. The data are not publicly available due to privacy.

Conflicts of Interest

Author Jihui Zhao was employed by the Shandong Academy of Building Research Co., Ltd. (SDABR). The remaining authors declare that the research was conducted in the absence of any commercial or financial relationships that could be construed as a potential conflict of interest.

References

  1. Ye, L.; Qu, Z.; Lu, X.; Feng, P. Collapse prevention of building structures: A lesson from the Wenchuan earthquake. Jianzhu Jiegou Xuebao/J. Build. Struct. 2008, 29, 42–50. [Google Scholar] [CrossRef]
  2. Ismail, N.; Khattak, N. Observed failure modes of unreinforced masonry buildings during the 2015 Hindu Kush earthquake. Earthq. Eng. Eng. Vib. 2019, 18, 301–314. [Google Scholar] [CrossRef]
  3. Göçer, C. Field Investigation of the Performance of Unreinforced Masonry Building Structures during the June 12, 2017, Lesvos Earthquake in the Aegean Sea. J. Perform. Constr. Facil. 2020, 34, 04020095. [Google Scholar] [CrossRef]
  4. Ural, A.; Fırat, F.K.; Kara, M.E.; Çelik, T.; Tanrıverdi, Ş. Damages to rubble stone masonry structures during the January 24, 2020, Sivrice (Elazığ) Earthquake in Turkey. Earthq. Struct. 2022, 23, 231–243. [Google Scholar] [CrossRef]
  5. Pan, Y.; Chen, J.; Bao, Y.; Peng, X.; Lin, X. Seismic damage investigation and analysis of rural buildings in MS6.0 Changning earthquake. J. Build. Struct. 2020, 41, 297–306. [Google Scholar] [CrossRef]
  6. Tripathy, D.; Singhal, V. Strengthening of weak masonry assemblages using wire reinforced cementitious matrix (WRCM) for shear and flexure loads. Constr. Build. Mater. 2021, 277, 122223. [Google Scholar] [CrossRef]
  7. Nanni, A. Guide to Design and Construction of Externally Bonded Fabric-Reinforced Cementitious Matrix (FRCM) Systems for Repair and Strengthening Concrete and Masonry Structures; American Concrete Institute: Farmington Hills, MI, USA, 2013; Volume ACI 549-.4R-13, p. 69. Available online: https://hdl.handle.net/11588/586708 (accessed on 8 January 2024).
  8. Lin, Y.-W.; Wotherspoon, L.; Scott, A.; Ingham, J.M. In-plane strengthening of clay brick unreinforced masonry wallettes using ECC shotcrete. Eng. Struct. 2014, 66, 57–65. [Google Scholar] [CrossRef]
  9. Deng, M.; Yang, S. Cyclic testing of unreinforced masonry walls retrofitted with engineered cementitious composites. Constr. Build. Mater. 2018, 177, 395–408. [Google Scholar] [CrossRef]
  10. Reboul, N.; Mesticou, Z.; Si Larbi, A.; Ferrier, E. Experimental study of the in-plane cyclic behaviour of masonry walls strengthened by composite materials. Constr. Build. Mater. 2018, 164, 70–83. [Google Scholar] [CrossRef]
  11. Thomoglou, A.K.; Karabinis, A. Experimental investigation of the shear strength of hollow brick unreinforced masonry walls retrofitted with TRM system. Earthq. Struct. 2022, 22, 355–372. [Google Scholar] [CrossRef]
  12. Thomoglou, A.K.; Karabini, M.A.; Achillopoulou, D.V.; Rousakis, T.C.; Chalioris, C.E. Failure Mode Prediction of Unreinforced Masonry (URM) Walls Retrofitted with Cementitious Textile Reinforced Mortar (TRM). Fibers 2023, 11, 53. [Google Scholar] [CrossRef]
  13. Thomoglou, A.K.; Rousakis, T.C.; Achillopoulou, D.V.; Karabinis, A.I. Ultimate shear strength prediction model for unreinforced masonry retrofitted externally with textile reinforced mortar. Earthq. Struct. 2020, 19, 411–425. [Google Scholar] [CrossRef]
  14. Aiello, M.A.; Micelli, F.; Valente, L. FRP confinement of square masonry columns. J. Compos. Constr. 2009, 13, 148–158. [Google Scholar] [CrossRef]
  15. Faella, C.; Martinelli, E.; Paciello, S.; Camorani, G.; Aiello, M.A.; Micelli, F.; Nigro, E. Masonry columns confined by composite materials: Experimental investigation. Compos. Part B Eng. 2011, 42, 692–704. [Google Scholar] [CrossRef]
  16. Micelli, F.; Di Ludovico, M.; Balsamo, A.; Manfredi, G. Mechanical behaviour of FRP-confined masonry by testing of full-scale columns. Mater. Struct. 2014, 47, 2081–2100. [Google Scholar] [CrossRef]
  17. Farooq, S.; Shahid, I.; Ilyas, M. Seismic performance of masonry strengthened with steel strips. KSCE J. Civ. Eng. 2014, 18, 2170–2180. [Google Scholar] [CrossRef]
  18. Farooq, S.; Ilyas, M.; Amir, S. Response of masonry walls strengthened with CFRP and steel strips. Arab. J. Sci. Eng. 2012, 37, 545–559. [Google Scholar] [CrossRef]
  19. Farough, S.; Ilyas, M.; Ghaffar, A. Technique for strengthening of masonry wall panels using steel strips. Asian J. Civ. Eng. Build. Hous. 2006, 7, 621–638. [Google Scholar]
  20. Farooq, S.; ElGawady Mohamed, A.; Ilyas, M. Seismic in-plane performance of retrofitted masonry walls. KSCE J. Civ. Eng. 2014, 18, 226–237. [Google Scholar] [CrossRef]
  21. Yang, K.H.; Mun, J.H.; Hwang, S.H. Cyclic shear behavior of masonry walls strengthened with prestressed steel bars and glass fiber grids. Compos. Struct. 2020, 238, 111961. [Google Scholar] [CrossRef]
  22. Capozucca, R.; Magagnini, E. Experimental response of masonry walls in-plane loading strengthened with GFRP strips. Compos. Struct. 2020, 235, 111735. [Google Scholar] [CrossRef]
  23. Taghdi, M.; Bruneau, M.; Saatcioglu, M. Seismic retrofitting of low-rise masonry and concrete walls using steel strips. J. Struct. Eng. 2000, 126, 1017–1025. [Google Scholar] [CrossRef]
  24. Nochebuena-Mora, E.; Mendes, N.; Lourenço, P.B.; Covas, J.A. Vibration control systems: A review of their application to historical unreinforced masonry buildings. J. Build. Eng. 2021, 44, 103333. [Google Scholar] [CrossRef]
  25. Paula, R.; Cóias, V.; Guerreiro, L. Development of Dissipation Panels for Seismic Retrofitting of Historic Buildings. In Historical Earthquake-Resistant Timber Framing in the Mediterranean Area; Springer: Cham, Switzerland, 2016; pp. 337–347. [Google Scholar]
  26. East, M.; Yassin, A.; Ezzeldin, M.; Wiebe, L. Development of Controlled Rocking Masonry Walls with Energy Dissipation Accessible in a Steel Base. J. Struct. Eng. 2023, 149, 04023032. [Google Scholar] [CrossRef]
  27. Shu, Z.; Ning, B.; Chen, J.; Li, Z.; He, M.; Luo, J.; Dong, H. Reinforced moment-resisting glulam bolted connection with coupled long steel rod with screwheads for modern timber frame structures. Earthq. Eng. Struct. Dyn. 2023, 52, 845–864. [Google Scholar] [CrossRef]
  28. Huang, H.; Yuan, Y.; Zhang, W.; Li, M. Seismic behavior of a replaceable artificial controllable plastic hinge for precast concrete beam-column joint. Eng. Struct. 2021, 245, 112848. [Google Scholar] [CrossRef]
  29. Huang, H.; Li, M.; Zhang, W.; Yuan, Y. Seismic behavior of a friction-type artificial plastic hinge for the precast beam–column connection. Arch. Civ. Mech. Eng. 2022, 22, 201. [Google Scholar] [CrossRef]
  30. Cevallos, O.; Olivito, R.S.; Codispoti, R.; Ombres, L. Flax and polyparaphenylene benzobisoxazole cementitious composites for the strengthening of masonry elements subjected to eccentric loading. Compos. Part B Eng. 2015, 71, 82–95. [Google Scholar] [CrossRef]
  31. Ombres, L.; Verre, S. Structural behaviour of fabric reinforced cementitious matrix (FRCM) strengthened concrete columns under eccentric loading. Compos. Part B Eng. 2015, 75, 235–249. [Google Scholar] [CrossRef]
  32. Ibrar, M.; Naseer, A.; Ashraf, M.; Badshah, E.; Ullah, S. Evaluation of confined masonry walls with varying sizes of confining elements and reinforcement ratios against cyclic loading. J. Build. Eng. 2022, 50, 104094. [Google Scholar] [CrossRef]
  33. Ahmadizadeh, M.; Shakib, H. Experimental Study of the In-Plane Behavior of Confined Stone Masonry Walls. J. Struct. Eng. 2016, 142, 04015145. [Google Scholar] [CrossRef]
  34. Wijaya, W.; Kusumastuti, D.; Suarjana, M.; Pribadi, K. Experimental study on wall-frame connection of confined masonry wall. Procedia Eng. 2011, 14, 2094–2102. [Google Scholar] [CrossRef]
  35. Marinilli, A.; Castilla, E. Experimental evaluation of confined masonry walls with several confining-columns. In Proceedings of the 13th World Conference on Earthquake Engineering, Vancouver, BC, Canada, 1–6 August 2004. [Google Scholar]
  36. Weng, D.; Lu, X.; Ren, X. Experimental study on seismic resistant capacity of masonry walls. In Proceedings of the 4th Multi-Lateral Workshop on Development of Earthquake Technologies and Their Integration for the Asia-Pacific Region (EQTAP), Tokyo, Japan, September 2002; pp. 201–211. [Google Scholar]
  37. Zhang, W.; Ma, J.; Chang, J. Researches on bending capacity course of plain masonry bearing wall under bending and invariable axial force. Eng. Mech. 2012, 29, 202–210. [Google Scholar] [CrossRef]
  38. Yankelevsky, D.Z.; Reinhardt, H.W. Focal points model for uniaxial cyclic behaviour of concrete. In Proceedings of the IABSE Colloquium, Delft, Netherlands, 26–28 August 1987. [Google Scholar]
  39. Teng, Z.; Zou, L. Nonlinear Finite Element Analysis of RC Members under Reversed Cyclic Loading. China Civ. Eng. J. 1996, 29, 19–27. [Google Scholar]
  40. Liu, J. Research on Mechanical Performance of Masonry Wall Strengthened with GFRP. Ph.D. Thesis, Dalian University of Technology, Dalian, China, 2007. [Google Scholar]
  41. Minafò, G.; D’Anna, J.; Cucchiara, C.; Monaco, A.; La Mendola, L. Analytical stress-strain law of FRP confined masonry in compression: Literature review and design provisions. Compos. Part B Eng. 2017, 115, 160–169. [Google Scholar] [CrossRef]
  42. Zhu, B.; Wu, M.; Jiang, Z. Experimental study on basic behaviour of brick masonry under reversed loading. J. Tongji Univ. 1980, 2, 1–14. [Google Scholar]
  43. Shi, C. The Theory and Design of Masonry Structure; Architecture & Building Press: Beijing, China, 2014. [Google Scholar]
  44. Naraine, K.; Sinha, S. Stress-Strain Curves for Brick Masonry in Biaxial Compression. J. Struct. Eng. 1992, 118, 1451–1461. [Google Scholar] [CrossRef]
  45. Priestley, M.J.N.; Elder, D.M. Stress-Strain Curves for Unconfined and Confined Concrete Masonry. ACI J. Proc. 1983, 80, 192–201. [Google Scholar] [CrossRef]
  46. Guo, Z. Strength and Constitutive Equation of Concrete; Architecture & Building Press: Beijing, China, 2004. [Google Scholar]
Figure 1. Examples of damage to unreinforced masonry buildings during the 2008 Wenchuan earthquake in China. (a) Diagonal cracks in the wall between windows. (b) Collapse of buildings. (c) Partial collapse of longitudinal walls.
Buildings 14 00184 g001
Figure 2. Construction details of the specimens.
Buildings 14 00184 g002aBuildings 14 00184 g002b
Figure 3. Field preparation of specimens.
Buildings 14 00184 g003
Figure 4. Schematic diagram of the loading system.
Buildings 14 00184 g004
Figure 5. The loading scheme of the test.
Buildings 14 00184 g005
Figure 6. Failure modes of specimens. Note: Due to the slippage of specimen S-8 during the loading process, only compression was applied to it in the later stage of the test.
Buildings 14 00184 g006aBuildings 14 00184 g006b
Figure 7. Hysteresis curves.
Buildings 14 00184 g007
Figure 8. Skeleton curves.
Buildings 14 00184 g008
Figure 9. Comparison of curves.
Buildings 14 00184 g009
Figure 10. Trilinear skeleton curves.
Buildings 14 00184 g010
Figure 11. Influences of various factors on the ductility of the specimen.
Buildings 14 00184 g011
Figure 12. Diagram for the flexural calculation of the wall strengthened by concrete–masonry composite columns.
Buildings 14 00184 g012
Table 1. Basic specimen parameters.
Serial NumberNo.Dimensions
(Width × Height) (mm × mm)
RebarsVertical Load (kN)Number of Composite Columns
1S-11000 × 15004φ 1260Two end columns
2S-21000 × 15006φ 12120Two end columns
3S-31000 × 15006φ 14180Two end columns
4S-41500 × 15004φ 12180Two end columns + one middle column
5S-51500 × 15006φ 12270Two end columns + one middle column
6S-61500 × 15006φ 1490Two end columns + one middle column
7S-72000 × 10004φ 12360Two end columns + one middle column
8S-82000 × 10006φ 12120Two end columns + one middle column
9S-92000 × 10006φ 14240Two end columns + one middle column
10S-101500 × 15006φ 12270Two end columns
11S-111000 × 15006φ 1260One middle column
Note: Rebars of composite columns in the table represent the total vertical rebars.
Table 2. Measured strengths of concrete, brick, and mortar.
MaterialSample Side Length (mm)Average Compressive Strength (MPa)Maximum Compressive Strength (MPa)Minimum Compressive Strength (MPa)
Concrete15046.147.545.2
Bricks10020.625.813.6
M5 mortar704.65.33.67
M10 mortar7014.917.611.1
Table 3. Mechanical parameters of rebar samples.
Diameter (mm)Yield Strength (MPa)Tensile Strength (MPa)Elongation (%)Cold Bending Performance
6.530041028.5Qualified
33544531.5Qualified
1257569523.5Qualified
57569520.0Qualified
1446058523.0Qualified
44558021.5Qualified
Table 4. Test results of the bearing capacity and displacement of specimens.
No.Cracked StateUltimate StateFailure State
Load (kN)Displacement (mm)Load (kN)Displacement (mm)Load (kN)Displacement (mm)
S-173.92.5170.618.8143.930.0
S-285.32.8234.124.8175.932.8
S-3123.02.4273.327.6230.343.6
S-4171.92.4350.717.4290.030.4
S-5144.52.1407.224.2350.733.2
S-6137.92.9465.723.0392.435.0
S-7445.95.5702.717.4548.329.0
S-8199.93.5685.023.2556.526.9
S-9192.02.6775.024.5571.626.0
S-10138.22.6396.219.0311.728.0
S-1134.91.7117.728.898.842.4
Table 5. Displacement ductility factors of specimens.
Specimen No.Δy (mm) Δ 0.85 (mm)μ
S-112.230.02.46
S-211.632.82.83
S-313.443.63.25
S-414.130.42.16
S-512.233.22.72
S-613.835.02.54
S-712.729.02.28
S-812.926.92.08
S-912.426.02.10
S-1011.728.02.39
S-1112.842.43.31
Table 6. Comparison of theoretical and test values of flexural capacities.
No.Calculated Value (kN)Test Value (kN)Test Value/Calculated Value
S-1248.9260.41.05
S-2383.3351.20.92
S-3433.5410.00.95
S-4478.7526.11.10
S-5703.2610.80.87
S-6632.5698.61.10
S-7823.3722.70.88
S-8837.7685.00.82
S-9999.8840.00.84
S-10698.4594.30.85
Disclaimer/Publisher’s Note: The statements, opinions and data contained in all publications are solely those of the individual author(s) and contributor(s) and not of MDPI and/or the editor(s). MDPI and/or the editor(s) disclaim responsibility for any injury to people or property resulting from any ideas, methods, instructions or products referred to in the content.

